Article

Physiological Phenotyping and Biochemical Characterization of Mung Bean (Vigna radiata L.) Genotypes for Salt and Drought Stress

Plant Functional Genomics and Molecular Biology Laboratory, Department of Biochemistry, School of Life Sciences, Central University of Rajasthan, Ajmer 305817, India
*
Author to whom correspondence should be addressed.
Agriculture 2024, 14(8), 1337; https://doi.org/10.3390/agriculture14081337 (registering DOI)
Submission received: 23 June 2024 / Revised: 3 August 2024 / Accepted: 7 August 2024 / Published: 10 August 2024
(This article belongs to the Section Crop Production)

Abstract

:
Vigna radiata (L.) R. Wilczek, generally known as mung bean, is a crucial pulse crop in Southeast Asia that is renowned for its high nutritional value. However, its cultivation faces substantial challenges due to numerous abiotic stresses. Here, we investigate the influence of salt and drought stress on mung bean genotypes by evaluating its morpho-physiological traits and biochemical characteristics. This phenotypic analysis revealed that both salt and drought stress adversely affected mung bean, which led to reduced plant height, leaf senescence, loss of plant biomass, and premature plant death. Reactive oxygen species (ROS) production increased under these abiotic stresses. In response, to prevent damage by ROS, the plant activates defense mechanisms to scavenge ROS by producing antioxidants. This response was validated through morpho-physiological, histological, and biochemical assays that characterized KVK Puri-3 and KVK Jharsuguda-1 as salt and drought sensitive genotypes, respectively, and Pusa ratna was identified as a drought and salt tolerant genotype.

1. Introduction

The potential impacts of global warming on agriculture have caused significant shifts in focus in regard to agricultural research in recent decades. Key areas of investigation include the abiotic and biotic environmental changes influencing agriculture, particularly changes in crop yields and the economic implications of these yield variations. Conversely, the use of chemical fertilizers in agriculture, aimed to enhancing crop production, introduces substantial environmental and health risks. This quality underscores the complex interplay between climate change and agricultural practices, necessitating a comprehensive understanding of both the benefits and detriments associated with modern agricultural inputs [1,2,3].
Salinity and drought are major environmental limitations to global crop productivity. Approximately 30–50% of irrigated agricultural land is affected by salinity [4]. Salinity is one of the most devastating natural hazards, significantly affecting a large portion of the global population, particularly those residing in semi-arid and arid regions [5]. Salt stress hampers plant growth and reduces the agricultural yield, and it also affects the physiochemical properties and environmental equilibrium of the ground [6,7](Ahmed et al., 2022). Drought is expected to affect one-third of the total irrigated land and make it difficult for normal plants to grow [8]. In regard to food production, legumes are ranked second in consumption, constituting 27% of global primary crop production and fulfilling 33% of the global protein requirements [9]. The Fabaceae family includes plants known as legumes, which can grow well in various seasons and soil types. Mung bean, a type of legume belonging to the Vigna genus, is particularly significant, comprising over 150 different varieties [10]. The global average yield of mung bean is approximately 721 kg/ha, with an estimated 7.3 million hectares under cultivation and 5.3 million tons produced worldwide, 30% of which is accounted for by India and Myanmar. Other notable producers are China, Indonesia, Thailand, Kenya, and Tanzania [11]. In 2022, mung bean production in India was projected to encompass 5.5 million hectares, producing 3.17 million tons with an average yield of 570 kg/ha. Mung bean accounts for 10% of the total pulse production and 16% of the area devoted to pulses. In India, the state of Rajasthan is the leading contributor, followed by Madhya Pradesh Maharashtra Karnataka Odisha, Bihar, Tamil Nadu, Gujarat, Andhra Pradesh, and Telangana, as detailed in the Annual Report (2022–23) by AICRP on Kharif Pulses (ICAR-Indian Institute of Pulses Research, 20 May 2024).
Mung bean is a protein-rich legume that can be consumed as whole grains or in sprouted form. Additionally, mung bean plays a crucial role in fixing atmospheric nitrogen and enhancing soil fertility by improving its physical properties ([12] Naik et al., 2020). Mung bean and other leguminous plants have growth-promoting rhizobacteria. These inherently free-living soil microorganisms colonize plant roots and facilitate plant growth [13]. Its nitrogen-fixing ability and short life span make mung bean a valuable component of cropping systems and a good practical choice for agricultural production [14].
Due to environmental constraints, growth and development of mung bean is frequently hindered. In practice, each phase of a plant’s growth, especially seed germination, vegetative growth, and reproductive development (like the flowering and pod-filling stage) are severely affected by salinity and drought stress [15,16]. Osmotic stress results in elevated levels of ROS, which can damage membrane and cell proteins and disrupt the physiological systems Therefore, a primary objective of the plant response is to scavenge reactive oxygen species by increasing antioxidant levels [17]. To assess the damaging effect and also scavenging of ROS, lipid peroxidation and the activity of antioxidant enzymes like APX, SOD, CAT, GR, GPX, MDHAR, and DHAR require evaluation. In this study, we investigate morpho-physiological parameters by screening sixty-one genotypes of mung bean to identify the most sensitive and tolerant contrasting lines under drought and salt stress. We have performed physiological, histochemical (a method that makes it possible to analyze cells and tissues chemically with respect to their structural organization), and biochemical assays to evaluate their sensitivity to drought and salt stress. The two contrastingidentified genotypes can be studied at a transcriptomic level in the near future to identify the critical stress regulatory genes for future crop improvement through either marker-assisted breeding or genetic engineering.

2. Materials and Methods

2.1. Plant Sample and Plant Acclimatization

Mung bean (Vigna radiata (L.) R. Wilczek) genotypes were obtained from the Orissa University of Agriculture and Technology, Bhubaneswar, Orissa, India (Table S1). For seed surface sterilization, seeds were treated with 2% sodium hypochlorite (NaOCl) solution containing 2 drops of Tween 20 for 5 min with continuous agitation, followed by washing with distilled water 3–4 times. The seeds were subsequently soaked in water overnight before being transferred to Petri dishes with moistened cotton beds for germination at room temperature for 3–4 days. After 4 days, germinated uniform seeds were transferred to a Hoagland nutrient solution with a pH of 6.2. These genotypes were transferred to grow hydroponically for 15 days in plant growth chambers under white fluorescent lights with a photon flux density of 200 µmol m⁻² s⁻¹ [18] following a 14 h light/10 h dark cycle at 26 °C. After 15 days, the vegetative mung bean plants were exposed to salt stress (200 mM NaCl) and drought stress (10% PEG 6000) for 48 h while the physiological parameters were measured; additionally, the water potential was approximately 3 Mpa.

2.2. Measurement of Growth and Plant Biomass

Plant growth and biomass were assessed by measuring shoot length, fresh biomass, turgid, and dry biomass. Fresh weight was recorded at harvest. To determine turgid weight, shoots were immersed in distilled water for 4 h. For dry weight measurement, shoots were dehydrated at 80 °C for 48 h, after which the dry biomass was measured.

2.3. Measurement of RWC

RWC was determined using the following formula.
RWC (%) = {(Fw − Dw)/(Tw − Dw)} × 100
where Fw signifies the fresh weight, Tw denotes to the turgid weight, and Dw signifies the dry weight.

2.4. Plant Height Stress Index

The plant height stress index was calculated by taking the ratio of the plant height under stress conditions to the plant height of the control plant and multiplying by 100 [18,19].
PHSI (%) = [plant height of stressed plant/plant height of control plant] × 100

2.5. Chlorophyll Fluorescence

The chlorophyll fluorescence or photosynthetic efficiency of mung bean plants was assessed using a junior PAM (Pulse Amplitude Modulation) chlorophyll fluorometer (PAM-2500—Configurations|WALZ, Heinz Walz GmbH 91090 Effeltrich Germany, Model: JUNIOR-PAM) [20,21]. This measurement involved three parameters: Fv/Fm, Y(II), and NPQ. To conduct the measurement, a leaf was positioned with the fiber using specialized leaf clips. The employment of a light-sensing leaf clip allowed for the calculation of electron transport rates based on surrounding photosynthetically active radiation (PAR) and photosystem II (PS II) photochemical yield, Y(II).
F0 = Basic fluorescence yield with low measuring light intensities.
Fm = Maximal chlorophyll fluorescence yield when the PS II reaction center is closed by a strong light pulse.
Fv/Fm = (Fm − F0)/Fm; maximum photochemical quantum yield of PS II.
NPQ = Non-photochemical fluorescence quenching.
Y (II) = Photochemical quantum yield of PS II.

2.6. Loss of Plasma Membrane Integrity by Histochemical Analysis

The plant leaf discs were incubated with 0.025% w/v Evan’s blue solution in 100 mM CaCl2 at pH 5.6 overnight in a vacuum desiccator. Following staining, the leaves were destained with 100 mM CaCl2 (pH 5.6) and then bleached using an acetic acid–glycerol–ethanol solution in a 1:1:3 ratio. The samples were then placed in a hot water bath at 95 °C for 10–15 min until the solution cleared, after which the samples were photographed [22].

3. Biochemical Analysis

3.1. Lipid Peroxidation

A leaf sample was taken and finely crushed with 1 mL of 0.1% trichloroacetic acid (TCA) and centrifuged at 13,000 rpm for 10 min. The supernatant was collected, and 0.5% TBA-TCA solution was added and incubated at 80 °C in a water bath for 30 min, followed by immediately cooling on ice to halt the reaction. The absorbance was measured at 532 and 600 nm [23].

3.2. LOX (Lipo-Oxygenase Assay)

A total of 200 mg plant tissue was grinded with 1mL acetone and incubated at −20 °C for 30 min, then centrifuged at 10,000 rpm for 15 min before the supernatant was discarded. This process was repeated three times. The resulting pellet was resuspended in 2 mL of 50 mM HEPES buffer (pH 7.2) containing 3 mM dithiothreitol, 10 mM magnesium chloride, and 1 mM EDTA and kept at 4 °C for 1 h before centrifugation at 10,000 rpm for 10 min was performed and the supernatant was collected as an enzyme extract to make the reaction mixture. The reaction mixture contained of 200 µL enzyme extract, 120 µL 10 mM linoleic acid, 1.25 mL of 0.1 M sodium phosphate buffer (pH 6.5), and 430 µL of 0.1% (w/v) Tween 20; the LOX activity was determined at 234 nm [24].

3.3. Hydrogen Peroxide

To determine the hydrogen peroxide content, tissue samples were homogenized with 0.1% TCA and centrifuged at 12,000× g for 15 min at 4 °C. A reaction mixture was prepared by combining 500 µL of supernatant with 1 mL of potassium iodide (KI) solution, followed by incubation in the dark for 10 min. Absorbance was measured at 390 nm and quantified using a standard curve [25].

3.4. Proline Content

To determine the proline content, tissue samples were finely crushed in 2.5 mL of 3% sulfosalicylic acid followed by centrifugation at 9000× g for 10 min. A reaction mixture was prepared by combining 500 µL of supernatant with 1 mL of glaciate acetic acid and ninhydrin reagent heated in a water bath at 100 °C for 1 h. The reaction was promptly stopped by transferring the mixture to ice, followed by the addition of 2 mL of toluene and vortexing for 30 s. The absorbance of the chromophore in toluene was measured at 520 nm [26].

3.5. Extraction and Assessment of Antioxidant Enzymes

To assess the antioxidant activity of the plant system under salt and drought stress, enzymatic assays were conducted. Plant samples were homogenized in 1.5 mL of 100 mM pH 7 potassium phosphate buffer and supplemented with 0.5% Triton X-100 and 1% polyvinylpyrrolidone (PVP) before centrifugation at 10,000 rpm for 30 min. The resulting supernatant was utilized for enzymatic assays, including superoxide dismutase (SOD), ascorbate peroxidase (APX), glutathione peroxidase (GPX), catalase (CAT), glutathione reductase (GR), monodehydroascorbate reductase (MDHAR), and dehydroascorbate reductase (DHAR).

3.6. SOD (Superoxide Dismutase)

The reaction mixture containing 1750 µL of phosphate buffer (50 mM, pH 7.8), 126 µL of NBT (63 µM), 26 µL of 13 µM methionine, and 30 µL of 1.3 µM riboflavin was added to 100 µL of enzyme extract and then exposed to a 15 W fluorescent light for 10 min. The absorbance was measured at 560 nm [27].

3.7. GPX (Guaiacol Peroxidase)

To make reaction mixture of 1.5 mL of phosphate buffer (100 mM) at pH 7, containing 200 μL of guaiacol (10 Mm), EDTA (1 mM), and 200 μL of 10 mM H2O2, were added to 100 µL of enzyme extract. Absorbance was measured at 470 nm for 15 s at 2 min [28].

3.8. GR (Glutathione Reductase)

For GR activity, 100 μL of enzyme extract was combined with a reaction mixture consisting of 1300 μL of phosphate buffer (100 mM, pH 7.6), 6 mM DTNB (5,5-dithio-bis-(2-nitrobenzoic acid)) (200 µL) 200 μL of 0.2 mM GSSG (oxidized glutathione), and 5 mM NADPH (200 µL) [29]. The absorbance was then measured at 412 nm for 15 s at 2 min intervals over a duration of 2 min.

3.9. Ascorbate Peroxidase (APX)

To determine the Apx, plant tissue, 200 mg was finely crushed in 1.5 mL of 0.1 M phosphate buffer (pH 6.8) containing Triton X-100 (0.5%), 1% polyvinylpyrrolidone (PVP), and 1 mM ascorbate before then being centrifuged at 17,000× g for one minute. The supernatant was mixed with 1.5 mL of 100 mM phosphate buffer (pH 6.8) containing 10 mM of hydrogen peroxide and 0.5 mM ascorbic acid. Absorbance of the reaction mixture was measured at 290 nm [30].

3.10. MDHAR (Monodehydroascorbate Reductase)

The assay was conducted using a protocol involving 50 mM HEPES buffer, 2.5 mM ascorbate, 0.25 mM NADH, and enzyme extract. Ascorbate oxidase served as the primary substrate in the reaction mixture. Absorbance of the reaction mixture was measured at 290 nm [31]. Enzymatic activity was determined using an extinction coefficient of 6.22 mM⁻¹ cm⁻¹.

3.11. DHAR (Dehydroascorbate Reductase)

For the determination of DHAR enzymatic activity, a reaction mixture was prepared containing HEPES buffer (pH 7, 50 mM) supplemented with EDTA (0.1 mM), reduced glutathione (GSH) (2.5 mM), and enzyme extract. The substrate in the reaction mixture was 0.2 mM dehydroascorbate (DHA). Absorbance was recorded at 265 nm [31].

3.12. CAT (Catalase)

To prepare the reaction mixture for enzymatic activity assessment, in 100 µL of enzyme extract, 1.8 mL of potassium phosphate buffer (50 mM, pH 7), and 100 µL of H2O2 (100 mM) were added. Absorbance was measured at 240 nm at 15-second intervals over a duration of 2 min [32].

3.13. Statistical Analysis

Data analysis was conducted using Microsoft Excel 2010 or GraphPad Prism 9. TB tool software version 0.665 was employed to generate a heat map of all 61 mung bean genotypes, aiming to identify the most contrasting sensitive and tolerant varieties based on the relationship between the plant height stress index, relative water content (RWC), and Fv/Fm. Correlation analysis was performed using the corr function in R to illustrate the associations among shoot length, the plant tolerance index, relative water content, root length, MDA, proline content, and enzymatic assays [33].

4. Results

After exposure of the mung bean genotypes to salt- and drought-stress all of them were studied in similar manner at the physiological level to identify two contrasting lines which were further studied by performing histochemical and biochemical assays to validate the study.

4.1. Measurement of Plant Height

The growth of plants observed in all genotypes was significantly reduced and led to plant senescence under stressed conditions. According to the plant height tolerance index, the most tolerant genotype, Pusa Ratna, indicates approx. 49% tolerance compared to the sensitive genotype, KVK Puri-3, under salt stress. Similarly, during drought conditions, the most tolerant genotype, Pusa Ratna, shows nearly 51% tolerance in comparison with the sensitive genotype, KVK Jharsuguda-1. The root length exhibited the same pattern as the shoot height (Figure 1 and Figure 2).

4.2. Fresh and Dry Biomass

During salt and drought stress, the fresh weight of genotypes was reduced. Genotype KVK Puri-3 was susceptible to salt and genotype KVK Jharsuguda-1 was prone to drought, hence their fresh and dry biomasses decrease under stress conditions at 48 h. Among all of the genotypes, Pusa Ratna was revealed to be tolerant to salt and drought, showing a slight decrease in its fresh and dry mass accumulation when exposed to stress (Figure 2).

4.3. Estimation of Relative Water Content

Relative water content (RWC) defines the condition of water balance at the point where plants reach full saturation [18]. During the time that the plants were treated with salt and drought conditions, a decline in RWC of the plants under stress conditions was noticed (Table S4, Figure 2 and Figure 3).

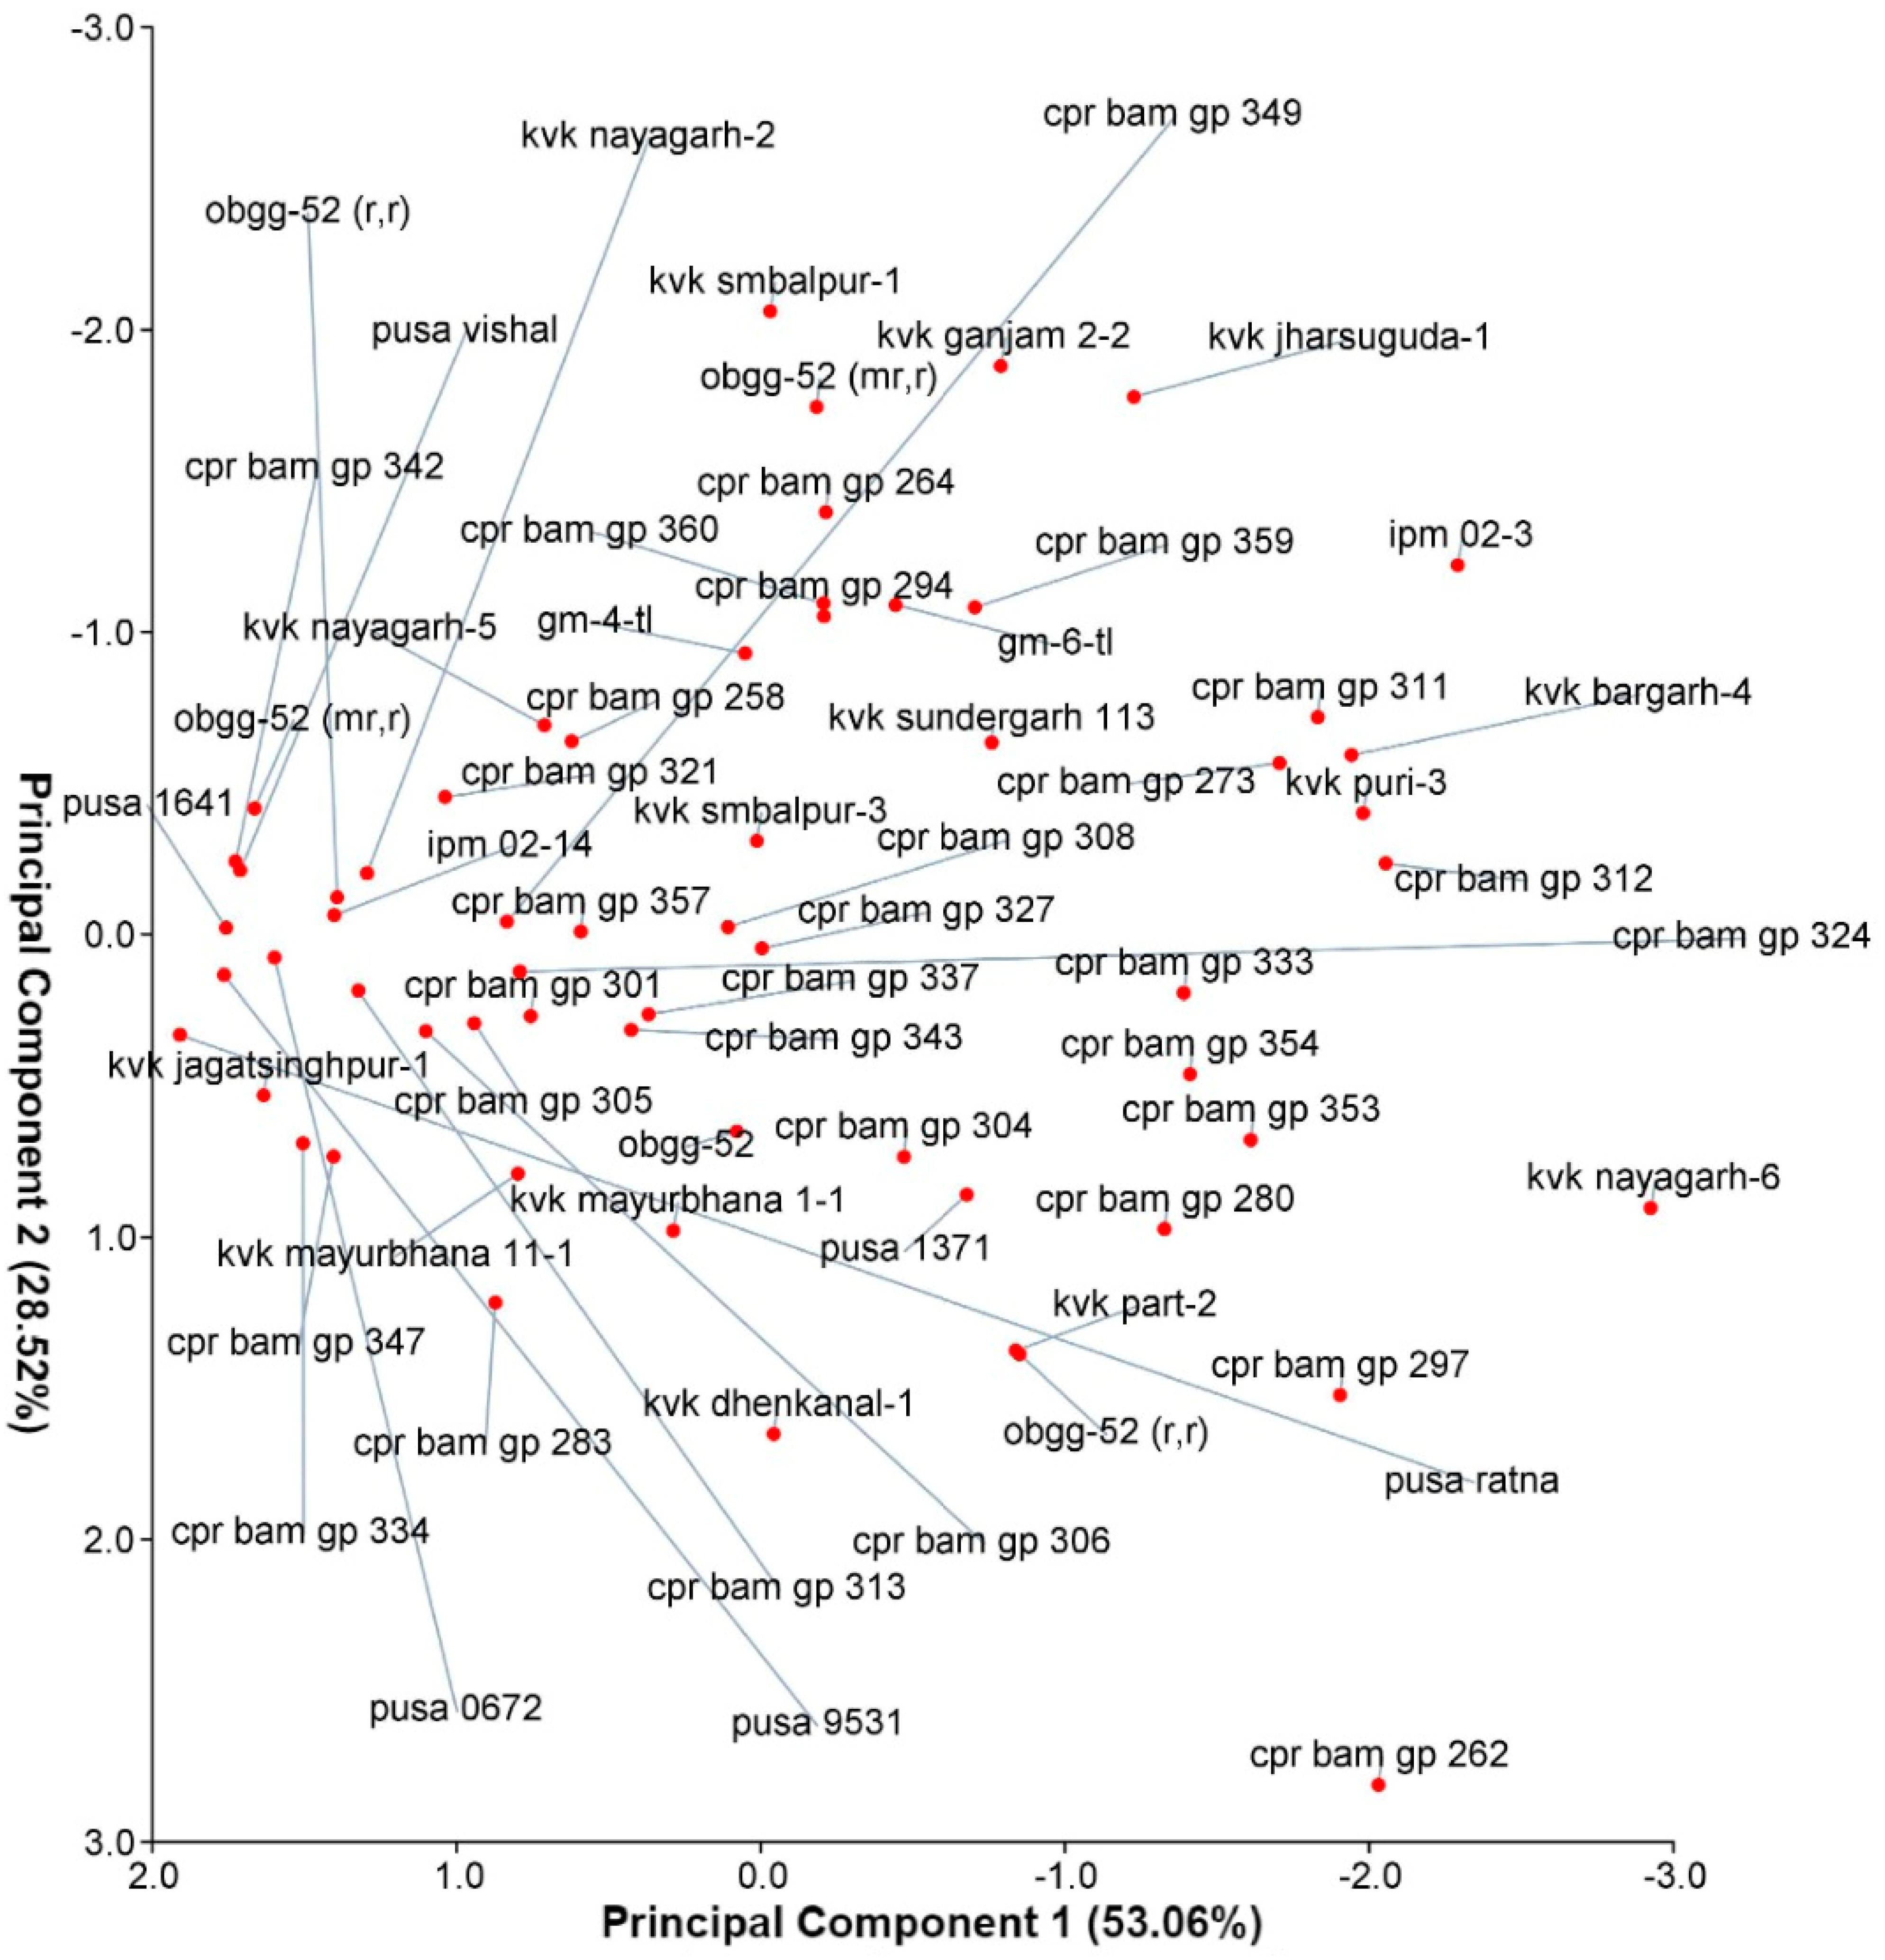
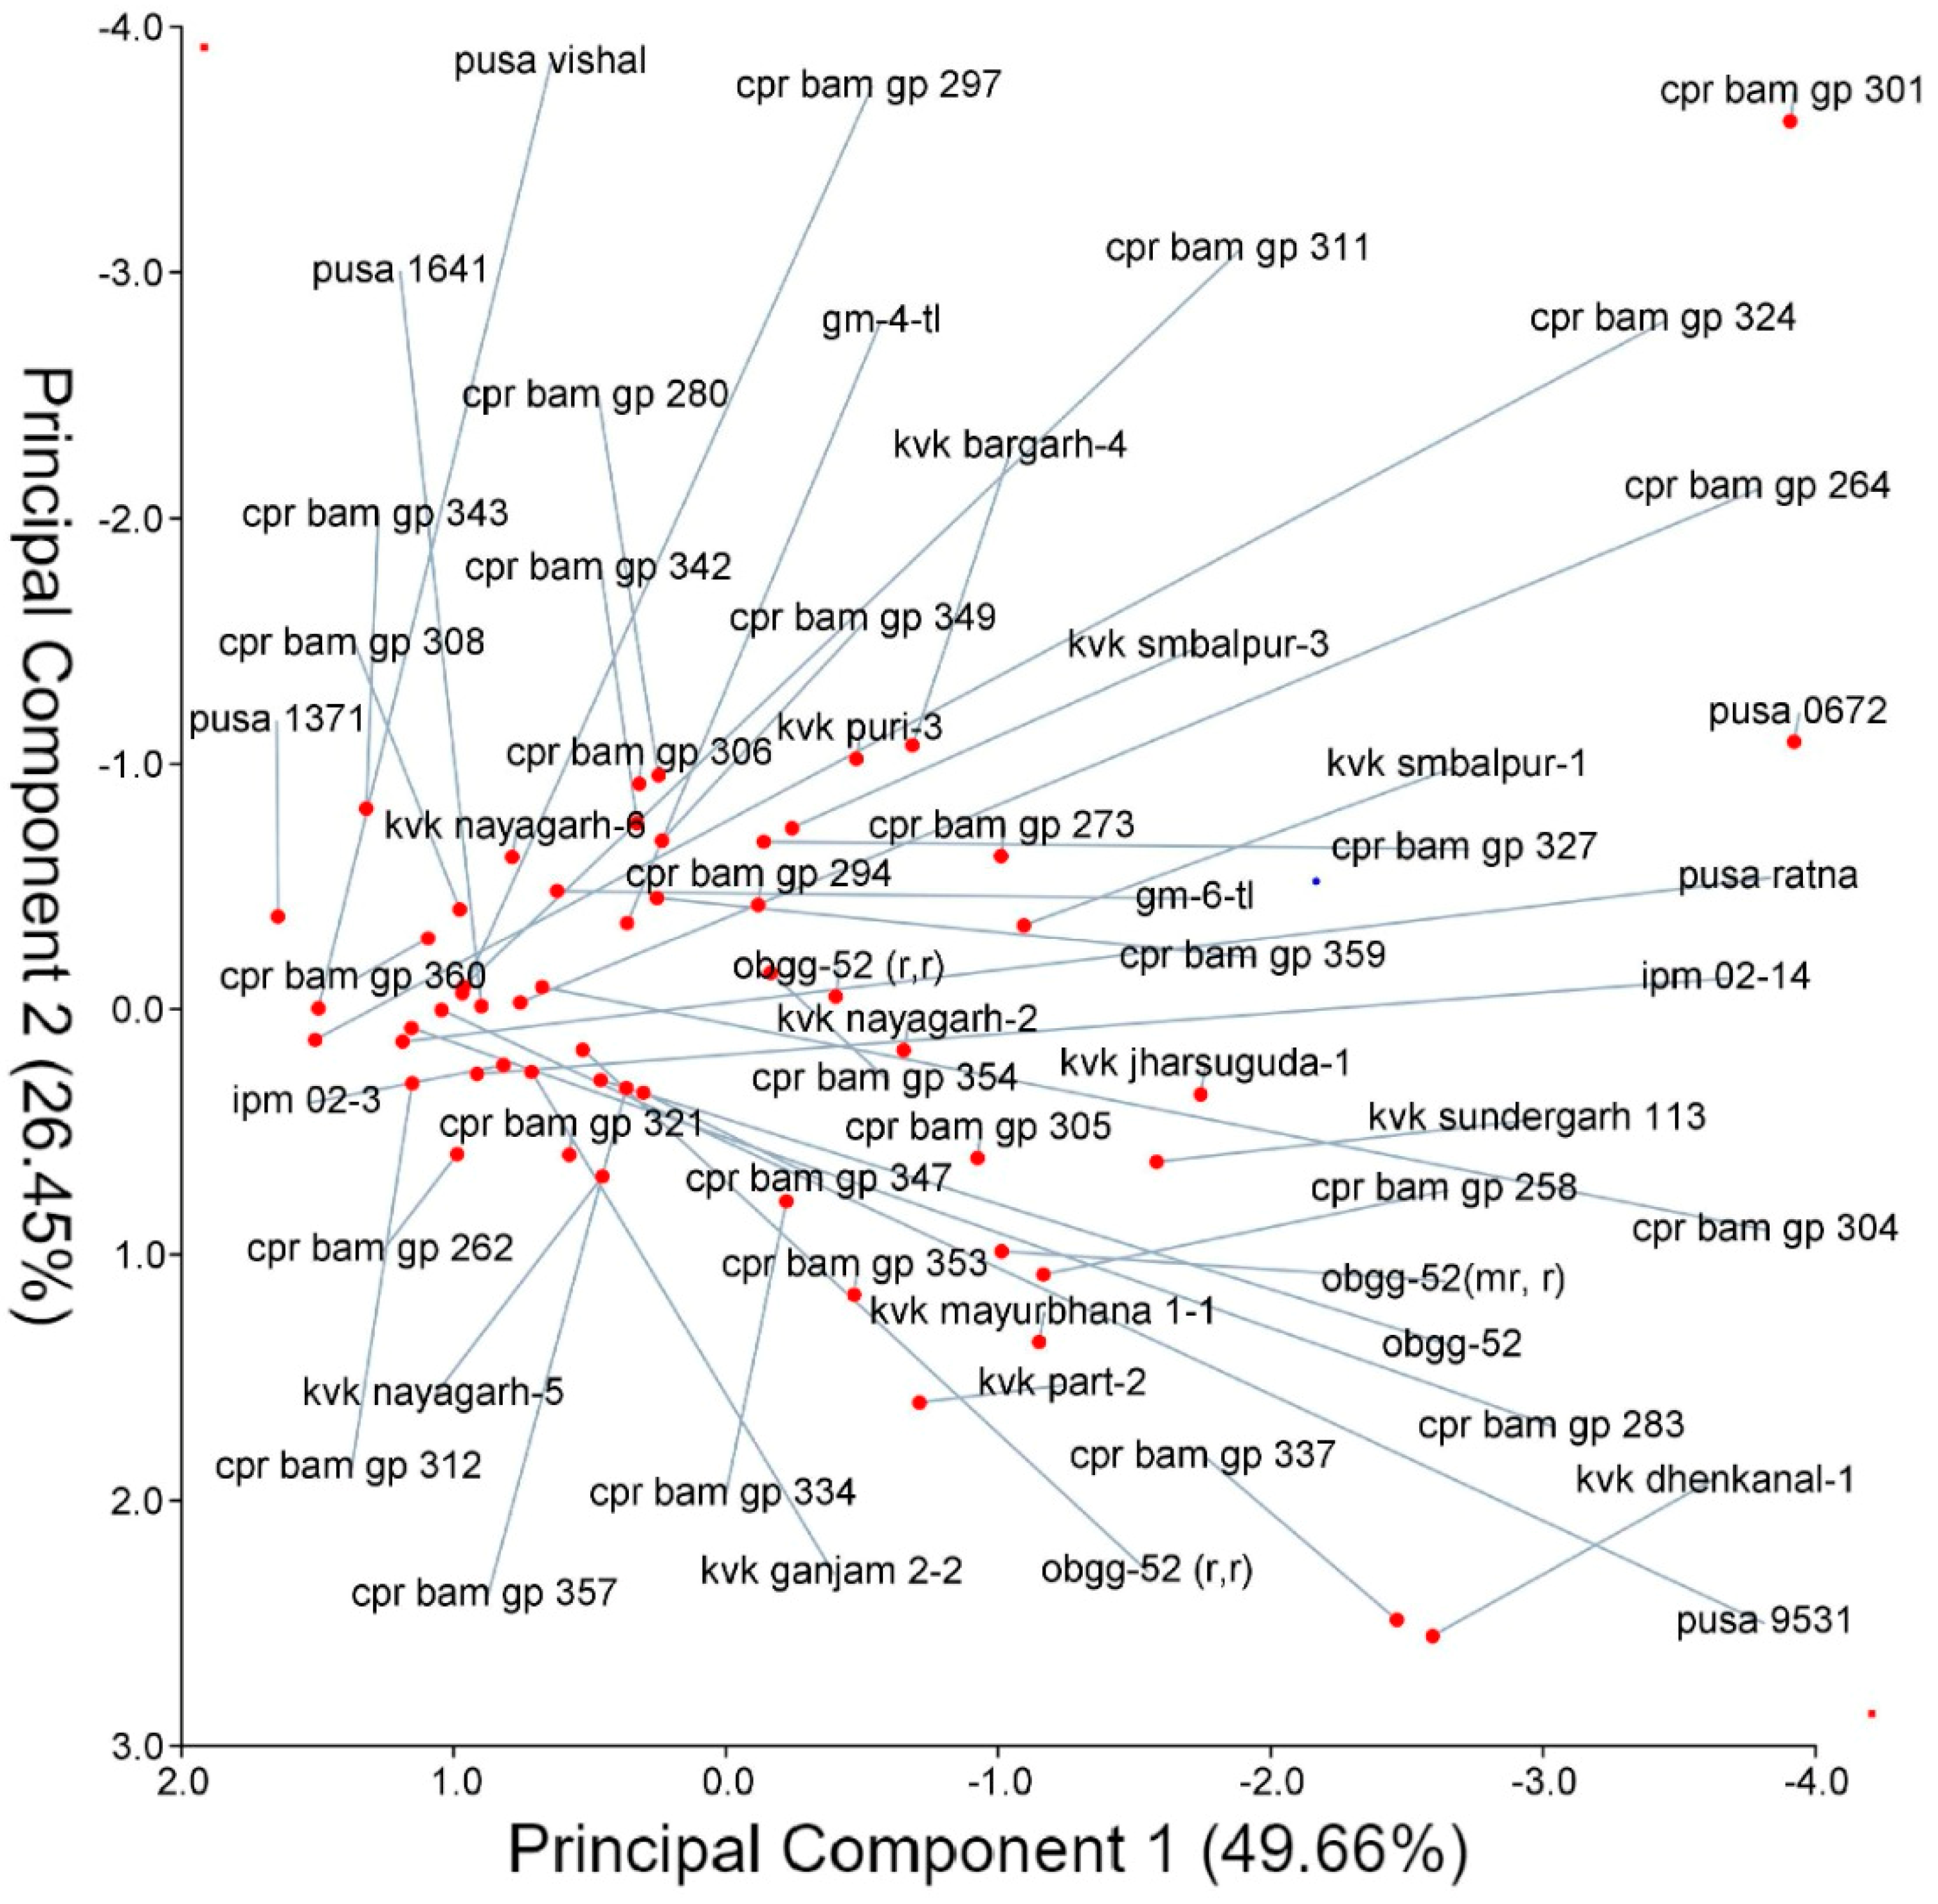
4.4. Principal Component Analysis (PCA)

PCA is a statistical approach to summarize the large dataset in smaller sets of uncorrelated variables. This study analysed 61 genotypes under salt and drought stress using various components to estimate their correlation. Each dot corresponds to a named genotype (Figure 4 and Figure 5).

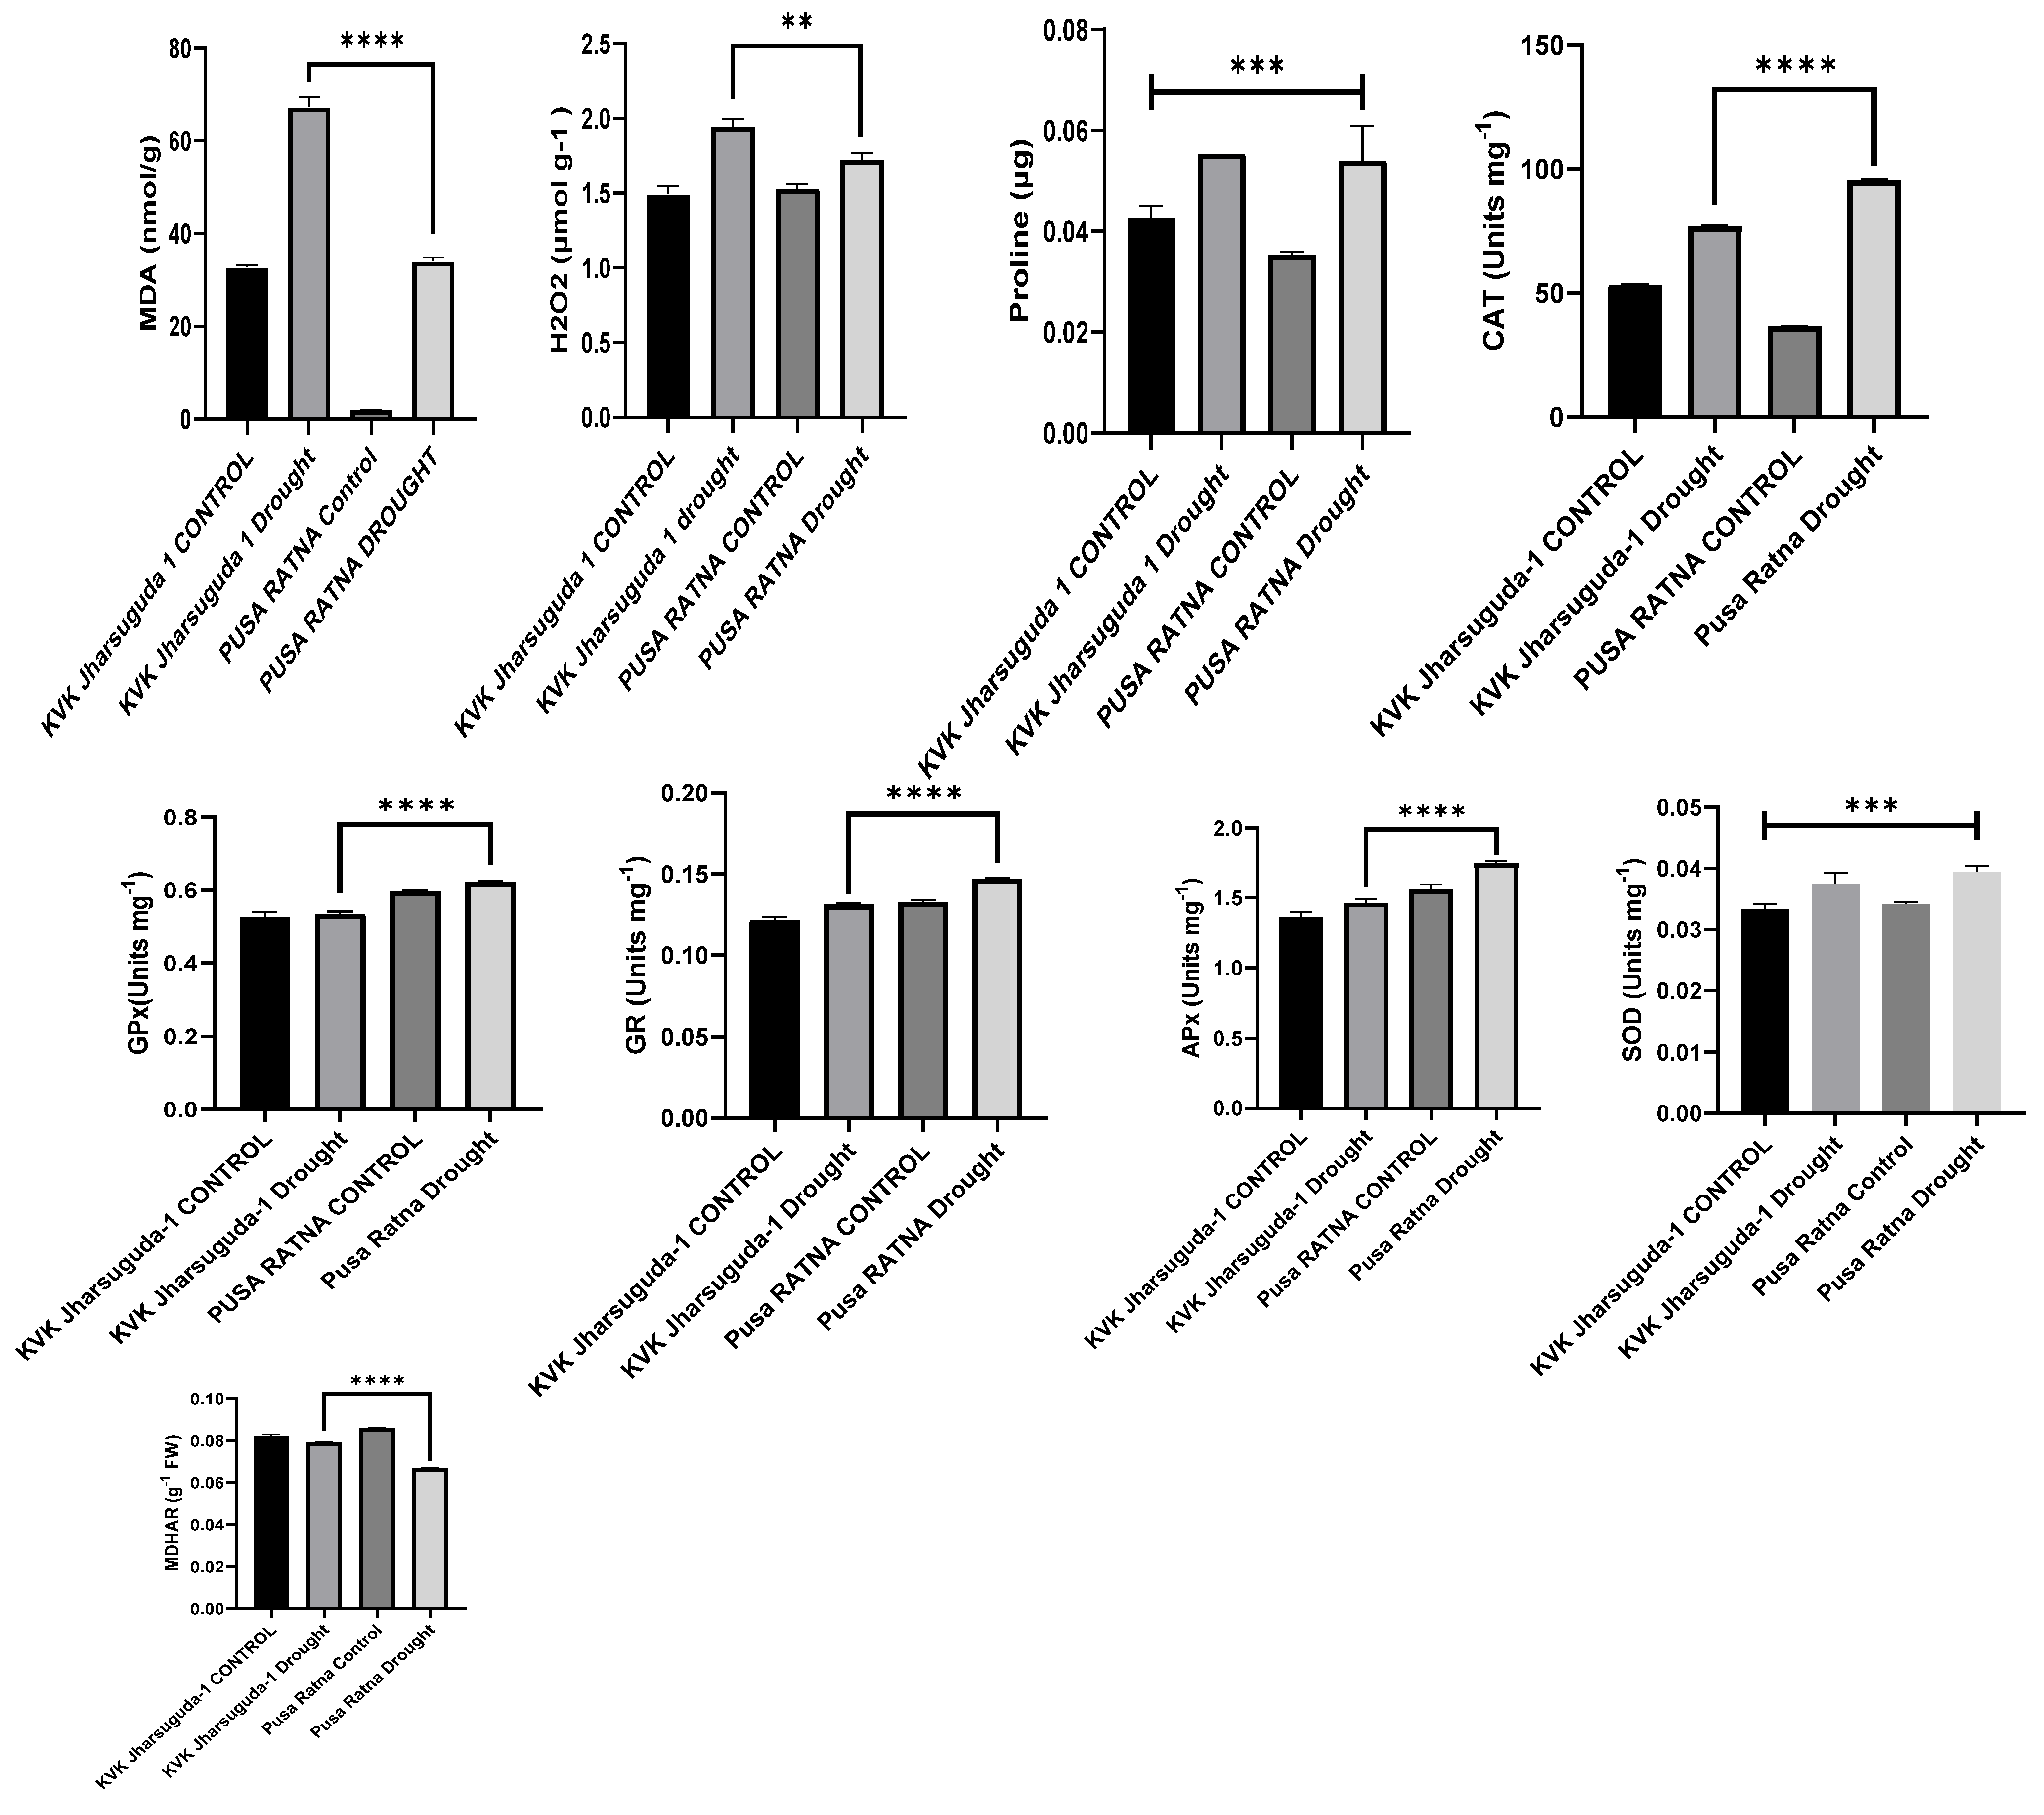
4.5. Biochemical Analysis

During abiotic stress conditions, the MDA content kept on increasing in the plants. KVK Purii 3, a salt-sensitive genotype, shows a tremendous increment in the MDA compared to Pusa Ratna against the salt stress, and the KVK Jharsuguda-1 shows a higher MDA peak than Pusa Ratna, which is a drought tolerant genotype. Proline overproduction enhances the tolerance of the plant during salt and drought conditions. Pusa Ratna shows more production of proline than the sensitive genotype of KVK Puri-3 and KVK Jharsuguda-1 during salt and drought stress, respectively (Figure 6 and Figure 7). Higher activity of CAT, SOD, GR, and GPX (Figure 6 and Figure 7) were observed in the tolerant genotypess than the sensitive ones during salt and drought stress to provide tolerance to the plant by detoxifying ROS and equilibrate its production by antioxidant production during homeostasis establishment against the stress. Ascorbic acid plays an important role in the plant cells by regulating ROS scavenging. It acts as a main antioxidant, and its frequent production is regulated by DHAR and MDHAR (Figure 6 and Figure 7). The ascorbic acid is overproduced more in the tolerant genotypes than in the sensitive genotypes under salt and drought stress conditions.

4.6. Histochemical Analysis

To check the plasma membrane integrity, a histochemical assay was performed. The assay reported the retention of Evans blue dye in sensitive genotypes than tolerant under drought and salt stress which represented the loss of membrane integrity more in sensitive one in comparison to tolerant ones (Figure 8).

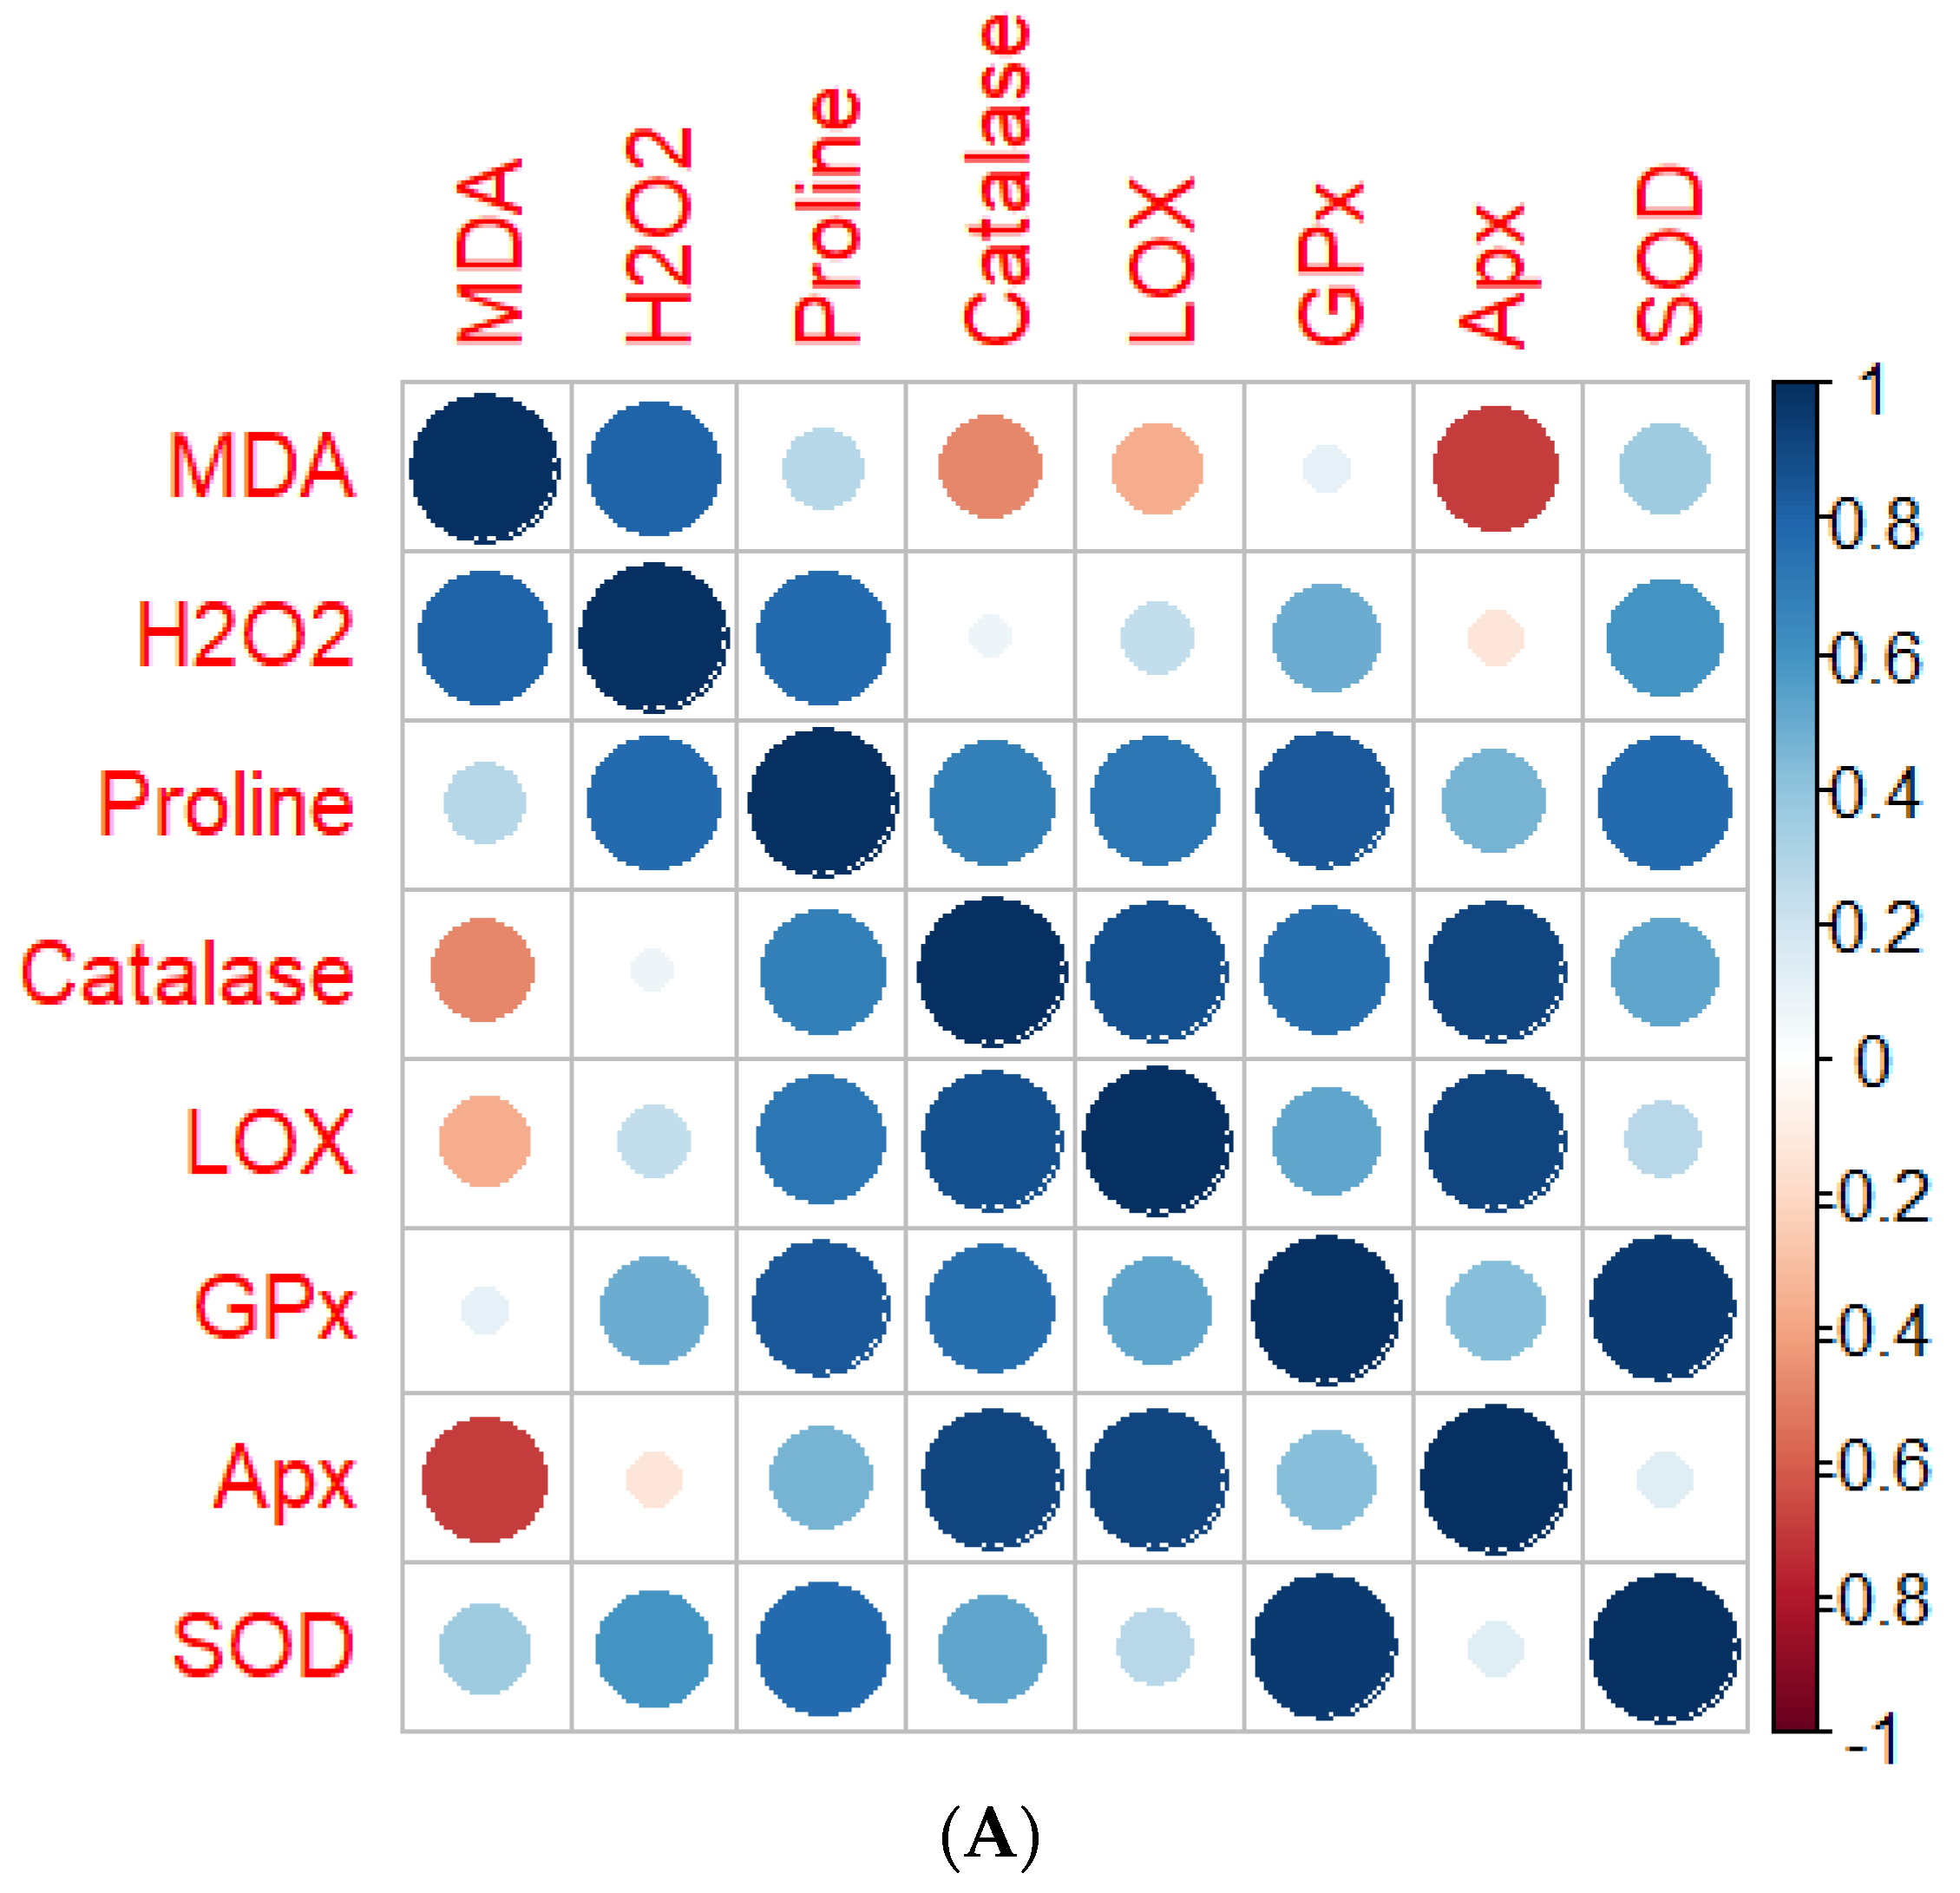
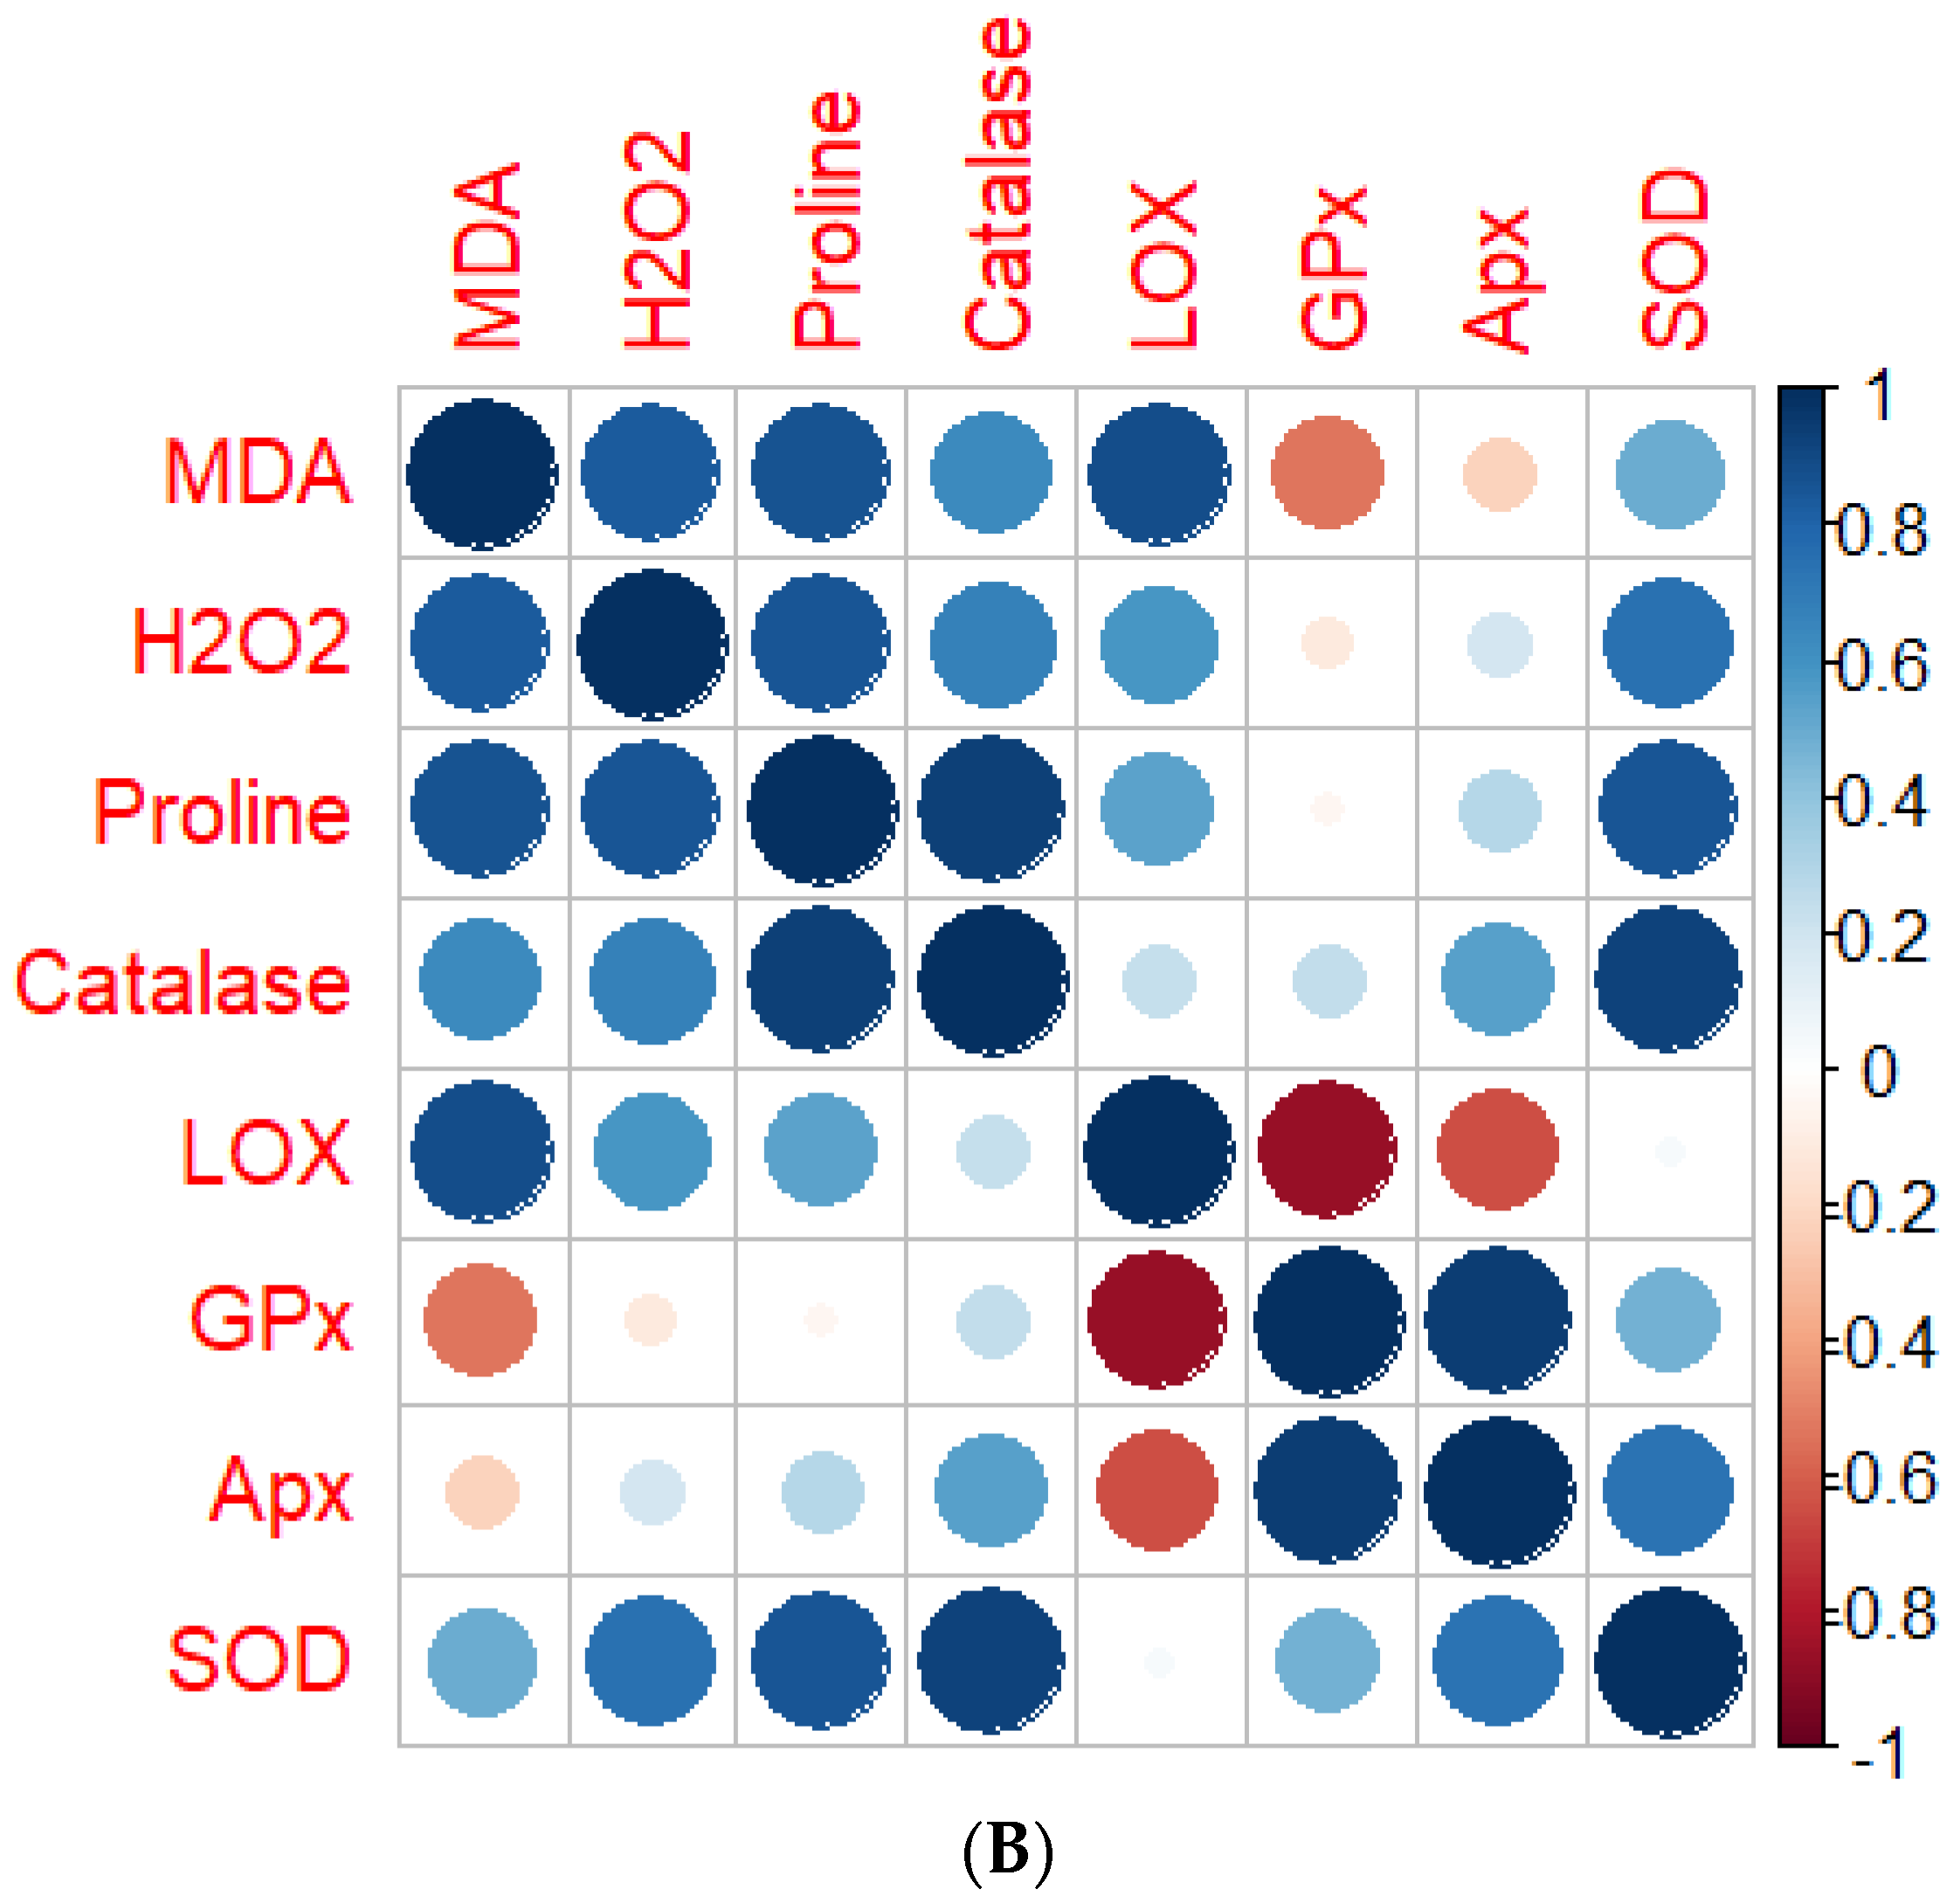
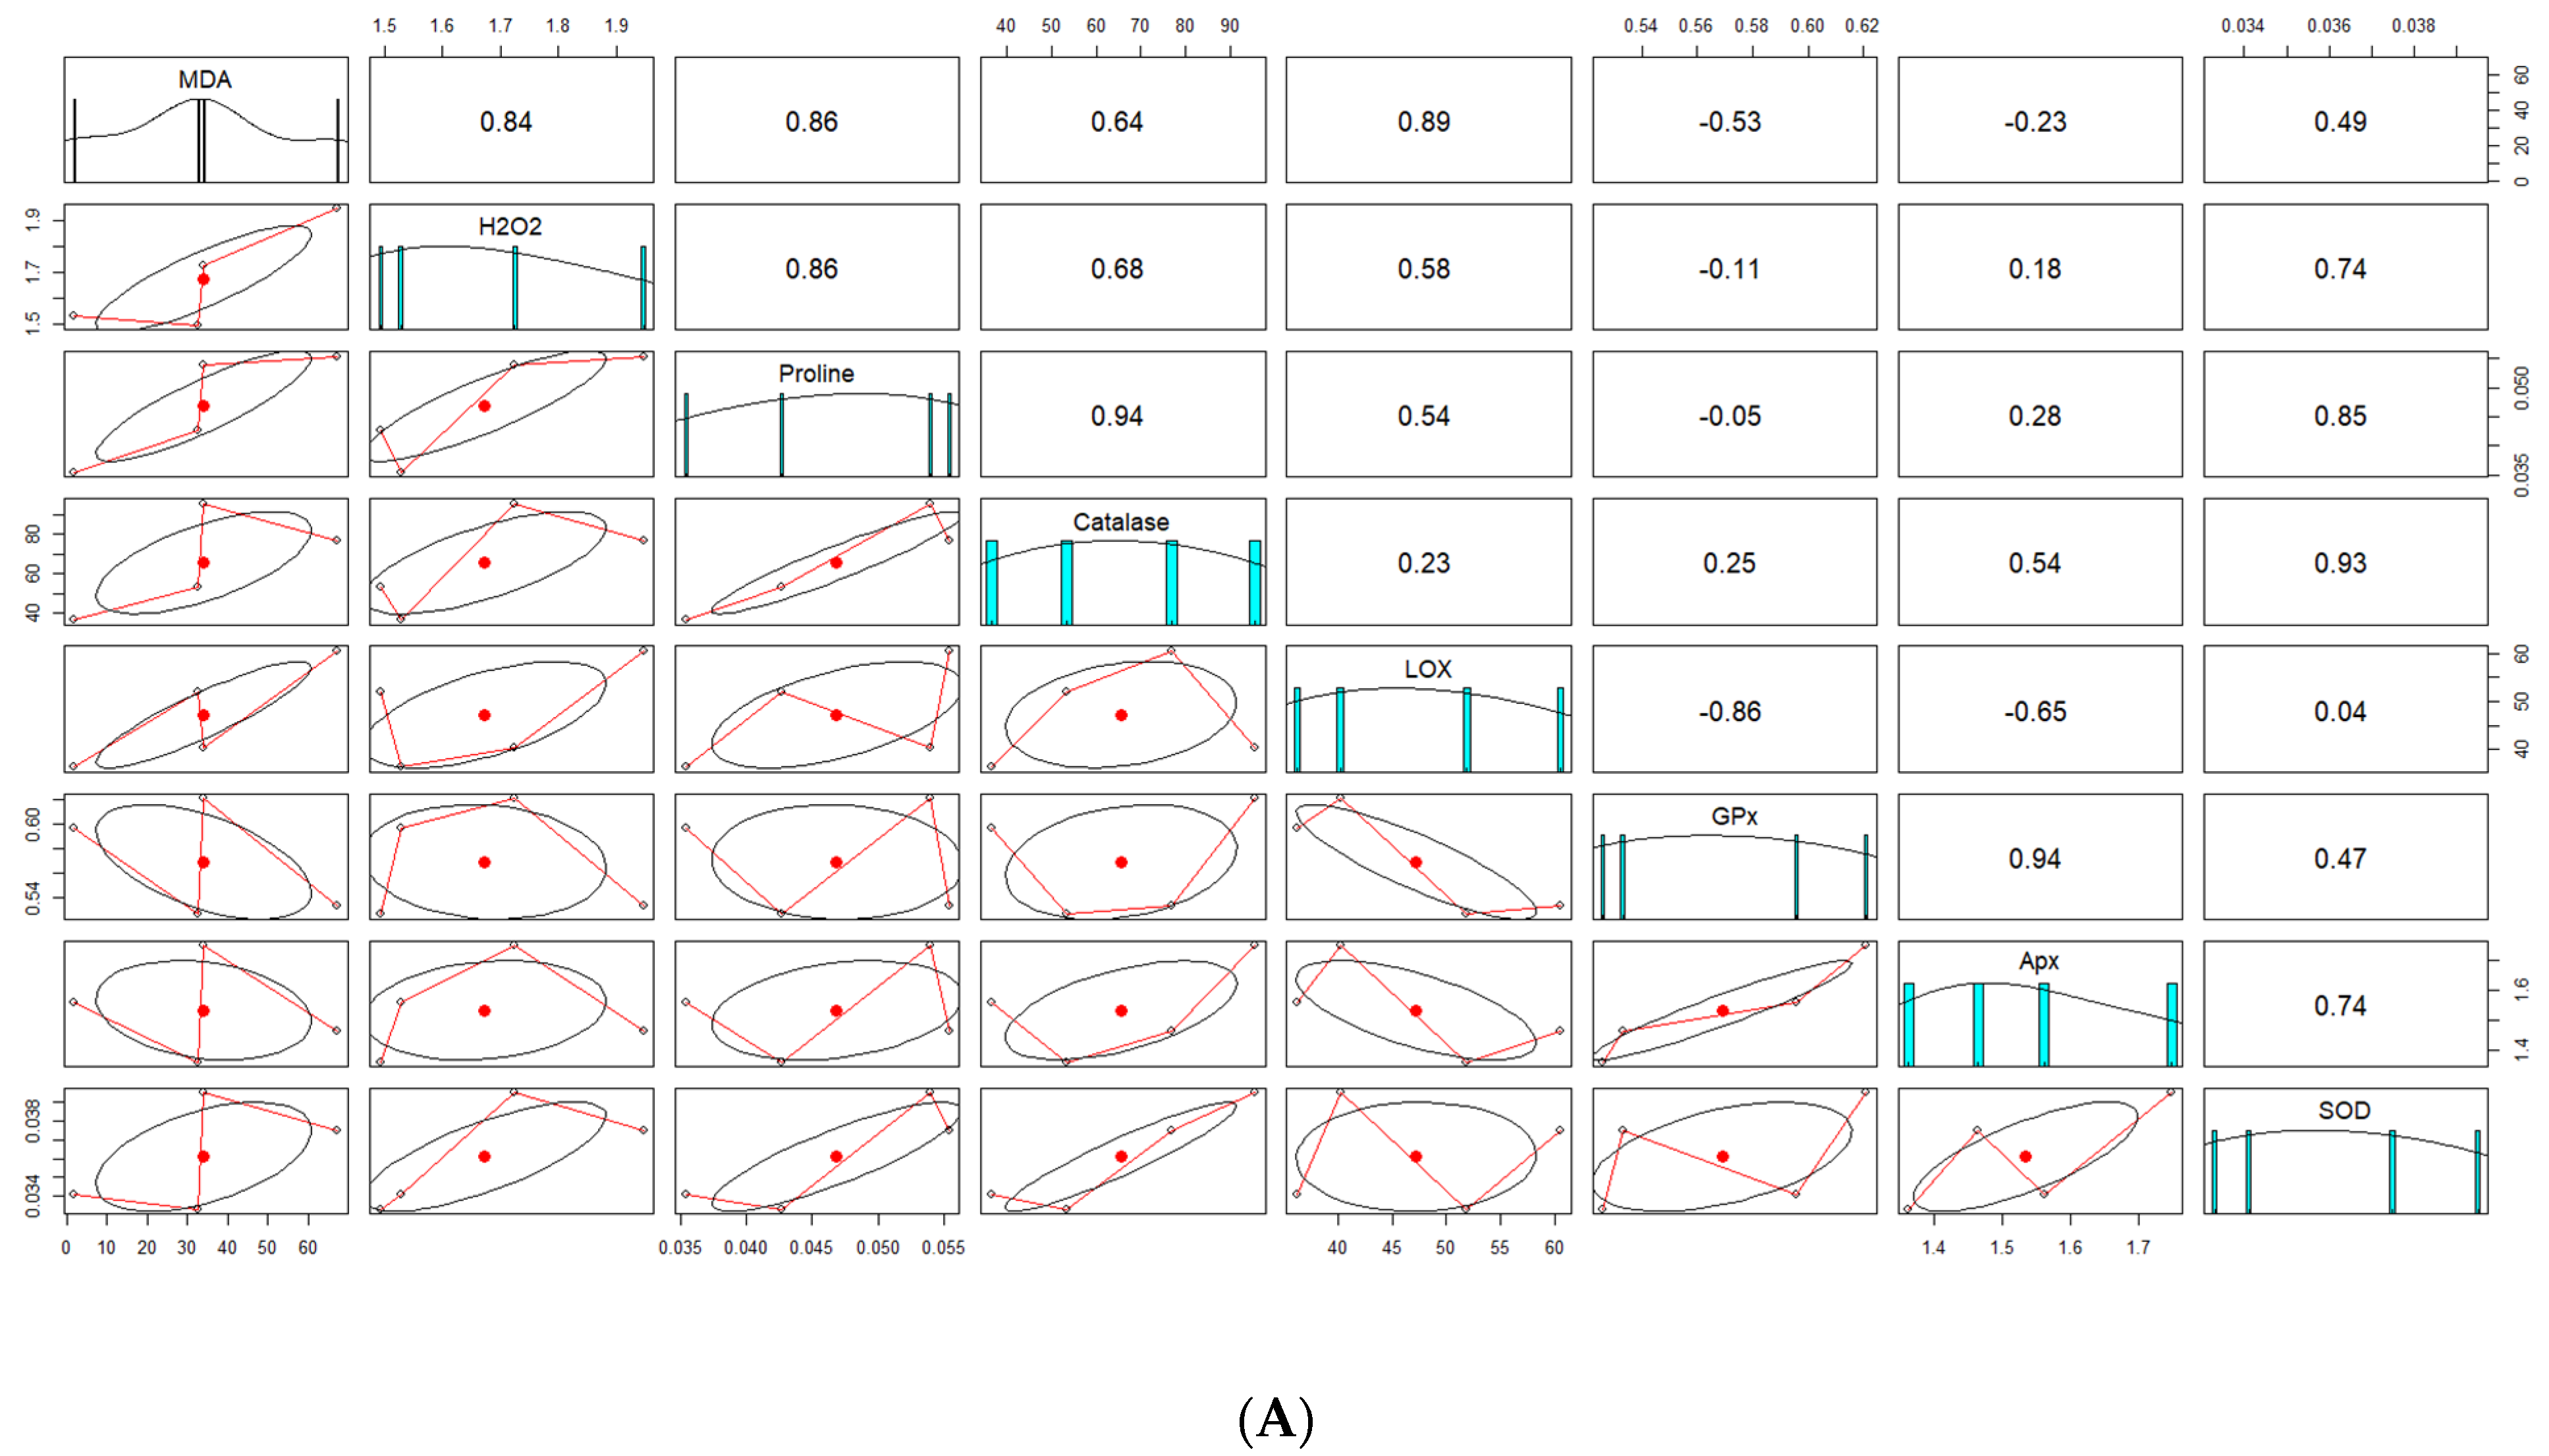
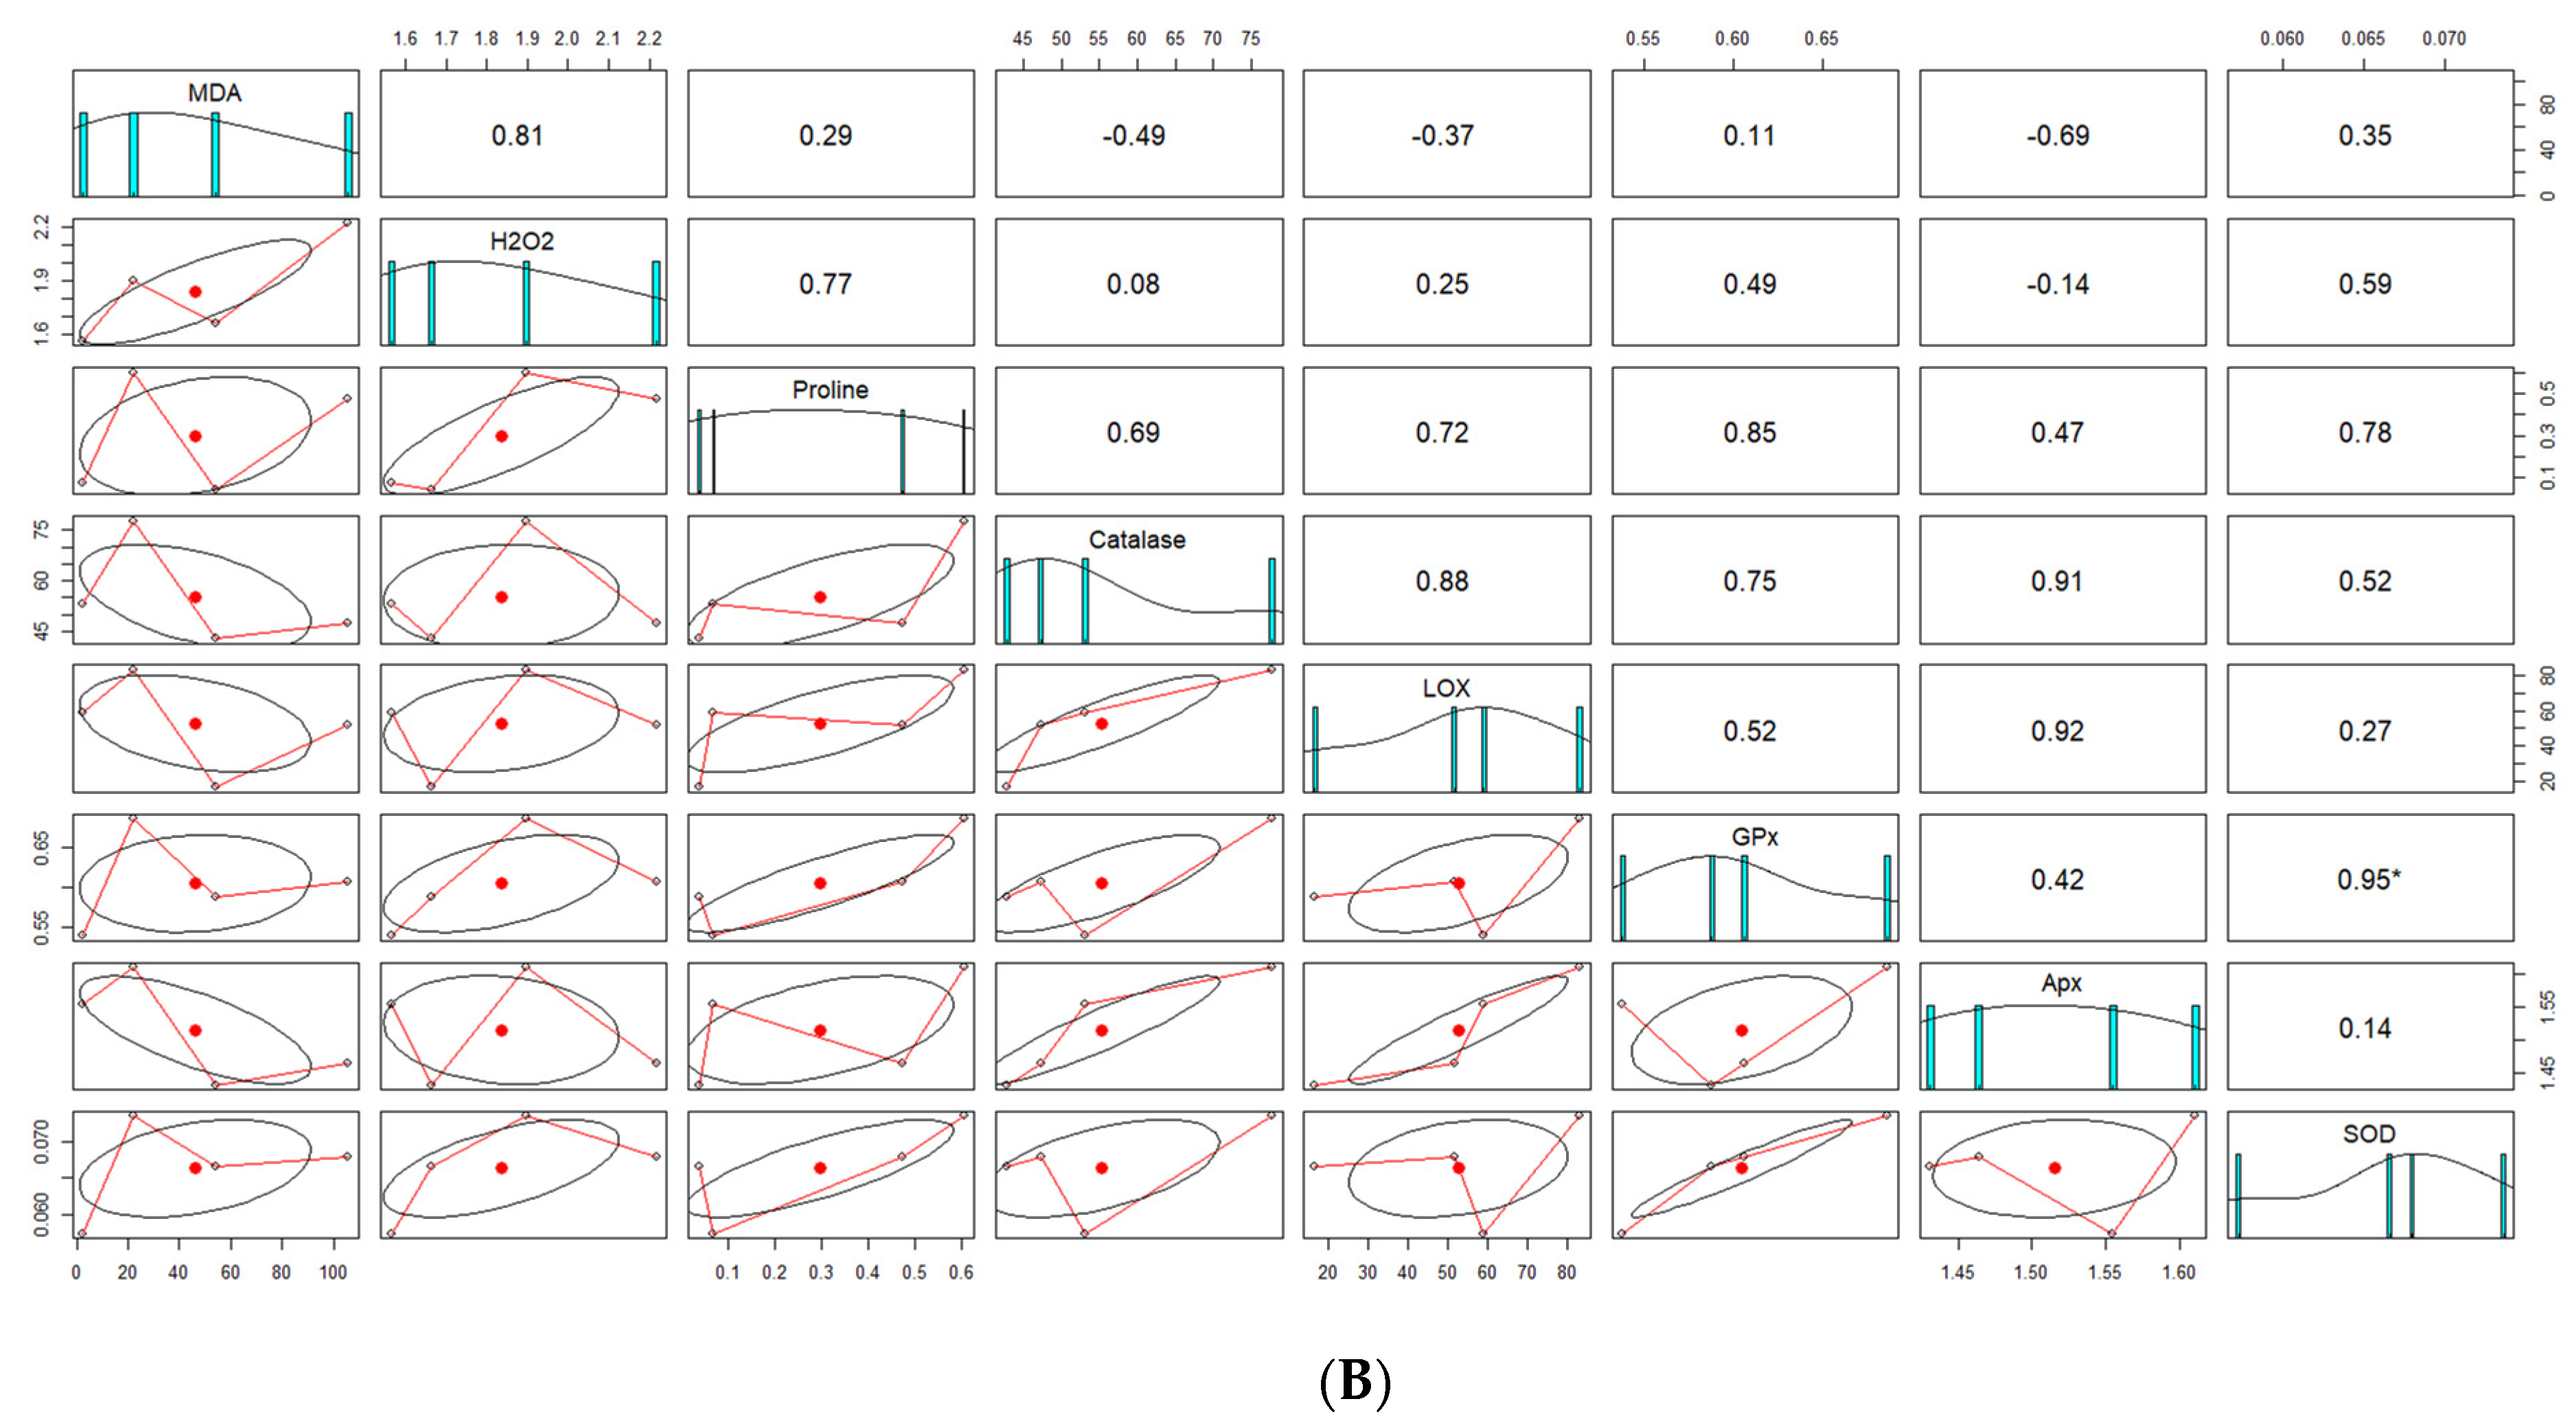
4.7. Correlation Analysis between Screened Genotypes

Here, a correlation analysis was carried out between biochemical assays performed for sensitive and tolerant genotypes under drought and salt stress (Figure 9 and Figure 10) (Tables S5 and S6).

4.8. Stress Tolerant and Sensitive Genotypes

By doing a preliminary screening of genotypes, the most sensitive and tolerant genotypes were selected. The results were demonstrated through heat map data for salt and drought stress (Figure 3) (Tables S2–S4).

4.9. Plant Height Tolerance Index

This experiment was performed for the plant height tolerance index of these 61 genotypes by salt and drought stress compared to control (Table S2). It was observed that, during salt stress conditions, the height of the plant sharply declined, whereas the tolerant genotype does not show such a decline in plant height.

5. Discussion

Salt and drought stress are one of the key factors in the regulation of plant growth and development, as they hinder photosynthetic efficiency and the uptake of water. A study of 61 genotypes of mung bean has provided two contrasting lines in terms of genotypes that are tolerant and sensitive to drought and salt stress. The seedlings were grown hydroponically for up to 15 days and exposed to salt stress (200 mM NaCl) and drought stress (10% PEG) for 48 h to evaluate the tolerance to stress at morpho-physiological, histological, and biochemical levels. RWC is one of the key parameters for understanding the relation between plants and water under osmotic stress conditions, as it is affected negatively due to lipid peroxidation, osmotic imbalance, etc. (Rao and Chaitanya 2016). Under drought and salt stress, KVK Puri-3 is a salt-sensitive genotype, reported RWC 57% and 82% in Pusa Ratna as salt tolerant. Similarly, under drought stress, KVK Jharsuguda-1 was identified as drought sensitive (RWC 70%) and Pusa Ratna was found to be drought tolerant (RWC 82%). A similar study reported a decreased RWC in rice seedlings under drought and salt stress compared to the control conditions [34].
Plant height reduction under drought stress was predicted due to water loss in cells, which may lead to inhibition in cell division [35]. In this study, salt-sensitive and tolerant genotypes, KVK Puri-3 and Pusa Ratna, have shown a decrease in plant height by 45% and 3%, respectively, as compared to the control. Similarly, drought-tolerant genotypes Pusa Ratna and KVK Jharsuguda-1as drought sensitive have shown decreases in PHTI by 2% and 62%, respectively. Similar to our study, wheat cultivars also showed reduced plant growth under drought and salt stress in comparison to control conditions [36]. In another report, barley plant height was also affected by drought stress [37]. Fv/Fm is a noninvasive method for monitoring photochemical quenching parameters for quantitative assessment in regard to monitoring the survival of plants under stress conditions [38]. Under salt stress, KVK Puri 3 has shown a 69% decrease in Fv/Fm value relative to control conditions, but no significant difference was observed under drought stress (Figure 2, Table S7). Similarly, [39] also reported a significant decrease in Fv/Fm values under salt stress after 8 days of treatment in watermelon seedlings, whereas no change was observed under drought stress.
Membrane stability determines the survivability of plants under stress conditions. Evan’s blue is a quick and cost-effective method of checking cell viability by penetrating through damaged tissue. The staining represents the cellular damage under stress [40]. In our study, the leaf tissue of KVK Puri-3 after staining, as a salt-sensitive genotype, has shown high damage by cells, as it retains more blue color than in the salt-tolerant Pusa Ratna genotype. Similarly, KVK Jharsuguda-1 was confirmed as drought sensitive and Pusa Ratna as drought tolerant by staining the tissue of each with a blue color. Also, in an earlier study, damage to the plasma membrane of root of sensitive variety was reported by Evan’s blue uptake [41].
Oxygen radicals and derivatives are termed ROS which are involved in regulatory mechanisms in higher plants under normal conditions; however, under stress conditions, they are responsible for oxidative stress [13]. To maintain ROS homeostasis, the ascorbate-glutathione pathway plays a crucial role as it is the result of enzymatic linkage between ascorbate-glutathione -NADPH: as antioxidant metabolites [42]. To evaluate the role of enzymes, APx, MDHAR, DHAR and GR an enzymatic assay have been utilized. In our study, MDHAR and DHAR reduced their concentration under salt and drought conditions in more tolerant genotypes than in sensitive genotypes. On the contrary, APX and GR were shown to be increased in tolerant genotypes relative to sensitive under drought and salt conditions. Similarly, CAT, SOD, and GPx as antioxidants were also more increased in tolerant genotypes relative to sensitive genotypes. Under osmotic stress, increased activity of Apx, GR, and GPx was reported in the Brassica species [43]. Similarly, the enzymatic activity was improved in SOD, CAT, GR and Apx in wheat under osmotic stress conditions [44]. Similar to our study, MDHAR was shown to be decreased in B. campestris under osmotic stress [43]. In a study, a synchrony was observed between the proline and ascorbate pathways in tomato plants [45]. Additionally, in our findings, proline accumulated in higher concentrations in more tolerant genotypes than in sensitive genotypes under drought and salt stress conditions, which can support the above synchrony between the two of them. After imposing drought stress, enhanced accumulation of proline biosynthesis in peanuts was recently studied [46]. Based on the screening of all 61 genotypes, the finally identified contrasting lines in response to drought and salt stress can be studied for further omics analysis to understand the molecular signalling that is responsible for the tolerance in identified genotypes.

6. Conclusions

In our study, we have screened 61 genotypes against drought and salt stress to identify sensitive and tolerant genotypes under the conditions of drought and salt stress. Through morpho-physiological, histological, and biochemical assays, KVK Puri-, and KVK Jharsuguda-1 were characterized as salt and drought sensitive genotypes, respectively, and Pusa Ratna was identified as being a drought- and salt-tolerant genotype. Identifying drought and salt genotypes against drought and salt stress can be used to improve crop productivity through marker-assisted breeding by identifying the traits of the target.

Supplementary Materials

The following supporting information can be downloaded at: https://www.mdpi.com/article/10.3390/agriculture14081337/s1, Table S1: Description of Mungbean Genotypes; Table S2: Classification of Mungbean Genotypes Based on Plant Tolerance Index After Salt Stress and Drought Stress; Table S3: Effect of Salt and Drought Stress on Chlorophyll Efficiency of 61 Mungbean Genotypes; Table S4: Effect of Salt and Drought Stress on Relative Water Content (%) on Mungbean Genotypes After 48 h; Table S5: Correlation Table of Biochemical Test Under Salt Stress; Table S6: Correlation Table of Drought; Table S7: Comparative Analysis of Photosynthetic Parameters in Genotypes Exhibiting Tolerance versus Sensitivity.

Author Contributions

M.P. and A.S.: investigation, data visualization, M.P. and D.G.: original draft preparationand statistical analysis, A.K., R.P. and D.G.: Data visualization S.K.P.: project administration, supervision, resources. All authors have read and agreed to the published version of the manuscript.

Funding

This research was supported by DBT-Builder project BT/INF/22/SP44383/2021.

Institutional Review Board Statement

Not applicable.

Data Availability Statement

All the required data has been submitted through Supplementary Materials.

Acknowledgments

We acknowledge the Orissa University of Agriculture and Technology, Bhubneshwar, India, and Gyana Ranjan Rout for providing us with the mung bean genotype seeds.We would also like to thank the Department of Biochemistry, School of Life Sciences for providing the instrumentation facility and space to carry out our research project.

Conflicts of Interest

The authors declare no conflicts of interest.

References

  1. Kaushal, M.; Wani, S.P. Rhizobacterial-plant interactions: Strategies ensuring plant growth promotion under drought and salinity stress. Agric. Ecosyst. Environ. 2016, 231, 68–78. [Google Scholar] [CrossRef]
  2. Ma, Y.; Dias, M.C.; Freitas, H. Drought and salinity stress responses and microbe-induced tolerance in plants. Front. Plant Sci. 2020, 11, 591911. [Google Scholar] [CrossRef]
  3. Balasubramaniam, T.; Shen, G.; Esmaeili, N.; Zhang, H. Plants’ response mechanisms to salinity stress. Plants 2023, 12, 22–53. [Google Scholar] [CrossRef]
  4. Waseem, M.; Liu, P.; Aslam, M.M. Salinity and drought stress in plants: Understanding physiological, biochemical and molecular responses. Front. Plant Sci. 2023, 14, 1277859. [Google Scholar] [CrossRef]
  5. Chele, K.H.; Tinte, M.M.; Piater, L.A.; Dubery, I.A.; Tugizimana, F. Soil salinity, a serious environmental issue and plant responses: A metabolomics perspective. Metabolites 2021, 11, 724. [Google Scholar] [CrossRef] [PubMed]
  6. Zhao, S.; Zhang, Q.; Liu, M.; Zhou, H.; Ma, C.; Wang, P. Regulation of plant responses to salt stress. Int. J. Mol. Sci. 2021, 22, 4609. [Google Scholar] [CrossRef]
  7. Ahmed, M.A. Physiological effects of salt stress on plant growth. Tikrit J. Agric. Sci. 2022, 22, 93–97. [Google Scholar] [CrossRef]
  8. Rasheed, R.; Iqbal, M.; Anwar, S.; Shereen, A.; Khan, M.A. Assessment of rice (Oryza sativa L.) genotypes for drought stress tolerance using morpho-physiological indices as a screening technique. Pak. J. Bot. 2021, 53, 45–58. [Google Scholar]
  9. Khatun, M.; Sarkar, S.; Era, F.M.; Islam, A.M.; Anwar, M.P.; Fahad, S.; Datta, R.; Islam, A.A. Drought stress in grain legumes: Effects, tolerance mechanisms and management. Agronomy 2021, 11, 2374. [Google Scholar] [CrossRef]
  10. Hou, D.; Yousaf, L.; Xue, Y.; Hu, J.; Wu, J.; Hu, X.; Feng, N.; Shen, Q. Mung bean (Vigna radiata L.): Bioactive polyphenols, polysaccharides, peptides, and health benefits. Nutrients 2019, 11, 1238. [Google Scholar] [CrossRef]
  11. Nair, R.; Schreinemachers, P. Global status and economic importance of mungbean. In The Mungbean Genome; Springer: Berlin/Heidelberg, Germany, 2020; pp. 1–8. [Google Scholar]
  12. Mohan Naik, G.; Abhirami, P.; Venkatachalapathy, N. Mung bean. In Pulses: Processing and Product Development; Springer Cham: Cham, Switzerland, 2020; pp. 213–228. [Google Scholar]
  13. Hasanuzzaman, M.; Bhuyan, M.B.; Parvin, K.; Bhuiyan, T.F.; Anee, T.I.; Nahar, K.; Hossen, M.S.; Zulfiqar, F.; Alam, M.M.; Fujita, M. Regulation of ROS metabolism in plants under environmental stress: A review of recent experimental evidence. Int. J. Mol. Sci. 2020, 21, 8695. [Google Scholar] [CrossRef] [PubMed]
  14. Baza, M.; Shanka, D.; Bibiso, M. Agronomic and economic performance of mung bean (Vigna radiata L.) varieties in response to rates of blended NPS fertilizer in Kindo Koysha district, Southern Ethiopia. Open Life Sci. 2022, 17, 1053–1063. [Google Scholar] [CrossRef]
  15. Sehrawat, N.; Yadav, M.; Sharma, A.K.; Kumar, V.; Bhat, K.V. Salt stress and mungbean [Vigna radiata (L.) Wilczek]: Effects, physiological perspective and management practices for alleviating salinity. Arch. Agron. Soil Sci. 2019, 65, 1287–1301. [Google Scholar] [CrossRef]
  16. Islam, M.R.; Sarker, U.; Azam, M.G.; Hossain, J.; Alam, M.A.; Ullah, R.; Bari, A.; Hossain, N.; El Sabagh, A.; Islam, M.S. Potassium augments growth, yield, nutrient content, and drought tolerance in mung bean (Vigna radiata L. Wilczek.). Sci. Rep. 2024, 14, 9378. [Google Scholar] [CrossRef]
  17. Sachdev, S.; Ahmad, S. Role of nanomaterials in regulating oxidative stress in plants. In Nanobiotechnology: Mitigation of Abiotic Stress in Plants; Springer Cham: Cham, Switzerland, 2021; pp. 305–326. [Google Scholar]
  18. Awasthi, J.P.; Saha, B.; Regon, P.; Sahoo, S.; Chowra, U.; Pradhan, A.; Roy, A.; Panda, S.K. Morpho-physiological analysis of tolerance to aluminum toxicity in rice varieties of North East India. PloS One 2017, 12, e0176357. [Google Scholar] [CrossRef]
  19. Nawaz, F.; Ashraf, M.Y.; Ahmad, R.; Waraich, E.A.; Shabbir, R.N. Selenium (Se) regulates seedling growth in wheat under drought stress. Adv. Chem. 2014, 143567. [Google Scholar] [CrossRef]
  20. Saha, B.; Swain, D.; Borgohain, P.; Rout, G.R.; Koyama, H.; Panda, S.K. Enhanced exudation of malate in the rhizosphere due to AtALMT1 overexpression in blackgram (Vigna mungo L.) confers increased aluminium tolerance. Plant Biol. 2020, 22, 701–708. [Google Scholar]
  21. Moustaka, J.; Moustakas, M. Early-stage detection of biotic and abiotic stress on plants by chlorophyll fluorescence imaging analysis. Biosensors 2023, 13, 796. [Google Scholar] [CrossRef]
  22. Schützendübel, A.; Schwanz, P.; Teichmann, T.; Gross, K.; Langenfeld-Heyser, R.; Godbold, D.L.; Polle, A. Cadmium-induced changes in antioxidative systems, hydrogen peroxide content, and differentiation in Scots pine roots. Plant Physiol. 2001, 127, 887. [Google Scholar] [CrossRef]
  23. Heath, R.L.; Packer, L. Reprint of: Photoperoxidation in isolated chloroplasts I. Kinetics and stoichiometry of fatty acid peroxidation. Arch. Biochem. Biophys. 2022, 726, 109248. [Google Scholar] [CrossRef]
  24. Axelrod, B.; Cheesbrough, T.M.; Laakso, S. [53] Lipoxygenase from soybeans: EC 1.13. 11.12 Linoleate: Oxygen oxidoreductase. In Methods in Enzymology; Academic Press: Cambridge, MA, USA, 1981; Volume 71, pp. 441–451. [Google Scholar]
  25. Junglee, S.; Urban, L.; Sallanon, H.; Lopez-Lauri, F. Optimized assay for hydrogen peroxide determination in plant tissue using potassium iodide. Am. J. Anal. Chem. 2014, 5, 730. [Google Scholar] [CrossRef]
  26. Forlani, G.; Funck, D. A specific and sensitive enzymatic assay for the quantitation of L-proline. Front. Plant Sci. 2020, 11, 582026. [Google Scholar] [CrossRef]
  27. Gupta, A.S.; Webb, R.P.; Holaday, A.S.; Allen, R.D. Overexpression of superoxide dismutase protects plants from oxidative stress (induction of ascorbate peroxidase in superoxide dismutase-overexpressing plants). Plant Physiol. 1993, 103, 1067–1073. [Google Scholar] [CrossRef]
  28. Rao, M.V.; Paliyath, G.; Ormrod, D.P. Ultraviolet-B-and ozone-induced biochemical changes in antioxidant enzymes of Arabidopsis thaliana. Plant Physiol. 1996, 110, 125–136. [Google Scholar] [CrossRef]
  29. Smith, I.K.; Vierheller, T.L.; Thorne, C.A. Assay of glutathione reductase in crude tissue homogenates using 5,5′-dithiobis(2-nitrobenzoic acid). Anal. Biochem. 1988, 175, 408–413. [Google Scholar] [CrossRef] [PubMed]
  30. Amako, K.; Chen, G.X.; Asada, K. Separate assays specific for ascorbate peroxidase and guaiacol peroxidase and for the chloroplastic and cytosolic isozymes of ascorbate peroxidase in plants. Plant Cell Physiol. 1994, 35, 497–504. [Google Scholar]
  31. Hossain, M.A.; Nakano, Y.; Asada, K. Monodehydroascorbate reductase in spinach chloroplasts and its participation in regeneration of ascorbate for scavenging hydrogen peroxide. Plant Cell Physiol. 1984, 25, 385–395. [Google Scholar]
  32. Poli, Y.; Nallamothu, V.; Balakrishnan, D.; Ramesh, P.; Desiraju, S.; Mangrauthia, S.K.; Voleti, S.R.; Neelamraju, S. Increased catalase activity and maintenance of photosystem II distinguishes high-yield mutants from low-yield mutants of rice var. Nagina22 under low-phosphorus stress. Front. Plant Sci. 2018, 9, 1543. [Google Scholar] [CrossRef] [PubMed]
  33. Wei, T.; Simko, V. Package “Corrplot”: Visualization of a Correlation Matrix, Version 0.84. 2017. 2020. Available online: https://github.com/taiyun/corrplot (accessed on 6 August 2024).
  34. Hossen, M.S.; Karim, M.F.; Fujita, M.; Bhuyan, M.B.; Nahar, K.; Masud, A.A.C.; Mahmud, J.A.; Hasanuzzaman, M. Comparative physiology of Indica and Japonica rice under salinity and drought stress: An intrinsic study on osmotic adjustment, oxidative stress, antioxidant defense and methylglyoxal detoxification. Stresses 2022, 2, 156–178. [Google Scholar] [CrossRef]
  35. Mehraban, A.; Tobe, A.; Gholipouri, A.; Amiri, E.; Ghafari, A.; Rostaii, M. The effects of drought stress on yield, yield components, and yield stability at different growth stages in bread wheat cultivar (Triticum aestivum L.). Pol. J. Environ. Stud. 2019, 28. [Google Scholar]
  36. Dugasa, M.T.; Cao, F.; Ibrahim, W.; Wu, F. Differences in physiological and biochemical characteristics in response to single and combined drought and salinity stresses between wheat genotypes differing in salt tolerance. Physiol. Plant. 2019, 165, 134–143. [Google Scholar] [CrossRef]
  37. Hafez, Y.; Attia, K.; Alamery, S.; Ghazy, A.; Al-Doss, A.; Ibrahim, E.; Rashwan, E.; El-Maghraby, L.; Awad, A.; Abdelaal, K. Beneficial effects of biochar and chitosan on antioxidative capacity, osmolytes accumulation, and anatomical characters of water-stressed barley plants. Agronomy 2020, 10, 630. [Google Scholar] [CrossRef]
  38. Woo, N.S.; Badger, M.R.; Pogson, B.J. A rapid, non-invasive procedure for quantitative assessment of drought survival using chlorophyll fluorescence. Plant Methods 2008, 4, 1–14. [Google Scholar] [CrossRef]
  39. Shin, Y.K.; Bhandari, S.R.; Lee, J.G. Monitoring of salinity, temperature, and drought stress in grafted watermelon seedlings using chlorophyll fluorescence. Front. Plant Sci. 2021, 12, 786309. [Google Scholar] [CrossRef]
  40. Vijayaraghavareddy, P.; Adhinarayanreddy, V.; Vemanna, R.S.; Sreeman, S.; Makarla, U. Quantification of membrane damage/cell death using Evan’s blue staining technique. Bio-Protocol 2017, 7, e2519. [Google Scholar]
  41. Omisun, T.; Sahoo, S.; Saha, B.; Panda, S.K. Relative salinity tolerance of rice cultivars native to North East India: A physiological, biochemical and molecular perspective. Protoplasma 2018, 255, 193–202. [Google Scholar] [CrossRef]
  42. Pandey, P.; Singh, J.; Achary, V.M.M.; Reddy, M.K. Redox homeostasis via gene families of ascorbate-glutathione pathway. Front. Environ. Sci. 2015, 3, 25. [Google Scholar] [CrossRef]
  43. Alam, M.M.; Nahar, K.; Hasanuzzaman, M.; Fujita, M. Alleviation of osmotic stress in Brassica napus, B. campestris, and B. juncea by ascorbic acid application. Biol. Plant. 2014, 58, 697–708. [Google Scholar]
  44. Naderi, R.; Valizadeh, M.; Toorchi, M.; Shakiba, M.R. Antioxidant enzyme changes in response to osmotic stress in wheat (Triticum aestivum L.) seedling. Acta Biol. Szeged. 2014, 58, 95–101. [Google Scholar]
  45. Lopez-Delacalle, M.; Silva, C.J.; Mestre, T.C.; Martinez, V.; Blanco-Ulate, B.; Rivero, R.M. Synchronization and interaction of proline, ascorbate and oxidative stress pathways under abiotic stress combination in tomato plants. BioRxiv 2020. [Google Scholar] [CrossRef]
  46. Furlan, A.L.; Bianucci, E.; Giordano, W.; Castro, S.; Becker, D.F. Proline metabolic dynamics and implications in drought tolerance of peanut plants. Plant Physiol. Biochem. 2020, 151, 566–578. [Google Scholar] [CrossRef] [PubMed]
Figure 1. This figure shows the physical changes that occur in response to salt and drought stress. (A) Salt tolerant germplasm: Pusa Ratna; (B) salt sensitive germplasm: KVK Puri-3; (C) drought tolerant germplasm: Pusa Ratna; (D) drought sensitive germplasm: KVK Jharsuguda.
Agriculture 14 01337 g001
Figure 2. Comparing sensitive and tolerant plant genotypes under salt and drought stress reveals distinct differences in their RWC, PHTI, and Fv/Fm values. (A) Graphs between the salt sensitive vs. salt tolerant; (B) graphs between drought sensitive and drought tolerant genotypes. Here, ***—p-value-0.001, ****—p-value-0.0002.
Agriculture 14 01337 g002
Figure 3. Heat map data analysis of 61 mung bean genotypes for sensitive and tolerant genotypes. This heat map was made by measuring RWC, PHTI, and Fv/Fm parameters for (A) salt and (B) drought stress to identify the most sensitive and most tolerant genotype among all 61 genotypes.
Agriculture 14 01337 g003
Figure 4. Principal component analysis of 61 mung bean genotypes. This PCA plot depicts the characterization of genotypes under salt stress. Here red dot corresponds to a named genotype.
Agriculture 14 01337 g004
Figure 5. Principal component analysis of 61 mung bean genotypes. This PCA plot depicts the characterization of genotypes under drought stress. Here, red dot corresponds to a named genotype.
Agriculture 14 01337 g005
Figure 6. Biochemical and antioxidative analysis for salt stress between sensitive and tolerant genotypes. The comparison graphs of MDA, H2O2, Proline, CAT, GPX, GR, APX, SOD, MDHAR, and DHAR, respectively. Here, *—p-value-0.01, **—p-value-0.001, ***—p-value-0.0002, ****—p-value < 0.00001.
Agriculture 14 01337 g006
Figure 7. Biochemical and antioxidative analysis for drought stress between sensitive and tolerant genotypes. The comparison graphs of MDA, H2O2, Proline, CAT, GPX, GR, APX, SOD, and MDHAR, respectively. Here, **—p-value-0.001, ***—p-value-0.0002, ****—p-value < 0.00001.
Agriculture 14 01337 g007
Figure 8. The loss of plasma membrane during stress was depicted by Evan’s blue staining.
Agriculture 14 01337 g008
Figure 9. A scenario of a correlation study conducted in salt conditions using different biochemical assays. (A) In this instance, the circle’s size and color proportionately correspond to correlation coefficients; (B) we can analyze the correlation between each of the pairwise combinations of distinct variables in this image.
Agriculture 14 01337 g009aAgriculture 14 01337 g009b
Figure 10. A scenario of a correlation study conducted in drought conditions using different biochemical assays. (A) Drought; (B) salt. In this instance, the circle’s size and color proportionately correspond to correlation coefficients, and we can analyze the correlation between each of the pairwise combinations of distinct variables in this image.
Agriculture 14 01337 g010aAgriculture 14 01337 g010b
Disclaimer/Publisher’s Note: The statements, opinions and data contained in all publications are solely those of the individual author(s) and contributor(s) and not of MDPI and/or the editor(s). MDPI and/or the editor(s) disclaim responsibility for any injury to people or property resulting from any ideas, methods, instructions or products referred to in the content.

