Article

Modelling Soil Moisture Content with Hydrus 2D in a Continental Climate for Effective Maize Irrigation Planning

Institute of Water and Environmental Management, Faculty of Agricultural and Food Sciences and Environmental Management, University of Debrecen, 138 Böszörményi Str., 4032 Debrecen, Hungary
*
Author to whom correspondence should be addressed.
Agriculture 2024, 14(8), 1340; https://doi.org/10.3390/agriculture14081340
Submission received: 26 June 2024 / Revised: 30 July 2024 / Accepted: 5 August 2024 / Published: 10 August 2024
(This article belongs to the Section Agricultural Water Management)

Abstract

:
In light of climate change and limited water resources, optimizing water usage in agriculture is crucial. This study models water productivity to help regional planners address these challenges. We integrate CROPWAT-based reference evapotranspiration (ETo) with Sentinel 2 data to calculate daily evapotranspiration and water needs for maize using soil and climate data from 2021 to 2023. The HYDRUS model predicted volumetric soil moisture content, validated against observed data. A 2D hydrodynamic model within HYDRUS simulated temporal and spatial variations in soil water distribution for maize at a non-irrigated site in Hungary. The model used soil physical properties and crop evapotranspiration rates as inputs, covering crop development stages from planting to harvest. The model showed good performance, with R² values of 0.65 (10 cm) and 0.81 (60 cm) in 2021, 0.51 (10 cm) and 0.50 (60 cm) in 2022, and 0.38 (10 cm) and 0.72 (60 cm) in 2023. RMSE and NRMSE values indicated reliability. The model revealed water deficits and proposed optimal irrigation schedules to maintain soil moisture between 32.2 and 17.51 V/V%. This integrated approach offers a reliable tool for monitoring soil moisture and developing efficient irrigation systems, aiding maize production’s adaptation to climate change.

1. Introduction

Research projections emphasize the pressing need for agricultural producers to align with the escalating demands of the global feed, food, and fiber markets, driven by a projected population increase by 2050 [1,2]. In recent years, notably in 2022, Europe experienced a historic drought coupled with successive heatwaves [3], significantly hampering maize growth during critical summer stages. The Combined Drought Indicator (CDI) analysis incorporates data from the initial ten days of August 2022 and August 2023, while at the midpoint of the month, the SPI-3 is calculated from a 3-month accumulation period; both underscore the severity of the situation, with 47% of Europe under warning conditions and 17% in alert conditions [4]. Both soil moisture and vegetation experienced considerable stress [5]. The prevalence of drought hazards is notably escalating, particularly affecting regions such as Luxembourg, Spain, Italy, the United Kingdom, Ukraine, France, Hungary, Germany, Portugal, Romania, Moldova, Belgium, Ireland, the Netherlands, and Northern Serbia. Noteworthy, precipitation anomalies in the three-month period leading up to August 10, 2022, have most significantly impacted southern Germany, Spain, central Italy, Switzerland, central and southern Portugal, southern France, extensive areas across Ukraine, Moldova, Hungary, Slovakia, Romania, and significant portions of the western Balkans [4]. Amid global warming, a growing global population, and concerns about water quality, the imperative to enhance irrigation water use and land utilization becomes even more critical [6]. To meet the increasing water demands and tackle the effects of climate change, optimizing water use or utilizing water more efficiently has been identified as a critical strategy [7,8]. A crucial tool for climate adaptation is the advancement of precision agriculture, which includes the development of sophisticated irrigation systems and the implementation of advanced monitoring and sensing technologies [9]. However, challenges arise in regions where freshwater resources are already fully or over-allocated in water basins, rendering the expansion of irrigated agricultural lands unfeasible [10].
In Hungary, characterized by variable precipitation with an annual mean of 600–800 mm, which constitutes approximately 60–80% of the global mean rainfall, addressing water challenges is paramount [11]. Rainfall, unevenly distributed over six months, affects rainfed maize agriculture significantly [12]. Although irrigated areas accounted for only 2% of Hungarian agricultural land in 2019, this figure is anticipated to rise significantly [13]. Despite irrigated agriculture utilizing around 12% of Hungary’s freshwater resources in 2017 [14], the pivotal role of the water sector in economic growth and energy production remains indisputable. Therefore, advanced integrated water management models are needed to foster sustainable water use in agriculture [15]. Consequently, there is an urgent requirement for efficient irrigation practices that enhance crop yield and quality, optimize water use efficiency, and safeguard freshwater resources [16]. Maize, sunflower, and wheat cultivation dominate approximately 60% of the country’s agricultural land, as per the annual reports of the Hungarian Central Statistics Office. Recognizing the water productivity of winter wheat, sunflower, and maize is pivotal for the sustained cultivation and intensification of field crops. Projections indicate the likelihood of prolonged periods of significantly below-average precipitation in the future, coupled with expectations of more substantial rainfall patterns [17]. Consequently, ensuring accurate and current agricultural acreage information, employing spatial analysis, and implementing precision irrigation practices are imperative for securing the region’s future food and energy resources.
The focus on modeling the soil water balance to plan irrigation for optimized water use aims to guide the timing and quantity of supplementary water supply to meet crop water demands while minimizing losses and preserving freshwater reserves [18]. Adopting best management practices involves scheduling irrigations based on real-time soil water content data [19]. Detailed adherence to sustainable irrigation management principles, encompassing soil water monitoring technology, irrigation efficiency, automation, machinery design, and land use management, becomes paramount for farmers [20]. Therefore, for precision irrigation a complex monitoring of soil water balance is required, and there are soil moisture, plant-based, and water balance calculations aiming to facilitate more appropriate irrigation [21].
There are several methods available for determining soil water resources and plant water requirements in agricultural and irrigation management. Soil moisture sensors, including types like gypsum blocks, tensiometers, capacitance sensors, and time domain reflectometry (TDR) sensors, measure real-time or near-real-time soil moisture levels [22]. These sensors aid in determining soil water content and optimizing irrigation scheduling [23]. Plant-based methods that monitor plant water status using parameters like leaf water potential, stomatal conductance, and growth parameters help assess plant water stress and requirements, enabling optimized irrigation scheduling [24], while issues arise in establishing benchmark or threshold values [25]. Despite the effectiveness of these methods, challenges such as cost, calibration, and spatial variability limit their widespread deployment [26].
There are soil water balance methods for calculating water inputs (e.g., precipitation, irrigation) and outputs (e.g., evapotranspiration, percolation, and runoff) in a field or crop over a specific period. The authors in [27] allude to monitoring these inputs and outputs to estimate soil water resources and crop water requirements. Crop evapotranspiration (ETc) measurement uses combined water loss through soil surface evaporation and plant transpiration, which is crucial for determining plant water needs. Methods like lysimeters, the Bowen ratio, eddy covariance, and crop coefficient utilize meteorological parameters to measure ETc [28]. Notably, their limited deployment is because they are expensive to install and maintain, require frequent calibration, may not capture small-scale variability in ETc, and may not account for factors such as soil moisture variability and management practices [29,30,31]. Crop water use models that utilize mathematical models like FAO Penman–Monteith in CropWat, and Soil and Water Assessment Tool (SWAT) estimate crop water requirements based on crop type, growth stage, and environmental conditions, utilizing crop characteristics, meteorological data, and soil data. Despite limitations such as parametrization, input variable sensitivity, and validation requirements, the Penman–Monteith method remains one of the most robust and widely accepted approaches for estimating reference evapotranspiration [32,33,34]. The crop coefficient approach commonly relies on FAO guidelines for Kc values [35]. However, these guidelines overlook spatial and temporal variability in evapotranspiration estimation. Recent research suggests using NDVI to derive Kc (crop coefficient) values, offering a more tailored approach to crop growth stages and conditions [36,37].
As per the findings in [38], this approach effectively simulates irrigation needs. Remote sensing technologies play an important role in calculating agricultural water requirements by providing vital data on different vegetation health and environmental characteristics [39,40]. Detecting accurate soil moisture using these advanced technologies depends on calibrated spectral data [41]. Field observations can be combined with other methods, such as soil moisture sensors or crop water use models, to improve the accuracy of water management decisions [42].
This study aimed to set a model to simulate soil moisture content by integrating Penman–Monteith reference crop evapotranspiration (ET0) (using CROPWAT) with Sentinel 2 data to calculate ETc and use it as an input for soil moisture modeling based on soil and climate data from 2021 to 2023. The HYDRUS software was used to set up a model to simulate soil moisture content in the study area, validating results against observed soil moisture data. The results could serve as a good practice on how to develop an accurate soil moisture estimation model for maize in a continental climate. The integration of these methodologies aims to make a simultaneous contribution to the long-term adaptation of maize production to climate change. By providing spatio-temporal data, this approach offers a solution to alleviate maize water stress through the design and implementation of an efficient irrigation system.

2. Materials and Methods

2.1. Description of the Study Area

The selected study period spans from 2021 to 2023, capturing a timeframe that allows for a comprehensive understanding of the agricultural dynamics and environmental conditions in this vital area of the Carpathian Basin. The research data were gathered from the central lowland area of the Carpathian Basin, specifically in Békés County, within the southeastern part of Kondoros village. This region, situated in the Pannonian region, is characterized by a predominantly flat landscape with fertile plains that are well-suited for agriculture. The presence of the Tisza River, one of central Europe’s largest transboundary rivers, traversing through the region contributes to the overall fertility of the soil [43].
The study area, illustrated in Figure 1, encompasses arable land spanning 13.11 hectares. Positioned within the expansive lowlands of the Tisza River catchment, the GPS coordinates pinpoint the location (Kondoros) at N 46°44′491″, E 20°48′674″. Elevations in the study area vary from 82 to 85 m. This watershed holds paramount significance in the Carpathian Basin and central Eastern Europe for maize production [44].
The climatic conditions in the South Kondoros Tisza catchment’s lowlands play a crucial role in influencing crop growth and development. As reported by [17], the mean annual global radiation is 4430 MJ m2 per year onto the surface, accompanied by a 3-year mean photoperiod of 1847 h, with 810 h in summer and 175–180 h in winter. The 3-year mean minimum–maximum air temperature range during the vegetative period (April–September) is 13–28 °C. The specific minimum air temperatures in April and May were recorded at 1.2 °C and 1.5 °C, respectively. The winter duration is generally the period of December–February whereas summer commences from June until August.
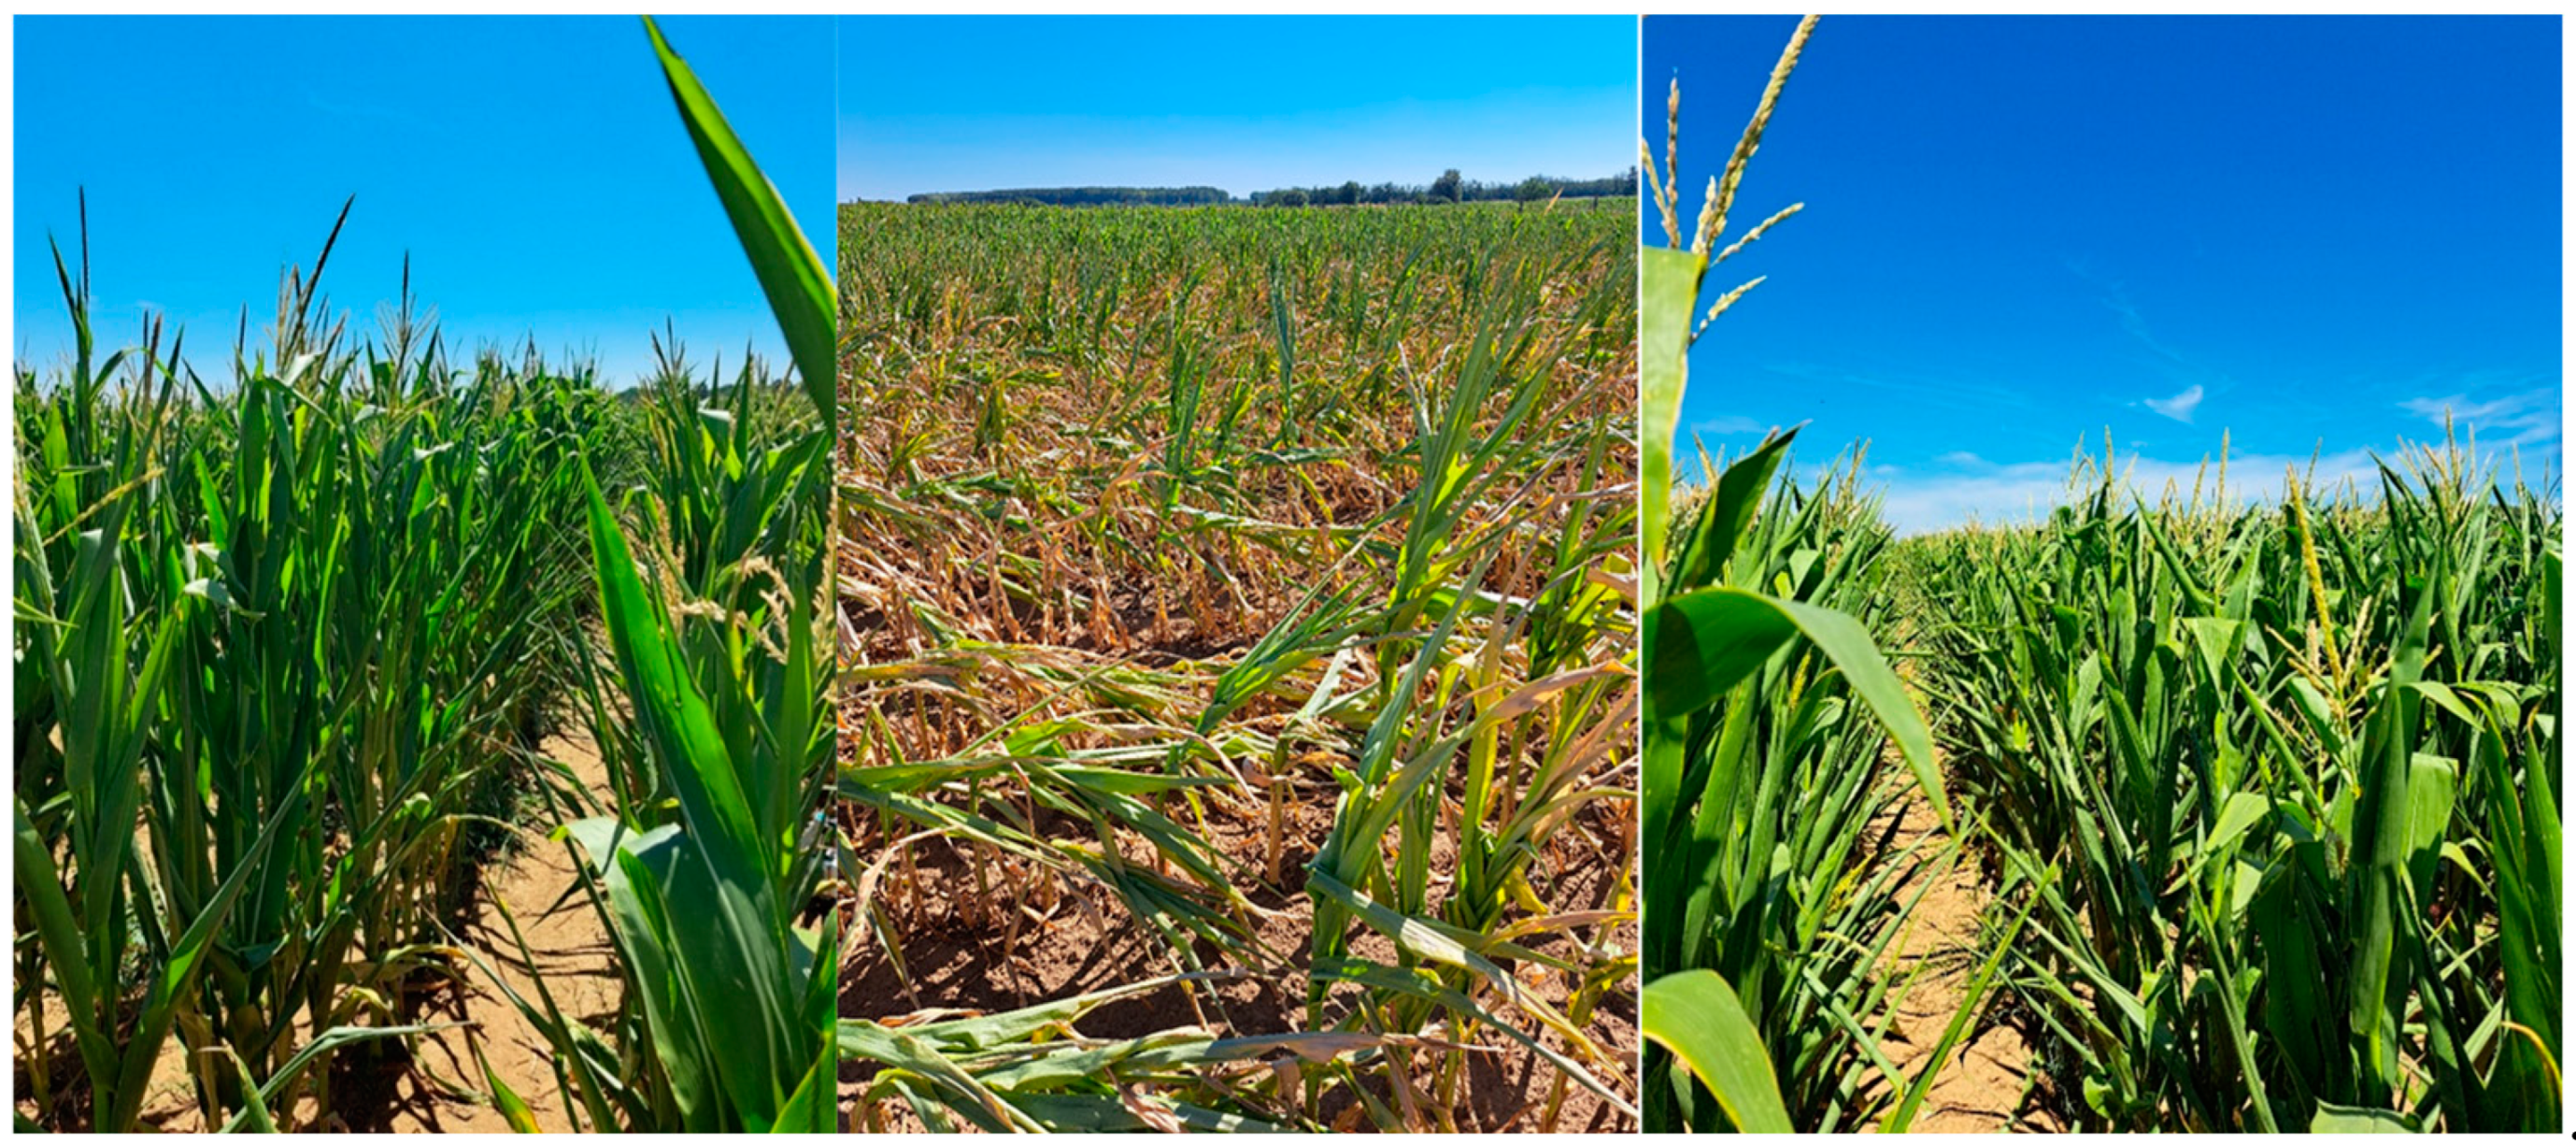
The region experiences predominantly northeastern winds with an average speed of 260 km per day. Despite being characterized by a continental climate and an average annual precipitation of 495 mm, with approximately 186.10 mm in the vegetative season (from mid-April to the end of September), the location faces challenging weather conditions such as droughts, floods, and agricultural excess water. Interestingly, both excess inland water and agricultural drought can occur simultaneously, creating significant challenges for crop cultivation. The climate of Kondoros is typified by a continental type, featuring harsh winters and a hot, semi-arid climate, particularly in July and August, according to [45]. In 2022, Hungary transitioned into a net importer of crops due to the drought situation reported in 2022 [46]. For instance, maize production fell short of 2.4 million tons compared to the average range of 6.5–9.3 million tons [47]. By August 2022, maize fields had desiccated completely, leading to only silage-based production, yielding 23 bales per 2.2 hectares on loamy sand soil [48]. The arable lands lacking irrigation witnessed a substantial decrease in soil moisture content in the top layer (0–20 cm) of 14–22% by August, destroying maize (see Figure 2) and sunflower crops on fertile loamy and chernozem soils. Conversely, in January, the soil moisture content soared to 100% in the top (0–20 cm) and deeper (50–100 cm) layers, leading to a surface water surplus in certain catchment zones [49].

2.2. Soil Data

Soil texture terminology was categorized according to the International Union of Soil Sciences as clay loam [50]. Soil moisture and temperature were measured at 10 and 60 cm depths using a HydraProbe SD1–12 Pro sensor. Key abiotic parameters such as sand, silt, and clay in percentage content were tested using the hydrometer method [51]. With soil humus (% m/m) assessed by the Walkley–Black method [52], soil pH (H2O) was measured using the guidelines of [53]. Soil CaCO3 (% m/m) was measured by the method of [54], soil bulk density (g/cm3) was measured using the core sampling method [55], and soil moisture (w% = grav. %) by the gravimetric method [56]. The site contains lowland chernozem soil, which is one of the most suitable soils for maize cultivation. With a consistently effective tillage depth of 0.75 m, effective internal drainage is indicated by the predominant sand content as well as preferable morphological characteristics such as a humus content between 3.4 and 3.9% (Table 1). Table 1 also indicates adequate and balanced quantities of plant nutrients and chemical properties, such as CaCO3 with a mean of 5% m/m. The soil pH ranged from 7.4 to 8.15, which is ideal for growing maize [57].

2.3. Crop Data

Throughout this period, the preceding crops in the field included maize, winter wheat, triticale, and sunflower. The current agricultural production on the field is rainfed. As indicated in Table 2, plowing was conducted in the autumn after the conclusion of the previous cropping season, followed by tillage and harrowing in preparation for seeding maize in early- to mid-April. The sowing date for the crop differed between years due to crop rotation and meteorological conditions. In 2021, the sowing date was in the first week of April. In 2022, sowing started in the last week of March, due to the ongoing drought and foreseen drought summer period. In 2023, it was in the third week of April. On the other hand, the soil moisture data for reference were available from 25 April of each year; therefore, the simulations and the ETc and Kc identification started at that date.
Maize seeds were sown at a depth of 16 cm to 18 cm in rows with a spacing of 75 cm, resulting in a planting density of 72,000 to 87,000 plants per hectare. This was achieved using either a 4-row or 6-row planter. Standard fungicides were applied to cover the maize seeds. Over the 3-year study period, planting or sowing commenced on 25 April, and harvest occurred on 27 August. The maize seed hybrid utilized was Pioneer P9241, classified under FAO 340, known for its drought tolerance, and yielding a consistent 5.14 tons per hectare during 2021 and 2023.

2.4. Meteorological Data

The 2021–2023 climate data were downloaded from the National Hungarian Meteorological Service (https://odp.met.hu/climate/station_data_series/ accessed on 15 January 2024) and Drought Monitoring Services [58]. The Kétsoprony weather station is located 9 km from the study site. The parameters of interest include daily precipitation, daily temperature (min, max, mean), daily relative humidity (RH) %, daily windspeed, daily sunshine hours, and daily evapotranspiration rates.
Crop evapotranspiration (ETc) was calculated by applying daily ETo as in Equation (1) and the crop coefficient (Kc) readings, as described in Equation (2).
E T 0 = 0.408 Δ R n G + γ 900 T + 273 u 2 e s e a Δ + γ 1 + 0.34 u 2
where,
  • ET0—reference evapotranspiration [mm day−1],
  • Rn—net radiation at the crop surface [MJ m−2 day−1],
  • G—soil heat flux density [MJ m−2 day−1],
  • T—mean daily air temperature at 2 m height [°C],
  • U2—wind speed at 2 m height [m s−1],
  • es—saturation vapor pressure [kPa],
  • ea—actual vapor pressure [kPa],
  • esea—saturation vapor pressure deficit [kPa],
  • D—slope vapor pressure curve [kPa °C−1],
  • g—psychrometric constant [kPa °C−1].
ETc = Kc × ETo
The FAO Penman–Monteith method was used to compute the daily ET0 [59] in CROPWAT. The equation and methodology depict the evapotranspiration of a hypothetical grass surface that is well-watered. ET0 in mm/day was calculated by Equation (1). The duration of phenological stages for the study years was determined through in situ phenological observations sourced from the Biologische Bundesanstalt, Bundessortenamt und Chemische Industrie (BBCH) [60], complemented by satellite-based aerial normalized difference vegetation index (NDVI) data from Sentinel 2. The Sentinel 2 Top-of-Atmosphere (TOA) dataset, which has a high temporal resolution of 5 days and a spatial resolution of 10 m, was used. To establish Kc values for different phenological phases, a remote sensing approach was employed, specifically the NDVI-Kc regression technique. This technique considers local conditions and site-specific circumstances, ensuring a tailored and precise determination of crop coefficients [61].
Sentinel 2 imagery spanning from 25 April to 27 August for the years 2021, 2022, and 2023 was selected for analysis. Given that this imagery is derived from the top of the Earth’s atmosphere and is not corrected for atmospheric effects such as scattering and absorption, a cloud-free day approach was employed to eliminate cloud cover. Subsequently, a 10-day time series was utilized, and both linear and polynomial interpolation was applied to the NDVI data to derive daily crop coefficients (Kc) [62,63,64]. The daily Kc values obtained were then incorporated as input data into the HYDRUS model.

2.5. HYDRUS Modeling Environment

2.5.1. Description of the Model

Several studies used HYDRUS 2D to simulate soil moisture in agricultural fields [64,65,66] Utilizing physically based models offers a valuable approach to enhancing water management efficiency, conserving water resources, and mitigating the potential risks associated with water percolation and leaching. In this study, the Hydrus 2D program (Version 2.x) developed by [65] was employed. This software facilitated the simulation of two-dimensional lateral isothermal variably saturated flow at the experimental site, specifically within a rainfed agricultural system. The simulation assumed a uniform distribution and delved into the dynamics of soil–water–root interactions.
Richard’s equation stands as a cornerstone in hydrogeology and soil physics, offering a fundamental framework for understanding the intricate dynamics of water flow in unsaturated soils. This partial differential equation serves as a key tool in these fields, providing a comprehensive description of water movement. HYDRUS, a significant software program in this domain, adeptly utilizes Richard’s equation to process data [67] The equation itself, denoted as Equation (3), accurately captures the temporal and spatial variations in soil water content. Through this mathematical representation, researchers and practitioners gain valuable insights into the nuanced interplay between water, soil, and time. Richard’s equation, as harnessed by HYDRUS, thus emerges as a pivotal element in advancing our comprehension of unsaturated soil hydrodynamics [68]
t θ = x i k i j h x j + k 33 h x 3 + s
where:
  • θ is the volumetric water content of the soil (fraction of soil volume occupied by water) [-]
  • t is time [s],
  • K is the hydraulic conductivity of the soil [mm s−1],
  • S represents sources/sinks of water in the soil term due to the water uptake of plants, rainfall, or geochemical reaction [s−1],
  • Kij(h) is the anisotropic hydrological conductivity tensor [m s−1],
  • xi is the Cartesian coordinate [m].

2.5.2. Model Parameters

The HYDRUS 2D model exhibits a modular design, comprising distinct components tailored for specific functions. The preprocessing phase serves as the foundation, allowing users to establish fundamental parameters. Subsequently, the execution area takes center stage, facilitating iterative modeling of soil water transport. Finally, the postprocessing component is dedicated to presenting comprehensive run results and insightful process information (Figure 3). For the modeling of soil water content, a rectangular transport domain was created in a 2D vertical plain with a length of 10 m and a depth of 2 m. The presented model considers a source term of water, such as precipitation or irrigation, for the top (atmospheric) boundary of the domain that represents the soil surface. Furthermore, a free drainage boundary was applied at the bottom, while no flux boundary was considered on both sides. The simulation domain was discretized, with 231 nodes corresponding to 400 triangular elements. The modeling time period was 125 days for each studied vegetation period, elapsed from the sowing to the harvesting of maize; thus, the number of time-variable boundary records is 125 in each case, accordingly [65,67]. The initial time step, the minimum time step, and the maximum time step were set up to 10–3 days, 10–6 days, and 1 day, respectively.
Noteworthy is the sequential build-up of the model, a deliberate approach employed to systematically configure model parameters. This sequential process allows for the gradual refinement of the model’s setup, enabling dynamic adjustments to future parameter options in response to variations in settings.
The illustrated model incorporates a comprehensive consideration of water supply terms, including precipitation (P) and irrigation (I), acting on the domain’s top boundary (atmospheric). Additionally, it accounts for a deep drainage boundary and a capillary fringe at the bottom. The transport domain spans 65 m in length (x) and 18 m in breadth (y), covering an extensive area of 1170 m2, with a depth (z) of 2 m.
The hydraulic characteristics crucial to the model encompass hydraulic conductivity (k), water retention (Ψm), bulk density (ρB), particle density (ρρ), particle size distribution (PSD), and porosity (θP), as detailed in Table 4. In the initial stages of postprocessing, a validation method was applied to assess the simulated soil water content. This validation involved comparing the model’s predictions with data obtained from a reference soil moisture probe at depths of 10 cm and 60 cm, utilizing information collected by the weather station.
The model not only predicts water flows across borders but also considers root water uptake. The study focused on adjusting soil parameters (Table 3) using the HYDRUS water flow module as part of the preprocessing. The fluctuation in soil water content (SWC), was modeled while some soil parameters were estimated, either through optimization algorithms or during model calibration processes.

2.5.3. Boundaries and Domain Discretization

The initial water content was computed based on measurements obtained from the on-site weather station (Table 3). An atmospheric continuum was applied at the upper boundary of the transport domain, reflecting atmospheric conditions. At the bottom, a free drainage condition was incorporated, aligning with the groundwater level situated at 14 m [69]. This integration of data from a distant well emphasizes the model’s capacity to incorporate broader environmental influences, enhancing the accuracy and reliability of the simulated water dynamics within the transport domain.

2.5.4. Developing the Model

Once the 2D general shape was selected, the initiation of primary processes governing water movement and root water uptake commenced. It is noteworthy that, in the current model scenario, the solute transport module remained inactive, with the solute concentration assumed to be 0.
The modeling duration spanned 125 days for each of the three analyzed years, covering the period from maize planting to harvesting. This timeframe resulted in 125 sets of time-variable boundary data. While considering various approaches, the van Genuchten–Mualem soil-hydraulic model (Equation (4)), assuming zero hysteresis, was selected to characterize the shape of the water retention curves [70]. This theoretical equation describes the relationship between capillary pressure, water content, and hydraulic conductivity in unsaturated soil.
θ h = θ r + θ s θ r 1 + α h n 1 1 n
where,
  • θ(h) is the volumetric water content at soil suction pressure h [L3L−3],
  • θr is the residual volumetric water content [L3L−3]
  • θs is the saturated volumetric water content, [L3L−3],
  • α is a fitting parameter related to the inverse of the air entry suction, α > 0, [L−1] /cm−3
  • n is a dimensionless empirical fitting parameter, n > 1 [-]
For modeling, those soil hydraulic parameters were used, which were measured from samples directly sampled from the soil moisture sensor. In one set of simulations, the soil hydraulic parameters were obtained using the Rosetta model [71], which is included in the HYDRUS program. Rosetta is a pedotransfer function software program that predicts hydraulic parameters with a neural network model (Table 4). The inputs for Rosetta were hydraulic conductivity, bulk density, porosity, and soil texture data.
Table 4. The mean inputs and outcomes of key soil physical properties employed within the built-in module of HYDRUS software, specifically the Rosetta Lite v1.1. module.
Soil Physical
Properties
/
Depth
Measured Hydraulic Conductivity,
k [m·s−1]
Measured
Bulk Density,
ρB [g·cm−3]
Measured Porosity,
θP [V/V%]
Field Capacity,
θFC [V/V%]
USDA Soil Classification Based on the PSD Analysis
Sand,
[m/m%]
Silt,
[m/m%]
Clay,
[m/m%]
Average of 0–60 cm0.42721.347.3832.2372934
The HYDRUS software incorporates a diverse database of crop types to facilitate the simulation of root water uptake. Within this predefined database, maize (referencing Wesseling, 1991, and Assouline, 2002) [72,73] was specifically chosen. Table 5 presents the parameter values utilized in the calculation of root water uptake (RWU) using the model by Feddes (1978) [74].

2.5.5. Validation of the HYDRUS 2D Model

To calibrate and validate the HYDRUS 2D model, the daily measured soil water content (SWC) data from April 25th to April 27th for the years 2021, 2022, and 2023 were employed. For model validation and calibration using the Hydrus software, several key parameters were adjusted. These parameters included soil hydraulic properties such as the saturated hydraulic conductivity (Ks), the soil water retention curve parameters (e.g., alpha and n in the van Genuchten model), and the saturated water content (θs). Calibration was performed based on the daily soil moisture data of each year, excluding every third day’s data, which were used for the validation of the model. Recognizing the substantial variability in soil water content across depths (10 cm and 60 cm), as highlighted by [78], two observation nodes (10 cm and 60 cm) were strategically incorporated into the domain.
A comparative analysis was conducted to analyze model-simulated SWC values and the corresponding measured values. This process ensures that the model not only captures the temporal dynamics of soil water content but also aligns closely with actual field observations across multiple depths. The inclusion of observation nodes at various depths enhances the granularity of the calibration and validation process, allowing for a more comprehensive assessment of the model’s performance under different soil conditions and depths.
Pearson’s coefficient of determination, often referred to as R-squared (R2), was used as a statistical metric to quantify the proportion of the regression model’s variation in soil moisture that is predicted from measured soil moisture. Climatic parameters for the soil moisture prediction models were established by utilizing crop evapotranspiration (ETc) values and measured precipitation data for the specified study periods. Daily ETc data were used as an input parameter in HYDRUS since there were no separate data for evaporation and transpiration. On the other hand, [79] measured the ratio E and ETc separately for phenological stages of maize in cases of similar growing (soil and climatic) conditions; therefore, transpiration and evaporation were separated in accordance with their study in HYDRUS. To ensure a more accurate alignment of the regression model with the daily soil moisture data, it is necessary to examine if the model fits better [80]. The Root Mean Square Error (RMSE) offers an indication of how effectively the predictive HYDRUS model can approximate measured soil moisture values, while the mean bias error (MBE) indicates whether the model tends to overestimate or underestimate the measured soil moisture values.
The mean absolute error (MAE) computes an average of the absolute errors, offering a simple measure of how distant the forecasts are, on average, from the captured soil moisture values. When compared to the Root Mean Square Error (RMSE), MAE is less susceptible to outliers, making it a more robust measure of accuracy [81]. On the other hand, the mean square error (MSE) metric was used to assess the model’s performance. Lastly, we utilized the Normalized Root Mean Square Error (NRMSE) which is a normalized measure of the model’s accuracy. A lower NRMSE value typically indicates better model performance, with 0 representing a perfect match between predictions and observations [82].

3. Results

3.1. Meteriological Conditions

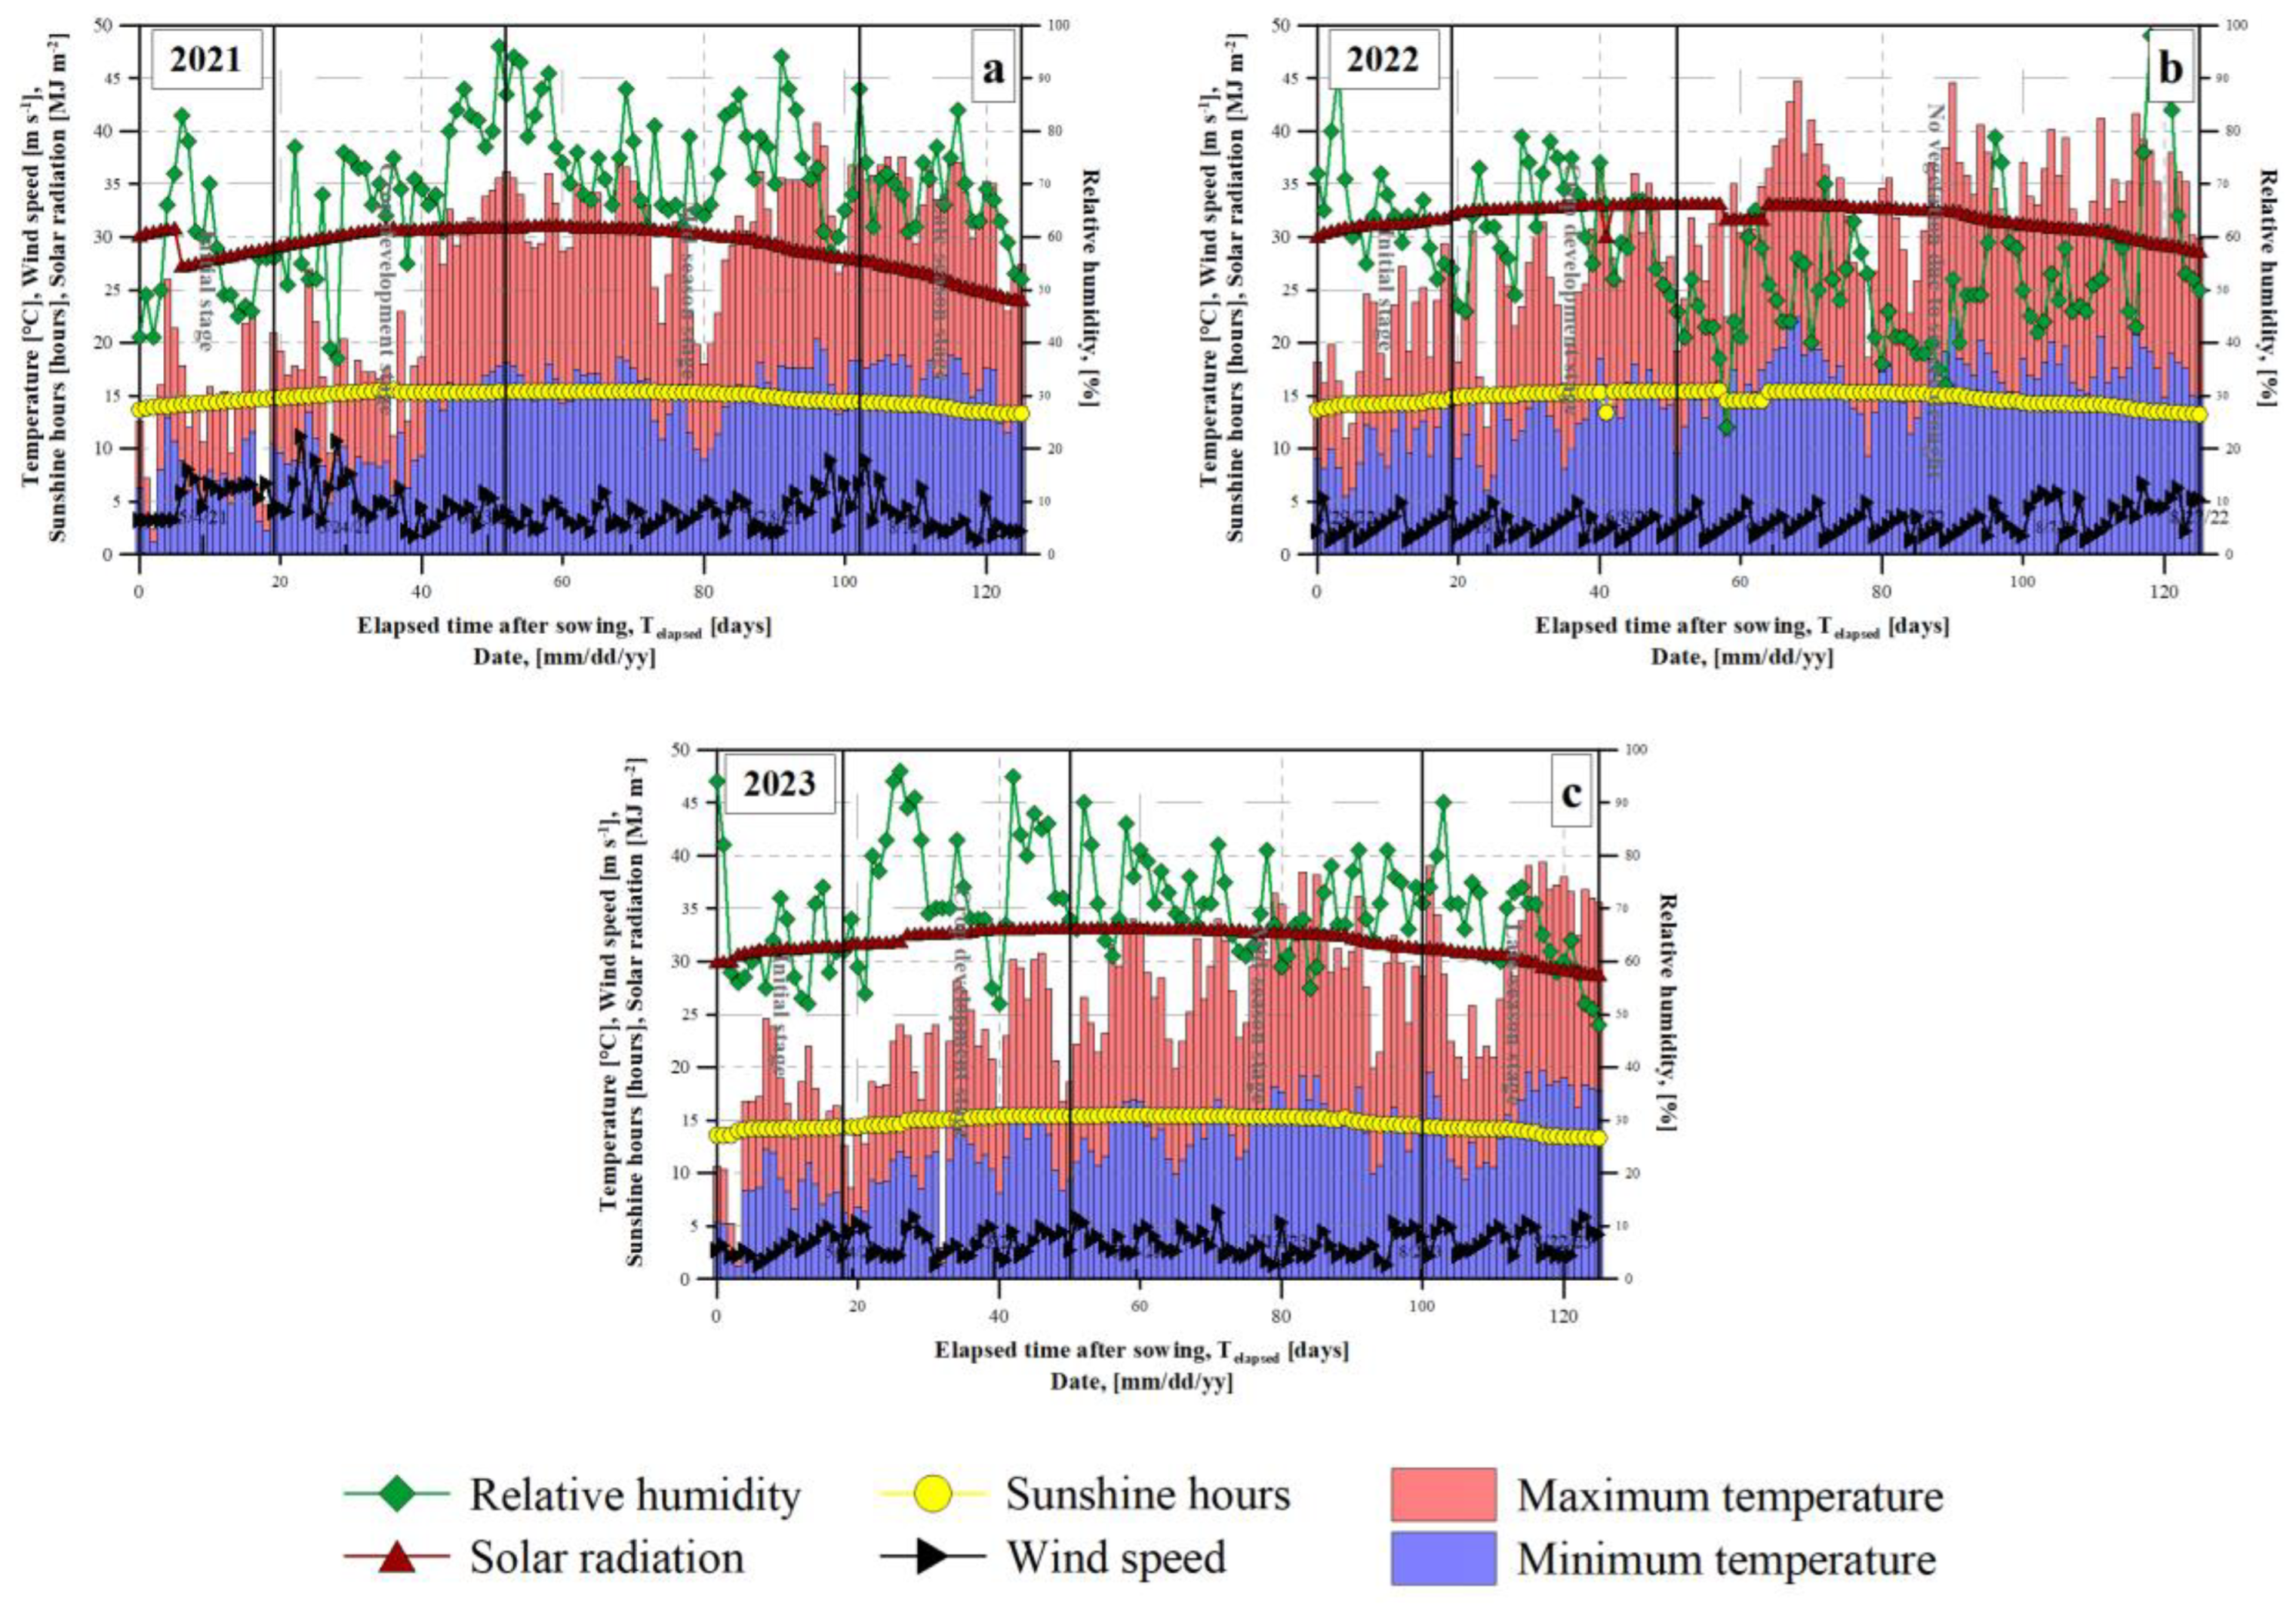
The meteorological data relevant to maize production reveal a diverse range of climatic conditions over the study period (Figure 4). The minimum temperature ranged from 1.2 °C to 22.4 °C, with a mean of 13.66 °C, while the maximum temperature varied from 12.2 °C to 38.9 °C, averaging 26.32 °C. These temperature ranges are critical for understanding the growing conditions for maize, as both extreme low and high temperatures can impact crop development. Humidity levels fluctuated significantly, with values between 24% and 98% and an average of 65.4%. This variability in humidity can affect the incidence of pests and diseases, as well as the overall health and yield of maize crops. Wind speeds showed a broad range from 1.34 to 11.67 m/s, with a mean value of 3.08 m/s, indicating varying degrees of wind stress on maize plants, which can influence pollination and plant stability. In terms of sunlight exposure, the dataset showed sun hours ranging from 13.3 to 15.56 h per day, with an average of 14.78 h. Adequate sunlight is essential for photosynthesis and crop growth, making this a critical factor for maize production. Radiation levels, with a mean of 31.08 MJm−2 and a range from 24.2 to 33.2 MJm−2, further contribute to understanding the energy available for maize growth. The moderate standard deviation in sun hours and radiation suggests consistent sunlight and radiation exposure, which is beneficial for stable maize production. Overall, these meteorological parameters provide a comprehensive picture of the environmental conditions influencing maize growth, helping to identify optimal growing conditions and potential stress factors that could impact crop yield and quality.

3.2. Maize Biomass and Crop Evapotranspiration (ETc)

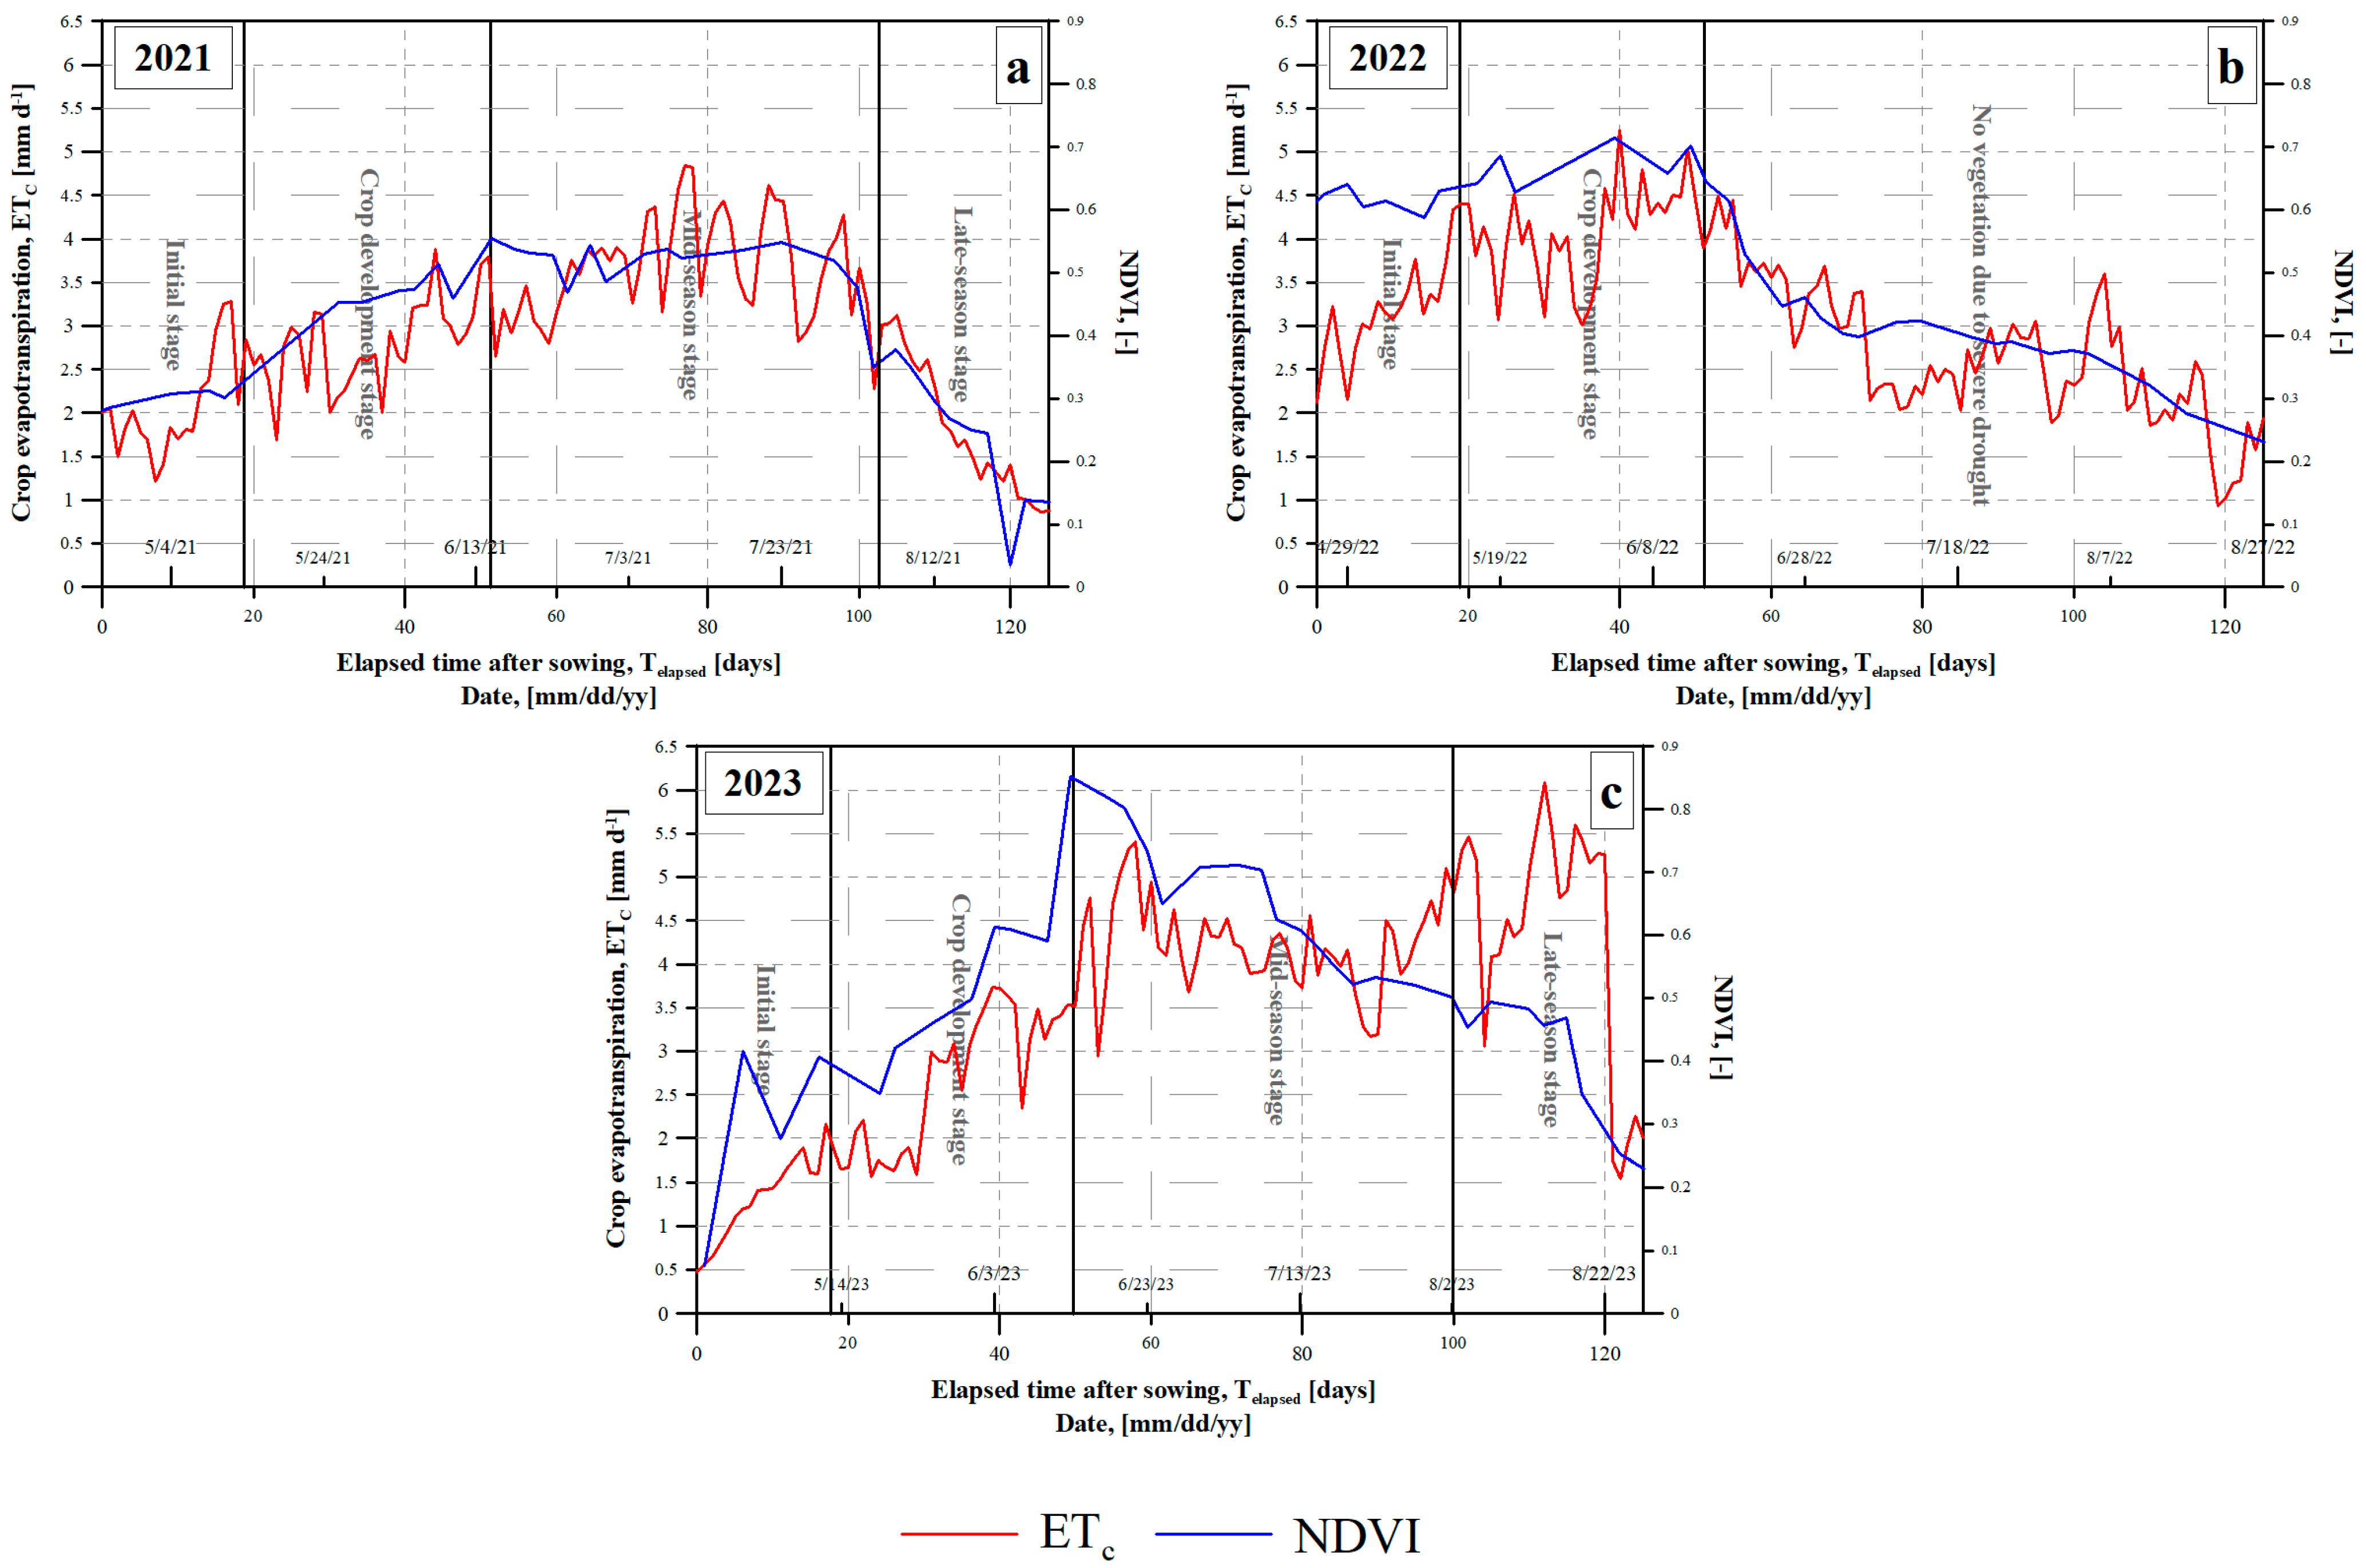
ET0 values generally increase from late April to early August, reflecting the rise in potential evapotranspiration as temperatures increase during the spring and summer months (Figure 5). The highest ET0 values of 7.96 mm/day in 2021, 10.54 mm/day in 2022, and 9.37 mm/day in 2023 were observed in early August, indicating the period of maximum potential evaporation during the summer. In 2021, the mean ET0 was 5.49 mm/day and the standard deviation was 0.90 mm/day. In 2022, the mean ET0 was 6.61 mm/day and the standard deviation was 0.12 mm/day, whereas in 2023 it was 5.69 mm/day and 0.1 mm/day, respectively. Differences in sowing dates and the timing of data collection can lead to variations in NDVI values at the start of observations. Therefore, the highest NDVI at the start of the experiment was around 0.6 in 2022. This high value was also due to the presence of weeds. From June 3 to July 23, the NDVI values peak, indicating maximum vegetation density and health. This certainly corresponds to the peak of the growing season, when the maize vegetation is lush and actively photosynthesizing. In 2022, the NDVI values start to decline gradually from June 13 to 27 August, indicating a reduction in vegetation density possibly due to factors such as drought or other environmental pressures.
During these critical stages, the ETc values reach their peak, registering at 4.84 mm/day, 5.25 mm/day, and 6.08 mm/day for the respective years. This observation underscores a notable surge in water consumption by the maize crop during this specific timeframe.

3.3. HYDRUS 2D Model Performance

A strong correlation (R2 = 0.65 and 0.85) was observed between the calculated and measured soil moisture content at a depth of 10 and 60 cm, respectively, over the examined 2021 period (see Table 6). In 2022 (R2 = 0.51 and 0.50 at respective depths), a moderate correlation in the first two phenological stages of maize full development was hindered by severe drought. A medium correlation (R2 = 0.71 and 0.38) was observed in 2023 between the calculated and measured soil moisture content at a depth of 10 and 60 cm, respectively.
Various metrics, including RMSE, NRMSE, MAE (absolute), and MBE (relative deviation in percentage), were computed to assess the disparities between modeled and observed moisture data according to Eqations (5)–(10). The seasonal accuracy of the model stood at 2.47 V/V% (11.232%) in 2021 at 10 cm and 1.73 V/V% (5.72%) at 60 cm in 2021, 4.37 V/V% (20.34%) in 2022 at 10 cm and 5.16 V/V% (19.08%) in 2022 at 60 cm, and lastly, 3.59 V/V% (13.95%) in 2023 at 10 cm and 1.91 V/V% (6.73%) in 2023 at 60 cm. The statistical metrics displayed fluctuations between 1.30 and 3.31 V/V% (1.69–10.97%) across phenological stages at the two depths, as determined by RMSE and MSE in 2021. With 0.95–3.96 V/V% (0.9%–4.44%) in 2022 and 1.50–12.36 V/V% (2.12–29.1%) in 2023 across phenological stages at both soil depths.
R 2 = 1 k = 1 n y k y ¯ k 2 k = 1 n y k y ¯ ˙ k 2
RMSE = k = 1 n y k   y ¯ k 2 n
MBE = 1 n k = 1 n y k y ¯ k
MAE = 1 n k = 1 n y k y ¯ k
MSE = 1 n k = 1 n y k y ¯ k 2
NRMSE = 100 ( k = 1 n y k   y ¯ k 2 n y ¯ ˙ k )
Considering the mean bias errors (0.66 V/V% at 10 cm and 1.43 V/V% at 60 cm) for 2021, the model slightly underestimated observed moisture values, particularly during the initial stage (MBE = −2.47) at 10 cm. Conversely, in 2021, the model exhibited a slight overestimation (MBE = 1.88) of soil moisture content at 60 cm, especially in the crop development stage. The mean absolute error in moisture ranged from 0.97 to 2.9 V/V%, with the highest error occurring during the crop development stage in 2021 at 10 cm. Notably weak correlations were identified in the initial stage towards late season (R2 = 0.03–0.47) except 60 cm during the mid-season stage (R2 = 0.93).
When considering the mean bias errors (2.26 v/v% at 10 cm and 6.69 v/v% at 60 cm) for 2022, notably in 2022, the model exhibited a higher overestimation (MBE = 1.648) of soil moisture content at 60 cm, especially in the crop development stage. Meanwhile, the model had a slight underestimation (MBE = −2.78) at 10 cm and (MBE = −0.79) at 60 cm in the initial stage. The mean absolute error in moisture ranged from 0.79 to 2.86 V/V%, with the highest error occurring during the initial stage in 2022 at 10 cm. Notably weak correlations were identified in the initial and crop development stages (R2 = 0.13–0.21) at 10 cm. Initial and crop development seasons had a moderately strong correlation (R2 = 0.68 and R2 = 0.81, respectively) at 60 cm depth.
Considering the 2023 mean bias errors (1.37 V/V% at 10 cm and 1.78 V/V% at 60 cm), the model slightly overestimated observed moisture values, particularly during the senescence stage (MBE = 0.09) and underestimated (MBE = −1.71) in the initial stage at 10 cm. Conversely, the highest overestimation (MBE = 4.92) happened at the crop development stage at 10 cm depth. The mean absolute error in soil moisture ranged from −1.71 to 4.92 V/V%. Notably weak correlations were identified at all phenological stages at 10 cm (R2 = 0.22–0.48). The 60 cm depth had quite a strong correlation (R2 = 0.78–0.83) at all stages except for a moderately strong correlation (R2 = 0.55) during the late stage.
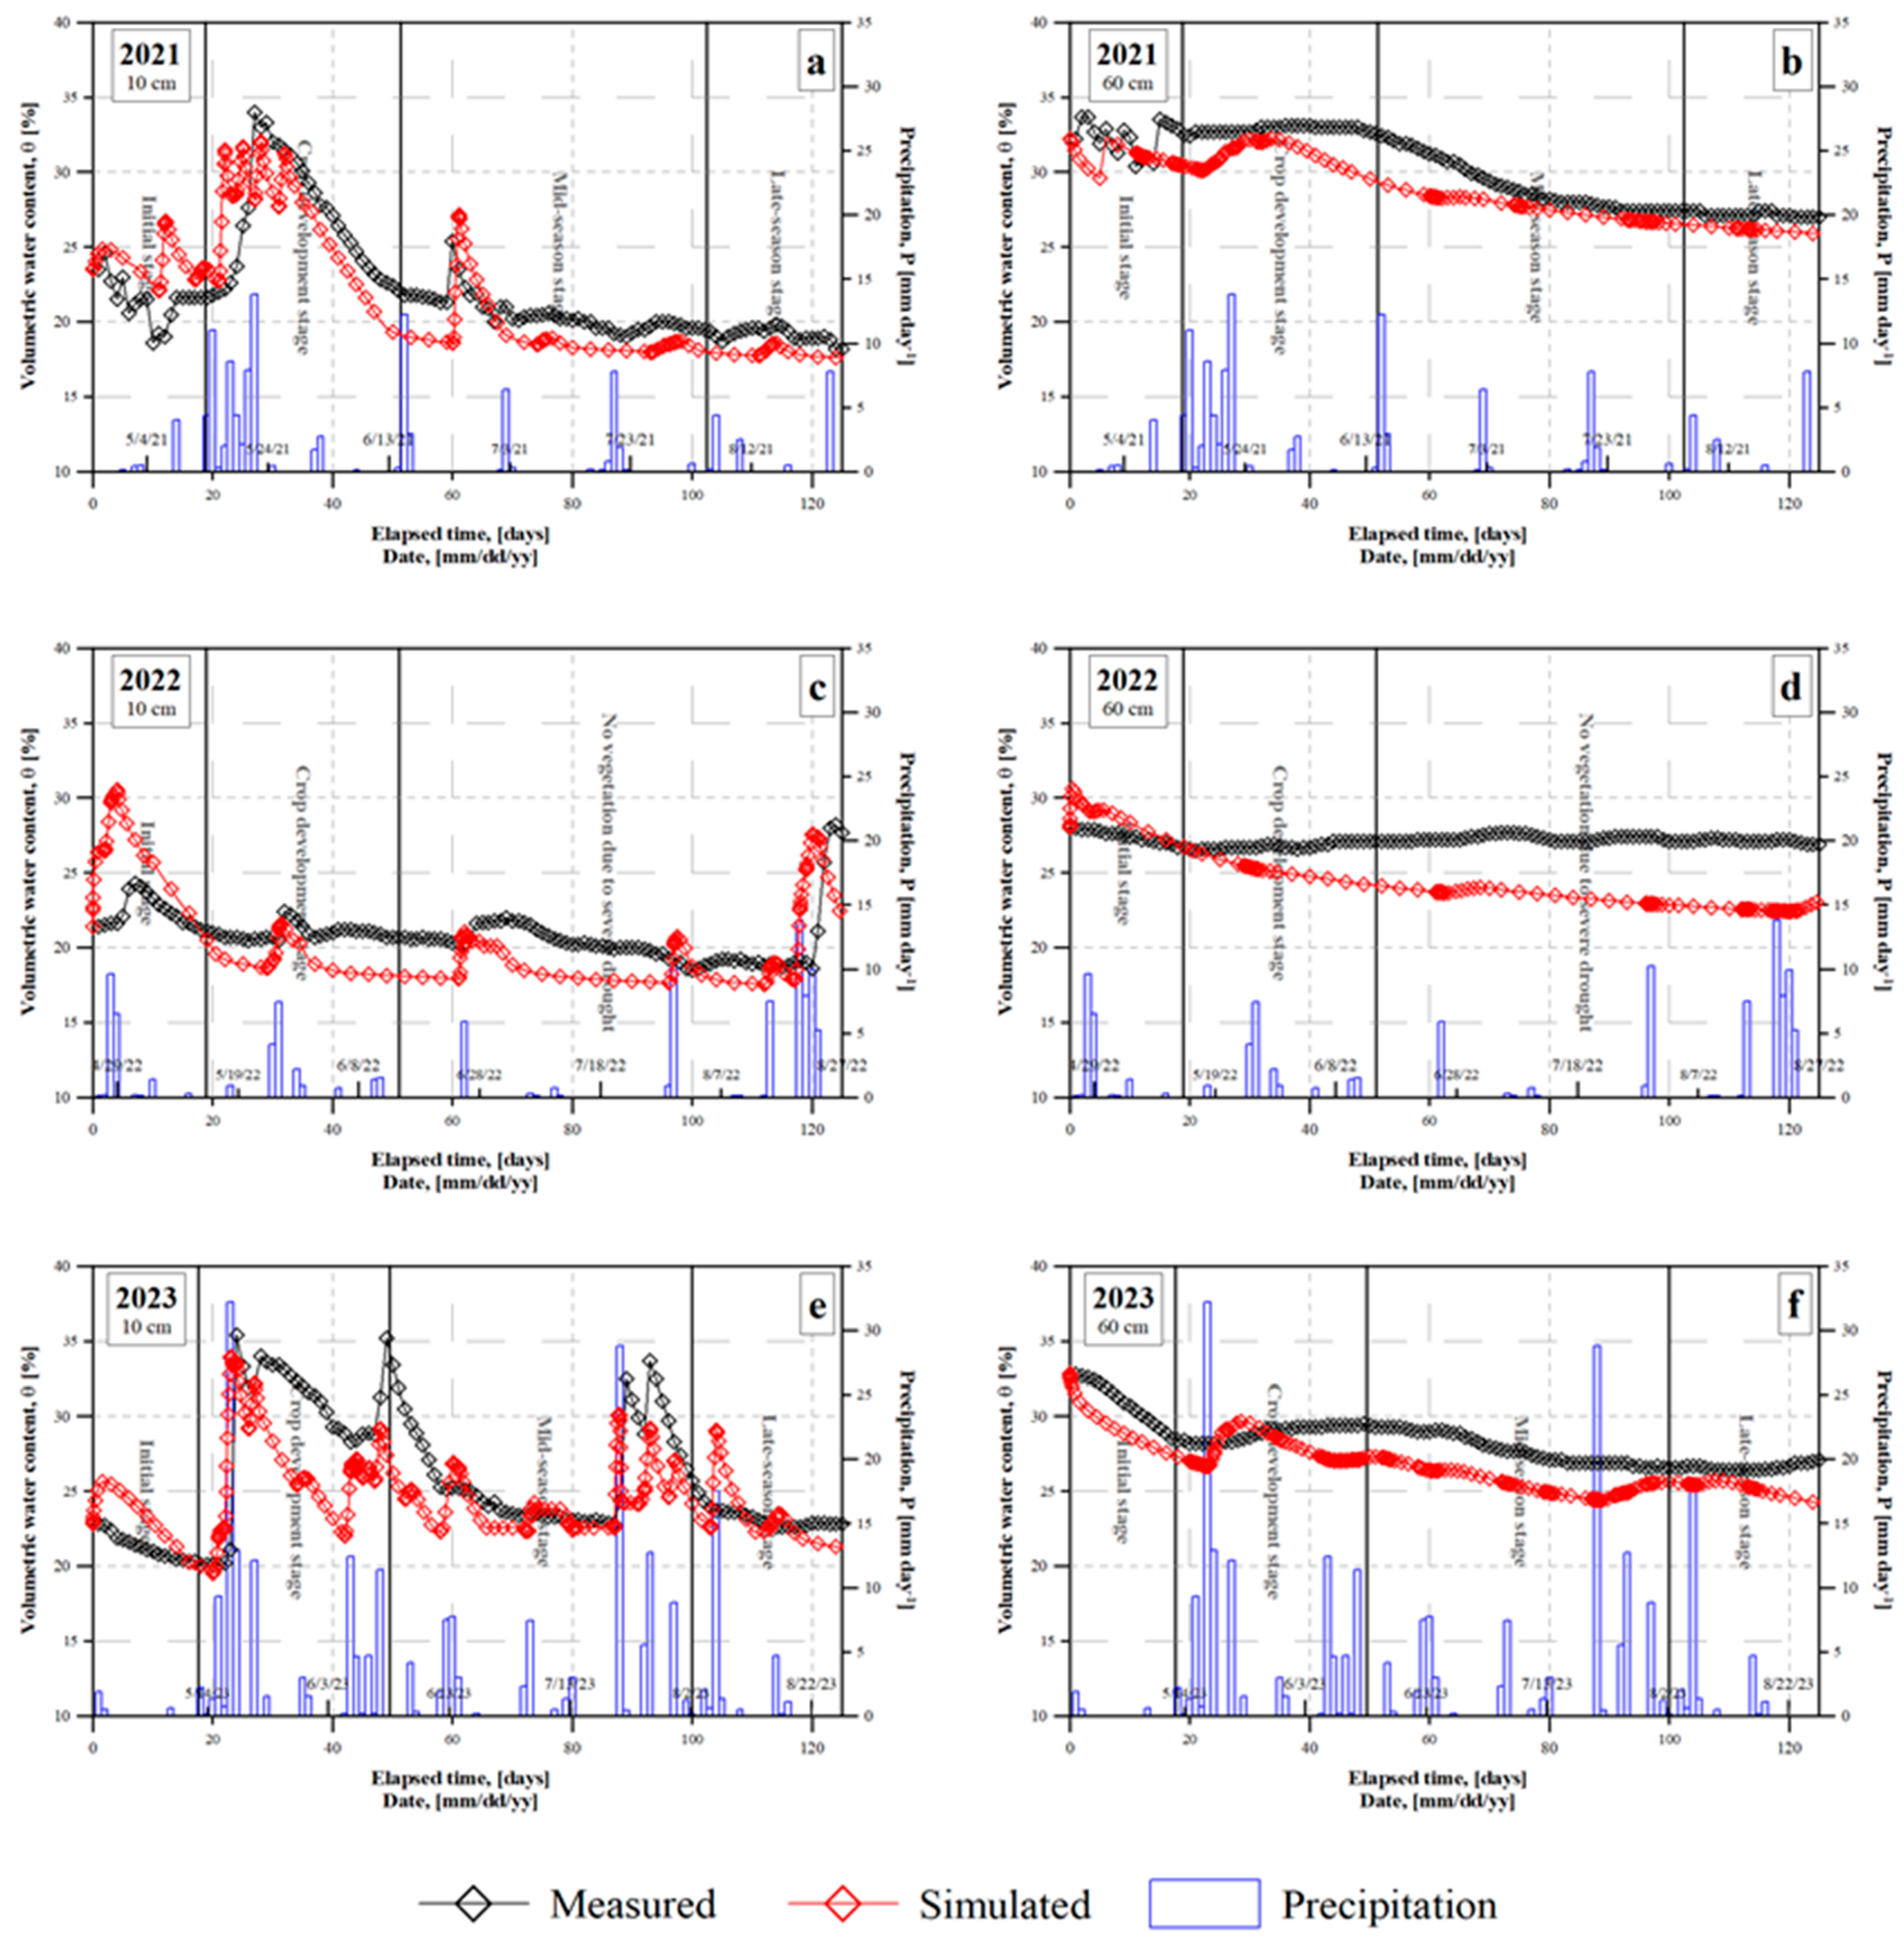
Figure 6 and Table 6 reveal one instance where predicted values are underestimated, particularly during the initial stage, at 10 cm depth with high gradients in soil water content. These results suggest that the HYDRUS model is well-suited for modeling water content changes at the study site. However, during the crop development stage in 2022, fewer rainfall events were encountered, leading to an underestimation of soil moisture, possibly due to the model’s higher infiltration rate compared to reality, the absence of runoff, and its inability to simulate extreme events such as droughts. The year 2022 was one of the driest and hottest in Hungary since 1901 [83].

3.4. Water Productivity

Water productivity in maize production is a crucial indicator of the efficiency with which water resources are utilized to achieve agricultural yields. In 2021, maize fields produced a yield of approximately 5.14 tons per hectare with a water productivity of 1.44 kg/m3. This metric signifies that for every cubic meter of water used, 1.44 kg of maize were produced. This relatively high water productivity indicates an efficient use of water resources, reflecting favorable conditions for crop growth and effective rainfall. Efficient rainfall use is essential for sustainable agriculture, particularly in the Tisza region, where water scarcity is a significant concern.
The year 2022 experienced lower relative humidity and significantly less precipitation compared to 2021 and 2023, indicating a period of drier conditions that certainly reduced water productivity and contributed to a drought (Table 7). In contrast, 2021 and 2023 had higher humidity and precipitation, supporting better water productivity and a lower likelihood of drought.
However, by 2023, water productivity had decreased to 1.19 kg/m³, despite the yield remaining steady at 5.14 tons per hectare. This decline in water productivity indicates a reduction in the efficiency of water use in maize fields. Several factors could contribute to this trend, including changes in climate conditions, increased water losses due to evaporation or runoff, and a lack of irrigation. The steady yield suggests that while the overall production has not been affected, more water is now required to achieve the same output. This trend highlights the need for improved water management strategies and the adoption of more water-efficient technologies to sustain maize production while conserving water resources.

4. Discussion

Improving the sustainability of a dynamic water productivity system necessitates optimizing operational parameters such as land drainage, water root absorption, nutrient uptake, and so on [84]. The analytical simulation has proved to be a quick and accurate method for enhancing those operating parameters [85,86]. Nevertheless, there has been minimal research on the link between irrigation schedule, irrigation tolerance, and irrigation volume [87,88]. Quantifying soil moisture content under a rainfed system is a challenging task due to variations in soil hydraulic properties, rainfall intensity and frequency, and water uptake by roots [26]. Due to these uncertainties, sub-root zone seepage and nutrient leaching may occur, even though the precipitation water is equal to or less than the crop demand [89].
In this exploratory study, we combine CROPWAT findings and HYDRUS 2D simulation results from rainfed settings and optimize operating parameters for selecting a cost-effective modernized irrigation system. The NDVI-derived Kc approach was used in this study in order to cater for field-specific planting schedules, crop growth durations, climate conditions, cropping cycles, and agricultural practices [90,91] Our investigation leveraged Sentinel-based NDVI data alongside on-site BBCH observations to ascertain the duration of phenological stages and to delineate the dynamic alterations in crop coefficient (Kc), aligning with findings from several prior studies [37,92,93]. However, this method is not without its uncertainties and potential for considerable error. One primary source of uncertainty arises from the variability in NDVI values due to differences in soil background, atmospheric conditions, and sensor characteristics. These factors can lead to inconsistencies in NDVI readings, which in turn affect the accuracy of the Kc estimation [94,95]. Thereafter, the FAO56 methodology [59] was employed in this study to calculate crop evapotranspiration (ETc). The computed ETc was determined to be 357.31 mm, 388.40 mm, and 431.32 mm in 2021, 2022, and 2023, respectively (refer to Figure 5). This aligns with European estimations for maize crop evapotranspiration of 373 ± 73 mm during 1992–2012, as conducted by [96] utilizing the Aquacrop model. The ETc values confirm the Hungarian regional estimations of 325.9–416.8 mm from [97]. These ETc values obtained under rainfed conditions using satellite-based data exhibit a consistent trend (267–425 mm) with findings from previous studies [97,98].
To gain a comprehensive understanding of soil water content distribution in the area, temporal variations in water content were explored using data from soil moisture measured at the hydrometeorological station as an initial reference. Illustrated in Figure 6 is the temporal evolution of soil water content. The discrepancy between the field capacity (32.2 V/V%) and the wilting point (17.51 V/V%) delineates the available soil moisture range, amounting to 14.69 V/V%. Drawing from practical insights, irrigation becomes necessary when this available moisture range diminishes to 50% [99], corresponding to a soil moisture content of below 17.51 V/V%. Notably, in 2022, precipitation alone failed to replenish soil water content to the optimal moisture range, resulting in soil moisture falling below the permanent wilting point in the absence of irrigation.
The HYDRUS-2D simulation model was used to examine the water flow throughout the maize growing seasons without irrigation with a fixed deep groundwater table at various nodes. The model regards the groundwater level at 14 m and the regional annual fluctuation at 326 cm [69]. In 2022, it is evident that the precipitation received was not enough to replenish the soil’s water content to the ideal moisture level, leading to a negative water balance. The resultant agricultural drought was severe, as shown by the vegetation stress in the NDVI. While the model demonstrated reliability, the Root Mean Square Error (RMSE) and Normalized RMSE (NRMSE) values indicate room for improvement. For instance, RMSE values ranged from 1.73 V/V% to 5.16 V/V%, and NRMSE values ranged from 5.72% to 20.34%. The subpar model performance observed at this location contrasts with findings from similar studies on maize under rainfed conditions [100], aiming to characterize soil moisture at a depth of 40–60 cm. For example, when integrating field measurements with in situ weather data, the discrepancy between modeled and observed soil volumetric water content (VWC) at the surface level, owing to the inherent soil heterogeneity at the field scale, resulted in a Root Mean Square Error (RMSE) of 0.018. It is worth mentioning that the model performs best in midseason at a 60 cm soil depth, where irrigation is most important for the crop. However, the current simulation results exhibit considerable discrepancies when compared to the observed data. These gaps indicate that there is room for improvement in the model’s accuracy and predictive capabilities. To accurately validate the HYDRUS-2D simulations, further work is required for more precise measurements of water usage and losses by a modern mini lysimeter [101,102] and spatio-temporal coverage of soil physical characteristics [103]. The study covers a relatively short period (2021–2023). Longer-term studies are needed to validate the model’s robustness and reliability over different climatic cycles and agricultural practices. The model may require additional calibration to handle extreme weather conditions, such as drought. In future goals, comprehensive sensitivity analysis is planned to identify the most influential parameters and refine the parameterization of the HYDRUS model affecting the simulation outcomes. This can help prioritize which parameters need more precise calibration. This will involve using more robust calibration methods, such as inverse modeling, to better align the simulated results with the observed data [104,105]. The accuracy of model fitting can be significantly enhanced by increasing the volume of field data and utilizing advanced machine learning techniques. Linear regression, while useful, often falls short of capturing the complex relationships between variables in vegetation studies (Zhang et al., 2020). To address this, deploying vegetation indices and leveraging machine learning algorithms can provide a more nuanced and predictive model for estimating crop coefficients (Kc). Vegetation indices, such as NDVI, offer valuable insights into vegetation health and density, which are crucial for refining Kc estimations [106]. Machine learning methods, such as random forests or neural networks, can further improve predictability by uncovering intricate patterns in the data that linear models may miss [107,108].
Given that the yield was around 5.14 tons per ha in 2021 and 2023, the water productivity was 1.44 kg/m³ and 1.19 kg/m³, respectively. The decreasing water productivity indicates a decline in the efficiency of water use in the maize field over these years. This observation is consistent with the study of [109], where they observed increased water use under the simulated drought stress of major cereals. This indicates that the climate was indeed drier or hotter, leading to increased water requirements for the same yield. The decreased biomass in 2022 serves as confirmation of the maize drought findings presented by [110]. Their research identified a significant agro-climatological drought that commenced in 2021 and persisted until early autumn 2022. During the vegetation period, the difference between rainfall and ETc was −156.31 mm, −269.1 mm, and −188.52 mm in 2021, 2022, and 2023, respectively. These negative differences imply that the natural water supply (rainfall) alone was insufficient to meet the water demands of the crops during their growth stages. Such consistent deficits over multiple years suggest a recurring pattern of water stress during the growing season. This validates the need for supplemental irrigation to ensure adequate water supply for the crops and to optimize their growth and yield. Irrigation would help compensate for the deficit and provide the necessary moisture for healthy plant development, potentially improving agricultural productivity in the area.

5. Conclusions

The proper management of water and nutrients has been highlighted as critical for bridging the yield gap of major crops (without neglecting the importance of plant genetics). In continental climate settings, to achieve sustainable expansion of irrigated agriculture, management solutions that enhance water and fertilizer usage efficiency must be defined.
In summary, this examination demonstrates the efficacy of NDVI indices for tracking maize growth stages and estimating crop evapotranspiration. This resultant ETc can be integrated into tools like Hydrus for effective soil moisture monitoring. The validation results indicated favorable goodness-of-fit statistics (R2 values) for each year and depth (10 cm and 60 cm), affirming the model’s reliability in soil moisture monitoring. Additionally, the model’s accuracy, as indicated by RMSE and NRMSE values, further underscores its efficacy as an indirect reference for measuring soil moisture content.
Leveraging remote sensing data alongside physical soil moisture modeling methods, combined with calibration and mathematical optimization procedures using spatial analysis, offers pertinent resources for enhancing agricultural water management practices, ultimately aiming for increased crop productivity and mitigation of water waste. Further research and refinement of these methodologies hold promise for developing more precise and reliable strategies for crop water management within agricultural systems.

Author Contributions

Conceptualization, N.G.S. and A.N.; methodology, T.M., N.G.S. and A.N.; software, T.M; validation, T.M. and N.G.S.; formal analysis, N.G.S., T.M. and A.N.; resources, N.G.S., J.T. and A.N.; writing—original draft preparation, N.G.S. and A.N.; writing—review and editing, N.G.S., J.T. and A.N.; visualization, T.M.; supervision, A.N. and T.M.; funding acquisition, A.N. and J.T. All authors have read and agreed to the published version of the manuscript.

Funding

This research was funded by the TKP2021-NKTA-32 project. Project no. TKP2021-NKTA-32 has been implemented with support provided by the National Research, Development, and Innovation Fund of Hungary, financed under the TKP2021-NKTA funding scheme. This research was supported by the János Bolyai Research Scholarship of the Hungarian Academy of Sciences.

Institutional Review Board Statement

Not applicable.

Data Availability Statement

Data are contained within the article. Publicly available datasets were analyzed in this study. These data can be found here: https://odp.met.hu/climate/station_data_series/.

Acknowledgments

The authors wish to thank CABI, c/o Plant Protection and Soil Conservation Directorate, Hungary, for their collaboration during field measurements and laboratory analysis.

Conflicts of Interest

The authors declare no conflicts of interest.

References

  1. Steensland, A. 2021 Global Agricultural Productivity Report: Climate for Agricultural Growth; Virginia Tech College of Agriculture and Life Sciences: Blacksburg, VA, USA, 2021. [Google Scholar]
  2. Ponnampalam, E.N.; Bekhit, A.E.D.; Bruce, H.; Scollan, N.D.; Muchenje, V.; Silva, P.; Jacobs, J.L. Production strategies and processing systems of meat: Current status and future outlook for innovation—A global perspective. In Sustainable Meat Production and Processing; Academic Press: Cambridge, MA, USA, 2019; pp. 17–44. [Google Scholar] [CrossRef]
  3. Tripathy, K.P.; Mishra, A.K. How unusual is the 2022 European compound drought and heatwave event? Geophys. Res. Lett. 2023, 50, e2023GL105453. [Google Scholar] [CrossRef]
  4. Toreti, A.; Bavera, D.; Acosta Navarro, J.; Cammalleri, C.; de Jager, A.; Di Ciollo, C.; Hrast Essenfelder, A.; Maetens, W.; Magni, D.; Masante, D.; et al. Drought in Europe August 2022; Publications Office of the European Union: Luxembourg, 2022; JRC130493. [Google Scholar] [CrossRef]
  5. Fu, Z.; Ciais, P.; Feldman, A.F.; Gentine, P.; Makowski, D.; Prentice, I.C.; Stoy, P.C.; Bastos, A.; Wigneron, J.P. Critical soil moisture thresholds of plant water stress in terrestrial ecosystems. Sci. Adv. 2022, 8, 7827. [Google Scholar] [CrossRef] [PubMed]
  6. Yillia, P.T. Water-Energy-Food nexus: Framing the opportunities, challenges and synergies for implementing the SDGs. Osterr. Wasser-Und Abfallwirtsch. 2016, 68, 86–98. [Google Scholar] [CrossRef]
  7. Hertel, T.W. The challenges of sustainably feeding a growing planet. Food Secur. 2015, 7, 185–198. [Google Scholar] [CrossRef]
  8. McKenzie, F.C.; Williams, J. Sustainable food production: Constraints, challenges and choices by 2050. Food Secur. 2015, 7, 221–233. [Google Scholar] [CrossRef]
  9. Tamás, J. Precision Agriculture (Precíziós Mezőgazdaság); Szaktudás Kiadó Ház ZRt.: Budapest, Hungary, 2001. (In Hungarian) [Google Scholar]
  10. Cai, X.; McKinney, D.C.; Rosegrant, M.W. Sustainability analysis for irrigation water management in the Aral Sea region. Agric. Syst. 2003, 76, 1043–1066. [Google Scholar] [CrossRef]
  11. Szépszó, G.; Horányi, A. Transient simulation of the REMO regional climate model and its evaluation over Hungary. Időjárás 2008, 112, 203–231. [Google Scholar]
  12. Bakucs, Z.; Fertő, I.; Vígh, E. Crop Productivity and Climatic Conditions: Evidence from Hungary. Agriculture 2020, 10, 421. [Google Scholar] [CrossRef]
  13. European Commission. The EU Environmental Implementation Review 2019 Country Report: Hungary; European Commission: Brussels, Belgium, 2019; Available online: https://ec.europa.eu/environment/eir/pdf/report_hu_en.pdf (accessed on 12 November 2023).
  14. FAO (Food and Agriculture Organisation of the United Nations). FAO Aquastat; FAO: Rome, Italy, 2020; Available online: http://www.fao.org/aquastat/en/ (accessed on 11 October 2023).
  15. Haacker, E.M.; Sharda, V.; Cano, A.M.; Hrozencik, R.A.; Núñez, A.; Zambreski, Z.; Nozari, S.; Smith, G.E.B.; Moore, L.; Sharma, S.; et al. Transition pathways to sustainable agricultural water management: A review of integrated modeling approaches. JAWRA J. Am. Water Resour. Assoc. 2019, 55, 6–23. [Google Scholar] [CrossRef]
  16. Levidow, L.; Zaccaria, D.; Maia, R.; Vivas, E.; Todorovic, M.; Scardigno, A. Improving water-efficient irrigation: Prospects and difficulties of innovative practices. Agric. Water Manag. 2014, 146, 84–94. [Google Scholar] [CrossRef]
  17. Elbeltagi, A.; Srivastava, A.; Kushwaha, N.L.; Juhász, C.; Tamás, J.; Nagy, A. Meteorological Data Fusion Approach for Modeling Crop Water Productivity Based on Ensemble Machine Learning. Water 2023, 15, 30. [Google Scholar] [CrossRef]
  18. Datta, S.; Taghvaeian, S.; Stivers, J. Understanding Soil Water Content and Thresholds for Irrigation Management; Oklahoma Cooperative Extension Service; Oklahoma State University: Stillwater, OK, USA, 2017. [Google Scholar]
  19. Barker, J.B.; Franz, T.E.; Heeren, D.M.; Neale, C.M.; Luck, J.D. Soil water content monitoring for irrigation management: A geostatistical analysis. Agric. Water Manag. 2017, 188, 36–49. [Google Scholar] [CrossRef]
  20. Lascano, R.J. Irrigation of Agricultural Crops, 2nd ed.; American Society of Agronomy: Madison, WI, USA, 2007. [Google Scholar]
  21. Bwambale, E.; Abagale, F.K.; Anornu, G.K. Smart irrigation monitoring and control strategies for improving water use efficiency in precision agriculture: A review. Agric. Water Manag. 2022, 260, 107324. [Google Scholar] [CrossRef]
  22. Petropoulos, G.P.; Griffiths, H.M.; Dorigo, W.; Xaver, A.; Gruber, A. Surface soil moisture estimation: Significance, controls, and conventional measurement techniques. In Remote Sensing of Energy Fluxes and Soil Moisture Content; Petropoulos, G.P., Ed.; CRC Press: Boca Raton, FL, USA, 2013; pp. 29–48. [Google Scholar]
  23. Dwevedi, A.; Kumar, P.; Kumar, P.; Kumar, Y.; Sharma, Y.K.; Kayastha, A.M. Soil sensors: Detailed insight into research updates, significance, and future prospects. In New Pesticides and Soil Sensors; Academic Press: Cambridge, MA, USA, 2017; pp. 561–594. [Google Scholar] [CrossRef]
  24. Fernández, J.E. Plant-based methods for irrigation scheduling of woody crops. Horticulturae 2017, 3, 35. [Google Scholar] [CrossRef]
  25. Jones, H.G. Irrigation scheduling: Advantages and pitfalls of plant-based methods. J. Exp. Bot. 2004, 55, 2427–2436. [Google Scholar] [CrossRef]
  26. Rasheed, M.W.; Tang, J.; Sarwar, A.; Shah, S.; Saddique, N.; Khan, M.U.; Imran Khan, M.; Nawaz, S.; Shamshiri, R.R.; Aziz, M.; et al. Soil moisture measuring techniques and factors affecting the moisture dynamics: A comprehensive review. Sustainability 2022, 14, 11538. [Google Scholar] [CrossRef]
  27. Pereira, L.S.; Paredes, P.; Jovanovic, N. Soil water balance models for determining crop water and irrigation requirements and irrigation scheduling focusing on the FAO56 method and the dual Kc approach. Agric. Water Manag. 2020, 241, 106357. [Google Scholar] [CrossRef]
  28. Verstraeten, W.W.; Veroustraete, F.; Feyen, J. Assessment of evapotranspiration and soil moisture content across different scales of observation. Sensors 2008, 8, 70–117. [Google Scholar] [CrossRef] [PubMed]
  29. Massman, W.; Lee, X. Eddy covariance flux corrections and uncertainties in long-term studies of carbon and energy exchanges. Agric. For. Meteorol. 2002, 113, 121–144. [Google Scholar] [CrossRef]
  30. Gebler, S.; Hendricks Franssen, H.J.; Pütz, T.; Post, H.; Schmidt, M.; Vereecken, H. Actual evapotranspiration and precipitation measured by lysimeters: A comparison with eddy covariance and tipping bucket. Hydrol. Earth Syst. Sci. 2015, 19, 2145–2161. [Google Scholar] [CrossRef]
  31. Rajan, N.; Maas, S.J. Spectral crop coefficient approach for estimating daily crop water use. Adv. Remote Sens. 2014, 3, 197. [Google Scholar] [CrossRef]
  32. Tegos, A.; Efstratiadis, A.; Koutsoyiannis, D. A parametric model for potential evapotranspiration estimation based on a simplified formulation of the Penman-Monteith equation. In Evapotranspiration—An Overview; Shahid, S., Ed.; IntechOpen: London, UK, 2013; pp. 143–165. [Google Scholar] [CrossRef]
  33. Lang, D.; Zheng, J.; Shi, J.; Liao, F.; Ma, X.; Wang, W.; Chen, X.; Zhang, M. A Comparative Study of Potential Evapotranspiration Estimation by Eight Methods with FAO Penman–Monteith Method in Southwestern China. Water 2017, 9, 734. [Google Scholar] [CrossRef]
  34. Owusu-Sekyere, J.D.; Ampofo, E.A.; Asamoah, O. Comparison of five different methods in estimating reference evapotranspiration in Cape Coast, Ghana. Afr. J. Agric. Res. 2017, 12, 2976–2985. [Google Scholar] [CrossRef]
  35. Pereira, L.S.; Allen, R.G.; Smith, M.; Raes, D. Crop evapotranspiration estimation with FAO56: Past and future. Agric. Water Manag. 2015, 147, 4–20. [Google Scholar] [CrossRef]
  36. Mhawej, M.; Nasrallah, A.; Abunnasr, Y.; Fadel, A.; Faour, G. Better irrigation management using the satellite-based adjusted single crop coefficient (aKc) for over sixty crop types in California, USA. Agric. Water Manag. 2021, 256, 107059. [Google Scholar] [CrossRef]
  37. Mebrie, D.W.; Assefa, T.T.; Yimam, A.Y.; Belay, S.A. A remote sensing approach to estimate variable crop coefficient and evapotranspiration for improved water productivity in the Ethiopian highlands. Appl. Water Sci. 2023, 13, 168. [Google Scholar] [CrossRef]
  38. Yimer, N.M. Assessment of Performance of SWAP and CROPWAT Model simulating Irrigation Water Requirement on Sugarcane Yield of Kuraz Irrigation Project. Master’s Thesis, Kuraz University, Addis Ababa, Ethiopia, 2022. [Google Scholar]
  39. Kumar, S.; Meena, R.S.; Sheoran, S.; Jangir, C.K.; Jhariya, M.K.; Banerjee, A.; Raj, A. Remote sensing for agriculture and resource management. In Natural Resources Conservation and Advances for Sustainability; Academic Press: Cambridge, MA, USA, 2022; pp. 91–135. [Google Scholar] [CrossRef]
  40. Ahmad, U.; Alvino, A.; Marino, S. A review of crop water stress assessment using remote sensing. Remote Sens. 2021, 13, 4155. [Google Scholar] [CrossRef]
  41. Nagy, A.; Riczu, P.; Gálya, B.; Tamás, J. Spectral estimation of soil water content in visible and near infra-red range. Eurasian J. Soil Sci. 2014, 3, 163–171. [Google Scholar] [CrossRef]
  42. Melton, F.S.; Johnson, L.F.; Lund, C.P.; Pierce, L.L.; Michaelis, A.R.; Hiatt, S.H.; Guzman, A.; Adhikari, D.D.; Purdy, A.J.; Rosevelt, C.; et al. Satellite irrigation management support with the terrestrial observation and prediction system: A framework for integration of satellite and surface observations to support improvements in agricultural water resource management. IEEE J. Sel. Top. Appl. Earth Obs. Remote Sens. 2012, 5, 1709–1721. [Google Scholar] [CrossRef]
  43. Tamás, J.; Lénárt, C. Analysis of a small agricultural watershed using remote sensing techniques. Int. J. Remote Sens. 2006, 27, 3727–3738. [Google Scholar] [CrossRef]
  44. Burgerné Gimes, A. Előadásaim [My presentations]; Agroinform: Budapest, Hungary, 2014. (In Hungarian) [Google Scholar]
  45. Mezősi, G.; Bata, T.; Meyer, B.C.; Blanka, V.; Ladányi, Z. Climate change impacts on environmental hazards on the Great Hungarian Plain, Carpathian Basin. Int. J. Disaster Risk Sci. 2014, 5, 136–146. [Google Scholar] [CrossRef]
  46. Lennert, J.; Kovács, K.; Koós, B.; Swain, N.; Bálint, C.; Hamza, E.; Király, G.; Rácz, K.; Váradi, M.M.; Kovács, A.D. Climate Change, Pressures, and Adaptation Capacities of Farmers: Empirical Evidence from Hungary. Horticulturae 2024, 10, 56. [Google Scholar] [CrossRef]
  47. Szedlák, L. Fekete év a Magyar Mezőgazdaságban: Tényleg Lehúzhatják a Rolót Ezek a Termelők? 2022. Available online: https://www.agrarszektor.hu/noveny/20221228/fekete-ev-a-magyar-mezogazdasagban-tenyleg-lehuzhatjak-a-rolot-ezek-a-termelok-41820 (accessed on 1 November 2023).
  48. Széles, A.; Horváth, É.; Simon, K.; Zagyi, P.; Huzsvai, L. Maize production under drought stress: Nutrient supply, yield prediction. Plants 2023, 12, 3301. [Google Scholar] [CrossRef] [PubMed]
  49. Szolnoky, T.; Nagy, A. WaterAgri D 1.2 Stakeholder Training Material; 2023. Available online: https://wateragri.eu/wp-content/uploads/2023/09/D1.2.pdf (accessed on 2 January 2024).
  50. IUSS Working Group WRB. World Reference Base for Soil Resources 2006. A Framework for International Classification Correlation and Communication. World Soil Resources Reports 2006, 103. FAO: Rome. Electronic update. 2007. Available online: http://www.fao.org/ag/agl/agll/wrb/ (accessed on 24 March 2022).
  51. Gee, G.W.; Bauder, J.W. Particle size analysis by hydrometer: A simplified method for routine textural analysis and a sensitivity test of measurement parameters. Soil Sci. Soc. Am. J. 1979, 43, 1004–1007. [Google Scholar] [CrossRef]
  52. Nelson, D.W.; Sommers, L.E. Total carbon, organic carbon, and organic matter. In Methods of Soil Analysis: Part 3 Chemical Methods; Sparks, D.L., Ed.; SSSA Book Series No. 5; ASA and SSSA: Madison, WI, USA, 1996; pp. 961–1010. [Google Scholar] [CrossRef]
  53. Thomas, G.W. Soil pH and soil acidity. In Methods of Soil Analysis: Part 3 Chemical Methods; Sparks, D.L., Ed.; SSSA Book Series No. 5; ASA and SSSA: Madison, WI, USA, 1996; pp. 475–490. [Google Scholar] [CrossRef]
  54. ASTM D4373; Standard Test Method for Rapid Determination of Carbonate Content of Soils. ASTM International: West Conshohocken, PA, USA, 2014.
  55. ASTM D2937; Standard Test Method for Density of Soil in Place by the Drive-Cylinder Method. ASTM International: West Conshohocken, PA, USA, 2009.
  56. Reynolds, S.G. The gravimetric method of soil moisture determination Part III An examination of factors influencing soil moisture variability. J. Hydrol. 1970, 11, 288–300. [Google Scholar] [CrossRef]
  57. Nagy, J. Maize Production; Akadémiai Kiadó: Budapest, Hungary, 2006. [Google Scholar]
  58. Štěpánek, P.; Trnka, M.; Chuchma, F.; Zahradníček, P.; Skalák, P.; Farda, A.; Fiala, R.; Hlavinka, P.; Balek, J.; Semerádová, D.; et al. Drought prediction system for Central Europe and its validation. Geosciences 2018, 8, 104. [Google Scholar] [CrossRef]
  59. Allen, R.G.; Pereira, L.S.; Raes, D.; Smith, M. Crop Evapotranspiration: Guidelines for Computing Crop Water Requirements; Food and Agriculture Organization of the United Nations: Rome, Italy, 1998. [Google Scholar]
  60. Meier, U. Growth Stages of Mono and Dicotyledonous Plants; BBCH Monograph; Federal Biological Research Centre for Agriculture and Forestry: Bonn, Germany, 2001; Available online: https://www.politicheagricole.it/flex/AppData/WebLive/Agrometeo/MIEPFY800/BBCHengl2001.pdf (accessed on 22 November 2023).
  61. Ramachandran, J.; Lalitha, R.; Kannan, S.V. Estimation of site-specific crop coefficients for major crops of lal-gudi block in tamil nadu using remote sensing based algorithms. J. Agric. Eng. 2021, 58, 62–72. [Google Scholar] [CrossRef]
  62. Li, X.; Zhu, W.; Xie, Z.; Zhan, P.; Huang, X.; Sun, L.; Duan, Z. Assessing the effects of time interpolation of NDVI composites on phenology trend estimation. Remote Sens. 2021, 13, 5018. [Google Scholar] [CrossRef]
  63. Hunsaker, D.J.; Pinter, P.J.; Kimball, B.A. Wheat basal crop coefficients determined by normalized difference vegetation index. Irrig. Sci. 2005, 24, 1–14. [Google Scholar] [CrossRef]
  64. Magyar, T.; Fehér, Z.; Buday-Bódi, E.; Tamás, J.; Nagy, A. Modelling of soil moisture and water fluxes in a maize field for the optimization of irrigation. Comput. Electron. Agric. 2023, 213, 108159. [Google Scholar] [CrossRef]
  65. Šimunek, J.; Šejna, M.; Saito, H.; Sakai, M.; Van Genuchten, M.T. The HYDRUS-1D Software Package for Simulating the One-Dimensional Movement of Water, Heat, and Multiple Solutes in Variably Saturated Media; Version 4.17; Department of Environmental Sciences University of California Riverside: Riverside, CA, USA, 2013. [Google Scholar]
  66. Han, M.; Zhao, C.; Feng, G.; Yan, Y.; Sheng, Y. Evaluating the effects of mulch and irrigation amount on soil water distribution and root zone water balance using HYDRUS-2D. Water 2015, 7, 2622–2640. [Google Scholar] [CrossRef]
  67. Jones, C.D. Assessing Efficiencies in Vegetable Production: Hydrological Modeling of Soil-Water Dynamics and Estimation of Greenhouse Gas Emissions; University of Florida: Gainesville, FL, USA, 2013. [Google Scholar]
  68. van Dam, J.; van der Zee, S.E.A.T.M.; Vogel, H.J.; Vrugt, J.A.; Wöhling, T.; Young, I.M. Modeling Soil Processes: Review, Key Challenges, and New Perspectives. Soil Sci. 2016, 15, vzj2015-09. [Google Scholar]
  69. VIZUGY. 2024. Available online: https://www.vizugy.hu/?mapModule=OpFkGrafikon&AllomasVOA=E0A4A0FC-A9AD-11D4-BB66-00508BA24287&mapData=KutIdosor#mapModule (accessed on 14 March 2024).
  70. van Genuchten, M.T. A closed-form equation for predicting the hydraulic conductivity of unsaturated soils. Soil Sci. Soc. Am. J. 1980, 44, 892–898. [Google Scholar] [CrossRef]
  71. Schaap, M.G.; Leij, F.J.; Van Genuchten, M.T. Rosetta: A computer program for estimating soil hydraulic parameters with hierarchical pedotransfer functions. J. Hydrol. 2001, 251, 163–176. [Google Scholar] [CrossRef]
  72. Wesseling, J.G. Meerjarige simulaties van grondwateronttrekking voor verschillende bodemprofielen, grondwatertrappen en gewassen met het model SWATRE. SC-DLO Rep. 1991, 152, 40. [Google Scholar]
  73. Assouline, S. The Effects of Microdrip and Conventional Drip Irrigation on Water Distribution and Uptake. Soil Sci. Soc. Am. J. 2002, 66, 1630–1636. [Google Scholar] [CrossRef]
  74. Feddes, R.A. Simulation of Field Water Use and Crop Yield. In Penning de Vries, F.W.T.; van Laar, H.H., Ed.; Simulation of Plant Growth and Crop Production; Pudoc: Wageningen, The Netherlands, 1982; pp. 194–209. Available online: https://edepot.wur.nl/172222 (accessed on 1 June 2024).
  75. Yu, J.; Wu, Y.; Xu, L.; Peng, J.; Chen, G.; Shen, X.; Lan, R.; Zhao, C.; Zhangzhong, L. Evaluating the Hydrus-1D Model Optimized by Remote Sensing Data for Soil Moisture Simulations in the Maize Root Zone. Remote Sens. 2022, 14, 6079. [Google Scholar] [CrossRef]
  76. Seo, H.S.; Šimunek, J.; Poeter, E.P. Documentation of the Hydrus Package for Modflow-2000, the US Geological Survey Modular Ground-water Model; IGWMC-International Ground Water Modeling Center: Princeton, NJ, USA, 2007; p. 96. [Google Scholar]
  77. Wang, X.; Li, Y.; Chau, H.W.; Tang, D.; Chen, J.; Bayad, M. Reduced root water uptake of summer maize grown in water-repellent soils simulated by HYDRUS-1D. Soil Tillage Res. 2021, 209, 104925. [Google Scholar] [CrossRef]
  78. Wang, Z.L.; Feng, H.; Wen, G.G. Effects of different water and nutrient schedules on farmland moisture and seed maize yield. J. Drain. Irrig. Mach. Eng. 2015, 33, 152–157. [Google Scholar]
  79. Wei, Z.; Yu, G.; Wang, Q.; Liu, Y. Separating transpiration and evaporation by stable isotopes in a maize field. Agric. For. Meteorol. 2014, 195–196, 108–117. [Google Scholar]
  80. Crow, W.T.; Van den Berg, M.J. An improved approach for estimating observation and model error parameters in soil moisture data assimilation. Water Resour. Res. 2010, 46, W12519. [Google Scholar] [CrossRef]
  81. Hodson, T.O. Root-mean-square error (RMSE) or mean absolute error (MAE): When to use them or not. Geosci. Model Dev. 2022, 15, 5481–5487. [Google Scholar] [CrossRef]
  82. Yang, J.M.; Yang, J.Y.; Liu, S.; Hoogenboom, G. An evaluation of the statistical methods for testing the performance of crop models with observed data. Agric. Syst. 2014, 127, 81–89. [Google Scholar] [CrossRef]
  83. Hungarian Meteorological Service. 2024. Available online: https://odp.met.hu/climate/station_data_series/ (accessed on 15 January 2024).
  84. Singh, R. Water Productivity Analysis from Field to Regional Scale; Wageningen University: Wageningen, The Netherlands, 2005. [Google Scholar]
  85. Hopmans, J.W.; Bristow, K.L. Current capabilities and future needs of root water and nutrient uptake modeling. Adv. Agron. 2002, 77, 103–183. [Google Scholar] [CrossRef]
  86. Bastiaanssen, W.G.M.; Allen, R.G.; Droogers, P.; D’Urso, G.; Steduto, P. Twenty-five years modeling irrigated and drained soils: State of the art. Agric. Water Manag. 2007, 92, 111–125. [Google Scholar] [CrossRef]
  87. Kirda, C. Deficit irrigation scheduling based on plant growth stages showing water stress tolerance. In Deficit Irrigation Practices; Water Reports; Food and Agricultural Organization of the United Nations: Rome, Italy, 2002; Volume 22, pp. 3–10. [Google Scholar]
  88. Allen, L.N.; MacAdam, J.W. Irrigation and water management. In Forages: The Science of Grassland Agriculture; Wiley: Hoboken, NJ, USA, 2020; Volume 2, pp. 497–513. [Google Scholar] [CrossRef]
  89. Arbat, G.; Puig-Bargués, J.; Duran-Ros, M.; Barragán, J.; de Cartagena, F.R. Drip-Irriwater: Computer software to simulate soil wetting patterns under surface drip irrigation. Comput. Electron. Agric. 2013, 98, 183–192. [Google Scholar] [CrossRef]
  90. Nikam, B.R.; Garg, V.; Thakur, P.K.; Aggarwal, S.P. Application of remote sensing and GIS in performance evaluation of irrigation project at disaggregated level. J. Indian Soc. Remote Sens. 2020, 48, 979–997. [Google Scholar] [CrossRef]
  91. Li, C.; Li, H.; Li, J.; Lei, Y.; Li, C.; Manevski, K.; Shen, Y. Using NDVI percentiles to monitor real-time crop growth. Comput. Electron. Agric. 2019, 162, 357–363. [Google Scholar] [CrossRef]
  92. Hari, M.; Tyagi, B.; Huddar, M.S.K.; Harish, A. Satellite-based regional-scale evapotranspiration estimation mapping of the rice bowl of Tamil Nadu: A little water to spare. Irrig. Drain. 2021, 70, 958–975. [Google Scholar] [CrossRef]
  93. Nagy, A.; Kiss, N.É.; Buday-Bódi, E.; Magyar, T.; Cavazza, F.; Gentile, S.L.; Abdullah, H.; Tamás, J.; Fehér, Z.Z. Precision Estimation of Crop Coefficient for Maize Cultivation Using High-Resolution Satellite Imagery to Enhance Evapotranspiration Assessment in Agriculture. Plants 2024, 13, 1212. [Google Scholar] [CrossRef]
  94. Bausch, W.C. Soil background effects on reflectance-based crop coefficients for corn. Remote Sens. Environ. 1993, 46, 213–222. [Google Scholar] [CrossRef]
  95. Glenn, E.P.; Huete, A.R.; Nagler, P.L.; Nelson, S.G. Relationship between remotely-sensed vegetation indices, canopy attributes and plant physiological processes: What vegetation indices can and cannot tell us about the landscape. Sensors 2008, 8, 2136–2160. [Google Scholar] [CrossRef] [PubMed]
  96. Gobin, A.; Kersebaum, K.C.; Eitzinger, J.; Trnka, M.; Hlavinka, P.; Takáč, J.; Kroes, J.; Ventrella, D.; Marta, A.D.; Deelstra, J.; et al. Variability in the water footprint of arable crop production across European regions. Water 2017, 9, 93. [Google Scholar] [CrossRef]
  97. Aina, R.M.N.; Grósz, J.; Waltner, I. Estimation of Crop Evapotranspiration Using AquaCrop for the Rákos and Szilas Stream Watersheds, Hungary. In Proceedings of the 3rd International Conference on Water Sciences, Szarvas, Hungary, 7–9 January 2020. [Google Scholar]
  98. Price, J.C. Using spatial context in satellite data to infer regional scale evapotranspiration. IEEE Trans. Geosci. Remote Sens. 1990, 28, 940–948. [Google Scholar] [CrossRef]
  99. Fereres, E.; Soriano, M.A. Deficit irrigation for reducing agricultural water use. J. Exp. Bot. 2007, 58, 147–159. [Google Scholar] [CrossRef] [PubMed]
  100. Iqbal, M.; Kamal, M.R.; Che Man, H.; Wayayok, A. HYDRUS-1D simulation of soil water dynamics for sweet corn under tropical rainfed condition. Appl. Sci. 2020, 10, 1219. [Google Scholar] [CrossRef]
  101. Ukoh Haka, I.B. Quantifying Evaporation and Transpiration in Field Lysimeters Using the Soil Water Balance. Ph.D. Thesis, University of the Free State, Bloemfontein, South Africa, 2010. [Google Scholar]
  102. Zsembeli, J.; Czellér, K.; Sinka, L.; Kovács, G.; Tuba, G. Application of Lysimeters in Agricultural Water Management. Creating a Platform to Address the Techniques Used in Creation and Protection of Environment and in Economic Management of Water in the Soil. 2019, pp. 5–21. Available online: https://raumberg-gumpenstein.at/jdownloads/Tagungen/Lysimetertagung/Lysimetertagung_2021/2l_2021_zsembeli.pdf. (accessed on 22 July 2023).
  103. Gebler, S.; Franssen, H.J.H.; Kollet, S.J.; Qu, W.; Vereecken, H. High resolution modelling of soil moisture patterns with TerrSysMP: A comparison with sensor network data. J. Hydrol. 2017, 547, 309–331. [Google Scholar] [CrossRef]
  104. Pinheiro, E.A.R.; van Lier, Q.D.J.; Inforsato, L.; Šimůnek, J. Measuring full-range soil hydraulic properties for the prediction of crop water availability using gamma-ray attenuation and inverse modeling. Agric. Water Manag. 2019, 216, 294–305. [Google Scholar] [CrossRef]
  105. Moore, C.; Doherty, J. Role of the calibration process in reducing model predictive error. Water Resour. Res. 2005, 41, W05020. [Google Scholar] [CrossRef]
  106. Gao, B.C. NDWI—A normalized difference water index for remote sensing of vegetation liquid water from space. Remote Sens. Environ. 1996, 58, 257–266. [Google Scholar] [CrossRef]
  107. Breiman, L. Random forests. Mach. Learn. 2001, 45, 5–32. [Google Scholar] [CrossRef]
  108. LeCun, Y.; Bengio, Y.; Hinton, G. Deep learning. Nature 2015, 521, 436–444. [Google Scholar] [CrossRef] [PubMed]
  109. Varga, B.; Varga-László, E.; Bencze, S.; Balla, K.; Veisz, O. Water use of winter cereals under well-watered and drought-stressed conditions. Plant Soil Environ. 2013, 59, 150–155. [Google Scholar] [CrossRef]
  110. Biró, K.; Kovács, E. Impact of the 2022 Drought Shock on the Adaptive Capacity of Hungarian Agriculture. Preprints, 2023. [Google Scholar] [CrossRef]
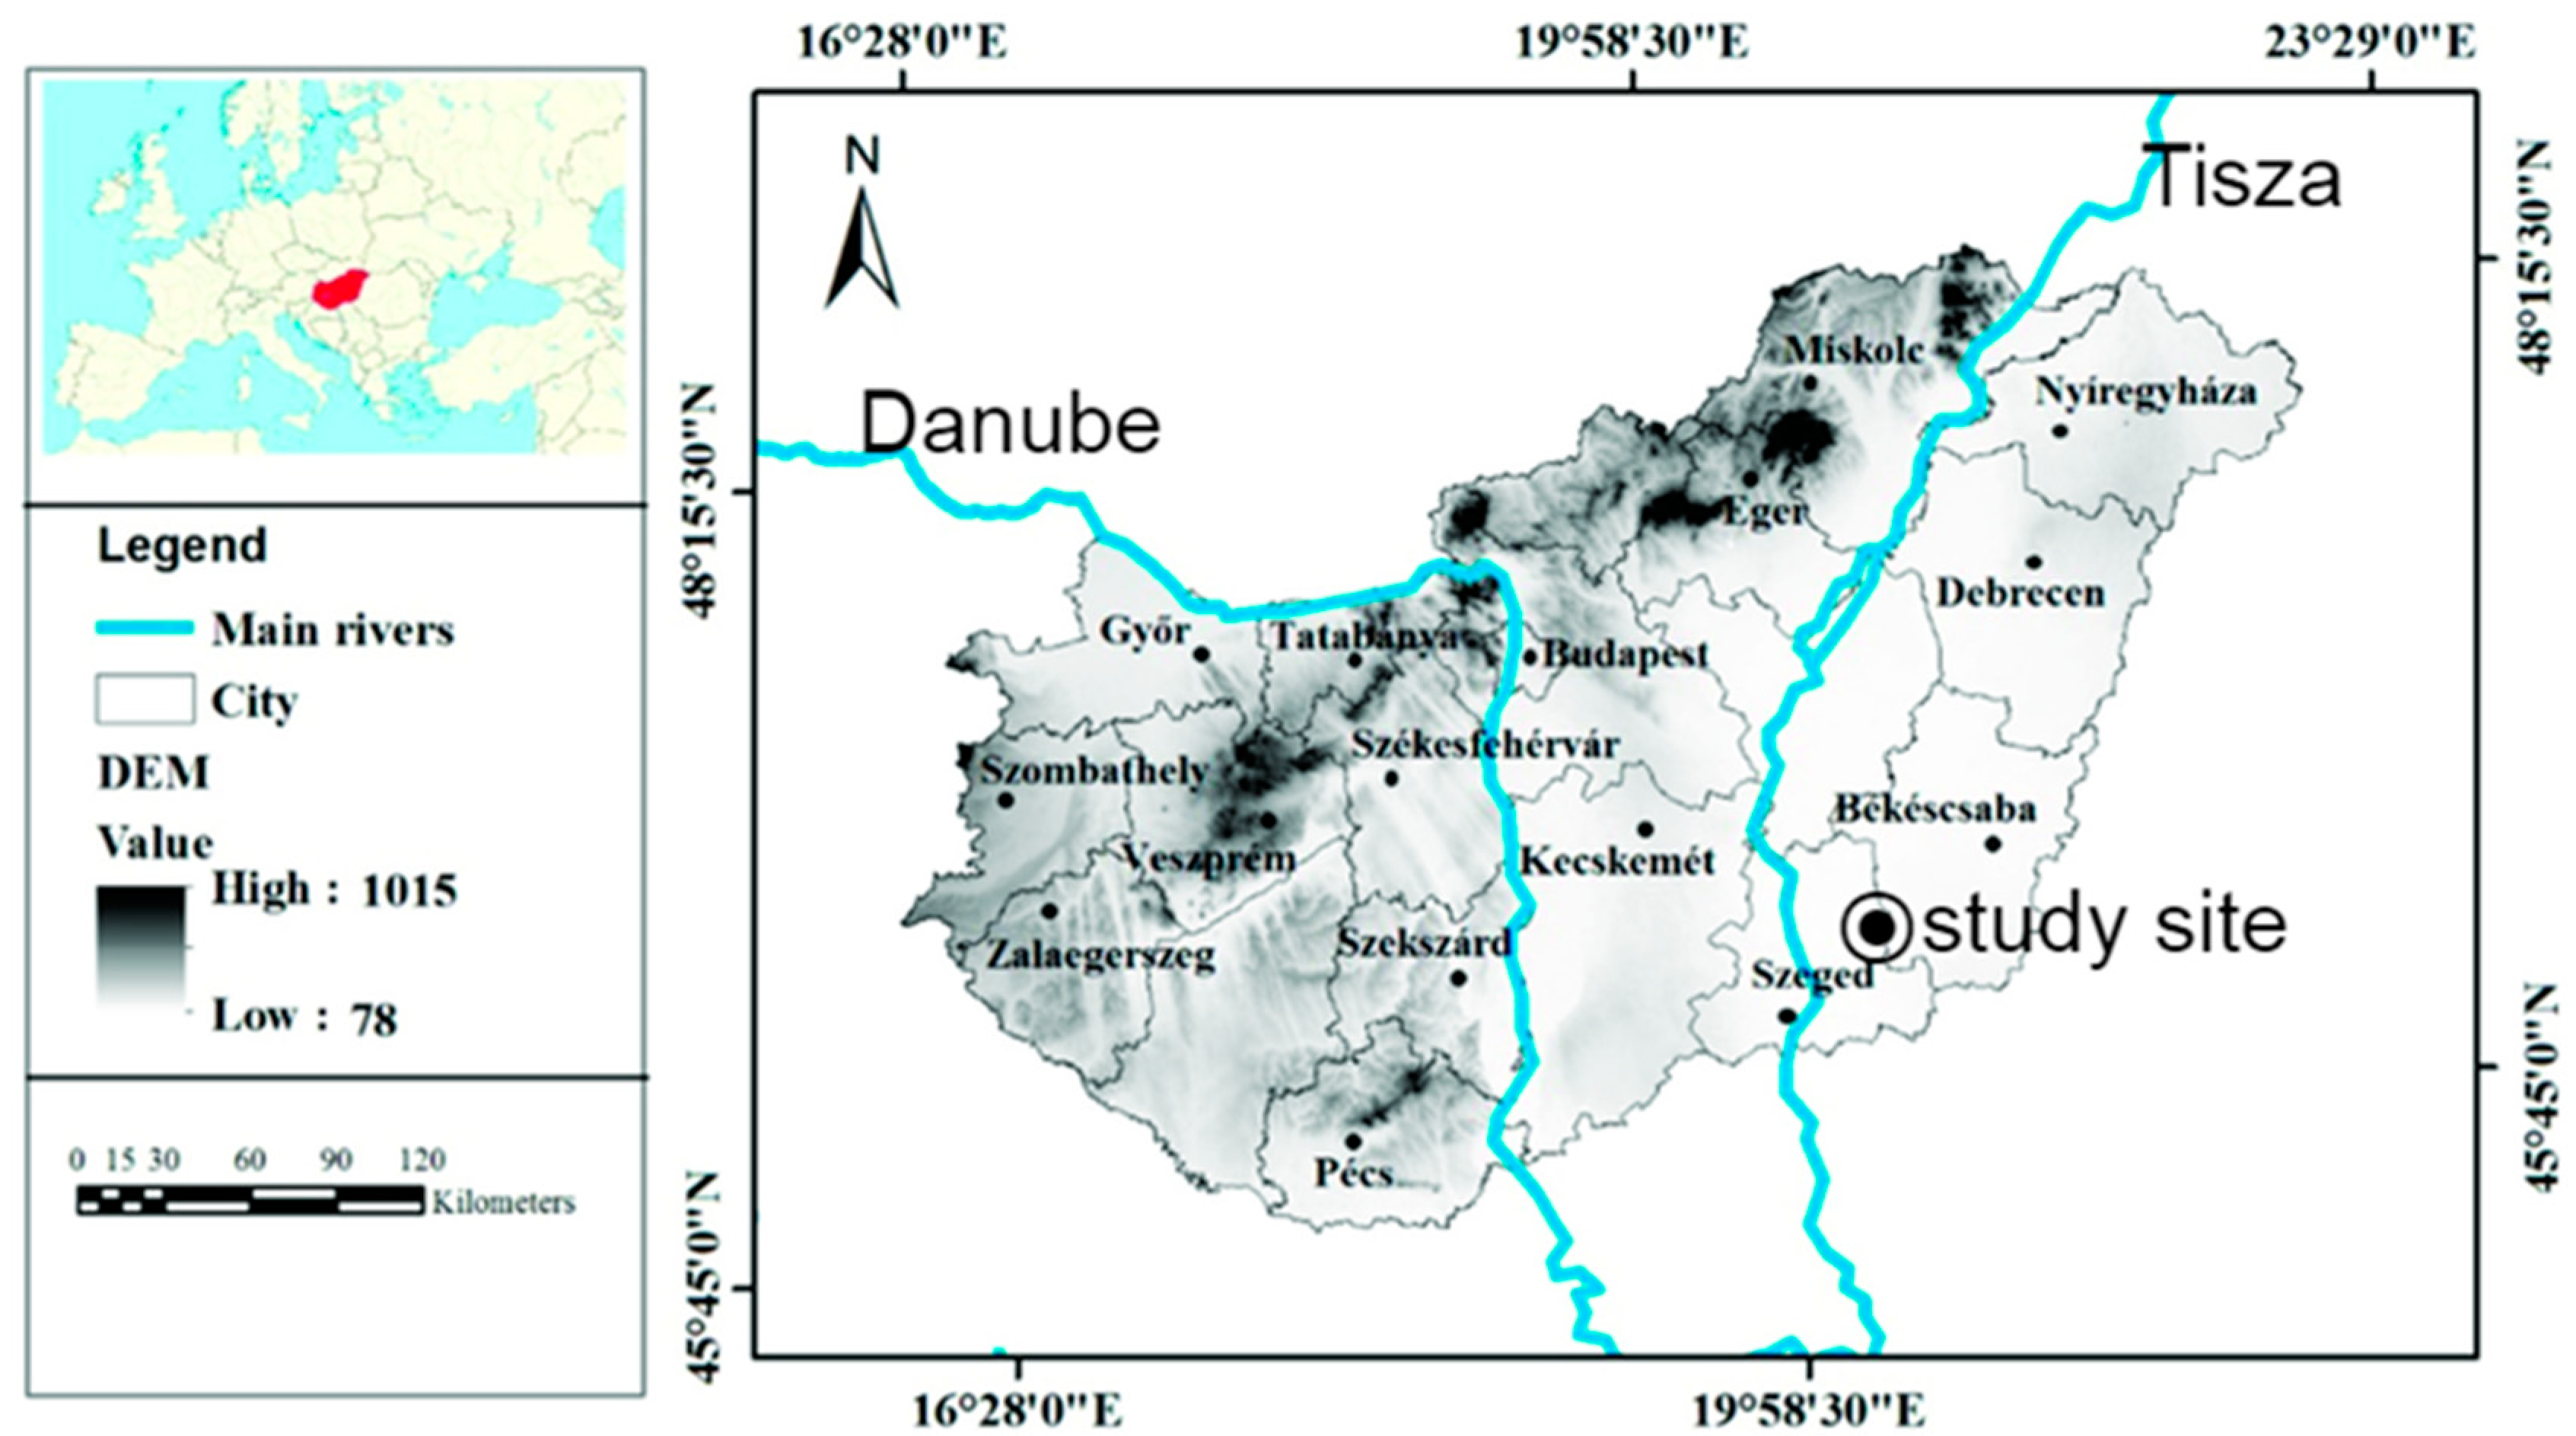
Figure 1. Study site in Kondoros, Hungary.
Agriculture 14 01340 g001
Figure 2. Maize at the end of June in 2021, 2022, and 2023.
Agriculture 14 01340 g002
Figure 3. Overview of the study Hydrus-2D model soil water content simulation process (adopted from [65]).
Agriculture 14 01340 g003
Figure 4. Meteorological conditions at the study site.
Agriculture 14 01340 g004
Figure 5. Maize NDVI and ETc as a function of elapsed time after sowing from 2021 to 2023 with (a), (b), and (c), respectively.
Agriculture 14 01340 g005
Figure 6. Soil water content at 10 cm and 60 cm depths was both measured and simulated during the 2021–2023 growing season.
Agriculture 14 01340 g006
Table 1. Soil data of the field during the vegetation period.
ParameterMeasured Mean Value
Sand content (%)44.00
Silt content (%)34.00
Clay content (%)22.00
Salt (% m/m)0.06
Soil pH (H2O)8.15
Soil CaCO3 (% m/m)8.80
Soil humus (% m/m)3.84
Soil bulk density (g/cm3)1.30
Soil temperature (°C)17.00
Table 2. Kc ranges for the years 2021–2023 on phenological crop growth stages.
YearStagePeriod, T [Days]Kc Range, [–]
2021Initial25th of April 2021–14th of May 20210.32–0.43
Crop development15th of May 2021–15th of June 20210.44–0.66
Mid-season16th of June 2021–2nd of August 20210.67–1.05
Late-season3rd of August 2021–27th of August 20210.52–0.16
2022Initial25th of April 2022–13th of May 20220.63–0.72
Crop development14th of May 2022–13th of June 20220.71–0.51
Mid-season (dry vegetation *)
Late-season (no vegetation *)
2023Initial25th of April 2023–19th of May 20230.19–0.42
Crop development20th of May 2023–13th of June 20230.43–0.84
Mid-season14th of June 2023–2nd of August 20231.08–0.51
Late-season3rd of August 2023–27th of August 20230.50–0.23
* Due to severe drought.
Table 3. Initial soil moisture content (V/V%).
Depth202120222023
10 cm23.521.422.8
60 cm32.228.032.8
Table 5. The parameter values utilized for predicting root water uptake (RWU) in the HYDRUS software [74,75,76,77].
ParameterValueDescription
P0−0.150Value of the pressure head [L] below which roots start to extract water from the soil (h1).
Popt−0.300Value of the pressure head [L] below which roots extract water at the maximum possible rate (h2).
P2H−3.250Value of the limiting pressure head [L] below which roots can no longer extract water at the maximum rate (assuming a potential transpiration rate of r2H) (h3hight).
P2L−6.000As above, but for a potential transpiration rate of r2L (h3low).
P3−80.000Value of the pressure head [L] below which root water uptake ceases (usually taken at the wilting point) (h4).
r2H0.005Potential transpiration rate [LT−1] (currently set at 0.5 cm/day) (Tp).
r2L0.001Potential transpiration rate [LT−1] (currently set at 0.1 cm/day) (Tp).
Table 6. Statistical metrics across different phenological stages.
StageDepth  (R2)NRMSE MAEMBERMSEMSE
2021
Initial10 cm  0.03
60 cm  0.10
14.42
6.00
2.47
1.57
2.47
1.32
3.24
1.94
9.56
3.75
Crop development10 cm  0.46
60 cm  0.14
12.36
6.30
2.90
1.88
1.08
1.88
3.31
2.07
10.97
4.29
Mid-season10 cm  0.42
60 cm  0.93
9.41
5.78
1.74
1.41
1.37
1.42
1.93
1.68
3.74
2.83
Late-season10 cm  0.48
60 cm  0.31
6.79
8.12
1.26
0.97
1.26
0.97
1.30
2.21
1.69
4.87
Full vegetation period10 cm  0.65
60 cm  0.85
11.23
5.72
2.06
1.47
0.66
1.43
2.47
1.73
6.11
2.98
2022
Initial10 cm  0.13
60 cm  0.81
17.71
0.95
2.86
0.79
2.78
0.79
3.96
0.95
1.57
0.90
Crop development10 cm  0.21
60 cm  0.68
10.04
6.89
2.02
1.65
1.36
1.65
2.11
1.85
4.44
3.41
Mid-season (dry vegetation *)
Late-season (no vegetation *)
Full vegetation period10 cm  0.51
60 cm 0.50
20.34
19.08
5.61
7.29
2.26
6.69
4.37
5.16
19.13
26.59
StageDepth  (R2)NRMSEMAEMBERMSEMSE
2023
Initial10 cm  0.48
60 cm  0.79
3.39
5.75
2.27
1.61
1.71
1.55
3.39
1.73
11.46
2.99
Crop development10 cm  0.22
60 cm  0.83
17.22
5.58
4.92
1.42
4.92
1.00
5.39
1.62
29.10
2.63
Mid-season10 cm  0.28
60 cm  0.78
12.36
7.998
2.36
2.18
1.77
2.18
12.36
2.23
10.28
4.96
Late-season10 cm  0.22
60 cm  0.55
7.63
6.06
1.249
1.47
1.45
1.47
1.46
1.61
2.12
2.60
Full vegetation period10 cm  0.38
60 cm  0.72
13.95
6.73
2.63
1.68
1.37
1.78
3.59
1.91
12.85
3.63
* Due to severe drought, maize necrotized.
Table 7. Cumulative precipitation and relative humidity in peak summer (June to August).
Meteorological ParameterPeriodQuantity of
the Parameter
Mean relative humidity (%)June to August 202173.1
Cummulative precipitation (mm)114.2
Mean relative humidity (%)June to August 202254.3
Cummulative precipitation (mm)88.5
Mean relative humidity (%)June to August 202370.6
Cummulative precipitation(mm)162.7
Disclaimer/Publisher’s Note: The statements, opinions and data contained in all publications are solely those of the individual author(s) and contributor(s) and not of MDPI and/or the editor(s). MDPI and/or the editor(s) disclaim responsibility for any injury to people or property resulting from any ideas, methods, instructions or products referred to in the content.