Article

Analysis of Moisture Migration and Microstructural Characteristic of Green Sichuan Pepper (Zanthoxylum armatum) during the Hot-Air Drying Process Based on LF-NMR

1
College of Intelligent and Manufacturing Engineering, Chongqing University of Arts and Sciences, Chongqing 402160, China
2
College of Engineering and Technology, Southwest University, Chongqing 400715, China
3
College of Engineering, South China Agricultural University, Guangzhou 510642, China
4
Key Laboratory of Agricultural Equipment Technology for Hilly and Mountainious Areas, Ministry of Agriculture and Rural Affairs, Chengdu 610066, China
*
Authors to whom correspondence should be addressed.
Agriculture 2024, 14(8), 1361; https://doi.org/10.3390/agriculture14081361
Submission received: 5 July 2024 / Revised: 7 August 2024 / Accepted: 10 August 2024 / Published: 14 August 2024
(This article belongs to the Section Agricultural Technology)

Abstract

:
To have a deeper understanding on the moisture migration patterns and microstructural changes of Green Sichuan Pepper during the hot-air drying process, the low-field nuclear magnetic resonance (LF-NMR) technology and scanning electron microscopy (SEM) methodology were adopted to analyze the moisture distribution, migration patterns and microscopic structural changes under different drying temperatures (45, 55 and 65 °C). The LF-NMR scanning results showed that the internal moisture of the Green Sichuan Pepper mainly includes bound water, immobilized water and free water, which can be respectively symbolized by the relaxation time ranges of T21 (0.1–10 ms), T22 (10–500 ms) and T23 (500–10,000 ms). The immobilized water accounts for 83.72% of the internal water, resulting in the significant drying difficulty of Green Sichuan Pepper. During the drying process, the content of immobilized water and free water exhibited a decreasing trend, while the bound moisture content initially increased and then decreased. In addition, the LF-NMR analysis showed that the parameters peak area A2 demonstrated a high correlation with the moisture content of Green Sichuan Pepper, enabling the prediction of moisture content changes during the drying process. Additionally, the SEM results showed that the pore degree and pore density on the pericarp surface of Green Sichuan Pepper perform significant changes during the drying process, which might be a good explanation for revealing some commonly recognized drying phenomena on Green Sichuan Pepper hot-air drying. In summary, the findings presented in the present work provide some new insights into the moisture distribution, migration patterns and microstructural changes of Green Sichuan Pepper, which can offer theoretical guidance for optimizing the drying process of Green Sichuan Pepper.

1. Introduction

Green Sichuan Pepper (Zanthoxylum armatum), also known as Chinese prickly ash, is widely cultivated in the southwestern regions of China, particularly in Sichuan and Chongqing provinces, belonging to the Rutaceae family of plants [1]. Owing to the fact that the Green Sichuan Pepper is rich in flavonoids [2] and polysaccharides [3], which have significant antioxidant and antibacterial properties [4,5], it is widely used in fields of food flavoring and traditional Chinese medicine [6,7].
Drying is the key process in Green Sichuan Pepper postpartum production, which can effectively prevent the newly harvested products from being mildewy and extend its shelf life. Though there are various emerging drying technologies (e.g., vacuum drying, infrared drying, high-voltage electric field drying, etc.) that have been used in Green Sichuan Pepper drying, hot-air drying stands out as a widely adopted method due to its simplicity, low operational costs and high material processing capacity. It is widely used in laboratory-scale drying experiments [8,9] and industrial-scale drying production [10,11]. In recent years, researchers around the world have conducted significant studies on Green Sichuan Pepper hot-air drying process optimization [12], related hot-air drying device design [13] and macro drying kinetics [14]. However, few works have been focused on the comprehensive analysis of moisture migration dynamics within the pepper samples during the hot-air drying process; while the micro moisture migration dynamics are key factors affecting the macro drying kinetics of the samples, the macro drying kinetics are the key to achieving intelligent control of the drying process, avoiding over- or underdrying, as well as reducing the energy consumption of the drying process. Therefore, it is of great significance to have a deeper understanding of the moisture’s presence, distribution and temporal changes throughout the drying process for developing optimal drying protocols and enhancing the quality of the dried products.
LF-NMR technology is a fundamental analytical technique in food science research. Due to its characteristics of non-destructive rapidity, high precision, and strong sensitivity, LF-NMR is widely applied in characterizing the microstructure of materials, internal moisture phases, and distribution patterns [15,16]. By measuring parameters such as transverse relaxation time (T2) values, magnetic resonance signal intensity and the areas and ratios of various inversion peaks, LF-NMR can provide valuable insights into the moisture phases, distribution and content within materials. Consequently, LF-NMR stands as a useful tool for investigating moisture distribution and migration dynamics during agricultural product drying processes [17,18]. For example, Tan et al. [19] adopted LF-NMR technology to investigate the moisture variation rule during the horseshoe crisps drying process; the results showed that only a small amount of immobile and bound water remains in the slices at the end of drying. Ren et al. [20] explored the moisture states and distribution changes in black fungus under various drying temperatures by applying LF-NMR technology; in detail, the moisture states and distribution changes in black fungus were characterized by identifying movement direction of the peak value T23 corresponding to the “free water” and the fusion index between “free water peak area A23” and “immobile water peak area A22” under different drying temperatures. The results showed that the rate at which “free water” transforms into “immobile water” increases with the increase of drying temperature. Liu et al. [21] employed LF-NMR to analyze the moisture distribution characteristics in radish pieces at different drying stages; the variations of transverse relaxation time peak values corresponding to the “free water”, “immobile water” and “bound water” with drying time were investigated, and the results showed that after the first 120 min, the “free water” reduces rapidly, which reveals that the macro drying rate is high at the initial drying stage. Overall, it can be summarized from the above analysis that LF-NMR performs well in investigating the moisture status and distribution in the drying process of agricultural products, and can be applied to reveal the moisture migration characteristics of Green Sichuan Pepper during the hot-air drying process.
To get a better recognition of the Green Sichuan Pepper physical property changes and migration patterns of internal moisture during the hot-air drying process, LF-NMR technology is adopted to investigate the moisture migration characteristics of the pepper under the different hot-air drying temperatures of 45, 55 and 65 °C. In detail, the parameters of transverse relaxation time (T2), magnetic resonance signal amplitude and inversion peak areas during the hot-air drying process were measured and analyzed under different drying temperatures. In addition, the variations of the sample microstructure with drying temperature were also comprehensively investigated by applying SEM technology, with the aim of providing theoretical support for optimizing subsequent hot-air drying processes and the designing of the related drying equipment.

2. Materials and Methods

2.1. Experiment Materials

Green Sichuan Peppers used in the present work were newly harvested in June 2023 from Jiangjin District, Chongqing, China. The fresh Green Sichuan Pepper fruits were pretreated by removing branches, leaves, and thorns, and the fruits without obvious damage and mold were selected as experimental samples. The selected Green Sichuan Pepper samples were cleaned with distilled water, the surface moisture was removed with absorbent paper and the samples were placed in resealable pouches (BKMAM, 20 × 32 cm) and stored in a refrigerator at 4 ± 1 °C. Meanwhile, the initial moisture content of the samples was determined to be 70%w.b. using 105 °C methodology [13].

2.2. Experiment Instruments and Equipment

In the present work, the hot-air drying experiments were conducted in a laboratory scale apparatus, while the dried samples were analyzed and measured by a low field magnetic resonance imaging analyzer. The details of the experimental equipment adopted in the present work are tabulated in Table 1.

2.3. Experiment Methods

2.3.1. Experimental Operation

Prior to the experiment, the hot-air drying equipment was preheated for 30 min. Meanwhile, the samples were removed from the refrigerator and placed in a laboratory environment. When the parameters of the drying equipment reached the predetermined values and remained stable, 100 g of uniformly sized Green Sichuan Peppers showing no signs of discoloration or spoilage were selected and weighed out, and spread in a single layer on a sample sieve. The sieve containing the Green Sichuan Peppers was placed into the thin-layer hot-air dryer to commence the drying process. The samples were dried under drying temperatures of 45, 55 and 65 °C with a constant air velocity of 1.5 m/s. Each experiment was conducted three times, and the average value was used for further analysis. During each experiment, approximately 10 g of pepper samples were swiftly removed every 30 min interval, and 5 g of these samples were used for moisture content measurement, while the remaining samples were cooled down to the room temperature and prepared for further analysis. In addition, the final moisture content of the dried samples was considered to be 10%w.b. [22,23] in the present work.

2.3.2. Low-Field Nuclear Magnetic Resonance Detection

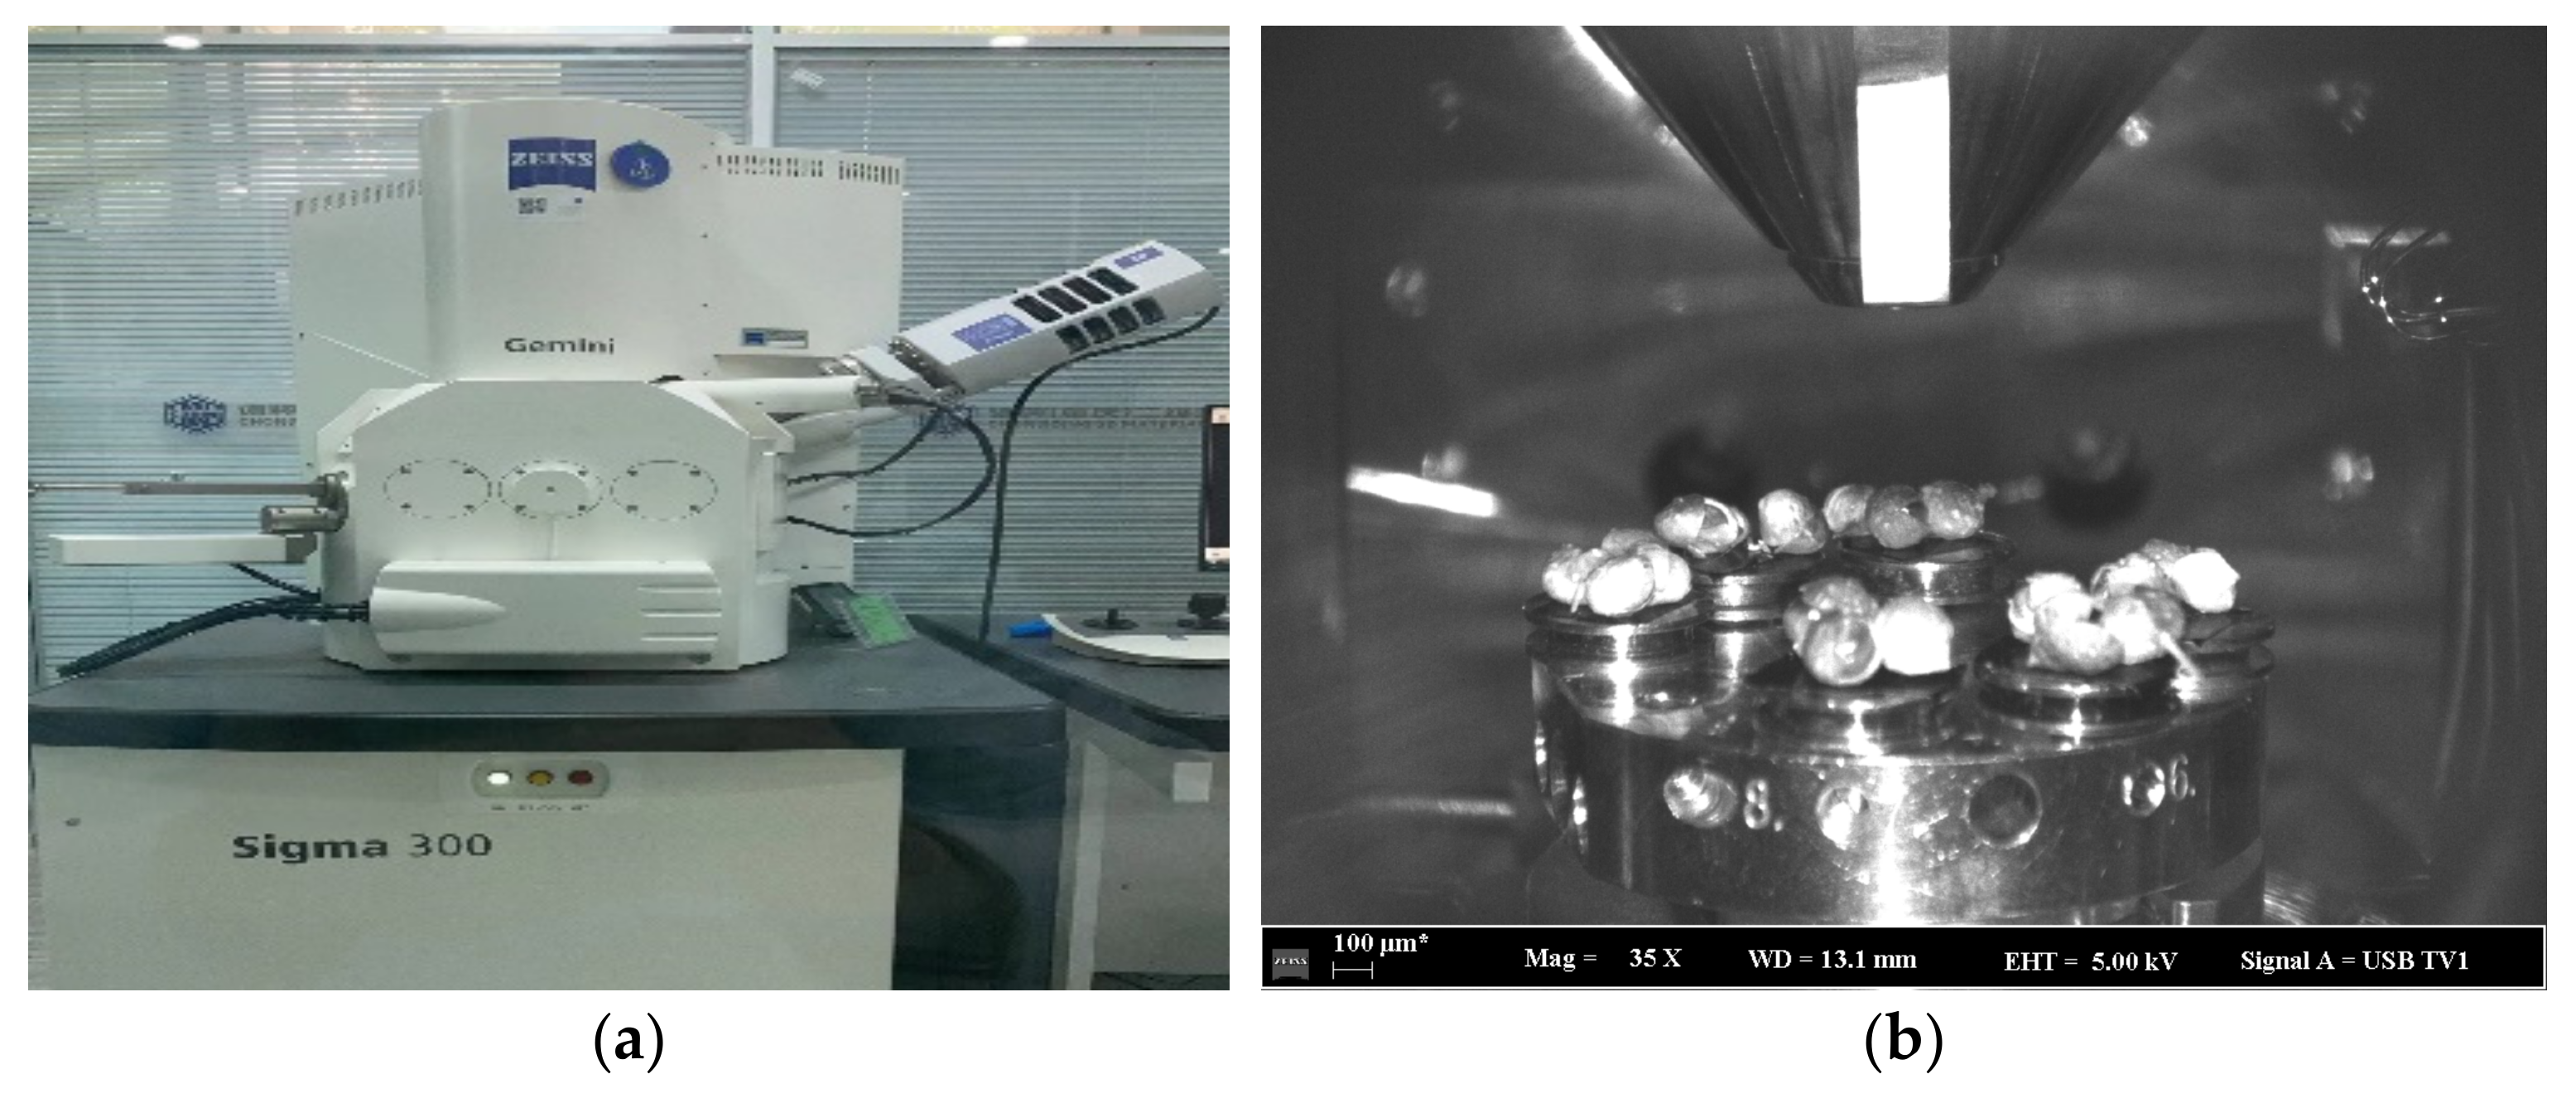
The scene graph of the LF-NMR analyzer and the sample are shown in Figure 1a,b, respectively. To ensure temperature stability, the analyzer’s temperature control system was activated 24 h before the LF-NMR tests to make the magnet temperature gradually reach the set temperature (32 ± 0.01 °C), which is crucial for maintaining consistent magnetic field strength, and thus accurate measurement results. Moreover, using a standard sample provided by the manufacturer, the analyzer was calibrated and confirmed by debugging the fundamental sequence parameters of center frequency, 90° pulse width, 180° pulse width, radiofrequency (RF) delay and waiting time. Based on the calibrated sequence, the parameters of sampling frequency, analog gain, digital gain, preamplifier setting, waiting time, number of accumulations, echo time and number of echoes were further ascertained to be 100 kHz, 10 dB, 2, 1, 0.01 ms, 5, 0.1 ms and 10, respectively.
The 9 sets of experimental dried samples were tested by the analyzer based on the above calibrated LF-NMR analyzer, and the test data were recorded and inverted to extract signal intensities, relaxation times, peak areas, peak ratios and peak determination times for each sample at every trial time. In addition, each test was conducted three times under same conditions and the average data were used for the analysis.

2.3.3. Sample Microstructure Analysis

To reveal the microstructural variation characteristics of the dried sample, the microstructure of the sample under different drying temperatures was investigated by a scanning electron microscope (SEM) analyzer; the scene graph of the SEM analyzer and the prepared sample are shown in Figure 2a, and Figure 2b, respectively. During the test, the gold sputter-coated samples were placed on the SEM observation stage, and measured under the magnification of 10,000 times.

3. Analysis of Internal Moisture Distribution and Migration Patterns during Drying of Green Sichuan Pepper

3.1. Moisture State and Distribution of Fresh Green Sichuan Pepper

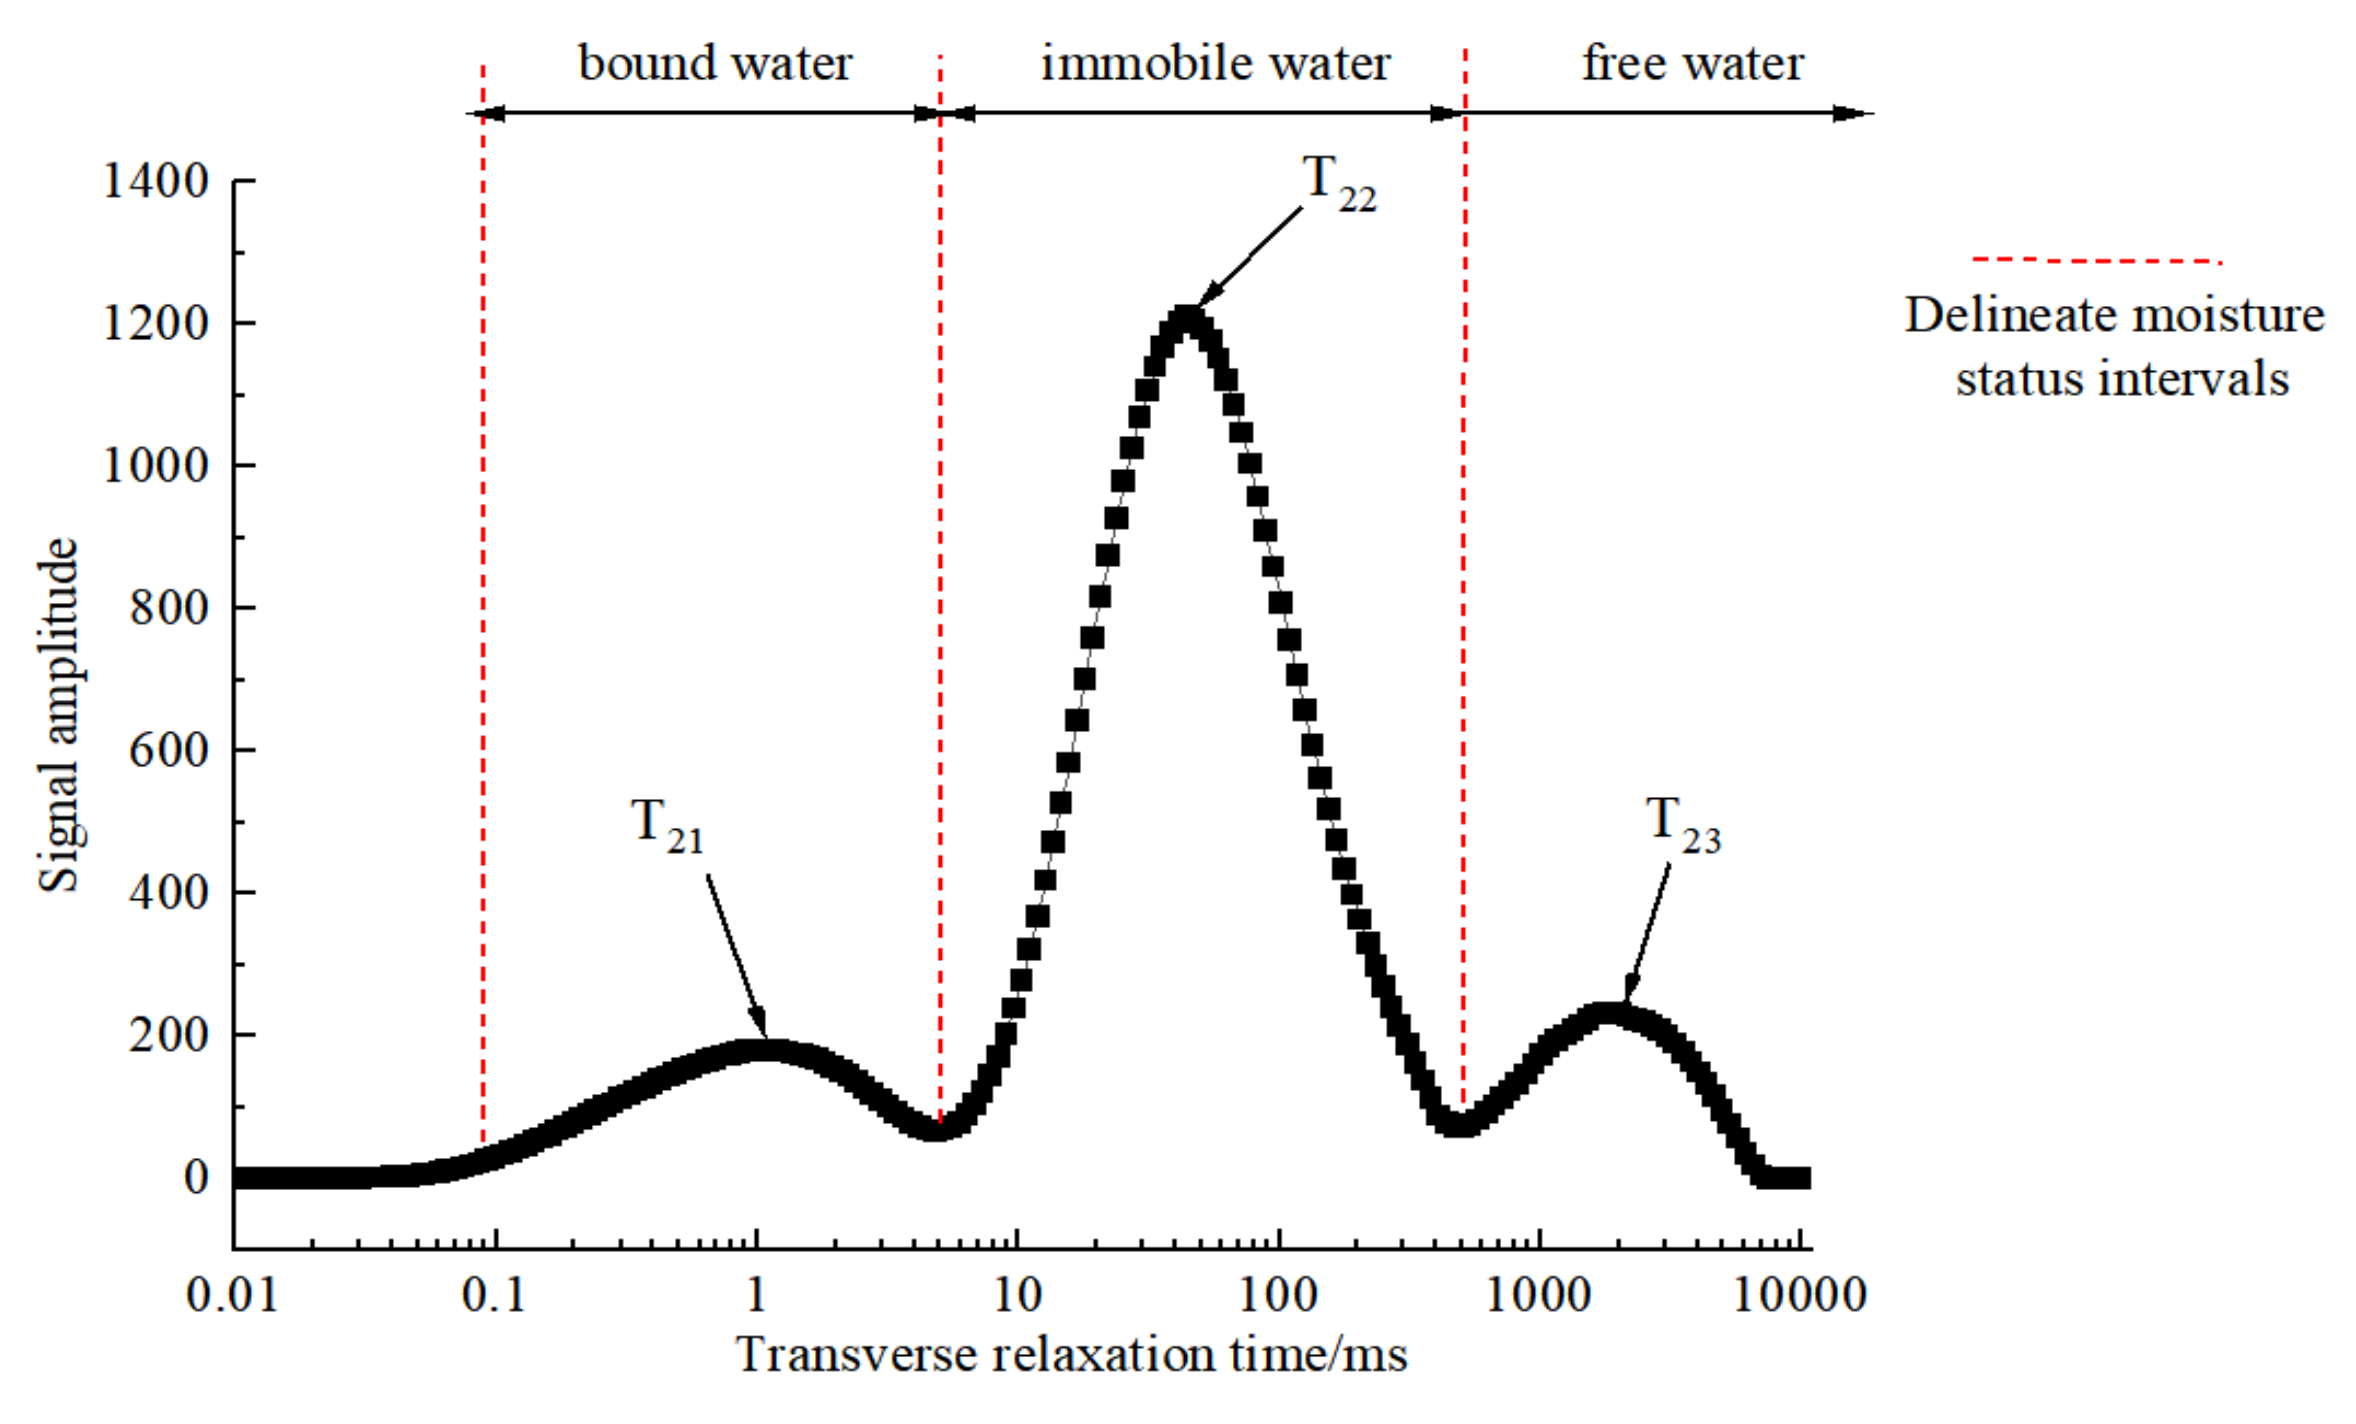
To have a fundamental understanding of the initial moisture distribution state of the fresh Green Sichuan Pepper sample, the variations of transverse relaxation time with signal amplitude of the scanner were investigated and are depicted in Figure 3. As can be observed from Figure 3, there are three distinct peaks after inversion processing, which can be respectively symbolized by the relaxation time ranges of T21 (0.1–10 ms), T22 (10–500 ms) and T23 (500–10,000 ms), indicating that there are three different states of water molecules within the fresh Green Sichuan Pepper; similar findings have been reported in the inversion spectra of kiwifruit [24], peanuts [25], yams [26], and chestnuts [27]. Aligned with the definition in the above-mentioned literature, the hydrogen protons in each relaxation time represent a specific moisture state. The water state in T21 was defined as “bound water”; the water molecule in this state is tightly associated with the internal adsorption site of the sample, and thus exhibits low activity and mobility [28]. The water state in T22 was defined as “immobile water”, where the water molecule in the state is restricted by the internal cellular structure of the sample, and thus shows reduced mobility. The water state in T23 was defined as “free water”, where the water molecules showed high activity and can be easily transported. However, different with the findings of a fourth peak in star anise seed reported by Wen Yaxin et al. [29], there are only three peaks in the inversion spectra of the Green Sichuan Pepper, which might due to the sensitivity limitation of the LF-NMR analyzer or the low concentration of lipid substances in the fresh Green Sichuan Pepper sample.
Moreover, according to the principles of LF-NMR, the peak area (Ai) in the inversion spectrum can directly reflect the amount of water in the corresponding state. Accordingly, it can be obviously seen from Figure 3 that the peak area of T22 (A22) is the largest, followed by the peak area of T21 (A21), and the peak area of T23 (A23) is the smallest among the three ranges. A21, A21 and A21 account for 11.44%, 83.72% and 4.84%, respectively, of the total spectrum area of the fresh sample, which indicates that the main state of the water in fresh Green Sichuan Pepper is “immobile water”, where water molecules are more tightly bound to other molecules within the pepper. Consequently, most of the drying process for Green Sichuan Pepper is characterized by a reduced drying rate, with a short or nonexistent accelerated drying phase.

3.2. Variation of Moisture Migration during Hot-Air Drying

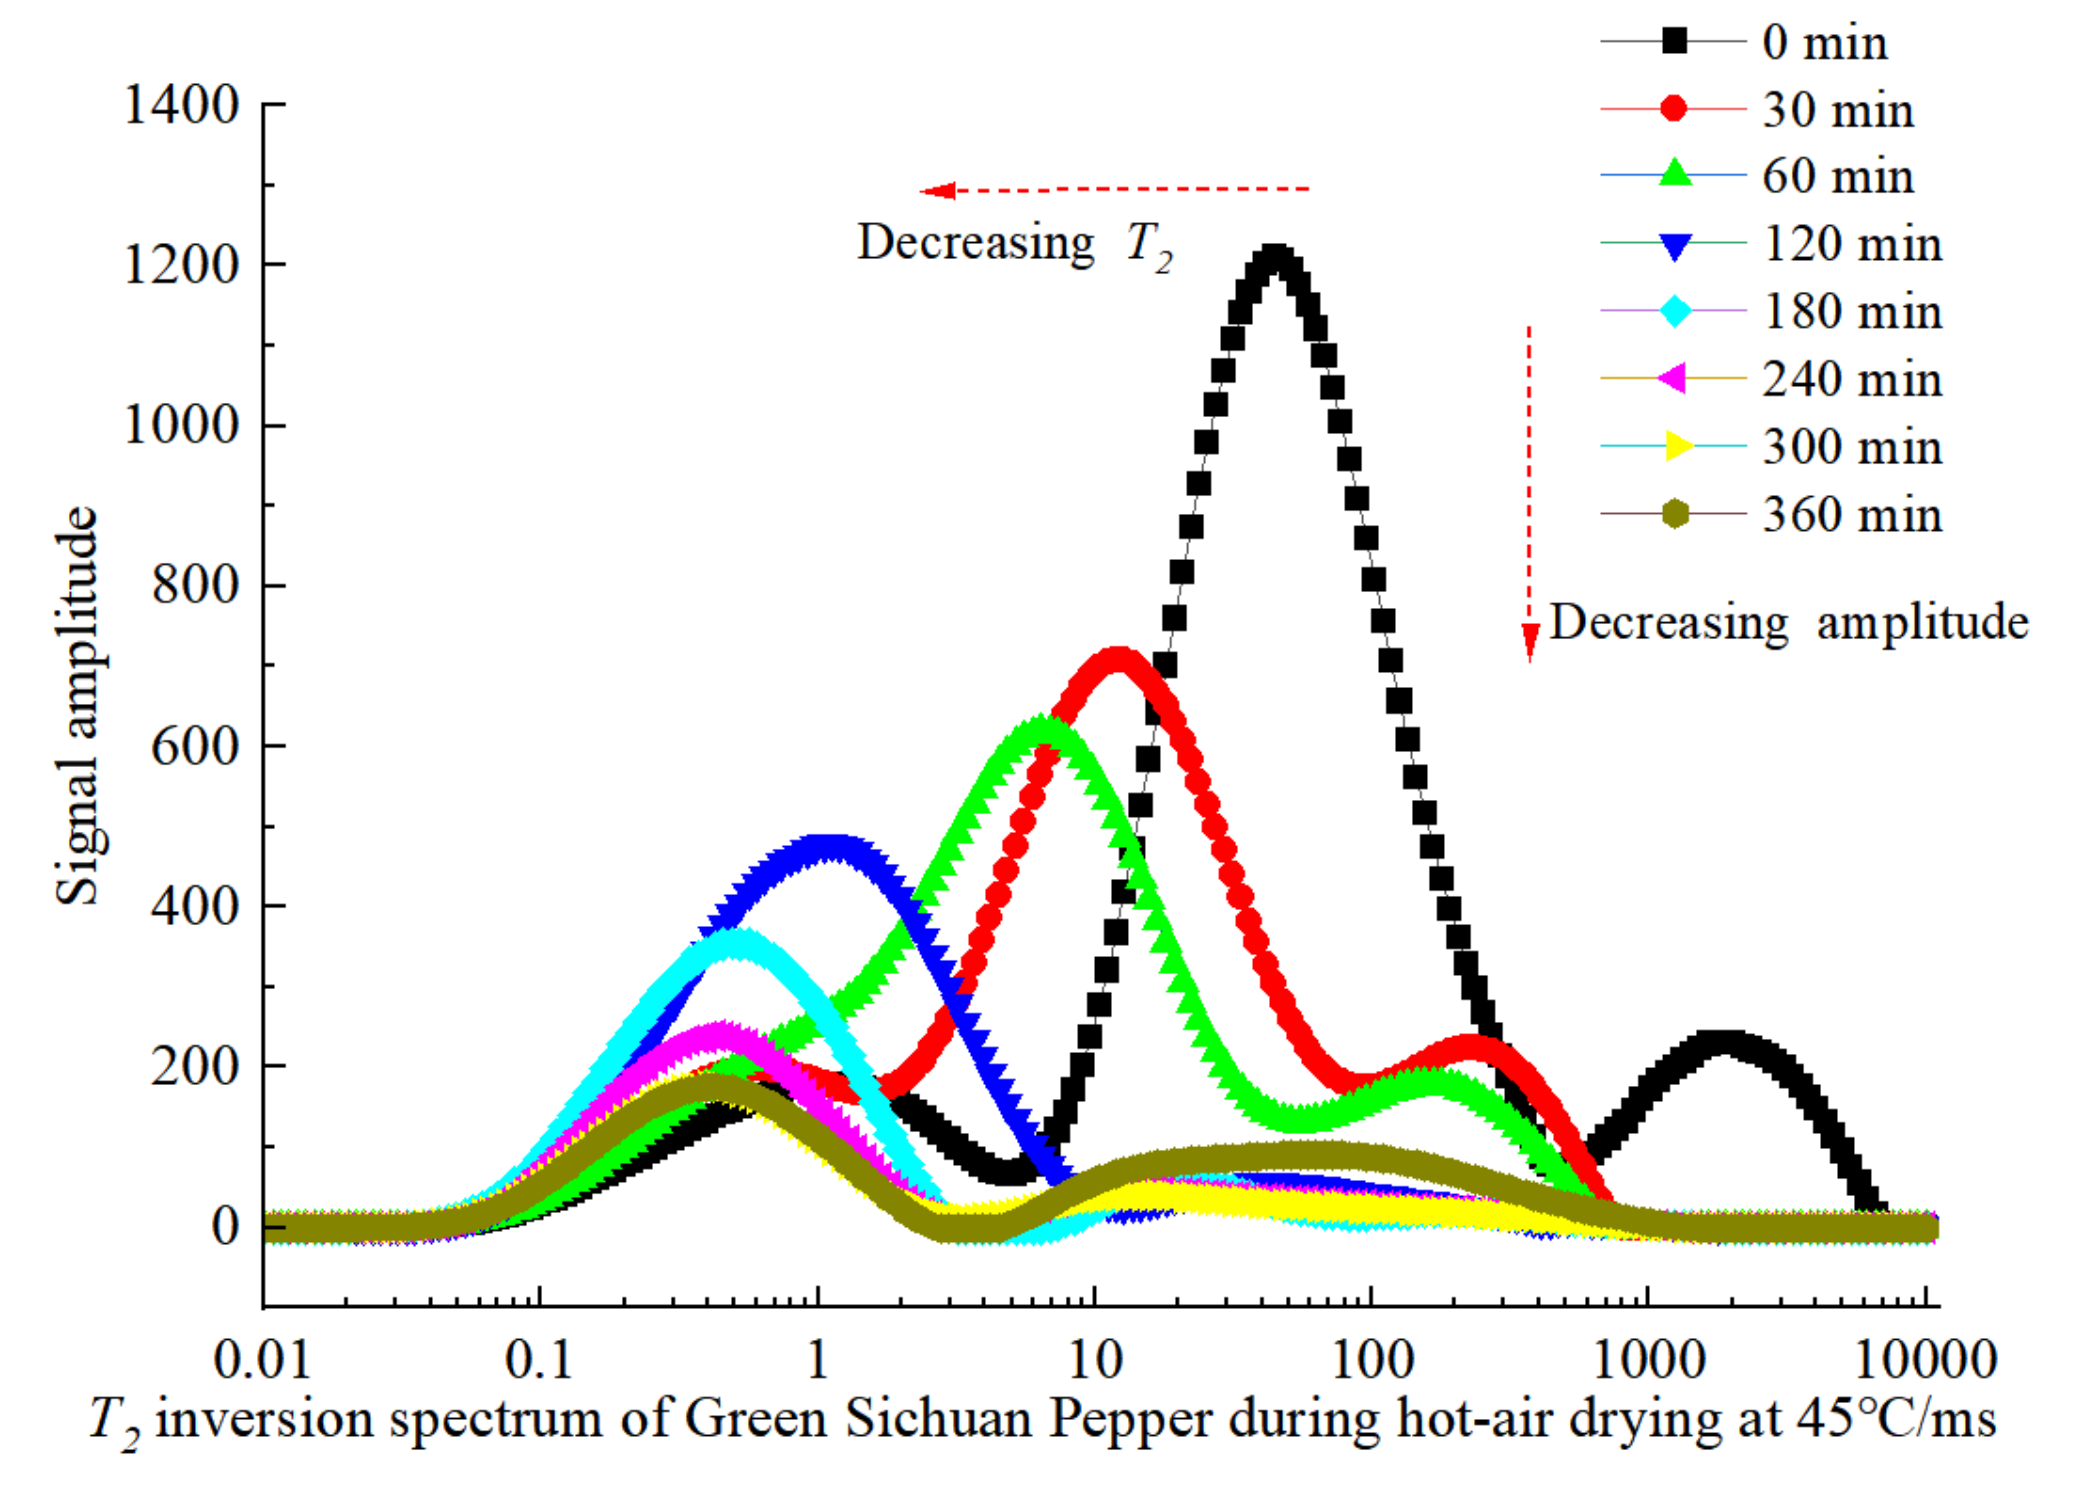
The dried samples under drying temperatures of 45, 55 and 65 °C were respectively analyzed by the LF-NMR analyzer, and the experimental data showed similar trends in the changes of T2 inversion spectra for the three sets of samples. Therefore, the T2 inversion spectrum of the samples during the drying process at 45 °C was adopted as the representative case to investigate the moisture migration and changes within Green Sichuan Pepper during the drying process. The variations of transverse relaxation time with signal amplitude during the drying process at 45 °C are depicted in Figure 4.
As can be seen from Figure 4, with an increase in drying duration, the peaks on the relaxation curves corresponding to the transverse relaxation times T2 and their peak values undergo marked changes, and T21, T22 and T23 show a leftward (decreasing) shift. This demonstrates that as the drying progresses, the moisture content and mobility within the Green Sichuan Pepper gradually decrease, leading to tighter binding of internal water molecules to other molecules, thereby reducing the freedom of the internal moisture and increasing the difficulty of moisture migration. On the other hand, the moisture migration difficulty at the end of the drying process may also be caused by the surface hardening phenomenon; similar findings have also been reported by Liu et al. in carrot drying process [21]. Furthermore, during the drying process, significant reductions of the signal peak values for the free water and bound water (T23, T22) are observed, where the relative content decreasing by more than 95%, indicating that the primary reduced moisture state are the “free water” and “immobile water”. Moreover, the immobile water significantly decreases after a period of drying (30 min); the peak area characterizing the bound moisture content (A22) dropped from 37,434 to 1475 from the initial to the end of the drying process, which indicates that the water activity as well as the water transport rate gradually decreases with the increase of drying time. This phenomenon is related, on one hand, to the gradual decrease in moisture content of Green Sichuan Pepper during hot-air drying, and on the other hand to changes in the interactions between water and other macromolecules. During the first 60 min, there is a partial fusion phenomenon between the free water peak area A23 and the immobile water peak area A22, indicating that the free water inside the Green Sichuan Pepper is transformed into immobile water; similar fusion phenomena have been reported in black fungus heat pump drying processes [20] and radish pieces low pressure superheated steam drying processes [21]. During the whole drying process, immobile water is simultaneously converted into bound water, driven by the moisture gradient formed internally. Throughout the drying process, the relative content of bound water increases with the increase of the drying time. In the latter stages of drying (240–360 min), the main moisture state in Green Sichuan Pepper is bound water, which exhibits a relatively stable state, and is thus generally resistant to removal from the sample. As can be observed from Figure 4, the variations in the T2 values are much more pronounced within the first 0 to 120 min interval compared to the 120 to 360 min interval, indicating a slowdown in moisture migration speed and a gradual decrease in the drying rate of Green Sichuan Pepper during the later stages of the process.

3.3. Effect of Hot Air Temperature on the Moisture Distribution and Migration Pattern of Green Sichuan Pepper

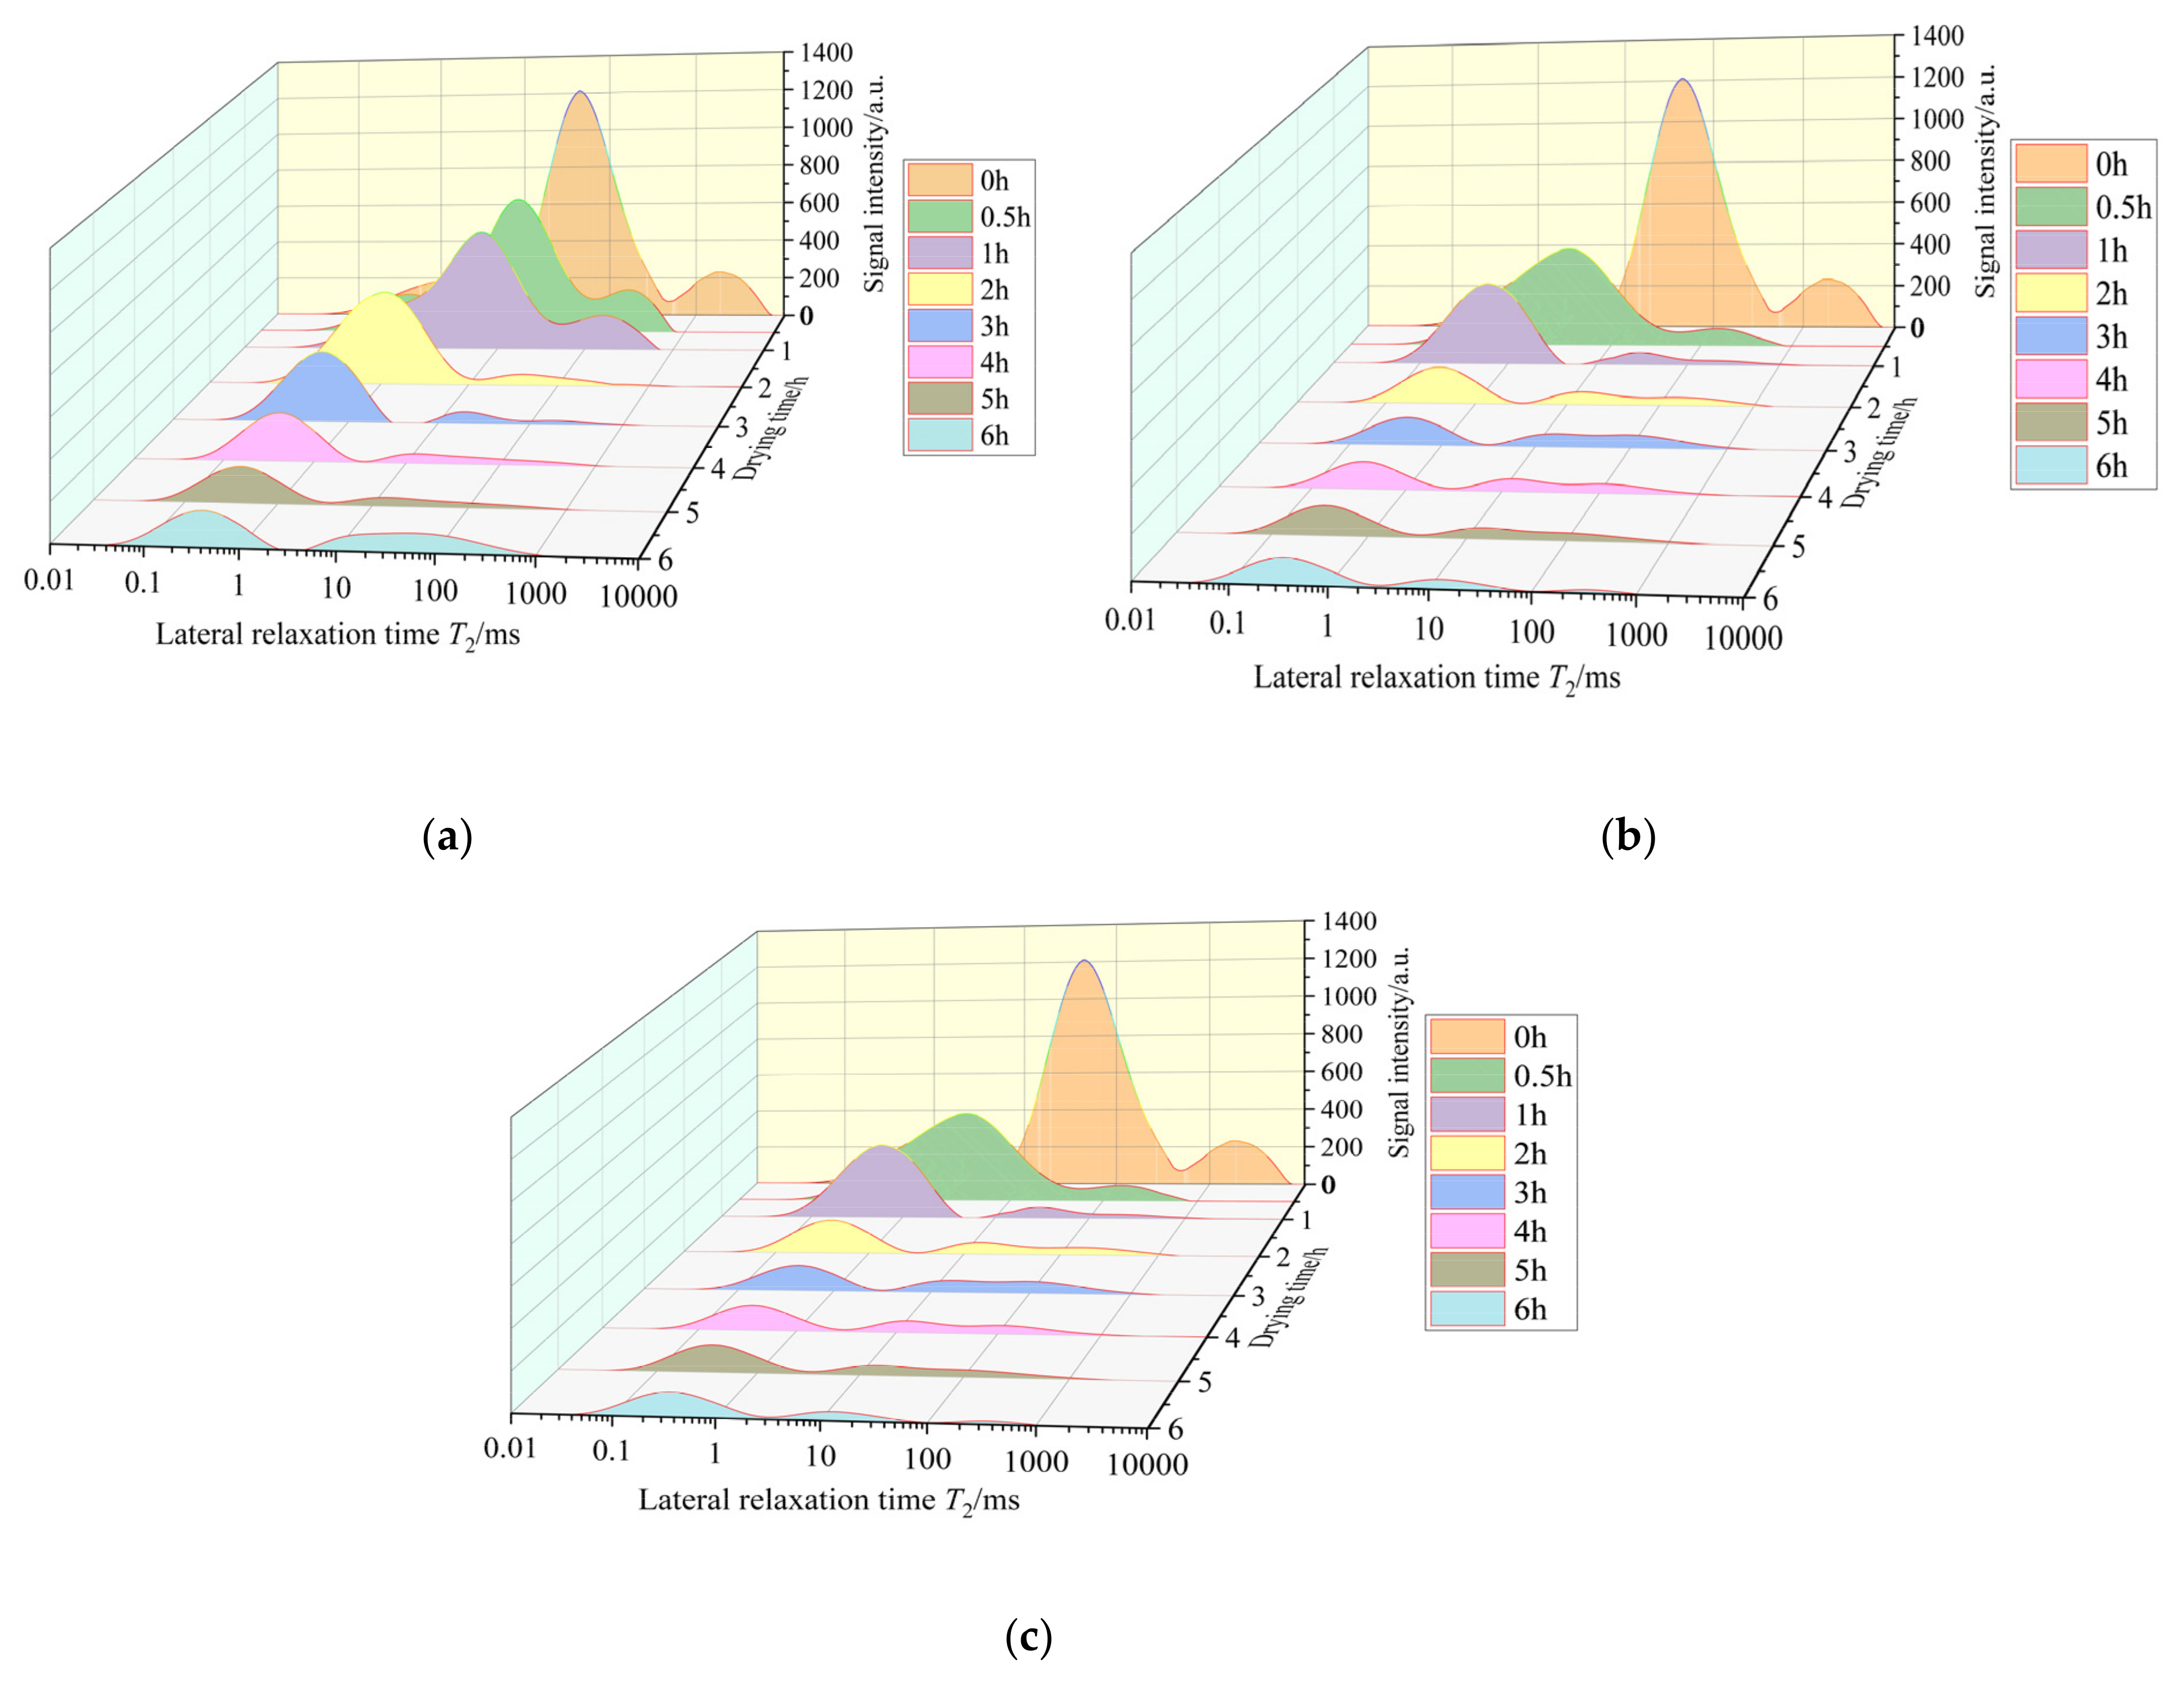
The LF-NMR spectra of Green Sichuan Pepper at different internal water states under varying temperatures are depicted in Figure 5. It can be seen from the Figure that the signal amplitude for T23 significantly decreases within the ranges of 0–2 h, 0–1 h and 0–1 h at temperatures of 45, 55 and 65 °C, respectively, while the signal amplitude for T22 significantly decreases within 0–4 h, 0–3 h and 0–2 h, respectively. The rate at which the T2 value shifts leftward increases with the increase of drying temperature, indicating that higher temperatures enhance the evaporation of free water and accelerate the conversion of immobile water to bound water. At a drying duration of 6 h, the A21 value corresponds to the hot air temperature in an ascending order is 65 °C < 55 °C < 45 °C, implying that a higher temperature enhances the transformation of immobile water to bound water, but also reduces the overall content of bound water, thus primarily facilitating the removal of free and immobile water. Furthermore, it can be also observed from Figure 5 that the water states show significant differences in the early stages of drying at different temperatures, while they tend to converge in the mid and late drying stages, indicating that the influence of hot air temperature on the drying process is predominantly at the initial drying stage. In addition, it can be also seen from Figure 5b,c that T22, which characterized the immobile water, shows significant reduction at the drying temperatures of 65 °C, while the migration of immobile water may lead to cell shrinkage, pore formation and collapse of cell and pore structures, further leading to a serious impact on dried quality [30].
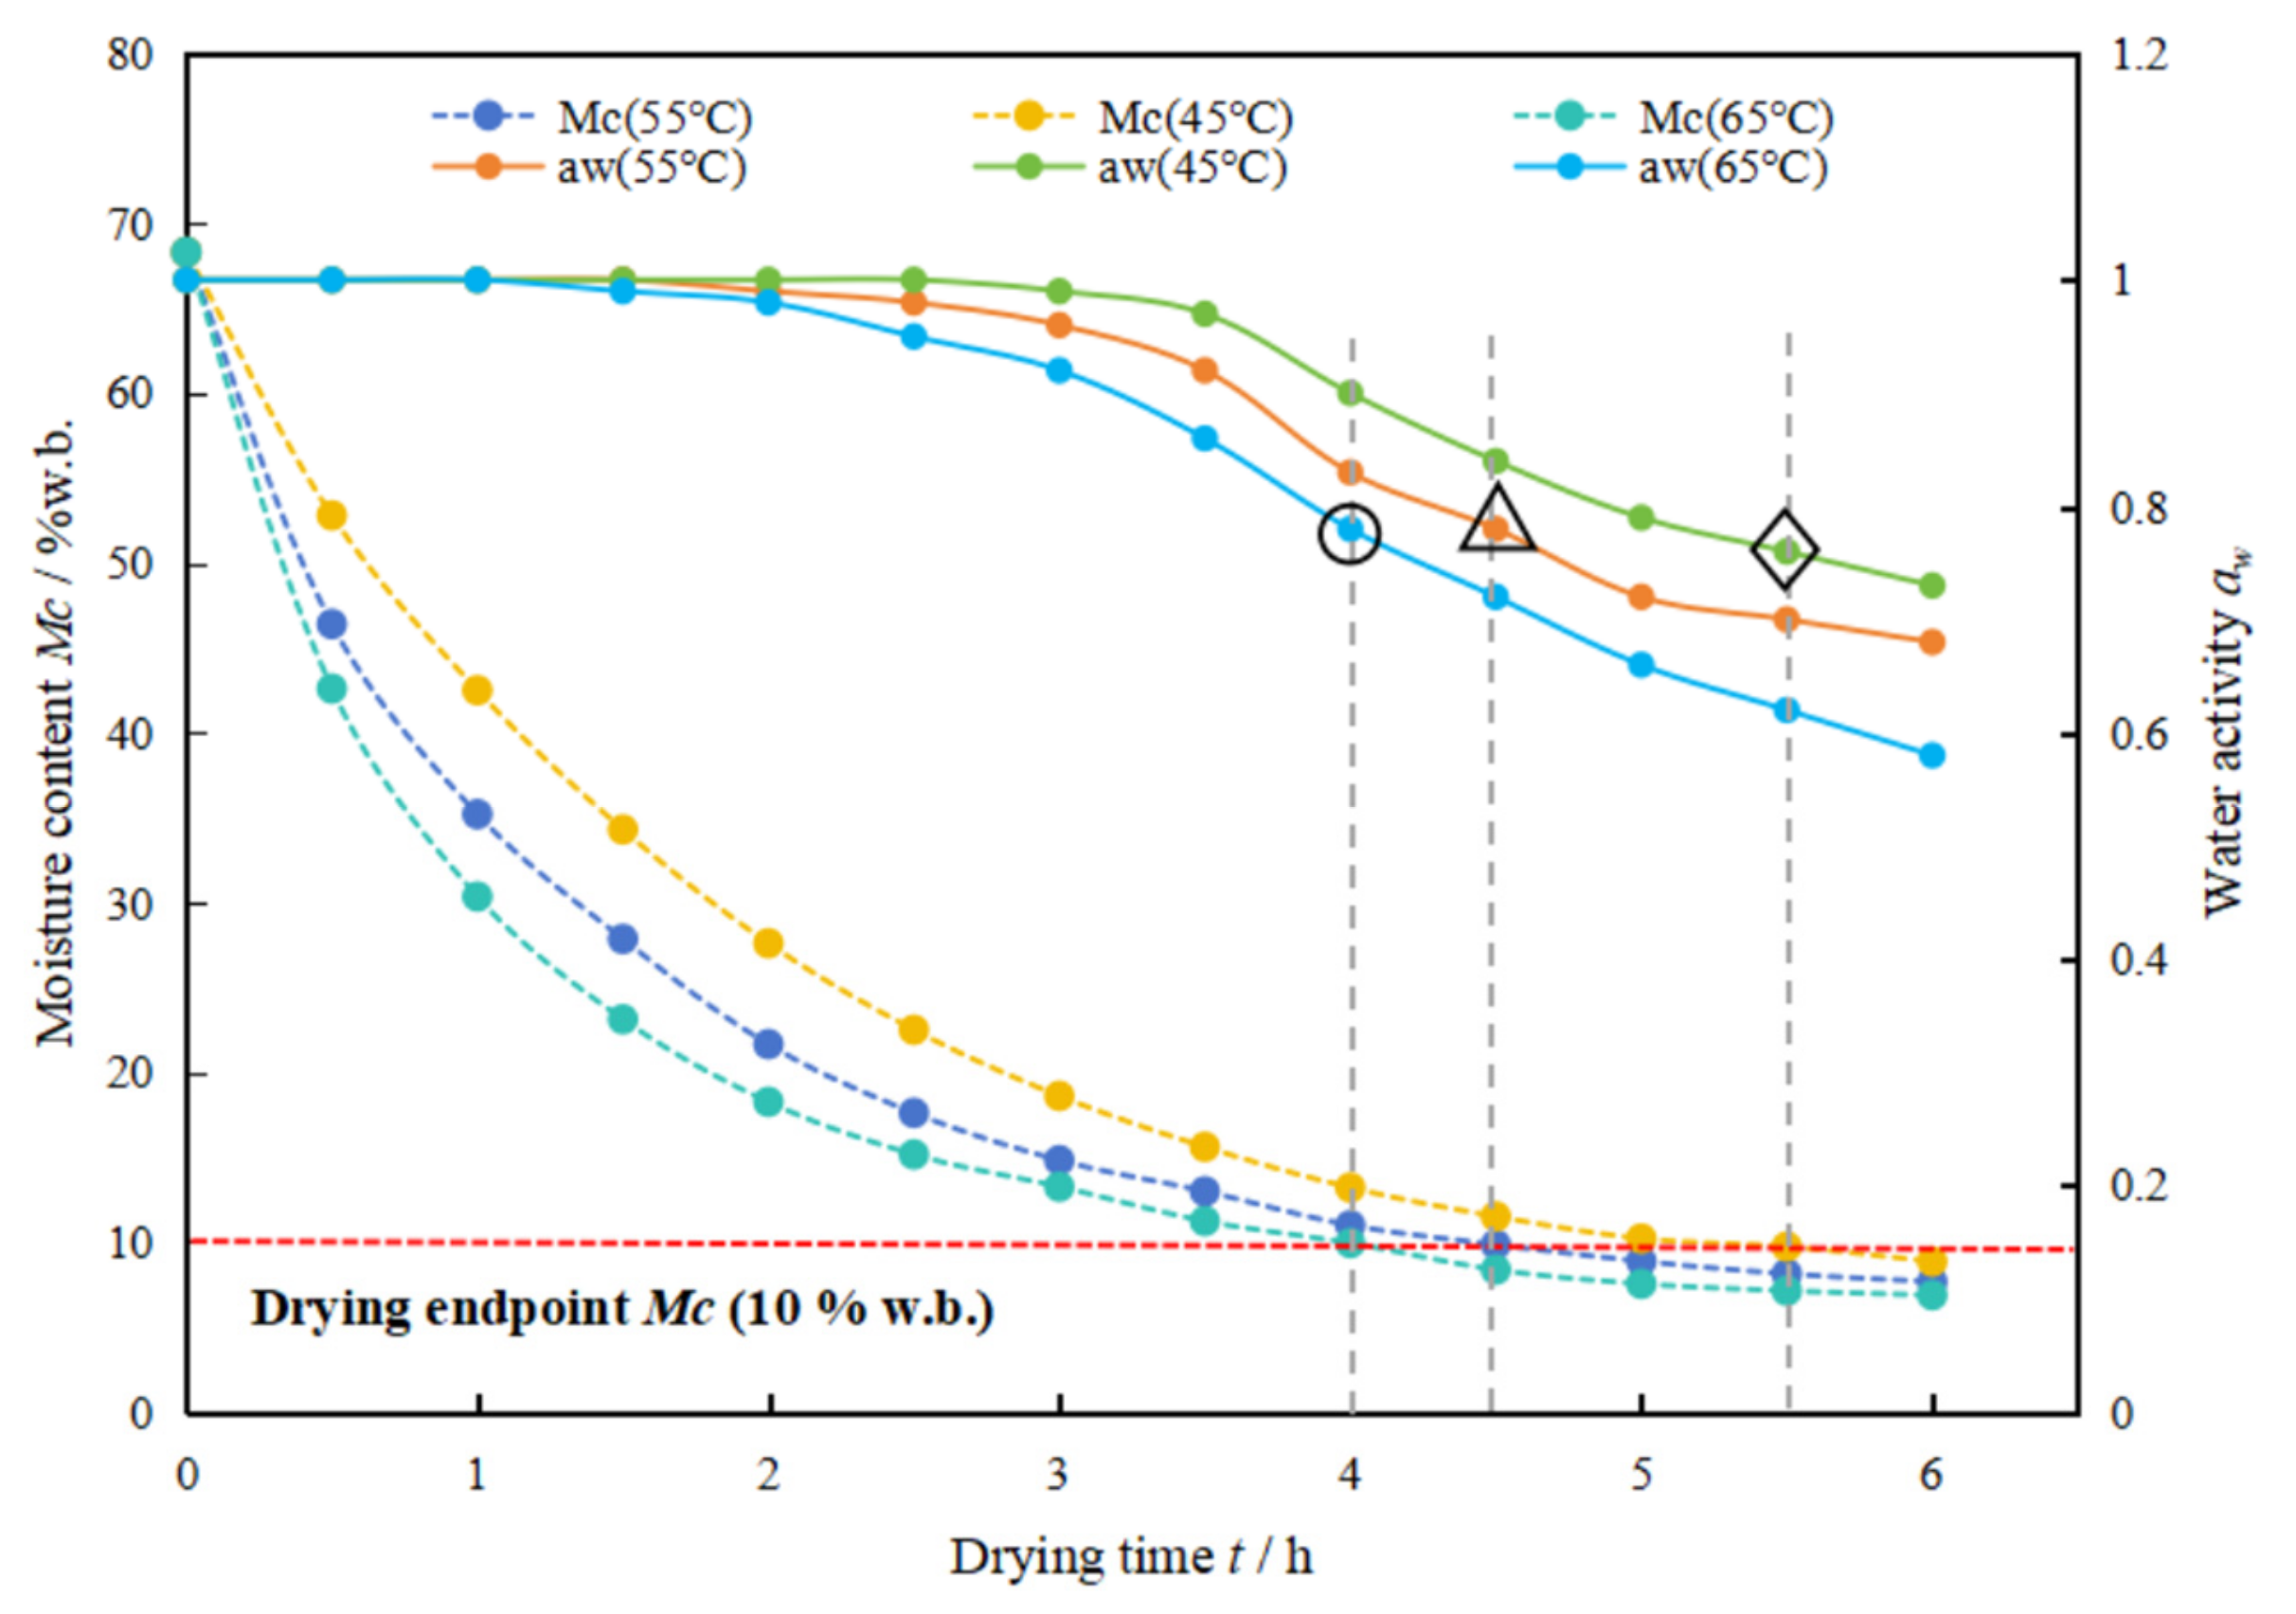
In order to further investigate the changes of the moisture states during the drying process, the water activities of the samples dried at drying temperatures of 45, 55 and 65 °C were also measured by a water activity meter (AW-2), and the variations of the water activities and the moisture content with the drying time are depicted in Figure 6. Obviously can be drawn from Figure 6 that the drying rate increases with the drying temperature, and the drying time to reach the drying endpoint 10%w.b. [31] at drying temperatures of 45, 55 and 65 °C were determined to be 5.5 h, 4.5 h and 4 h, respectively, and the corresponding aw of the dried samples are 0.789, 0.782, and 0.778, respectively. On the other hand, it can be seen from the Figure that the aw for 65 °C performs a downward trend at 1 h, while the aw for 55 °C performs a downward trend at 1.5 h and the aw for 45 °C performs a downward trend at 2 h. This indicates that the free water inside the samples dried at 45, 55 and 65 °C were respectively removed or transformed to immobile water at 1 h, 1.5 h, and 2 h, which can corroborate the LF-NMR results shown in Figure 5. Furthermore, by comprehensively comparing the LNF-NMR analysis in Figure 5 and the sample water activity variations shown in Figure 6, it can be summarized that a higher drying temperature can significantly increase the free water removal rate, while it has a smaller influence on the bound water removing rate and a significant influence on the immobile water removal rate under a drying temperature of 65 °C.
The variations of the relaxation time (T2) and peak area (A2) for Green Sichuan Pepper during the drying process with drying time at different drying temperature is tabulated in Table 2. T21, T22, T23 and A21, A22, A23 correspond to the relaxation times and peak areas of the respective peaks on the inversion spectrum. As indicated by Table 2, the peak area values (representing the content of water in different states within the Green Sichuan Pepper) generally decrease with the increase of drying time under different conditions; specifically, this means the higher temperature is, the faster the peak area reduction. This attests that a higher temperature speeds up the water evaporation rate within the Green Sichuan Pepper. It can be also summarized from the table that the peak area of bound water (A21) slightly increases, then gradually decreases at the initial drying stage, which may be caused by the internal temperature gradient and moisture movement at the stage, with the result that the bound water content increases initially and decreases sequentially. On the other hand, the peak area of immobile water (A22) constitutes the largest proportion of the total peak area and shows a nearly exponential declination trend during the first 0.5 h for the three drying temperatures. Among the three water states during the whole drying process, the proportion of the free water (A23) peak area is relatively small, and on account of the limitations of the NMR equipment’s precision, though the regularity in the changes of free water is less distinct, it generally shows a decreasing trend. To sum up, during the drying process of Green Sichuan Pepper, the moisture content gradually decreases, with the content of immobile water consistently decreased, the content of bound water initially increased then decreased, and the content of free water generally decreased.
In addition, it can be also seen from Table 2 that the variation ranges of T21 under drying temperatures of 45, 55 and 65 °C are 2.583–0.425 ms, 2.583–0.37 ms and 2.583–0.245 ms, respectively. These are all varied in a small range, indicating that drying can slightly increase the freedom of hydrogen protons of the bound water, though the impact is minimal. This might due to the short relaxation times associated with T21, which primarily relate to bound water; similar findings have been reported in drying processes for broccoli [32], ginger [33], and persimmon slices [34]. This type of water molecule is tightly bound to the internal macromolecules of Green Sichuan Pepper, making it less prone to evaporation during drying, resulting in only small changes in T21 values. During the drying process, both T22 and T23 values undergo significant changes; T22 values increase initially and decrease gradually, while T23 values first decrease, then increase gradually, and finally decrease to disappearance. The higher the temperature, the faster the T22 changes occur, indicating that the primary loss of water in Green Sichuan Pepper during drying involves free water and immobile water. The changes in T22 may be attributed to drying promoting the mobility of hydrogen protons of water molecules in various states and the transformation of bound water into free water, increasing the freedom of internal water molecules, thereby causing an initial increase in T22 values. As drying progresses and most of the free water is removed, the moisture content of the Green Sichuan Pepper decreases, and the remaining internal water molecules find it more difficult to ‘escape’, leading to a decrease in T22 values.

3.4. Moisture Content Prediction Model Based on Low-Field NMR Parameters

3.4.1. Correlation Analysis and Modelling of Parameters with Moisture Content

An analysis of the correlation between the wet basis moisture content (MC) of Green Sichuan Pepper and LF-NMR parameters under different hot air temperature conditions was conducted by applying Pearson correlation coefficients and the t-test [35], and the results are tabulated in Table 3. As can be seen from the Table, it is evident that at 45 °C, both T21 and A2 show a highly significant positive correlation with MC (p < 0.001), indicating that increases in T21 duration and A2 are closely associated with an increase in MC. Additionally, A21 and A22 are also significantly positively correlated with MC (p < 0.05), demonstrating that these parameters increase as the MC rises. Under the temperature condition of 55 °C, the correlation between T21, T22, T23 and A2 with MC reached significant or highly significant levels, indicating that these parameters can indirectly reflect changes in MC. At 55 °C and 65 °C, the correlation between A23 and MC performance was a non-significant negative correlation, possibly due to high temperatures facilitating the transformation of internal moisture in Green Sichuan Pepper, further affecting the relationship between A23 and MC. At 65 °C, the correlations of A21, A22 and A2 with MC are significant or highly significant; A2 in particular shows the strongest correlation. Overall, the parameter A2 consistently shows a good correlation with MC at different drying temperatures, and total peak area A2 can be used for the MC prediction during the hot-air drying process of Green Sichuan Pepper. Similar conclusions have been drawn in drying processes for figs [36], oilseed rape [37] and kiwifruit [24] conducted by Wang et al., Si et al. and Li et al., respectively.
Accordingly, the MC prediction models at different drying temperatures were established by applying the parameter A2 as the independent variable and MC as the dependent variable under a constant drying air velocity of 1.5 m/s. The models for each temperature condition are presented as Equations (1)–(3):
M C = 0.00165 A 2 + 0.87416                 45   ° C
M C = 0.00174 A 2 1.28247                 55   ° C
M C = 0.00171 A 2 3.07982                 65   ° C
Based on the established models, the fitted curves between the MC and A2 are depicted in Figure 7. As can be seen from the Figure, there is a significant linear relationship between the total peak area A2 and MC at different drying temperatures, and the determination coefficients (R2) for the fitted curves at 45, 55 and 65 °C were 0.9664, 0.9470 and 0.9830, respectively, indicating that the models show a reliable fitting performance and can be used for predicting the MC during the drying process.

3.4.2. Model Validation

In order to validate the prediction performance of the established models shown in Equations (1)–(3), an additional experiment was conducted using the same batch of Green Sichuan Pepper under identical hot-air drying conditions at temperatures of 45, 55 and 65 °C. During the test, the parameter A2 and corresponding MC at each drying point were measured. The predicted MCs were obtained by inserting the measured A2 at each drying interval into the established models, while the measured MCs were obtained using 105 °C methodology mentioned above [13]. The comparison between the predicted and measured MCs were estimated using the relative deviation, and the results are tabulated in Table 4. As can be seen from the Table that the relative deviation between the predicted MCs and measured MCs ranges from 0.11% to 22.54%, indicating that the models can generally predict the moisture content of Green Sichuan Pepper effectively.

4. Microstructural Changes during Hot-Air Drying of Green Sichuan Pepper

4.1. Analysis of Green Sichuan Pepper Microstructure

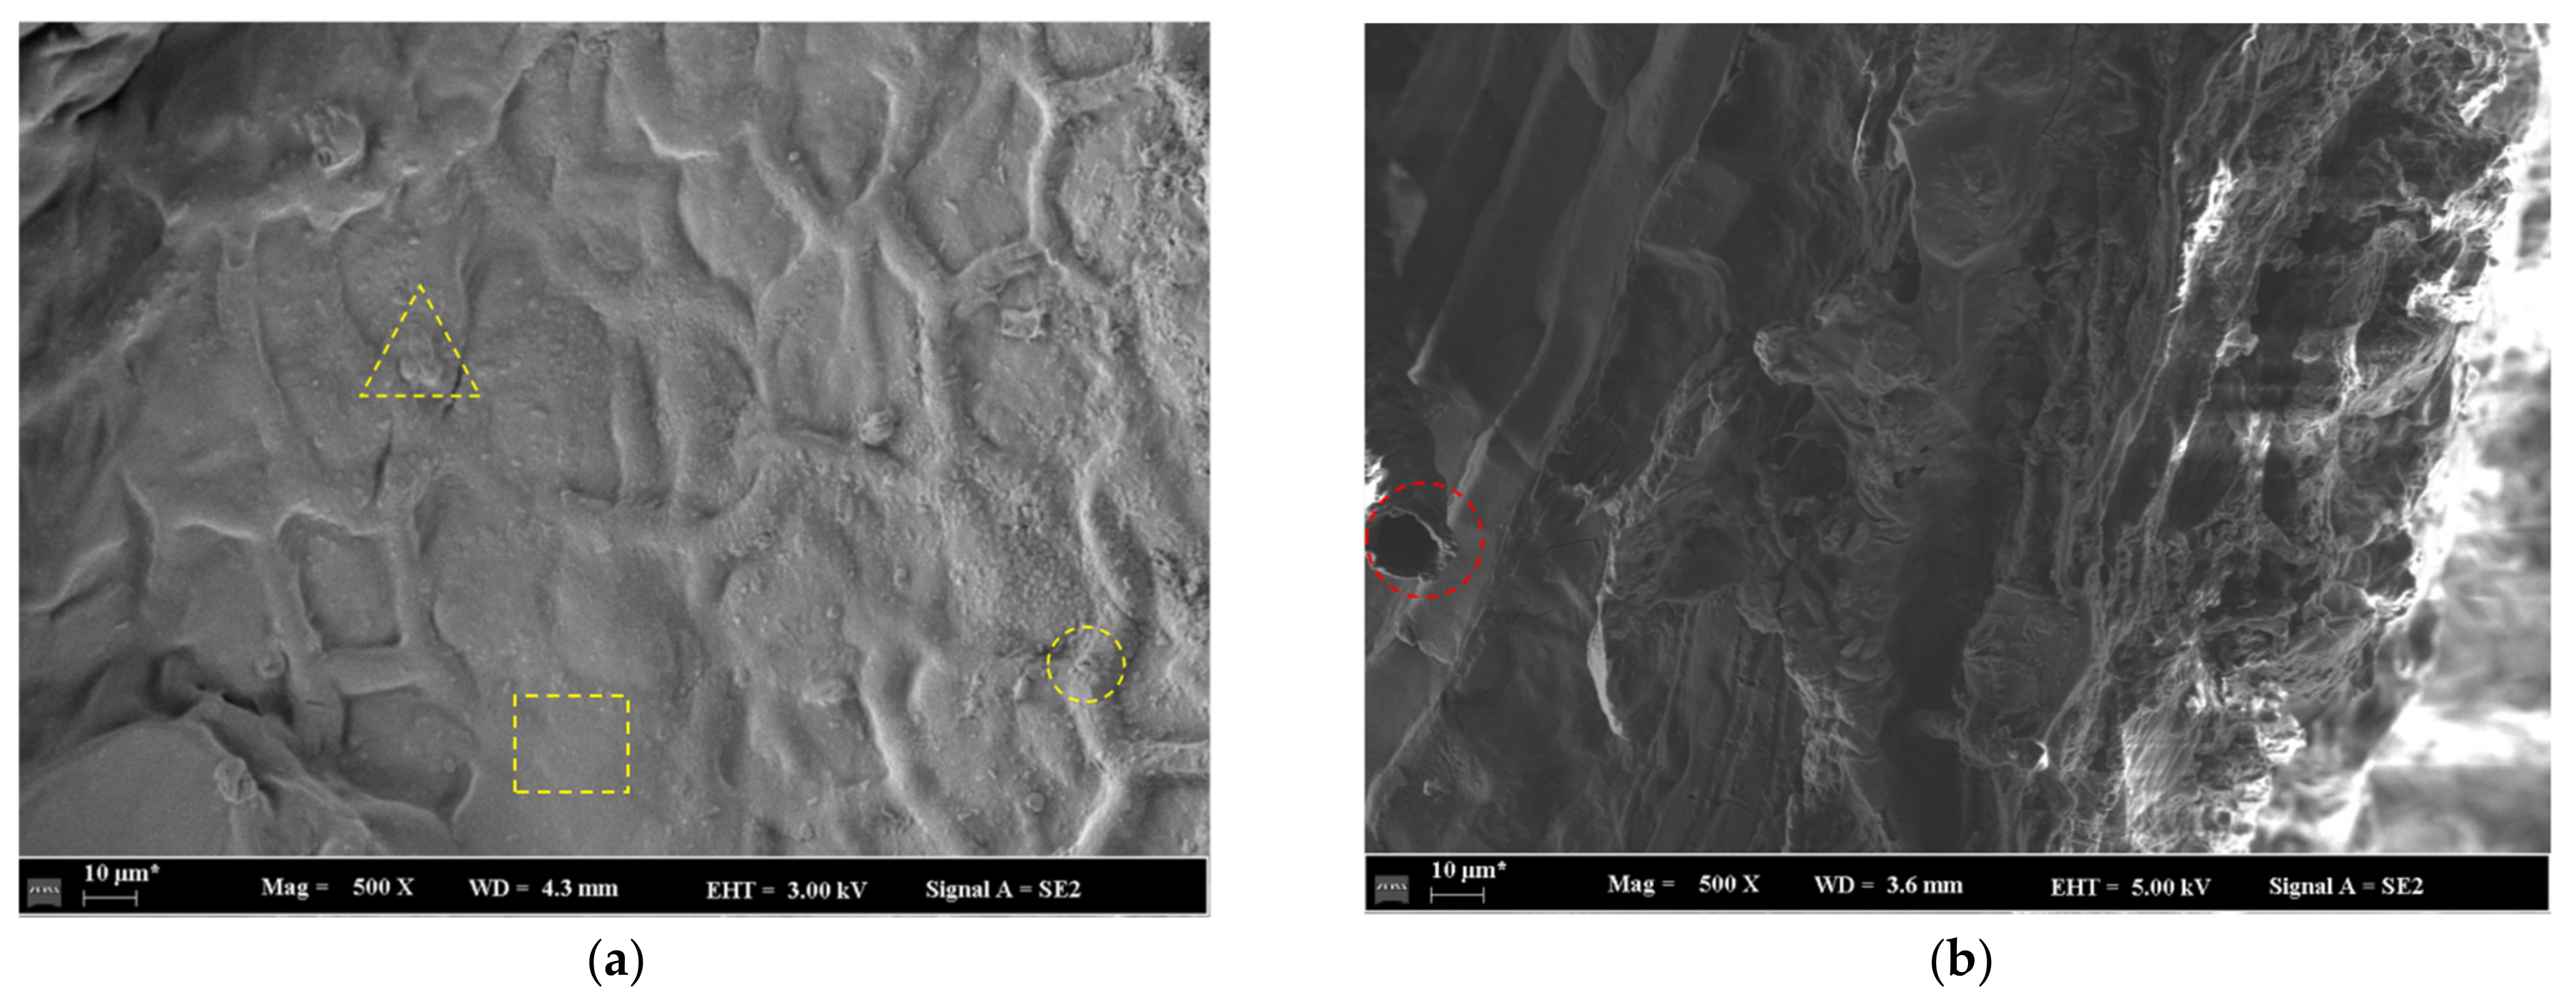
The microstructure of agro-products is one of the key factors affecting the moisture migration intensity during the drying process. In recent year, researchers have conducted studies on the microstructural changes of Green Sichuan Pepper seeds using SEM methodology, and the results showed that the structural integrity of Green Sichuan Pepper seeds remained largely unchanged during the drying process. However, few works have focused on the microstructural changes of the pericarp. Accordingly, the surface and section feature of the pericarp were investigated and are depicted in Figure 8.
As can be seen from Figure 8a, the Green Sichuan Pepper pericarp surface mainly consists of three components, including the surface structure, pore structure and the oil chamber structure, which are respectively characterized by the “rectangle”, “circle” and “triangle” in Figure 8a. The local surface structure possesses a slight fold phenomenon, while the whole surface possesses a grid mesh phenomenon. The oil chamber structure is the main place for storing essential oils, which is manifested as irregular protrusions, as shown in the Figure. The pore structure is the key component to transport the water from the inside to the outside of the sample, which possesses a flat shape on the surface and a three-dimensional tubular shape at the cross-section of the pericarp, as shown in Figure 8b.
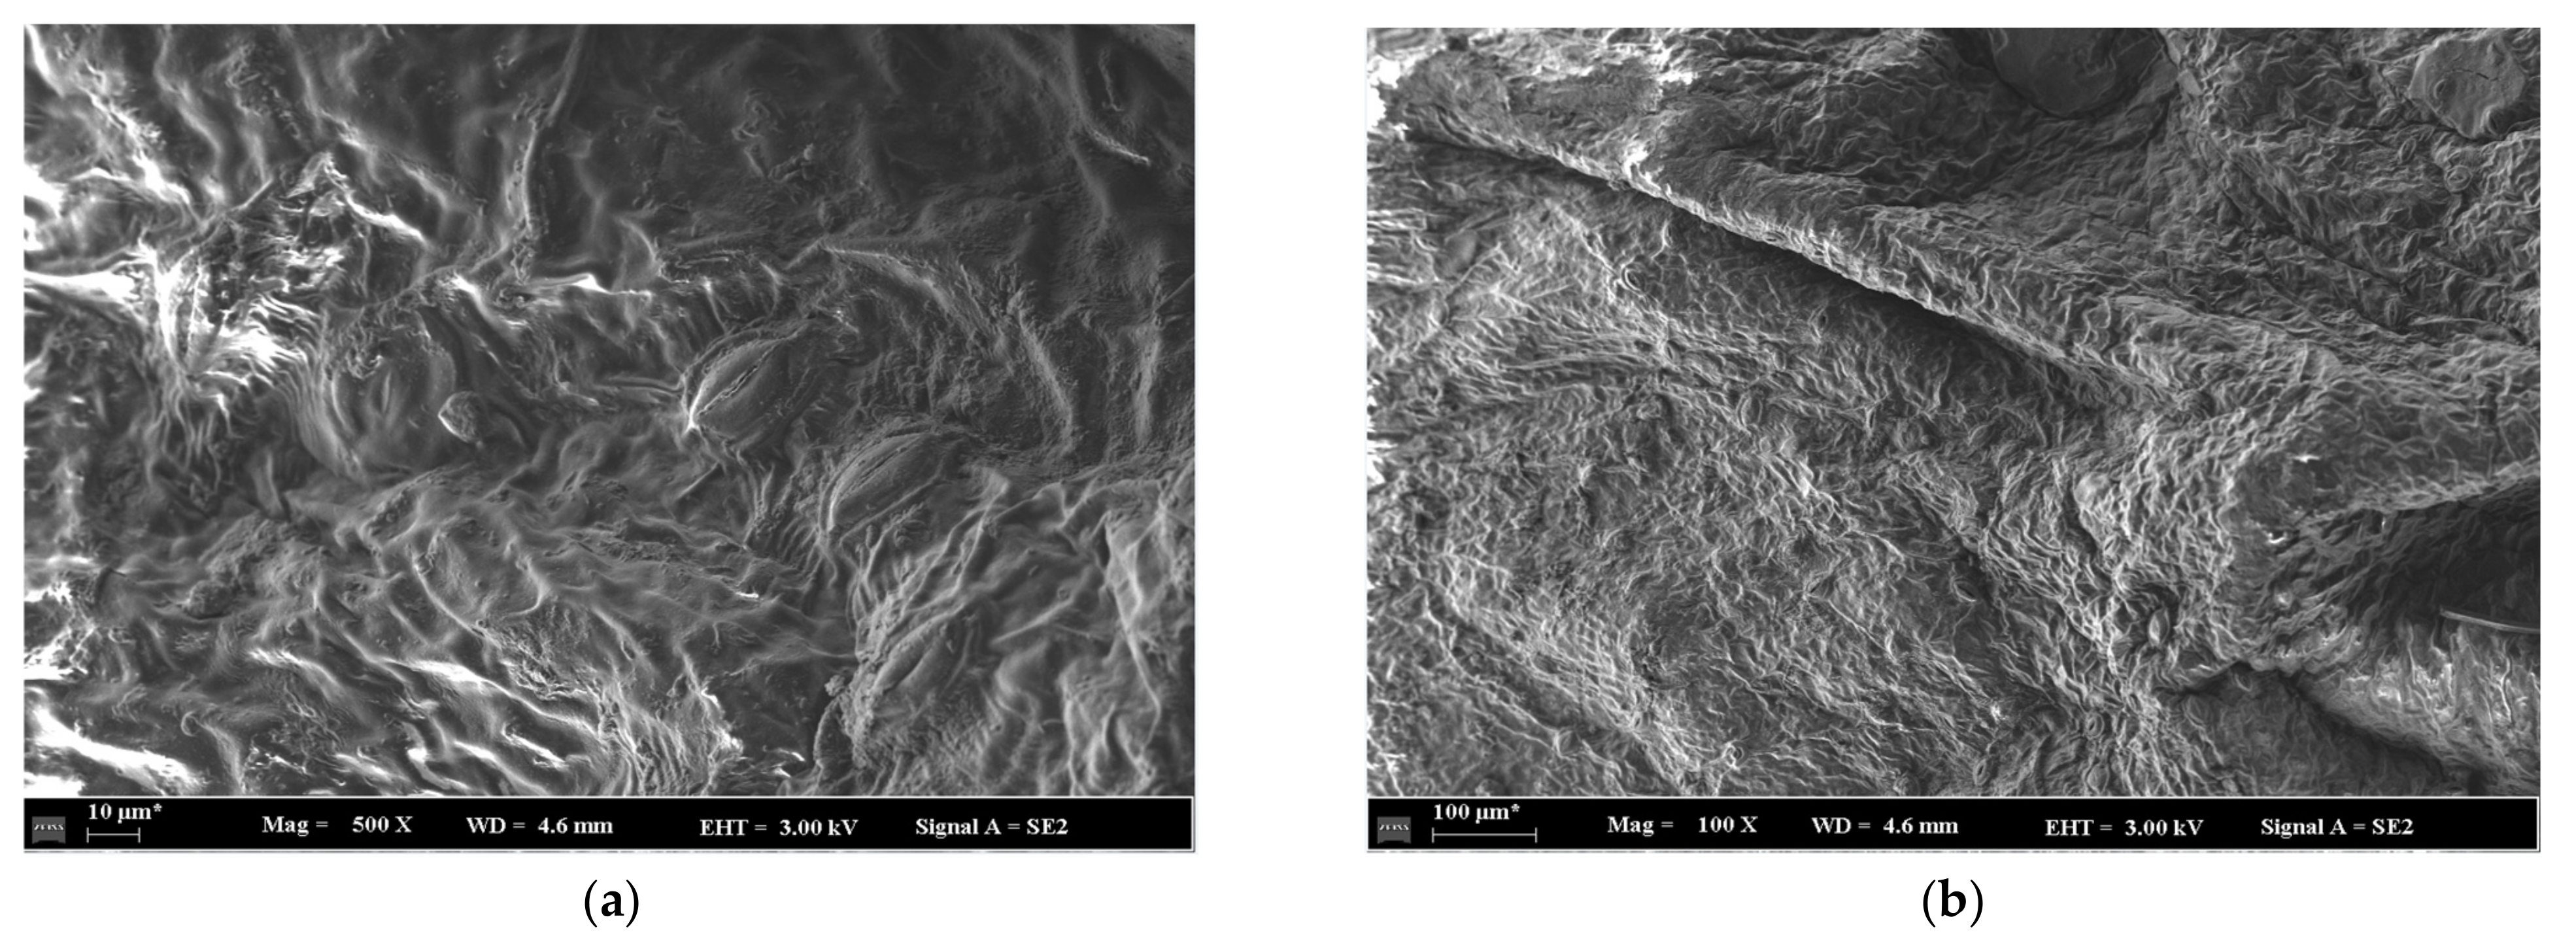
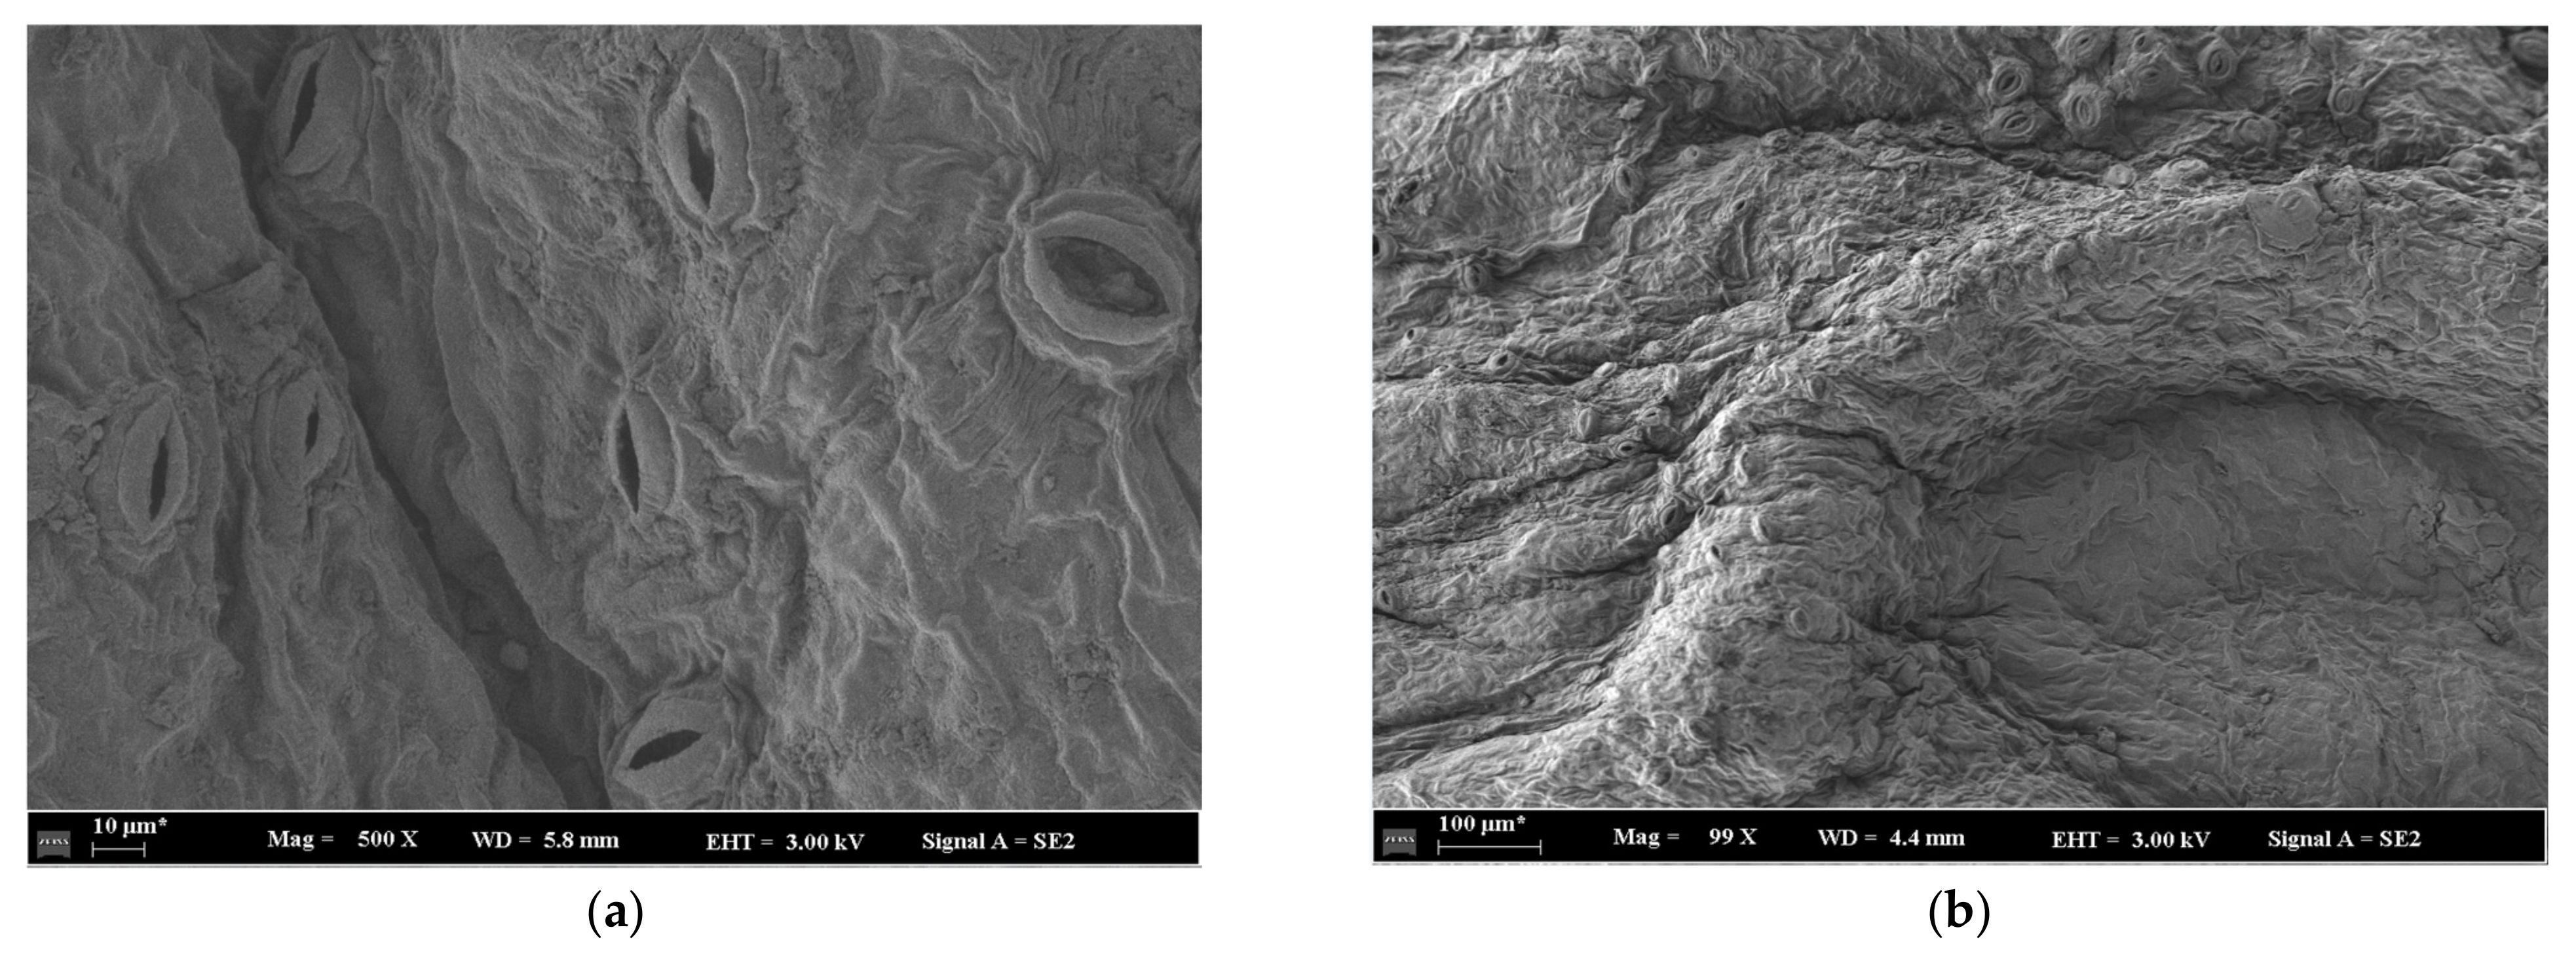
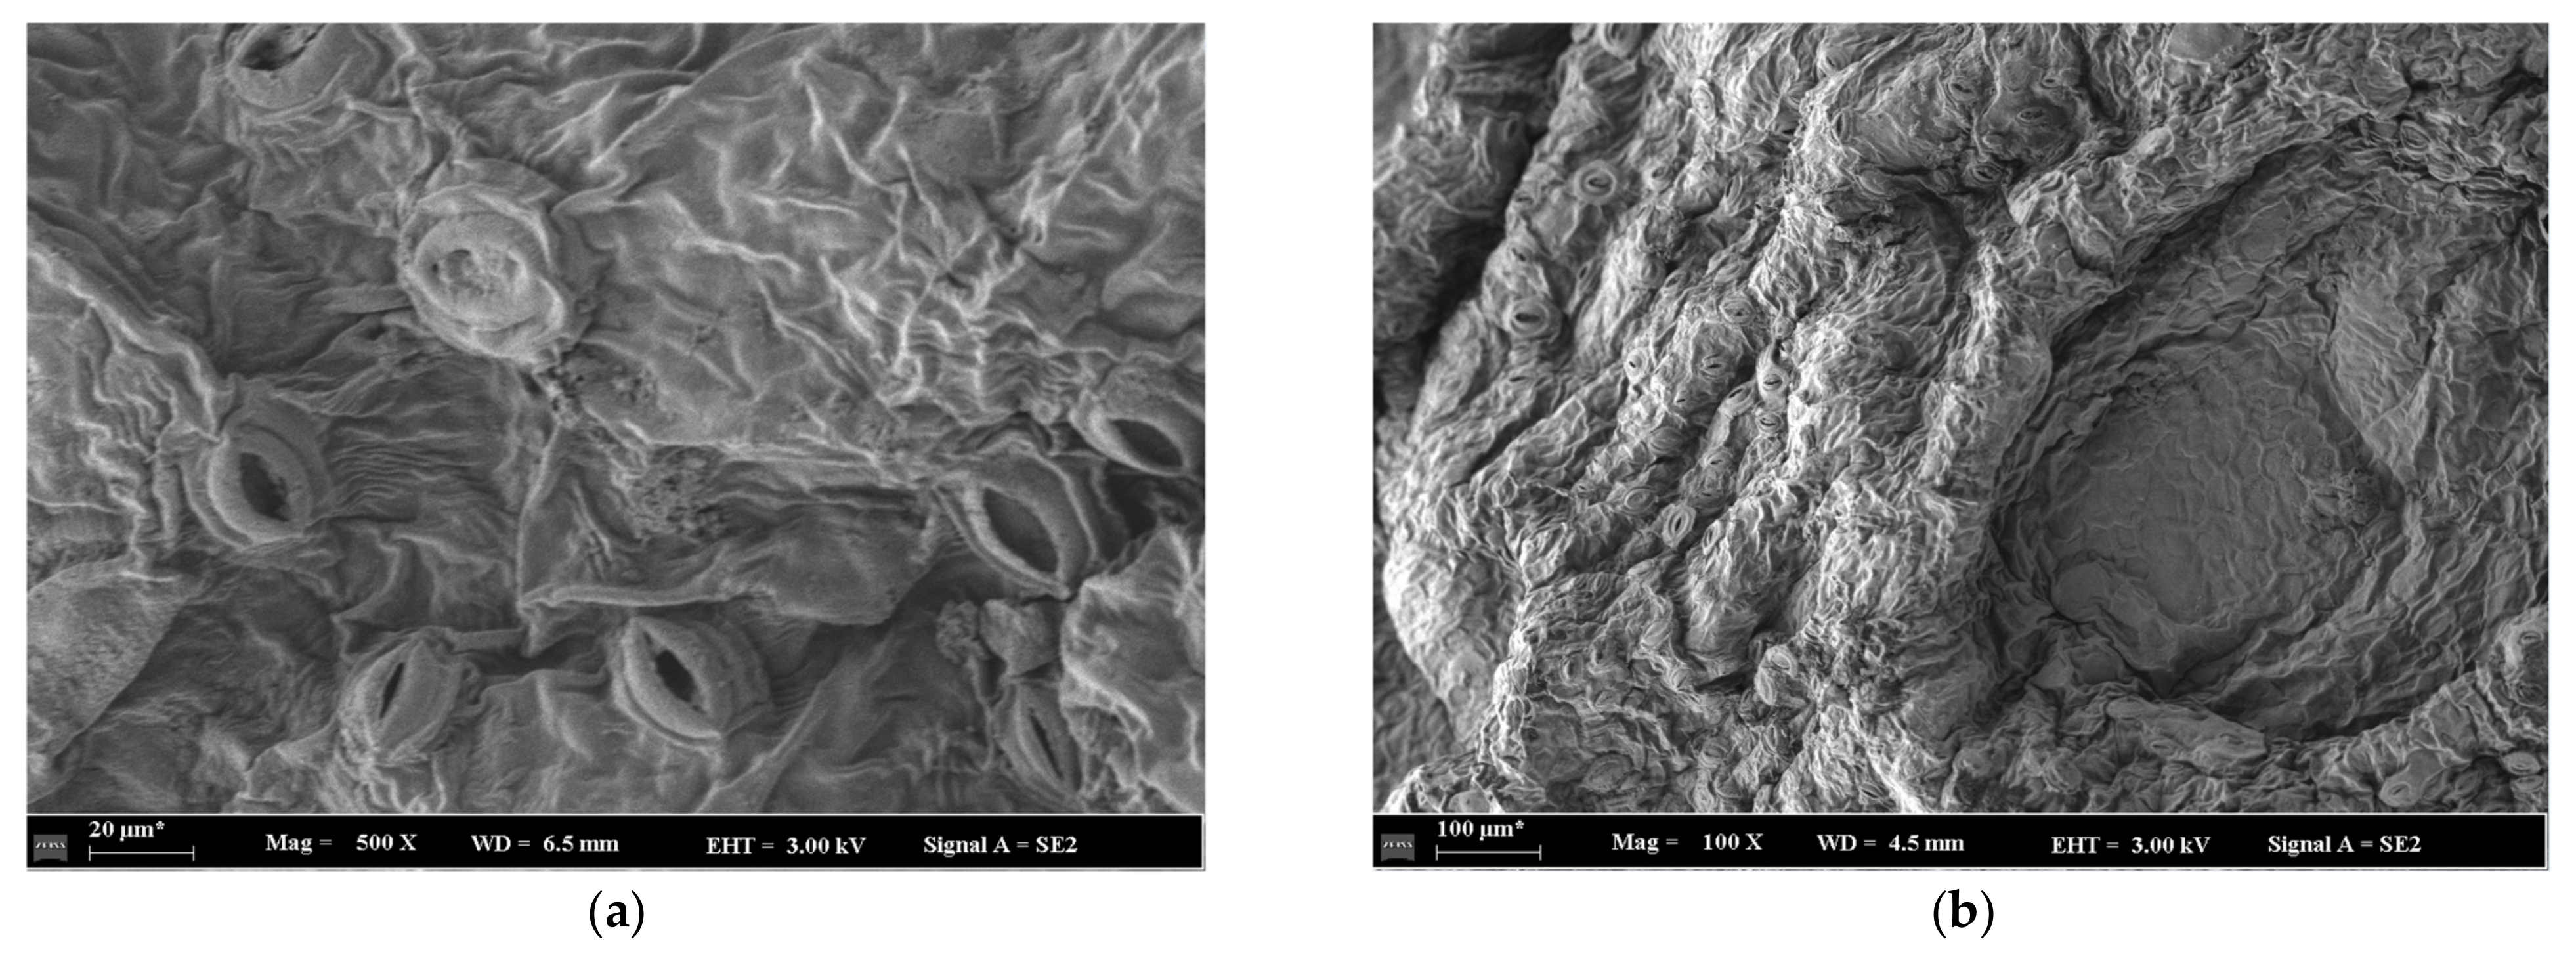
During the drying process, the inside water migrates from the pore structure driven by the temperature, pressure and moisture concentration gradients; however, the pore structure varies with the variations of the drying conditions. Accordingly, based on the analysis mentioned above, an experimental study on the microstructure of the samples dried at 45, 55 and 65 °C has been conducted using SEM technology. Meanwhile, in order to investigate the variations of the pore structure with the drying time, and at the same time, by reducing the number of scanned samples, the microstructures of Green Sichuan Pepper pericarp at 60 min and 360 min with drying temperatures of 45, 55 and 65 °C were respectively investigated, and the results are depicted in Figure 9, Figure 10 and Figure 11.
By comparing the pore structure features on the pericarp at drying time of 30 min and 60 min under the different drying temperatures, it can be obviously seen from Figure 9, Figure 10 and Figure 11 that the density of pore at 360 min is significantly larger than that at 60 min, which might due to the fact that during the drying process, the surface moisture firstly evaporates and the internal moisture migrates from the center to the surface and transfers to the outside. As a result, a humidity gradient is formed from the inside to the outside of the pericarp during the drying process. Under the influence of the humidity gradient, a reaction force, namely wrinkling stress, is generated from the outside to the inside, which hinders the moisture migration of the fruit peel and leads to the shrinkage of the pericarp, leading to increased density of the pore. However, it can be also seen from Figure 9, Figure 10 and Figure 11 that the size and open degree of a single pore at the end of the drying process experiences a significant reduction comparing with that of at the beginning of the drying process. This might due to the fact that dehydration leads to cell contraction, and further leads to micro shrinkage of the pore structure, leading to the reduction of the exchange intensity of the moisture and gas between the inside and outside of the pericarp. This might explain why the drying efficiency decreases with the increase of the drying time during the speed-down drying stage in Green Sichuan Peppers, as well as some other common agricultural product drying process.
On the other hand, by comparing the pore features under different drying temperatures at same drying time, it can be seen from the Figures that at the drying time of 60 min, the pore opening degree at drying temperatures of 45 °C is obviously smaller than that of at 55 °C and 65 °C, and the pore opening degree increases with the increase of the drying temperature, which might reveal that the drying temperature can enhance the drying efficiency of an agricultural product, just as reported in various drying reports [12,14,18]. However, it can be seen from Figure 11a that parts of the pore structure have been destroyed under the drying temperatures of 65 °C, which might be due to the fact that the migration of bound water and immobile water leads to cell shrinkage, pore formation and the collapse of cell and pore structures [30]; similar findings have also been reported in a carrot drying process [21].

4.2. Analysis of Changes in Elemental Distribution

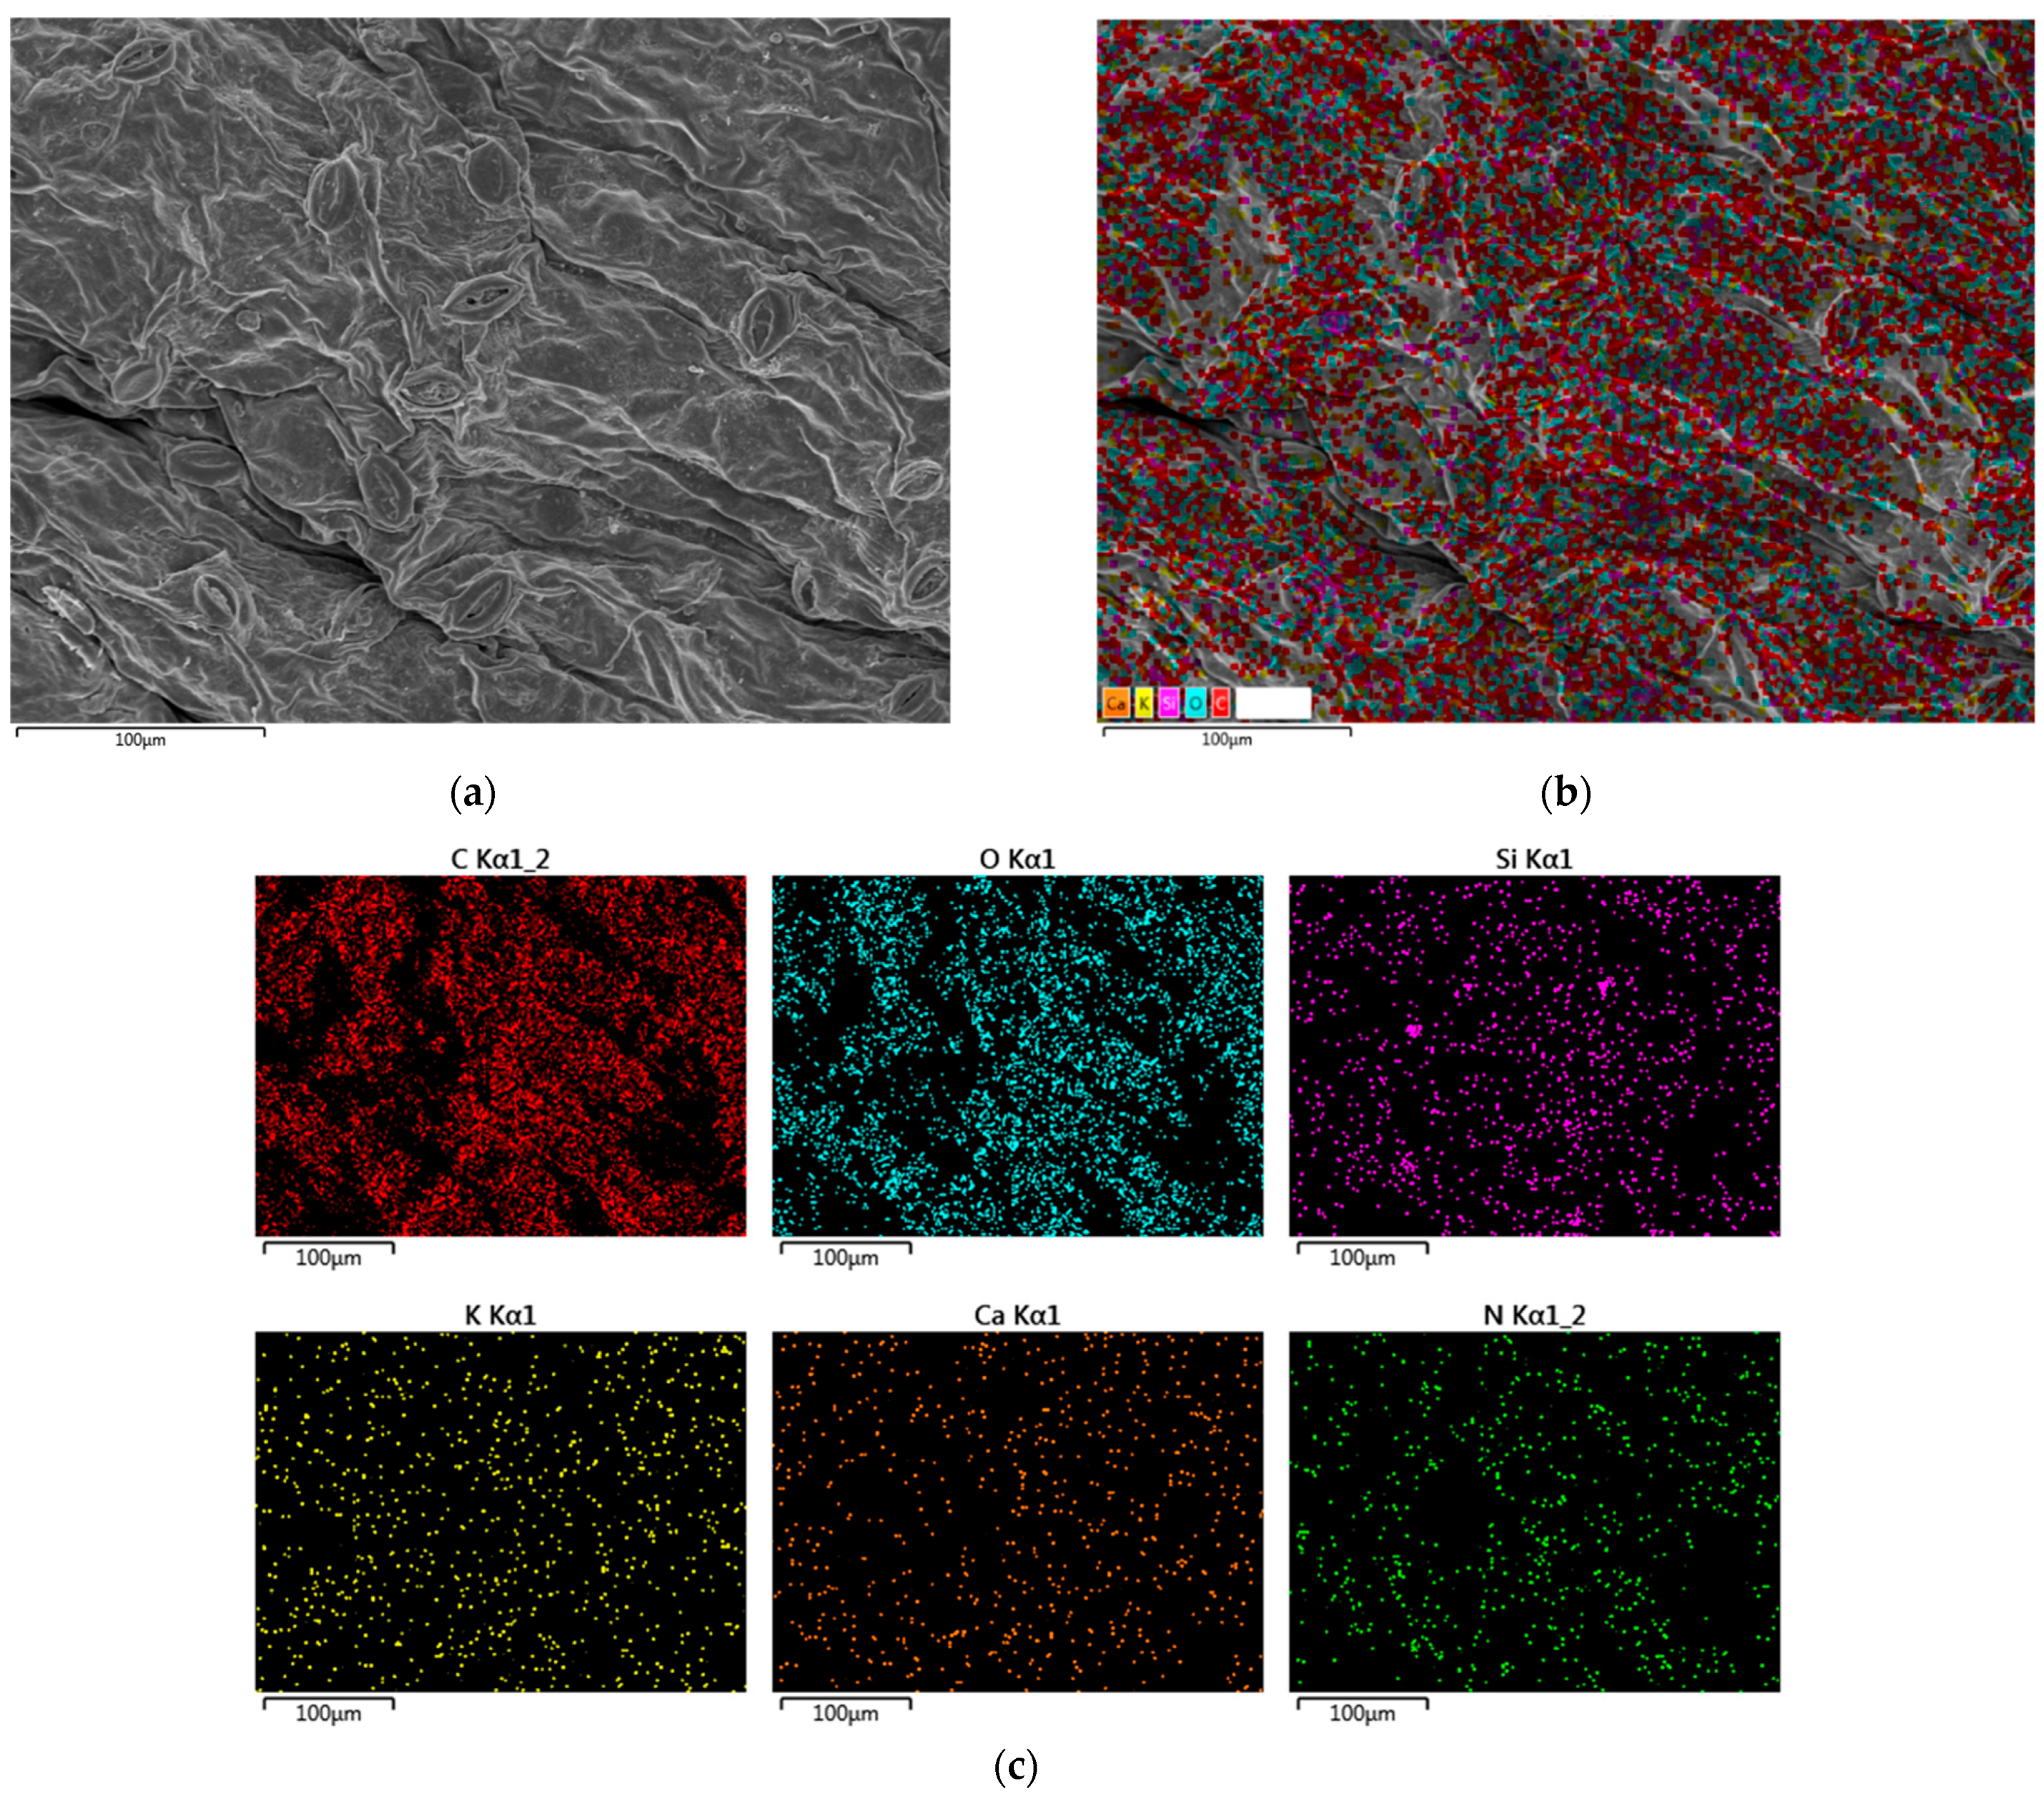
During the SEM observation of Green Sichuan Pepper pericarp, the samples were simultaneously scanned using an energy-dispersive X-ray spectrometer (EDS) accessory for EDS-Mapping, which can not only provide detailed microstructural images but also produces maps of elemental distribution on the surface of the samples, thereby revealing the chemical composition and constituents of the pericarp for comprehensive characterization [38]. Considering the diversity of elements as well as the length of the present work, the distribution of elements on the pericarp surface at drying times of 60 min and 360 min were respectively investigated by adopting EDS-Mapping, and the results are depicted in Figure 12 and Figure 13, respectively.
As illustrated in Figure 12, the primary elements contained in the Green Sichuan Pepper pericarp include carbon (C), oxygen (O), silicon (Si), potassium (K), calcium (Ca) and nitrogen (N). C and O constitute the most significant portion of the cellular walls, cytoplasm and proteins, indicating that the main components of the Green Sichuan Pepper pericarp are cellulose and other carbohydrates. The elements Si and Ca play critical roles in reinforcing the strength and structural stability of the cell walls. By comparing the comprehensive EDS images shown in Figure 12b and Figure 13b, it can be obviously seen that the distribution of elements (C, O, Si, K, Ca and N) on the pericarp surface at a drying time of 60 min is more uniform than that of a drying time of 360 min, and the elements C, O, Si, K, Ca and N at a drying time of 360 min reduce more than 10% compared with that of a drying time of 60 min, which might be due to the reduction of internal moisture during the drying process leading to cellular structure contraction, further affecting the distribution and the observation of the elements.

5. Conclusions

In the present work, LF-NMR and SEM technologies were adopted to investigate the moisture migration characteristics and microstructural characteristic of Green Sichuan Pepper during the hot-air drying process. The main conclusions drawn from the results can be summarized as follows:
(1)
There are three states of water molecules present within the fresh Green Sichuan Pepper, including bound water, immobile water and free water, which can be symbolized by the relaxation time ranges of T21 (0.1–10 ms), T22 (10–500 ms) and T23 (500–10,000 ms), respectively. The majority of the water is immobile water (A22, accounting for 83.72%), which contributes to the considerable challenges associated with drying Green Sichuan Pepper.
(2)
Throughout the whole drying process, the immobile water and the free water consistently exhibit a declining trend, while the bound water initially increases and then decreases. The main dehydrated water during the drying process is ascertained to be the immobile water and free water. The higher the drying temperature is, the faster the immobile water and free water dehydrated rates are.
(3)
The LF-NMR parameter A2 shows a high correlation with the sample moisture content under different drying temperatures. The moisture content prediction models under 45, 55 and 65 °C were established and validated to be reliable by applying the index of relative error.
(4)
The pore opening degree increases with the increase of the drying temperature, which might reveal that the drying temperature can enhance the drying efficiency. The pore opening degree decreases with the increase of the drying time, which might reveal that drying efficiency decreases with the increase of drying time at the speed-down drying stage in Green Sichuan Pepper.
Above all, by comprehensively considering drying efficiency and drying equality, the optimal drying temperature of Green Sichuan Pepper is ascertained to be 55 °C. Under the drying temperature of 55 °C and hot air velocity of 1.5 m/s, the drying time is ascertained to be 4.5 h and the main structure of the pericarp remains relatively intact during the drying process. Though the moisture migration characteristics and microstructural characteristic of Green Sichuan Pepper under different drying temperatures were revealed in the present work, further study is recommended to identify the appropriate drying air velocity for faster drying of Green Sichuan Pepper, and further to achieve better quality samples at a reasonable economic cost.

Author Contributions

Conceptualization, B.L. and C.L.; methodology, B.L. and H.L.; software, B.L. and C.H.; validation, B.L., Q.L. and Z.Z.; formal analysis, B.L. and P.W.; investigation, B.L. and L.G.; resources, C.L. and H.L.; data curation, B.L., Q.L., X.Z. and Z.Z.; writing—original draft preparation, B.L., X.Z. and Z.Z.; writing—review and editing, B.L., C.L., C.H., X.Z. and Z.Z.; visualization, B.L., H.L., P.W., L.G., X.Z. and Z.Z.; supervision, B.L., L.G., X.Z. and Z.Z.; project administration, B.L.; funding acquisition, B.L. All authors have read and agreed to the published version of the manuscript.

Funding

This research was funded by the Science and Technology Research Program of Chongqing Municipal Education Commission (Grant No. KJQN202201318); the Key Laboratory of Agricultural Equipment Technology for Hilly and Mountainious Areas, Ministry of Agriculture and Rural Affairs, P.R.China (Grant No. 2022KLOP02); the Natural Science Foundation Program of Yongchuan District, Chongqing (Grant No. 2022yc-jckx20037); the China Postdoctoral Science Foundation (Grant No. 2023T160768); the Special Support Project of Chongqing Postdoctoral Science Foundation (Grant No. 2021XM1034); the Chongqing Postdoctoral Science Foundation Project (CSTB2022NSCQ-BHX0016); the Talent Introduction Projects of Chongqing University of Arts and Sciences (Grant No. R2021SZZ02); the Major Cultivation Project of Chongqing University of Arts and Sciences (Grant No. P2022ZZ15) and the National Natural Science Foundation of China (Grant No. 32171906).

Data Availability Statement

The original contributions presented in the study are included in the article, further inquiries can be directed to the corresponding authors.

Acknowledgments

The authors would like to thank to the editors and reviewers for their valuable and constructive comments.

Conflicts of Interest

The authors declare that we have no known competing financial interests or personal relationships that could have appeared to influence the work reported in this paper.

References

  1. Liu, Y.; Zhang, Y.; Wei, X.; Wu, D.; Dai, J.; Liu, S.; Qin, W. Effect of radio frequency-assisted hot-air drying on drying kinetics and quality of Sichuan pepper (Zanthoxylum bungeanum maxim). LWT—Food Sci. Technol. 2021, 147, 111572. [Google Scholar] [CrossRef]
  2. Bhatt, V.; Sharma, S.; Kumar, N.; Sharma, U.; Singh, B. Simultaneous quantification and identification of flavonoids, lignans, coumarin and amides in leaves of Zanthoxylum armatum using UPLC-DAD-ESI-QTOF-MS/MS. J. Pharm. Biomed. 2017, 132, 46–55. [Google Scholar] [CrossRef] [PubMed]
  3. Jing, N.; Wang, M.; Gao, M.; Zhong, Z.; Ma, Y.; Wei, A. Color sensory characteristics, nutritional components and antioxidant capacity of Zanthoxylum bungeanum Maxim. as affected by different drying methods. Ind. Crop. Prod. 2021, 160, 113167. [Google Scholar] [CrossRef]
  4. Yamazaki, E.; Inagaki, M.; Kurita, O.; Inoue, T. Antioxidant activity of Japanese pepper (Zanthoxylum piperitum DC.). Fruit. Food Chem. 2007, 100, 171–177. [Google Scholar] [CrossRef]
  5. Ma, Y.; Li, X.; Hou, L.; Wei, A. Extraction solvent affects the antioxidant, antimicrobial, cholinesterase and HepG2 human hepatocellular carcinoma cell inhibitory activities of Zanthoxylum bungeanum pericarps and the major chemical components. Ind. Crop. Prod. 2019, 142, 111872. [Google Scholar] [CrossRef]
  6. Zhang, D.; Sun, X.; Battino, M.; Wei, X.; Shi, J.; Zhao, L.; Liu, S.; Xiao, J.; Shi, B.; Zou, X. A comparative overview on chili pepper (capsicum genus) and sichuan pepper (zanthoxylum genus): From pungent spices to pharma-foods. Trends Food Sci. Tech. 2021, 117, 148–162. [Google Scholar] [CrossRef]
  7. Lu, J.; Xiang, J.; Liu, T.; Gao, Z.; Liao, M. Sichuan Pepper Recognition in Complex Environments: A Comparison Study of Traditional Segmentation versus Deep Learning Methods. Agriculture 2022, 12, 1631. [Google Scholar] [CrossRef]
  8. Ojediran, J.O.; Okonkwo, C.E.; Adeyi, A.J.; Adeyi, O.; Olaniran, A.F.; George, N.E.; Olayanju, A.T. Drying characteristics of yam slices (Dioscorea rotundata) in a convective hot air dryer: Application of ANFIS in the prediction of drying kinetics. Heliyon 2020, 6, e03555. [Google Scholar] [CrossRef]
  9. Li, M.; Chen, Y.; Wang, X.; Cheng, S.; Liu, F.; Huang, L. Determination of drying kinetics and quality changes of Panax quinquefolium L. dried in hot-blast air. LWT—Food Sci. Technol. 2019, 116, 108563. [Google Scholar] [CrossRef]
  10. Zeng, Z.; Li, B.; Han, C.; Wu, W.; Chen, T.; Dong, C.; Gao, C.; He, Z.; Zhang, F. Performance of Exergetic, Energetic and Techno-Economic Analyses on a Gas-Type Industrial Drying System of Black Tea. Foods 2022, 11, 3281. [Google Scholar] [CrossRef]
  11. Li, B.; Li, C.; Li, T.; Zeng, Z.; Ou, W.; Li, C. Exergetic, Energetic, and Quality Performance Evaluation of Paddy Drying in a Novel Industrial Multi-Field Synergistic Dryer. Energies 2019, 12, 4588. [Google Scholar] [CrossRef]
  12. Zhang, H.; Zhao, Y.; Gong, C.; Jiao, S. Effect of radio frequency heating stress on sublethal injury of Salmonella Typhimurium in red pepper powder. LWT—Food Sci. Technol. 2020, 117, 108700. [Google Scholar] [CrossRef]
  13. Liu, S.; Wang, H.; Ma, S.; Dai, J.; Zhang, Q.; Qin, W. Radiofrequency-assisted hot-air drying of Sichuan pepper (Huajiao). LWT—Food Sci. Technol. 2021, 135, 110158. [Google Scholar] [CrossRef]
  14. Jin, H.; Wang, Y.; Lv, B.; Zhang, K.; Zhu, Z.; Zhao, D.; Li, C. Rapid Detection of Avocado Oil Adulteration Using Low-Field Nuclear Magnetic Resonance. Foods 2022, 11, 1134. [Google Scholar] [CrossRef] [PubMed]
  15. Zhu, W.; Wang, X.; Chen, L. Rapid detection of peanut oil adulteration using low-field nuclear magnetic resonance and chemometrics. Food Chem. 2017, 216, 268–274. [Google Scholar] [CrossRef]
  16. Li, M.; Li, B.; Zhang, W. Rapid and non-invasive detection and imaging of the hydrocolloid-injected prawns with low-field NMR and MRI. Food Chem. 2018, 242, 16–21. [Google Scholar] [CrossRef]
  17. Kirtil, E.; Cikrikci, S.; McCarthy, M.J.; Oztop, M.H. Recent advances in time domain NMR & MRI sensors and their food applications. Curr. Opin. Food Sci. 2017, 17, 9–15. [Google Scholar]
  18. Cheng, S.; Wang, X.; Li, R.; Yang, H.; Wang, H.; Wang, H.; Tan, M. Influence of multiple freeze-thaw cycles on quality characteristics of beef semimembranous muscle: With emphasis on water status and distribution by LF-NMR and MRI. Meat Sci. 2019, 147, 44–52. [Google Scholar] [CrossRef]
  19. Tan, D.; Tang, X.; Zhang, Y.; Li, G.; Li, X.; Luo, Y.; Wu, S. Optimization of microwave vacuum drying process for horseshoe crisp slices and its moisture content variation. Food Res. Dev. 2024, 45, 107–115. [Google Scholar]
  20. Ren, A.; Cai, W.; Han, C.; Tang, X.; Duan, Z. LF-NMR combined with MRI analysis of moisture migration in black fungus during heat pump drying process. Food Res. Dev. 2023, 44, 10–16. [Google Scholar]
  21. Liu, J.; Li, L.; Xu, Q.; Wang, R.; Wu, L.; Li, Z. Research on the mechanism of low-pressure superheated steam drying of green radish chunks based on low field nuclear magnetic resonance. Packag. Food Mach. 2023, 41, 33–38. [Google Scholar]
  22. Ouyang, M.Y. Study on Color Change and Maillard Reaction Mechanism of Pumpkin Slices during Hot Air Drying; Hunan Agricultural University: Changsha, China, 2021. [Google Scholar]
  23. Chao, E.; Li, J.; Fan, L. Enhancing drying efficiency and quality of seed-used pumpkin using ultrasound, freeze-thawing and blanching pretreatments. Food Chem. 2022, 384, 132496. [Google Scholar] [CrossRef]
  24. Li, L.; Cheng, X.; Yang, S.; Luo, Z.; Liu, Z. A moisture content prediction model for hot air dried kiwifruit slices based on low field nuclear magnetic resonance. J. Agric. Eng. 2020, 36, 252–260. [Google Scholar]
  25. Wei, Z.; Zhu, W.; Bai, X.; Luo, L.; Ning, Y.; Si, M. Study on the moisture state of hot air dried peanut kernels based on low field nuclear magnetic resonance and electron microscopy. Chin. J. Cereals Oils 2022, 37, 213–220. [Google Scholar]
  26. Xu, X.; Ke, Y.; Tang, S.; Li, Y.; Sun, Y.; Wang, Q. Study on the Changes in Water Status of Yam During Hot Air Drying. Preserv. Process. 2020, 20, 177–180. [Google Scholar]
  27. Wang, J.; Geng, Y.; Liu, Y.; Hu, B.; Zhang, S.; Lu, Z.; Zeng, Q.; Chen, S. Exploring the Effect of Different Moisture Content on the Quality of Matured Chestnuts Based on Low Field Nuclear Magnetic Resonance Technology. J. Nucl. Agric. 2023, 37, 769–780. [Google Scholar]
  28. Chen, W.; Mu, H.; Wu, W.; Fang, X.; Han, Y.; Chen, H.; Gao, H.; Jin, L. Non destructive detection of moisture content in Australian nuts using low field nuclear magnetic resonance technology. J. Agric. Eng. 2020, 36, 303–309. [Google Scholar]
  29. Wen, Y. Dynamics and Quality Changes of Star Anise Dried by Far Infrared Irradiation and Hot Air; South China University of Technology: Guangzhou, China, 2019. [Google Scholar]
  30. Prothon, F.; Ahrne, L.; Sjoholm, I. Mechanismsand prevention of plant tissue collapse duringdehydration: A critical review. Crit. Rev. Infood Sci. Nutr. 2003, 43, 447–479. [Google Scholar] [CrossRef] [PubMed]
  31. Dai, J.; Fu, Q.; Huang, H.; Li, M.; Li, L.; Xu, L. Drying characteristics and quality optimization of green prickly ashes during vacuum pulsed drying. Trans. Chin. Soc. Agric. Eng. Trans. CSAE 2021, 37, 279–287. [Google Scholar]
  32. Xu, F.; Jin, X.; Zhang, L.; Chen, X.D. Investigation on water status and distribution in broccoli and the effects of drying on water status using NMR and MRI methods. Food Res. Int. 2017, 96, 191–197. [Google Scholar] [CrossRef]
  33. Lv, W.; Li, S.; Han, Q.; Zhao, Y.; Wu, H. Study of the drying process of ginger (Zingiber officinale Roscoe) slices in microwave fluidized bed dryer. Dry. Technol. 2016, 34, 1690–1699. [Google Scholar] [CrossRef]
  34. Pan, Y.; Duan, Z.; Zhong, J. Analysis of internalmoisture changes of persimmon slices during intermittent microwavedrying using low-field NMR. Sci. Technol. Food-Dustry 2021, 42, 33–39. [Google Scholar]
  35. Li, B.; Peng, G.; Luo, C.; Meng, G.; Yang, L. Vacuum drying kinetics of Sichuan pepper based on Weibull distribution function. Food Ferment. Ind. 2017, 43, 58–64. [Google Scholar]
  36. Wang, X.; Jia, C.; Wang, X.; Li, M.; Liu, F.; Dong, H. Study on moisture changes and quality during hot air drying of figs. Food Res. Dev. 2022, 43, 71–78. [Google Scholar]
  37. Si, M.; Zhu, W.; Bai, X.; Luo, L.; Ning, Y. Research on the drying characteristics of oil sand bean heat pumps based on low field nuclear magnetic resonance technology. Chin. J. Cereals Oils 2023, 38, 19–26. [Google Scholar]
  38. Wang, Y. Scanning transmission electron microscopy technology and its application in traditional Chinese medicine research. Anal. Test. Tech. Instrum. 2022, 28, 280–288. [Google Scholar]
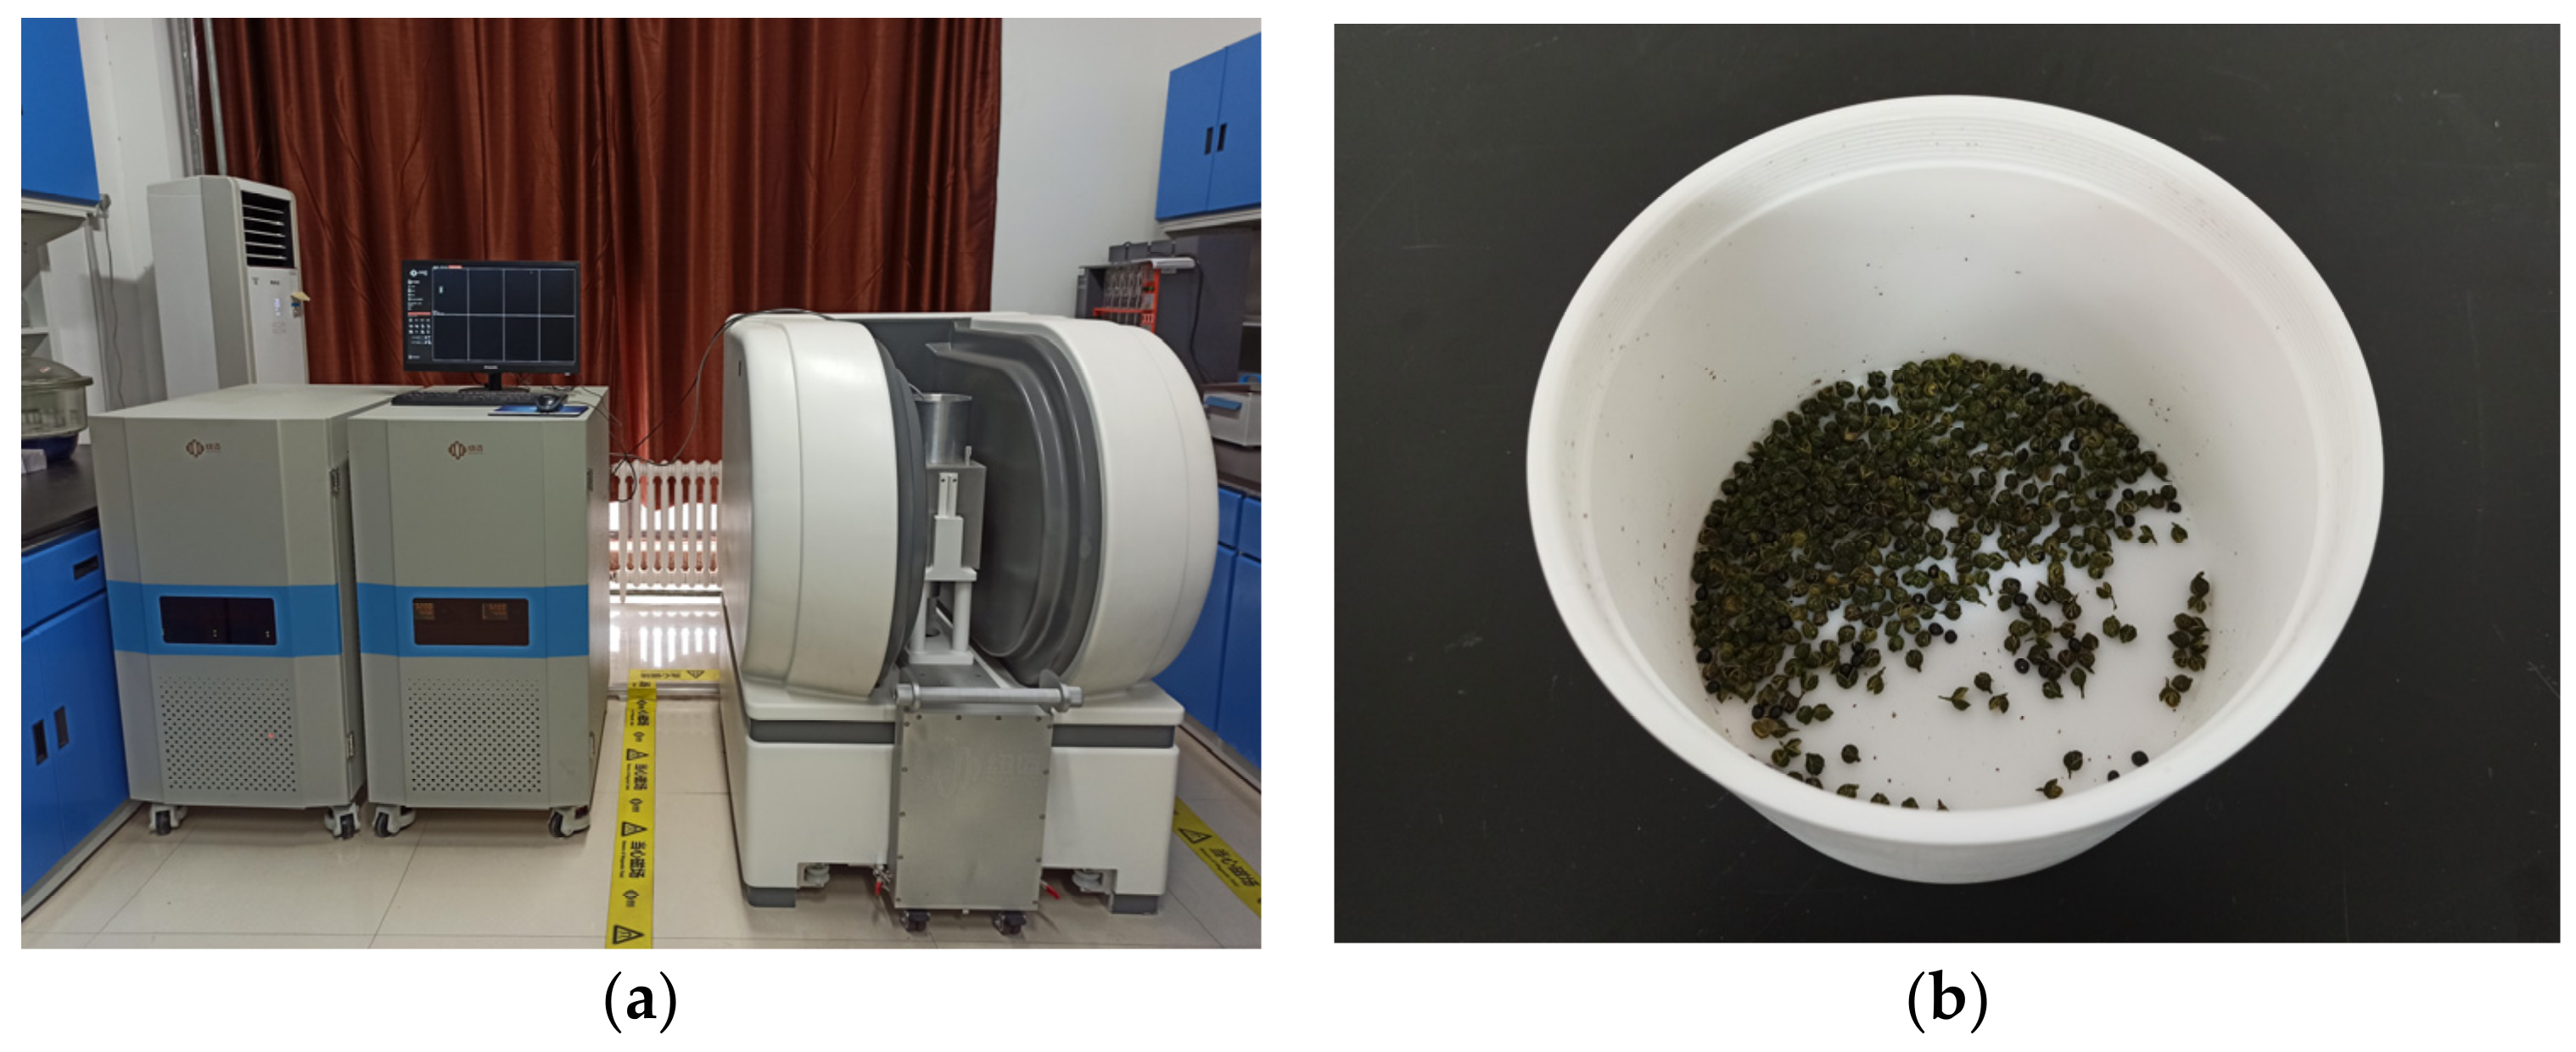
Figure 1. Scene graph of the LF-NMR analyzer (a) and the Green Sichuan Peppers sample (b).
Agriculture 14 01361 g001
Figure 2. The scene graph of the SEM analyzer (a) and the prepared samples (b).
Agriculture 14 01361 g002
Figure 3. The variations of transverse relaxation time with signal amplitude. (Note: T21 refers to relaxation peak of bound water, T22 refers to relaxation peak of immobile water, T23 refers to relaxation peak of free water).
Agriculture 14 01361 g003
Figure 4. Variation of T2 with amplitude signals during the drying process under 45 °C.
Agriculture 14 01361 g004
Figure 5. LF-NMR spectrum of different water states in Green Sichuan Pepper at drying temperatures of 45 °C (a), 55 °C (b) and 65 °C (c).
Agriculture 14 01361 g005
Figure 6. The variations of the water activity and the moisture content with the drying time at drying temperatures of 45, 55 and 65 °C.
Agriculture 14 01361 g006
Figure 7. Fitting curves of A2 and MC at drying temperatures of 45 °C (a), 55 °C (b) and 65 °C (c).
Agriculture 14 01361 g007
Figure 8. The microstructure of the surface (a) and a section (b) of the fresh Green Sichuan Pepper pericarp.
Agriculture 14 01361 g008
Figure 9. Microstructure of Green Sichuan Pepper pericarp at 60 min (a) and 360 min (b) with drying temperature of 45 °C.
Agriculture 14 01361 g009
Figure 10. Microstructure of Green Sichuan Pepper pericarp at 60 min (a) and 360 min (b) with drying temperature of 55 °C.
Agriculture 14 01361 g010
Figure 11. Microstructure of Green Sichuan Pepper pericarp at 60 min (a) and 360 min (b) with drying temperature of 65 °C.
Agriculture 14 01361 g011
Figure 12. The local positioning (a), comprehensive EDS (b), and energy spectrum elemental distribution (c) images of Green Sichuan Pepper epidermal samples at 60 min under 55 °C.
Agriculture 14 01361 g012
Figure 13. The local positioning (a), comprehensive EDS (b), and energy spectrum elemental distribution (c) images of Green Sichuan Pepper epidermal samples at 360 min under 55 °C.
Agriculture 14 01361 g013
Table 1. Details of the adopted instruments and equipment in experiments.
EquipmentTypeManufacturer
Electric constant temperature drier202-00Shanghai Guangdi Instrument Equipment Company, Shanghai, China
Thin-layer drying experiment bedBC-2 Changchun Jida Instrument Company, Changchun, China
Halogen water-determination meterFBS-760AXiamen Forbes Testing Equipment Company, Xiamen, China
Low field magnetic resonance imaging analyzerMesoMR12-060H-1Suzhou Newmai Analytical Instrument Company, Suzhou, China
Thermal field emission scanning electron microscopeSigma300Carl Zeiss AG, Germany, Jena, Germany
Electronic scaleYP-6002BShanghai Lichen Instrument Technology Company, Shanghai, China
Sample sieve50 mesh; diameter: 20 cm-
Table 2. Variations of T2 and A2 with the drying time at different drying temperature.
Drying Temperature/°CDrying Time/hT21/msT22/msT23/msA21A22A23
4502.6 ± 0.347.7 ± 0.7766.3 ± 1.16973.8 ± 1.437,433.8 ± 2.7887.5 ± 1.3
0.51.8 ± 0.163.0 ± 0.6486.3 ± 0.16099.1 ± 1.025,122.5 ± 1.34908.9 ± 3.1
11.1 ± 0.0166.4 ± 1.3-27,916.7 ± 2.14735.9 ± 0.5-
20.6 ± 0.141.5 ± 1.1235.5 ± 0.118,921.1 ± 1.41911.8 ± 4.1171.7 ± 1.5
30.5 ± 0.219.3 ± 1.3191.2 ± 0.114,230.3 ± 2.01577.8 ± 0.6499.4 ± 0.6
40.4 ± 0.013.7 ± 1.1-7574.3 ± 1.72201.5 ± 2.4-
50.4 ± 0.214.7 ± 0.3-5755.8 ± 0.61914.7 ± 1.7-
60.4 ± 0.313.2 ± 0.7-4849.3 ± 1.51475.1 ± 0.5
5502.6 ± 0.347.7 ± 2.3766.3 ± 1.36973.7 ± 1.537,433.8 ± 1.3887.5 ± 0.8
0.51.7 ± 0.2117.6 ± 1.5622.3 ± 1.722,523.9 ± 1.63433.5 ± 1.587.7 ± 0.4
10.9 ± 0.158.7 ± 1.7-21,129.8 ± 0.81962.2 ± 1.8-
20.5 ± 0.015.7 ± 0.5109.7 ± 0.99936.8 ± 1.91385.5 ± 1.32233.3 ± 2.6
30.4 ± 0.322.2 ± 0.5 6970.8 ± 0.31392.9 ± 0.9-
40.4 ± 0.29.0 ± 0.351.1 ± 1.23898.9 ± 0.51044.1 ± 1.02037.0 ± 0.7
50.4 ± 0.014.7 ± 0.3252.3 ± 2.14349.6 ± 1.01395.3 ± 0.3614.2 ± 1.3
60.4 ± 0.112.7 ± 1.6219.4 ± 0.63881.5 ± 0.41225.2 ± 0.3335.1 ± 2.1
6502.6 ± 0.147.7 ± 1.5766.3 ± 1.56973.7 ± 0.837,433.8 ± 2.3887.5 ± 1.6
0.51.1 ± 0.0155.2 ± 2.2-24,043.9 ± 0.32197.1 ± 1.7-
10.6 ± 0.029.3 ± 1.7-13,388.7 ± 1.12009.0 ± 2.0-
20.4 ± 0.114.7 ± 1.7155.2 ± 1.95409.6 ± 0.31785.6 ± 0.11174.4 ± 2.1
30.4 ± 0.416.8 ± 1.995.5 ± 1.73701.0 ± 1.61262.3 ± 0.71920.6 ± 3.7
40.4 ± 0.115.7 ± 1.5109.7 ± 2.83901.5 ± 1.41617.6 ± 3.31174.3 ± 2.9
50.4 ± 0.013.7 ± 1.3-4342.3 ± 1.21959.1 ± 1.8-
60.2 ± 0.012.3 ± 0.5-3662.9 ± 0.31688.4 ± 1.4-
Table 3. Pearson correlation between low-field nuclear parameters and moisture content.
IndexT21/msT22/msT23/msA21A22A23A2
45 °C MC0.878 ***0.6320.766 *0.3440.771 *0.515 *0.986 *
55 °C MC0.942 ***0.724 *0.719 *0.5910.727 *−0.1510.977 ***
65 °C MC0.4130.6170.7290.537 **0.811 *−0.119 *0.993 **
Note: *** refer to p < 0.005, significantly correlated at the 0.005 level; ** refer to p < 0.01, significantly correlated at the 0.01 level; * refer to p < 0.05, significantly correlated at the 0.05 level.
Table 4. Comparison of measured and predicted moisture content of Green Sichuan Pepper at different drying temperatures.
Drying Temperature/°CDrying Time/hA2Predicted Moisture Content/%w.b.Measured Moisture Content/%w.b.Relative Deviation/%
45 °C043,295.0272.3169.843.54
0.537,130.5762.1462.210.11
134,652.5858.0557.720.58
223,004.538.8343.9511.65
319,307.4232.7326.8022.12
49875.79517.1716.732.62
57770.48813.7011.4219.96
66124.49410.988.9622.54
55 °C043,399.574.2369.916.18
0.534,730.3459.1553.1811.23
128,652.8448.5742.9113.20
217,004.3528.3125.4711.13
39607.715.4312.6921.63
46975.2110.859.7411.49
54510.1696.575.979.90
63924.8695.555.733.20
65 °C043,295.8770.9670.890.09
0.530,130.6348.4447.392.23
120,495.5831.9726.7319.59
211,005.6115.7413.3218.16
38025.5410.648.9718.65
45517.7956.366.114.09
55370.4886.105.726.69
64723.4945.004.901.92
Disclaimer/Publisher’s Note: The statements, opinions and data contained in all publications are solely those of the individual author(s) and contributor(s) and not of MDPI and/or the editor(s). MDPI and/or the editor(s) disclaim responsibility for any injury to people or property resulting from any ideas, methods, instructions or products referred to in the content.