Abstract
Silphium perfoliatum, an energy crop with a high fiber content but low concentrations of fermentable carbohydrates, presents challenges for complete fermentation in biogas production. To overcome this, a bioeconomic approach proposes the use of the fibers for paper and board production, which requires high-quality silage with minimal butyric acid, which affects the marketability of the fibers. This study aims to optimize the silaging process of Silphium perfoliatum by investigating the effects of harvest date, bacterial cultures and additives on fermentation results. Laboratory experiments were conducted to evaluate the effect of three harvest dates on fermentation acid composition, with a focus on increasing lactic acid production to inhibit butyric acid formation. Results indicate that an early harvest date (early September) is critical for achieving stable fermentation and minimizing ensiling losses. The addition of sugar-rich additives, such as syrup, was found to be essential, especially for later harvest dates. Despite these interventions, a late harvest (early November) consistently resulted in suboptimal fermentation. The results suggest that optimizing harvest timing and incorporating appropriate additives are key strategies for producing high quality silage and ensuring the suitability of Silphium perfoliatum fibers for industrial applications.
1. Introduction
The German biogas sector has grown to 9600 plants in the last two decades [1]. With changing EEG requirements the cultivation of energy maize is expected to decline in favor of diverse, high-biodiversity energy crops. Silphium perfoliatum (cup plant), native to eastern North America, is gaining importance as a bioenergy crop in Germany [2,3]. Although originally introduced as a forage crop, it is now primarily cultivated for biogas production. Its growth characteristics and autecology do not exclude the possibility of invasive potential [4]. Due to its perennial growth and ecological benefits, cup plants fit into the sustainable bio-economy strategy of Baden-Württemberg [5]. However, their high fiber content results in a low methane yield (250 LCH4kgoDM−1) compared to maize silage (355 LCH4kgoDM−1) [6]. The plant’s fibers offer a potential alternative to short-fiber pulp in papermaking [7]. Effective processing can produce high-quality pulp, while the residual liquid and cell components can be used for energy [8,9]. Ensiling is necessary for year-round use, but low sugar content often leads to butyric acid formation, which negatively affects fiber quality and marketability.
The objective of ensiling is to maintain the nutritional value of forage plants, prolong their shelf life, and prevent spoilage, thereby ensuring optimal methane yields in biogas production. During ensiling, lactic acid bacteria ferment plant carbohydrates into organic acids under anaerobic conditions, thereby lowering the pH and inhibiting the growth of spoilage microorganisms and enzymes [10]. This process necessitates the presence of adequate moisture, fermentable sugars, and an oxygen-free environment, which can be managed through the techniques of wilting and proper coverage. However, the colonization of natural lactic acid bacteria is unpredictable [11,12]. For optimal ensiling, a minimum of 100,000 lactic acid bacteria per gram of silage is essential, as evidenced by studies [13,14]. The addition of additives can enhance fermentation and prolong shelf life; however, excessive dryness or moisture, low sugar content, elevated buffer capacity, and contamination can impede fermentation and pH reduction. High-quality silage should comprise approximately 80% lactic acid in the total acid content, with drier silage generally leading to diminished acid formation [15].
Ensiling agents are used to prevent the growth of undesirable microorganisms, thereby minimizing nutrient losses, preserving substrate quality, and avoiding defects such as fermentation issues and reheating [16]. The effective application of these agents relies on proper selection, accurate dosing according to manufacturer guidelines, and even distribution throughout the substrate. These additives help to reduce nutrient and energy losses by mitigating undesirable transformations in the silage. Ensiling agents vary in composition and action. Lactic acid bacteria, for example, fall into two categories: homofermentative and heterofermentative. Homofermentative bacteria lower the pH and increase lactic acid levels, inhibiting harmful microbes. In contrast, heterofermentative bacteria produce more acetic acid, which helps protect the silage from mold and yeast degradation, especially under aerobic conditions [10].
Inoculum cultures containing homofermentative lactic acid bacteria are preferred for enhancing fermentation quality. These bacteria rapidly convert plant sugars in silage to lactic acid, lowering the pH and effectively suppressing undesirable fermentation microbes [9]. Species like Enterococcus, Pediococcus, and certain Lactobacillus produce lactic acid crucial for silage preservation [14]. Different strains within these species are considered when selecting silage inoculants to ensure optimal fermentation properties [9]. However, homofermentative fermentation, lacking acetic and butyric acids, may lead to aerobic instability, as these acids typically suppress yeasts [9,11,12].
In contrast, heterofermentative inoculum cultures produce acetic acid alongside lactic acid, benefiting silage preservation by inhibiting yeasts and molds and extending storage life after appropriate fermentation [11,16]. Selected strains of Lentilactobacillus buchneri and Lactobacillus brevis are commonly employed for this purpose [9]. Despite higher fermentation losses, the prevention of silo reheating losses outweighs these drawbacks [12]. Additionally, the addition of external sugars during ensiling provides nutrients that support lactic acid bacteria, further stabilizing the ensiling process [10].
The objective of this study is to develop an optimized harvesting and ensiling process that ensures stable lactic acid fermentation, rapid pH reduction in the cup plant, and ultimately improved storage stability to inhibit the loss of methane potential for anaerobic digestion. This will be achieved by promoting sufficient lactic acid formation while preventing butyric acid formation, thereby reducing organic matter losses and increasing biogas yield. Furthermore, enhanced ensilability has the potential to positively impact the economics of the entire fiber production process. To enhance the quality of silage derived from cup plant, particularly by reducing the concentration of butyric acid, the study employed two strategies: (a) harvesting the plants at the optimal growth stage and (b) utilizing suitable additives. The ensiling process is optimized through two main strategies: the addition of ensiling aids based on microbial cultures (bacterial preparations), and the inclusion of small amounts of sugar-containing additives (such as beet syrup). These measures facilitate the rapid establishment of microbial cultures and pH reduction, which is essential for preventing improper fermentation within the silo.
2. Materials and Methods
2.1. Silage Additives
Different silage additives were investigated in this study. The silage additive SILASIL ENERGY.XD® (Schaumann BioEnergy GmbH, Pinneberg, Germany) combines three highly effective strains of lactic acid bacteria: L. diolivorans, L. rhamnosus and L. buchneri. This silage additive is a combination product of homo- and heterofermentative lactic acid bacteria. The metabolism of L. diolivorans is at the center of the action. Short generation times and strong competition give the selected bacterial strains an advantage over natural pathogens. The rapid formation of lactic acid in the initial phase of the fermentation process creates the basis for the synthesis of further preservative metabolites (e.g., acetic acid, 1-propanol). With the help of these heterofermentative fermentation processes, high-quality silage can be protected from energy-depleting molds and yeasts [17].
In this study, the silage additive SILASIL ENER-GY. XD® (Schaumann BioEnergy GmbH, Pinneberg, Germany) was examined. It combines three potent strains of lactic acid bacteria, L. diolivorans, L. rhamnosus, and L. buchneri, encompassing both homo- and heterofermentative types. L. diolivorans plays a pivotal role in its metabolism, characterized by rapid generation times and strong competitive advantages over natural pathogens. The early production of lactic acid sets the foundation for additional preservative metabolites such as acetic acid and 1-propanol through heterofermentative processes. This approach effectively safeguards high-quality silage from energy-depleting molds and yeasts [17].
Another silage additive from the same manufacturer is SILASIL ENERGY.BG® (Schaumann BioEnergy GmbH, Pinneberg, Germany), which contains only homofermentative lactic acid bacteria strains L. buchneri and L. brevis. The product contains homofermentative lactic acid bacteria specially selected for biogas production, which helps to protect protein-rich and low-sugar energy crops. The homofermentative fermentation acid profile effectively protects against energy losses through low pH values and a high lactic acid content. The intensive lactic acid formation minimizes the fermentation process losses during ensiling, while at the same time achieving a targeted effect against the multiplication of clostridia in the ensiled material [18].
The silage additive Cow-Fresh-WET (B&K-Agrargas, Dietersheim, Germany) is a combination product of two homofermentative lactic acid bacteria strains for rapid lactic acid formation (acceleration of the ensiling process) and a heterofermentative L. buchneri strain for controlled acetic acid formation [19]. This can be considered to be comparable with SILASIL ENERGY.XD.
As a source of sugar, “Goldsaft” (Graftschafter, Meckenheim, Germany) was used, which is a natural sugar beet syrup made from sugar beets with no chemical additives. This juice is filtered and further boiled down to obtain a syrup with a minimum dry substance of 780 g kg−1 and has a sugar content of about 650 to 700 g kg−1 [20].
2.2. Sampling
One of the main objectives of the study was to investigate the influence of harvest time on the material and energetic utilization of cup plant in order to optimize the monosilage and storage of the cup plant. Three different harvesting dates were set for the investigations (Figure 1), with harvesting taking place at four-week intervals on (1.) 01.09.21, (2.) 01.10.21 and (3.) 02.11.21 (Table 1). The fresh cup plant was harvested at the ‘Unterer Lindenhof’ (Eningen, Unter Achalm, Germany), an agricultural research station of the University of Hohenheim. At ‘Unterer Lindenhof’, an average annual precipitation of 770 mm and an average temperature of 11.6 °C were measured over the last five years [21]. At the time of each cup plant harvest, the weather was sunny and the stock was dry. Harvesting took place in the same field (48°28′15.2″ N 9°16′14.9″ E) on different harvest dates. The cup plant was harvested manually as a whole plant, transported promptly to the University of Hohenheim and chopped on campus with a PTO-driven disk chopper. The cup plant was harvested according to the practice prevalent in Germany, where the stock is harvested from the field with a forage harvester and then freshly ensiled. Therefore, the day of harvesting corresponds to the day of ensiling.
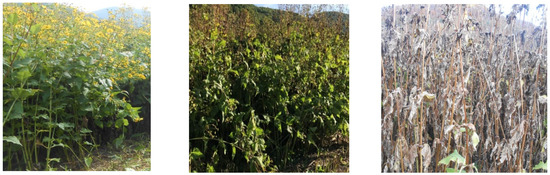
Figure 1.
Samples from different harvest dates prior to ensiling: first harvest date (left), second harvest date (center), third harvest date (right).

Table 1.
Harvest dates of the cup plant at the Unterer Lindenhof in Eningen.
Table 2 below presents a correlation between the respective harvest dates and the preceding physiological characteristics of the cup plant. During the study, an increase in dry matter content was observed with later harvesting.
Table 2.
DM/oDM content and area yield of the cup crop at harvest.
2.3. Preparation of Treatments
The three harvest dates each featured six variants of treatments with additives, which were sampled at 0, 3, 14, 30 and 90 days in triplicate and subsequently individually examined and analyzed (Table 3). This resulted in a total of 270 samples or individual jars. For the performance of the experiment, the DLG guideline for the ensiling and testing of the ensiling additives was used for orientation [13].
Table 3.
Treatment codes (n = 18) and dosing based on the silage additives and the respective harvest date.
The different harvest dates were treated with the different silage additives immediately after chopping and then ensiled in airtight cylindrical glasses with a volume of 1590 mL (WECK, Bonn, Germany).
The sugar content was artificially increased by adding beet syrup to ensure better lactic acid formation. The dosage is according to DLG guidelines, with 3% beet syrup based on fresh silage matter [10].
The dosage of each ensiling agent is based on the manufacturer’s instructions. For this purpose, 0.1 g or 0.2 g of each silage additive was diluted with 1000 mL of water. Subsequently, 200 mL of the mixed silage additive was sprayed onto 20 kg of cup plant silage with a compressed air spray bottle, mixed thoroughly and ensiled in the glasses. After 0, 3, 14, 30 and 90 days, the glasses were opened.
2.4. Determination of the Biogas Potential
The methane potential of each sample was determined using the Hohenheim biogas yield test (HBT) according to VDI 4630 [22,23]. The HBT is a biogas yield test that can be used to determine both the maximum methane yield and the methane content, as well as the kinetics of methane formation and possible inhibitors in the biogas process. The HBT consists of 100 mL glass syringes sealed with silicone and a plastic clip. During the experiment, the glass syringes are placed in a rotating disk, which is placed in a heating cabinet. The volume of methane produced is determined by reading a volume scale on the glass syringe, with a measurement taken each time more than 20 mL of gas is produced in the flask. In addition to the volume, the methane content is also determined at each measurement. This is carried out by infrared measurement (Advanced Gasmitter, Pronova Analysetechnik, Berlin, Germany). Before each measurement, the gas is dehumidified with a desiccant (SICAPENT®, Merck KGaA, Darmstadt, Germany). The residence time in the HBT was 35 days at 37 °C. Each sample was replicated three times. The inoculum/substrate ratio was 2.25:1 based on oDM. The inoculum slurries were taken from a 400 L laboratory reactor operated at 37 °C with controlled feeding. Feeding was adjusted so that the inoculum had a low intrinsic methane potential. In addition to the inoculum correction according to VDI 4630, a positive correction was also performed with two standards that have been used in recent studies (hay, concentrated feed). Further information can be found in Hülsemann et al. (2020) [24].
2.5. Analytic Parameters
Dry matter (DM) and oDM were measured according to DIN EN 12879 [25] and DIN EN 12880 [26]. A DM/oDM correction (with regard to results of the HBT experiments) was conducted for all samples according to Weißbach et al. [27,28]. To determine the DM/oDM correction and to evaluate the silage quality and process, the fatty acid concentrations of all samples were determined. This was conducted using a gas chromatograph (GC 2010plus with AOC-20i autoinjector, Shimadzu, Kyoto, Japan) and high-pressure liquid chromatography (Bischoff AnalysetechnikGmbH, Leonberg, Germany). Volatile fatty acids were determined by gas chromatography using an FID detector, a capillary column with—50 m length, 0.32 mm ID and 1.2 µm film, (CP-Wax 58/FFAP CB, Agilent Technologies, Santa Clara, CA, USA) and helium as the carrier gas. The injection temperature was 150 °C and the detector temperature was 280 °C. Samples were acidified with 17% phosphoric acid prior to analysis. While the liquid could be used directly, only the solid supernatant was used. This was previously centrifuged in a centrifuge (5415 D, Eppendorf AG, Hamburg, Germany). An RI detector and column (BioRad Aminex, Hercules, CA, USA) HPLC column HPX-87H (7.8 × 300 mm; part. size: 5.0 μm) and BioRad precolumn HPX-87H) were used for the determination of lactic acid and Al alcohols by HPLC. For sample preparation, the sample material was diluted with 0.2 N sulfuric acid and water. This solution was centrifuged in a centrifuge (Eppendorf Centrifuge 5415 D, Eppendorf AG, Hamburg, Germany) at 132,000 rpm. For the determination of solids, the supernatant was centrifuged prior to the steps described here, analogous to the procedure for the gas chromatograph. The pH was determined using a pH meter (type 211, HANNA Instruments Woonsocket, RI, USA). All chemical measurements were performed at least in duplicate.
2.6. Characterization of Silage According to DLG-Key 2006
The DLG-key is suitable for assessing the fermentation quality of green fodder silages of all types (grass, legumes, green cereal, maize, and cereal whole plant silages, cruciferous and beet leaves), irrespective of the silage process, dry matter content, and the use of chemical or biological additives. The characteristics of the fermentation process and nutrient degradation in the silo are used. The evaluation of fermentation quality provides important information about the extent of nutrient losses that have occurred, the decrease in nutrient and energy content that has occurred and the storage stability of the silage in the silo [29]. Extensive studies at Humboldt University in Berlin have shown that the fermentation quality can be reliably and discriminately derived from the content and mutual ratio of butyric acid and acetic acid [30]. Although the inclusion of the pH value provides an additional indication of whether and to what extent acidification has occurred, the weighting has been reduced compared to previous guidelines [30]. The butyric acid and acetic acid content, as well as the pH value, are evaluated individually with points, and a summary evaluation is derived from the total score (Table 4) [30]. The silage is awarded points based on the lactic acid and acetic acid contents achieved, as well as the low pH values. Points are deducted for the presence of excessive levels of acetic acid and, in particular, butyric acid, as well as for excessive pH values. Consequently, the maximum achievable score is 100 points.
Table 4.
Determination of the score according to the DLG key 2006 using regression equations.
3. Results and Discussion
3.1. Acidity and Content Analysis of Silage Samples from the First Harvest Date (01.09.21)
Table 5 shows the results of the ensiling tests from the first harvest date. The dry matter content varied between 19.11% and 20.85%. The total sugar content, consisting of sucrose, glucose and fructose, was 86.53 g/kg DM at harvest time, which was the highest sugar content compared to the individual harvest dates. The pH value, an important factor in assessing silage quality, confirms that acidification took place in all treatments, creating an acidic environment (pH 4.05–4.78) that protects the silage from bacterial conversion. Lowest pH, highest methane yield and highest lactic acid concentration were obtained with the beet syrup variant and the Energy BG (1SBS_BG) silage additive. The silage additive 1XD (homo- and heterofermentative) showed a product-related increased acetic acid formation (63.07 g/kg DM) with only low lactic acid concentrations (16.46 g/kg DM). Acetic acid is a weaker acid compared to lactic acid, which may result in a higher pH. Due to the high acetic acid concentrations, 1XD silage additive received a poor score of 45 points according to the DLG key [30]. The n-butyric acid content, which indicates fermentation issues, was unusually high (6.35 g/kg DM) only in the 1CFW ensiling agent, in direct comparison with the other variants. For this silage additive, butyric acid levels were detected in all three replicates. Overall, however, the butyric acid content at harvest date 1 was low. The methane yield per kg oDM was 257–276 LCH4kgoDM−1, and only the 1SBS_BG treatment showed a significantly higher methane yield. This indicates a good silage quality, which was also confirmed by the DLG key [30]. Since ensiling is a biological process in which material transformations take place, ensiling is associated with losses of dry matter (DM) or organic dry matter (oDM). Dry matter losses during ensiling were less than 1% of the initial mass. This value can be considered as very low compared to agricultural practice. According to a study by Köhler et al. [31], the guideline value for unavoidable dry matter losses during ensiling in a mobile silo is 8%, regardless of the type of forage. The results of the study show that the ash content of all samples was between 9% and 13% in dry matter. A crude ash content of 10% or more in the dry matter may indicate an elevated butyric acid (clostridia) content in silage [11,13]. Moreover, a high crude ash content amplifies the silage’s buffering capacity [11,13].
Table 5.
First harvest date, 01.09.21, dry matter, organic dry matter, methane potentials, pH, acid and nutrient concentrations of samples, FM = fresh matter, oDM = organic dry matter, - = below <0.01 g/kgDM. Data after 90 days of ensiling. Different letters indicate significant differences between the treatments for p < 0.05 TUKEY HSD/KRAMER, mean ± standard deviation of three replicates.
Figure 2A shows the course of the pH over the ensiling period of 90 days. As can be seen, after three days, the treatments with beet syrup (1SBS and 1SBS_BG) generally already had a lower pH value, which indicates a faster and higher acid production. Compared to the control variant (1CV), with a pH of 5.16, a pH of 4.56 was measured after 3 days in the experimental variant with beet syrup and silage additive BG (1SBS_BG), which corresponds to a direct reduction of −12%. Assuming that a pH value of 4 should be reached for good silage quality, the treatment 1SBS_BG (pH value 4.56) reached 79% of this value after 3 days compared to the initial value (pH value 6.75), while the control variant without silage additive reached only 54% (pH value 5.16) of this value. The small standard deviation between the three replicates shows that there were hardly any fluctuations in the pH value, which indicates a uniform ensiling process in the respective test variant.
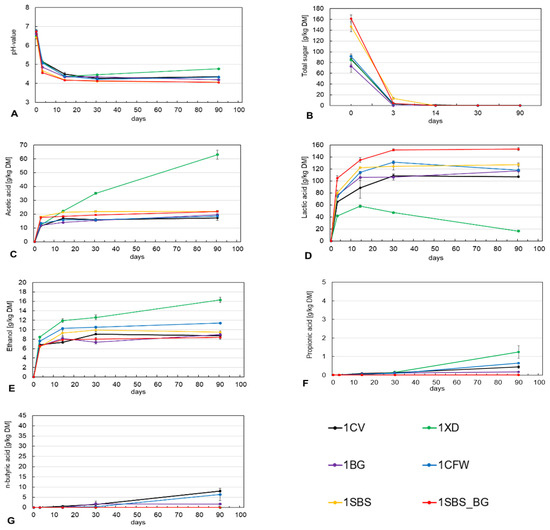
Figure 2.
Course of pH (A), total sugar (B), acetic acid (C), lactic acid (D), ethanol (E), propionic acid (F) and butyric acid (G) during fermentation for first harvest date, 01.09.21.
Figure 2B shows the total sugar in g/kg DM. The addition of 3% sugar beet syrup should increase the sugar content to 100 g/kg DM at a DM content of 19.32%. However, according to the laboratory results, the sugar content could only be increased by about 70 to 90 g per kg DM. These differences may be due to an uneven application of the syrup and sampling.
Plant sugars are converted to organic acids by anaerobic microorganisms in the silage [10]. One of the most important acids is lactic acid, which, due to its very low pH, is largely responsible for the preservation and quality of the silage [10,12]. Due to the artificially increased sugar content, the 1SBS and 1SBS_BG treatments were able to produce more lactic acid than the other treatments. In particular, the 1SBS_BG treatment converted almost completely into lactic acid (g/kg DM). Furthermore, it can be seen that almost all treatments with and without silage additives were able to increase the yield in relation to the total sugar content at the beginning of ensiling. Only the 1XD treatment showed a significant decrease, due to the heterofermentative effect. In addition to lactic acid, acetic acid, ethanol and propionic acid were mainly formed in this variant (see Figure 2C,E,F).
Ideally, acetic acid (Figure 2C) is produced by natural heterofermentative lactic acid bacteria or those added by silage additives. However, undesirable bacteria can also produce acetic acid, especially coliform bacteria. Acetic acid bacteria (enterobacteria) are considered fermentation inhibitors because they convert sugars via pyruvic acid to acetic acid, formic acid, carbon dioxide, and water. Acetic acid is important for aerobic stability and protects the silage from reheating, as the yeasts responsible for reheating cannot tolerate acetic acid. The challenge, therefore, is to introduce just enough acetic acid into the silage to ensure aerobic stability, but not too much, as energy is extracted from the substrate to produce acetic acid, which generates heat [16]. The tested concentrations indicate favorable storage and aerobic stability, apart from the sample containing the 1XD silage additive. Acetic acid fermentation also has a negative effect on lactic acid fermentation by depriving the lactic acid bacteria of sugars and by exceeding the optimum temperature range of the lactic acid bacteria due to heat development [16]. This phenomenon is clearly evident in the silage additive treatment 1XD. Additionally, this bacterial species constitutes a dominating part of the epiphytic microflora with an epiphytic bacterial count, which is ten to one hundred times higher than that of the lactic acid bacteria [14]. Therefore, the concentration of acetic acid should be 20–30 g/kg DM [6]. All treatments met this criterion, except the 1XD treatment, which had a concentration of 63.1 g/kg DM. To maintain the desired acetic acid concentration, it is crucial to ensure adequate air exclusion and to achieve a rapid reduction in the pH value by lactic acid formation. The coliform bacteria cannot thrive in low pH conditions and consequently cease their production, leading to the pH drop observed after 3 days, as indicated in Figure 2C. The increase in acetic acid in the 1XD treatment 1XD can be attributed to the acetic acid producers. The 1CFW treatment does not exhibit a significant increase in the production of acetic acid, despite the inclusion of the heterofermentative strain L. buchneri. Nevertheless, the level of acetic acid concentration aligns with the desired standards for this particular variant.
Ethanol (Figure 2E) is a by-product of yeast metabolism. This means that its formation and quantity can be prevented by controlling yeast growth. This metabolite is associated with microbial spoilage and higher DM mass losses, but also with the reduced aerobic stability of the silage. The ethanol content in silage should therefore be below 20 g/kg DM for corn and below 10 g/kg DM for grass silage [6]. As shown by the silage progress in terms of ethanol production, the 1XD and 1CFW treatments produced more ethanol due to heterofermentative lactic acid formation. A similar effect can be observed in Figure 2F for the formation of propionic acid.
Propionic acid (Figure 2F) was not formed in significant amounts at the time of the first harvest. No measurable amounts of propionic acid were formed in the 1SBS and 1SBS_BG treatments. High concentrations indicate fermentation issues where energy is lost.
The butyric acid bacteria (Clostridia) are strictly anaerobic fermentation spoilers and enter the silage mainly through contamination. Their harmful effect is based on the degradation of carbohydrates, lactic acid and various amino acids with the formation of butyric acid, acetic acid, carbonic acid and hydrogen [16]. Degradation has far-reaching effects. During the formation of one mole of butyric acid from two moles of lactic acid, the pH increases and the preservative effect decreases. Figure 2G illustrates this effect in the 1CFW silage additive treatment. Additionally, Figure 2C shows that the lactic acid content per g/kg DM declines due to butyric acid fermentation, which causes the pH to increase once again. It is recommended that the butyric acid content in silages should not exceed 3 g/kg DM [13]. Only the control (1CV) with 8.03 g/kg DM and the treatment 1CFW with 6.35 g/kg DM were higher than the recommended maximum (see Figure 2G). In the 1XD, 1SBS and 1SBS_BG treatments, no detectable butyric acid was formed. This indicates that the multiplication of Clostridia and the formation of butyric acid are sufficiently inhibited by the formation of acetic acid when treatment with 1XD is carried out.
3.2. Acidity and Content Analysis of Silage Samples of the Second Harvest Date (01.10.21)
Table 6 shows the results of the second harvest. By harvesting one month later, the DM content of the cup crop increased from 19.32% to 24.55%. The ash content remained high, at about 11%, which may have a relevant influence on ensiling due to the buffer capacity. Overall, less acid was formed on the second harvest day compared to the first harvest day (Table 5), resulting in a significantly higher pH, especially in the low lactic acid variants with a pH above 5. This is due to the lower total sugar content in the dry matter, which decreased by 13% to 75.20 g/kg DM in the control due to the later harvest. Due to the aging of the plant material and the increased fiber content, which meant that less fermentable sugar was available overall, the risk of fermentation issues increased enormously. This is particularly evident in the extremely high butyric acid concentrations observed in the two treatments, 2CV (34.32 g/kg DM) and 2BG, with the homofermentative silage additive (27.24 g/kg DM). Ultimately, the 2CV exhibited a greater concentration of butyric acid than lactic acid, which could have a detrimental impact on methane yield and result in a significant increase in odor production. However, a greater production of butyric acid was detected overall, likely due to the later harvest. Very good silage quality could only be achieved by adding syrup and silage additives at the second harvesting day. In the evaluation of the silage quality, the treatment 2SBS_BG achieved a score of 95 according to the DLG key, which shows that in the other treatments neither the stock of natural lactic acid bacteria nor the sugar content of the cup plant was sufficient at the second harvest day to ensure stable ensiling. The 1SBS treatment without the external addition of lactic acid bacteria achieved only a satisfactory result, indicating that the use of silage additives to improve silage quality seems reasonable when the sugar content is sufficient. The heterofermentative silage additive 2XD again produced more acetic acid than lactic acid on the second harvest day, which is why the silage result according to the DLG key must be classified as poor. From the results of the acid analysis at the second harvest day, it is clear that the positive effect of silage additives on silage quality increased significantly compared to the untreated sample and could be controlled by their addition.
Table 6.
Second harvest date, 01.10.21, dry matter, organic dry matter, methane potentials, pH, acid and nutrient concentrations of samples, FM = fresh matter, oDM = organic dry matter, - = below <0.01 g/kgDM. Data after 90 days of ensiling. Different letters indicate significant differences between the treatments for p < 0.05 TUKEY HSD/KRAMER, mean ± standard deviation of three replicates.
As can be seen in Figure 3B, the total sugar content, with the exception of the 2SBS_BG treatment, was about −10 g/kg DM lower than on the first harvest date (Figure 2B). It is also noticeable that the sugar available for the ensiling process was not metabolized or converted to acid until 14 days after the second harvest date, compared to 3 days after the first harvest date. This means that the ensiling process is slower overall, resulting in less lactic acid being formed, which ultimately leads to a higher pH and weaker acidification of the silage. This may indicate that the lactic acid bacteria population has decreased compared to the first harvest date. Due to the weaker and later acidification, undesirable bacterial strains such as Clostridia can proliferate strongly during this period, causing the pH to rise again after 14 days, especially in the 2CV, 2XD and 2BG treatments (see Figure 2A). In this context, pH values above 4.5 in silages are considered critical with regard to fermentation issues [13].
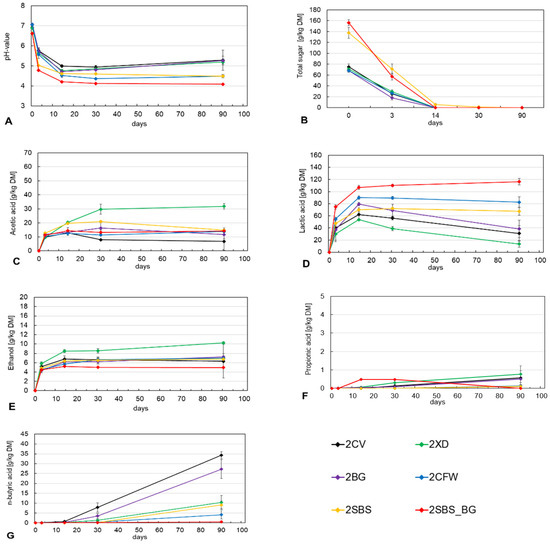
Figure 3.
Course of pH (A), total sugar (B), acetic acid (C), lactic acid (D), ethanol (E), propionic acid (F) and butyric acid (G) during fermentation for second harvest date, 01.10.21.
Figure 2D illustrates the concentration of lactic acid in grams per kilogram of dry matter as a function of ensiling time. As is evident from the data, a significant decline in lactic acid concentration occurs after 14 days in the three variants mentioned above. This is accompanied by a conversion of lactic acid to butyric acid and other fermentation products. It can be expected that energy losses of more than 20% will result from butyric acid fermentation [32]. The 2XD treatment with the heterofermentative and homofermentative bacterial preparations shows, as in the first harvest, a striking lactic acid degradation against the background of more acetic acid being formed in this context (Figure 2C). A comparison of the total lactic acid concentrations of all treatments of the first and second harvest dates shows that a total of 289.84 g/kg DM and thus 45% less lactic acid was formed in the later harvest. The first harvest date was therefore significantly better in terms of both ensiling quality and storage stability.
Butyric acid concentrations as a function of silage time are shown in Figure 3G. It can be seen that after 14 days of the 2CV and 2BG treatments, there was a fermentation issue and thus an enormous production of n-butyric acid. Consequently, the butyric acid concentrations were observed to be 34.32 g/kg DM in the absence of a silage additive (2CV) and 27.24 g/kg DM in the presence of a homofermentative silage additive (2BG). Contamination of the forage with clostridia (butyric acid bacteria) can only occur by contamination, since these bacteria are present in the epiphytic microflora of green plants only in small quantities and usually only in the spore stage. For this reason, the rapid conversion of fermentable carbohydrates by suitable lactic acid bacteria is essential to produce a low and stable pH in the silage through acidification, which ensures stable and long storage without butyric acid production by the clostridia. It is notable that the 2BG treatment resulted in the production of high concentrations of lactic acid after 14 days, which was subsequently converted to extremely high levels of butyric acid. This indicates a high density of Clostridia in the silages at the time of the second harvest. This suggests that the purely homofermentative bacterial strain may not be the most process-stable and may have difficulty in suppressing butyric acid formation in the long term as sugar levels decrease. As the same silage additive was utilized in treatment 2SBS_BG as in treatment 2BG, yet butyric acid concentrations were virtually absent in 2SBS_BG, it can be postulated that the sugar content plays a pivotal role in this process. The addition of lactic acid bacteria and additional sugar was found to be an effective and significant means of reducing butyric acid formation in the second harvest.
3.3. Acidity and Content Analysis of Silage Samples of the Third Harvest Date (02.11.21)
Table 7 shows the results of the evaluation of the third harvest date. The harvest date of the cup plant was 02.11.21, clearly after the harvest dates usual in agricultural practice. As can be seen from the increasing DM content, this increased by another 5% compared to the second harvest date, to a DM content of 30% with a decrease in total sugar content to 14.19 g/kg DM and an increase in crude fiber content to 42% in the fresh mass (see Table 2). These conditions placed high demands on the ensiling and preservation processes of the substrate. During ensiling, lactic acid bacteria preferentially convert plant sugars to organic acids or lactic acid in the absence of air; ideally, the pH is rapidly lowered to suppress the activity of harmful bacteria. The third harvest date was not conducive to the formation of lactic acid, with the exception of the 3SBS_BG treatment. The pH value of the treatments was between 5.05 and 6.47, which does not indicate sufficient acidification. As a result of low acidification, fermentation issues occurred, with extremely high butyric acid values up to 41.28 g/kg DM (3SBS). The butyric acid fermentation of the cup plant is probably due to the cold weather prior to harvest, as the natural colonization with lactic acid bacteria was insufficient, as well as the low sugar content. In the 3SBS_BG treatment, the population of lactic acid bacteria and the total sugar were artificially increased by the syrup. However, due to the high butyric acid content of 18.22 g/kg DM, it can be assumed that the epiphytic population of clostridia and other harmful germs was extremely high at this late stage. This phenomenon can also be observed in the 3SBS treatment. Here, the external addition of sugar additionally promoted the proliferation of clostridia, since the sugar introduced served as a food basis for them. All treatments of the third harvest date were rated very poor or poor according to the DLG key. The use of silage additives and supplements may result in a slightly lower pH value and a higher specific methane yield when harvesting the cup plant at a late date.
Table 7.
Third harvest date, 02.11.21, dry matter, organic dry matter, methane potentials, pH, acid and nutrient concentrations of samples, FM = fresh matter, oDM = organic dry matter, - = below <0.01 g/kgDM. Data after 90 days of ensiling. Different letters indicate significant differences between the treatments for p < 0.05 TUKEY HSD/KRAMER, mean ± standard deviation of three replicates.
Figure 4A shows the pH curve of the third harvest day over the ensiling period. It can be seen that under extreme conditions, the use of silage additives and syrup can be useful to lower the pH value. The low pH is largely due to the lactic acid formed (Figure 4D), as lactic acid (pH range 3.0–3.6) has a stronger effect on the pH compared to acetic acid (4.5–5.5) and butyric acid (4.2–6.0) [33].
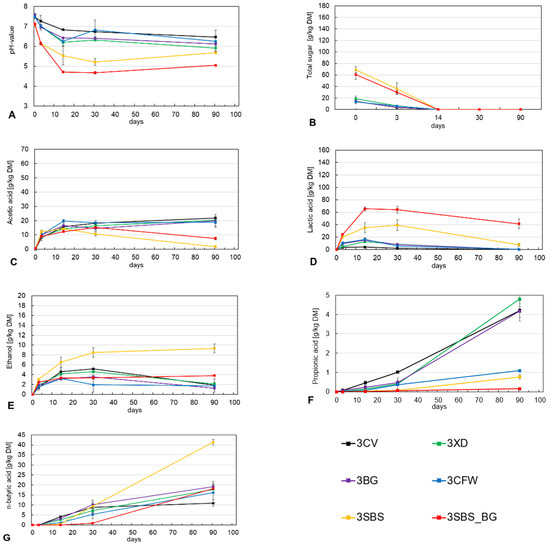
Figure 4.
Course of pH (A), total sugar (B), acetic acid (C), lactic acid (D), ethanol (E), propionic acid (F) and butyric acid (G) during fermentation for third harvest date, 02.11.21.
After 14 days, the lactic acid produced degraded to butyric acid and other undesirable fermentation products due to the high microbial load. This negatively impacted the silage quality by increasing pH levels and promoting the growth of undesirable microorganisms in the substrate. This, in turn, led to substrate metabolism. A similar course can be seen for the treatments 3SBS and 3SBS_BG and the acetic acid concentrations formed in Figure 4C, which were also degraded after 14 days. In the treatments without external sugar addition (3CV, 3XD, 3BG, 3CFW), more acetic acid than lactic acid was formed during the ensiling period. The concentrations of acetic acid (20.20 ± 1.26 g/kg DM) were very close after 90 days.
Acetic acid can be produced by natural heterofermentative lactic acid bacteria or heterofermentative lactic acid bacteria added to silage additives under optimal conditions. However, undesirable bacteria, especially Coli bacteria, can also produce acetic acid. Therefore, adequate air exclusion and rapid pH reduction with lactic acid are critical to maintaining low levels of coli bacteria. Coli bacteria have a low tolerance for acidic conditions and will therefore cease production upon a rapid pH drop. This leaves only the heterofermentative acetic acid producers active in the process. While it cannot be definitively determined which group of bacteria ultimately produced the acetic acid on the third harvest date, it can be speculated that it was produced by Coli bacteria due to the high pH levels and low concentration of lactic acid.
Figure 4G shows the concentrations of butyric acid. The concentration increases rapidly during the silage period in all silages of the third harvest date, indicating poor fermentation. The addition of syrup (3SBS) provides extra food for clostridia, leading to additional butyric acid formation and lactic acid conversion. It can be assumed that additional butyric acid is formed beyond 90 days of opening in the case of the 3SBS_BG treatment, due to the presence of lactic acid (41.35 g/kg DM). Butyric acid fermentation refers to the microbial degradation of organic matter, resulting in the conversion of primarily carbohydrates to butyric acid (butyrate), elemental hydrogen (H2), and carbon dioxide (CO2). Butyric acid fermentation refers to the microbial degradation of organic matter resulting in the conversion of primarily carbohydrates to butyric acid (butyrate), elemental hydrogen (H2), and carbon dioxide (CO2). Small amounts of acetic acid (acetate) and ethanol are also produced [11]. The higher concentration of ethanol (Figure 4E) in the syrup treatments (3SBS, 3SBS_BG) suggests that additional fermentation issues have occurred that cannot be attributed solely to butyric acid fermentation.
3.4. Acidity and Content Analysis of Silage Samples from Different Harvest Dates
Figure 5 illustrates the pH, lactic acid and butyric acid content for different silage harvest dates. According to the DLG key [30], the orange line signifies the threshold beyond which silage quality reduces. The pH value (Figure 5A) during the first harvest date indicates that an inadequate sugar content inhibits acid production, resulting in a failure to lower the pH to 4 or below. Achieving a pH of 4 was only possible with the addition of external sugar and lactic acid bacteria (1SBS_BG/2SBS_BG) in such cases. As the harvest progressed, it became increasingly challenging to ensile the cup plant, particularly after the second harvest date. This suggests that the sugar content and naturally occurring lactic acid bacteria are not sufficient in later stages of the harvest. Consequently, external supplementation of the lactic acid bacteria and sugar can significantly enhance ensiling, as evidenced by the analysis of lactic acid concentrations (Figure 5B).
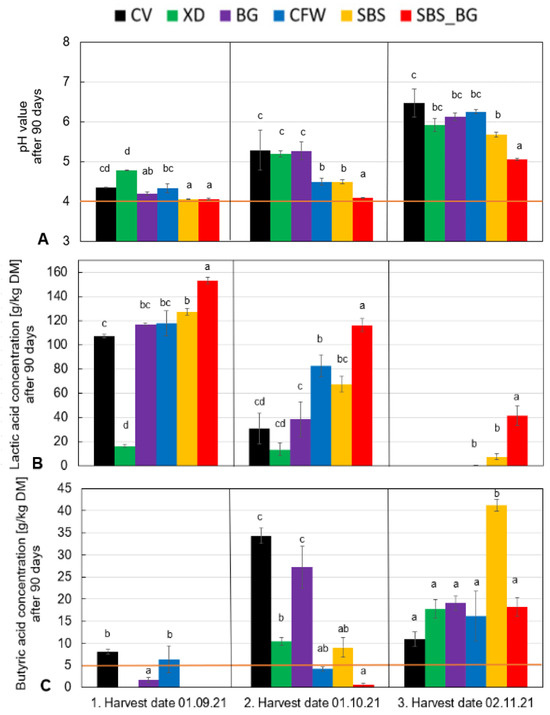
Figure 5.
Final pH (A), lactic acid (B), and butyric acid (C) after 90 days of fermentation for the three harvest dates. Different letters indicate significant differences between the treatments for p < 0.05 TUKEY HSD/KRAMER.
Figure 5B demonstrates that homofermentative silage additives and the addition of sugar at the earlier harvest dates result in a higher production of lactic acid than their untreated control variants (CV). Furthermore, the treatments with syrup and silage additives (SBS_BG) demonstrate the most promising results.
The addition of silage additives can prevent the development of silage defects and the formation of butyric acid (Figure 5C). At the initial harvest, the silage additive CFW only slightly surpasses the limit of 5 g/kg DM. A comparison of the first and second harvest dates with the control variant (CV) indicates that all additives yielded better results with less butyric acid formation, suggesting superior silage quality due to enhanced fermentation. The third harvest date (November) is anomalous and does not align with standard agricultural practices. As a result, the outcomes are difficult to categorize objectively. Evidence indicates a limited possibility of ensiling in this case; therefore, it is not recommended to harvest the cup plant during this time.
3.5. Methane Yield from Cup Plants at the Different Harvest Dates
The main goal of the ensiling process is to achieve a high methane yield in an anaerobic digestion process afterwards. Figure 6 illustrates the specific methane yields of the cup plants at the various harvest dates. It can be observed that the application of silage additives during the initial harvest period resulted in a consistent methane yield throughout the entirety of the ensiling process. The addition of silage additives resulted in an additional biogas yield of 13% (+36 LCH4kgoDM−1) for the SBS_BG variant at the first harvest date. Nevertheless, the elevated acid production resulting from the incorporation of syrup (energy addition) is the underlying cause of this phenomenon.
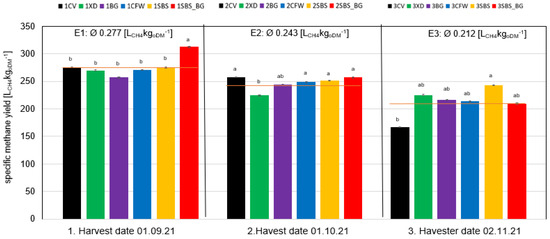
Figure 6.
Comparison between specific methane yields at harvest dates E1, E2 and E3 (mean values) after 90 days ensiling. Different letters indicate significant differences between the treatments for p < 0.05 TUKEY HSD/KRAMER.
The silage additives utilized in the second harvest exhibited a minimal impact on the specific methane yield. The variant treated with the silage additive Energy XD (2XD) exhibited a 13% reduction in methane yield (224 LCH4kgoDM−1) in comparison to the control variant (2CV) (257 LCH4kgoDM−1). The observed reduction in yield can be attributed to the heterofermentative nature of the preparation and the formation of acetic acid, which is necessary for energy production.
On average, the first harvest had a methane yield of 277 LCH4kgoDM−1, which is 12% higher than the second harvest’s yield of 243 LCH4kgoDM−1. The observed decline in yield can be attributed to the aging of the plant, which results in an increase in the crude fiber content, the degree of lignification, and the loss of dry matter (DM) content. Since crude fiber and lignification are poor anaerobic degraders, they are responsible for the low specific methane yield.
When comparing the third harvest date with the others, it is evident that bacterial preparations and sugar addition have a direct impact on the methane yield. The five silage additive variants achieved an average methane yield of 221 LCH4kgoDM−1, which is 32% higher than the methane yield without silage additive (3CV), measuring 167 LCH4kgoDM−1. The highest specific methane yield was obtained from the 3SBS treatment, with a methane yield of 243 LCH4kgoDM−1. Meanwhile, the highest concentration of butyric acid was measured in this variant. The elevated yield is likely because of the initial syrup addition.
When analyzing the methane yield of different harvest dates, it was found that the first harvest date resulted in an average yield of 277 LCH4kgoDM−1, which is 12% higher than the average yield of the second harvest date (243 LCH4kgoDM−1) and 31% higher than the average yield of the third harvest date. The harvest date had a greater impact on the specific methane yield than the treatments. Therefore, selecting the appropriate harvest date is crucial for achieving maximum methane yield. It is possible that an earlier harvest in mid to late August could result in higher methane yields. Choosing the appropriate harvest timing is typically a balancing act that considers the cell content composition, specifically the incorporable total sugars, dry matter output and climate patterns throughout the year and during the harvest period. As the plant ages physiologically, an increase in not only the dry matter content but also the crude fiber content and the degree of lignification can be observed. This results in expected lower sugar concentrations. For instance, the sugar content at harvest significantly decreased by six times, going from an average of 86.53 g/kg DM on the first harvest date to only 14.19 g/kg DM on the third harvest date.
The microorganisms compete with the plant’s nutrient substrate for the sugars present in the material. As homofermentative bacteria convert all the sugar in the plant material into lactic acid, the sugar concentration and the lactic acid bacteria population at harvest are decisive for the quality of the silage. In the event that an insufficient quantity of sugar is present during the fermentation process, the production of lactic acid will cease prematurely. Insufficient preservation can result in an increased risk of incorrect fermentation. To illustrate, the sugar content of the cup plant is comparatively low compared to maize, which has a sugar content of 300–400 g/kg DM [6], more than four times higher than the cup plant. In order to achieve optimum ensiling and methane yield, it is crucial to determine the optimum harvest time of the cup plant, which depends on the maximum sugar content.
4. Conclusions
The ensiling process for the cup plant was optimized by adding microorganism-based ensiling agents and small amounts of sugar beet syrup. Laboratory trials over 90 days studied five ensiling agents at three different harvest dates. Key findings from the trials include the following.
The analysis of the harvest dates revealed that an early harvest, as observed on the first date, is recommended for the production of high-quality silage. This is due to the fact that the sugar content decreased at later harvest dates, which impairs the stability of the silage. This was observed on the third harvest date. The combination of homofermentative lactic acid bacteria and sugar beet syrup had the strongest effect, producing up to 43% more lactic acid and significantly lowering the pH. The addition of syrup, increasing total sugar content, positively affected ensilability, as evidenced by the DLG keys. The silage additive Energy XD, containing hetero- and homofermentative lactic acid bacteria, increased acetic acid and ethanol production at all harvest dates. Cow-Fresh-Wet did not significantly increase acetic acid despite containing the heterofermentative L. buchneri strain. Energy BG, a pure homofermentative additive, demonstrated suboptimal ensiling properties with insufficient sugar. The silage quality of the third harvest in early November was poor due to significant butyric acid concentrations across all treatments. Only the variants with added syrup showed lactic acid concentrations. Methane yields from this harvest indicated that all bacterial preparations and syrup addition had a direct impact, resulting in an average methane yield of 221 LCH4kgoDM−1, a 32% increase from the 167 LCH4kgoDM−1 yield without silage additives. The utilization of silage additives has the potential to influence both the methane yield and the quality of the silage, particularly in instances where ensiling conditions are challenging. The highest methane yields with an average of 277 LCH4kgoDM−1 were measured at the first harvest date.
The most optimal overall result was observed at the first harvest date with the supplementation of a sugar and silage additive. This was evidenced by the absence of butyric acid concentrations, the lowest pH value (4.05), the highest lactic acid concentrations (153.2 g/kg DM), and the highest methane yields (312 LCH4kgoDM−1) in this silage.
Finally, the following results should be derived from the laboratory trials:
- Sugar content and lactic acid bacteria content are crucial for optimal ensiling
- Harvesting of the cup plant at maximum sugar content
- The addition of ensiling aids and syrup has a positive effect on ensiling
Author Contributions
Conceptualization, B.H.; Investigation, M.B. and G.S.; Supervision, H.O. and J.M. All authors have read and agreed to the published version of the manuscript.
Funding
This research was funded by the Ministry of Rural Affairs, Food and Consumer Protection Baden-Wuerttemberg. Project “Silphie-Sil”, grant number BWBF110011.
Institutional Review Board Statement
Not applicable.
Data Availability Statement
Data are contained within the article.
Acknowledgments
Many thanks to all institutions that supported this study, especially by supplying the substrates. Special thanks go to Schaumann BioEnergy GmbH (Pinneberg, Germany), B&K AgrarGas GmbH (Dietersheim, Germany) and the Ministry for Rural Areas, Food and Consumer Protection Baden-Württemberg.
Conflicts of Interest
The authors declare no conflicts of interest.
References
- FNR. Basisdaten Bioenergie Deutschland 2020. 2021. Available online: https://www.fnr.de/fileadmin/Projekte/2020/Mediathek/broschuere_basisdaten_bioenergie_2020_web.pdf (accessed on 9 September 2021).
- Standford, G. Silphium Perfoliatum (cup-plant) as a new forage. In Recapturing a Vanishing Heritage, Proceedings of the 12th North American Prairie Conference, Cedar Falls, IA, USA, 5–9 August 1990; Smith, D.D., Jacobs, C.A., Eds.; University of Northern Iowa: Cedar Falls, IA, USA, 1992; pp. 33–38. [Google Scholar]
- Penskar, M.R.; Crispin, S.R. Special plant abstract for Silphium perfoliatum (cup plant). In Michigan Natural Features Inventory; Penskar: Lansing, MI, USA, 2010; p. 3. [Google Scholar]
- Ende, L.M.; Lauerer, M. Spreading of the cup plant (Silphium perfoliatum) in northern Bavaria (Germany) from bioenergy crops. NeoBiota 2022, 79, 87–105. [Google Scholar] [CrossRef]
- Biertümpel, A. Broschüre: Anbautelegramm Durchwachsende Silphie (Silphium perfoliatum L.); Thüringer Landesanstalt für Landwirtschaft: Jena, Germany, 2011. [Google Scholar]
- Dandikas, V.; Herrmann, C.; Hülsemann, B.; Jacobi, H.F.; Krakat, N.; Meißauer, G.; Merrettig-Bruns, U.; Oechsner, H.; Ohl, S.; Paterson, M.; et al. Gasausbeute in landwirtschaftlichen Biogasanlagen: Potenziale, Erträge, Einflussfaktoren; KTBL: Darmstadt, Germany, 2021. [Google Scholar]
- Outnature: Entwickeln und Vertreiben Innovative Faser- und Papierprodukte auf Basis der Donau-Silphie. 2020. Available online: https://out-nature.de/?gclid=EAIaIQobChMIk8aQycHp-gIV_ICDBx18_g4iEAAYASAAEgJ09fD_BwE (accessed on 9 September 2021).
- Pohl, M.; Barchmann, T.; Liebetrau, J.; Hülsemann, B.; Oechsner, H.; Zhou, L.; Nägele, H.-J.; Mächtig, T.; Moschner, C.; Kliche, R.; et al. Biogas-Messprogramm III; Fachagentur Nachwachsende Rohstoffe: Gülzow, Germany, 2021. [Google Scholar]
- Nussbaum, H. Fahrsilo Praxishandbuch Futter- und Substratkonservierung, 8th ed.; DLG-Verlag: Frankfurt, Germany, 2011. [Google Scholar]
- Futterkonservierung, B. Praxishandbuch Futter- und Substratkonservierung; Gerighausen, H.-G., Ed.; DLG-Verlag: Frankfurt, Germany, 2011. [Google Scholar]
- Galler, J. Silagebereitung von A bis Z Grundlagen—Siliersysteme—Kenngrößen; von Josef Galler, P., Ed.; Landwirtschaftskammer Salzburg: Salzburg, Austria, 2011. [Google Scholar]
- Kaiser, E. Beurteilung der Gärqualtität. In Praxishandbuch Futterkonservierung, 7th ed.; Futterkonservierung, B., Ed.; DLG-Verlag: Frankfurt am Main, Germany, 2006; pp. 42–49. [Google Scholar]
- Auerbach, H.; Eise, M.; Hng, K.; Ler, C.; Nußbaum, H.; Ostertag, J.; Pahlow, G.; Pauly, T.; Rahn, S.; Richter, W.; et al. DLF Testing Guidelines for the Award and Use of the DLG Quality Mark for Ensiling Agents. DLG TestService GmbH: Groß-Umstadt, Germany. Available online: https://www.dlg.org/de/landwirtschaft/themen/tierhaltung/futtermittelnet/fachinfos-futterkonservierung (accessed on 3 December 2022).
- Pahlow, G.; Muck, R.E.; Driehuis, F.; Oude-Elferink, S.J.; Spoelstra, S.F. Microbiology of Ensiling. In Silage Science and Technology; American Society of Agronomy: Madison, WI, USA, 2003; Volume 42, pp. 31–94. [Google Scholar]
- McDonald, P.; Henderson, A.R.; Heron, S.J.E. Herson Biochemistry of silage, 2nd ed.; Chalcombe Publications: Marlow, UK, 1991. [Google Scholar]
- Gross, F.; Riebe, K. Gärfutter—Betriebswirtschaft, Erzeugung, Verfütterung, 1st ed.; Verlag Eugen Ulmer: Stuttgart, Germany, 1974. [Google Scholar]
- Schaumann BioEnergy GmbH. Siliermittel Energy XD. Available online: https://www.schaumann-bioenergy.eu/de/konservierung-silierung-2176.htm?productID=5ecfa45bd3bf2127a45216b8 (accessed on 9 September 2021).
- Schaumann BioEnergy GmbH. Siliermittel Energy BG. Available online: https://www.schaumann-bioenergy.eu/de/konservierung-silierung-2176.htm?productID=5ecfa5c8d3bf2127a45216bc (accessed on 9 September 2022).
- B&K B&K AgrarGas GmbH Weinbergfeld 7 D-91463 Siliermittel Cow-Fresh-Wet Dietersheim-Oberrossbach. Available online: https://bk-agrargas.shop/collections/siliermittel-milchvieh/products/cow-fresh-wet (accessed on 9 September 2022).
- Goldsaft—Zuckerrübensirup Grafschafter Krautfabrik Josef Schmitz KG Wormersdorfer Str. 22–26, D-53340 Meckenheim. Available online: https://www.grafschafter.de/produkte/goldsaft/grafschafter-goldsaft (accessed on 9 September 2022).
- Agrarmeteorologie Baden-Wemberg: Wetterstation Unterer Lindenhof. Available online: https://www.wetter-bw.de/Internet/AM/NotesBwAM.nsf/bwweb/7b6dc2ff140f6662c1257db2002d5120?OpenDocument&TableRow=3.1.3,3.6#3.1 (accessed on 12 September 2021).
- VDI-Fachbereich Energietechnik. Fermentation of Organic Materials—Characterisation of the Substrate, Sampling, Collection of Material Data, Fermentation Tests, VDI 4630; VDI-Gesellschaft Energie und Umwelt: Düsseldorf, Germany, 2016. [Google Scholar]
- Helffrich, D.; Oechsner, H. Hohenheimer Biogasertragstest. Landtechnik 2003, 58, 148–149. [Google Scholar] [CrossRef]
- Hülsemann, B.; Zhou, L.; Merkle, W.; Hassa, J.; Müller, J.; Oechsner, H. Biomethane Potential Test: Influence of Inoculum and the Digestion System. Appl. Sci. 2020, 10, 2589. [Google Scholar] [CrossRef]
- DIN EN 12879:2001-02; Characterization of Sludges—Determination of the Loss on Ignition of Dry Mass. German Institute for Standardization: Berlin, Germany, 2001.
- DIN EN 12880:2001-02; Characterization of Sludges—Determination of Dry Residue and Water Content. German Institute for Standardization: Berlin, Germany, 2001.
- Weißbach, F. On Assessing the Gas Production Potential of Renewable Primary Products. Landtechnik 2008, 63, 356–358. [Google Scholar]
- Weißbach, F. Degree of utilization of primary renewable products in biogas production. Landtechnik 2009, 64, 18–21. [Google Scholar]
- Kaiser, E.; Weiss, K. Nitratgehalte im Grünfutter—Bedeutung für Gärqualität und siliertechnische Maßnahmen. Ubers. Zur Tierernährung 2007, 35, 13–30. [Google Scholar]
- Kaiser, E.; Weiß, K.; Nussbaum, H.; Kalzendorf, C.; Pahlow, G.; Schenkel, H.; Schwarz, F.J.; Spiekers, H.; Staudacher, W.; Thaysen, J. Grobfutterbewertung. In Teil B—DLG-Schlüssel Zur Beurteilung Der Gärqualität von Grünfuttersilagen Auf Basis Der Chemischen Untersuchung; DLG-Information—Ausschuss für Futtermittelkonservierung: Frankfurt, Germany, 2006. [Google Scholar]
- Köhler, B.; Diepolder, M.; Ostertag, J. Dry matter losses of grass, lucerne and maize silage in bunker silos. Agric. Food Sci. 2013, 22, 145–150. [Google Scholar] [CrossRef]
- Hansen, M. Grassilage/Wichtigstes Grundfutter in der Rindviehhaltung. In Grünlandtag Erpeldingen; Lycée Technique Agricole: Ettelbruck, Luxembourg, 2002. [Google Scholar]
- Namann, K.; Bassler, R. Methodenbuch Band III. Die chemische Analyse von Futtermitteln; Verl. J. Neumann-Neudamm: Melsungen, Berlin, Germany, 1976. [Google Scholar]
Disclaimer/Publisher’s Note: The statements, opinions and data contained in all publications are solely those of the individual author(s) and contributor(s) and not of MDPI and/or the editor(s). MDPI and/or the editor(s) disclaim responsibility for any injury to people or property resulting from any ideas, methods, instructions or products referred to in the content. |
© 2024 by the authors. Licensee MDPI, Basel, Switzerland. This article is an open access article distributed under the terms and conditions of the Creative Commons Attribution (CC BY) license (https://creativecommons.org/licenses/by/4.0/).