Abstract
The productivity and quality of strawberries in southern Brazil are affected by the lack of cultivars adapted to different regions and by their susceptibility to diseases. This study aims to evaluate the resistance of cultivars and genotypes to mycosphaerella leaf spot (MLS) and powdery mildew (PM) and the quantitative and qualitative fruit agronomic parameters (FAP) of strawberries in southern Brazil during the 2019/2020 and 2020/2021 growing seasons. The incidence and severity of MLS and PM were evaluated from the beginning of symptoms appearances until harvest. Cultivars and genotypes were compared based on the area under the incidence (AUIDPC) and severity (AUSDPC) disease progress curves and the quantitative and qualitative FAP. The data were subjected to analysis of variance, and multivariate analysis was performed using principal component analysis (PCA). The cultivars Irma, Bellalinda, Kiara, Jonica, and Pircinque exhibited the lowest values of AUIDPC and AUSDPC, demonstrating the highest resistance to MLS and PM. The cultivars Kiara, Jonica, and Pircinque, along with genotype FRF LAM 119.1, showed the best qualitative and quantitative FAP. However, the FRF LAM 119.1 genotype exhibited the highest values of AUIDPC and AUSDPC, indicating high susceptibility to MLS and PM. CPA data indicated that the cultivars Kiara, Jonica, and Pircinque had the highest level of resistance, which was associated with the highest total fruit yield and the best fruit quality in terms of skin color and flavor balance. Kiara, Jonica, and Pircinque proved to be good options for strawberry production in southern Brazil, combining resistance to MLS and PM with good FAP.
1. Introduction
Strawberry (Fragaria x ananassa Duchesne) is one of the most economically important small fruit crops [1]. Interest in the crop has led to an approximately 40% increase in the total amount of land under strawberries from 2018 to 2021 worldwide, resulting in a 46% increase in production to approximately 12 million tons [2]. The main Brazilian strawberry-producing poles are located between the 20° and 32° south latitude parallels [3]. Due to the country's high edaphoclimatic diversity, the small number of cultivars available to producers is one of the main difficulties for strawberry development [3,4]. Therefore, it is important to encourage national genetic improvement programs, as well as the introduction of new strawberry cultivars developed in other countries [3,4]. In the last seven years, ten new cultivars were registered on the National Cultivar Registry (NCR) of the Agriculture, Livestock and Supply Ministry (ALSM), namely, ‘Cristal’ (2010), ‘Flórida Fortuna’ (2011), ‘Sabrina’ (2012), ‘Benicia’ (2013), ‘Florida Elyana’ (2013), ‘Mojave’ (2013), ‘Sweet Ann’ (2013), and ‘PRA Estiva’, ‘Jonica’ and ‘Pircinque’ in 2016 [2]. Strawberry production is concentrated in the Albion, San Andreas, and Camarosa cultivars, which together represent approximately 60% of fruit crops. Due to the large geographic area where strawberry is cultivated and due to the different specific conditions of each location, there are few cultivars used by producers [5]. There is a lack of cultivars adapted for the different cultivation locations and for the various cultural techniques that are used by the producers, as all the cultivars used for fruit production come mainly from United States genetic improvement programs. So, there are no cultivars fully developed and evaluated especially for the Brazilian climate and soil conditions [5].
The increase in strawberry production has been accompanied by some productive challenges for the producers, especially in southern Brazil. Lack of cultivars adapted to different growing regions and susceptibility to the main strawberry diseases in Brazil are some of these challenges [3]. In southern Brazil, most of the strawberries are produced in metropolitan areas and are harvested at the end of winter (July–August) and/or early spring (September/October). However, the highland regions of southern Brazil show good production during the summer period, from December to March [4].
Because of the lack of suitable materials for cultivation in the southern region of Brazil, most strawberry producers use imported cultivars chosen for their suitability for the photoperiod and temperature of the region [4]. Most imported cultivars are not adapted to local edaphoclimatic conditions; therefore, they do not fully express their agronomic potential for production and disease resistance. These imported cultivars, when grown in southern Brazil, exhibit some favorable characteristics, including high productivity, average fruit mass, and pulp firmness. However, they lack flavor and production alternation and are susceptible to major diseases, such as MLS and PM [3]. MLS and PM are caused by the fungi Mycosphaerella fragariae (Tul.) Lindau (anamorph: Ramularia brunnea Peck, syn. R. tulasnei Sacc) and Sphaerotheca maculata f. sp. fragariae, syn. Podosphaera aphanis (Wallr.) U. Braun and S. takam (syn. S. macularis [Wallr.: Fr.] Jacz. f. sp. fragariae Peries), respectively. These diseases occur widely in all strawberry-producing regions and, if uncontrolled, can attack a large portion of the leaf area, drastically reducing the plant’s photosynthetic capacity. The reduction in photosynthesizing area caused by spots and mycelial growth can lead to losses ranging from 10% to 100%, depending on the variety’s susceptibility and environmental conditions [5,6,7].
MLS appears as small, round, dark purple spots with a whitish center [7,8]. Favorable conditions for M. fragarie infection are a temperature of 18–25 °C, relative humidity greater than 98%, and a minimum wetting period of 12 h [9]. Under these climatic conditions, the spots can coalesce, causing leaf burn and potentially infecting petioles, calyxes, and fruits. The spread of M. fragarie conidia occurs through water splashing (rainfall or irrigation). The fungus can survive in the form of conidia in lesions on live leaves, sclerotia, and ascospores, which are formed in crop residues [10]. PM can occur on leaves, flowers, and fruits, reducing photosynthesis and causing necrosis and defoliation. On leaves, signs of disease appear as white spots formed by mycelia and spores with a powdery appearance on the lower surface. Leaf petioles, flower peduncles, and fruits also show white powdery growth of S. maculata f. sp. fragariae. Most of the structures of S. maculata f. sp. fragariae remain outside the infected tissue. Temperature conditions between 15 °C and 25 °C and relative humidity higher than 75% and lower than 98% favor conidia germination and germ tube elongation [11].
Effective control of MLS and PM requires an integrated disease management system (IDM) that combines various cultural, genetic, physical, biological, and chemical control methods. IDM can reduce or eliminate crop damage and, most importantly, fruit damage. The use of adapted and resistant cultivars is the most efficient strategy for controlling MLS and PM. Therefore, the development of genetic improvement programs and the introduction of new cultivars in strawberry-producing regions in Brazil are essential. In these programs, the adaptability potential of imported cultivars and genotypes under study should be compared with that of newly introduced cultivars. Santa Catarina State University (UDESC) has been developing a strawberry breeding program in partnership with Centro di Olivicoltura, Frutticoltura e Agrumicoltura (CRE-OFA-FRF) in Forlì, Italy since 2012. Therefore, this study aims to evaluate the resistance of cultivars and genotypes to MLS and PM and quantitative and qualitative FAP under the edaphoclimatic conditions of the highland region of Santa Catarina State, southern Brazil, during the 2019/2020 and 2020/2021 growing seasons.
2. Materials and Methods
2.1. Meteorological Observations
Experiments were conducted in Lages Municipality (27°47′05′′ S, 50°18′08′′ W), at an altitude of 922 m above sea level, in Santa Catarina State, southern Brazil, during the 2019, 2020, and 2021 growing seasons. According to the Köppen classification [12], the climate of the region is subtropical humid mesothermal Cfb, and the soil type is clay auric cambisol [13]. The average annual temperature and rainfall are around 15.6 °C and 1500 mm, respectively. Daily rainfall, relative humidity, and hourly temperatures were recorded from May to December for three growth seasons from 2019 to 2021 by the Santa Catarina Hydrology and Environmental Resources Center (Epagri, Florianópolis, SC, Brazil). The weather station (Onset Computer Corp., Procasset, MA, USA; Davis Pro2-6153) was 500 m away from the experimental beds.
2.2. Plant Materials
Treatments consisted of 15 strawberry cultivars and genotypes, including 7 genotypes, FRF PIR 256.4, FRF PIR 79.6, FRF PIR 75.8, FRF 57.6, FRF 191.2, FRF LAM 119.1, and FRF LAM 263.1, from the UDESC and advanced Italian selections of CREA-FRF (Italy) breeding program and five cultivars, Randoce (crossing between Chandler × Sel. 91.143.5 (86.288.1 × Cortina), Bellalinda (crossing between Ventana × selection PIR 04.133.1), Kiara (crossing between Nora × selection PIR 04.55.18), Jonica (selection PIR 04.72.21—crossing between Rosalinda × Demetra (Irvine × Tudla), and Pircinque (selection PIR 04.228.05—crossing between the cultivars Nora × Ventana), two cultivars of American origin, Albion (crossing between cultivar Diamante × advanced selection Cal 94.16-1) and San Andreas (crossing between cultivar Albion × advanced selection Cal 97.86-1), and one cultivar of Italian origin, Irma (crossing between Camerosa × selection Cal 95.17-4). Strawberry seedlings used in all experiments were grown, field-collected, and rooted in 72-cell trays in a commercial nursery in the Farroupilha Municipality of Rio Grande do Sul State, southern Brazil.
A conventional soil cultivation system with low tunnels was used in an experimental randomized block design with four replications and 11 plants in each experimental unit. Strawberry seedlings were planted by hand in May from 2019 to 2021. Soil correction and fertilization were performed in accordance with the results of soil analysis [14]. Fertilization was performed weekly with fertigation, which included calcium nitrate (9.92 g/100 plants−1), monoammonium phosphate (38.74 g/100 plants−1), P51 (liquid fertilizer containing 51% phosphorus) (7.3 mL/100 plants−1), magnesium sulfate (4.55 g/100 plants−1), and potassium phosphate (31.25 g/100 plants−1).
The experimental beds measured approximately 0.90 × 33 × 0.15 m (L × C × H) for each cultivar and genotype. The beds were covered with 30-micron thick black polyethylene plastic (mulching). Strawberry plants were grown in three rows in a “V” or quinconic system with 30 cm between plants and 60,000 plants per ha. A drip irrigation system was used with a spacing of 0.15 m between drippers, a flow rate of 1.5 l/h, and 3 hoses per bed.
Pest and disease control was conducted using crop-specific products. The Acaricide abamectin, insecticide thiamethoxan, and fungicides methyl thiophanate (only before harvest), fluazinam, iprodione, pyrimethanil, and azoxystrobin + difenoconazole were also used. First, sprays were applied when blossoms opened, and spraying was repeated every 7–14 days, depending on the rainfall conditions. Spraying ended at harvest. Weeds were controlled by weeding between the beds and manual tillage in the planting pits. Old and diseased leaves were removed using pruning shears. Beginning at the end of August and continuing until the middle of February the following year, strawberries were harvested every 3 days when the fruits displayed an epidermis with approximately 70–80% red color.
2.3. Disease’s Assessment
The MLS and PM incidence and severity were assessed biweekly from the first appearance of symptoms until harvest, considering that the average life span of leaves is approximately 60 days [15]. Thus, a total of four evaluations were performed per leaf in each evaluation cycle, and these were recorded on the 15th, 30th, 45th, and 60th day after the first appearance of symptoms. Four plants were evaluated for each cultivar and genotype, totaling 60 evaluated plants. New young leaves were marked every 60 days, which was regarded as the evaluation cycle. Two evaluation cycles were performed during the 2019/2020 and 2020/2021 growing seasons. The pathogens M. fragarie and S. maculata f. sp. fragariae occurred endemically in cultivation areas without the necessity of artificial inoculation.
The MLS incidence was calculated as the number of leaves with at least one lesion in relation to the total number of infected leaves on each plant and all plants of the plot using Equation (1):
where NS = Number of symptomatic leaves and NT = Number of total leaves per plant.
The PM incidence (PMI) was derived from the severity data by classifying a leaf as diseased when its severity was >0 [16]. The MLS and PM severity were assessed by the percentage of the infected leaf area using the diagrammatic scale proposed by [17,18], which assigns scores from 1–5 and 0–3, where 1 = 0 to 0.11%; 2 = 0.12 to 0.51%; 3 = 0.52 to 2.4%; 4 = 2.5 to 10.2%; and 5 = >34.9%; and 0 = (0%), 1 = 1 to 25%, 2 = 26 to 50%, and 3 = >51%, respectively. The three youngest fully expanded leaves of each plant were evaluated, resulting in an MLS and PM index (DI) of 1–5 and 1–3, respectively. The disease index was calculated as the average of scores assigned to the leaves of each evaluated plant.
The MLS and PM incidence and severity data were used to plot progress curves for the diseases, as proposed by [19], and the areas under incidence (AUIDPC) and severity (AUSDPC) disease progress curves were calculated. Percent incidence and severity data were transformed to arcsine multiplied by the square root of the percentage to normalize the data [20]. AUDPC was calculated using Equation (2):
where li = disease incidence or severity at evaluation date (i); l (i + 1) = disease incidence or severity at the subsequent evaluation; Ti = plant age (days) at the evaluation time (15th, 30th, 45th, and 60th days after the first evaluation); and T (i + 1) = plant age (days) during the subsequent evaluation. These areas represent the trapezoidal integration severity [21].
AUDPC = ∑ (li + l (i + 1))/2 × (T (i + 1) − Ti)
2.4. Fruit Agronomic Parameters
Strawberries were harvested from August to February of each growing season, and quantitative and qualitative FAP (fruit agronomic parameters) were evaluated once a month during each evaluation cycle and growing season. The quantitative and qualitative FAP were characterized using the fruit number, weight, and epidermis luminosity (L*), epidermis chroma (C*), hue angle (°hue), fruit pulp firmness (FPF) (g/fruit−1), soluble solids (SS) (°Brix), titratable acidity (TA) (g. 100 g citric acid), and soluble solids/titratable acidity ratio (SS/TA) per plot and treatment, respectively. The physicochemical analysis was performed using uniform samples of 10 fruits per repetition at each new plant flowering for a total of 4 analyses per plant and evaluation cycle. The physicochemical analyses were performed in accordance with the following methodologies:
- (a)
- Texture Analyzer TA texturometer (Stable Micro Systems Ltd., Vienna Court, UK) was used to measure the L*, C*, °hue (color angle), and FPF parameters expressed in grams;
- (b)
- SS was measured using a digital refractometer and expressed as the sugar concentration in fruits (°Brix);
- (c)
- TA was measured using an automatic Titronic (titrator®) with 5 mL of juice in 45 mL of distilled water and titration in a sodium hydroxide solution (0.1 N) at pH 8.1;
- (d)
- SS/TA ratio was calculated as the ratio of SS content to that of TA.
2.5. Statistical Analysis
Statistical analyses were performed using data from harvests in 2019, 2020, and 2021 and were performed using the Shapiro–Wilk normality test and Bartlett test, using Software R, version 4.1.2 (R Core Team, 2013) via the Action Stat interface. Univariate analysis was performed using analysis of variance and the Scott–Knott test with a 5% probability of error using the statistical program SISVAR, version 5.6 [22]. Principal component analysis (PCA) for multivariate analysis was performed in R. PCA is an unsupervised learning algorithm that summarizes and visualizes data based on multiple inter-correlated quantitative variables. To support PCA, a nonhierarchical cluster analysis of K-means was used to determine possible cultivars and genotype groups. The optimal number of clusters to be calculated by K-means analysis was estimated using the silhouette method.
3. Results
3.1. Environment Conditions
During the two strawberry evaluation cycles (May–July and July–September) of the 2019/2020 and 2020/2021 growing seasons, the average temperature and total rainfall were 16.6 °C and 631 mm and 16.7 °C and 664 mm, respectively (Figure 1). Generally, there were no significant differences in the average temperature and rainfall distribution between the 2019/2020 and 2020/2021 growing seasons. There were three rainfall peaks during the 2019/2020 growing season: at the beginning of May (128 mm), the end of June (252 mm), and the beginning of September (171 mm). Similarly, three precipitation peaks were recorded for the following season, 2020/2021 (Figure 1). Environmental conditions, including frequent rainfall, mild temperatures, and sustained humidity during the two evaluation cycles, from May to September, provided long periods of wet leaves conducive for M. fragariae and S. macularis f. sp. fragariae infections, especially in susceptible cultivars and genotypes. MLS and PM were present in the experimental beds and areas in previous years, and their occurrence was not necessarily due to artificial inoculation.
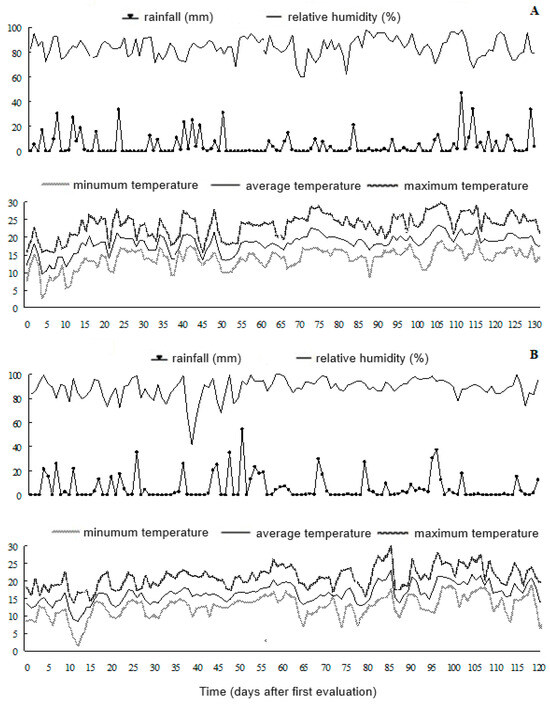
Figure 1.
Rainfall (mm day−1), relative humidity (%), and minimum, average, and maximum temperatures (°C) recorded at São Joaquim/SC municipality from May to September of the 2019–2020 (A) and 2020–2021 (B) growing seasons.
3.2. MLS and PM Intensity
All cultivars and genotypes exhibited different intensities of typical symptoms of MLS and PM. The first symptom of MLS infection began as small, roundish, reddish–brown, or purple spots on the upper leaf surface. Spots turned light brown or gray in the center as they matured but retained a purple margin. Spots appeared on the lower surfaces of leaves as the infection progressed in most cultivars and genotypes that had high incidence, severity, and AUIDPC and AUSDPC values (Table 1 and Table 2). Leaf spot occurred at average temperatures between 15 and 25 °C. As the disease progresses, most lesions coalesce to form larger areas of necrotic tissue. Fruit infections were not observed during the period of disease evaluation. The first symptom of PM infection was the curling up of leaf margins, exposing the white patches of S. macularis f. sp. fragariae mycelium on the lower leaf surface. Generally, the patches coalesced to cover the entire underside of the leaf. Infected leaves of the most susceptible cultivars (San Andres and Albion) and genotypes (FRF 191.2, FRF LAM 119.1, and FRF LAM 263.1) showed curling, purple, and reddish blotches on the lower leaf surface.

Table 1.
Incidence and severity of (A) micosphaerela leaf spot—MLS (Mycosphaerella fragariae) and (B) powdery mildew—PM (Sphaerotheca macularis f. sp. fragariae) in strawberry cultivars and genotypes in a highland region of Santa Catarina State, southern Brazil during the 2019/2020 and 2020/2021 growing seasons.
Table 2.
Area under the incidence (AUIDPC) and severity (AUSDPC) disease progress curve of Mycosphaerella Leaf Spot (MLS) (Mycosphaerella fragariae) and powdery mildew (PM) (Sphaerotheca macularis f. sp. fragariae) in strawberry cultivars and genotypes in a highland region of Santa Catarina State, southern Brazil during the 2019/2020 and 2020/2021 growing seasons.
The epidemiological variables of incidence, severity, AUIDPC, and AUSDPC were estimated for each strawberry cultivar and genotype (Table 1 and Table 2). There were significant differences in the incidence, severity, AUIDPC, and AUSDPC of MLS and PM among strawberry cultivars and genotypes. Under field conditions, the incidence and severity for both MLS and PM were significantly lower in most cultivars (Kiara, Jonica, Irma, Bellalinda, Pircinque, and Randoce) from 15 to 60 days after the first appearance of symptoms, except for Albion and San Andreas (Table 1). The incidence and severity in all genotypes, as well as in the cultivars Albion and San Andreas, were significantly higher, exhibiting a high percentage of MLS and PM incidence and severity. These ranged from 12.45 (PIR 79.6) to 24.00 (LAM 119.1), 0.77 (PIR 256.4) to 1.55 (LAM 119.1), 11.93 (PIR 75.8) to 18.94 (LAM 119.1), and 0.64 (PIR 79.6) to 0.71 (Albion) in the first 15 days after the first appearance of symptoms, respectively. The incidence and severity maintained constant and significant progress throughout the entire evaluation period. (Table 1). The lowest MLS AUIDPC and AUSDPC were observed in Kiara and Bellalinda and in Kiara, Irma, and Bellalinda, respectively (Table 2). The lowest PM AUIDPC and AUSDPC were observed in Kiara, Jonica, Bellalinda, and Pircinque and in Kiara and Bellalinda, respectively (Table 2). Despite significant differences in MLS and PM resistance between these two cultivars groups, Kiara, Jonica, Irma, Bellalinda, and Pircinque had the lowest incidence, severity, AUIDPC, and AUSDPC, indicating that they were the most resistant cultivars of all cultivars and genotypes.
The cultivars Kiara, Jonica, and Pircinque also showed moderate resistance to MLS and PM, with the lowest values of AUIDPC 326.38, 498.53, 460.24 and 8.85, 23.65, and 22.44; and 271.86, 281.54, 282.70 and 6.15, 8.08, and 9.80, respectively (Table 2). The genotype FRF 191.2 had the highest values of AUIDPC (2040.17 and 1388.12) and AUSDPC (127.60 and 40.49) for MLS and PM, respectively (Table 2) but was also one of the genotypes that exhibited the highest values of FAP (Table 3).
Table 3.
Univariate analysis of quantitative fruit agronomic parameters (FAP) of total fruit yield (g plant−1—TFY) and qualitative FAP of luminosity (L), chroma (C), hue angle (°hue), pulp firmness F (g/fruit−1), soluble solids (SS ° Brix), titratable acidity (AT g 100 g−1 citric acid) and the ratio of soluble solids to titratable acidity (SS/TA) of strawberry cultivars and genotypes under edaphoclimatic conditions of highland region of Santa Catarina State, southern Brazil during the 2019/2020 and 2020/2021 growing seasons.
All genotypes developed from UDESC and the CRE-OFA-FRF, which showed both potential for qualitative and quantitative FAP and tolerance to foliar diseases in Italy, presented low values of AUIDPC and AUSDPC, indicating that they were moderately resistant to MLS and PM under the edaphoclimatic conditions in the highland region of Santa Catarina State during the 2019/2020 and 2020/2021 growing seasons (Table 1 and Table 2).
3.3. Cultivars and Genotypes FAP
The cultivars Bellalinda and Kiara had similar MLS and PM AUIDPC and AUSDPC. However, the Kiara cultivar showed higher (TFY-643,12) fruit production than the Bellalinda (TFY-470,05) cultivar (Table 3). The cultivars Kiara, Jonica, Irma, Bellalinda, Pircinque, and Randoce had the lowest values of MLS and PM AUIDPC and AUSDPC. However, they exhibited significant differences in MLS and PM susceptibility (Table 1 and Table 2) and in quantitative and qualitative FAP (Table 3). Therefore, PCA was conducted to evaluate the interrelationships among the variables.
The first two principal components obtained from the PCA analysis of MLS and PM AUIDPC (INC-M and INC-O) and AUSDPC (SEV-M and SEV-O) explained 99.3% of the data variability (Figure 2). The first component contributed 91.0%, whereas the second component contributed only 8.3%. The first principal component classified cultivars and genotypes into four main groups. The main axes are related to the first principal component. In decreasing order of contribution were the axes representing MLS INC-M and SEV-M, and PM INC-O (Figure 2). Therefore, the values of these three indicators were higher for cultivars and genotypes that followed the direction and sense of these axes (Figure 2). The cultivars and genotypes that fell into Group 3 were those that showed higher MLS INC-M and SEV-M, and PM INC-O. Group 1 included the cultivars and genotypes with the lowest values for the same variables. Therefore, the cultivars Kiara, Jonica, Irma, Bellalinda, Pircinque, and Randoce were more resistant to MLS and PM than the cultivars San Andreas and Albion, and the genotypes FRF LAM 119.1, FRF 191.2, FRF LAM 263.1, and FRF 57 (Figure 2).
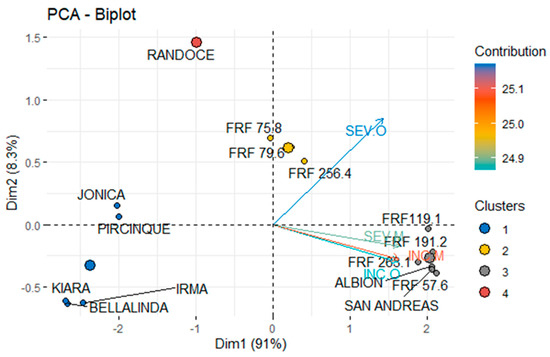
Figure 2.
Area under incidence (AUIDPC) and severity (AUSDPC) disease progress curve of mycosphaerella leaf spot—MLS (Mycosphaerella fragariae) (INC.M and SEV.M) and powdery mildew—PM (Sphaerotheca macularis f. sp. fragariae) (INC.O and SEV.O) in strawberry cultivars and genotypes under edaphoclimatic conditions of the highland region of Santa Catarina State, southern Brazil during the 2019/2020 and 2020/2021 growing seasons.
The FRF PIR 75.8, FRF PIR 79.6, and FRF PIR 256.4 genotypes from Group 2 showed intermediate susceptibility to MLS and PM relative to Groups 1 and 3. The second principal component explains the variation in cultivars and genotypes with respect to PM SEV-O. Regarding this variable, cultivars and genotypes were similar between Groups 2 and 3. Despite the difference in PM INC-O between the cultivars and genotypes in Groups 2 and 3, PM SEV-O was similar among cultivars and genotypes (Figure 2). PM SEV-O differentiated the Randoce cultivar from the cultivars and genotypes classified under Group 1 in relation to the second principal component.
Quantitative and qualitative FAP were estimated for each strawberry cultivar and genotype (Table 3). Under field conditions, the cultivars Pircinque and Jonica exhibited the best values for the FAP of TFY, L, C, °hue, and SS, combined with the lowest incidence, severity, AUIDPC, and AUSDPC (Table 1 and Table 2). However, the cultivars Pircinque, Kiara, and Jonica, as well as the genotype FRF 119.1, showed the highest TFY (g plant−1) values of 667.79, 643.12, 596.63, and 680.32, respectively. The genotypes RFR PIR 75.8 and PIR 256.4 had the highest values for F and SS/AT FAP, respectively, while the cultivars Irma, San Andreas, Albion, and Randoce had the highest values for AT (Table 3). Additionally, the cultivars San Andreas, Albion, and Randoce showed good TFY values of 532.43, 499.09, and 524.56, respectively.
Univariate analysis of the quantitative and qualitative FAP in Table 2 did not allow identification of the best cultivars and genotypes for fruit yield and quality. Cultivars and genotypes were separated using only isolated FAP. Therefore, PCA was used to group the samples according to FAP, allowing for a more comprehensive and integrated evaluation.
The first two principal components of PCA for the different FAP of quality, such as L, C, °hue, SS, TA, and SS/TA, explained 72.5% of the variability in cultivars and genotypes (Figure 3). The contributions of the first and second components were 52.2% and 20.3%, respectively. The first principal component differentiated the cultivars and genotypes mainly by fruit color parameters L, C, and °hue, with a greater contribution from parameters L and C. Genotypes FRF 119.1 and FRF 79.6 exhibited the highest L and C values (Figure 3). The Albion cultivar exhibited the lowest values of the fruit color parameters L, C, and °hue. Despite the lower contributions of parameters L, C, and °hue, the SS variable also belonged to the first PCA component. The second principal component was the fruit flavor parameters of TA and RATIO-SS/TA, which explained 20.3% of the data variability.
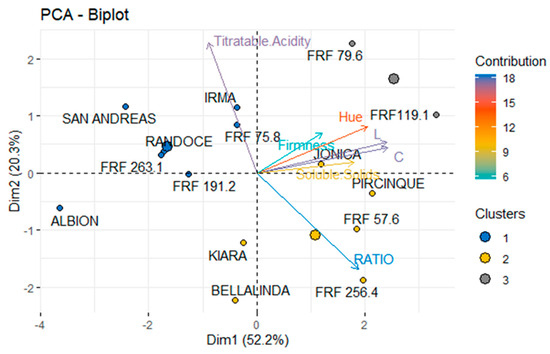
Figure 3.
Qualitative fruit agronomic parameters (FAP) of luminosity (L), chroma (C), hue angle (°hue), pulp firmness F (g/fruit−1), soluble solids (SS ° Brix), titratable acidity (TA g 100 g−1 citric acid) and the ratio of soluble solids to titratable acidity (RATIO) of strawberry cultivars and genotypes under edaphoclimatic conditions of highland region of Santa Catarina State, southern Brazil during the 2019/2020 and 2020/2021 growing seasons.
The genotype FRF 119.1 was classified in Group 2, positioned in the direction and sense of the SS/TA ratio and in the opposite direction of the TA parameter. Thus, genotypes FRF 119.1 and FRF 79.6 exhibited the best flavor balance, primarily due to their lower acidity, TA. Better flavor balance may be related to not only lower TA but also higher SS values. Therefore, the Pircinque cultivar and genotypes FRF 119.1 and FRF 256.4 were positioned in the direction and sense of the SS parameter, respectively, in relation to the first principal component. Therefore, their high SS/TA ratio was related to low TA and high SS (Figure 3). Despite the similar TA values between the pairs Bellalinda and FRF 256.4 and Kiara and Pircinque, because of the high SS, the genotype FRF 256.4 exhibited a higher SS/TA ratio than the cultivar Bellalinda. Additionally, the Pincinque cultivar showed a higher SS/TA ratio than the cultivar Kiara (Figure 3). The FRF 79.6 genotype was also relevant, with an SS value similar to that of the genotype FRF 119.1, which exhibited a higher TA value, resulting in a less balanced flavor. In general, Pircinque, Bellalinda, and Kiara showed good FAP values among the eight FAP evaluated and were the cultivars that exhibited the lowest incidence, severity, AUIDPC, and AUSDPC (Table 1 and Table 2).
The FRF LAM 119.1 genotype was among those that presented the highest production values of TFY of 680.32 g/plant (Table 2), and Kiara, Jonica, and Pircinque showed the highest values for color and flavor. However, the genotype FRF LAM 119.1 was also among those that presented the highest values of MLS AUIDPC (1853.51) and AUSDPC (121.02), and PM AUIDPC (1282.84) and AUSDPC (41.58). The genotypes Kiara, Jonica, and Pircinque (Figure 4) exhibited a high FAP with a good fruit quality, characterized by a high flavor and color balance. The cultivar Kiara was approximately one degree less for °hue than Pircinque and Jonica, characterized by one red tone higher and justifying the distance in the graphic position (Figure 3 and Figure 4). Kiara, Jonica, and Pircinque showed greater resistance to MLS and PM, while Bellalinda and Irma showed less resistance but were still significantly different from all other evaluated materials.
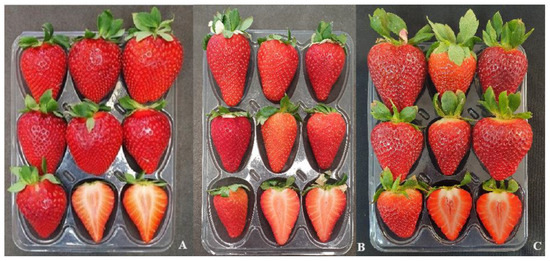
Figure 4.
The best fruit-quality strawberry cultivars, Pircinque (A), Jonica (B), and Kiara (C), which showed the lowest susceptibility of mycosphaerella leaf spot—MLS (Mycosphaerella fragariae) and powdery mildew—PM (Sphaerotheca macularis f. sp. fragariae) under edaphoclimatic conditions of the highland region of Santa Catarina State, southern Brazil during the 2019/2020 and 2020/2021 growing seasons.
4. Discussion
This study, for the first time, compared the main commercial cultivars and advanced genotypes from the breeding program of the Centro di Olivicoltura, Frutticoltura e Agrumicoltura (CRE-OFA-FRF) Forlì/Italy in partnership with UDESC, with respect to their resistance levels to MLS and PM, and quantitative and qualitative FAP under the edaphoclimatic conditions of highland regions of southern Brazil during the 2019/2020 and 2020/2021 growing seasons. Most of the evaluated cultivars are used in strawberry production in many countries worldwide. The findings of this study complement those of similar previous studies [8,11,15,18].
The climatic conditions during the 2019/2020 and 2020/2021 growing seasons were favorable for infection and growth by M. fragariae and S. macularis f. sp. fragariae, which require a high relative humidity of 75% to 98% and temperatures of approximately 9–25 °C and 15–22 °C, respectively. The growth season usually starts in May and can extend to the end or beginning of the next year, depending on the cultivars. During this period, it is common to find environmental conditions suitable for both MLS and PM. In this context, the influence of relative humidity, temperature, and duration of leaf wetness on infection is important, particularly the influence of low temperatures on early spring inoculum production. Disease infection may begin early in the season when the average temperature is about 10–12 °C and prolonged periods of high relative humidity are frequent. Moreover, this means that the onset of infection is synchronized with the spring regrowth of strawberry leaves, which implies that infection occurs when young leaves, which are the most susceptible to infection, appear [8,23,24,25].
Ref. [16] studied the sporulation of M. fragariae detached leaves and observed minimal sporulation when the leaves were maintained wet for 24 h at 5 °C, an increase in sporulation from 10 to 25 °C, low sporulation at 30 °C, and absence of sporulation at 35 °C. M. fragariae can produce spores throughout the year in lesions in old leaves under conditions in southern Brazil [23,26,27,28]. If these spores fall onto other leaves, they germinate under wet conditions, especially after rainfall. After an incubation period of 10–15 days, new spots appear and produce new spores that infect other young leaflets. This cycle can repeat several times during a single growing season. S. macularis f. sp. fragariae survives in intercrops as mycelium on green persistent leaves and dormant infected strawberry crowns. Colonies on these tissues sporulate throughout the cultivation period, thereby perpetuating the disease [24,29]. Conidia of S. macularis f. sp. fragariae remain viable for a short period of time and require 4–6 h of high relative humidity at approximately 25 °C for germination. Subsequent penetration and colonization of leaf tissue takes place within 24–48 h of germination [23,24,25]. Although MLS and PM have been recognized as an important strawberry disease for many decades [16,25,30], little information exists on their epidemiology [9,16,23,26,29]. This is primarily because, to date, the disease has been managed mostly by host genetic resistance and fungicide control [16,27,29]. However, many changes in strawberry cultivars and increased fungicide resistance have caused disease outbreaks in several strawberry production areas [23,25].
Disease quantification is essential for epidemiological studies, surveys, and management decisions. PM requires special attention because it occurs as patches or diffuse colonies on the underside of leaves, making the assessment of disease severity challenging [9].
The cultivars Kiara, Jonica, Irma, Bellalinda, Pircinque, and Randoce were more resistant to MLS and PM than the cultivars San Andreas and Albion, and the genotypes FRF LAM 119.1, FRF 191.2, FRF LAM 263.1, and FRF 57. Additionally, Pircinque, Kiara, and Jonica presented the best FAP values and combined MLS and PM resistance with high fruit yield and quality. The FRF 104.1 genotype produces high fruit yields under semi-hydroponic and hydroponic production systems [26], and it has recently been named cultivar Bellalinda [9]. This cultivar had the lowest values of MLS and PM incidence, severity, AUIDPC, and AUSDPC. Cultivar Bellalinda, when grown in soil with tunnel systems, showed 28% higher production than when it was grown under semi-hydroponic and hydroponic systems [26]. The cultivars Bellalinda, Kiara, Jonica, and Pircinque are excellent options for strawberry producers in the southern region of Brazil. They combined the highest level of MLS and PM resistance with good fruit yield and quality.
Yield (TFY—g plant−1) is one of the most important quantitative FAP in breeding programs for many crops. Therefore, having highly productive genotypes with Brazilian averages around 35–40 t ha−1 [4,11,15] is important because it allows reliability for the producer. Thus, the cultivars Kiara, Jonica, and Pircinque were considered excellent options for increasing productivity and fruit quality because they are highly productive and moderately to highly resistant to MFM and PM. Ref. [31] identified three resistance genes that control PM in strawberries. These genes are associated with quantitative FAP and aid in the selection of genetic materials for the germplasm bank of the breeding program. However, PM is a pathogen that infects various parts of the plant, such as leaves, fruits, flowers, and strawberry stolons, causing significant losses in production, mainly through the production of nonmarketable fruits.
Despite the relevance of the TFY parameter in the context of strawberry commercialization, it is necessary to combine it with high fruit quality. The FAP TA and SS are associated with fruit flavor. Therefore, high TA should be balanced with sugar content, ensuring that the fruit is well accepted by consumers [10]. The SS/TA ratio is also essential in choosing the best cultivar or genotype, and in this study, the cultivars and genotypes that showed a higher correlation with the FAP yield (g plant−1) also showed higher SS/TA ratio values and moderate to high MLS and PM resistance, such as Kiara, Jonica, Pircinque cultivars, and FRF 119.1 genotype.
The quality of fruit flavor and aroma is reflected by a high SS/TA ratio, which indicates a balance between sugar content and acidity. A higher SS/TA ratio leads to a more balanced flavor and aroma, resulting in greater sensory acceptance of the fruit [32,33]. The SS/TA ratio is a more comprehensive indicator of fruit flavor and aroma compared to sugars and acidity alone, providing a more precise assessment [34]. When consumers make purchasing decisions, they often prioritize the size and appearance of fruit over its flavor [35]. Breeding programs aim to develop new cultivars that not only exhibit high productivity but also possess desirable fruit quality characteristics. However, achieving this combination can be challenging, as many of these productive and fruit quality parameters are inversely related, depending on the available germplasm material [31]. The results obtained are important in defining the cultivars and the type of management to be adopted for controlling MLS and PM in strawberry cultivation. Cultivars with higher levels of resistance and good fruit quality, such as Kiara, Jonica, and Pircinque, should be preferred by farmers, especially in southern Brazil. For cultivars with moderate resistance, such as Bellalinda and Randoce, attention should be given to the adoption of cultural practices and the use of fungicides aimed at disease prevention and control, as fruit productivity and quality are directly related to the leaf area capable of performing photosynthesis [8,24]. Therefore, the most recently released cultivars, Kiara, Jonica, and Pircinque, are precisely those with higher levels of resistance and good fruit yield and quality. The present data showed that the cultivars Kiara, Jonica, and Pircinque exhibited moderate to high levels of MLS and PM resistance associated with good fruit quality under the edaphoclimatic conditions of the highland regions of southern Brazil.
5. Conclusions
Cultivars Kiara, Jonica, Pircinque, Bellalinda, and Irma were the most resistant to MLS and PM, and Kiara, Jonica, and Pircinque, and the genotype FRF LAM 119.1 had the best quantitative and qualitative FAP. However, the FRF LAM 119.1 genotype was highly susceptible to MLS and PM. The cultivars Kiara, Jonica, and Pircinque, and the FRF LAM 119.1 genotype, had the highest TFY values and the best fruit quality in terms of skin color and flavor balance (TA and SS).
Author Contributions
J.M.d.L., D.P., L.R., G.B., F.R.N. and A.B.—Conceived and designed the experiments. J.M.d.L., A.F.F., and F.R.N.—Performed the experiments. J.M.d.L., D.P., L.R., A.A.K., F.R.N., G.B. and A.B.—Analyzed and interpreted the data. All authors have read and agreed to the published version of the manuscript.
Funding
This study was supported by the Santa Catarina State University-UDESC (PAP-01/2019), the Coordination for the Improvement of Higher Education Personnel—CAPES (PROAP-2019), the National Council for Scientific and Technological Development—CNPq (PQ-2022), and the Foundation for Support of Research and Innovation of the State of Santa Catarina—FAPESC (TO-2019).
Data Availability Statement
Data will be made available on request.
Acknowledgments
The authors thank the institutions Santa Catarina State University (CAV-UDESC), Brazilian Coordination of Superior Level Staff Improvement (CAPES), Santa Catarina State Foundation for Research Support (FAPESC), and National Council for Scientific and Technological Development (CNPQ) for funds and fellowships.
Conflicts of Interest
Author Antônio Felipe Fagherazzi was employed by the company Brazil Ekland Marketing Co. (EMCO CAL). The remaining authors declare that the research was conducted in the absence of any commercial or financial relationships that could be construed as a potential conflict of interest.
References
- Fachinello, J.C.; Pasa, M.S.; Schmtiz, J.D.; Betemps, D.L. Situation and perspectives of temperate fruit crops in Brazil. Rev. Bras. Frut. 2011, 33, 109–120. [Google Scholar] [CrossRef]
- Faostat. Food and Agriculture Organization of United Nation. Statistical of Yearbook. Statistical of Strawberry Production in World. 2023. Available online: https://openknowledge.fao.org/ (accessed on 5 May 2024).
- Antunes, L.E.C.; Peres, N.A. Strawberry Production in Brazil and South America. Int. J. Fruit Sci. 2013, 13, 156–161. [Google Scholar] [CrossRef]
- Antunes, L.E.C.; Júnior, C.R.; Schwengber, J.E. Morangueiro, 1st ed.; Embrapa: Brasília, DF, Brazil, 2016; p. 146. [Google Scholar]
- Fagherazzi, A.F.; Bortolini, A.J.; Zanin, D.S.; Bisol, L.; Dos Santos, A.M.; Grimaldi, F.; Kretzschmar, A.A.; Baruzzi, G.; Faedi, W.; Lucchi, P.; et al. New strawberry cultivars and breeding activities in Brazil. Acta Hort. 2017, 1156, 167–170. [Google Scholar] [CrossRef]
- Jia, N.; Xie, Y.; Zhang, H.; Liu, H.; Feng, J.; Zhu, L.; Zhou, X. Effect of bacteriocin treatment on storage and quality of postharvest strawberry fruit. Adv. Mat. Res. 2012, 554, 1547–1552. [Google Scholar] [CrossRef]
- Heling, A.L.; Kuhn, O.J.; Stangarlin, J.R. Biological controlo f Mycosphaerella fragariae in strawberry. Sci. Agr. Paran. 2015, 14, 221–228. [Google Scholar]
- Fagherazzi, A.F.; Cocco, C.; Antunes, L.E.C.; De Souza, J.A.; Rufato, L. La fragolicoltura brasiliana guarda avanti. Riv. Fruttic. Ortofloric. 2014, 76, 20–25. [Google Scholar]
- da Silva, L.R.; Campos, A.A.A.; Moreira, L.C.; Barral, D.M.; de Andrade, G.F.P.; Guimarães, A.G.; da Silva, I.M.; Tannure, M.P.; Pinto, N.A.V.D.; da Costa, M.R.; et al. Agronomic characteristics and postharvest quality of strawberry in a semi-hydroponic cultivation system. Pesq. Agrop. Bras. 2024, 59, e03384. [Google Scholar] [CrossRef]
- Aldrighetti, A.; Pertot, I. Epidemiology and control of strawberry powdery mildew: A review. Phytop. Medit. 2023, 62, 427–453. [Google Scholar] [CrossRef]
- Carpenedo, S.; Antunes, L.E.C.; Treptow, R.O. Sensory characterization of strawberry grown in the region of Pelotas (Brazil). Hort. Bras. 2016, 34, 565–570. [Google Scholar] [CrossRef]
- Peel, M.C.; Finlayson, B.L.; McMahon, T.A. Updated world map of the Koppen-Geiger climate classification. Hydr. Earth Syst. Sci. 2007, 11, 633–1644. [Google Scholar] [CrossRef]
- dos Santos, H.G.; Jacomine, P.K.T.; dos Anjos, L.H.C.; de Oliveira, V.A.; Lumbreras, J.F.; Coelho, M.R.; de Almeida, J.A.; de Araujo Filho, J.C.; de Oliveira, J.B.; Cunha, T.J.F. Sistema Brasileiro de Classificação de Solos, 5th ed.; Embrapa: Brasília, DF, Brazil, 2018; p. 306. [Google Scholar]
- SBCS. Sociedade Brasileira de Ciência do Solo. Manual de adubação e calagem para os estados de Rio Grande do Sul e Santa Catarina; Núcleo Regional Sul, Comissão de Química e Fertilidade do Solo—RS/SC: Xanxerê, SC, Brazil, 2016; p. 265. [Google Scholar]
- Fagherazzi, A.F.; Grimaldi, F.; Kretzschmar, A.A.; Molina, A.R.; Gonçalves, M.J.; Antunes, L.E.C.; Baruzzi, G.; Rufato, L. Strawberry production progress in Brazil. Acta Hort. 2017, 1156, 937–940. [Google Scholar] [CrossRef]
- Carisse, O.; Lefebvre, A.; Van der Heyden, H.; Roberge, L.; Brodeur, L. Analysis of incidence–severity relationships for strawberry powdery mildew as influenced by cultivar, cultivar type, and production systems. Plant Dis. 2013, 97, 354–362. [Google Scholar] [CrossRef]
- Mazaro, S.M.; Gouvea, A.; May De Mio, L.L.; Deschamps, C.; Biasi, L.A.; Citadin, I. Diagrammatic scale to evaluate the mycosphaerella blight severity in strawberry. Ciência Rural 2006, 36, 648–652. [Google Scholar] [CrossRef]
- Brahm, R.U.; Ueno, B.; De Oliveira, R.P. Reaction of strawberry cultivars to powdery mildew under greenhouse conditions. Rev. Bras. Frutic. 2005, 27, 219–221. [Google Scholar] [CrossRef]
- de Jesus Junior, W.C. Análise Temporal de Epidemias. In Epidemiologia Aplicada ao Manejo de Doenças de Plantas; Vale, F.X.R., de Jesus Junior, W.C., Zambolim, L., Eds.; Perfil Editora: Belo Horizonte, MG, Brazil, 2004; pp. 125–192. [Google Scholar]
- Jeager, T.F. Categorical data analysis: Away from ANOVAs (transformation or not) and towards Logit Mixed Models. J. Mem. Lang. 2008, 59, 434–446. [Google Scholar] [CrossRef]
- Campbell, C.L.; Madden, L.V. Introduction to Plant Disease Epidemiology; Wiley: New York, NY, USA, 1990; p. 560. [Google Scholar]
- Ferreira, D.F. Sisvar: A computer statistical analysis system. Cienc. Agrotec. 2011, 35, 1039–1042. [Google Scholar] [CrossRef]
- Carisse, O.; McNealis, V. Development of Action Threshold to Manage Common Leaf Spot and Black Seed Disease of Strawberry Caused by Mycosphaerella fragariae. Plant Dis. 2019, 103, 563–570. [Google Scholar] [CrossRef]
- Farooq, M.; Dodgson, J.; Hall, A. Examination of the morphology of Podosphaera aphanis cleistothecia and their role in over wintering of the fungus. Asp. App. Biol. 2007, 83, 55–58. [Google Scholar]
- Kader, A.A. Standardization and Inspection of Fresh Fruits and Vegetables. In Fresh Foods and Vegetables, 3rd ed.; Kader, A., Ed.; University of California: Oakland, CA, USA, 2002; pp. 287–299. [Google Scholar]
- Brugnara, E.C.; Colli, M.P. Leaf spot and leaflet removal in day-neutral strawberry cultivars under different cultivation conditions in organic management. Idesia 2014, 32, 89–92. [Google Scholar] [CrossRef]
- Carisse, O.; McNealis, V. Identification of weather conditions associated with the occurrence, severity, and incidence of black seed disease of strawberry caused by Mycosphaerella fragariae. Phytopathology 2018, 108, 83–93. [Google Scholar] [CrossRef]
- Gadoury, D.M.; Asalf, B.; Heidenreich, M.C.; Herrero, M.L.; Welser, M.J.; Seem, R.C.; Tronsmo, A.M.; Stensvand, A. Initiation, development, and survival of cleistothecia of Podosphaera aphanis and their role in the epidemiology of strawberry powdery mildew. Phytopathology 2010, 100, 246–251. [Google Scholar] [CrossRef] [PubMed]
- Iwasaki, S.; Asano, S.; Yoshida, K.; Kitamura, S.; Taira, A.; Honda, Y.; Suzuki, T.; Takikawa, Y.; Kakutani, K.; Matsuda, Y.; et al. Analysis of conidiogenesis and lifelong conidial production from single conidiophores of Podosphaera aphanis on strawberry leaves using digital microscopic and electrostatic techniques. Aust. Plant Path. 2021, 50, 571–587. [Google Scholar] [CrossRef]
- Sombardier, A.; Dufour, M.C.; Blancard, D.; Corio-Costet, M.F. Sensitivity of Podosphaera aphanis isolates to DMI fungicides: Distribution and reduced cross-sensitivity. Pest Manag. Sci. 2010, 66, 35–43. [Google Scholar] [CrossRef]
- Sargent, D.J.; Buti, M.; Šurbanovski, N.; Brurberg, M.B.; Alsheikh, M.; Kent, M.P. Identification of QTLs for powdery mildew (Podosphaera aphanis; syn. Sphaerotheca macularis f. sp. fragariae) susceptibility in cultivated strawberry (Fragaria ×ananassa). PLoS ONE 2019, 14, e0222829. [Google Scholar] [CrossRef] [PubMed]
- Barankevicz, G.B.; Novello, D.; Resende, J.T.V.; Schwarz, K.; Santos, E.F. Physical and chemical characteristics of tomato hybrids pulp during frozen storage. Hort. Bras. 2015, 33, 7–11. [Google Scholar] [CrossRef]
- Souza, D.C.; Ossani, P.C.; Resende, L.V.; Cirillo, M.A.; Silva, L.F.L.; Xavier, J.B. Genetic variability between commercial cultivars and experimental strawberry hybrids with emphasis on multi-factor analysis. Magistra 2019, 30, 48–59. [Google Scholar]
- Zanin, D.S.; Fagherazzi, A.F.; Santos, A.M.; Martins, R.; Kretzschmar, A.A.; Rufato, L. Agronomic performance of cultivars and advanced selections of strawberry in the South Plateau of Santa Catarina State. Rev. Ceres 2019, 66, 159–167. [Google Scholar] [CrossRef]
- Faedi, W.; Baruzzi, G.; Lucchi, P.; Magnani, S.; Carullo, A.; Maltoni, M.L.; Migani, M.; Sbrighi, P. The new ‘Pircinque’ strawberry cultivar released under Italy’s PIR Project. Acta Hort. 2014, 1049, 961–1966. [Google Scholar] [CrossRef]


Disclaimer/Publisher’s Note: The statements, opinions and data contained in all publications are solely those of the individual author(s) and contributor(s) and not of MDPI and/or the editor(s). MDPI and/or the editor(s) disclaim responsibility for any injury to people or property resulting from any ideas, methods, instructions or products referred to in the content. |
© 2024 by the authors. Licensee MDPI, Basel, Switzerland. This article is an open access article distributed under the terms and conditions of the Creative Commons Attribution (CC BY) license (https://creativecommons.org/licenses/by/4.0/).