Article

Nonlinear Nexus between Agricultural Tourism Integration and Agricultural Green Total Factor Productivity in China

by
Bing Yang
1,
Yansong Li
2,
Mengjiao Wang
3,* and
Jianxu Liu
2
1
School of Economics, Xihua University, Chengdu 610039, China
2
School of Economics, Shandong University of Finance and Economics, Jinan 250014, China
3
Institute of Area and International Communication Studies, Shenzhen University, Shenzhen 518060, China
*
Author to whom correspondence should be addressed.
Agriculture 2024, 14(8), 1386; https://doi.org/10.3390/agriculture14081386
Submission received: 3 July 2024 / Revised: 11 August 2024 / Accepted: 14 August 2024 / Published: 16 August 2024
(This article belongs to the Section Agricultural Economics, Policies and Rural Management)

Abstract

:
The integration of agriculture and tourism has emerged as a potential strategy to boost agricultural productivity and promote sustainable rural development in China. This study investigates the impact of agricultural tourism integration (ATI) on agricultural green total factor productivity (AGTFP) in China, filling a research gap in understanding the complex dynamic nexus. We examine the mediating role of the agricultural industrial structure adjustment index (AISAI) and the threshold effects of ATI and human capital level (HCL) using a panel dataset of 30 Chinese provinces from 2011 to 2021. The empirical results reveal three key findings: (1) ATI has a significant positive impact on AGTFP growth; (2) the AISAI partially mediates the relationship between ATI and AGTFP; and (3) ATI and HCL have a double-threshold effect and a single-threshold effect on the ATI-AGTFP nexus, respectively. These findings suggest that the effectiveness of ATI in promoting AGTFP varies across different stages of integration and levels of human capital development. The empirical results contribute to the literature on rural development strategies by providing an in-depth understanding of how ATI influences agricultural productivity and sustainability. Based on these findings, we propose targeted policy recommendations to optimize ATI strategies and invest in human capital to improve the resilience and sustainability of rural economies in China.

1. Introduction

In terms of sustainable agricultural development, the concept of agricultural green total factor productivity (AGTFP) has been receiving a lot of attention recently. AGTFP is a comprehensive measurement which captures the effectiveness of agricultural output while taking into account its effects on the environment and resource limitations [1]. Recognized as an important indicator, it measures the resilience and sustainability of agricultural systems [2]. Improving AGTFP has become a crucial component of achieving sustainable agricultural development as global society deals with challenges such as food security, climate change, and resource depletion [3].
Meanwhile, an emerging phenomenon in various countries is the combining of tourism and agriculture, and offers new opportunities for the economic diversification and recovery of agricultural regions [4]. It has been successfully shown that agritourism, which combines agricultural production with activities related to tourism, contributes to supporting the preservation of rural landscapes and cultures, creates jobs for farmers, and increases their income [5]. Agritourism’s potential as a catalyst for the development of agriculture was previously highlighted by its 15% annual growth rate over the past ten years, according to the UNWTO world tourism highlights in 2020 [6].
The agricultural tourism industry in China has experienced significant growth in the past ten years. This trend has not only provided new economic development opportunities in rural areas but has also presented challenges to the sustainability of agricultural systems. China, the world’s largest agricultural nation, has placed great emphasis on the enhancement of AGTFP and the advancement of sustainable agricultural development [7]. In this context, it is crucial to understand the impact of including agricultural tourism integration (ATI) on AGTFP in order to achieve the dual goals of modernizing rural areas and promoting sustainable agriculture practices.
ATI has become a global trend, providing an achievable path to rural diversification and sustainable development. The government’s efforts to promote rural tourism as a strategy for poverty alleviation and rural revitalization, as well as the growing demand for rural leisure experiences among urban residents, have contributed to the growth of agricultural tourism in China. According to the China Tourism Academy dataset, agricultural tourism attracted 3.2 billion visitors and generated a revenue of over 850 billion RMB in 2019. Agricultural tourism has provided economic benefits to rural communities, but its influence on the sustainability of agricultural systems is still poorly understood. On the one hand, the expansion of agricultural tourism may result in adverse environmental externalities, including resource overexploitation and environmental degradation, which could potentially undermine AGTFP. However, agricultural tourism could additionally encourage the multifunctionality of agriculture by promoting the adoption of eco-friendly farming practices, landscape conservation, and branding of agricultural products, thereby enhancing AGTFP [8]. Therefore, it is necessary to examine the impact of ATI on AGTFP in order to develop evidence-based policies and to improve agricultural tourism models to achieve sustainable agricultural development.
The existing literature has separately investigated different aspects of AGTFP and ATI. Agritourism’s economic, social, and environmental effects (e.g., [9,10]), as well as the determinants and trends in AGTFP, have been the subject of numerous studies (e.g., [11,12]). Nevertheless, there are still several significant research gaps in understanding the relationship between the two key elements of sustainable agricultural development. Firstly, there is a paucity of studies examining the impact of ATI on AGTFP. The majority of studies have primarily focused on the direct economic benefits of agritourism, ignoring its implications for agricultural productivity and sustainability. Secondly, the potential mediating mechanisms in the ATI-AGTFP relationship, such as the role of agricultural industrial structure adjustment, remain largely unexplored. Thirdly, the nonlinear characteristics of the ATI-AGTFP relationship, which may include potential threshold effects, have not been adequately addressed in the current research. Moreover, there is a requirement for more extensive and precise measurement indicators for both AGTFP and ATI to fully capture the multiple dimensions of these concepts.
This study proposes a number of research questions to fill these gaps: (1) Does ATI have a direct impact on AGTFP? (2) Does the agricultural industrial structure adjustment index (AISAI) mediate the relationship between ATI and AGTFP? (3) Is the relationship between ATI and AGTFP characterized by any nonlinearities?
The objective of this study is to provide an in-depth investigation of the impacts of ATI on AGTFP in China, in order to contribute to the growing body of research on sustainable agricultural development. Specifically, this research aims to (1) construct indicators for measuring AGTFP and ATI, (2) examine the mediating effect of the AISAI on the ATI-AGTFP relationship, and (3) explore the potential nonlinear relationship between the two using a threshold effect model.
This study adopts econometric methodologies and a panel dataset that covers 30 Chinese provinces from 2011 to 2021 to ensure the reliability and robustness of the findings. The Slack-Based Measure–Global Malmquist–Luenberger (SBM-GML) index is employed to accurately measure AGTFP by including both desirable and undesirable outputs. The ATI index was constructed using the coupling coordination degree method, and ten indicators were selected to represent the complex relationship between agriculture and tourism. Furthermore, the mediation effect model is applied to investigate the indirect effects of ATI on AGTFP by using the AISAI. After that, the threshold regression model was applied to examine the potential nonlinearities in the relationship between ATI and AGTFP in terms of ATI and human capital level (HCL) as a threshold.
Three major contributions are provided by this study. First of all, the impact of ATI on AGTFP was comprehensively studied, considering both direct and indirect effects, as well as potential nonlinear relationships. The empirical results indicate that ATI has a significant positive impact on AGTFP growth, that the AISAI partially mediates the effect, and that there are threshold effects of ATI and HCL on the ATI-AGTFP relationship. This presents a deeper understanding of the detailed relationship between ATI and AGTFP. Secondly, new indicators were created to evaluate AGTFP and ATI, which more accurately reflect the multiple aspects of the concepts than previous research. The empirical findings show these indicators are effective in describing the ATI-AGTFP relationship. Thirdly, this study provides the foundation for future research and policy development by bridging the gap between ATI and AGTFP, thereby contributing to the expanding literature on sustainable agricultural development. The empirical findings and policy recommendations have important implications for policymakers and practitioners who are involved in promoting sustainable agritourism development and enhancing agricultural productivity.
The organization of this paper is as follows: Section 2 provides a literature review discussing the relationship between ATI and AGTFP, as well as the potential mediating and threshold factors. Section 3 explains the methodology employed in this study; it includes the construction of indicators for ATI and AGTFP, the application of mediation effect and threshold regression models, and a description of the panel dataset. Section 4 presents the empirical findings, containing descriptive statistics, a baseline regression analysis, a mediating effect analysis, and a threshold effect analysis. Section 5 provides a detailed discussion of the results, which also explores the implications of the findings for sustainable agriculture and rural development within the broader literature. Finally, conclusions, policy recommendations, limitations, and suggestions for future research are drawn in Section 6.

2. Literature Review

2.1. The Relationship between ATI and AGTFP

The measurement of AGTFP has become a hot topic in the research of sustainable agricultural development, with scholars employing various indicators and methods to quantify AGTFP. In terms of indicator selection, some studies have focused on traditional input–output indicators including land, labor, and capital [13], while others have taken environmental elements such as the use of chemical fertilizers and pesticides [14]. However, these approaches often ignore the importance of undesirable outputs such as carbon emissions and agricultural waste. For the calculation methods, scholars have applied many techniques like Data Envelopment Analysis (DEA), Stochastic Frontier Analysis (SFA), and the Malmquist index [14,15]. Nevertheless, these methods are limited in their ability to accurately measure AGTFP due to their requirement for the inputs and outputs of the model to change in the same proportion, which is inconsistent with actual production conditions [16]. In order to overcome these limitations, this study employs the SBM-GML index, which takes into account both desirable and undesirable outputs, leading to a more accurate and comprehensive assessment of AGTFP [17].
Additionally, the investigation of ATI has attracted significant academic attention due to its important potential for promoting rural and sustainable agricultural growth [18,19]. ATI refers to the systematic integration and intrinsic connection between agriculture and tourism along the industrial and value chains, thereby enhancing economic and social benefits [20]. In order to accurately assess ATI, it is important to consider many perspectives and employ a variety of indicators. Several studies have focused on the economic impact of ATI by analyzing the share of agritourism income in total agricultural income. Others have investigated the preservation of traditional agricultural practices and rural heritage, taking into account social and cultural factors. And some have examined environmental factors, particularly the reduction in carbon emissions and the promotion of eco-friendly activities [21]. However, these indicators have constraints in accurately representing the multifarious facets of ATI, and thus, a more comprehensive indicator system to measure ATI is necessary.
Scholars have suggested several methods for developing indicators for ATI, namely the analytic hierarchy process (AHP) [22] and the entropy weight method (EWM) [23]. Nevertheless, these methods have limitations in capturing the dynamic interactions between agriculture and tourism [20]. In an effort to solve these issues, this study adopted the coupling coordination degree (CCD) method, which has the advantage of measuring the synergistic effects and coordinated development of multiple subsystems [24], and it provides a more comprehensive assessment of the intricate relationships and interdependencies between agriculture and tourism, offering a comprehensive way to measure the degree of integration level between the two sectors [25,26]. Thus, this study employed the CCD method to quantify the ATI level, capturing the complicated character of ATI by constructing the ATI indicator covering different factors including economic, social, and environmental elements.
Although academics have paid more attention to the relationship between ATI and AGTFP, the results are not consistent. On the one hand, agritourism improves AGTFP. According to Barbieri and Mshenga [18], agritourism farms often have higher levels of environmental management and employ more sustainable agricultural practices compared to non-agritourism farms. Conversely, agritourism creates negative environmental externalities from issues like resource overexploitation and environmental degradation, which negatively impact agricultural total factor productivity [27,28,29]. Despite the increasing number of studies on the economic, social, and environmental impacts of agritourism, the specific mechanisms through which ATI affects AGTFP remain underexplored, and scholars have not reached a consensus on the net effect of ATI on AGTFP. Therefore, this study aims to address the deficiencies in this research field by comprehensively investigating the impact of ATI on AGTFP and its potential pathways of influence.

2.2. The Mediation Effect of Agricultural Industrial Structure Adjustment Index

The AISAI plays a crucial role in explaining the intricate relationship between ATI and AGTFP. As ATI may generate transformations in the agricultural industrial structure, which then impacts agricultural productivity and sustainability [30,31], academics have increasingly recognized the potential mediating role of the AISAI in the ATI-AGTFP relationship. Numerous studies have explored the relationship between productivity and industrial structure. For instance, Vu [32] found that structural change significantly contributes to productivity growth in developing countries. Flanigan et al. [19] propose in the context of integration of tourism and agriculture that agritourism could serve as a catalyst for the restructuring and modernization of the agricultural sector. These findings point to ATI possibly promoting the optimization and upgrading of the agricultural industrial structure, hence improving AGTFP. Nevertheless, whereas some studies have investigated the role played by the mediation of agricultural industrial structure in the relationship between several factors and agricultural productivity (e.g., [33]), research specifically examining the AISAI as a mediating variable in the ATI-AGTFP relationship remains limited. Thus, by providing new insights on the complex relationships between ATI, the AISAI, and AGTFP, this study aims to bridge the gap.

2.3. The Threshold Effect of Human Capital Level

Scholars have drawn interest in the threshold effect of HCL in the nonlinear relationship between ATI and AGTFP increase. Studies have investigated the threshold effects of human capital in various contexts, which includes the impact of human capital on the relationship between foreign direct investment and economic growth [34], the role of human capital in the technology spillover effects of international trade [35], and the threshold effect of human capital on the relationship between entrepreneurship and innovation [36]. However, scholars have paid less attention to the impact of HCL on the ATI-AGTFP relationship at specific points or intervals, and the structural changes between variables.
Some studies have shown that higher HCLs have a positive effect on the ATI-AGTFP relationship. Huffman [37] argues that higher HCLs make areas more likely to gain from agritourism since they possess the knowledge and ability needed to implement advanced technology and management techniques. Gao and Wu [22] contend that realizing the possibilities of agritourism to further sustainable agricultural development depends on a well-educated and competent workforce in agriculture. These findings imply that investment in human capital development will help to improve the positive impact of agritourism on the growing ATI-AGTFP relationship.
Other scholars have also emphasized the diminishing marginal returns to human capital investment. Psacharopoulos and Patrinos [38] point out that the marginal effect of human capital on the agricultural tourism–AGTFP relationship may weaken once human capital accumulation exceeds a certain level. Krueger and Lindahl [39] observed a nonlinear relationship between human capital and economic growth with the growth effects of human capital diminishing at higher levels of development. The diminishing marginal impact could result in a less-than-ideal resource allocation and hinder the effectiveness of programs targeted to support sustainable agricultural development via ATI. Therefore, investigating the potential threshold effects of HCL on the ATI-AGTFP relationship is essential.

3. Methodology

3.1. Measurement of AGTFP and ATI

When measuring AGTFP, we take into account both input and output factors. For input factors, we drew on the work of Fuglie [40], Adetutu and Ajayi [41], and Wang et al. [16] by considering the five key dimensions of labor, land, capital, energy, and water, which were expressed using eight specific indicators. Labor input is defined by the number of employees in the primary industry, which measures the human resources required. Land inputs consider the spatial extent of agricultural activities, measured by the total area used for growing crops and aquaculture. Capital input takes into account the resources required in both the early and later stages of agricultural production. It is measured by four indicators: fertilizer usage, the total power of agricultural machinery, the usage of agricultural plastic film, and the use of pesticides. Energy inputs are expressed in terms of agricultural diesel consumption, while water inputs are obtained in terms of the effective irrigated area.
On the output factor, we refer to the study by Mulwa et al. [42], which classified it into desirable outputs and undesirable outputs and considered the importance of environmental factors. The desirable output is represented by the total output of agriculture, forestry, animal husbandry, and fisheries. Given the increasing environmental concerns, agricultural carbon emissions represent the undesirable output.
The AGTFP indicator is constructed by considering many input factors and both desirable and undesirable outputs. It balances the effects of economic productivity and environmental issues to provide a more complete measure of agricultural productivity in the context of sustainable development. In this study, the SBM-GML index was used to measure and evaluate AGTFP (for detailed explanations, refer to Zhang et al. [43]), and the specific input and output indicators are shown in Table 1.
ATI relates to the interaction and cooperation between two different sectors. To effectively measure the level of integration between agriculture and tourism, it is essential to take into account various aspects and indictors that reflect the synergy between the two industries. In this study, we consider the complex relationship and interdependence between agriculture and tourism, adopt the CCD model to quantify the level of ATI, and provide an overall assessment of their integration level.
The following five steps detail the process of constructing the ATI index.
Step 1: Creation of an index system for evaluations.
ATI can be described as the process of combining agricultural resources with regional characteristics to form distinctive agricultural and tourism brands. Therefore, the most exceptional reflection of the features and elements of ATI is characteristic agritourism brands like agricultural tourism towns, key tourism villages, leisure agriculture, and rural tourism demonstration counties.
To better capture the essence of ATI, this study employs indicators that specifically represent the development level of the agricultural tourism industry, rather than relying on generic indicators like tourism income and agricultural output value found in statistical yearbooks. Building upon the work of Yang et al. [44], we select five indicators to measure the level of characteristic agricultural development and another five indicators to evaluate the degree of rural tourism development. The indicators for characteristic agricultural development comprehensively reflect its scale, innovation, quality, ecology, and efficiency, while those for rural tourism development capture its attractiveness, popularity, economic contribution, and industrial support. Table 2 displays the indicator system of ATI.
Step 2: Standardization of the indicator data.
The evaluation index system contains both positive and negative indicators in its raw data. To better compare and analyze the data, it is crucial to perform dimensionless and positive standardization on the indicators.
The original data for the indicators in the evaluation index system have different dimensions and include both positive and negative indicators. To better compare and analyze the data, it is necessary to perform dimensionless and positive normalization on the indicators. In this study, we employ the range normalization method to standardize the data.
Taking the calculation of agricultural industry indicators as an example, suppose there are m indicators ( X i ). The formula X i j = X i j m i n X j m a x X j m i n X j is used for calculation in positive indicators, and X i j = m i n X j X i j m a x X j m i n X j is for negative indicators. X i j is the normalized values of the j th indicator for the i th province, and X i j is the original values. m a x   ( · ) and m i n   ( · ) are, respectively, the maximum and minimum values of the j th indicator. The tourism industry n indicators ( Y j ) value is calculated in the same way.
The range normalization method scales the raw data to a range between 0 and 1, while maintaining the relative differences between the values. Positive indications demonstrate better results when their normalized value are greater, and negative indicators exhibit greater performance when their normalized values are lower.
Step 3: Calculating the values of the indicators.
To assess the overall development level of the agricultural and tourism industries, we first calculate the comprehensive evaluation indices for each industry. This study adopts the weighted sum method to compute these indices. Taking the agricultural industry as an example, the specific formula is A i = i = 1 m w j X i j , and i = 1 m w j = 1 . Here, A i is the comprehensive development index for the agricultural industry in the i th province, and w j is the weight assigned to the j th indicator in the agricultural industries.
Step 4: Calculating the entropy weights of the indicators.
This study employs the entropy weight method to calculate the weights assigned to each indicator in the agricultural and tourism industries. The entropy weight method is an objective weighting approach that assigns weights based on the degree of variation in the indicator data, effectively reflecting the importance of each indicator. We selected this method since ATI is a process of a system transitioning from disorder to order, and the information entropy determined by the entropy weight method can effectively measure the degree of order in the system. The weight of each indicator is also displayed in Table 2.
The process for calculating weights using the entropy weight method is as follows. We will compute the weight of agricultural industry indicators ( w j ) in this explanation. The weights for the indicators of the tourism industry can be determined with the same method.
(1)
Determine the ratio of the j th indicator for the i th province using the formula p i j = X i j i = 1 k X i j , where k represents the total number of provinces.
(2)
Calculate the information entropy of the j th indicator: e j = 1 l n k i = 1 k p i j l n p i j .
(3)
Compute the degree of divergence of the j th indicator: d j = 1 e j .
(4)
Obtain the entropy weight of the j th indicator using the formula w j = d j j = 1 m d j , where m is the total number of indicators and j = 1 m d j = 1 .
Step 5: Calculating ATI.
After obtaining the comprehensive development indices for the agricultural and tourism industries, respectively, we can calculate the CCD to measure ATI. The CCD takes into account both the coupling degree and the overall development level of the agricultural and tourism industries. First, the coupling degree is calculated using Equation (1).
C = { ( A i × T i ) / [ ( A i + T i ) × ( A i + T i ) ] } 1 / 2
The coupling degree between the agricultural and tourism industries, denoted as C , is a value that falls within the range of 0 to 1. The larger the value of coupling degree, the stronger the interaction and mutual influence between the agricultural and tourism industries. Next, Equation (2) is used to calculate ATI.
A T I = C × T
A T I refers to the CCD between the agricultural and tourism industries, whereas C represents the coupling degree obtained using Equation (1). T is the comprehensive evaluation index of the agricultural and tourism industries, computed as T = a A i + b T i , where a and b represent the contribution coefficients of the agricultural and tourism industries, respectively, and a + b = 1 . In this study, we follow the view of Wang et al. [20] and set the values a = b = 0.5 . The CCD also ranges from 0 to 1, with a higher value indicating a better coordinated development between the agricultural and tourism industries.

3.2. Empirical Models

3.2.1. Baseline Model

This study constructs the baseline model, represented by Equation (3), to examine the impact of ATI on AGTFP.
l n A G T F P i t = c + α l n A T I i t + β l n C o n t r o l i t + μ i + ε i t
where l n denotes the natural logarithm, C o n t r o l i t denotes a set of control variables that reflect the characteristics of regional AGTFP, c is the constant term, α and β are the coefficients to be estimated, μ i represents the individual fixed effect, and ε i t is the random error term.

3.2.2. Mediating Effect Model

In order to examine the mediating influence of the AISAI in the relationship between ATI and AGTFP, the three-step mediation test approach, also known as the causal steps approach, proposed by Baron and Kenny [45], was employed in this study.
The first step is to analyze the impact of ATI on AGTFP by using the fixed-effects panel data model described in Equation (3). If the coefficient of ATI is statistically significant, it implies that the first condition for the mediation effect is satisfied. The second step investigates the impact of ATI on the mediating variable AISAI. Additional information is presented in Equation (4). When the ATI coefficient is of statistical significance, it suggests the second mediation requirements has been achieved.
l n A I S A I i t = c + γ l n A T I i t + δ l n C o n t r o l i t + μ i + ε i t
Lastly, in the third step, Equation (5) displays the impact of both ATI and the AISAI on AGTFP.
l n A G T F P i t = c + ζ l n A T I i t + η l n A I S A I i t + κ l n C o n t r o l i t + μ i + ε i t
The fixed-effects panel data model includes both the independent variable (ATI) and the mediating variable (AISAI) as explanatory variables. If the coefficient of the mediating variable is significant and the absolute value of the ATI coefficient is smaller than that in the first step, it provides evidence of the mediating effect of the AISAI. If the coefficient of ATI in the third step becomes insignificant with the addition of the mediator variable, while the coefficient of the mediator variable remains statistically significant, it indicates that there is a full mediation effect. This indicates that the impact of ATI on AGTFP is completely transmitted through the mediator variable, indicating that the AISAI fully explains the relationship between the independent and dependent variables.
In addition, if the coefficients on ATI and the mediating variable in the third step remain statistically significant, and the value of the ATI coefficient is smaller than that in the first step, it suggests that there is a partial mediation effect. In this situation, it indicates that the AISAI provides a partial explanation for the relationship between ATI and AGTFP. ATI has both direct and indirect impact on AGTFP, with the indirect effect being influenced by the AISAI.

3.2.3. Threshold Effect Model

This study employed a threshold regression model, drawing on the works of Hansen [46] and Wang and Liu [47] to investigate the impact of critical levels of ATI and HCL on the ATI-AGTFP relationship. The two threshold variables, which account for both ATI on its own impact and the potential threshold role of human capital on the ATI-AGTFP relationship, provide a more comprehensive understanding of the complex processes affected. Equation (6) shows the fixed-effects panel threshold regression model with a single-threshold.
l n A G T F P i t = c + θ 1 l n A T I i t × I q i t < φ + θ 2 l n A T I i t × I q i t φ + λ l n C o n t r o l i t + μ i + ε i t
where φ is a threshold parameter of threshold variable q , which is estimated to examine whether the coefficients on ATI ( θ 1 and θ 2 ) exhibit significant changes in different regimes below and above the threshold parameter φ , and I ( · ) is an indicator function that takes the value of 1 when condition in parentheses is satisfied and 0 otherwise. Similarly, Equation (7) represents a double-threshold model with fixed effects.
l n A G T F P i t = c + θ 1 l n A T I i t × I q i t < φ 1 + θ 2 l n A T I i t × I φ 1 q i t < φ 2 + θ 3 l n A T I i t × I q i t φ 2 + λ l n C o n t r o l i t + μ i + ε i t                                                                                                                                                                                                                                                                                                
In this approach, φ 1 and φ 2 are the two threshold parameters that divide the sample into three regimes based on the level of threshold variable q . The coefficients of ATI ( θ 1 , θ 2 , and θ 3 ) capture the impact of ATI on AGTFP in the low, medium, and high intervals, respectively. The other variables are consistent with the baseline mode.

3.3. Variable Selection

The variables selected to examine the impact of ATI on AGTFP in our research are based on the previous literature (e.g., [16,20]). The chosen variables include the detailed characteristics of agricultural productivity and its determinants, and these variables are displayed in Table 3.
The explained variable, AGTFP, is measured using the SBM-GML index, as detailed in the preceding section. The core explanatory variable is ATI, which is obtained through the CCD model, and indicates the level of integration between agriculture and tourism sectors. This measure enables us to estimate the combined effects of these two industries and analyze how they affect AGTFP. The specific calculation process is described in Table 2.
For the purpose of investigating the potential mediating effects, we use the AISAI as a mediating variable. The AISAI can be calculated as follows: 1 minus the ratio of agricultural out value to the gross output value of agriculture, forestry, animal husbandry, and fishery. This index was used to analyze the impact of agricultural changes on the relationship between ATI and AGTFP, as well as to determine if it plays a mediating role.
In the analysis of the threshold effect, we use HCL and ATI as threshold variables to investigate the potential nonlinearities or critical values in the ATI-AGTFP relationship. The two threshold variables are used to examine whether the productivity gains from ATI are subject to certain threshold levels of either sectoral integration or human capital endowment. By adopting this methodology, we aim to identify the conditions under which ATI most effectively enhances AGTFP. HCL is calculated by dividing the number of students enrolled in higher education institutions by the total population, and represents the regional knowledge and skill level. Given that the efficacy of ATI may depend on the availability of skilled human resources, HCL was selected as the threshold variable.
Lastly, we take several control variables to consider other factors that may potentially impact agricultural productivity and environmental sustainability. Disaster severity (DS) is calculated as the proportion of disaster-affected area in the total sown area of crops. This measurement captures the degree to which natural disasters have impacted agricultural output. The informatization level (IL) is determined by calculating the ratio of the total volume of post and telecommunications businesses to the regional gross production value, which represents the rate at which information technology contributes to agricultural development. Trade dependence is computed as the ratio of the total import and export value of agricultural products to their gross production value, taking into account how international trade influences agricultural productivity.
The data employed in this study represent a panel dataset covering 30 Chinese provinces from 2011 to 2021. The data are collected from the China Statistical Yearbook and the Ministry of Agriculture and Rural Affairs. Linear interpolation is used to fill a small number of missing values.
Figure 1 displays the basic statistical data of ATI in China from 2011 to 2021. The average ATI level in 30 provinces increased from 0.209 in 2011 to 0.358 in 2021, with an average annual growth rate of 28.9%. The detailed ATI values for each province from 2011 to 2021 are provided in Table A1 in Appendix A.
Figure 2 shows the spatial distribution of average AGTFP and ATI across Chinese provinces for the period 2011–2021. In order to express the geographical differences, we classified AGTFP into five distinct levels, with each level denoted by a different color on the map. The numerical values given inside each provincial boundary indicate the mean ATI index, which provides a direct comparison of ATI levels across different regions.
The spatial distribution of AGTFP reveals significant differences among Chinese provinces. It is worth noting that provinces like Shandong, Henan, Guizhou, Ningxia, and Jiangxi exhibit higher AGTFP levels (AGTFP > 1.44), which suggests that they have superior agricultural efficiency and environmental performance. These provinces generally have favorable natural conditions, such as a suitable climate, fertile soil, and abundant water resources, which contribute to efficient agricultural production. Additionally, these provinces have implemented advanced agricultural technologies and promoted environmentally friendly farming practices, thereby increasing their agricultural productivity and sustainability.
On the other hand, provinces such as Shanghai, Inner Mongolia, Xinjiang, and Jiangsu have lower AGTFP values (AGTFP 1.31). These regions meet several limitations, including harsh climatic conditions, limited arable land, and water scarcity, especially in arid areas like Xinjiang and Inner Mongolia. Moreover, these areas face difficulties like underdeveloped agricultural infrastructure, limited technical implementation, and conflicting economic objectives. Shanghai’s emphasis on tertiary industries could potentially redirect resources and attention away from agricultural growth.
China’s various geographical characteristics and different levels of regional economic development provide an important dataset for investigating the impact of ATI on AGTFP. In recent years, China has been actively promoting rural revitalization through industrial integration. This creates a unique opportunity to research the effects of ATI on AGTFP in a rapidly developing economy. Therefore, selecting China as the research subject is appropriate and representative for this study.

4. Empirical Results

4.1. Descriptive Statistics

The descriptive statistics of the variables used in this study are presented in Table 4. Clear explanations of the four major findings are as follows:
(1)
AGTFP has a mean value of 1.3741, showing a positive trend in agricultural productivity. The maximum value of 3.1306 suggests that some regions have achieved substantial improvements in green agricultural productivity, while the minimum value of 0.6494 points to areas with significant room for improvement.
(2)
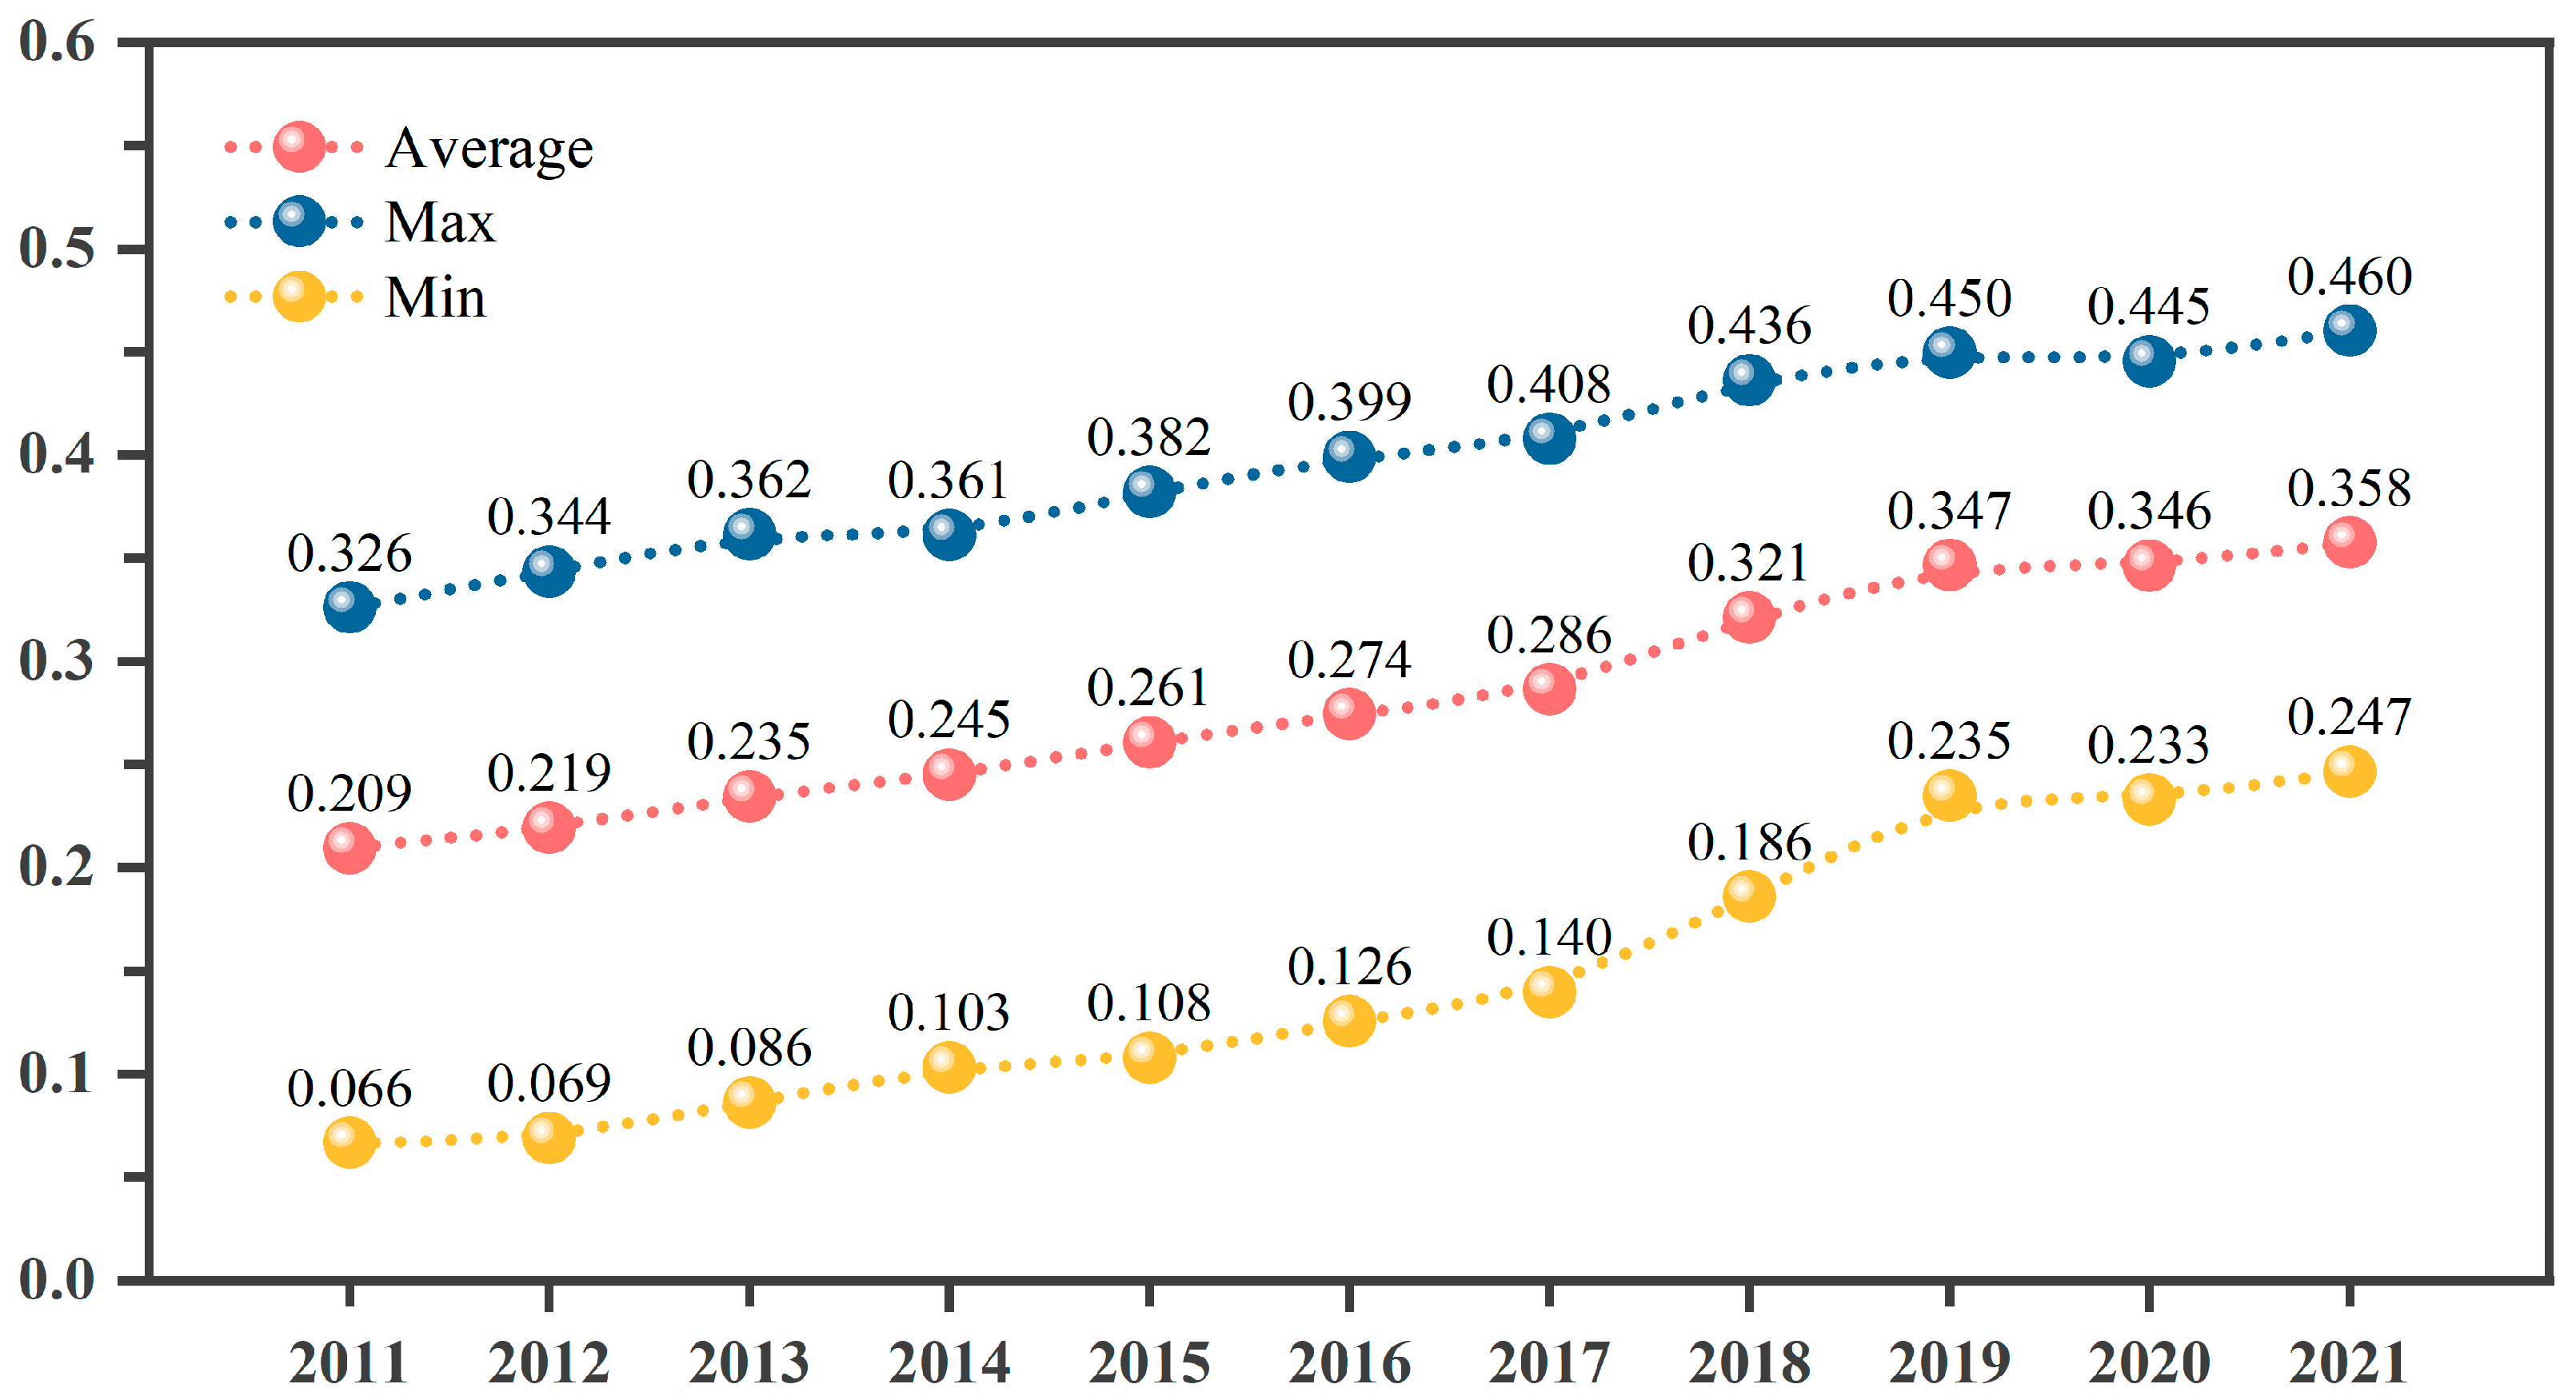
The ATI levels show significant differences. Some regions achieved a higher degree of integration (maximum 0.4601), and others are still in the early stages (minimum 0.0665). The differences in ATI levels provides an excellent opportunity to examine its impact on AGTFP.
(3)
The mean value of the AISAI (0.4776) indicates that approximately 50% of the agricultural output is derived from non-traditional agricultural activities, indicating a significant level of diversification within the sector. The range of the AISAI values (0.0940 to 0.6489) implies that different regions are in various stages of agricultural restructuring, which may play a crucial role in the ATI-AGTFP relationship.
(4)
The control variables display some remarkable characteristics. The relatively low mean value of 0.0213 for HCL suggests that further investment in higher education is necessary to support agricultural development. The TD in the agriculture sector shows a very low level of reliance on international trade, with a mean value of 0.0257. However, there is substantial variation observed across different regions. These factors may influence the ATI-AGTFP relationship.

4.2. Baseline Model Regression Results

Before regression, we conducted multicollinearity tests. The variance inflation factor (VIF) values of all explanatory variables are less than 2, which is substantially below the generally accepted threshold of 10. This indicates that there is no significant multicollinearity problem [47]. Detailed results of the multicollinearity tests are shown in Table 5.
The baseline regression results in Table 6 illustrate the impact of ATI on AGTFP growth. The analysis employs a fixed-effects model to control for individual heterogeneity and to ensure the robustness of the estimates [48]. Based on the regression results in Table 6, we can draw the following three key findings.
Firstly, in all five models, the core explanatory variable ATI has a significant positive impact on AGTFP. The reported result remains robust after controlling for several relevant variables, with the estimated coefficient gradually decreasing from 0.9232 to 0.5009, but always remaining statistically significant. This finding provides empirical evidence for promoting ATI as a way to enhance AGTFP.
Secondly, the transformed coefficients of HCL, IL, and TD exhibit significant positive effects on AGTFP. In particular, the IL has the greatest impact, with a transformed coefficient of about 0.9657 ( l n I L = 0.0349 ). This implies that in the digital era, enhancing the IL could be an important strategy for improving AGTFP. Meanwhile, investing in human capital and promoting agricultural trade also led to the positive effect.
Finally, it is well known that the occurrence of natural disasters significantly hinders agricultural productivity growth, which is also consistent with the findings of Wang et al. [16]. Although the effect is relatively weak, with the coefficients ranging from −0.0225 to −0.0439, the impact of DS cannot be ignored. By gradually adding control variables, the model’s explanatory power rose from 0.7599 to 0.8619, indicating that the parameters examined in this study were highly effective in capturing the majority of the variation in AGTFP.

4.3. Mediating Effect Analysis

In order to further investigate the potential mediating effect of the AISAI on the relationship between ATI and AGTFP growth, we constructed a mediation effect model using the AISAI as the mediating variable. The results of mediation effect are shown in Table 7.
The baseline regression results indicate a significant total effect of 0.5009. When introducing the AISAI as a mediating variable, the direct effect of ATI on AGTFP growth remains statistically significant but decreases in magnitude (0.1066), whereas the AISAI shows a significant positive impact on AGTFP growth (0.0713). These findings suggest that the AISAI partially mediates the ATI-AGTFP relationship, accounting for 2.24% of the total effect. The partial mediation effect can be attributed to the fact that ATI not only directly influences AGTFP growth but also indirectly affects it through its impact on the AISAI. The relatively low proportion of the mediation effect implies that there might be other factors, such as technological innovation, human capital, and institutional support [49,50,51], in the nonlinear ATI-AGTFP relationship.
The mediating mechanism of the AISAI in the ATI-AGTFP relationship can be explained by the following three paths: First, ATI can promote the optimization and upgrading of the agricultural industrial structure by introducing new technologies, management methods, and market opportunities, thereby increasing the efficiency and productivity of the agricultural sector [22]. Second, ATI encourages the development of high value-added agricultural products and services, contributing to the adjustment of the agricultural industrial structure and the improvement of AGTFP [31]. Third, the ATI facilitates the flow of resources, knowledge, and capital between the two sectors, promotes innovation and entrepreneurship in the agricultural sector, and drives the adjustment of the industrial structure [48].
Although the mediation effect analysis provides valuable insights into the mechanisms underlying the ATI-AGTFP relationship, it is important to keep in mind that the nonlinear ATI-AGTFP relationship may also be affected by other factors and conditions, as shown by the small proportion of mediating effect. Therefore, it is necessary to analyze the potential threshold effects to gain a deeper understanding of the complex dynamics among these factors.

4.4. Threshold Effect Analysis

To further analyze the nonlinear relationships and potential boundary conditions of the influence of ATI on AGTFP growth, we constructed threshold model to test and adopt ATI and HCL as threshold variables, respectively. To determine the specific form of the threshold model, we conducted estimations for single-threshold, double-threshold, and triple-threshold models, respectively. Sampling was performed 500 times using the Bootstrap method to simulate the distribution and critical values of the test statistics. The estimation results of threshold effect are shown in Table 8.
The results shown in Table 8 indicate that a double-threshold model is optimal for ATI, whereas for HCL, a single-threshold model is suitable. The presence of threshold effects suggests that the ATI-AGTFP relationship may have two or one structural break points, respectively, due to the differences in the levels of ATI and HCL. The point estimates and confidence intervals for the threshold parameters are presented in Table 9.
Table 10 presents the estimation results of fixed-effects threshold regressions. In models (8) and (9), the threshold variables are ATI and HCL, respectively. The ATI threshold model (8) exhibits a double-threshold effect. The coefficients for ATI are positive and statistically significant in all three regimes. However, as the level of ATI increases, the impact on AGTFP decreases, indicating a nonlinear relationship. Specifically, the coefficient of ATI is 1.6283 ( l n A T I = 0.4875 ) at A T I < 0.3113 ( l n A T I = 1.1673 ), implying that a 1-unit rise in ATI will result in a 0.6238 unit increase in AGTFP. At 0.3113 A T I < 0.4240 , the coefficients decrease to 1.5191 ( l n A T I = 0.4181 ). At A T I 0.4240 ( l n A T I = 0.8580 ), it further drops to 1.2702 ( l n A T I = 0.2392 ). The declining trend in the coefficient indicates that the influence of ATI on AGTFP is characterized by a distinct decrease in its marginal effect. The early integration of industry introduced new ways of resource allocation and technological innovation, which has the most pronounced impact on agricultural production efficiency. As the level of integration increases, although ATI still has a positive impact on AGTFP, the growth rate gradually decreases. This implies that once ATI has reached a specific threshold, further efforts to boost industrial integration will not yield benefits that match the associated expenditures.
In model (9), the coefficient of ATI is 2.1777 ( l n A T I = 0.7783 ), when H C L < 0.0204 ( l n H C L = 3.8925 ), indicating that an increase of 1 unit in ATI will increase AGTFP by 2.1777 units in this interval. When the H C L 0.0204 , the coefficient of ATI decreases to 1.9723 ( l n A T I = 0.6792 ). The observed decrease in the coefficient with an increasing threshold reveals the following three issues. First, the impact of ATI on AGTFP is greater in lower HCL regions. It suggests that there is greater room for improvement in low-HCL regions. In contract, high-HLC cities have already achieved higher levels of efficiency, so the additional benefits from ATI are relatively small. Second, the low-HCL areas are more prone to gaining new knowledge and skills from ATI. Practitioners in these areas are inclined to seek expertise in emerging technologies and advanced management methods to improve efficiency in the process of industrial integration. On the contrary, individuals in places with high-HCL regions may have previously developed more advanced skills, resulting in relatively lower levels of new knowledge from ATI. Third, in the process of ATI, low-HCL regions exhibit greater innovation and adaptability. These regions have a greater willingness to adapt existing processes and explore new business models to achieve greater efficiency gains when presented with new opportunities. High-HCL regions, on the other hand, have already established a more advanced and mature business mode, and so have relatively lower requirement for modification.

5. Discussion

Building upon the empirical results presented in Section 4, this section provides a more in-depth analysis and explanation of our findings. We will discuss the empirical results from descriptive statistics, fixed-effects panel data regression, mediation effect analysis, and threshold effect models. We also take into account the applicability of our findings to other countries.
The descriptive statistics results provide a research basis for an in-depth understanding of the impact of ATI and other related factors on AGTFP. (1) The AGTFP values (0.6494–3.1306) show that there is a regional difference in AGTFP. Regions with higher AGTFP values may benefit from advanced agricultural technologies, efficient resource management, and policy support. This is consistent with the findings of Chen et al. [52], which point out technological advancements as the main driver of increased agricultural productivity. These advancements may involve the adoption of precision farming techniques, sustainable water management systems, and environmentally friendly pest control methods to increase yields while minimizing environmental impacts. In contrast, areas with lower AGTFP values might face problems that include limited access to modern agricultural technologies, inefficient resource use, or environmental degradation. To address these issues, policymakers should focus on technology transfer programs, sustainable resource management training, and targeted environmental policies, as suggested by Adetutu and Ajayi [41].
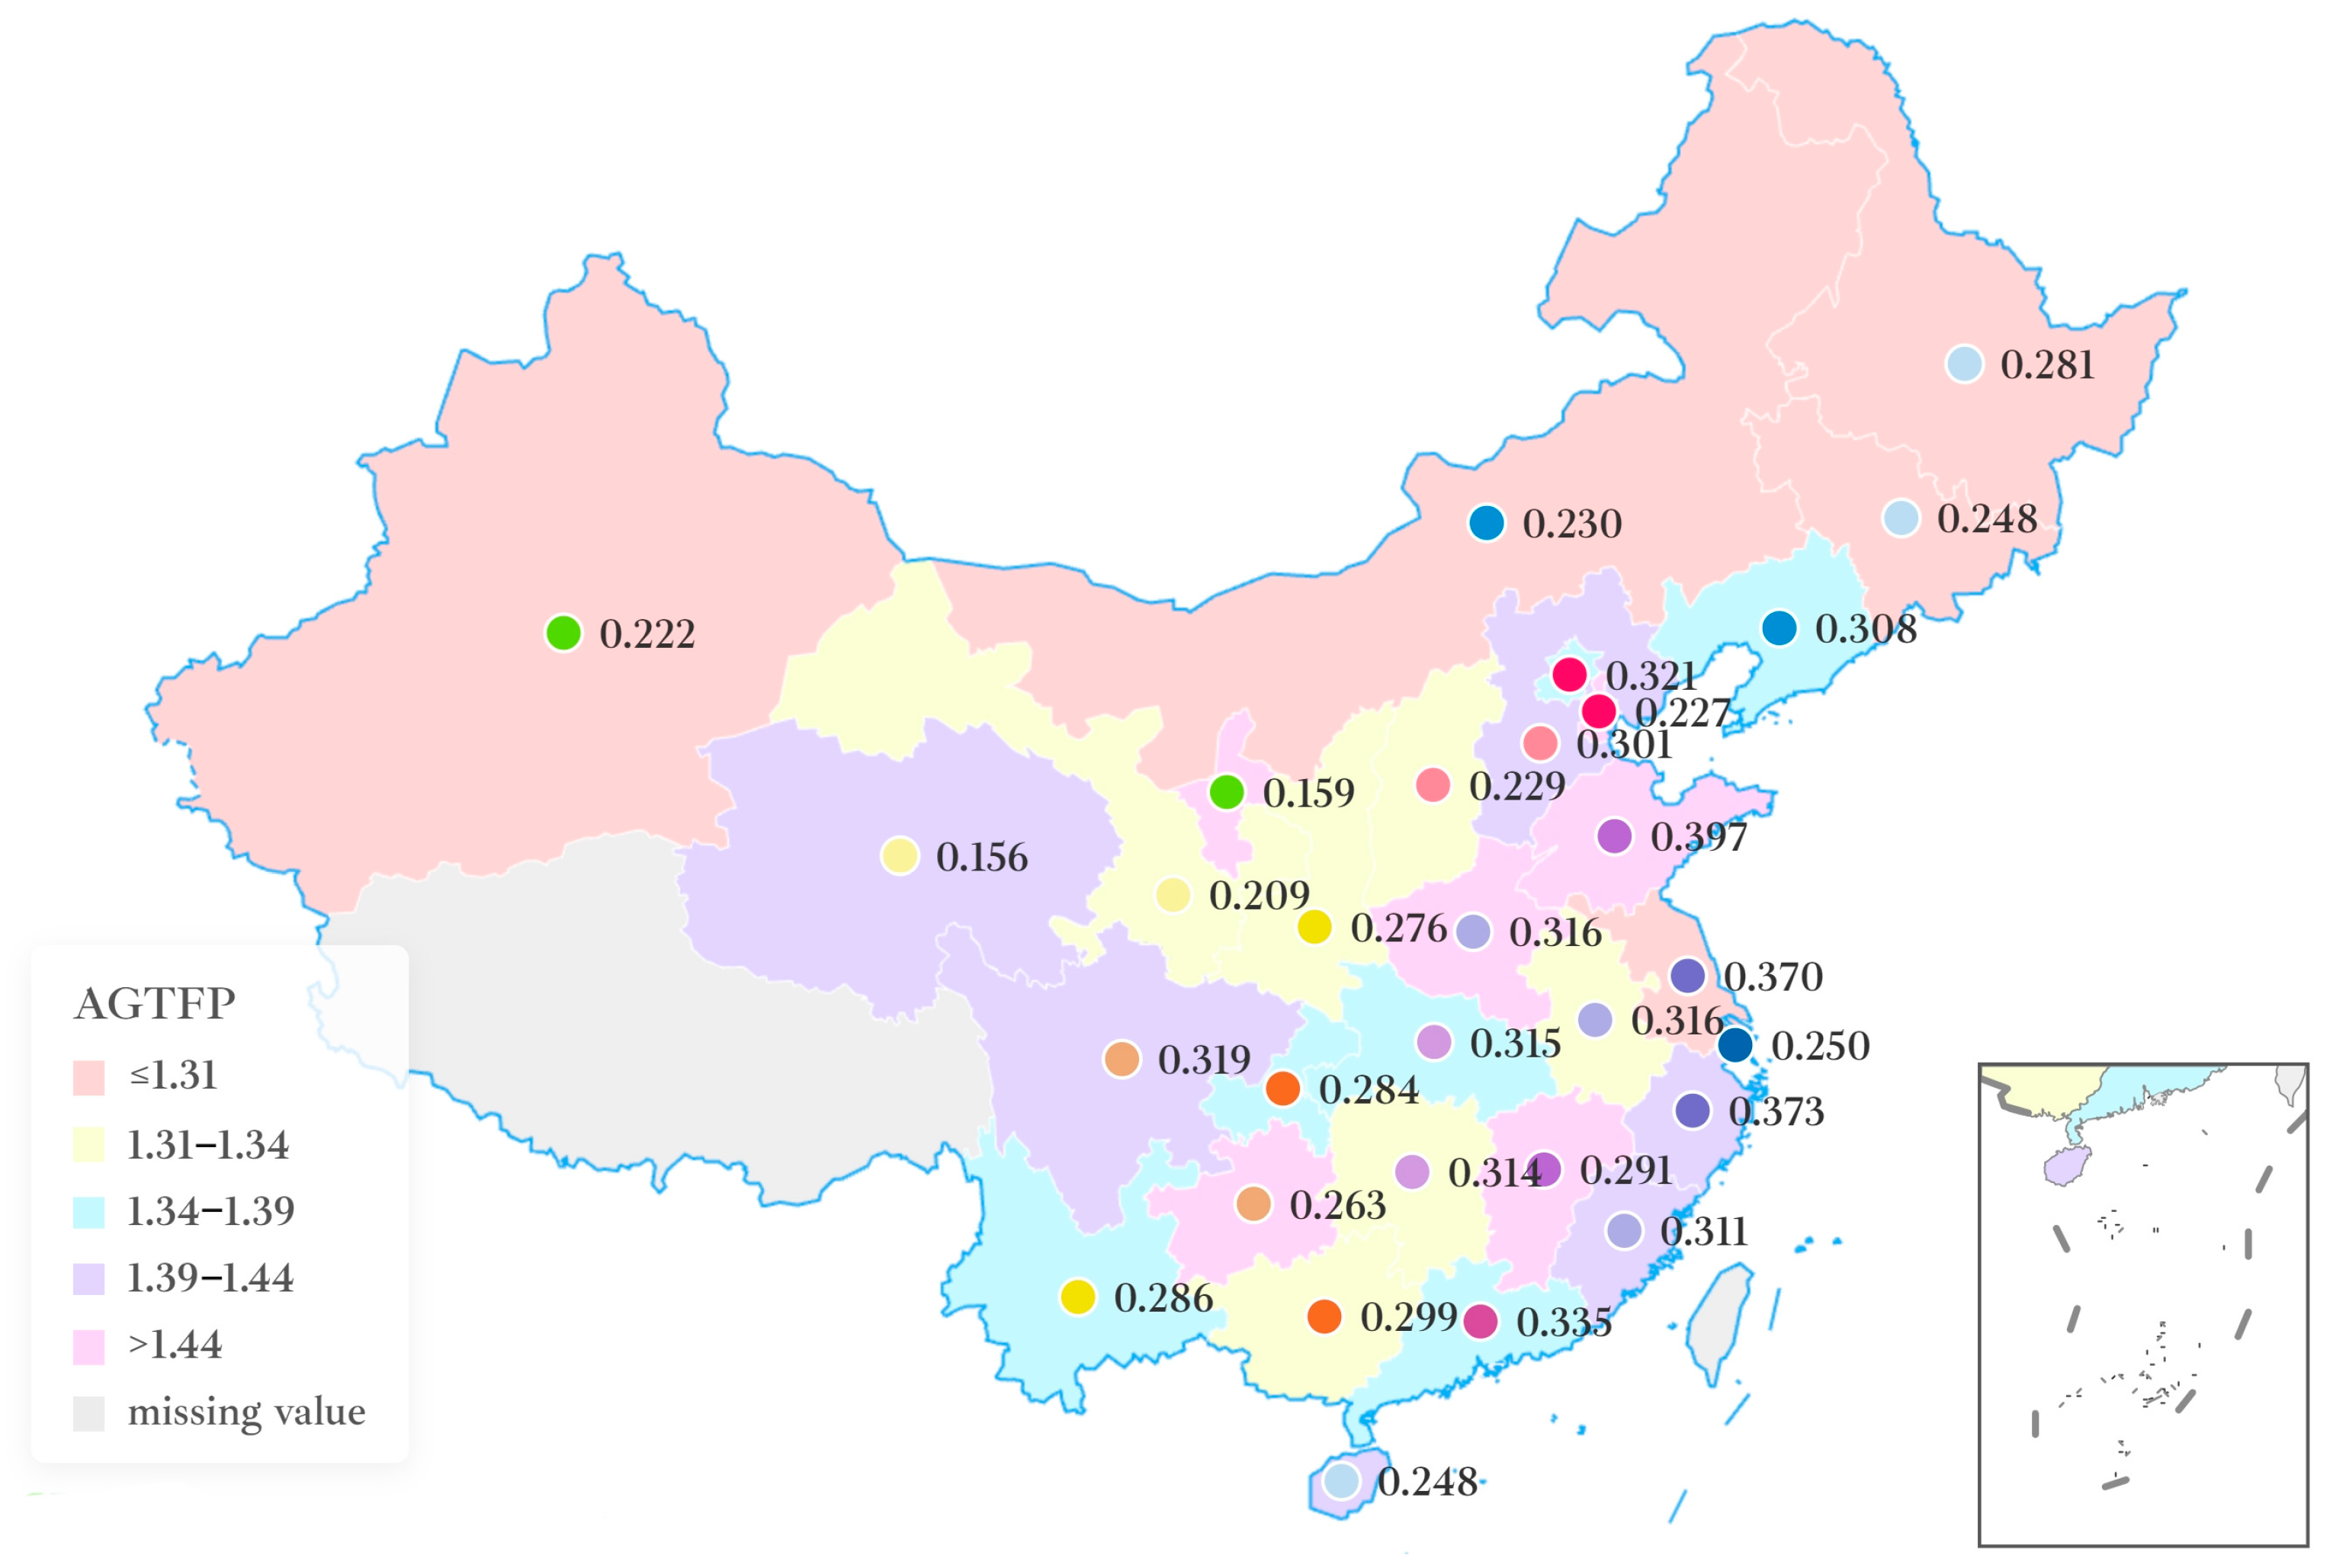
(2) The different levels of ATI provide a valuable opportunity to examine the impact of ATI on AGTFP [44]. Regions with high levels of ATI have likely succeeded in leveraging their natural and cultural resources to create attractive agritourism products, which has led to increased agricultural productivity through diversification and value addition. This finding aligns with Barbieri and Mshenga’s [18] research, which identified a positive relationship between agritourism and sustainable agricultural practices. To promote ATI in less developed regions, policymakers should prioritize infrastructure development, marketing support, and capacity building initiatives that enable farmers to effectively engage in tourism activities.
(3) The AISAI values ranged between 0.0940 and 0.6489, with an average value of 0.4776. It indicates a change in the industry’s structure towards non-traditional agricultural operations. According to Flanigan et al. [19], agritourism has the potential to facilitate the reorganization of the agricultural industry, and this study confirms their viewpoint. Firstly, a higher AISAI value indicates a more diversified agricultural sector, which leads to an increased ability to withstand economic shocks and changes in the market [53]. This diversification allows farmers to spread risk across multiple income streams, which may result in more stable and sustainable agricultural productivity growth. Secondly, regions with higher AISAI values are likely to have developed complementary skills and infrastructure that can support both agricultural and tourism activities. The collaboration between different elements can lead to more efficient resource allocation and improved overall productivity, as proposed by Tew and Barbieri [5]. Thirdly, a diversified agricultural structure may attract a wider range of tourists by providing a multitude of different experiences and products, thereby increasing the possibilities for tourism integration and its associated benefits [54]. Lastly, the shift towards non-traditional agricultural activities often includes higher value-added products and services, which can contribute to increased agricultural productivity and profitability when integrated with tourism [11].
The empirical findings of fixed-effects regression showed a significant positive impact of ATI on AGTFP, consistently with Wang et al. [16,20]. This relationship can be explained by two main processes. Firstly, ATI encourages farmers to diversify their activities beyond traditional farming. This diversification helps farmers manage risks better and use their resources more efficiently. As Barbieri and Mahoney [55] found, integrating tourism into farming operations can make farm incomes more stable and less vulnerable to market changes. Due to increased financial stability, farmers are more likely to allocate resources towards sustainable and productive farming methods, which can boost overall agricultural productivity. Secondly, ATI encourages agricultural innovation. ATI regularly promotes the development of new products and services, and the adoption of innovative farming practices to meet tourist demands. This aligns with Tew and Barbieri’s [5] observation that agritourism operators tend to exhibit greater innovation in their farming practices. Thus, ATI contributes to the overall improvement of AGTFP.
The empirical results emphasize the critical role of HCL, TD, and IL in improving AGTFP. Consistently with Huffman’s [37] human capital theory in agriculture, higher levels of education enable farmers to better adopt new technologies and manage a wide range of activities, such as agritourism. Gao and Wu [22] emphasize more directly the importance of a well-educated workforce, which is required to achieve sustainable agricultural development. In this study, the relatively low HCL mean (0.0213) suggests that there are human capital constraints in the agricultural sector, which may impede the adoption of advanced technologies to improve AGTFP. To address the human capital constraints in the agricultural sector, Reimers and Klasen [56] suggest investing in targeted educational interventions, while promoting information transfer through learning networks can help disseminate innovative technology and best practices [57]. Moreover, policies that incentivize skilled labor to remain or return to rural areas can help reduce the “brain drain” phenomenon often observed in agricultural regions. Agricultural trade has a positive impact on AGTFP. One possible explanation for this is that agricultural trade facilitates knowledge spillovers and technology transfer across borders, as Grossman and Helpman [58] theorized. On the other hand, exposure to foreign markets encourages farmers to adopt more efficient and sustainable production techniques in order to comply with global standards. This study also points out the importance of information technology in boosting AGTFP, which supports Deichmann et al.’s [59] findings about the advantages of digital technologies in agriculture, such as improved information availability and connectivity to markets.
The analysis of mediating effects showed that the AISAI exists as a partial mediator between ATI and AGTFP. About 2.24% of the influence of ATI on AGTFP is mediated through the AISAI. This finding indicates that ATI not only directly impacts AGTFP but also indirectly affects it by promoting structural changes in the agricultural sector. The mediating effect can be explained by the impact of changes in ATI on agricultural practices and resource allocation. Barbieri and Mshenga [18] argue that agritourism encourages farmers to diversify their operations and adopt more efficient production techniques, which leads to structural changes in the agricultural sector and a shift in resources towards higher value-added activities and more sustainable practices. In addition, Yang et al. [60] found that the integration of tourism into agricultural areas promotes innovation and entrepreneurship, which can drive structural changes in the industry. To successfully promote ATI, it is crucial to focus on the restructuring of the industry so as to achieve long-term improvements in AGTFP efficiency. Policymakers should pay attention to how to promote upgrading through ATI, so as to maximize the positive impact of ATI on AGTFP.
This study further explores the complexity and nonlinear characteristics of the ATI-AGTFP relationship. Applying a threshold regression model, we found a double-threshold effect in the impact of ATI on AGTFP. This finding indicates that the relationship is not simply “the more, the better.” Instead, there are two structural break points, which indicates that there is an optimal level of integration beyond which marginal benefits begin to diminish. Initially, as proposed by Tew and Barbieri [5], ATI brings significant benefits through diversification, resource optimization, and knowledge spillovers. However, as integration deepens, farms may face challenges such as increased competition for resources between agricultural and tourism activities, potential environmental pressures, and the need for specialized management skills, as mentioned by Phillip et al. [54]. These factors contribute to the observed nonlinear relationship and the presence of two structural break points.
The findings also indicate that HCL has a significant single-threshold effect on the ATI-AGTFP relationship. Specifically, the effect of ATI on AGTFP is stronger in regions with lower HCL. According to Becker [61], regions with lower HCL usually have more opportunity for improving knowledge and skills. The introduction of ATI in these areas led to a rapid learning of new skills and the adoption of innovative methods by workers, which resulted in increased efficiency in AGTFP. This rapid progress in less developed regions is consistent with the concept of “catching up”, as described by Abramovitz [62] in his study of economic growth patterns, in which he argued that countries with lower initial economic conditions often achieve faster development by adopting the proven technologies and practices from more developed economies.
The mediating and threshold effects observed in the relationship between ATI and AGTFP in China show both similarities and differences when compared to findings from other countries, while the positive impact of ATI on agricultural productivity is consistent with studies from different conditions (e.g., [5,18]). However, the specific processes and degrees of these impacts in China are determined by its unique development route.
China’s rapid economic transformation and the government’s strategic focus on rural revitalization provide a distinctive backdrop for the ATI-AGTFP relationship. The partial mediating role of the AISAI in the ATI-AGTFP relationship reflects China’s ongoing agricultural modernization. Nevertheless, the relatively small mediation proportion (2.24%) suggests that the structural changes caused by ATI in China might be less pronounced in China compared to some developed countries where agritourism has a longer history [54].
The double-threshold effect of ATI on AGTFP is particularly noteworthy in China. It suggests that while integration brings initial benefits, there is an optimal level beyond which returns diminish. This finding is important for policymakers in China and in other developing countries with similar agricultural modernization goals. It suggests that a balanced approach to ATI, rather than unrestricted integration, may be more beneficial for long-term agricultural productivity.
The single-threshold effect of HCL on the ATI-AGTFP relationship in China coincides with the “catching up” theory proposed by Abramovitz [62]. However, the magnitude of this effect might be more pronounced in China due to the vast regional disparities in development levels. This finding underscores the importance of targeted human capital investments in less developed regions to maximize the benefits of ATI.

6. Conclusions and Policy Recommendation

6.1. Conclusions

This study investigates the impact of ATI on AGTFP in China. By analyzing a panel dataset covering 30 Chinese provinces from 2011 to 2021, we employ mediation and threshold effect models to examine the mediating role of the AISAI and threshold role of ATI and HCL in the nonlinear relationship between ATI and AGTFP.
The findings address the initial research objectives and provide significant insight on the complex relationship between ATI and AGTFP in China. Firstly, the observed positive impact of ATI on AGTFP highlights its potential as a strategy to improve agricultural efficiency while promoting sustainability. Secondly, the AISAI partially mediates the ATI-AGTFP relationship. ATI influences AGTFP both directly and indirectly through changes in the AISAI, highlighting the importance of structural adjustments in the agricultural sector as a mechanism through which ATI influences AGTFP efficiency. Thirdly, the threshold effects observed in both ATI and HCL uncover the nonlinear character of the ATI-AGTFP relationship. This suggests that the effectiveness of ATI in boosting AGTFP is not uniform, but varies depending on the stage of integration and the level of human capital development in different regions. These findings provide an in-depth understanding of how ATI can be effectively implemented to improve agricultural performance and sustainability across diverse contexts in China. They additionally set the basis for further policy recommendations.

6.2. Policy Recommendations

Based on the empirical findings and discussion, we propose the following three policy recommendations to promote sustainable agricultural development. Firstly, the positive impact of ATI on AGTFP suggests that promoting this integration can increase farm incomes and improve environmental sustainability at the same time. However, the nonlinear relationship indicates that a one-size-fits-all approach may not be the best one. It is recommended for policymakers to implement a staged approach for promoting ATI, creating strategies based on the specific level of integration and human capital in each region. In areas with low ATI, policies should focus on building basic infrastructure and raising awareness about the benefits of integration. As integration progresses, the primary attention should shift towards optimizing the integration process and increasing effectiveness through targeted training programs.
Secondly, given the mediational role of the AISAI in the process of ATI influencing AGTFP, policymakers should also pay attention to promoting structural adjustments in the agriculture industry. This includes pushing for the diversification of agricultural operations, encouraging the development of high-value agricultural products that are complementary to tourism, and supporting the adoption of innovative farming practices that correspond with tourism needs. Restructuring may improve the synergistic relationship between agriculture and tourism, achieving the maximum benefits of integration.
Finally, we recommended targeted investments in human capital development, particularly in less developed regions. This can be achieved through the implementation of vocational training programs focusing on agritourism skills, such as hotel management, sustainable agricultural techniques, and cultural heritage preservation. Adopting these measures could improve local capabilities, boost service quality, and promote innovation in the rural tourism product. Moreover, it is possible to establish partnerships between educational institutions and local agritourism businesses. It can facilitate knowledge transfer and create opportunities for practical learning experiences. The above recommendations can lead to more diversified rural economies, increased income stability for farmers, and the preservation of rural landscapes and cultural traditions.
While this study provides insights for understanding the relationship between ATI and AGTFP in China, there are still several limitations. Firstly, our analysis is mainly based on provincial-level data. This approach may overlook variations in ATI implementation and AGTFP outcomes within provinces. Further research should consider using city- or county-level data to capture more localized characteristics. Secondly, although our study covers a duration of 11 years, this timeframe is not sufficient to fully capture the long-term impacts of ATI on AGTFP. Given that China has not only just begun to emphasize rural revitalization in recent years, a more extended time series would be necessary to have a deeper understanding of the persistence of these effects. Thirdly, since we have identified mediating and threshold effects, it is important to note that the rural economy is quite complex. This suggests that there may be other existing mediators or nonlinear relationships that our model has not captured. Further studies incorporating factors influencing rural economic development may provide a more comprehensive understanding of the ATI-AGTFP relationship within the context of rural development in China. These limitations not only point out the constraints of this study, but also provide guidelines for future directions. By addressing these issues, we can further deepen our understanding of the ATI-AGTFP relationship and provide more robust support for agricultural policymaking in China and other developing countries.

Author Contributions

Conceptualization, B.Y. and J.L.; methodology, Y.L. and M.W.; software, B.Y. and Y.L.; data curation, B.Y. and Y.L.; writing—original draft preparation, B.Y.; writing—review and editing, J.L. and M.W.; visualization, B.Y. and Y.L.; supervision, J.L.; project administration, B.Y. All authors have read and agreed to the published version of the manuscript.

Funding

This research was funded by Xihua University Talent Foundation (No. RX2200001974) and the Humanities and Social Science Foundation for the Ministry of Education of China under Grant [22YJC790129].

Institutional Review Board Statement

Not applicable.

Informed Consent Statement

Not applicable.

Data Availability Statement

The data presented in this study are available upon request from the corresponding author.

Acknowledgments

This work was assisted by the China–ASEAN High-Quality Development Research Center at the Shandong University of Finance and Economics, and also supported by the Office of Research Administration, Chiang Mai University.

Conflicts of Interest

The authors declare no conflicts of interest.

Appendix A

Table A1. Agriculture and tourism integration index in 30 Chinese provinces from 2011 to 2021.
IDProvince20112012201320142015201620172018201920202021
1Beijing0.23330.23670.26110.27390.29770.31790.32090.38700.41380.40140.3914
2Tianjin0.14460.15130.16440.16920.18710.20500.19490.29740.32000.31910.3466
3Hebei0.25450.25810.26290.26980.29000.30120.30860.33480.35400.34330.3542
4Shanxi0.15860.16850.18500.19610.20330.21370.22190.27720.31340.29730.2830
5Inner Mongolia0.17520.18520.19880.20450.21330.22380.23210.25990.27280.28070.2850
6Liaoning0.25440.26240.28100.29010.29550.30500.30670.34060.35380.34690.3482
7Jilin0.18470.19110.21740.22420.24240.24650.25700.28120.29750.28800.2952
8Heilongjiang0.22680.24330.24460.24800.27620.27760.29430.31350.31380.32620.3267
9Shanghai0.17690.18490.19720.20460.20490.21220.22210.31960.33470.34070.3550
10Jiangsu0.29330.31140.32930.33040.34930.36050.37690.39970.43880.42400.4601
11Zhejiang0.30160.31120.32460.34060.35050.36430.38240.40960.42590.43820.4507
12Anhui0.24350.25380.26630.26800.29490.31000.33560.36570.37870.37870.3831
13Fujian0.23180.24100.25730.27840.28890.30740.32340.35850.37830.37700.3825
14Jiangxi0.21700.22750.24290.25860.27680.28910.30560.32700.34310.35090.3673
15Shandong0.32610.34360.36160.36130.38210.39920.40780.43630.44960.44540.4485
16Henan0.24840.25840.26910.27950.29790.29980.31120.33940.41030.36200.3953
17Hebei0.25330.26680.28280.28400.30620.31550.32800.33490.35180.35850.3801
18Hunan0.24240.25490.26830.28050.30090.30850.31970.33910.36920.39360.3818
19Guangdong0.26310.28020.29310.30870.32500.33970.35180.37490.38860.38270.3811
20Guangxi0.21130.22230.23620.25790.26950.28800.30740.34750.37350.38250.3953
21Hainan0.18750.19200.21300.22840.24460.25040.25510.26420.27020.29960.3228
22Chongqing0.19360.20960.22670.23600.26100.27340.29810.32050.36310.36230.3839
23Sichuan0.24720.26170.27710.28120.30220.31380.32860.35800.38520.37620.3787
24Guizhou0.15410.16830.19070.20990.22560.26670.29330.33240.35890.34280.3534
25Yunnan0.20960.21430.23030.24480.25900.28210.29410.32720.36760.34920.3711
26Shaanxi0.20050.21500.23650.24910.25710.27510.29290.30960.33630.32780.3402
27Gansu0.14220.15620.16410.17430.19390.20130.21230.24590.25160.27270.2904
28Qinghai0.08340.08220.09600.11840.12800.14850.15550.19500.23490.23300.2466
29Ningxia0.06650.06890.08620.10320.10780.12560.13960.18590.26250.29360.3066
30Xinjiang0.15380.15950.17220.18240.19130.20980.21350.25570.28370.29870.3200

References

  1. Zhang, L.; Pang, J.; Chen, X.; Liu, Z. Carbon emissions, energy consumption and economic growth: Evidence from the agricultural sector of China’s main grain-producing areas. Sci. Total Environ. 2019, 665, 1017–1025. [Google Scholar] [CrossRef] [PubMed]
  2. Wang, J.; Zhou, F.; Xie, A.; Shi, J. Impacts of the integral development of agriculture and tourism on agricultural eco-efficiency: A case study of two river basins in China. Environ. Dev. Sustain. 2024, 26, 1701–1730. [Google Scholar] [CrossRef]
  3. FAO. The State of Food and Agriculture 2021: Making Agrifood Systems More Resilient to Shocks and Stresses; Food and Agriculture Organization of the United Nations: Rome, Italy, 2021. [Google Scholar]
  4. Barbieri, C. Assessing the sustainability of agritourism in the US: A comparison between agritourism and other farm entrepreneurial ventures. J. Sustain. Tour. 2013, 21, 252–270. [Google Scholar] [CrossRef]
  5. Tew, C.; Barbieri, C. The perceived benefits of agritourism: The provider’s perspective. Tour. Manag. 2012, 33, 215–224. [Google Scholar] [CrossRef]
  6. World Tourism Organization. UNWTO International Tourism Highlights, 2020 ed.; World Tourism Organization (UNWTO): Geneva, Switzerland, 2020. [Google Scholar]
  7. Xinhua News Agency. Opinions of the Central Committee of the Communist Party of China and the State Council on Grasping the Key Work in the Field of “Agriculture, Rural Areas and Farmers” to Ensure the Achievement of a Moderately Prosperous Society in All Respects on Schedule. 2020. Available online: http://www.gov.cn/zhengce/2020-02/05/content_5474884.htm (accessed on 5 February 2020).
  8. Tan, M.; Qi, C. Research on the path and countermeasures of accelerating the poverty alleviation to a well-off society for the characteristic agricultural industry in the southwest mountainous area. Rev. Cercet. Interv. Soc. 2020, 69, 410–434. [Google Scholar] [CrossRef]
  9. Zhou, F.; Wen, C. Research on the level of agricultural green development, regional disparities, and dynamic distribution evolution in China from the perspective of sustainable development. Agriculture 2023, 13, 1441. [Google Scholar] [CrossRef]
  10. Wang, Z.; Zhu, J.; Liu, X.; Ge, D.; Liu, B. Research on spatial-temporal characteristics and affecting factors of agricultural green total factor productivity in Jiangxi Province. Sustainability 2023, 15, 9073. [Google Scholar] [CrossRef]
  11. Schilling, B.J.; Attavanich, W.; Jin, Y. Does agritourism enhance farm profitability? J. Agric. Resour. Econ. 2014, 39, 69–87. [Google Scholar]
  12. Khanal, A.R.; Mishra, A.K. Agritourism and off-farm work: Survival strategies for small farms. Agric. Econ. 2014, 45, 65–76. [Google Scholar] [CrossRef]
  13. Sheng, Y.; Tian, X.; Qiao, W.; Peng, C. Measuring agricultural total factor productivity in China: Pattern and drivers over the period of 1978–2016. Aust. J. Agric. Resour. Econ. 2020, 64, 82–103. [Google Scholar] [CrossRef]
  14. Chen, Y.; Miao, J.; Zhu, Z. Measuring green total factor productivity of China’s agricultural sector: A three-stage SBM-DEA model with non-point source pollution and CO2 emissions. J. Clean. Prod. 2021, 318, 128543. [Google Scholar] [CrossRef]
  15. Liu, J.; Liu, S.; Cui, J.; Kang, X.; Lin, Q.; Osathanunkul, R.; Dong, C. Total-Factor Energy Efficiency and Its Driving Factors in China’s Agricultural Sector: An Empirical Analysis of the Regional Differences. Agronomy 2023, 13, 2332. [Google Scholar] [CrossRef]
  16. Wang, J.; Zhou, F.; Chen, C.; Luo, Z. Does the integration of agriculture and tourism promote agriculture green total factor productivity?—Province-level evidence from China. Front. Environ. Sci. 2023, 11, 1164781. [Google Scholar] [CrossRef]
  17. Zhan, X.; Li, R.Y.M.; Liu, X.; He, F.; Wang, M.; Qin, Y.; Xia, J.; Liao, W. Fiscal decentralisation and green total factor productivity in China: SBM-GML and IV model approaches. Front. Environ. Sci. 2022, 10, 989194. [Google Scholar] [CrossRef]
  18. Barbieri, C.; Mshenga, P.M. The role of the firm and owner characteristics on the performance of agritourism farms. Sociol. Rural. 2008, 48, 166–183. [Google Scholar] [CrossRef]
  19. Flanigan, S.; Blackstock, K.; Hunter, C. Agritourism from the perspective of providers and visitors: A typology-based study. Tour. Manag. 2014, 40, 394–405. [Google Scholar]
  20. Wang, Y.; Zhao, Z.; Xu, M.; Tan, Z.; Han, J.; Zhang, L.; Chen, S. Agriculture-tourism integration’s impact on agricultural green productivity in China. Agriculture 2023, 13, 1941. [Google Scholar] [CrossRef]
  21. Mastronardi, L.; Giaccio, V.; Giannelli, A.; Scardera, A. Is Agritourism Eco-Friendly? A Comparison between Agritourisms and Other Farms in Italy Using Farm Accountancy Data Network Dataset; SpringerPlus: Berlin/Heidelberg, Germany, 2015; Volume 4, pp. 1–12. [Google Scholar]
  22. Gao, J.; Wu, B. Revitalizing traditional villages through rural tourism: A case study of Yuanjia Village, Shaanxi Province, China. Tour. Manag. 2017, 63, 223–233. [Google Scholar] [CrossRef]
  23. Fu, L.; Xu, Z.; Chen, Q.; Zhang, Q.; Zou, Z.; Li, L.; Yturralde, C.C.; Valencia, L.G. Research on the integrated development of agriculture and tourism in inner Mongolia. Environ. Dev. Sustain. 2023, 26, 14877–14892. [Google Scholar]
  24. Tang, Z. An integrated approach to evaluating the coupling coordination between tourism and the environment. Tour. Manag. 2015, 46, 11–19. [Google Scholar] [CrossRef]
  25. Qiu, P.; Zhou, Z.; Kim, D.J. A new path of sustainable development in traditional agricultural areas from the perspective of open innovation—A coupling and coordination study on the agricultural industry and the tourism industry. J. Open Innov. Technol. Mark. Complex. 2021, 7, 16. [Google Scholar] [CrossRef]
  26. Streifeneder, T.; Dax, T. Agritourism in Europe: Enabling factors and current developments of sustainable on-farm tourism in rural areas. In Global Opportunities and Challenges for Rural and Mountain Tourism; IGI Global: Hershey, PA, USA, 2020; pp. 40–58. [Google Scholar]
  27. Jiang, G. How does agro-tourism integration influence the rebound effect of China’s agricultural eco-efficiency? An economic development perspective. Front. Environ. Sci. 2022, 10, 921103. [Google Scholar] [CrossRef]
  28. Ammirato, S.; Felicetti, A.M.; Raso, C.; Pansera, B.A.; Violi, A. Agritourism and sustainability: What we can learn from a systematic literature review. Sustainability 2020, 12, 9575. [Google Scholar] [CrossRef]
  29. Barbieri, C. Agritourism research: A perspective article. Tour. Rev. 2020, 75, 149–152. [Google Scholar] [CrossRef]
  30. Chen, X.; Li, J. Research on Industrial Structure Transformation and Upgrading of Chinese Tourism Villages Based on Big Data Analysis. Mob. Inf. Syst. 2022, 2022, 1820098. [Google Scholar] [CrossRef]
  31. Wang, J.; Peng, L.; Chen, J.; Deng, X. Impact of rural industrial integration on farmer’s income: Evidence from agricultural countries in China. J. Asian Econ. 2024, 2024, 101761. [Google Scholar] [CrossRef]
  32. Vu, K.M. Structural change and economic growth: Empirical evidence and policy insights from Asian economies. Struct. Change Econ. Dyn. 2017, 41, 64–77. [Google Scholar] [CrossRef]
  33. Luo, Y.; Xiong, T.; Meng, D.; Gao, A.; Chen, Y. Does the Integrated Development of Agriculture and Tourism Promote Farmers’ Income Growth? Evidence from Southwestern China. Agriculture 2023, 13, 1817. [Google Scholar] [CrossRef]
  34. Li, X.; Liu, X. Foreign direct investment and economic growth: An increasingly endogenous relationship. World Dev. 2005, 33, 393–407. [Google Scholar] [CrossRef]
  35. Chuang, Y.C.; Hsu, P.F. FDI, trade, and spillover efficiency: Evidence from China’s manufacturing sector. Appl. Econ. 2004, 36, 1103–1115. [Google Scholar] [CrossRef]
  36. Marvel, M.R.; Davis, J.L.; Sproul, C.R. Human capital and entrepreneurship research: A critical review and future directions. Entrep. Theory Pract. 2016, 40, 599–626. [Google Scholar] [CrossRef]
  37. Huffman, W.E. Human capital: Education and agriculture. Handb. Agric. Econ. 2001, 1, 333–381. [Google Scholar]
  38. Psacharopoulos, G.; Patrinos, H.A. Returns to investment in education: A further update. Educ. Econ. 2004, 12, 111–134. [Google Scholar] [CrossRef]
  39. Krueger, A.B.; Lindahl, M. Education for growth: Why and for whom? J. Econ. Lit. 2001, 39, 1101–1136. [Google Scholar] [CrossRef]
  40. Fuglie, K.O. Is agricultural productivity slowing? Glob. Food Secur. 2018, 17, 73–83. [Google Scholar] [CrossRef]
  41. Adetutu, M.O.; Ajayi, V. The impact of domestic and foreign R&D on agricultural productivity in sub-Saharan Africa. World Dev. 2020, 125, 104690. [Google Scholar]
  42. Mulwa, R.; Emrouznejad, A.; Nuppenau, E.A. An overview of Total Factor Productivity estimations adjusted for pollutant outputs: An application to sugarcane farming. Int. J. Environ. Technol. Manag. 2012, 15, 1–15. [Google Scholar] [CrossRef]
  43. Zhang, X.; Li, R.; Zhang, J. Understanding the green total factor productivity of manufacturing industry in China: Analysis based on the super-SBM model with undesirable outputs. Sustainability 2022, 14, 9310. [Google Scholar] [CrossRef]
  44. Yang, Y.H.; He, J.X.; Zhang, Y.H.; Zhang, X.H.; Rui, Y. Spatial differentiation characteristics and influencing texture of the coupling coordinated development of agro-culture-tourism in China. Arid Land Geogr. 2022, 11, 1–12. [Google Scholar]
  45. Baron, R.M.; Kenny, D.A. The moderator-mediator variable distinction in social psychological research: Conceptual, strategic, and statistical considerations. J. Personal. Soc. Psychol. 1986, 51, 1173–1182. [Google Scholar] [CrossRef]
  46. Hansen, B.E. Threshold effects in non-dynamic panels: Estimation, testing, and inference. J. Econom. 1999, 93, 345–368. [Google Scholar] [CrossRef]
  47. Wang, M.; Liu, J. Deciphering the digital divide: The heterogeneous and nonlinear influence of digital economy on urban-rural income inequality in China. Appl. Econ. 2024, 1–21. [Google Scholar] [CrossRef]
  48. Wooldridge, J.M. Econometric Analysis of Cross Section and Panel Data, 2nd ed.; MIT Press: Cambridge, UK, 2010. [Google Scholar]
  49. Hong, M.; Tian, M.; Wang, J. Digital inclusive finance, agricultural industrial structure optimization and agricultural green total factor productivity. Sustainability 2022, 14, 11450. [Google Scholar] [CrossRef]
  50. Chen, D.; Ma, Y. Effect of industrial structure on urban-rural income inequality in China. China Agric. Econ. Rev. 2022, 14, 547–566. [Google Scholar] [CrossRef]
  51. Zeng, M.; Shen, S.; Gu, J. How does the integration of cultural and tourism industries impact the value added to tourism value chain: Evidences from Jiangsu Province of China. PLoS ONE 2023, 18, 0287610. [Google Scholar] [CrossRef]
  52. Chen, P.C.; Yu, M.M.; Chang, C.C.; Hsu, H. Total factor productivity growth in China’s agricultural sector. China Econ. Rev. 2008, 19, 580–593. [Google Scholar] [CrossRef]
  53. Darnhofer, I. Strategies of family farms to strengthen their resilience. Environ. Policy Gov. 2010, 20, 212–222. [Google Scholar] [CrossRef]
  54. Phillip, S.; Hunter, C.; Blackstock, K. A typology for defining agritourism. Tour. Manag. 2010, 31, 754–758. [Google Scholar] [CrossRef]
  55. Barbieri, C.; Mahoney, E. Why is diversification an attractive farm adjustment strategy? Insights from Texas farmer and ranchers. J. Rural Stud. 2009, 25, 58–66. [Google Scholar] [CrossRef]
  56. Reimers, M.; Klasen, S. Revisiting the role of education for agricultural productivity. Am. J. Agric. Econ. 2013, 95, 131–152. [Google Scholar] [CrossRef]
  57. Anderson, J.R.; Feder, G. Agricultural extension. Handb. Agric. Econ. 2007, 3, 2343–2378. [Google Scholar]
  58. Grossman, G.M.; Helpman, E. Innovation and Growth in the Global Economy; MIT Press: Cambridge, UK, 1991. [Google Scholar]
  59. Deichmann, U.; Goyal, A.; Mishra, D. Will digital technologies transform agriculture in developing countries? Agric. Econ. 2016, 47, 21–33. [Google Scholar] [CrossRef]
  60. Yang, Z.; Cai, J.; Sliuzas, R. Agro-tourism enterprises as a form of multifunctional urban agriculture for peri-urban development in China. Habitat Int. 2010, 34, 374–385. [Google Scholar] [CrossRef]
  61. Becker, G.S. Human capital revisited. In Human Capital: A Theoretical and Empirical Analysis with Special Reference to Education, 3rd ed.; The University of Chicago Press: Chicago, IL, USA, 1994; pp. 15–18. [Google Scholar]
  62. Abramovitz, M. Catching up, forging ahead, and falling behind. J. Econ. Hist. 1986, 46, 385–406. [Google Scholar] [CrossRef]
Figure 1. Agriculture and tourism integration index in China from 2011 to 2021. Note: the blue, red, and yellow lines indicate the maximum, average, and minimum values of ATI, respectively.
Agriculture 14 01386 g001
Figure 2. Spatial distribution of the average AGTFP and ATI in China’s provinces from 2011 to 2021. Note: The numerical values displayed within each provincial boundary represent the average ATI index.
Agriculture 14 01386 g002
Table 1. Measuring indicators of AGTFP.
Type of VariablesEvaluation of IndicatorUnit
Input indicatorsAgricultural Labor InputNumber of employees in the primary industry10,000 persons
Agricultural Land InputTotal sown area of crops and aquaculture area1000 hectares
Agricultural Capital InputUsage of agricultural fertilizers10,000 tons
Total power of agricultural machinery10,000 kilowatts
Usage of agricultural plastic film10,000 tons
Usage of pesticides10,000 tons
Agricultural Energy InputUsage of agricultural diesel10,000 tons
Agricultural Water InputEffective irrigation area1000 hectares
Output indicatorsDesired OutputGross output value of agriculture, forestry, animal husbandry, and fishery100 million CNY
Undesired OutputAgricultural carbon emissions10,000 tons
Table 2. Indicators for measuring the level of agricultural tourism integration.
ElementsIndicatorsAttributeWeight (%)
AgricultureGross output value of agriculture, forestry, animal husbandry, and fishery (10,000 CNY)+11.40
Proportion of typical counties for rural entrepreneurship and innovation (number of typical counties for rural entrepreneurship and innovation/total number of counties in the region)+53.66
Number of green food enterprises (number of certified green food units in the current year)+17.16
Forest coverage rate+8.42
Land productivity (gross agricultural output value/sown area of crops)+9.36
TourismNumber of A-level scenic spots+18.69
Proportion of demonstration counties for leisure agriculture (number of demonstration counties for leisure agriculture/total number of counties in the region)+20.44
Total tourism revenue (100 million CNY)+25.60
Total number of tourist arrivals (10,000 persons)+18.05
Number of travel agencies (units)+17.22
Table 3. Relevant variables and descriptions.
Variable TypeVariable NameCalculation MethodData Source
Explained
variable
Agricultural green total factor productivity (AGTFP)Measured and evaluated using the SBM-GML indexBy calculation
Core
explanatory
variable
Agriculture and tourism integration (ATI)Calculated using the coupling coordination degree modelBy calculation
Mediating
variables
Agricultural industrial structure adjustment index (AISAI)1—(Agricultural output value/Gross output value of agriculture, forestry, animal husbandry, and fishery) CSY
Threshold
variables
Human capital level (HCL)Number of students enrolled in higher education institutions/total populationCSY
Control
variables
Disaster severity (DS)Proportion of disaster-affected area in total sown area of cropsMARA, CSY
Informatization level (IL)Total volume of post and telecommunications business/regional gross production valueCSY
Trade dependence (TD)Total import and export of agricultural products value/gross production valueMARA
Note: CSY: China Statistical Yearbook; MARA: Ministry of Agriculture and Rural Affairs.
Table 4. Descriptive statistics of variables.
VariablesMeanMedianMaxMinStd. DevObservations
AGTFP1.37411.25913.13060.64940.3964330
ATI0.28190.28380.46010.06650.0775330
AISAI0.47760.49560.64890.09400.0912330
DS0.15670.12790.69550.00210.1181330
HCL0.02130.02080.04360.00850.0057330
IL0.06970.03832.51290.01470.1456330
TD0.02570.01290.10820.00070.0202330
Note: Data have been taken logarithmically before regression.
Table 5. Pearson correlation matrix and variance inflation factor (VIF) of variables.
Variables l n AGTFP l n ATI l n AISAI l n DS l n HCL l n IL l n TDVIF
l n AGTFP1.0000
l n ATI0.5487 ***1.0000 1.4697
l n AISAI0.1084 **0.2391 ***1.0000 1.2969
l n DS−0.2639 ***−0.3281 ***−0.0914 *1.0000 1.2346
l n HCL0.4711 ***0.4456 ***0.0307−0.3852 ***1.0000 1.4032
l n IL0.0923 *0.1467 ***−0.0827−0.0422−0.05781.0000 1.0758
l n TD−0.1940 ***0.2717 ***0.2920 ***−0.3084 ***0.1610 ***−0.08251.00001.1532
Note: *, **, and *** indicate significance at the level of 10%, 5%, and 1%, respectively.
Table 6. Baseline regression results of the impact of ATI on AGTFP growth.
Explained Variable: lnAGTFP(1)(2)(3)(4)(5)
l n ATI0.9232 ***
(0.0330)
0.8474 ***
(0.0361)
0.4369 ***
(0.0462)
0.5206 ***
(0.0481)
0.5009 ***
(0.0476)
l n DS −0.0439 ***
(0.0097)
−0.0269 ***
(0.0082)
−0.0240 ***
(0.0079)
−0.0225 ***
(0.0078)
l n HCL 0.8182 ***
(0.0702)
0.7507 ***
(0.0693)
0.6929 ***
(0.0702)
l n IL −0.0403 ***
(0.0086)
−0.0349 ***
(0.0086)
l n TD −0.0863 ***
(0.0254)
Constant1.4939 ***
(0.0439)
1.6187 ***
(0.0507)
4.1721 ***
(0.2229)
3.8821 ***
(0.2242)
3.6564 ***
(0.2301)
Province FEYESYESYESYESYES
Observations330330330330330
R20.75990.77530.84590.85650.8619
Note: Std. error is in parentheses; *** indicate significance at the level of 1%; FE: fixed effect.
Table 7. Results of mediation effect tests.
Baseline ModelMediation Effect
Explained Variable: l n AGTFP (5) l n AISAI (6) l n AGTFP (7)
l n ATI0.5009 ***
(0.0476)
0.1577 **
(0.0665)
0.1066 ***
(0.0328)
l n AISAI 0.0713 **
(0.0336)
Control variablesYESYESYES
Constant3.6564 ***
(0.2301)
−1.2334 ***
(0.3642)
0.9277 ***
(0.1454)
Province FEYESYESYES
R20.86190.79330.7863
Observations330330330
Mediation effect Partial
Proportion of effect 2.24%
Note: Std. error is in parentheses; ** and *** indicate significance at the level of 5% and 1%, respectively.
Table 8. Results of threshold effect tests.
Threshold
Variable (q)
ThresholdF-StatisticCritical ValueBootstrap Repeat
1%5%10%
l n ATISingle16.1937.356427.341421.6812500
Double21.16 **22.918417.247414.4312500
Triple7.8043.260223.697417.1407500
l n HCLSingle42.04 **50.550236.468932.0932500
Double19.2451.509236.633930.1454500
Note: ** indicate significance at the level of 5%.
Table 9. Results of threshold estimates and confidence intervals.
Threshold
Variable (q)
ThresholdEstimated
Threshold Value
95% Confidence
Interval
l n ATISingle−1.1673[−1.1880, −1.1672]
Double−0.8580[−0.8866, −0.8535]
l n HCLSingle−3.8925[−3.8965, −3.8913]
Table 10. Estimation results of fixed-effects threshold regressions.
(8)(9)
Threshold Variable (q)
Explained Variable: lnAGTFP l n ATI l n HCL
l n ATI   ( q < φ 1 )0.4875 ***
(0.0739)
l n ATI   ( φ 1 q < φ 2 )0.4181 ***
(0.0737)
l n ATI   ( q φ 2 )0.2392 *
(0.1189)
l n ATI   ( q < φ ) 0.7783 ***
(0.0955)
l n ATI   ( q φ ) 0.6792 ***
(0.1052)
Control variablesYESYES
Constant3.1795 ***
(0.4001)
1.2801 ***
(0.1249)
Province FEYESYES
Observations330330
R20.85420.8128
Note: Robust std. error is in parentheses; * and *** indicate significance at the level of 10% and 1%, respectively; q represents the threshold variable; φ indicates the threshold value of single-threshold model, but φ 1 and φ 2 indicate the first and second thresholds in a double-thresholds model, respectively.
Disclaimer/Publisher’s Note: The statements, opinions and data contained in all publications are solely those of the individual author(s) and contributor(s) and not of MDPI and/or the editor(s). MDPI and/or the editor(s) disclaim responsibility for any injury to people or property resulting from any ideas, methods, instructions or products referred to in the content.

