Article

Numerical Simulation and Analysis of the Impurity Removal Process of a Sugarcane Chopper Harvester Based on a CFD–DEM Model

1
Key Laboratory of Key Technology on Agricultural Machine and Equipment, College of Engineering, South China Agricultural University, Ministry of Education, Guangzhou 510642, China
2
School of Mechanical Science and Engineering, Huazhong University of Science and Technology, Wuhan 430074, China
*
Author to whom correspondence should be addressed.
Agriculture 2024, 14(8), 1392; https://doi.org/10.3390/agriculture14081392 (registering DOI)
Submission received: 8 July 2024 / Revised: 14 August 2024 / Accepted: 16 August 2024 / Published: 18 August 2024
(This article belongs to the Section Agricultural Technology)

Abstract

:
The cleaning system is a critical component of the sugarcane chopper harvester, facing challenges such as high impurity rate, elevated power consumption, and an inadequate understanding of the cleaning mechanism. This study aims to simulate the process of removing extraneous matter (represented by sugarcane leaves) from the cleaning system by employing a coupling approach of computational fluid dynamics (CFD) and the discrete element method (DEM) to determine the speed of the extractor fan. Initially, a CFD model was established to analyze the airflow field within the extractor, and its accuracy was verified on a test bench for the cleaning system. Subsequently, a DEM model was developed for sugarcane billets and leaves, which was then integrated with the CFD model to form a gas–solid coupling model. The efficacy of this integrated model was confirmed through experimental measurements of impurity rate. Furthermore, a ternary quadratic regression orthogonal combination design was utilized in the gas–solid coupling simulation to assess the impacts of feed rate, leaf–stalk ratio, and extractor fan speed on impurity rate. Finally, the extractor fan speeds were obtained for various feed rates and leaf–stalk ratios under impurity rates of 5%, 6%, 7%, and 8%. This research can guide in controlling the extractor fan speed during sugarcane chopper harvester field operations and can serve as a foundation for extractor fan design.

1. Introduction

Sugarcane is an important sugar and energy crop widely cultivated across the world. Mechanization of sugarcane harvesting is a developing trend in the sugarcane industry, and the promotion of sugarcane chopper harvesters is an important aspect of this trend [1]. Currently, the cleaning device of sugarcane chopper harvesters uses an axial flow fan, but it has issues such as high-power consumption and high impurity rate. These problems, to some extent, restrict the promotion of sugarcane chopper harvesters [2]. The impurity removal process during sugarcane harvesting directly affects the quality and economic benefits of the final product [3,4]. By deeply exploring the relationship between various factors and the impurity rate, the specific influence rules of each factor on the impurity rate can be accurately revealed, thereby effectively solving many existing problems in the current impurity removal process and improving the efficiency and quality of sugarcane harvesting [5,6]. Therefore, it is necessary to reveal the process and mechanism of impurity removal, clarify the distribution of the airflow field and the movement law of the material flow, and clarify the relationship between the impurity rate and its main influencing factors. However, the traditional research methods that rely on experience, theoretical calculations, and physical prototype tests are time-consuming. It is necessary to explore a method to accelerate the research of the extractor in sugarcane chopper harvesters.
Our research team previously designed and manufactured the 4GDZ-132 sugarcane chopper harvester (as shown in Figure 1) [7]. However, in actual operation, the fan speed of the extractor is controlled by personnel experience, resulting in a high impurity rate and excessive energy consumption after cleaning [8]. The machine’s forward speed and the planting density of the field determine the feeding rate, while the variety and harvesting time determine the leaf–stalk ratio [9]. The feeding rate, leaf–stalk ratio, and fan speed ultimately affect the impurity content. To control the impurity content, it is necessary to clarify the impact of the feeding rate, leaf–stalk ratio, and fan speed on the impurity rate. The separation process of sugarcane leaves and billets in the extractor is difficult to quantitatively measure and analyze through physical experiments.
The gas–solid coupling method is an effective numerical simulation technique for two-phase flow. It solves the gas motion using computational fluid dynamics (CFD) and calculates the motion of solid particles using the discrete element method (DEM). The cleaning process of sugarcane chopper harvesters is a typical dense gas–solid two-phase flow [10]. Therefore, using the CFD–DEM coupling theory to study this process is a feasible approach. In addition, many researchers have also used this theory to analyze different agricultural harvesters. The use of CFD–DEM technology to simulate the impurity removal process of rice combine harvesters has become relatively mature. By analyzing the movement of materials and the airflow field, the mechanical structure and working parameters were optimized in a targeted manner, thereby improving the impurity removal performance of the harvester [11,12,13,14,15]. The mechanism of grain detachment from the stalk can also be explored by simulating the stripping-prior-to-cutting process of the rice combine machine [16]. The feasibility of using gas–solid coupling simulation for corn and flax combine harvesters has also been validated by researchers, respectively [17,18]. Numerous studies have shown that CFD–DEM technology demonstrates reliable and convenient characteristics in exploring the cleaning process. It breaks the limitations of space and time, enabling researchers to conveniently optimize the cleaning unit.
Some researchers have explored the optimization of the cleaning device in the sugarcane chopper harvester to improve its impurity removal performance. They have developed a computational fluid dynamics model for the extractor and optimized specific extractor structures [19,20,21,22,23,24]. There are also studies that explore the performance of the fan through physical experiments and optimize the operating parameters of the extractor based on the results of these experiments [5,25]. Most of the studies in this field only focus on investigating the airflow field using CFD technology and proposing improvement suggestions based on the aerodynamic conditions within the flow field. However, this approach neglects the movement of billets, leaves, and other materials inside the extractor, as well as the impact of particles on the airflow. As a result, it is unable to provide a direct assessment of the impurity removal performance and has certain limitations.
In conclusion, employing CFD–DEM technology for simulating the cleaning process of a combine harvester proves to be a dependable approach. The DEM can simulate the movement of materials but cannot consider the influence of the airflow field on the materials [26]. CFD can simulate the movement of the airflow field but cannot consider the movement of the materials [27]. The CFD–DEM coupling can simulate the movement process of materials in the airflow field, thereby revealing the separation mechanism of materials under the action of airflow [28].
The purpose of this paper is to explore the relationship between impurity rate and feed rate, leaf–stalk ratio, and fan speed by simulating the separation process, and finally, obtain the ideal fan speed under the target impurity rate. The results of this study can guide the field operation of harvesters and lay the foundation for future intelligent harvesting. The main contributions of this paper are summarized as follows: (1) a gas–solid coupling model of the impurity removal process of the extractor in the sugarcane chopper harvester has been established; (2) the relationship between impurity rate and influencing factors has been studied; and (3) parameter combinations under different target impurity rates have been obtained, laying a foundation for subsequent research.

2. Materials and Methods

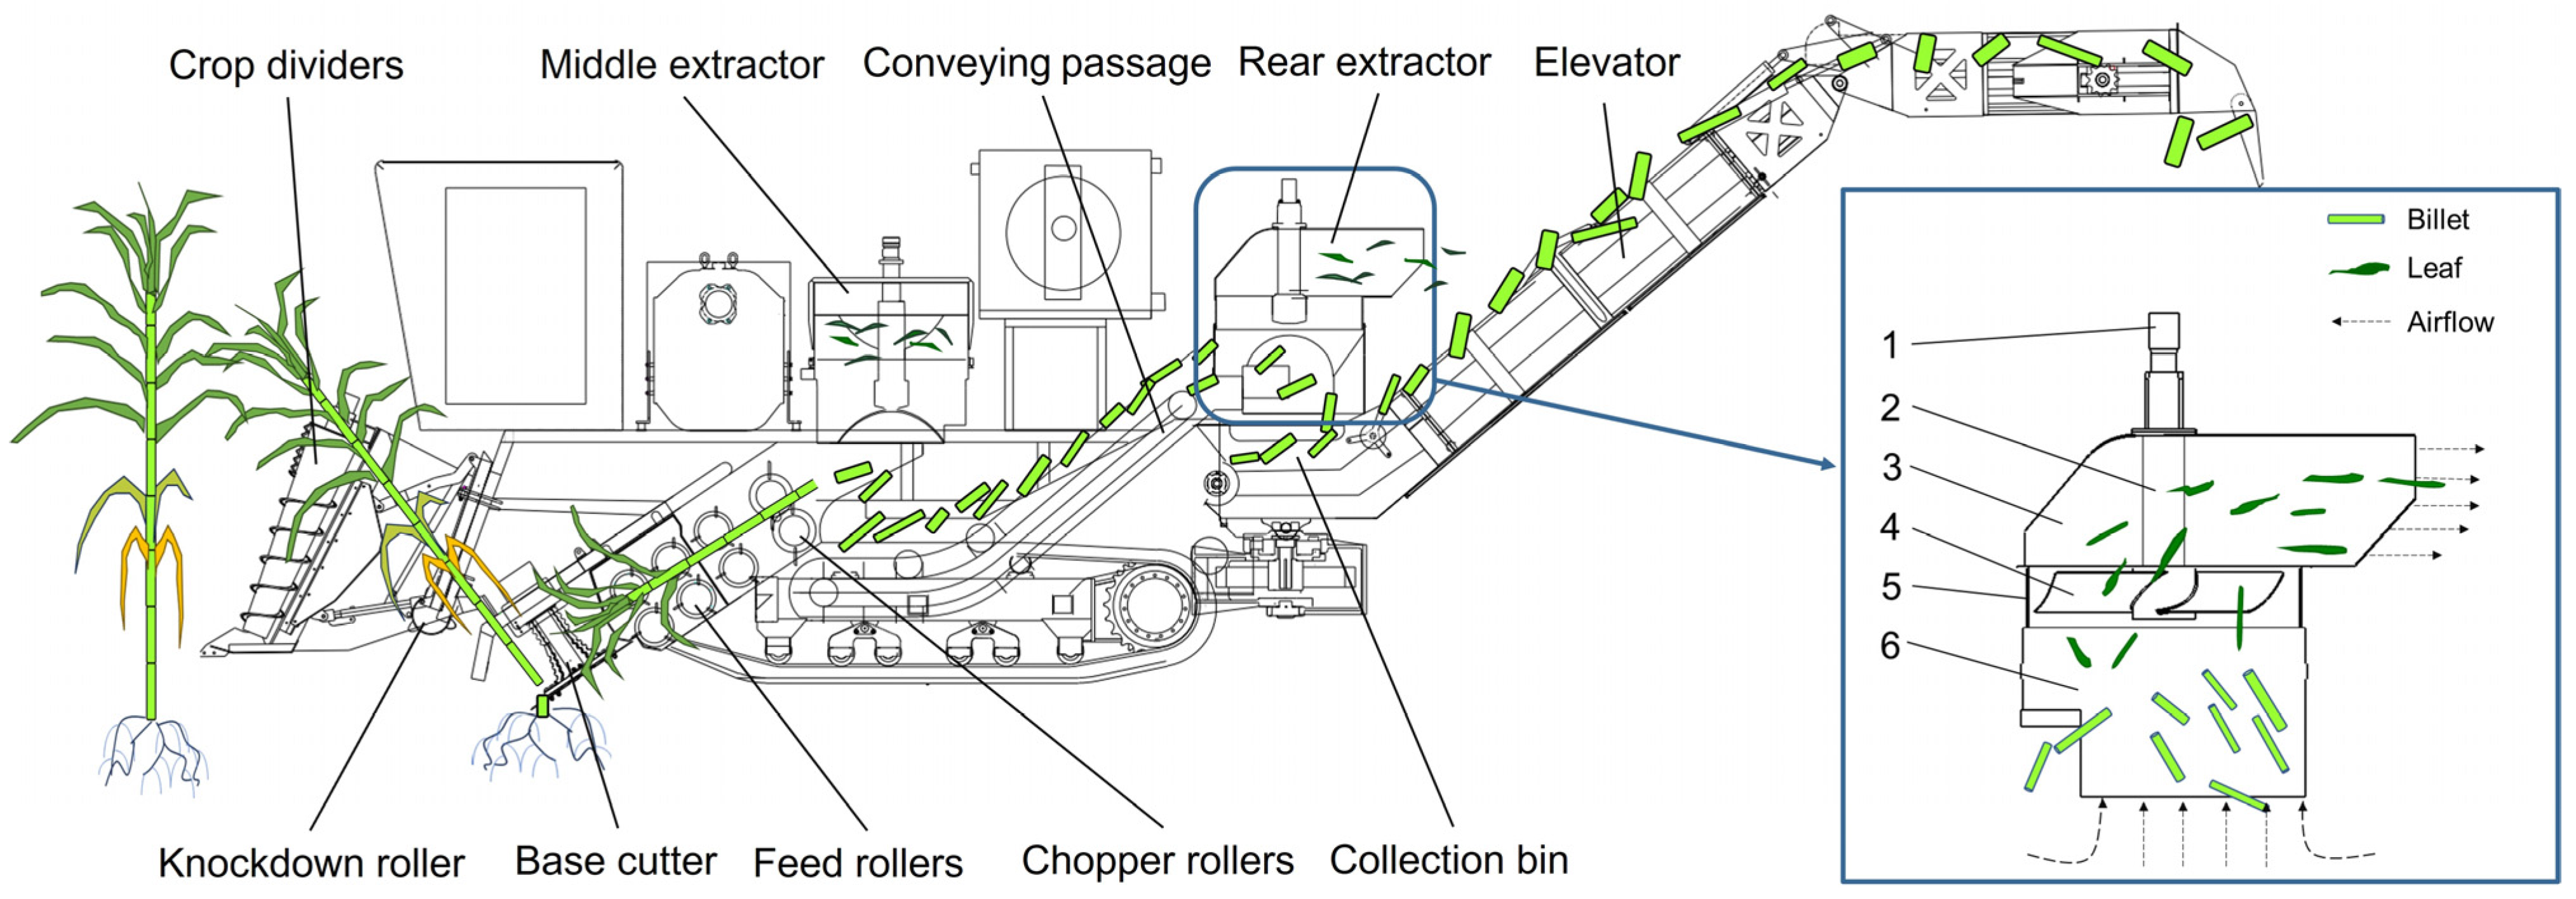
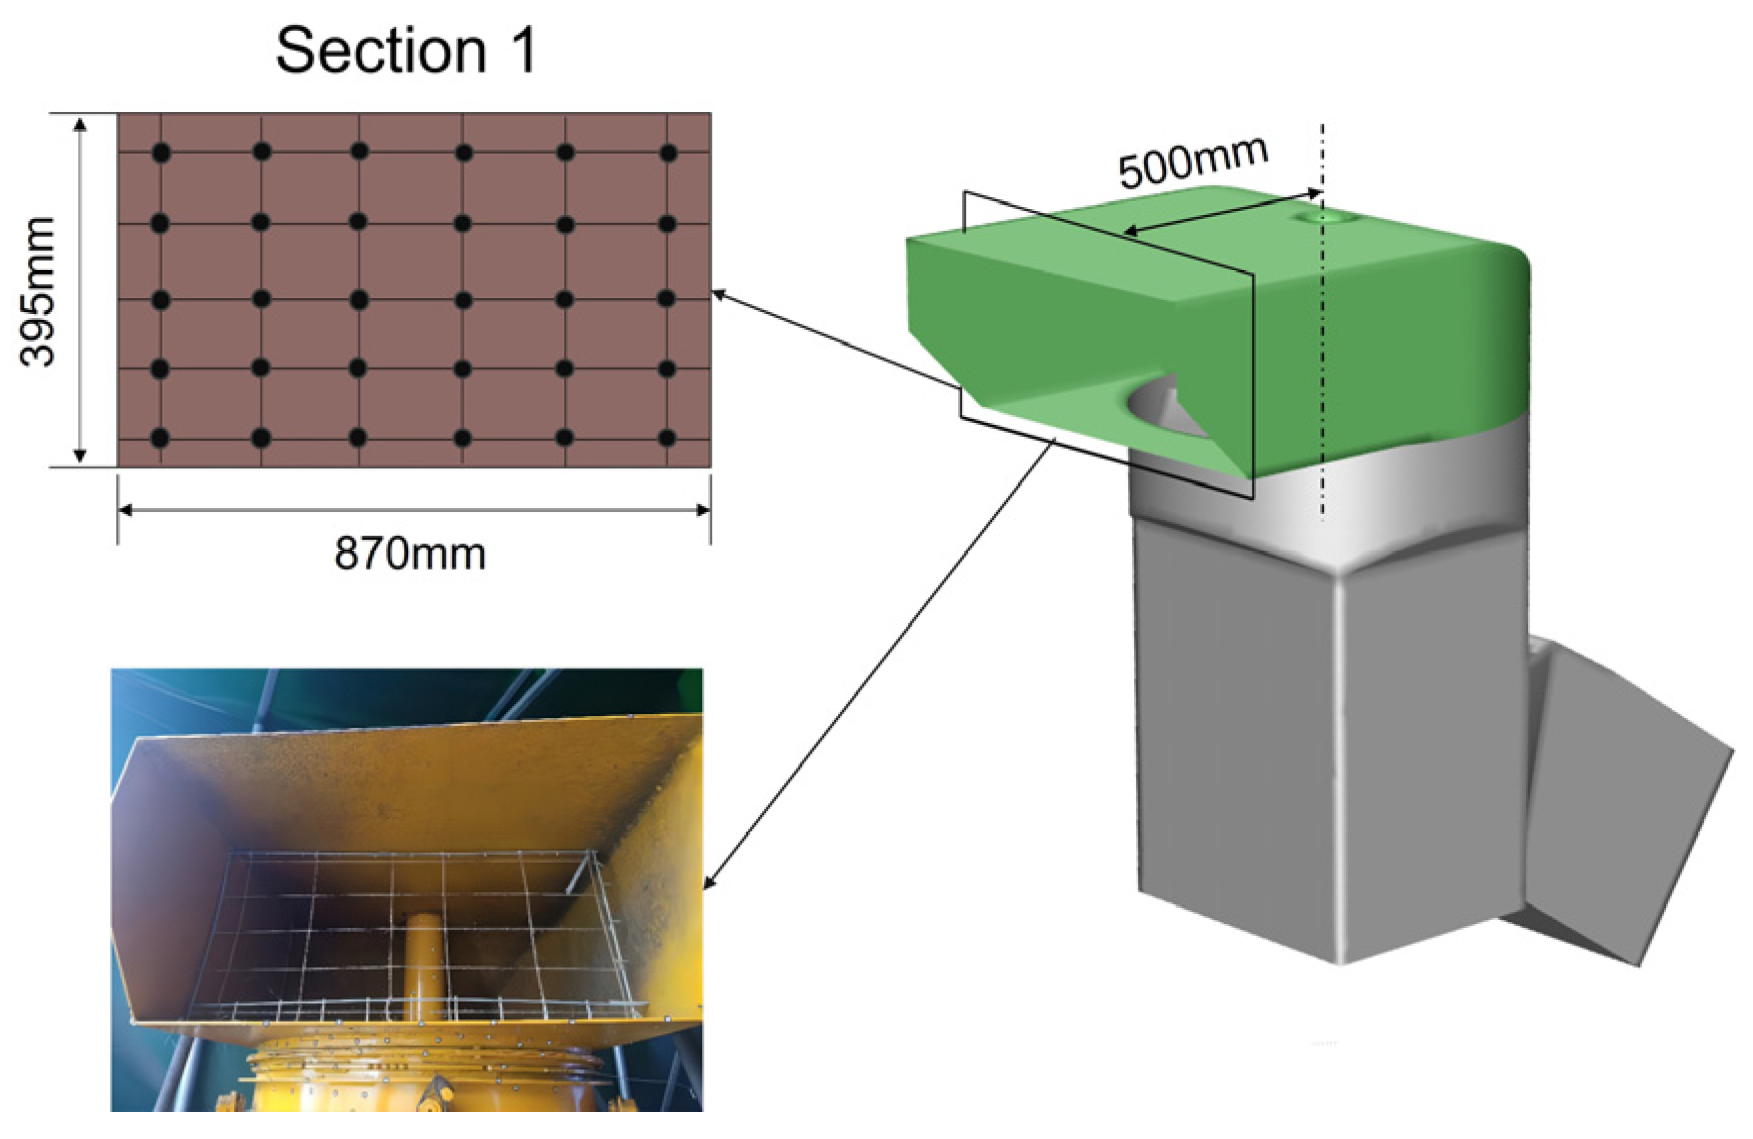
2.1. Structure and Working Principle of the Extractor Test Bench

When the sugarcane chopper harvester is operating in the field, the crop dividers rotate in opposite directions to gather the sugarcane towards the middle of the machine. The knockdown roller pushes the sugarcane forward, and the base cutter cuts the sugarcane from the root, and then it is sent to the feed rollers. Using the feed rollers to hold the sugarcane and move it backward, the chopper rollers cut it into billets and throws the billets into the impurity removal area of the middle extractor for the first impurity removal. After cleaning, the sugarcane materials fall into the conveying passage and are thrown into the rear extractor for secondary impurity removal through the scraper conveyor. After cleaning, the billets fall into the collection bin, and then are lifted into the field transport vehicle by the elevator (as shown in Figure 1).
The rear extractor is an important impurity removal mechanism. The extractor comprises a hydraulic motor, transmission shaft, fan blade, impurity separation chamber, fan chamber, and hood, as illustrated in Figure 1. The swiftly rotating fan blade draws air from beneath the impurity separation chamber, generating an upward airflow that traverses the impurity separation chamber and the fan chamber before exiting through the hood. The chopper rollers cut the whole cane into segments and throws the segments into the impurity separation chamber. The varyious suspension speeds of the impurities (slower than the ascending air current) and billets (faster) result in their segregation within the chamber. Impurities ascend with the airflow and are expelled, while the billets descend into the elevator. According to the structure and arrangement of the rear extractor of the sugarcane chopper harvester, a corresponding cleaning system test bench is built, as shown in Figure 2.
The test bench is powered by a 132 kw hydraulic station. The rotational speed of the fan blades of the extractor is controlled by adjusting the hydraulic flow. A torque sensor (Futek Corporation.TRS605, Futek, CA, USA) was installed between the hydraulic motor and the fan shaft to measure the real-time rotational speed (see Figure 2). The parameters of the key components of the extractor are detailed in Table 1.

2.2. Simulation of the Airflow Field of the Extractor

The subsequent gas–solid coupling simulation can be ensured by constructing an accurate and reliable airflow field simulation model, which is a crucial component of the gas–solid coupling model.

2.2.1. Model and Meshing

A simplified model of the extractor was developed using SolidWorks 2016 software. The model is segmented into sections for outlet zone, fan blade zone, material separation zone, and material throwing area (see Figure 3).

2.2.2. Verification of Mesh Independence

When conducting a CFD simulation, the quantity of meshes directly influences the accuracy and reliability of the simulation results. Fewer meshes may be unable to capture the subtle features and complex phenomena of fluid flow, resulting in a relatively large deviation of the results, while an excessive number of meshes implies an increase in computing cost and time. Different mesh quantities may lead to variations in the simulation results. To ensure that the simulation results are not caused by the unreasonable setting of the meshes, it is necessary to conduct mesh independence verification.
Based on this, multiple models with different mesh sizes were established for independence verification. Under the premise of meeting the mesh quality requirements, for the simulation tests with different mesh quantities, the fan speed was set at 600 rev/min, and the average velocities of the airflow at the outlet surface were obtained, respectively, and compared. With an increase in the number of meshes, the flow velocity at the outlet tends to stabilize. When the number of meshes reaches approximately 313,893, the velocity basically remains unchanged, and the computing error at this time also tends to stabilize (see Figure 4). Considering the computing error and efficiency comprehensively, this model was selected for subsequent calculations.

2.2.3. Boundary Conditions and Data Calculation

According to the operational conditions of the fan, primarily characterized by rotating airflow, the turbulence model selected was the Realizable k–ε model [20,24]. A pressure-based double precision steady solver was utilized, with default values assigned to all relaxation factors. The SIMPLEC (Semi-Implicit Method for Pressure-Linked Equations) algorithm was applied for solving, with the gradient computed in the Least Squares Cell-Based discretization format, pressure in the PRESTO discretization format, and other parameters in the second-order upwind format. The convergence criterion for solving was established at 1 × 10⁻³.

2.2.4. Validation of Airflow Simulation Model

To validate the accuracy of the airflow field simulation model, the simulated flow values at the extractor outlet were compared with test data. Following the flow measurement protocol outlined in the “Industrial Ventilation Fan On-Site Performance Test” [29], a cross-section was chosen at the extractor outlet, and measurement points in the rectangular duct were distributed using the Chebyshev method (refer to Figure 5). Wind speeds at various rotational speeds (600, 700, 800, 900, 1000, 1100) were recorded and averaged to determine the flow values. The test was repeated three times, and the average value was taken. The measurement tool was a SMARTT SENSOR split-type anemometer (The accuracy of wind speed was ±3%).
Using ANSYS Fluent 19.2 software, a steady simulation was conducted on the airflow field of the extractor to determine simulated wind speeds and calculate the flow. The flow results from test and simulations at various speeds are illustrated in Figure 6. The trend of the simulated flow values aligns consistently with the test values, showing an increase in flow as the fan speed rises. The maximum relative error is 11.7%, the minimum is 3.9%, and the average is 9%. In conclusion, the simulation model for the airflow field of the extractor is reasonably reliable, the numerical simulation method is accurate, and it is suitable for investigating the internal flow dynamics of the extractor.

2.3. Material Discrete Element Simulation Model Construction and Parameter Setting

The material mixture in the fan during operational processes is intricate, comprising billets, leaves, tops, broken sugarcane, soil, and more. Among these components, billets represent the harvested materials, while leaves serve as the primary impurities. Simulating all material elements would result in an overly extensive model, demanding substantial computational resources. Hence, simplifying the material composition is essential, with a specific focus on the blend of billets and leaves.

2.3.1. Determination of Basic Physical Parameters of Billets and Leaves

The sugarcane variety Xin Tai Sugar 22 (Code-named ROC22), cultivated in Zhanjiang, Guangdong Province, was harvested using the 4GDZ-132 sugarcane chopper harvester. During the harvesting process, 100 sugarcane billets and 100 leaves were randomly chosen for measuring their geometric dimensions. The material volume was determined through the drainage method, while the material moisture content was assessed using the electric heating drying method. Moreover, employing the five-point sampling technique, 30 whole cane were randomly picked from five distinct areas within the sugarcane field to calculate the leaf–stalk ratio [30]. Table 2 provides a comprehensive overview of the basic physical parameters of the materials.

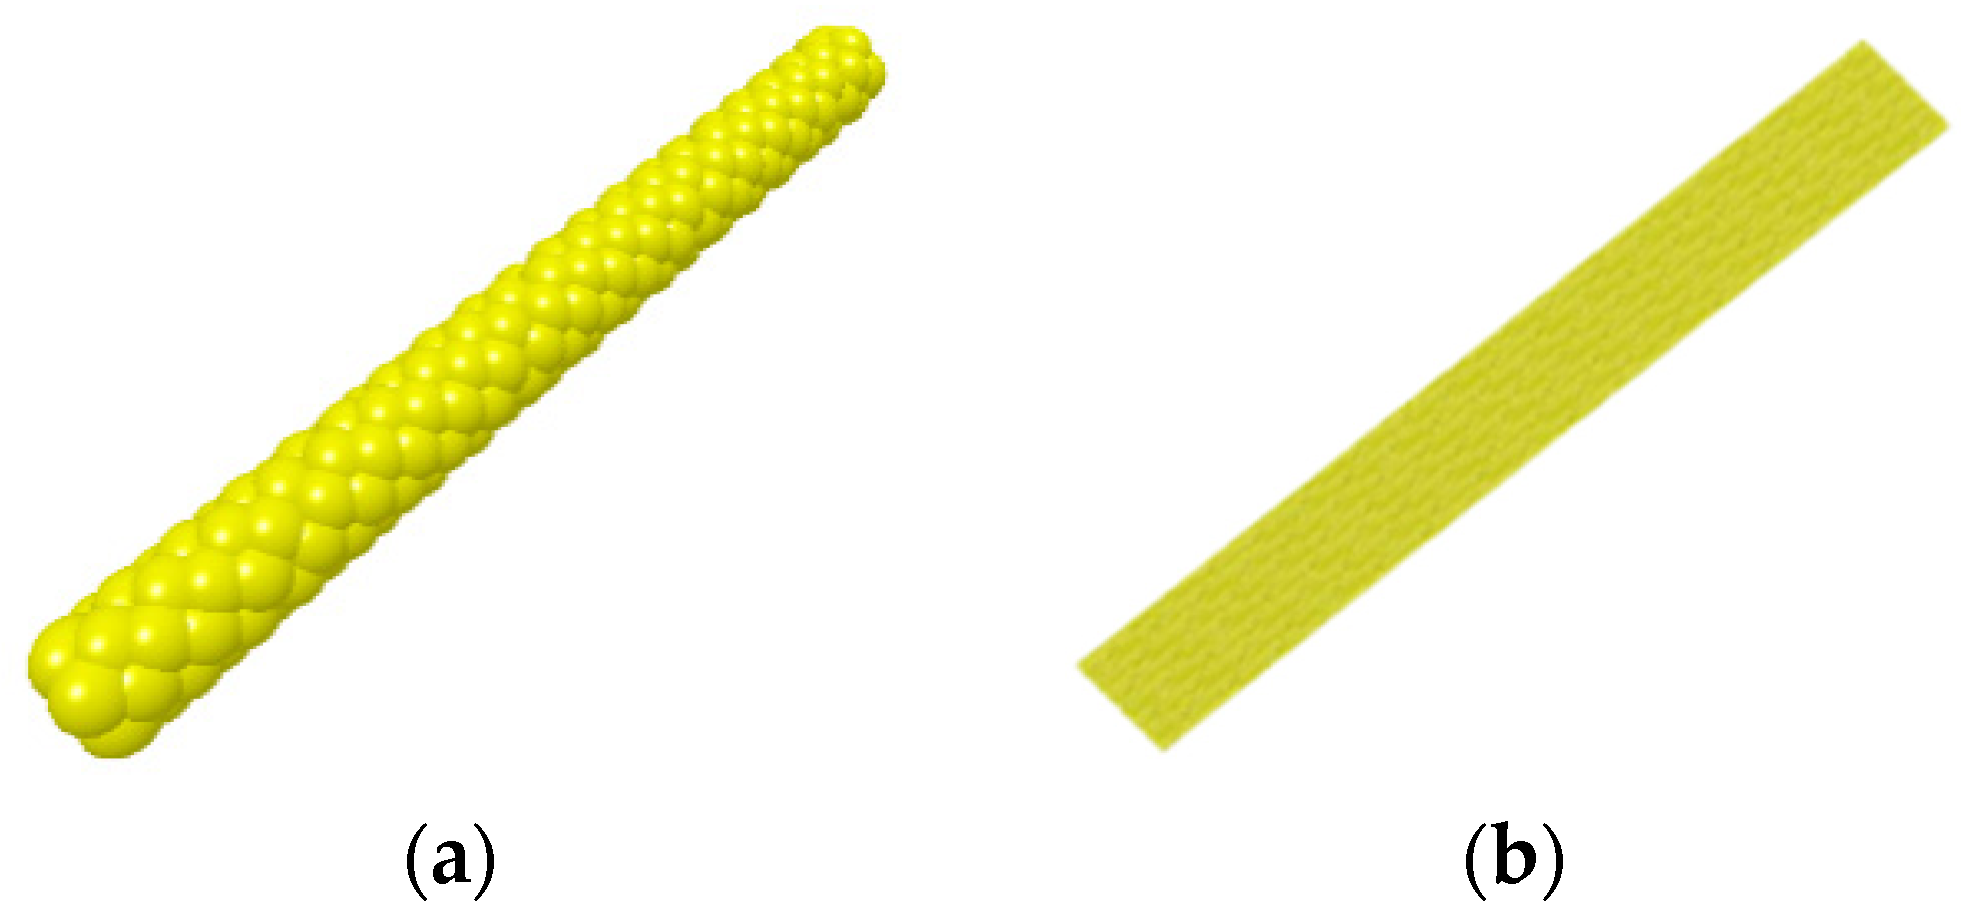
2.3.2. Discrete Meta-Simulation Model Construction for Billets and Leaves

Based on the results of the physical measurements, geometric models of billets and leaves were created using Solidworks2016 software and then imported into EDEM 2020 in stl format. The modeling of billets and leaves involved a multi-sphere aggregation model and the XML method, incorporating the Hertz–Mindlin non-slip contact model between particles. The simulation models of billets and leaves were filled using the automatic filling model, and the central coordinates of all particles were exported to a .csv file, which was subsequently processed to generate a .xml file. Upon setting up a new particle project in EDEM and importing the .xml file, the software automatically generated a discrete element simulation model. The filled model was exported as a .dec file, serving as a particle template for future simulation runs. The discrete element models of billets and leaves are illustrated in Figure 7.

2.3.3. Discrete Element Simulation Parameter Setting

In discrete element simulation, fundamental parameters consist of intrinsic properties (such as Poisson’s ratio, shear modulus, and density) and contact properties (including restitution coefficient, static friction coefficient, and dynamic friction coefficient). These parameters are essential for describing particle behavior in terms of flow, friction, elasticity, and plasticity. Drawing from our team’s prior studies [2,31], the specific values for the materials’ discrete element simulation parameters have been established and are presented in detail in Table 3.

2.4. Modelling of Gas–Solid Coupling for Extractor

2.4.1. Coupling Parameter Setting

In EDEM 2020, the simulation time step is set to 1 × 10⁻⁷ s, with results saved every 0.01 s. For ANSYS Fluent 19.2, the time step is adjusted to 1 × 10⁻⁵ s, which is 100 times that of EDEM. The simulation comprises 500,000 steps, corresponding to a duration of 0.5 s, and Max Iterations/Time Step is limited to 40 to cap the iteration count per step. The coupling interface with EDEM 2020 was established using user-defined functions to integrate with the solver, enabling the implementation of CFD–DEM coupling through the Lagrangian (DPM) model.

2.4.2. Validation of the Gas–Solid Coupling Model

To validate the accuracy of the CFD–DEM coupling model, test factors including the leaf–stalk ratio, feed rate, and fan speed were chosen, with impurity rate serving as the test indicator. Bench-scale tests were carried out to assess the cleaning process of the sugarcane chopper harvester. A comparison was made between the test results and the simulation results to confirm the model’s accuracy.
The test was conducted in the soil laboratory at South China Agricultural University as illustrated in Figure 8. The test material used was sugarcane variety ROC22, and the test setup consisted of the test bench illustrated in Figure 2. Three fan speeds (700, 900, and 1100 rev/min) were designated as test variables, with impurity rate as the key parameter for analysis. Each test was replicated three times, and the mean value was taken as the measurement outcome. The calculation method for impurity rate was referenced from “Sugarcane Combine Harvester” [32], as shown in Equation (1).
J h = W z W j z × 100 %
where Wz is the mass of the impurity, kg; Wjz is the total mass of the sample taken from the test bench, kg; Jh is the impurity rate, %.
For conducting the gas–solid coupling simulation test for the impurity removal process of the sugarcane chopper harvester, the materials, which comprise billets and leaves, enter the material throwing area at a 34° angle to the horizontal plane with a speed of 2.17 m/s. The leaf–stalk ratio was 25%, the feed rate was 10 kg/s, and the fan speeds were 700, 900, and 1100 rev/min. The impurity rate served as the experimental indicator. Mass sensors were placed at the top of the outlet zone and the fan blade zone in EDEM to measure the mass of discharged leaves. The gas–solid coupling simulation test is illustrated in Figure 9.
The simulation test impurity rate calculation method is as follows:
J f = M l M J M S + M l M J × 100 %
where Ml is the total mass of generated leaves, kg; MJ is the total mass of leaves discharged from the extractor, kg; Ms is the total mass of generated billets; and Jf is the impurity rate, %.

2.4.3. Model Validation Results

The impurity rate results from the simulation test and the test bench are depicted in Figure 10. As the fan speed increases, the impurity rate decreases, and the trend in simulation values closely aligns with test values, showing a maximum relative error of 15%, a minimum of 6.67%, and an average of 10.53%. The model demonstrates adequate reliability, thus enabling its application in future gas–solid coupling simulation studies.

3. Results and Analysis

3.1. Simulation Analysis of the Airflow Field of the Extractor

To delve deeper into the influence of fan speed on the airflow field, simulations were carried out to analyze the flow distribution at three distinct fan speeds (700, 900, 1100 rev/min). Subsequently, an analysis was conducted on the velocity and total pressure simulation results of Section 2, illustrated in Figure 11.
Figure 12 shows the velocity distribution contour map within Section 2 at different fan speeds. The velocity distribution inside the extractor is a crucial design parameter. A comparison of the three velocity distribution contour maps reveals, that with an increase in fan speed, the velocity values within most of the airflow field inside the fan also increase, while the distribution range remains relatively constant. The airflow field status of the extractor at a certain speed can be clearly observed from the graphs. Taking the velocity distribution contour map of Section 2 at 700 rev/min as an example: the velocity in the fan blade zone reaches a maximum value, with a maximum velocity of 23.2 m/s; the overall velocity in the material throwing zone is the lowest, with the lowest velocity being 2.6 m/s; the velocity in the outlet zone shows the greatest variation, ranging from 3.3 to 20.2 m/s; the material separation zone just below the blades exhibits relatively high and stable velocity, with an average velocity of 6.8 m/s and a velocity range of 5.7 to 11.3 m/s.
Figure 13 illustrates the contour map depicting the distribution of total pressure in Section 2 of the airflow field. A pressure concentration phenomenon is observed on the upper side of the fan blade, where the positive pressure peaks, while the negative pressure beneath the fan blade also reaches its maximum. The material separation zone below the fan blade region demonstrates a relatively stable pressure condition.
In conclusion, variations in fan speed primarily influence the intensity of airflow velocity and pressure within the airflow field, while having a relatively small influence on the airflow field’s distribution. As the fan speed escalates, the overall airflow velocity and pressure within the airflow field escalate correspondingly. Proximate to the fan blade region, airflow velocity and pressure values are elevated. Within the material separation zone beneath the fan blade, airflow velocity and pressure remain relatively high and stable, thereby facilitating the effective separation of mixed materials.

3.2. Analysis of Gas–Solid Coupling Simulation Results

The movement and separation laws of billets and leaves in the gas–solid coupled simulation process were analyzed under the conditions of a feed rate of 10 kg/s, a leaf–stalk ratio of 25%, and a fan speed of 1100 rev/min, as illustrated in Figure 14.
At 0.45 s, billets and leaves are intermingled as they enter the material throwing zone. Within this region, the airflow velocity and pressure are low, exerting minimal influence on the movement of materials. Material motion is predominantly governed by inertia and gravity, and the segregation of billets and leaves has not yet taken place.
At 0.65 s, some billets and leaves are transported to the material separation zone. With decreased spatial constraints, the billets and leaves exhibit dispersed movements. Within this region; the airflow velocity and pressure are consistently high. The leaves are predominantly affected by the airflow, moving upward, while the billets descend under gravity, resulting in their segregation.
At 0.85 s, certain leaves traverse the fan blade and outlet zones, being expelled from the hood. Under the influence of the airflow field distribution, the majority of leaves swirl near the fan blade zone where wind speed and pressure are high. Numerous billets move forward due to inertia, colliding with the inner wall of the extractor. Some leaves that fail to separate promptly become intermixed and travel alongside the billets.
At 1.4 s, the material throwing process concludes, with the majority of leaves already expelled from the hood. While some leaves persist within the extractor, a subset of them is affected by the airflow pattern, persisting in an upward trajectory. Furthermore, a few leaves are compressed by the billets and descend from the lower outlet, representing impurities found in harvested sugarcane.
The examination of the airflow field indicates a close relationship between the movement, orientation, path, and separation characteristics of billets and leaves and the distribution, scale, material feed rate, and leaf–stalk ratio of the airflow field. Consequently, assessing the influence of the fan speed, feed rate, and leaf–stalk ratio on its operational efficiency is essential. This analysis can provide guidance for field operations and serve as a basis for designing the extractor.

3.3. Analysis of the Relationship among Parameters

The fan speed of the extractor is directly related to the impurity removal effect of the extractor and the power consumption of the machine. It is necessary to clarify the relationship between the impurity rate and the fan speed, leaf–stalk ratio, and feed rate. Corresponding conclusions can be conveniently drawn through the gas–solid coupling simulation test.

3.3.1. Simulation Test Design

A three-factor quadratic regression orthogonal combination design test approach was employed. The coding of test factors is detailed in Table 4. Here, A, B, and C correspond to fan speed, feed rate, and leaf–stalk ratio, with the impurity rate Y serving as the test indicator.

3.3.2. Simulation Test Results

The test scheme and its corresponding results are displayed in Table 5.
Utilizing Design-Expert 11.0 software, the test results underwent second-order regression analysis and multiple regression fitting to derive the multivariate nonlinear regression Equation (3) with the impurity rate Y of the extractor as the experimental indicator, followed by a significance test.
Y = 10.35 − 2.95A + 1.59B − 0.2583AB − 0.3417AC + 0.1333BC − 0.8722A2 − 0.4556B2 − 0.6889C2
From the above equation, it can be seen that there exists an optimal combination of parameters among the factors of fan speed, feed rate, and leaf–stalk ratio to minimize the impurity rate.
The ANOVA (Analysis of Variance) results for the regression model are presented in Table 6. As per the table, the main and interaction effects of each factor on the impurity rate follow this order of importance: A > B > A2 > C2 > AC > B2 > AB > BC > C. Specifically, the influence of fan speed (A), feed rate (B), and the interaction between fan speeds (A2) on the impurity rate is highly significant (p < 0.01); the interaction involving the leaf–stalk ratio (C2) significantly impacts the impurity rate (0.01 < p < 0.05); all other factors with p > 0.05 are non-significant. The model fit is highly significant with p < 0.01. The regression model’s coefficient of predicted R2 = 0.9727, and the adjusted R2 = 0.9583, both approaching 1, demonstrating a strong alignment between predicted and actual values. The coefficient of variation C.V = 6.58% < 10%, indicating low variability and ensuring the experiment’s reliability. The Adeq Precision = 28.3766 > 4, confirming the model’s accuracy. In summary, this regression model effectively and accurately represents the real-world scenario.
The simulation results show that the three experimental factors—feed rate, fan speed, and leaf–stalk ratio—exhibit unique correlations with impurity rate trends. Therefore, fine-tuning these factors can act as a guiding strategy for effectively managing the sugarcane chopper harvester during field operations. Confronted with diverse sugarcane growth conditions in different plots, marked by varying leaf–stalk ratios and fluctuating feed rates due to factors like forward speed and planting density, real-time fan speed control is crucial to maintain the desired impurity rate level.
In order to obtain the parameter matching under different target impurity rates (5%, 6%, 7%, 8%). By using Formula (3) between the impurity rate and the three test factors, the numerical combination results of the three test factors under the target impurity rate can be obtained. It is necessary to set boundary conditions for each test factor in the software and derive its mathematical model (see Formula (4)).
  Target   value   = Y %                                       s . t . 700 rev / min A 1100 rev / min 10   kg / s B 20   kg / s 20 % C 30 %
The regression equation was solved using a target optimization method to obtain multiple sets of parameters. The matching graph of these parameters is illustrated in Figure 15. Analysis of Figure 15 reveals that as the target impurity rate increases, the surface area on the graph consistently expands, indicating a growing number of optimal parameter combinations capable of achieving the target impurity rate. Consequently, with the rise in the target impurity rate, the range of fan speeds widens continuously to accommodate various feed rates and leaf–stalk ratios.

4. Discussion

It can be known from Figure 15 that if a 5% (relatively the lowest) impurity rate is to be achieved, the feed rate (10–13.3 kg/s) and the fan speed (1038–1100 rev/min) are limited to a smaller range. This indicates that during field harvesting, it is necessary to proceed at a lower feed rate, that is, a lower forward speed (2–3 km/h), while the fan needs to operate at a high speed. Under such circumstances, the fan at a high speed will cause some billets to be extracted, reducing sugarcane yield. In addition, the machine operating with high energy consumption means an increase in harvest cost. Therefore, in actual operations, an overly low impurity rate of sugarcane will not be pursued blindly. In the other three figures, as the target impurity rate increases, a higher feed rate can be adapted, and the fan is no longer limited to a high speed, which implies that there are more combinations to achieve the target impurity rate. Its application significance lies in that in the fields with a determined leaf–stalk ratio, if the machine feed rate can be determined, referring to the parameter matching diagram, the corresponding fan speed can be found to achieve the set target impurity rate instead of operating at a fixed fan speed, thereby achieving precise control of the harvesting process and reducing energy consumption.
In the future, we can design a feed rate sensor suitable for sugarcane chopper harvesters by referring to the feed rate sensors of other grain harvesters [33,34,35]. We plan to develop a control system that can adapt to the following two harvest situations: Scenario one, set the target impurity rate, the leaf–stalk ratio, and the yield of the current field in the system, calculate the real-time feed rate according to the driving speed of the machine, and then obtain the fan speed based on the parameter matching model in this paper to control the extractor of the harvester in real time. Scenario two, also set the target impurity rate and the leaf–stalk ratio in the system, and then obtain real-time data through the feed rate sensor; the system calculates the corresponding fan speed to achieve real-time control. These two application scenarios are precisely the research directions of intelligent harvesting in the future; this article lays the foundation for the implementation of this function. Finally, this harvesting method can avoid the fan operating at high energy consumption, reducing energy waste, and making certain contributions to energy conservation and emission reduction.

5. Conclusions

This study addresses the challenges of a high impurity rate, elevated power consumption, and an unclear impurity removal mechanism in the sugarcane chopper harvester. It utilizes CFD–DEM numerical simulation technology in conjunction with test bench experiments to investigate the impurity removal process of the extractor. The main conclusions are as follows:
(1)
An airflow field model of the extractor is established. Simulation shows fan speed variation only affects values not distribution. A fan speed increase raises velocity and pressure. Near the fan blades, velocity and pressure values are higher. The area beneath the fan is the main separation zone.
(2)
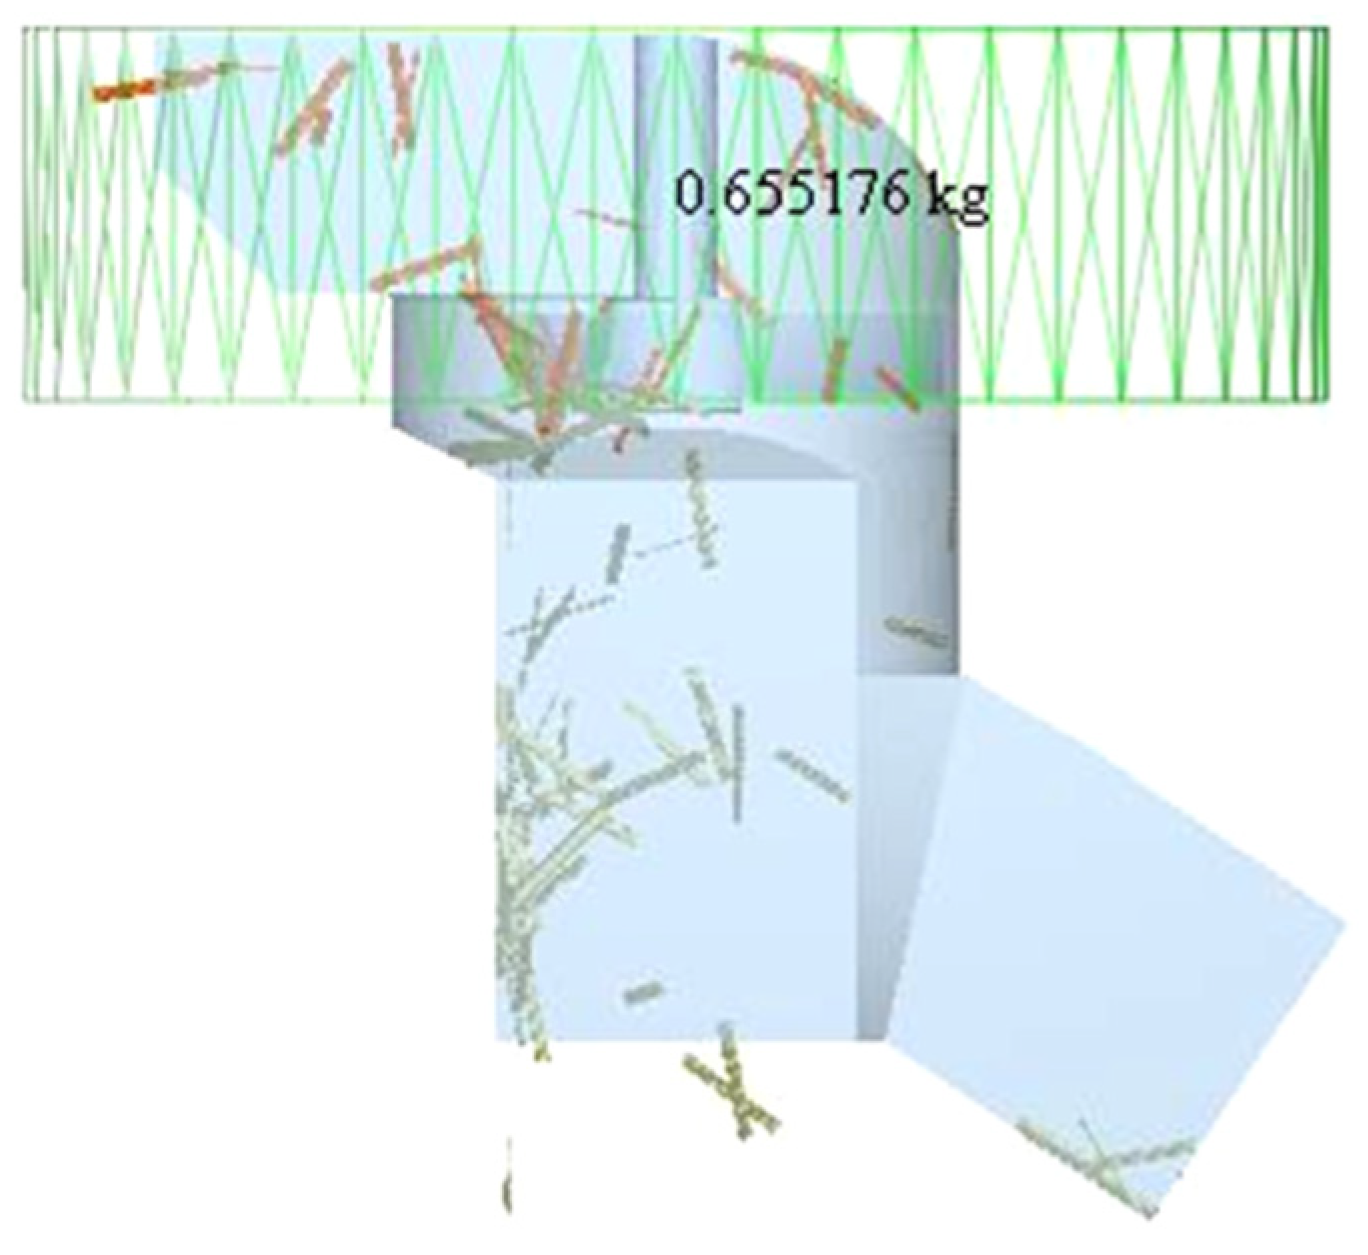
The gas–solid coupling simulation model of the extractor was constructed, and the impurity removal process was simulated. The movement state of sugarcane material in the extractor at different times was analyzed, which lays a foundation for further exploring the impurity removal mechanism.
(3)
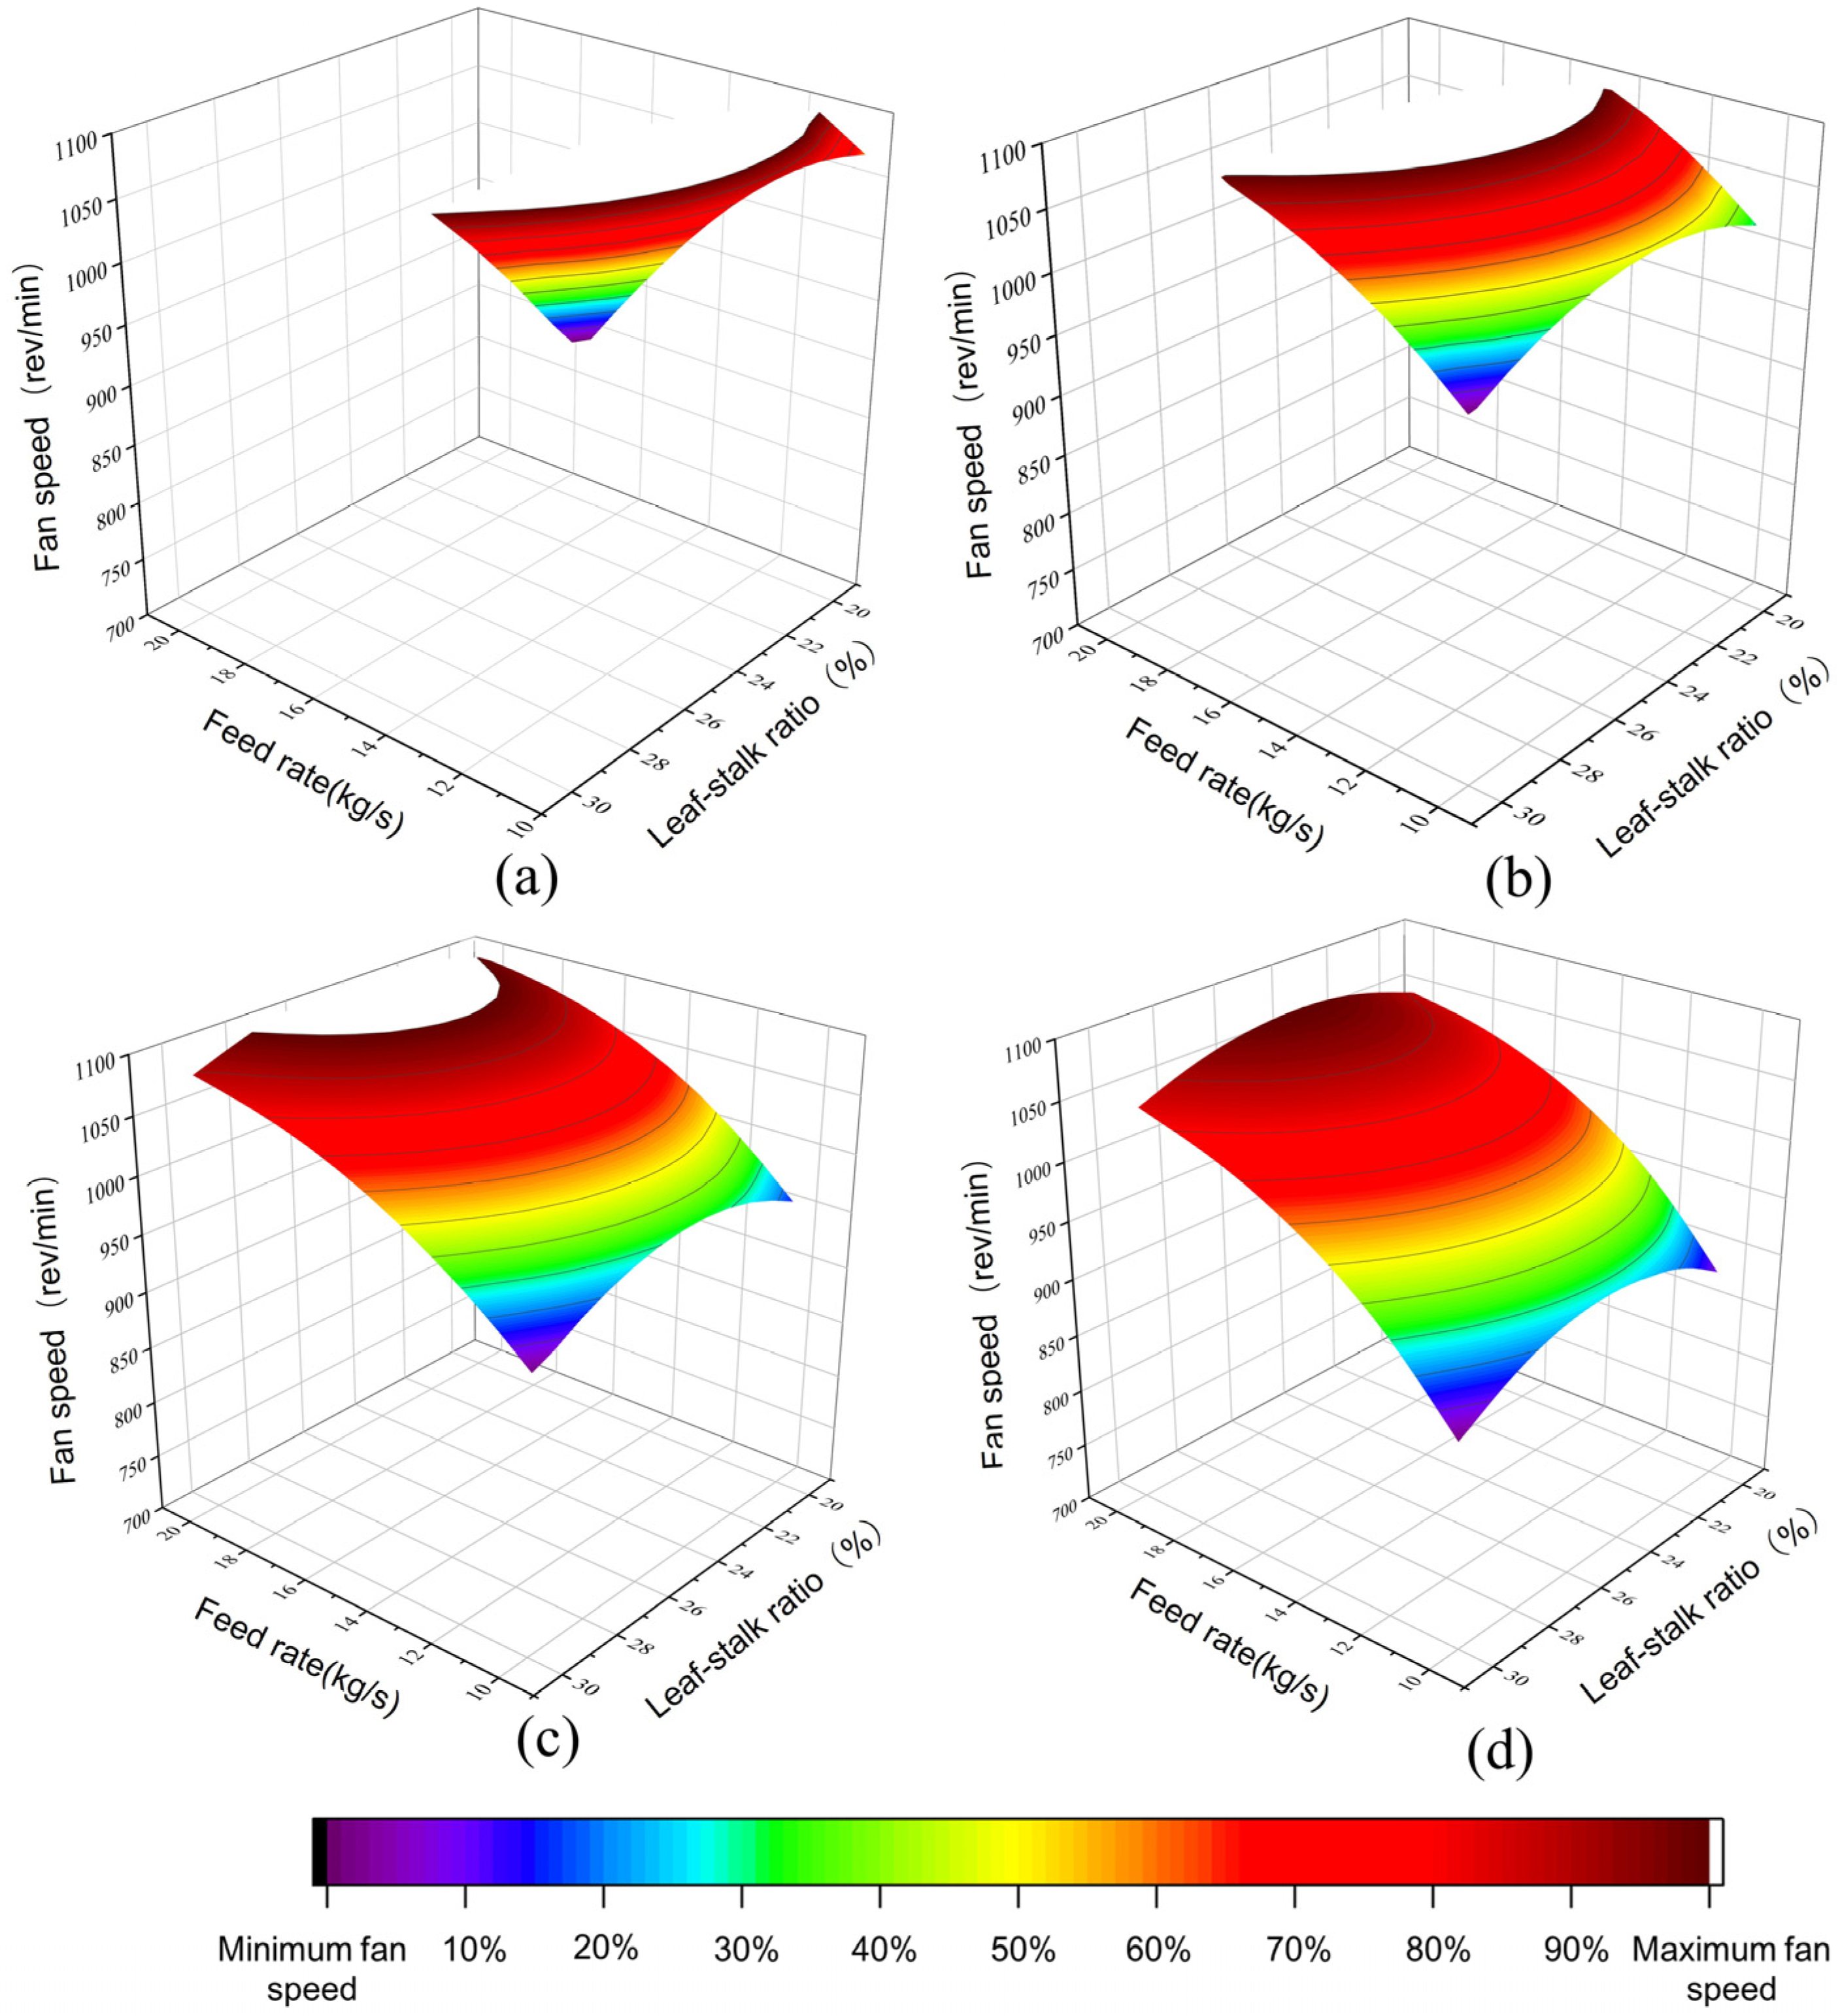
A simulation test was conducted to address the issues of the high-power consumption and high impurity rate of the extractor. The relationship between the impurity rate and the fan speed, leaf–stalk ratio, and feed rate was determined.
(4)
The parameter combinations under different impurity rates were obtained. The fan speed was adjusted according to the feed rate and leaf–stalk ratio, and these models can guide the intelligent harvesting of sugarcane in the future.

Author Contributions

Conceptualization, T.W. and Q.L.; methodology, T.W. and Q.L.; software, F.L., J.H. and Z.Q.; validation, F.L., J.R. and J.H.; formal analysis, T.W. and F.L.; investigation, F.L. and J.R.; resources, F.L. and J.R.; data curation, F.L., J.H. and Z.Q.; writing-original draft preparation, T.W., F.L. and J.R.; writing-review and editing, T.W. and F.L.; visualization, F.L.; supervision, T.W. and F.L.; project administration, T.W.; funding acquisition, T.W. All authors have read and agreed to the published version of the manuscript.

Funding

This work was supported by The National Natural Science Foundation of China (52175227), the Guangdong Basic and Applied Basic Research Fund (2022A1515010680), and the Science and National Sugar Industry Technology System (CARS-170402).

Institutional Review Board Statement

Not applicable.

Data Availability Statement

The data provided in this study are available upon request from the corresponding author.

Conflicts of Interest

The authors declare no conflicts of interest.

References

  1. Huo, P.; Ma, S.; Su, C.; Ding, Z.; Li, W.; Qian, J.; Li, L.; Li, Y.; Zhou, B.; Peng, C.; et al. Sugarcane leaf-stalk separating technology: A critical review. Biosyst. Eng. 2023, 228, 120–148. [Google Scholar] [CrossRef]
  2. Ren, J.; Wu, T.; Liu, Q.; Mo, W.; Li, K. Discrete element simulation modeling method and parameter calibration of billet. J. South China Agric. Univ. 2022, 43, 124–132. [Google Scholar]
  3. Xing, H.; Ma, S.; Mo, J.; Zeng, B.; Liang, W.; Li, W.; Wang, F.; Bai, J.; Ding, Z. Optimization and experiment on structural parameters of impeller of extractor of sugarcane harvester. Trans. Chin. Soc. Agric. Eng. 2021, 37, 12–19. [Google Scholar]
  4. Wang, H.; Li, S.; Ma, F.; Li, Z. Pneumatic design of small sugarcane harvester fan. J. Agric. Mech. Res. 2015, 37, 103–107. [Google Scholar]
  5. Wang, F.; Yang, G.; Ke, W.; Ma, S. Effect of sugarcane chopper harvester extractor parameters on impurity removal and cane losses. IFAC-Pap. Online 2018, 51, 292–297. [Google Scholar] [CrossRef]
  6. Kosum, K.; Bun-art, S. Factors affecting the amount of impurities when harvesting produced sugarcane with sugarcane harvester. IOP Conf. Ser. Earth Environ. Sci. 2019, 301, 012017. [Google Scholar] [CrossRef]
  7. Wu, T.; Liang, X.; Liu, Q.; Zhang, Z.; Xu, H.; Huang, J.; Li, J.; Zou, X. Chopper Sugarcane Combine Harvester with Middle-Mounted Primary Extractor. Sugar Technol. 2020, 22, 589–595. [Google Scholar] [CrossRef]
  8. Wu, T.; Ren, J.; Liu, Q.; Zou, X.; Zhang, Z.; Zhou, S.; Feng, J.; He, L. Development of 4GDZ-132 sugarcane chopper combine harvester. Trans. Chin. Soc. Agric. Eng. 2022, 38, 30–38. [Google Scholar]
  9. Viator, R.; Richard, E.; Viator, B.; Jackson, W.; Waguespack, H.; Birket, H. Sugarcane chopper harvester extractor fan and ground speed effects on yield and quality. Appl. Eng. Agric. 2007, 23, 31–34. [Google Scholar] [CrossRef]
  10. El-Emam, M.; Zhou, L.; Shi, W.; Han, C.; Bai, L.; Agarwal, R. Theories and Applications of CFD–DEM Coupling Approach for Granular Flow: A Review. Arch. Comput. Methods Eng. 2021, 28, 4979–5020. [Google Scholar] [CrossRef]
  11. Li, H.; Li, Y.; Gao, F.; Zhao, Z.; Xu, L. CFD–DEM simulation of material motion in air-and-screen cleaning device. Comput. Electron. Agric. 2012, 88, 111–119. [Google Scholar] [CrossRef]
  12. Xu, L.; Li, Y.; Chai, X.; Wang, G.M.; Liang, Z.; Li, Y.; Li, B. Numerical simulation of gas–solid two-phase flow to predict the cleaning performance of rice combine harvesters. Biosyst. Eng. 2020, 190, 11–24. [Google Scholar] [CrossRef]
  13. Ding, B.; Liang, Z.; Qi, Y.; Ye, Z.; Zhou, J. Improving cleaning performance of rice combine harvesters by DEM–CFD coupling technology. Agriculture 2022, 12, 1457. [Google Scholar] [CrossRef]
  14. Yuan, J.; Li, H.; Qi, X.; Hu, T.; Bai, M.; Wang, Y. Optimization of airflow cylinder sieve for threshed rice separation using CFD-DEM. Eng. Appl. Comput. Fluid Mech. 2020, 14, 871–881. [Google Scholar] [CrossRef]
  15. Zhao, L.; Chen, L.; Yuan, F.; Wang, L. Simulation study of rice cleaning based on DEM-CFD coupling method. Processes 2022, 10, 281. [Google Scholar] [CrossRef]
  16. Tang, H.; Xu, C.; Zhao, J.; Wang, J. Stripping mechanism and loss characteristics of a stripping-prior-to-cutting header for rice harvesting based on CFD-DEM simulations and bench experiments. Biosyst. Eng. 2023, 116–136. [Google Scholar] [CrossRef]
  17. Li, Y.; Xu, Y.; Cui, T.; Zhang, D.; Fan, H.; Gao, X.; Su, Y.; Qiao, M.; Song, Z. Improving particle dispersion characteristics with a novel cleaning screen: Parameter design and numerical simulation. Powder Technol. 2022, 397, 116987. [Google Scholar] [CrossRef]
  18. Dai, F.; Xu, P.; Yuan, Z.; Shi, R.; Zhao, Y.; Song, X.; Zhao, W. Simulation and optimization experiment: Working process of a cleaning device for flax combine harvester. Agriculture 2023, 13, 2123. [Google Scholar] [CrossRef]
  19. Guo, W.; Yang, W.; Wen, X.; Yang, J.; Mo, J.; Zeng, B.; Nong, H. Research on simulation modeling method for debris removal of sectional sugarcane harvester. Agric. Mech. Res. 2020, 42, 6–12. [Google Scholar]
  20. Xing, H.; Ma, S.; Wang, F.; Bai, J.; Hu, J. Structure optimization and experiment of sugarcane chopper harvester extractor. Trans. Chin. Soc. Agric. Eng. 2020, 36, 67–75. [Google Scholar]
  21. Xing, H.; Ma, S.; Li, W.; Wang, F.; Bai, J.; Hu, J. Improving the performance of a sugarcane harvester extractor using design changes validated by computational fluid dynamic modelling and experiment. Biosyst. Eng. 2022, 124–138, 1537–5110. [Google Scholar] [CrossRef]
  22. Zhou, B.; Ma, S.; Li, W.; Li, W.; Peng, C. Study on the influence mechanism of energy consumption of sugarcane harvester extractor by fluid simulation and experiment. Agriculture 2023, 13, 1726. [Google Scholar] [CrossRef]
  23. Xing, H.; Ma, S.; Wang, F.; Bai, J.; Ma, J. Aerodynamic performance evaluation of sugarcane harvester extractor based on CFD. Sugar Technol. 2021, 23, 627–633. [Google Scholar] [CrossRef]
  24. Ren, J.; Wu, T.; Liu, Q.; Zou, X.; Li, K. Design and test of the structure of extractor negative pressure zone of sugarcane chopper harvester. Agronomy 2022, 12, 2336. [Google Scholar] [CrossRef]
  25. Xie, F.; Ou, Y.; Liu, Q.; Zou, X.; Feng, J. Design and experiment of trash discharging fan of sugarcane harvester. Trans. Chin. Soc. Agric. Eng. 2012, 28, 8–14. [Google Scholar]
  26. Yan, J.; Biao, X.; Bai, J.; Zheng, Y.; Zhao, S.; Liu, N.; Zhang, Q. Discrete element simulation of the grain mixing law in brown rice germination device. Int. J. Agric. Biol. Eng. 2024, 17, 41–48. [Google Scholar] [CrossRef]
  27. Goudarzi, N. Computational fluid dynamics methods for wind turbines performance analysis. In Advanced Wind Turbine Technology; Hu, W., Ed.; Springer International Publishing: Cham, Switzerland, 2018; Volume 2, pp. 47–57. [Google Scholar]
  28. Ma, H.; Zhou, L.; Liu, Z.; Chen, M.; Xia, X.; Zhao, Y. A review of recent development for the CFD-DEM investigations of non-spherical particles. Powder Technol. 2022, 412, 117972. [Google Scholar] [CrossRef]
  29. GB/T 10178-2006; Industrial Fans—Performance Testing In Situ. General Administration of Quality Supervision, Inspection and Quarantine of the People’s Republic of China. Standardization Administration of China: Beijing, China, 2006.
  30. Huang, W.; Zeng, B.; Mo, J.; Yang, Z.; Zhang, X.; Mo, F. Comparative Experiment Research of Mechanized Harvesting Newly Planted Cane and Ratoon Cane. Mod. Agric. Equip. 2020, 41, 27–32. [Google Scholar]
  31. Ren, J.; Wu, T.; Mo, W.; Li, K.; Hu, P.; Xu, F.; Liu, Q. Discrete Element Simulation Modeling Method and Parameters Calibration of Sugarcane Leaves. Agronomy 2022, 12, 1796. [Google Scholar] [CrossRef]
  32. JB/T 6275-2019; Sugarcane Combine Harvester. The Ministry of Industry and Information Technology of the People’s Republic of China: Beijing, China, 2019.
  33. Fan, C.; Zhang, D.; Yang, L.; Cui, T.; He, X.; Dong, J.; Zhao, H. Power consumption and performance of a maize thresher with automatic gap control based on feed rate monitoring. Biosyst. Eng. 2022, 216, 147–164. [Google Scholar] [CrossRef]
  34. Sun, Y.; Liu, R.; Zhang, M.; Li, M.; Zhang, Z.; Li, H. Design of feed rate monitoring system and estimation method for yield distribution information on combine harvester. Comput. Electron. Agric. 2022, 201, 107322. [Google Scholar] [CrossRef]
  35. Jie, Z.; Zhou, X. Study on Mathematical Model of Feed Quantity Sensor Measuring. J. Agric. Mach. 2001, 32, 53–55. [Google Scholar]
Figure 1. The harvesting process and extractor structure of the 4GDZ-132 sugarcane chopper harvester. 1—Hydraulic motor. 2—Transmission shaft. 3—Hood 4—Fan blade. 5—Fan chamber. 6—Impurity separation chamber.
Agriculture 14 01392 g001
Figure 2. Structure diagram of cleaning system test bench. I—Feed rollers and chopper. II—Extractor. III—Elevator.
Agriculture 14 01392 g002
Figure 3. Simulation model of the extractor. 1—Outlet zone. 2—Fan blade zone. 3—Material separation zone. 4—Material throwing area.
Agriculture 14 01392 g003
Figure 4. The relationship between the number of meshes and the velocity of the airflow at the outlet surface.
Agriculture 14 01392 g004
Figure 5. The layout schematic of the measuring points and the actual setting.
Agriculture 14 01392 g005
Figure 6. Test and simulated flow results at different speeds.
Agriculture 14 01392 g006
Figure 7. DEM modeling of billets and leaves. (a) Billet simulation model. (b) Leaf simulation model.
Agriculture 14 01392 g007
Figure 8. Conduct tests performed using the test bench.
Agriculture 14 01392 g008
Figure 9. Gas–solid coupling simulation test.
Agriculture 14 01392 g009
Figure 10. Test and simulated impurity rate results at different fan speeds.
Agriculture 14 01392 g010
Figure 11. The position of Section 2.
Agriculture 14 01392 g011
Figure 12. Cloud diagram of airflow velocity distribution at different fan speeds.
Agriculture 14 01392 g012
Figure 13. Cloud diagram of total pressure at different fan speeds.
Agriculture 14 01392 g013
Figure 14. Movement of billets and leaves and the process of separating them. (a) The state of billets and leaves only in the material throwing area; (b) the state of billets and leaves entering the impurity removal chamber and undergoing material separation; (c) the state when part of the leaves starts to be discharged from the extractor; and (d) the state when part of the leaves have fallen with the billet.
Agriculture 14 01392 g014
Figure 15. Parameter matching graph for targets with different impurity rates. (ad) The parameter combinations for the extractor under the target of impurity rates of 5%, 6%, 7%, and 8%, respectively.
Agriculture 14 01392 g015
Table 1. The parameters of the key components of the extractor.
ParametersValue
Impeller diameter/mm954
Impeller width/mm124
Number of leaves3
Blade installation angle/°38.04
Incoming trending area/m20.386
The trending area/m20.344
Speed range/(rev/min)0–1200
Table 2. Basic physical parameters of the sugarcane materials.
MaterialPropertyMeanStandard Deviation
BilletGeometric dimensions/
(L × Φ)/mm × mm
250.3 × 32.043.20 × 2.41
Density/g·cm−31.030.03
Moisture content/%72.505.01
Suspension speed/(m/s)9.920.473
LeafGeometric dimensions/
(L × W × H)
/mm × mm × mm
250.30 × 36.89 × 0.4010.23 × 12.66 × 1.20
Density/g·cm−30.380.07
Moisture content/%10.330.97
Suspension speed/(m/s)3.6550.34
Whole caneLeaf–stalk ratio/%253.00
Table 3. Discrete element simulation parameters of materials. (a). Material’s own parameters. (b). Contact parameters between materials.
(a)
MaterialPoisson’s
Ratio
Shear Modulus
/MPa
Density
/g·cm−3
Billet0.3510.8×1041.03
Leaf0.303000.38
Steel0.307.9×1047.85
(b)
MaterialRecovery
Coefficient
Static Friction
Coefficient
Dynamic Friction
Coefficient
Billet–billet0.450.530.04
Billet–steel0.450.350.03
Leaf–leaf0.0020.210.05
Leaf–steel0.0030.30.03
Table 4. Simulation test factors and levels.
LevelsTest Factors
A/(rev/min)B/(kg/s)C/%
−17001020
09001525
111002030
Table 5. Simulation scheme and results.
NO.Test FactorsTest Indicators
A/(rev/min)B/(kg/s)C/%Y/%
1−1−1−19.2
2−1−109.6
3−1−1110
4−10−111.1
5−10013.3
6−10112.5
7−11−113.2
8−11013.4
9−11112.7
100−1−17.6
110−108.4
120−117.5
1300−19.3
1400010.4
150018.9
1601−110.3
1701012.4
1801111.5
191−1−15.3
201−104.1
211−113.7
2210−16.3
231006.5
241015.5
2511−16.7
261107.1
271116.7
Table 6. Analysis of variance of a regression model with impurity rate as the test indicator.
Source of VarianceSum of SquaresDegrees of FreedomMean SquareFp
Model213.16923.6867.34<0.0001 **
A156.641156.64445.38<0.0001 **
B45.44145.44129.2<0.0001 **
C01001
AB0.800810.80082.280.1497
AC1.411.43.980.0622
BC0.213310.21330.60660.4468
A24.5614.5612.980.0022 **
B21.2511.253.540.0771
C22.8512.858.10.0112 *
Residual5.98170.3517
Sum219.1426
R2 = 0.9727R2adj = 0.9583CV = 6.58%Adequate Precision = 28.3766
Where: ** means extremely significant (p < 0.01); * means significant (0.01 < p < 0.05).
Disclaimer/Publisher’s Note: The statements, opinions and data contained in all publications are solely those of the individual author(s) and contributor(s) and not of MDPI and/or the editor(s). MDPI and/or the editor(s) disclaim responsibility for any injury to people or property resulting from any ideas, methods, instructions or products referred to in the content.

