Article

The Crop Phosphorus Uptake, Use Efficiency, and Budget under Long-Term Manure and Fertilizer Application in a Rice–Wheat Planting System

Key Laboratory of Fertilization from Agricultural Wastes, Ministry of Agriculture and Rural Affairs, Institute of Plant Protection and Soil Fertilizer, Hubei Academy of Agricultural Sciences, Wuhan 430064, China
*
Author to whom correspondence should be addressed.
Agriculture 2024, 14(8), 1393; https://doi.org/10.3390/agriculture14081393 (registering DOI)
Submission received: 15 July 2024 / Revised: 15 August 2024 / Accepted: 16 August 2024 / Published: 18 August 2024
(This article belongs to the Section Agricultural Soils)

Abstract

:
Little is known about the effect of the long-term application of organic and inorganic fertilizers on P-use efficiency, P budget, and the residual effect of P fertilizer. To clarify the effect of different fertilization on soil P balance in a rice (Oryza sativa L.)–wheat (Triticum aestivum L.) rotation system is helpful to promote the sustainable development of agriculture. Thus, a thirty-five-year fertilizer experiment was conducted with eight treatments, including an unfertilized control (CK); chemical nitrogen (N), phosphorus (P), and potassium (K) fertilizers; and organic manure (M) either alone or in combination treatments (N, NP, NPK, M, MN, MNP, and MNPK). The results indicated that crop yields and P uptake were higher in the combined application of manure and chemical fertilizer treatments than in the manure or chemical fertilizer alone treatments. Soil P budget indicated a 23.4–55.4 kg P ha−1 yr−1 surplus in the organic combined with or without mineral fertilizer treatments, but the soil P budget indicated a 20.0 and 21.9 kg P ha−1 yr−1 deficit in the control and N treatments. The proportion of residual fertilizer P converted to soil available P in NP, NPK, M, MN, MNP, and MNPK treatments was 4.5%, 4.8%, 19.1%, 19.0%, 11.5%, and 13.3%, respectively, over a 35-year period. Furthermore, according to the higher P content and crop uptake in organic manure treatment compared with chemical P fertilizer alone, an organic addition could effectively reduce the use of chemical fertilizer and become an effective way of sustainable development in practice. Therefore, the combined application of organic and inorganic fertilizer will be a practical method to increase crop yields and soil P status in a rice–wheat planting system.

1. Introduction

Phosphorus (P), a critical plant macronutrient, is one of the main crop nutrient elements, and its application for farmland soil is vital to achieve optimum crop yields [1,2,3,4]. Worldwide, almost 5.7 billion hectares of farmland are phosphorus deficient [5]. At present, the P supply in cultivated soil depends on the application of chemical fertilizer. However, P is a nonrenewable resource that is depleted daily worldwide [6]. Therefore, changes in the soil P concentration, conversion of P forms, and P bioavailability have attracted attention in recent decades [7]. Phosphorus deficiency substantially affects plant growth and reduces crop yields [8]. However, in recent decades, the excessive application of phosphate fertilizer in the soil in pursuit of higher crop yields has raised some environmental problems. Soil P accumulation increases the risk of P loss to the surface and underground water and is accompanied by non-point source water pollution and eutrophication, which has adverse effects on aquatic ecosystems [6,9]. The reserves of exploitable phosphate rock resources are decreasing and are predicted to be depleted in the next 100 years. Therefore, for environmental and economic reasons, appropriate field management measures are needed to improve soil fertility. Farmland nutrient management is of great significance to improve soil nutrient availability and maintain high yields. The combined application of organic and inorganic fertilizers is becoming an effective way for nutrient management in farmland. [6,10,11]. Studies have shown that organic fertilizer application can change the physical, chemical, and biological fertility of soil, owing to its abundance in organic matter and microorganisms [12,13,14,15]. The combined application of organic and inorganic fertilizer can improve the utilization rate of inorganic P fertilizer, which is attributed to the decreasing P in soil colloid [16]. Studies have shown that the long-term combined application of organic and inorganic fertilizers can significantly increase the content of total P and available P, enhance the enrichment and absorption of phosphorus by crops, and improve the utilization rate of phosphate fertilizer [17,18,19,20,21]. However, the effects of different fertilization methods on the phosphorus budget of farmland systems and the ratio of residual fertilizer phosphorus to soil available phosphorus were not enough. The rice–wheat cropping system is the world’s largest farmland production system, accounting for about 15.8 million hectares in South Asia; 123,000 hectares, 22,000 hectares, 8000 hectares, and 5000 hectares in India, Pakistan, Bangladesh, and Nepal, respectively [22,23,24]; and approximately 10.5 million hectares in East Asia. China’s cultivated land is mainly distributed in Jiangsu, Zhejiang, Hubei, Guizhou, Yunnan, Sichuan, and Anhui provinces in South China, accounting for about half of the total area of rice cultivation in China [25]. The rice–wheat cropping system is vital to the food security of China and the livelihood of farmers [26]. However, due to the deterioration of soil health and the lack of organic matter caused by excessive chemical fertilizers, thus, the crop sustainability and productivity are threatened [27]. Therefore, sustainable nutrient management alternatives are needed, especially P, such as the combined application of organic and inorganic fertilizers. This can increase the efficiency of P use, improve soil health, and reduce reliance on chemical fertilizers.
Long-term fertilizer experiments provide essential information to determine the utilization of organic and inorganic P fertilizer to maintain sustainable and stable crop yields [28,29,30]. This will be helpful to the producers for the scientific management of the phosphorus element in this area. In this study, a field experiment was conducted to study the effects of the combined application of organic and inorganic fertilizers on the crop yield, phosphorus uptake, phosphorus budget, and phosphorus transformation of residual fertilizers in a rice–wheat rotation system for 35 consecutive years. The phosphorus utilization efficiency under different fertilization systems was evaluated.

2. Materials and Methods

2.1. Experiment Site and Design

The experimental site is located in the Hubei Province of Central China (30°28′ N, 114°25′ E) with an altitude of 20 m. It is located in the subtropical monsoon region, with an average annual temperature of 16.5 °C and an annual rainfall of 1300 mm. Soil belongs to the soil class of Udalfs (American Soil Taxonomy). Soil initial physical and chemical properties were as follows: pH 6.3, bulk density 1.3 g cm−3, organic carbon 15.9 g kg−1, total N 1.8 g kg−1, total P 1.0 g kg−1, total K 30.2 g kg−1, available P 5.0 mg kg−1, available K 98.5 mg kg−1. More information about this study site can be found in Hu et al. [31] and Han et al. [30].
The field experiment was conducted in a randomized complete block design with 8 treatments and 3 replicates. Briefly, they were as follows: CK, no fertilization as a control; N, single application of N fertilizer; NP, applying inorganic N and P fertilizers; NPK, applying inorganic N, P, and K fertilizers; M, single application of organic fertilizer; MN, applying organic fertilizer and inorganic N fertilizer; MNP, applying organic fertilizer and inorganic N and P fertilizers; and MNPK, applying organic fertilizer and inorganic N, P, and K fertilizers. In the above fertilizers, inorganic N was in the form of urea, and the annual application rate was 150 kg N ha−1. The P fertilizer was in the form of monoammonium phosphate, and the annual application rate was 32.7 kg P ha−1. The K fertilizer was in the form of potassium chloride, and the annual application rate was 125 kg K ha−1. The annual application rate of the organic fertilizer from pig manure compost in all organic fertilizer treatments was 22,500 kg ha−1, equivalent to 105 kg N ha−1, 63 kg P ha−1, and 79 kg K ha−1. There were 24 plots with three replicates for each treatment, and the area of each plot was 40 m2.
In addition to different fertilizer inputs, each treatment had the same environmental conditions and conducted the same agronomic measures. The crops were rice and wheat rotation; rice was planted from June to September, and wheat was planted from November to May. A total of 60% of the inorganic fertilizer was applied to the rice growing season, and the remaining 40% was applied to the wheat growing season. Organic fertilizer was applied to two crops at an average ratio of 1:1. Two-fifths of the N fertilizer was applied at the time of transplantation, two-fifths of N was applied during the tilling stage, and the remaining one-fifth of N was applied during the booting stage in the rice growing season. Half of the N fertilizer was applied at the time of sowing, one-fourth of the N was applied during the wheat seedling stage, and the remaining one-fourth of the N was applied during the jointing stage in the wheat growing season. Detailed application amounts of chemical fertilizers and manure were shown in Table 1.

2.2. Yield Monitoring, Sampling, and Laboratory Analysis

Every year, rice and wheat grains and straw were manually harvested using a sickle in May and September. Crop grains were threshed from straws with threshing machines. Grain yields and straws biomass were recorded after sun-drying from the whole plot. Crop straws were removed from the field after threshing, and crop stubbles were remained. The grain and straw of some crops were dried in an oven at 65 °C for 72 h. After grinding, they were sieved with 0.5 mm sieve to determine the total N, P, and K contents in plant tissues. Crop grain, straw, and organic manure samples were digested with H2SO4-H2O2. The micro-Kjeldahl, molybdenum-blue colorimetric, and flame photometry method were used to analyze the N, P, and K concentrations of digesting solution, respectively [32,33,34].
After rice harvest, soil samples were taken from each plot every year, and the soil samples were composed of 10 mixed soil cores (0–15 cm). Soil samples were stored in plastic bags and dried at room temperature for 14 days. The samples were grinded through 2 mm sieve, and the contents of available phosphorus, available potassium, and soil pH were analyzed. In order to determine the concentration of soil organic carbon and total nitrogen, the samples were ground and sieved with 0.25 mm sieve. The soil organic carbon content was determined by potassium dichromate external heating method [35]. Soil total N and alkaline-hydrolysable N concentrations were analyzed with the micro-Kjeldahl method and alkaline-hydrolysable diffusion method, respectively [31]. The 0.5 mol L−1 NaHCO3 (soil: solution = 1:20) extracted for soil available P and soil available P concentration were determined with the Olsen method [36]. The 1 mol L−1 NH4Ac (soil: solution = 1:10) extracted for soil available K and soil available K concentration were analyzed with the flame photometry method [37]. A glass electrode was used to determine to soil pH with a 0.01 mol L−1 CaCl2 slurry (soil: solution = 1:2.5). All the data are expressed on the basis of dry mass.

2.3. Data Processing

2.3.1. Calculation of P Uptake

Puptake in rice (kg P ha−1 yr−1) and Puptake in wheat (kg P ha−1 yr−1) are the harvestable phosphorus amount of rice and wheat for each treatment every year. Yieldrice-straw (kg ha−1), Yieldwheat-straw (kg ha−1), Yieldrice-grain (kg ha−1), and Yieldwheat-grain (kg ha−1) are straw and grain yields of rice and wheat for each treatment every year. Price-straw (g kg−1), Pwheat-straw (g kg−1) , Price-grain (g kg−1), and Pwheat-grain (g kg−1) are the phosphorus concentration of straw and grain of rice and wheat for each treatment every year.
Ptotal uptake = Puptake in rice + Puptake in wheat
Puptake in rice = Yieldrice-straw × Price-straw/1000 + Yieldrice-grain × Price-grain/1000
Puptake in wheat = Yieldwheat-straw × Pwheat-straw/1000 + Yieldwheat-grain × Pwheat-grain/1000

2.3.2. Calculation of P-Use Efficiency

P-use efficiency (PUE, %) was calculated as follows.
PUE = [(Puptake in P added − Puptake in control)/(total Pfertilizer and manure applied)] × 100
Puptake in P added (kg P ha−1 yr−1) is the crop straw and grain P uptake in the added P fertilizer and manure treatments. Puptake in control (kg P ha−1 yr−1) is the crop straw and grain P uptake in the unfertilized control treatment. Pfertilizer and manure applied (kg P ha−1 yr−1) is total applied P amount by chemical fertilizer and manure.

2.3.3. Calculation of Soil P Budget

The P budget was calculated as the difference between the P input into soil from inorganic fertilizer and manure and the output, which mainly included the removal of aboveground P after crop harvest (grain and straw) for each treatment every year. In the present study, the P input amount ignored atmospheric dry and wet deposition, and the P output ignored soil leaching and surface runoff. The straw and grain yields of each crop were recorded from all plots every year. Rice harvestable phosphorus is equal to the rice straw yield multiplied by its phosphorus concentration and the rice grain yield multiplied by its phosphorus concentration. The harvestable phosphorus content of wheat was calculated by the same method.
Pbudget = Pinput − Poutput
Pinput = Pfertilizer + Pmanure
Poutput = Puptake in rice + Puptake in wheat
Pbudget (kg P ha−1 yr−1) is the total P surplus or deficit in the soil of each treatment every year. Pinput (kg P ha−1 yr−1) is the total P amount from chemical fertilizers and manure into the soil of each treatment every year. Poutput (kg P ha−1 yr−1) is the harvestable phosphorus amount from rice and wheat each treatment every year. Pfertilizer (kg P ha−1 yr−1) is the P amount from chemical fertilizer into soil, and Pmanure (kg P ha−1 yr−1) is the P amount from organic manure into soil every year.

2.4. Statistical Analysis

Differences among treatments were analyzed by one-way analysis of variance (ANOVA), and all data were subjected to statistical analysis using the SPSS 20.0 software package (SPSS Inc., Chicago, IL, USA). Least significant difference (LSD) test was used for mean comparison with a probability of 5%. In addition, linear regression analysis was used to estimate the relationships between soil P budget and soil P input amount, soil total P, and Olsen P concentration.

3. Results

3.1. Crop Yield and Biomass

Rice and wheat grain yields and straw biomass are shown in Table 2. On average, the rice grain yield and straw biomass were increased by 30.1–54.3% and 16.4–43.1%, respectively, for the 35-year chemical fertilizer and manure treatments compared with the unfertilized control. Similarly, the average wheat grain yield and straw biomass were increased by 5.9–175.9% and 5.1–168.0%, respectively, for fertilizer and manure treatments compared to the yield of the unfertilized control. On average, the rice grain yield and straw biomass in the manure in combination with chemical fertilizer treatments were 6.3–18.7% and 11.8–17.1% higher, respectively, than those in mineral fertilizer alone treatments. Similarly, the average wheat yield and straw biomass in the manure combined with chemical fertilizer treatments were 36.9–144.9% and 37.8–129.2% higher, respectively, than those in the chemical fertilizer alone treatments. The average rice grain yield was significantly (p < 0.05) higher in the MN, MNP, and MNPK treatments than that in the N, NP, NPK, and M treatments, and the rice grain yield in the N, NP, NPK, and M treatments was significantly (p < 0.05) higher than that in the unfertilized control. The average wheat yield was significantly (p < 0.05) higher in the MN, MNP, and MNPK treatments than the wheat grain yield in the N, NP, NPK, and M treatments, and that in the NP, NPK, and M treatments was significantly (p < 0.05) higher than that in the N and unfertilized control treatments. However, the average wheat grain yield had no significant difference (p > 0.05) between the N and unfertilized control treatments.

3.2. Crop P Concentration and P Uptake

The average phosphorus content and uptake of rice and wheat are shown in Table 3. In all treatments, the average phosphorus content of wheat grain was generally higher than that of rice, but the average phosphorus content of wheat straw was generally lower than that of rice. The P concentration of different plant parts was increased due to the application of P fertilizer and organic fertilizers. Among all treatments, the different plant tissues for both rice and wheat had the maximum P content in the MNPK treatment group. Similarly, the average annual rice and wheat P uptake amounts of different plant tissues were the highest in the MNPK treatment group and were increased with the application of P fertilizer and organic fertilizer. Moreover, the total rice and wheat P uptake amounts of the different plant tissues were significantly (p < 0.05) higher in the manure mixed with chemical fertilizer treatments than in the manure alone or mineral fertilizer alone treatments (Table 3). Total annual crop P uptake amount in the different fertilization treatments ranged from 20.0 to 43.1 kg P ha−1, and the increasing rate ranged from 9.3 to 115.8% compared with the unfertilized control. The average total annual P uptake of crops exhibited the following order: MNPK > MNP > MN > M > NPK > NP > N > CK.

3.3. P-Use Efficiency
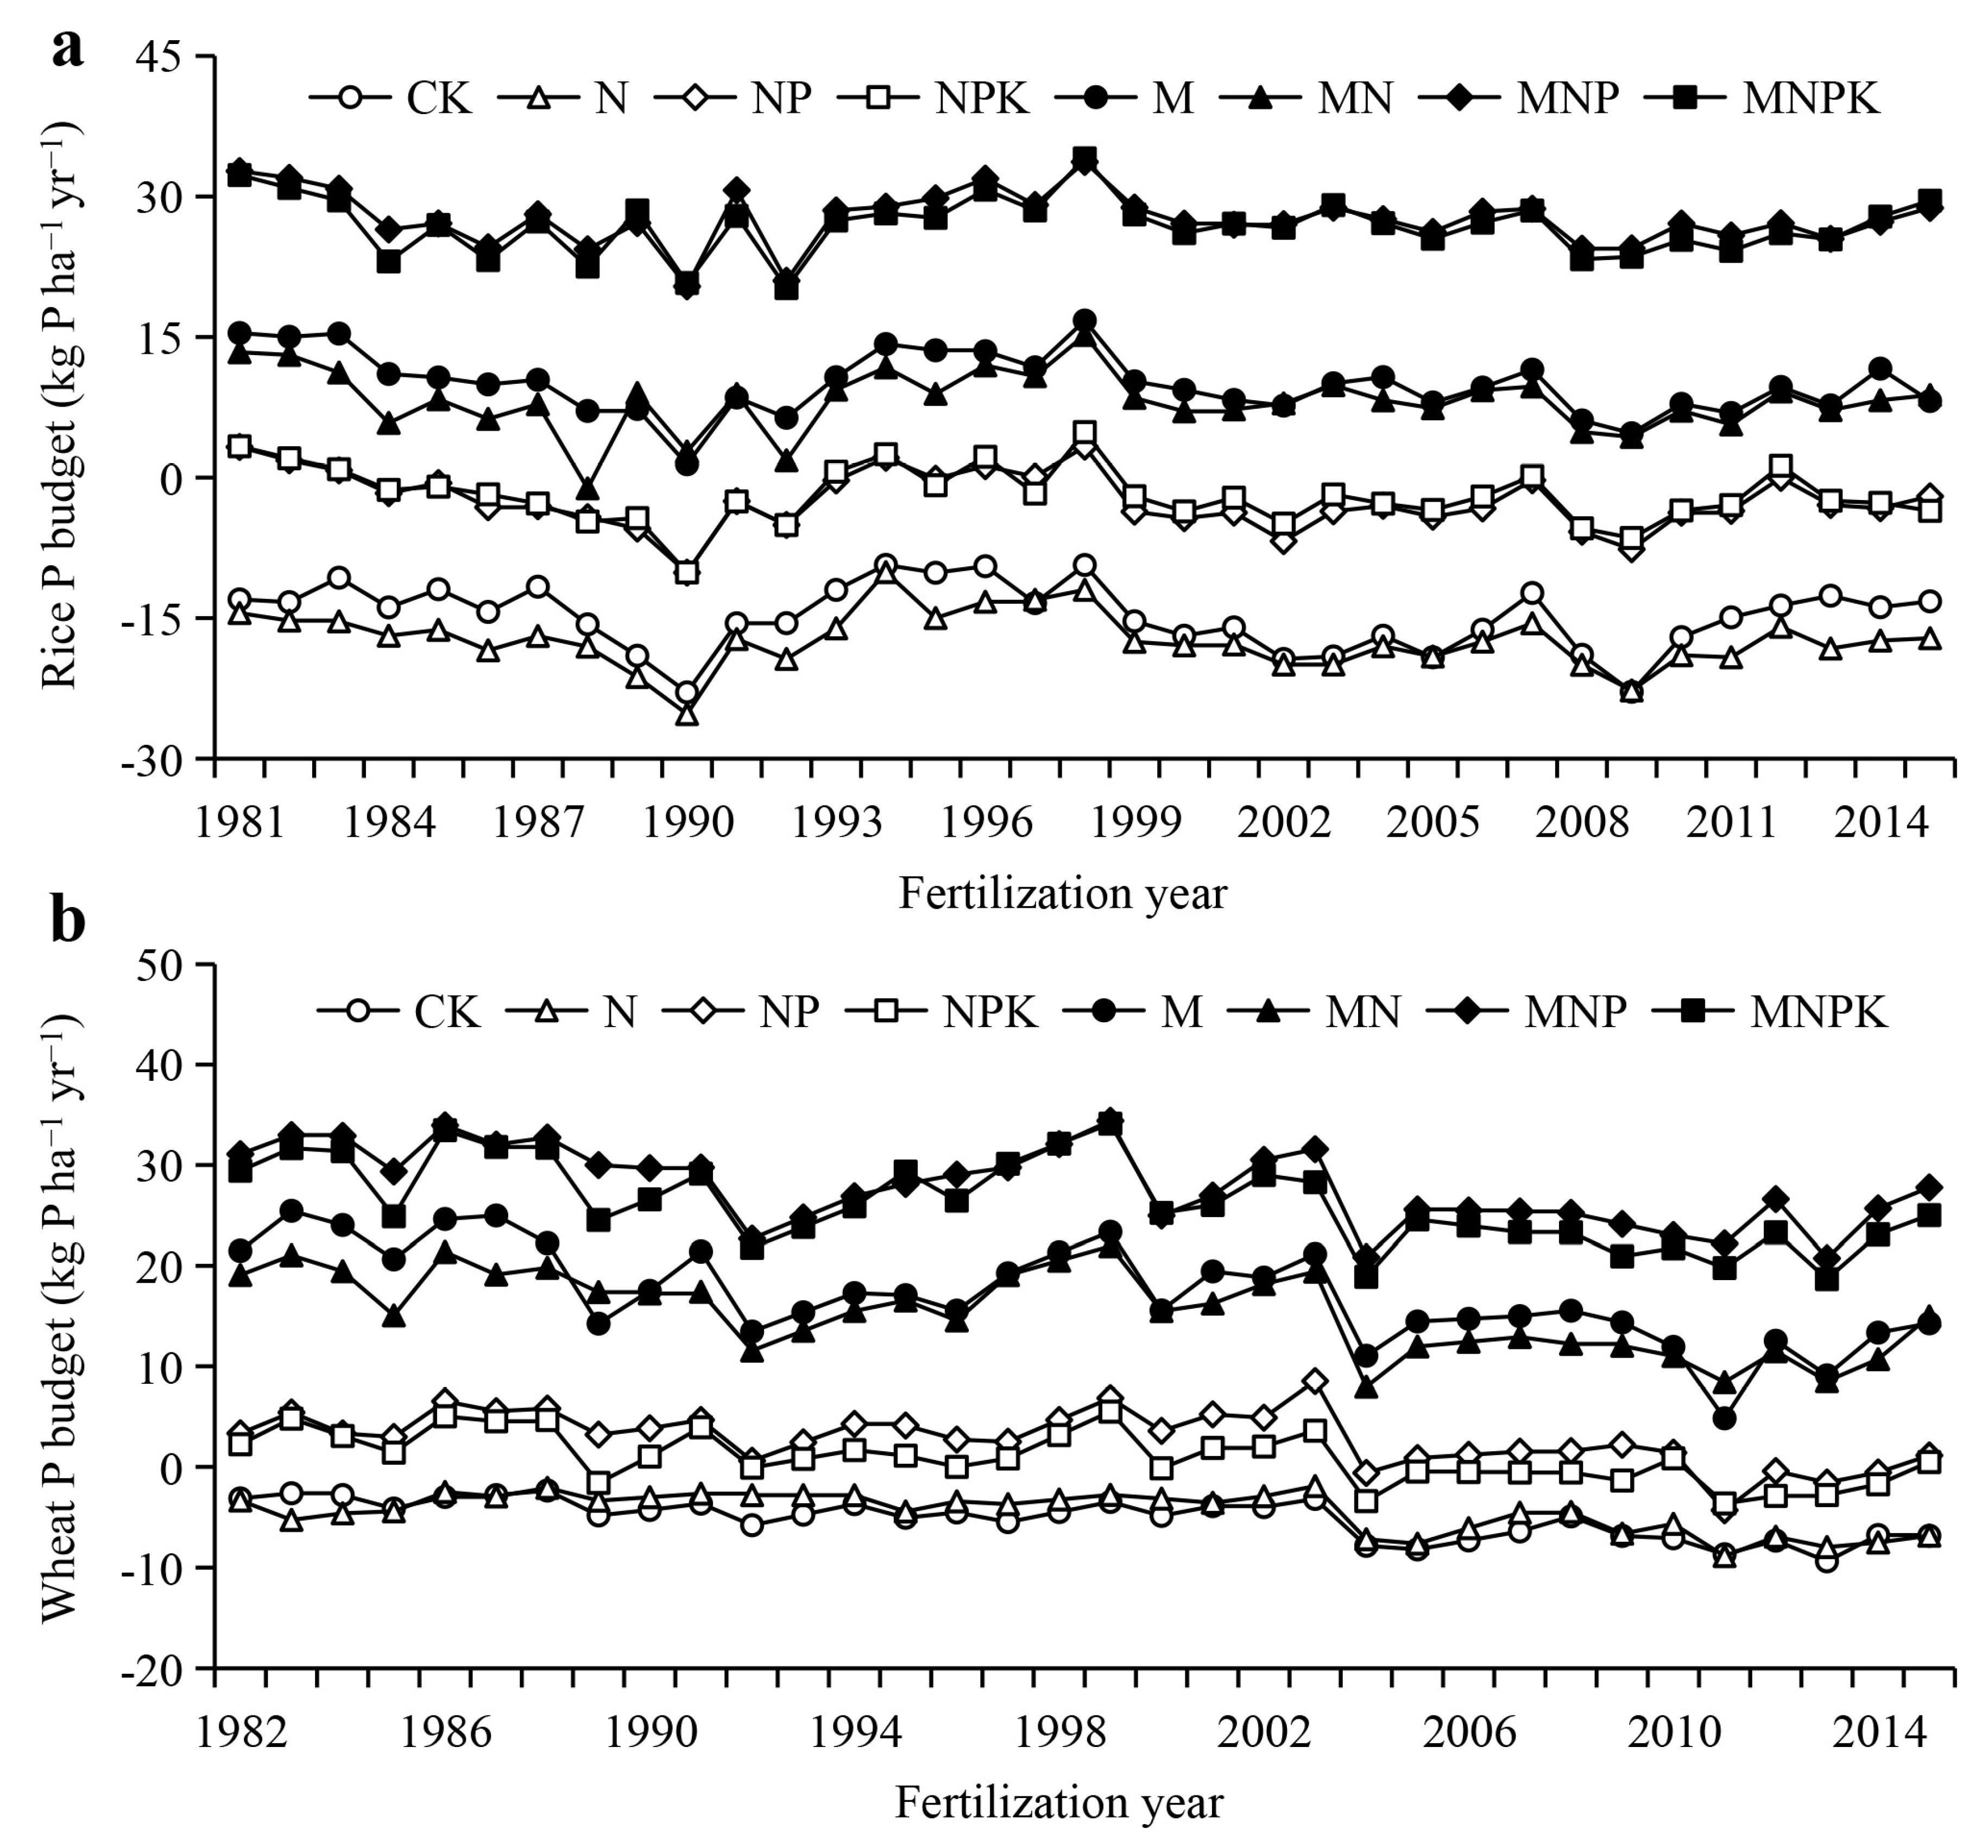
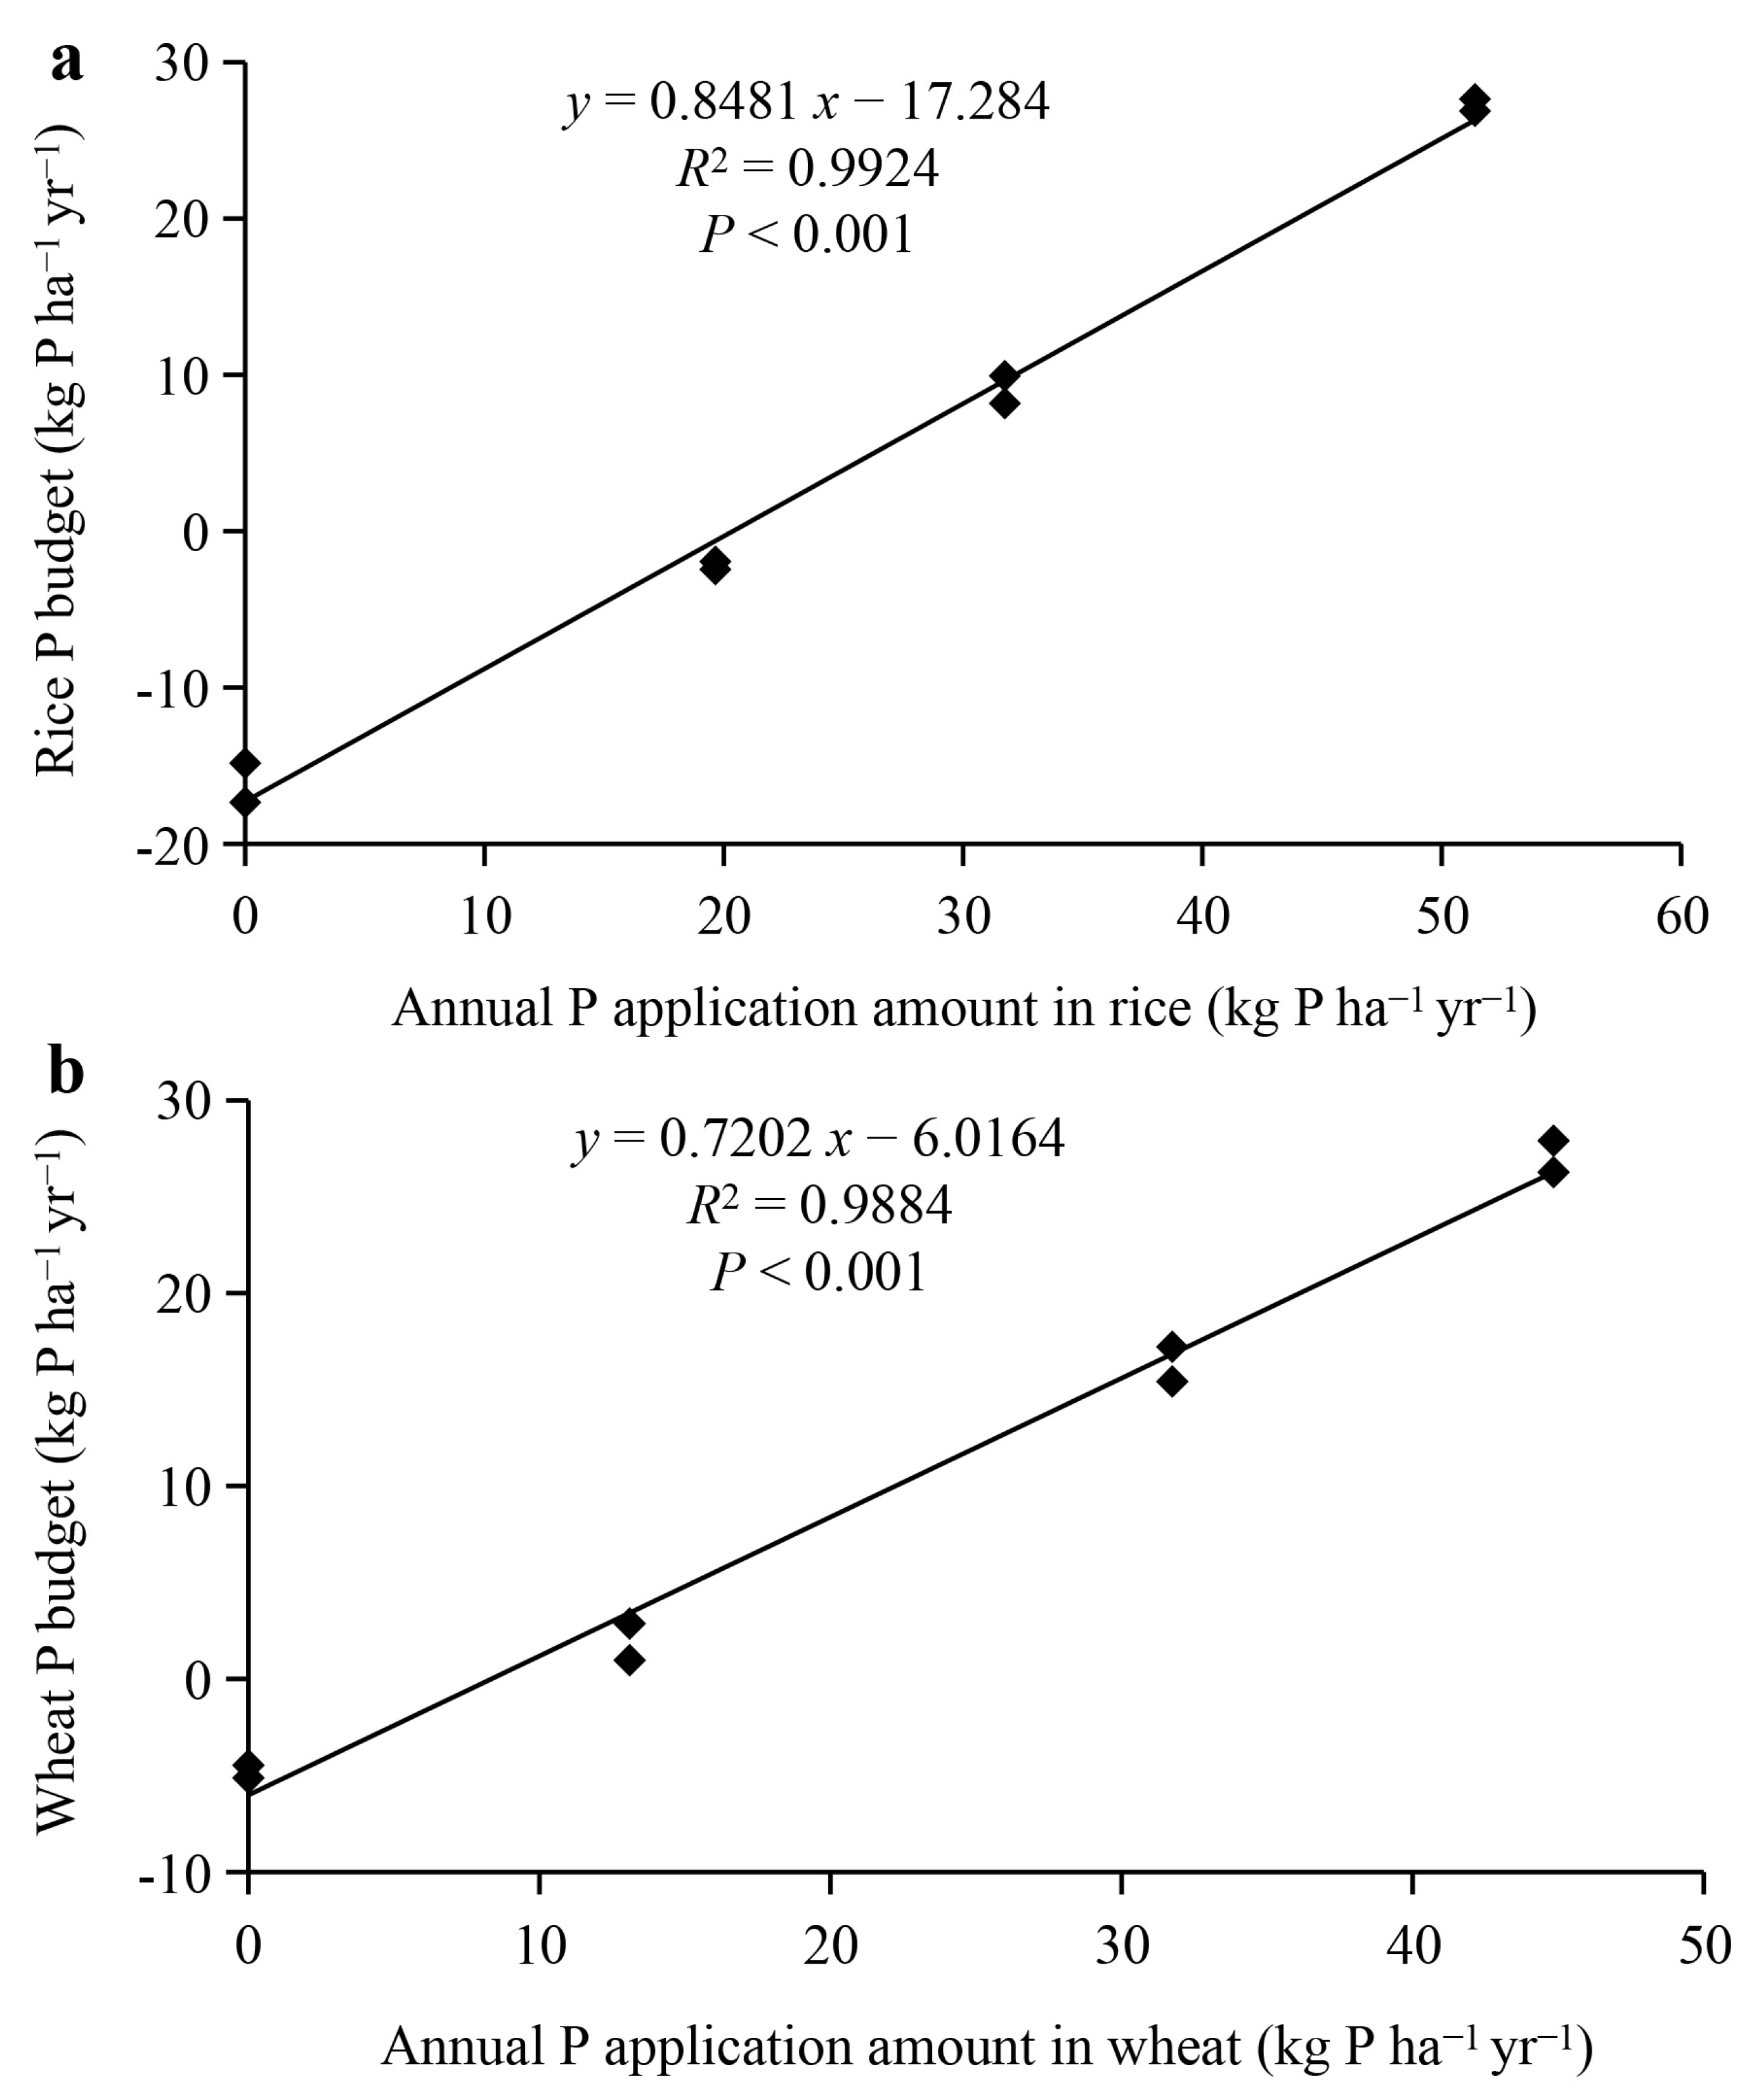
The phosphorus-use efficiency is reflected by the efficiency of P recovered in the rice and wheat crops. The dynamics of P-use efficiency in rice and wheat are shown in Figure 1. On average, the P-use efficiency of rice was 36.8%, 33.8%, 22.0%, 27.2%, 17.2%, and 19.4% and the P-use efficiency of wheat was 37.5%, 50.6%, 28.5%, 34.5%, 25.9%, and 29.1% in the NP, NPK, M, MN, MNP, and MNPK treatments, respectively. The annual crop P-use efficiency was 37.4%, 40.8%, 25.4%, 30.8%, 21.4%, and 24.0% in the NP, NPK, M, MN, MNP, and MNPK treatments, respectively. On average, the P-use efficiency of rice was the highest in the NP alone treatment; however, the P-use efficiency of wheat was the highest in the NPK alone treatment.

3.4. P Budget

The annual soil P surplus or deficit amounts for every treatment in rice and wheat seasons are depicted in Figure 2. The average annual soil P deficit amounts in the rice season were 14.8, 17.3, 2.4, and 1.9 kg P ha−1 yr−1 in the CK, N, NP, and NPK treatments, respectively, and the average annual soil P surplus amounts in the rice season were 9.9, 8.2, 27.7, and 26.9 kg P ha−1 yr−1 in the M, MN, MNP, and MNPK treatments, respectively, during the 35-year period. The average annual soil P deficit amounts in the wheat season were 5.1 and 4.5 kg P ha−1 yr−1 in the CK and N treatments, respectively, and the average annual soil P surplus amounts in wheat season were 2.9, 1.0, 17.2, 15.4, 27.9, and 26.3 kg P ha−1 yr−1 in the NP, NPK, M, MN, MNP, and MNPK treatments, respectively, during the 35-year period. These indicated that the chemical phosphorus fertilizer combined with manure application were overdosed in the present study.

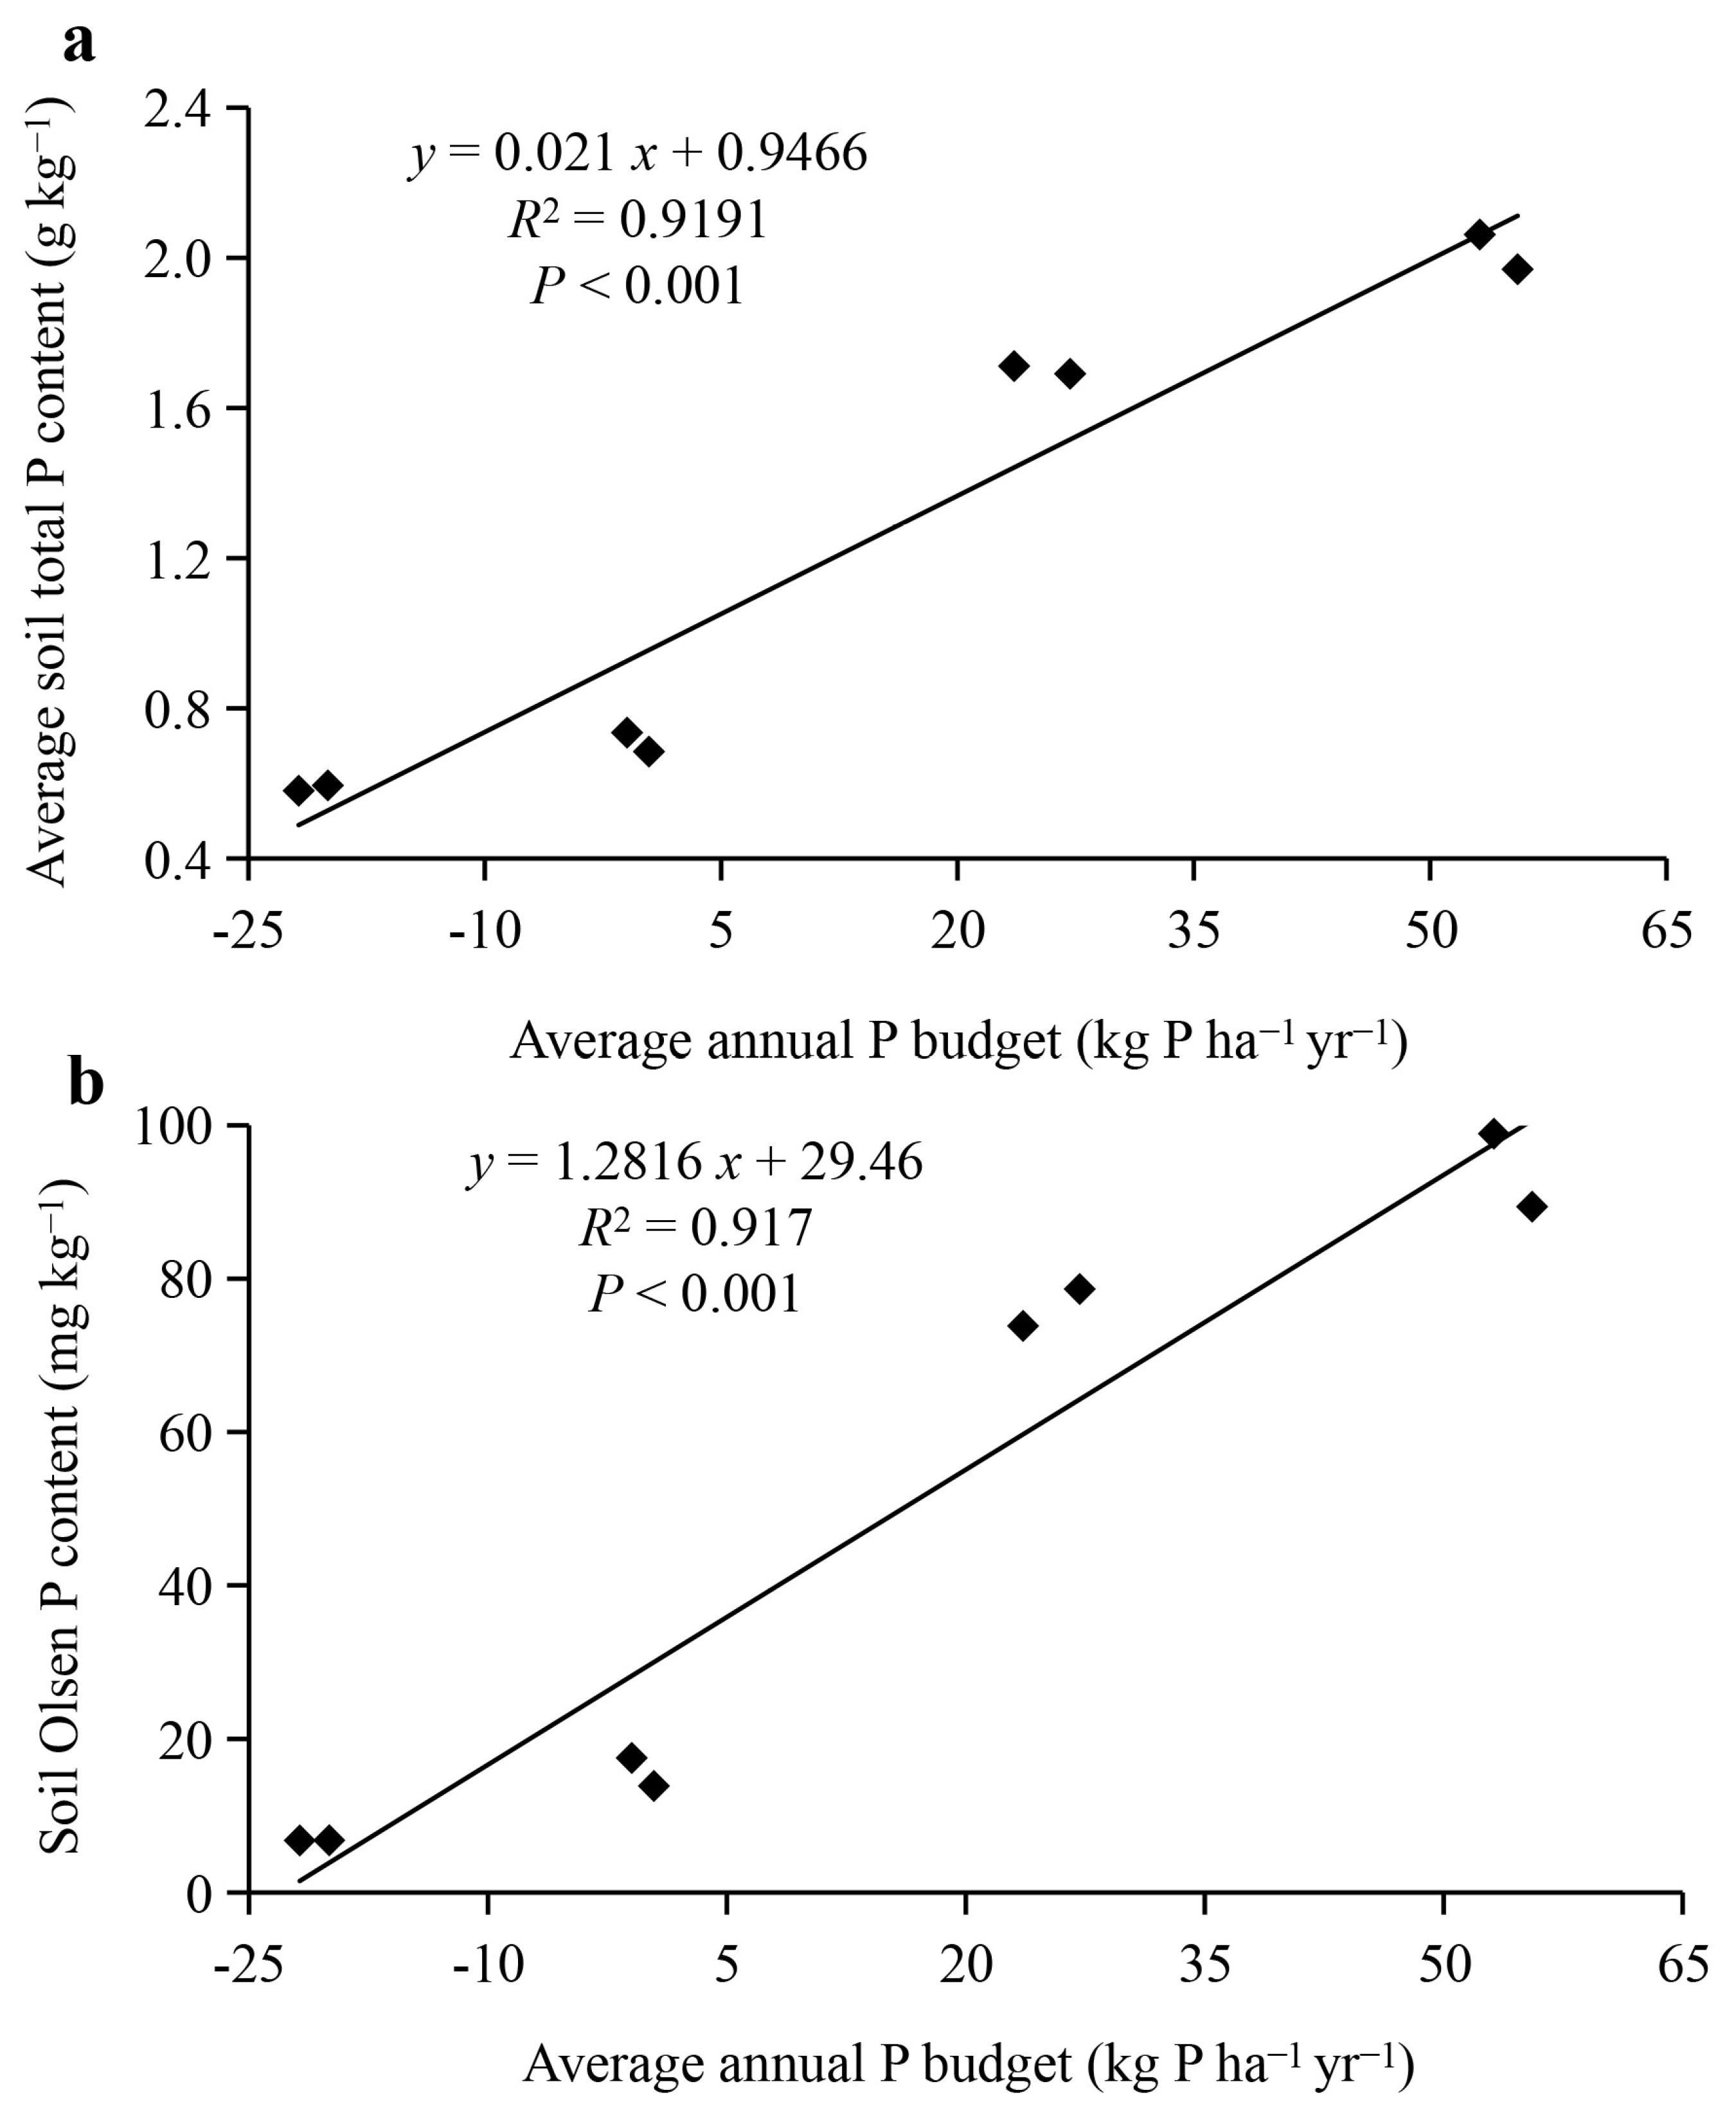
3.5. Changes in Soil Available P and Transformation of Residual Fertilizer P

The addition of P fertilizer and manure improved the available P content in the soil compared with that associated with the CK and N treatments, and furthermore, the manure effect was very obvious. The available soil P content associated with P fertilizer application treatments was 2.3–18.4 times higher than that without P fertilizer use over the 35-year study period. Without P fertilization, the soil available P content was low (<10 mg P kg−1 soil). In comparison, with inorganic P fertilization, the soil available P content was approximately 20 mg P kg−1 soil in the late stage. However, the available soil P content in all the manure treatments exceeded 100 mg P kg−1 soil at the end of the trial. The transformation of residual fertilizer P in soil under different fertilization treatments is shown in Table 4. During the 35-year study period, the proportion of residual fertilizer P converted into soil available P under NP, NPK, M, MN, MNP, and MNPK treatments were 4.5%, 4.8%, 19.1%, 19.0, 11.5%, and 13.3%, respectively. The long-term combined application of manure with chemical NPK fertilizer increased the proportion contrasted with the NPK fertilizer alone use. Moreover, manure alone and manure mixed with N fertilizer significantly increased the proportion compared to the effects of inorganic P fertilizer in combination with manure. Therefore, manure application greatly contributed to increasing the soil available P content.

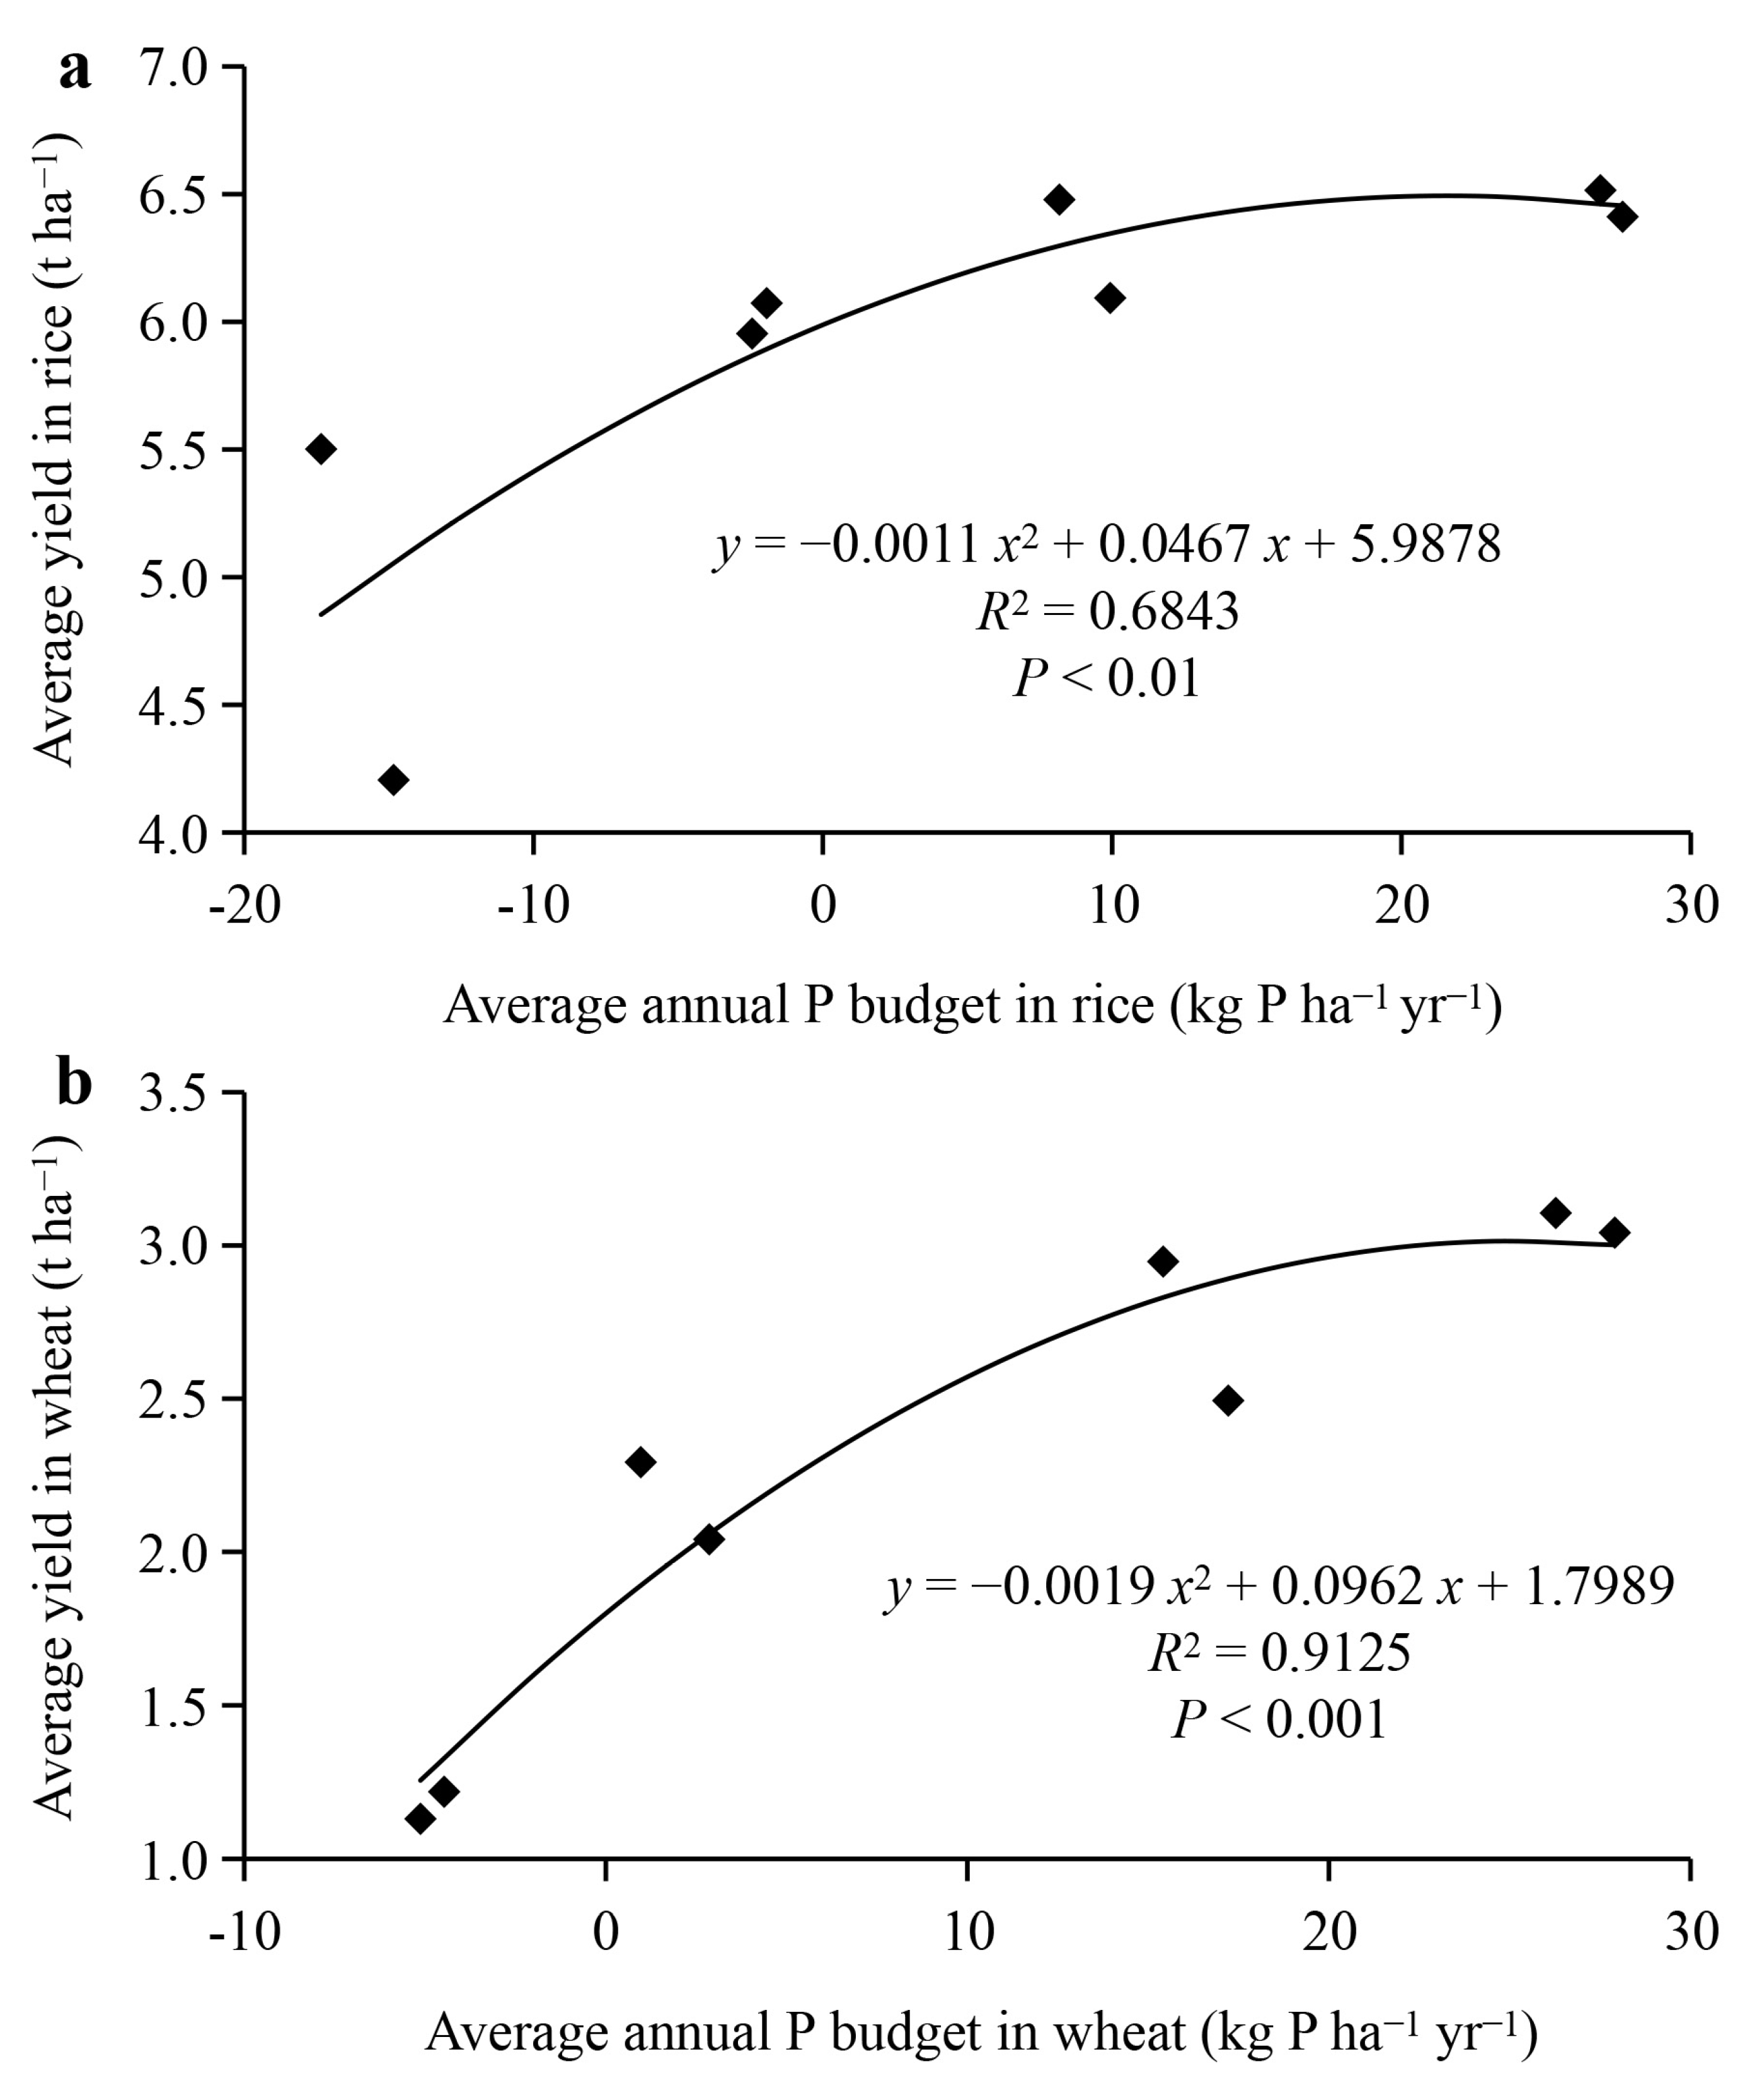
3.6. Relationships Among Soil P Parameters and Crop Yield

A significant (p < 0.001) linear regression was fitted between rice P budget and annual P application amount in the rice growth season (Figure 3a). Similarly, a significant (p < 0.001) linear regression was found between the wheat P budget and annual soil P application amount in the wheat growth season (Figure 3b). The average soil total P content was significantly (p < 0.001) linearly correlated with the average annual P budget (Figure 4a). Similarly, the average soil Olsen P content was significantly (p < 0.001) linearly correlated with the average annual P budget (Figure 4b). The average rice grain yield was significantly (p < 0.01) nonlinearly correlated with the average annual P budget in rice (Figure 5a). Similarly, the average wheat grain yield was significantly (p < 0.001) nonlinearly correlated with the average annual P budget in wheat (Figure 5b).

4. Discussion

4.1. The Effect of Fertilization on Crop Yield and Biomass

Phosphorus deficiency was shown to significantly influence crop grain yields and biomass in the present study, and adding P fertilizer could significantly increase the rice and wheat yield and biomass. Specifically, the average wheat yield and biomass in the NP treatment were increased by 69.3% and 61.5%, respectively, in contrast to the N treatment. The possible reason was primarily that the available soil P content (only 5.0 mg kg−1) was very low before the start of the experiment [19]. The chemical P fertilizer addition improved winter wheat and rapeseed grain yields in Switzerland [2] and enhanced crop yields in the long-term fertilization trial on the Luvic Phaeozem at Halle in Germany [38]. In the rice–wheat double cropping system, organic manure use was more useful for increasing the wheat grain yield and biomass in contrast with that of rice because manure nutrients were slowly released in the seven months of the wheat growth stages. These were consistent with the findings reported by Wang et al. [39] and Shen et al. [40] in the rice–wheat agroecosystem of China. Crop yields and biomass were increased due to the long-term addition of organic manure and chemical fertilizer, which was similar to the previous observations [41]. For instance, Wang et al. [39] reported that rice grain yields in the NPK and MNPK treatments increased by 1.7 and 1.8 times, respectively, in comparison to the unfertilized control. Nevertheless, the wheat grain yield in the NPK and MNPK treatments was increased by 2.5 and 2.6 times, respectively, in contrast to the unfertilized control (Table 2). Chen et al. [42] found that the sum of early and late rice grain yields increased by 65.4–80.2% compared with the unfertilized control due to thirty-two years of manure and chemical fertilizer application in the double rice cropping system. Tlustoš et al. [43] observed that long-term MNPK application resulted in significantly higher wheat grain yields in the Czech Republic. In Burkina Faso, the mean maize grain yield was increased by 0.29 t ha−1year−1 due to farmyard manure application [44]. Singh et al. [45] found that the long-term application of inorganic fertilizer and farmyard manure significantly increased the yield of rice and wheat in the black soil region of India. Similarly, Choudhary et al. [46] reported that the long-term application of organic and inorganic fertilizers significantly increased wheat grain yields under soybean–wheat cropping systems in the Central Himalayas of India.

4.2. Effect of Fertilization on Crop P Concentration and Uptake

This study showed that the application of phosphorus fertilizer increased the phosphorus content in different tissues of the plant at the harvest stage and increased the phosphorus uptake of the crop accordingly. The application of organic fertilizer can significantly increase the phosphorus content and phosphorus uptake of crops. The reason is that the application of organic fertilizer increases the soil available phosphorus content. Other studies have shown that the application of organic fertilizer can not only directly input more available phosphorus into the soil but also activate the insoluble phosphorus in the soil [19]. The grain P concentration of wheat, maize, and rapeseed was significantly positively affected by forty-four years of mineral P fertilization in Switzerland [2]. Manure application alone can also boost stem, leaf, spike, and grain P concentrations in wheat–maize planting systems in China [13]. The grain and straw P concentrations of crops in the no fertilizer control is higher in contrast to the N alone treatment, which was in agreement with the results reported by Tang et al. [47]. Muhammad et al. [48] reported that long-term P fertilizer application significantly increased crop P uptake amounts, and the application of manure combined with chemical fertilizer was more obvious in the wheat–maize cropping system. The research reported that chemical N, P, and K fertilizers and organic fertilizer could increase crop P uptake, and their combined application had a synergistic effect [18,21,49,50]. Crop P uptake amounts in the NPK and MNPK treatments were 45 and 60 kg/ha, respectively, in the wheat–maize cropping system [20], which was higher than our data, showing that the crop P uptake amount in the NPK and MNPK treatments was 33.7 and 43.1 kg/ha, respectively. Similarly, Xin et al. [2] reported that crop P uptake amounts in the NPK and M treatments were 36.7 and 41.8 kg P ha−1, respectively, for the wheat–maize planting system in North China Plain.

4.3. Effect of Fertilization on P-Use Efficiency

The P-use efficiency depends on the soil P status and crop yield, which can be affected by any number of factors, such as fertilizer type, soil physico-chemical properties, crop varieties, climates, and so on [20,51]. Generally, P-use efficiency ranged from 10 to 30% with P fertilizer application. However, the average annual P-use efficiency in the NPK treatment was almost 40.8% in our study. Therefore, the P-use efficiency in this study actually related with the cumulative P-use efficiency because of the long-term fertilization experiment. As such, most P remained due to its strong holding capacity in soil [6]. In our study, the average use efficiency of P fertilizer ranged from 17.2 to 36.8% during the rice growing season and ranged from 25.9% to 50.6% during the wheat growing season, which indicated that the P-use efficiency in the wheat was higher than in the rice (Figure 1). Whether rice or wheat, the phosphorus-use efficiency of the chemical fertilizer treatment was higher than that of organic fertilizer and organic fertilizer combined with the chemical fertilizer treatment. This is because the crop yield of organic fertilizer combined with the chemical fertilizer treatment was equivalent to or slightly higher than that of the NPK treatment. Similarly, Khan et al. [20] reported that P-use efficiency in the NPK treatment was significantly higher than that in the MNPK treatment in the wheat–maize cropping system. Accordingly, significantly higher soil P levels were observed in the manure mixed with chemical fertilizer treatments (Table 4). P-use efficiency in the NP and NPK treatment was approximately 20%, as reported by Ning et al. [6], which was lower than our results (37.4–40.8%) (Figure 1). Our results were slightly lower than the values (39–53%) reported in the European long-term experiments [52]. Similarly, P-use efficiency (21.4–40.8%) in the present study (Figure 1) was lower than that (53.7–61.7%) over the 20-year experiment in the wheat–maize cropping system [19]. In addition, P-use efficiency fluctuated greatly annually, which may be due to crop yield differences. P-use efficiency in the chemical fertilizer was higher than that in the manure combined with chemical fertilizer treatments, indicating that the overapplication of P fertilizer was the most important reason for the declining P-use efficiency. Thus, the correct rate of P input is key to increasing P efficiency. Consequently, the inorganic P input could be reduced under the addition of manure.

4.4. P Budget and Transformation of Residual Fertilizer P in the Soil

The nutrient budget is a vital index for soil fertility and soil health [6,53]. The soil available P content could affect the crop P uptake; moreover, it is also a significant indicator of P leaching and runoff [19]. In this study, the no P fertilizer treatment resulted in a soil P budget deficit (approximately 20 kg P ha−1 yr−1) because the P output was greater than the P input. In contrast, the application of chemical P maintained the P budget, suggesting that 32.8 kg P ha−1 was adequate. Messiga et al. [54] and Ning et al. [6] reported similar results. However, Tang et al. [47] found that the average annual P budget surplus amount in the NP and NPK treatments was 23–42 kg P ha−1 in four wheat–maize cropping systems, but Lemming et al. [55] reported that the average annual P budget deficit amount in the NPK treatment was 8.0–10.6 kg P ha−1 in a long-term fertilizer experiment in Denmark. The average annual P budget surplus amount was 23.4–55.4 kg P ha−1 in the manure and combined application manure and mineral P fertilizer treatments in our study, whereas the annual P budget surplus amount was 128.1–180.4 kg P ha−1 in the mineral P fertilizer mixed with farmyard swine manure treatments in the winter wheat–maize cropping system of Northern China [56]. In addition, manure application further increased crop P uptake, resulting in a significant amount of residual P and preserving the P budget. Moreover, the soil P was deficient without P application, which was in agreement with similar studies by Zhang et al. [57] and Kunzov and Hejcman [58]. P atmospheric deposition is very likely the source for the P addition in the CK, NK, and NPK treatments [19]. In contrast, under the condition of applying P fertilizer, the positive P budget produced a rising trend of available P content in soil, especially in the manure treatment, which indicated that P fertilizer has a strong residual effect [6]. Rodriguez et al. [59] and Sun et al. [60] observed similar results. Singh et al. [17] found that the average annual P budget surplus amount owing to eight years of farmyard manure application was 35.7 kg P ha−1 in the rice–wheat cropping system of India, which was similar to our results. Similarly, Hua et al. [61] found that the average annual P budget surplus amount was 46.0 kg P ha−1 owing to the long-term addition of pig dung manure to the vertisol soil in northern China.
After harvest, some available P is removed from the pool, and the residual P fertilizer can leach into the soil pool and exist in a fixed form [62]. In the present study, the proportion of residual fertilizer P in the soil converted to soil available P under inorganic fertilizer and manure treatments was 4.5–19.1% over the 35-year study period, which was similar to the findings (13%) reported by Johnston and Poulton [63] at the Rothamsted experimental station. Rodriguez et al. [59] found that a small portion of residual fertilizer P can be reused from the soil in Southern Finland. Ning et al. [6] reported that 3–9% of residual fertilizer P transformed into soil available P in the mineral P fertilizer combined with manure treatments, and the P budget was deficient in the M and MN treatments. However, the proportion was the highest (approximately 19%) in the M and MN treatments in this study. Our observation was that the proportion in the M alone and M combined with N, P, and K fertilizers was much higher than the NP and NPK treatments, which revealed that the combined application of chemical fertilizer with manure could improve the P availability; similar results were reported by Ning et al. [6]. Organic material input could increase the soil microorganisms and enzymatic activity (e.g., dehydrogenase, phosphatase) in relation to nutrient transformation and accordingly improve the decomposition of organic matter and mineralization of organic P [21,31,64,65]. Meanwhile, organic materials decompose to produce organic acids, which can improve the activity of insoluble P [66].

5. Conclusions

In conclusion, the crop yield, P uptake, use efficiency, and budget were evaluated in a continuous 35-year fertilizer experiment with the addition of chemical fertilizer with or without organic manure. Organic manure application was a positive supplement for mineral fertilizer and could even maintain stable and sustainable crop yields. The long-term combined application of organic fertilizer and chemical fertilizer significantly increased the utilization rate of phosphorus fertilizer and the ratio of residual fertilizer phosphorus to soil available phosphorus, which was beneficial to improve soil phosphorus fertility. According to the results that the phosphorus content and uptake of crops treated with organic fertilizer were higher than those treated with chemical phosphorus fertilizer alone, the addition of organic fertilizer appropriately reduced the input of chemical phosphorus fertilizer. However, the long-term addition of organic manure led to the accumulation of excessive P, which increases ecological risks. There is still a lot of work to be completed in this area in the future, such as adjustments in fertilizer and manure application rates, the interaction between soil management practices, and the use efficiency of nutrients other than P.

Author Contributions

D.L.: Conceptualization, Resources, Writing—original draft. Z.X.: Data curation, Software, Formal analysis. Z.Z.: Formal analysis, Validation. Y.Q.: Investigation, Visualization. Y.C.: Methodology. H.W.: Visualization. C.H.: Writing—original draft, Writing—review and editing, Supervision, Project administration, Funding acquisition. All authors have read and agreed to the published version of the manuscript.

Funding

This project was sponsored by Smart Fertilization Project of National agricultural science and technology project (20221805) in China.

Institutional Review Board Statement

Not applicable.

Data Availability Statement

The data presented in this study are available on request from the corresponding author.

Conflicts of Interest

The authors declare no conflicts of interest in the present work.

References

  1. Lv, M.; Li, Z.P.; Che, Y.P.; Han, F.X.; Liu, M. Soil organic C, nutrients, microbial biomass, and grain yield of rice (Oryza sativa L.) after 18 years of fertilizer application to an infertile paddy soil. Biol. Fertil. Soils 2011, 47, 777–783. [Google Scholar] [CrossRef]
  2. Cadot, S.; Bélanger, G.; Ziadi, N.; Morel, C.; Sinaj, S. Critical plant and soil phosphorus for wheat, maize, and rapeseed after 44 years of P fertilization. Nutr. Cycl. Agroecosyst. 2018, 112, 417–433. [Google Scholar] [CrossRef]
  3. Cao, D.Y.; Lan, Y.; Chen, W.F.; Yang, X.; Wang, D.; Ge, S.H.; Yang, J.X.; Wang, Q.Y. Successive applications of fertilizers blended with biochar in the soil improve the availability of phosphorus and productivity of maize (Zea mays L.). Eur. J. Agron. 2021, 130, 126344. [Google Scholar] [CrossRef]
  4. Sun, Y.; Amelung, W.; Wu, B.; Haneklaus, S.; Schnug, E.; Bol, R. Fertilizer P-derived uranium continues to accumulate at Rothamsted long-term experiments. Sci. Total Environ. 2022, 820, 153118. [Google Scholar] [CrossRef] [PubMed]
  5. Dhillon, J.; Torres, G.; Driver, E.; Figueiredo, B.; Raun, W.R. World phosphorus use efficiency in cereal crops. Agron. J. 2017, 109, 1670–1677. [Google Scholar] [CrossRef]
  6. Ning, C.C.; Ma, Q.; Yuan, H.Y.; Zhou, C.R.; Xia, Z.Q.; Yu, W.T. Mineral fertilizers with recycled manure boost crop yield and P balance in a long-term field trial. Nutr. Cycl. Agroecosyst. 2020, 116, 271–283. [Google Scholar] [CrossRef]
  7. Medinski, T.; Freese, D.; Reitz, T. Changes in soil phosphorus balance and phosphorus-use efficiency under long-term fertilization conducted on agriculturally used Chernozem in Germany. Can. J. Soil Sci. 2018, 98, 650–662. [Google Scholar] [CrossRef]
  8. Tucher, S.; Horndl, D.; Schmidhalter, U. Interaction of soil pH and phosphorus efficacy: Long-term effects of P fertilizer and lime applications on wheat, barley, and sugar beet. Ambio 2018, 47 (Suppl. 1), S41–S49. [Google Scholar] [CrossRef] [PubMed]
  9. Carpenter, S.R. Eutrophication of aquatic ecosystems: Bistability and soil phosphorus. Proc. Natl. Acad. Sci. USA 2005, 102, 10002–10005. [Google Scholar] [CrossRef]
  10. Choudhary, S.; Dheri, G.S.; Brar, B.S. Long-term effects of NPK fertilizers and organic manures on carbon stabilization and management index under rice-wheat cropping system. Soil Tillage Res. 2017, 166, 59–66. [Google Scholar] [CrossRef]
  11. Yao, C.C.; Guo, H.J.; Xu, H.H.; Yang, X.Y.; Yao, Z.S. Maize stalk incorporation increases N2O emissions that offset the benefit of SOC sequestration in a winter wheat-summer maize field: A four-year measurement in long-term fertilizer experiments. Agric. Ecosyst. Environ. 2023, 352, 108507. [Google Scholar] [CrossRef]
  12. Diacono, M.; Montemurro, F. Long-term effects of organic amendments on soil fertility. A Review. Agron. Sustain. Dev. 2010, 30, 401–422. [Google Scholar] [CrossRef]
  13. Hu, C.; Qi, Y.C. Long-term effective microorganisms application promote growth and increase yields and nutrition of wheat in China. Eur. J. Agron. 2013, 46, 63–67. [Google Scholar] [CrossRef]
  14. Zhao, J.; Ni, T.; Li, J.; Lu, Q.; Fang, Z.Y.; Huang, Q.W.; Zhang, R.F.; Li, R.; Shen, B.; Shen, Q.R. Effects of organic-inorganic compound fertilizer with reduced chemical fertilizer application on crop yields, soil biological activity and bacterial community structure in a rice-wheat cropping system. Appl. Soil Ecol. 2016, 99, 1–12. [Google Scholar] [CrossRef]
  15. Celestina, C.; Hunt, J.R.; Sale, P.W.G.; Franks, A.E. Attribution of crop yield responses to application of organic amendments: A critical review. Soil Tillage Res. 2019, 186, 135–145. [Google Scholar] [CrossRef]
  16. Lee, C.H.; Park, C.Y.; Park, K.D.; Jeon, W.T.; Kim, P.J. Long term effects of fertilization on the forms and availability of soil phosphorus in rice paddy. Chemosphere 2004, 56, 299–304. [Google Scholar] [CrossRef]
  17. Singh, M.; Reddy, K.S.; Singh, V.P.; Rupa, T.R. Phosphorus availability to rice (Oriza sativa L.)-wheat (Triticum estivum L.) in a Vertisol after eight years of inorganic and organic fertilizer additions. Biores. Technol. 2007, 98, 1474–1481. [Google Scholar] [CrossRef] [PubMed]
  18. Selles, F.; Campbell, C.A.; Zentner, R.P.; Curtin, D.; James, D.C.; Basnyat, P. Phosphorus use efficiency and long-term trends in soil available phosphorus in wheat production systems with and without nitrogen fertilizer. Can. J. Soil Sci. 2011, 91, 39–52. [Google Scholar] [CrossRef]
  19. Xin, X.; Qin, S.W.; Zhang, J.B.; Zhu, A.N.; Yang, W.L.; Zhang, X.F. Yield, phosphorus use efficiency and balance response to substituting long term chemical fertilizer use with organic manure in a wheat-maize system. Field Crops Res. 2017, 208, 27–33. [Google Scholar] [CrossRef]
  20. Khan, A.; Lu, G.Y.; Ayaz, M.; Zhang, H.T.; Wang, R.J.; Lv, F.L.; Yang, X.Y.; Sun, B.H.; Zhang, S.L. Phosphorus efficiency, soil phosphorus dynamics and critical phosphorus level under long-term fertilization for single and double cropping systems. Agric. Ecosyst. Environ. 2018, 256, 1–11. [Google Scholar] [CrossRef]
  21. Venkatesh, M.S.; Hazra, K.K.; Ghosh, P.K.; Singh, M. Integrated phosphorus management in maize-chickpea cropping system on alkaline Fluvisol. Nutr. Cycl. Agroecosyst. 2019, 113, 141–156. [Google Scholar] [CrossRef]
  22. Bhatt, R.; Kukal, S.S.; Busari, M.A.; Arora, S.; Yadav, M. Sustainability issues on rice-wheat cropping system. Int. Soil Water Conse. 2016, 4, 64–74. [Google Scholar] [CrossRef]
  23. Devkota, M.; Devkota, K.P.; Acharya, S.; McDonald, A.J. Increasing profitability, yields and yield stability through sustainable crop establishment practices in the rice-wheat systems of Nepal. Agric. Syst. 2019, 173, 414–423. [Google Scholar] [CrossRef]
  24. Singh, M.; Kumar, P.; Kumar, V.; Solanki, I.S.; McDonald, A.; Kumar, A.; Poonia, S.P.; Kumar, V.; Ajay, A.; Kumar, A.; et al. Intercomparison of crop establishment methods for improving yield and profitability in the rice-wheat system of Eastern India. Field Crops Res. 2020, 250, 107776. [Google Scholar] [CrossRef] [PubMed]
  25. Han, X.M.; Hu, C.; Chen, Y.F.; Qiao, Y.; Liu, D.H.; Fan, J.; Li, S.L.; Zhang, Z. Soil nitrogen sequestration in a long-term fertilizer experiment in central China. Span J. Agric. Res. 2020, 18, e1102. [Google Scholar] [CrossRef]
  26. Wang, H.H.; Shen, M.X.; Hui, D.F.; Chen, J.; Sun, G.F.; Wang, X.; Lu, C.Y.; Sheng, J.; Chen, L.G.; Luo, Y.Q.; et al. Straw incorporation influences soil organic carbon sequestration, greenhouse gas emission, and crop yields in a Chinese rice. Soil Tillage Res. 2019, 195, 104377. [Google Scholar] [CrossRef]
  27. Nadeem, F.; Farooq, M. Application of micronutrients in rice-wheat cropping system of South Asia. Rice Sci. 2019, 26, 356–371. [Google Scholar] [CrossRef]
  28. Lan, Z.M.; Lin, X.J.; Wang, F.; Zhang, H.; Chen, C.R. Phosphorus availability and rice grain yield in a paddy soil in response to long-term fertilization. Biol. Fertil. Soils 2012, 48, 579–588. [Google Scholar] [CrossRef]
  29. Han, X.M.; Hu, C.; Chen, Y.F.; Qiao, Y.; Liu, D.H.; Fan, J.; Li, S.L.; Zhang, Z. Crop yield stability and sustainability in a rice-wheat cropping system based on 34-year field experiment. Eur. J. Agron. 2020, 113, 125965. [Google Scholar] [CrossRef]
  30. Mohanty, M.; Sinha, N.K.; Somasundaram, J.; McDermid, S.S.; Patra, A.K.; Singh, M.; Dwivedi, A.K.; Reddy, K.S.; Rao, C.S.; Prabhakar, M.; et al. Soil carbon sequestration potential in a Vertisol in central India- results from a 43-year long-term experiment and APSIM modeling. Agric. Syst. 2020, 184, 102906. [Google Scholar] [CrossRef]
  31. Hu, C.; Li, S.L.; Qiao, Y.; Liu, D.H.; Chen, Y.F. Effects of 30 years repeated fertilizer applications on soil properties, microbes and crop yields in rice-wheat cropping systems. Exp. Agric. 2015, 51, 355–369. [Google Scholar] [CrossRef]
  32. Bremner, J.M. Nitrogen-Total. In Methods of Soil Analysis. Part 3; Sparks, D.L., Ed.; Soil Science Society of America Book Series 5; Wiley Online Library: Madison, WI, USA, 1996; pp. 1085–1086. [Google Scholar]
  33. Thomas, R.L.; Sheard, R.W.; Moyer, J.R. Comparison of conventional and automated procedures for nitrogen, phosphorus, and potassium analysis of plant material using a single digestion. Agron. J. 1967, 59, 240–243. [Google Scholar] [CrossRef]
  34. Wang Helmke, P.A.; Sparks, D.L. Lithium, sodium, potassium, rubidium and cesium. In Methods of Soil Analysis. Part 3. Chemical Method; Sparks, D.L., Ed.; Soil Science Society of America, American Society of Agronomy: Madison, WI, USA, 1996; pp. 551–574. [Google Scholar]
  35. Page, A.L.; Miller, R.H.; Dennis, R.K. Methods of soil analysis. Catena 1988, 15, 99–100. [Google Scholar]
  36. Olsen, R.S.; Cole, V.C.; Watanabey, F.S.; Dean, L.A. Estimation of Available Phosphorus in Soils by Extraction with Sodium Bicarbonate; US Department of Agricultural Circulation: Washington, DC, USA, 1954; p. 939. [Google Scholar]
  37. Choudhary Carson, P.L. Recommended potassium test. In Recommended chemical Soil Test Procedures for the North Central Region. Bulletin 499.; Dahnke, W.C., Ed.; North Dakota Agricultural Experiment Station: Fargo, ND, USA, 1980; pp. 17–18. [Google Scholar]
  38. Gransee, A.; Merbach, W. Phosphorus dynamics in a the long-term P fertilization trial on the Luvic Phaeozem at Halle. J. Plant Nutr. Soil Sci. 2000, 163, 353–357. [Google Scholar] [CrossRef]
  39. Wang, J.D.; Wang, K.H.; Wang, X.J.; Ai, Y.C.; Zhang, Y.C.; Yu, J.G. Carbon sequestration and yields with long-term use of inorganic fertilizers and organic manure in a six-crop rotation system. Nutr. Cycl. Agroecosyst. 2018, 111, 87–98. [Google Scholar] [CrossRef]
  40. Shen, M.X.; Yang, L.Z.; Yao, Y.M.; Wu, D.D.; Wang, J.G.; Guo, R.L.; Yin, S.X. Long-term effects of fertilizer managements on crop yields and organic carbon storage of a typical rice-wheat agroecosystem of China. Biol. Fertil. Soils 2007, 44, 187–200. [Google Scholar] [CrossRef]
  41. Shahbaz, M.; Kätterer, T.; Thornton, B.; Börjesson, G. Dynamics of fungal and bacterial groups and their carbon sources during the growing season of maize in a long-term experiment. Biol. Fertil. Soils 2020, 56, 759–770. [Google Scholar] [CrossRef]
  42. Chen, D.M.; Yuan, L.; Liu, Y.R.; Ji, J.H.; Hou, H.Q. Long-term application of manures plus chemical fertilizers sustained high rice yield and improved soil chemical and bacterial properties. Eur. J. Agron. 2017, 90, 34–42. [Google Scholar] [CrossRef]
  43. Tlustoš, P.; Hejcman, M.; Kunzová, E.; Hlisnikovský, L.; Záečíová, H.; Száková, J. Nutrient status of soil and winter wheat (Triticum aestivum L.) in response to long-term farmyard manure application under different climatic and soil physicochemical conditions in the Czech Republic. Arch. Agron. Soil Sci. 2018, 64, 70–83. [Google Scholar] [CrossRef]
  44. Garba, M.; Serme, I.; Maman, N.; Korodjouma, O.; Gonda, A.; Wortmann, C.; Mason, S. Crop response to manure and fertilizer in Burkina Faso and Niger. Nutr. Cycl. Agroecosyst. 2018, 111, 175–188. [Google Scholar] [CrossRef]
  45. Singh, D.K.; Pandey, P.C.; Nanda, G.; Gupta, S. Long-term effects of inorganic fertilizer and farmyard manure application on productivity, sustainability and profitability of rice-wheat system in Mollisols. Arch. Agron. Soil Sci. 2018, 65, 139–151. [Google Scholar] [CrossRef]
  46. Choudhary, M.; Panday, S.C.; Meena, V.S.; Singh, S.; Yadav, R.P.; Mahanta, D.; Mondal, T.; Mishra, P.K.; Bisht, J.K.; Pattanayak, A. Long-term effects of organic manure and inorganic fertilization on sustainability and chemical soil quality indicators of soybean-wheat cropping system in the Indian mid-Himalayas. Agric. Ecosyst. Environ. 2018, 257, 38–46. [Google Scholar] [CrossRef]
  47. Tang, X.; Li, J.M.; Ma, Y.B.; Hao, X.Y.; Li, X.Y. Phosphorus efficiency in long-term (15 years) wheat-maize cropping systems with various soil and climate conditions. Field Crops Res. 2008, 108, 231–237. [Google Scholar] [CrossRef]
  48. Muhammad, Q.; Huang, J.; Waqas, A.; Li, D.C.; Liu, S.J.; Zhang, L.; Cai, A.; Liu, L.S.; Xu, Y.M.; Gao, J.S.; et al. Yield sustainability, soil organic carbon sequestration and nutrients balance under long-term combined application of manure and inorganic fertilizers in acidic paddy soil. Soil Tillage Res. 2020, 198, 104569. [Google Scholar]
  49. Andriamananjara, A.; Rakotoson, T.; Razanakoto, O.R.; Razafimanantsoa, M.P.; Rabeharisoa, L.; Smolders, E. Farmyard manure application in weathered upland soils of Madagascar sharply increase phosphate fertilizer use efficiency for upland rice. Field Crops Res. 2018, 222, 94–100. [Google Scholar] [CrossRef]
  50. Káš, M.; Müehlbachová, G.; Kusá, H.; Pechová, M. Soil phosphorus and potassium availability in long-term field experiments with organic and mineral fertilization. Plant Soil Environ. 2016, 62, 558–565. [Google Scholar] [CrossRef]
  51. Chen, M.M.; Zhang, S.R.; Liu, L.; Wu, L.P.; Ding, X.D. Combined organic amendments and mineral fertilizer application increase rice yield by improving soil structure, P availability and root growth in saline-alkaline soil. Soil Tillage Res. 2021, 212, 105060. [Google Scholar] [CrossRef]
  52. Blake, L.; Mercik, S.; Koerschens, M.; Moskal, S.; Poulton, P.R.; Goulding, K.W.T.; Weigel, A.; Powlson, D.S. Phosphorus content in soil, uptake by plants and balance in three European long-term field experiments. Nutr. Cycl. Agroecosyst. 2000, 56, 263–275. [Google Scholar] [CrossRef]
  53. Gao, C.; Sun, B.; Zhang, T.L. Sustainable nutrient management in Chinese agriculture: Challenges and perspective. Pedosphere 2006, 16, 253–263. [Google Scholar] [CrossRef]
  54. Messiga, A.J.; Ziadi, N.; Plenet, D.; Parent, L.E.; Morel, C. Long-term changes in soil phosphorus status related to P budgets under maize monoculture and mineral P fertilization. Soil Use Manag. 2010, 26, 354–364. [Google Scholar] [CrossRef]
  55. Lemming, C.; Oberson, A.; Magid, J.; Bruun, S.; Scheutz, C.; Frossard, E.; Jensen, L.S. Residual phosphorus availability after long-term soil application of organic waste. Agric. Ecosyst. Environ. 2019, 270–271, 65–75. [Google Scholar] [CrossRef]
  56. Chen, X.B.; Zhai, L.M.; Liu, J.; Liu, S.; Wang, H.Y.; Luo, C.Y.; Ren, T.Z.; Liu, H.B. Long-term phosphorus accumulation and agronomic and environmental critical phosphorus levels in Haplic Luvisol soil, northern China. J. Integr. Agr. 2016, 15, 200–208. [Google Scholar]
  57. Zhang, T.Q.; MacKenzie, A.F.; Liang, B.C.; Drury, C.F. Soil test phosphorus and phosphorus fractions with long-term phosphorus addition and depletion. Soil Sci. Soc. Am. J. 2004, 68, 519–528. [Google Scholar]
  58. Kunzov, E.; Hejcman, M. Yield development of winter wheat over 50 years of FYM, N, P and K fertilizer application on black earth soil in the Czech Republic. Field Crops Res. 2009, 111, 226–234. [Google Scholar] [CrossRef]
  59. Olsen Rodriguez, I.G.; Yli-Halla, M.; Jaakkola, A. Fate of phosphorus in soil during a long-term fertilization experiment in Finland. J. Plant Nutr. Soil Sci. 2018, 181, 675–685. [Google Scholar] [CrossRef]
  60. Sun, B.H.; Cui, Q.H.; Guo, Y.; Yang, X.Y.; Zhang, S.L.; Gao, M.X.; Hopkins, D.W. Soil phosphorus and relationship to phosphorus balance under long-term fertilization. Plant Soil Environ. 2018, 64, 214–220. [Google Scholar] [CrossRef]
  61. Hua, K.; Zhang, W.; Guo, Z.; Wang, D.; Oenema, O. Evaluating crop response and environmental impact of the accumulation of phosphorus due to long-term manuring of vertisol soil in northern China. Agric. Ecosyst. Environ. 2015, 219, 101–110. [Google Scholar] [CrossRef]
  62. Selles, F.; Campbell, C.A.; Zentner, R.P. Effect of cropping and fertilization on plant and soil phosphorus. Soil Sci. Soc. Am. J. 1995, 59, 140–144. [Google Scholar] [CrossRef]
  63. Johnston, A.E.; Poulton, P.R. The role of phosphorus in crop production and soil fertility: 150 years of field experiments at Rothamsted, United Kingdom. In Phosphate Fertilizers and the Environment, Proceedings of an International Workshop; Schultz, J.J., Ed.; International Fertilizer Development Centre: Muscle Shoals, AL, USA, 1993; pp. 45–63. [Google Scholar]
  64. Kundu, S.; Bhattacharyya, R.; Prakash, V.; Gupta, H.S.; Pathak, H.; Ladha, J.K. Long-term yield trend and sustainability of rainfed soybean-wheat system through farmyard manure application in a sandy loam soil of the Indian Himalayas. Biol. Fertil. Soils 2007, 48, 579–588. [Google Scholar] [CrossRef]
  65. Hu, C.; Qi, Y.C. Soil biological and biochemical quality of wheat-maize cropping system in long-term fertilizer experiments. Exp. Agric. 2011, 47, 593–608. [Google Scholar] [CrossRef]
  66. Sharpley, A.N.; McDowell, R.W.; Kleinman, P.J.A. Amounts, forms, and solubility of phosphorus in soils receiving manure. Soil Sci. Soc. Am. J. 2004, 68, 2048–2057. [Google Scholar] [CrossRef]
Figure 1. Rice (a) and wheat (b) P-use efficiency in different fertilization treatments during thirty-five-year period. NP: inorganic N and P fertilizer; NPK: inorganic N, P, and K fertilizer; M: manure; MN: manure combined with inorganic N fertilizer; MNP: manure combined with inorganic N and P fertilizers; MNPK: manure combined with inorganic N, P, and K fertilizers.
Agriculture 14 01393 g001
Figure 2. Rice (a) and wheat (b) P budget in different fertilization treatments during thirty-five-year period. CK: no fertilizer; N: only inorganic N fertilizer; NP: inorganic N and P fertilizer; NPK: inorganic N, P, and K fertilizer; M: manure; MN: manure combined with inorganic N fertilizer; MNP: manure combined with inorganic N and P fertilizers; MNPK: manure combined with inorganic N, P, and K fertilizers.
Agriculture 14 01393 g002
Figure 3. Linear regression relationship between rice (a) or wheat (b) P budget and annual P application amount in rice or wheat for the duration of long-term fertilizer experiments. Eight points represent eight fertilization treatments.
Agriculture 14 01393 g003
Figure 4. Linear regression relationship between the average soil total P (a) or Olsen P (b) content and the average annual P budget for the duration of long-term fertilizer experiments. Eight points represent eight fertilization treatments.
Agriculture 14 01393 g004
Figure 5. Nonlinear regression relationship between the average rice (a) or wheat (b) grain yield and the average annual P budget in rice or wheat for the duration of long-term fertilizer experiments. Eight points represent eight fertilization treatments.
Agriculture 14 01393 g005
Table 1. Experimental design and application amounts of chemical fertilizers and manure from 1981 to 2015.
TreatmentBasal Fertilizer (kg ha−1)Supplementary Fertilizer (kg ha−1)
Chemical FertilizerManureFirstSecond
NPKNPKNN
Rice
CK00000000
N36000003618
NP3619.600003618
NPK3619.674.70003618
M00052.631.739.200
MN360052.631.739.23618
MNP3619.6052.631.739.23618
MNPK3619.674.752.631.739.23618
Wheat
CK00000000
N30000001515
NP3013.100001515
NPK3013.149.80001515
M00052.631.739.200
MN300052.631.739.21515
MNP3013.1052.631.739.21515
MNPK3013.149.852.631.739.21515
CK: no fertilizer; N: only inorganic N fertilizer; NP: inorganic N and P fertilizer; NPK: inorganic N, P, and K fertilizer; M: manure; MN: manure combined with inorganic N fertilizer; MNP: manure combined with inorganic N and P fertilizers; MNPK: manure combined with inorganic N, P, and K fertilizers.
Table 2. Average annual grain and straw biomass of rice and wheat under different fertilization treatments across thirty-five years.
TreatmentRice Yield (kg ha−1)Wheat Yield (kg ha−1)
GrainStrawGrainStraw
CK4183.6 d 4765.0 d1195.5 d 1513.7 d
N5440.8 c5546.1 c 1266.3 d 1590.3 d
NP5858.9 b 5847.6 b2144.0 c 2568.1 c
NPK6011.4 b6102.1 b 2410.1 bc 2944.0 b
M5997.3 b 6246.7 b2645.6 b3058.6 b
MN6456.9 a 6494.5 ab3101.1 a3644.2 a
MNP6338.8 a6623.1 a 3201.5 a 3883.7 a
MNPK6389.1 a6821.0 a3298.7 a4056.9 a
CK: no fertilizer; N: only inorganic N fertilizer; NP: inorganic N and P fertilizer; NPK: inorganic N, P, and K fertilizer; M: manure; MN: manure combined with inorganic N fertilizer; MNP: manure combined with inorganic N and P fertilizers; MNPK: manure combined with inorganic N, P, and K fertilizers. Different small letters in the same column indicate significant differences among treatments at a 5% significance level according to LSD multiple comparison.
Table 3. Average P content and annual P uptake of rice and wheat in different treatments across thirty-five years.
ItemCrop P Content (g kg−1)Crop P Uptake (kg P ha−1)
RiceWheatRiceWheat
GrainStrawGrainStrawGrainStrawSumGrainStrawSum
CK2.68 b0.58 b 3.85 c0.35 b12.05 c2.78 c 14.84 d4.60 d0.53 d 5.13 e
N2.60 b 0.47 b3.17 d0.29 b14.71 b2.63 c17.34 c4.01 d 0.46 d 4.47 e
NP2.95 a0.71 a 4.28 b0.41 b17.96 a4.13 b22.09 b 9.18 c 1.06 c10.24 d
NPK2.94 a 0.65 ab4.54 a0.40 b17.65 a3.94 b 21.59 b10.95 b 1.19 c12.13 d
M2.86 a0.75 a4.60 a0.72 a17.14 a4.67 b 21.81 b12.18 b2.35 b 14.53 c
MN2.89 a0.75 a4.49 a0.75 a18.69 a4.87 b 23.56 a13.92 a 2.41 b 16.33 bc
MNP2.88 a0.83 a 4.37 b0.80 a18.26 a5.48 a23.74 a 13.99 a2.95 a 16.93 ab
MNPK3.07 a0.84 a4.62 a0.82 a18.86 a5.65 a24.51 a15.26 a 3.31 a18.57 a
CK: no fertilizer; N: only inorganic N fertilizer; NP: inorganic N and P fertilizer; NPK: inorganic N, P, and K fertilizer; M: manure; MN: manure combined with inorganic N fertilizer; MNP: manure combined with inorganic N and P fertilizers; MNPK: manure combined with inorganic N, P, and K fertilizers. Different small letters in the same column indicate significant differences among treatments at a 5% significance level according to the LSD multiple comparison.
Table 4. The transformation of residual fertilizer P in the soil after 35 years of different treatments.
ItemNPNPKMMNMNPMNPK
Total P input (kg ha−1)113311332190219033233323
P uptake by crops (kg ha−1)112111681257138014071489
P uptake by crops from fertilizer (kg ha−1)427474563686713795
Residual fertilizer P in the soil (kg ha−1)7066591627150426102528
Change of available P (kg ha−1) 3232311286300336
Ratio of residual P converted to available P (%)4.494.8219.0919.0011.5013.28
NP: inorganic N plus P fertilizer treatment; NPK: inorganic N, P, and K fertilizer treatment; M: manure treatment; MN: manure plus inorganic N fertilizer treatment; MNP: manure plus inorganic N and P fertilizers treatment; MNPK: manure plus inorganic N, P, and K fertilizers treatment. For CK and N treatments, total P uptake by crops was 694 and 759 kg P ha−1.
Disclaimer/Publisher’s Note: The statements, opinions and data contained in all publications are solely those of the individual author(s) and contributor(s) and not of MDPI and/or the editor(s). MDPI and/or the editor(s) disclaim responsibility for any injury to people or property resulting from any ideas, methods, instructions or products referred to in the content.

