Article

Experimental Research on Breakage Characteristics of Feed Pellets under Different Loading Methods

1
College of Engineering, Huazhong Agricultural University, Wuhan 430070, China
2
Key Laboratory of Smart Farming for Agricultural Animals, Ministry of Agriculture, Wuhan 430070, China
*
Author to whom correspondence should be addressed.
Agriculture 2024, 14(8), 1401; https://doi.org/10.3390/agriculture14081401
Submission received: 26 June 2024 / Revised: 10 August 2024 / Accepted: 15 August 2024 / Published: 19 August 2024
(This article belongs to the Section Agricultural Technology)

Abstract

:
Particle breakage is a common phenomenon during the processes of production, storage, and transportation. Because of the requirements for pellet integrity in poultry farming, research on the breakage characteristics of feed pellets is necessary. In this paper, repeated compression tests under different loading forces and repeated impact tests under different air pressures were carried out with feed pellets as the research object. The breakage behaviors were described, and the particle size distribution of feed pellets was analyzed quantitatively. The results revealed a positive correlation between crack density in feed particle beds and loading force. The compression process was divided into three stages based on force–displacement curves. The size of the feed pellets during repeated impacts decreased continuously and was negatively correlated with air pressure. The Weibull function accurately described the particle size distribution, with R2 values exceeding 0.97 and 0.96. The Weibull parameters showed a steady breakage degree in compression tests and a growing breakage degree in impact tests. The variation in energy and pulverization rate under different loading conditions was examined as the number of loading cycles increased. The relationship between energy and pulverization rates was fitted, showing that both parameters increased with loading cycles in different loading methods. The model of Vogel and Peukert could describe the relationship between energy and pulverization rate well, with R2 values exceeding 0.94. The minimum energy required for pellet breakage was higher in compression than in impact due to the compaction of the feed particle bed during repeated compression. The results can provide basic theory and data support for breakage characteristics and quality evaluation of feed pellets.

1. Introduction

It is a common phenomenon that feed pellets are damaged during production, storage, and transportation [1,2]. Broken particles in aquaculture will affect fish feeding and water quality, leading to financial losses and significant environmental pollution [3]. Small particles in livestock farming are unable to be digested well and could even lead to respiratory diseases [4,5]. Therefore, it is crucial to assess the quality of feed pellets, which is defined as the ability to resist abrasion and fragmentation and the ability to avoid fines during production and transportation [6,7].
Particle breakage during production, storage, and transportation is mainly caused by compression and impact forces [8]. Numerous studies have explored the breakage mechanisms of feed pellets, with a focus on the compression or impact characteristics of individual pellets [9,10,11,12,13,14,15,16,17]. For example, using Weibull analysis, a single-particle diametral compression test was conducted to investigate the intensity distribution of feed pellets. The breakage characteristics of fish feed were captured by high-speed photography technology at different impact velocities [9,11]. At various airspeeds and feeding rates during pneumatic conveying, the degradation of three kinds of fish feed was examined [12]. Based on single particle compression and impact tests, the repeated loading characteristics were studied, and the relationship between energy and breakage probability was fitted [14]. Based on the texture profile analysis and stress relaxation test, the mechanical properties of fish feed were obtained and correlated with mechanical durability [15,16]. The Holmen tester was used to access the breakage degree of fish feed produced under different temperatures and pressures, and it was found that the temperature and pressure would influence the breakage degree of fish feed [17]. Research on single feed pellets is useful for understanding breakage mechanisms and the critical breakage conditions of feed pellets. However, the loading conditions of feed pellets in the actual production, storage, and transportation process are different from those in single particle loading. For example, feed pellets exist as particle groups during the storage process, and the interaction between particles is not taken into account in single particle compression [18,19]. During the transportation process, feed pellets are subjected to continuous impact loading. The breakage information cannot be represented by one pellet at one impact. Therefore, particle group compression tests and repeated loading tests are considered in this study.
Starch and protein ensure that the inorganic particles primarily manifest as brittle failure and the organic particles primarily manifest as elastoplastic failure. Therefore, the degradation of particles is influenced by their physical properties [20,21,22]. As an organic particle, the loading characteristics of agricultural particle groups have been scarcely reported. The breakage process of agricultural materials is usually influenced by variety, composition, and water content [23,24]. Some studies have carried out particle group loading and repeated loading on materials such as wheat [25], coffee [26], rice [27], and corn [28,29], and bulk compression characteristics, bulk porosity, deformation, and breakage models were obtained. However, few studies focus on the compression of the feed particle bed. Unlike homogeneous materials such as maize and rice, feed pellets compressed by raw materials are porous materials. On the one hand, feed pellets cannot be simulated well by the bonded particle model during the single particle compression simulation [13]; on the other hand, cyclic stiffening occurs during repeated loading due to the inelastic deformation of the feed pellet [14]. As a special agricultural material, the breakage characteristics of feed particle beds may be different from those of common agricultural materials. Therefore, the compression of feed particle beds is a reasonable way to investigate the breakage characteristics of a particle group.
To analyze the particle breakage quantitatively, the particle size distribution (PSD) of damaged particles was collected. Currently, fractal theory and Weibull analysis are commonly used for the analysis of PSD. The fractal theory was first proposed by Mandelbrot and was mainly used to characterize many complex and inconsistent graphics and processes in nature [30]. Now, it is widely applied in the fields of rock and coal. For example, the relation of fractal dimension to fracture energy and applied stress was proposed and validated by experimental data published previously [31]. Due to its high fitting accuracy, the Weibull distribution proposed in 1939 [32] was widely used. For instance, it was used to describe the variation in PSD during coal particle bed compression tests [33]. Fractal theory mainly describes the situation where the breakage degree of the particle is large, and the Weibull function can not only describe the situation where the breakage degree of the particle is large but also better characterize the situation where the breakage degree of the particle is small. Therefore, the Weibull function is a better choice for different loading conditions.
In order to evaluate the breakage characteristics of feed pellets in the actual production, storage, and transportation process, repeated compression tests with feed particle beds and repeated impact tests with feed pellets were conducted. The PSD was fitted with the Weibull function, and the fitting parameters were analyzed in detail. The variations in energy and the pulverization rate of feed pellets at different loading conditions and loading cycles were studied, and the breakage behaviors of feed pellets were investigated. The relationship between energy and pulverization rate was quantitatively analyzed.

2. Materials and Methods

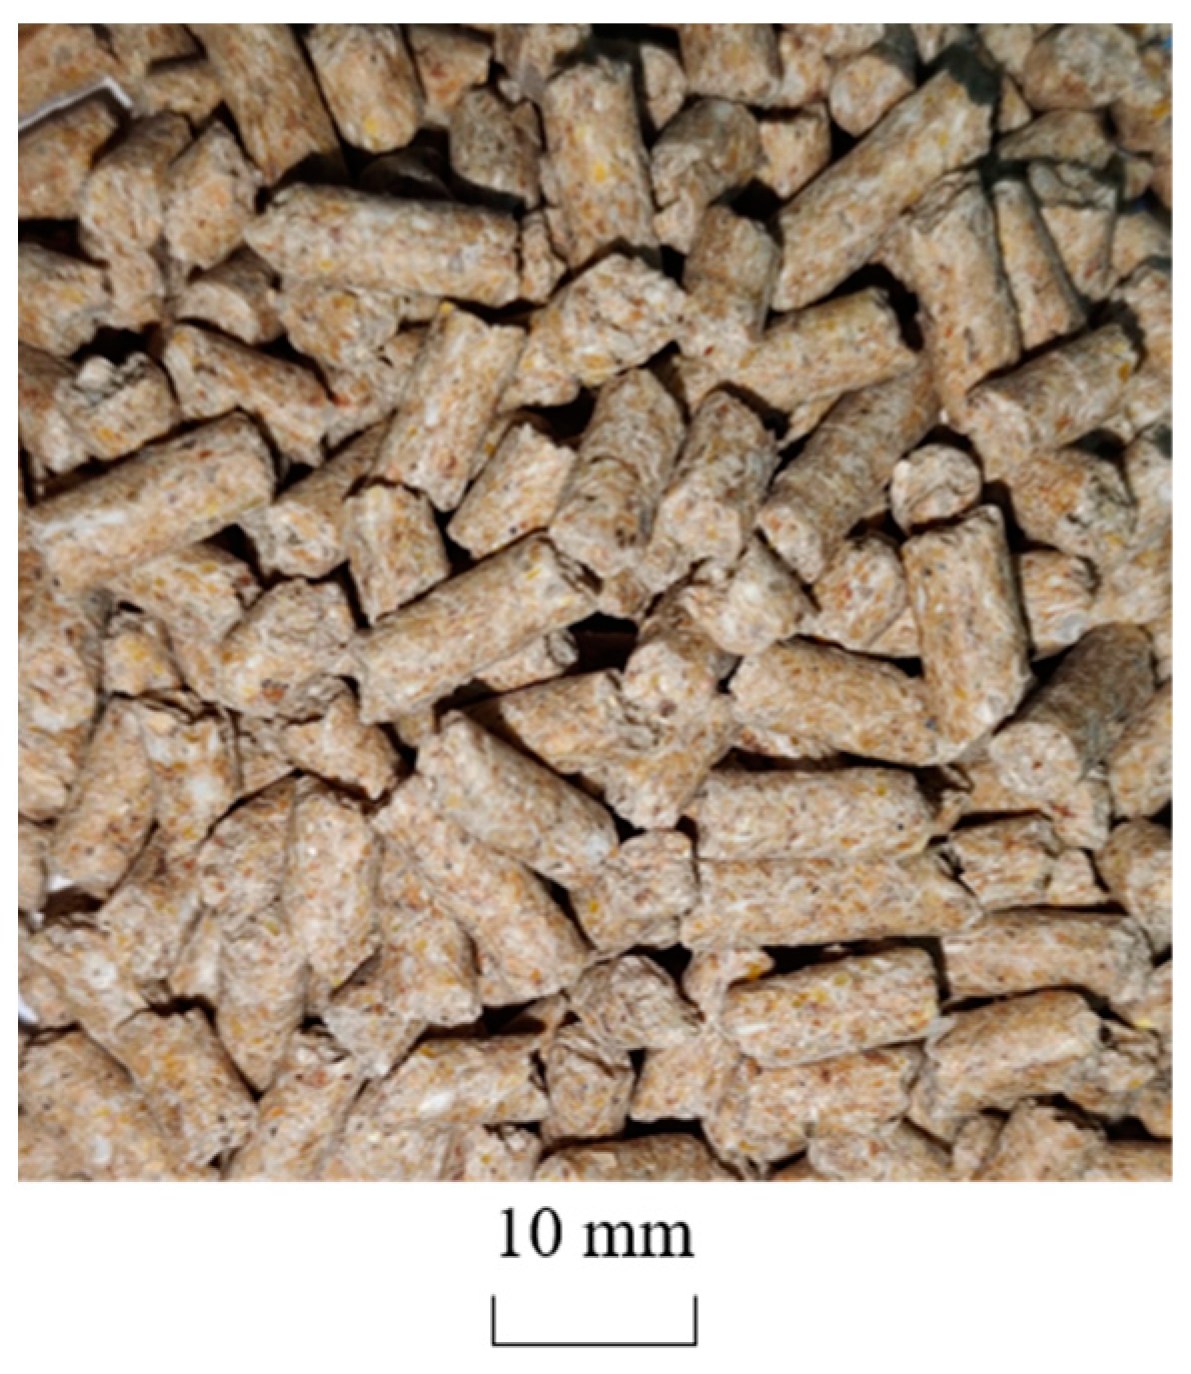
2.1. Samples and Preparation

The test samples (Figure 1) were compound feeds for pig feeding, which were taken from Charoen Pokphand Group (CP Group, Wuhan, China). The density of feed pellets was 1093.28 ± 21.83 kg/m3, measured by the sand discharge method. The main chemical compositions are listed in Table 1. The average diameter and length range measured by the Vernier caliper (accuracy: ±0.01 mm) were 4.18 ± 0.11 mm and 5.55–19.56 mm, with 100 pellets selected randomly. Before the experiment, the pellets were pre-screened using 3.35 mm wired mesh sieve diameters. Selected samples were sealed and stored at room temperature. The breakage forces under radial compression and axial compression were 66.6 ± 10.1 N and 32.3 ± 6.5 N with polished samples, and the detailed process is shown in the previous studies [14]. The elastic modulus and Poisson’s ratio of the samples are 258.83 ± 61.58 MPa and 0.34 ± 0.06, respectively.

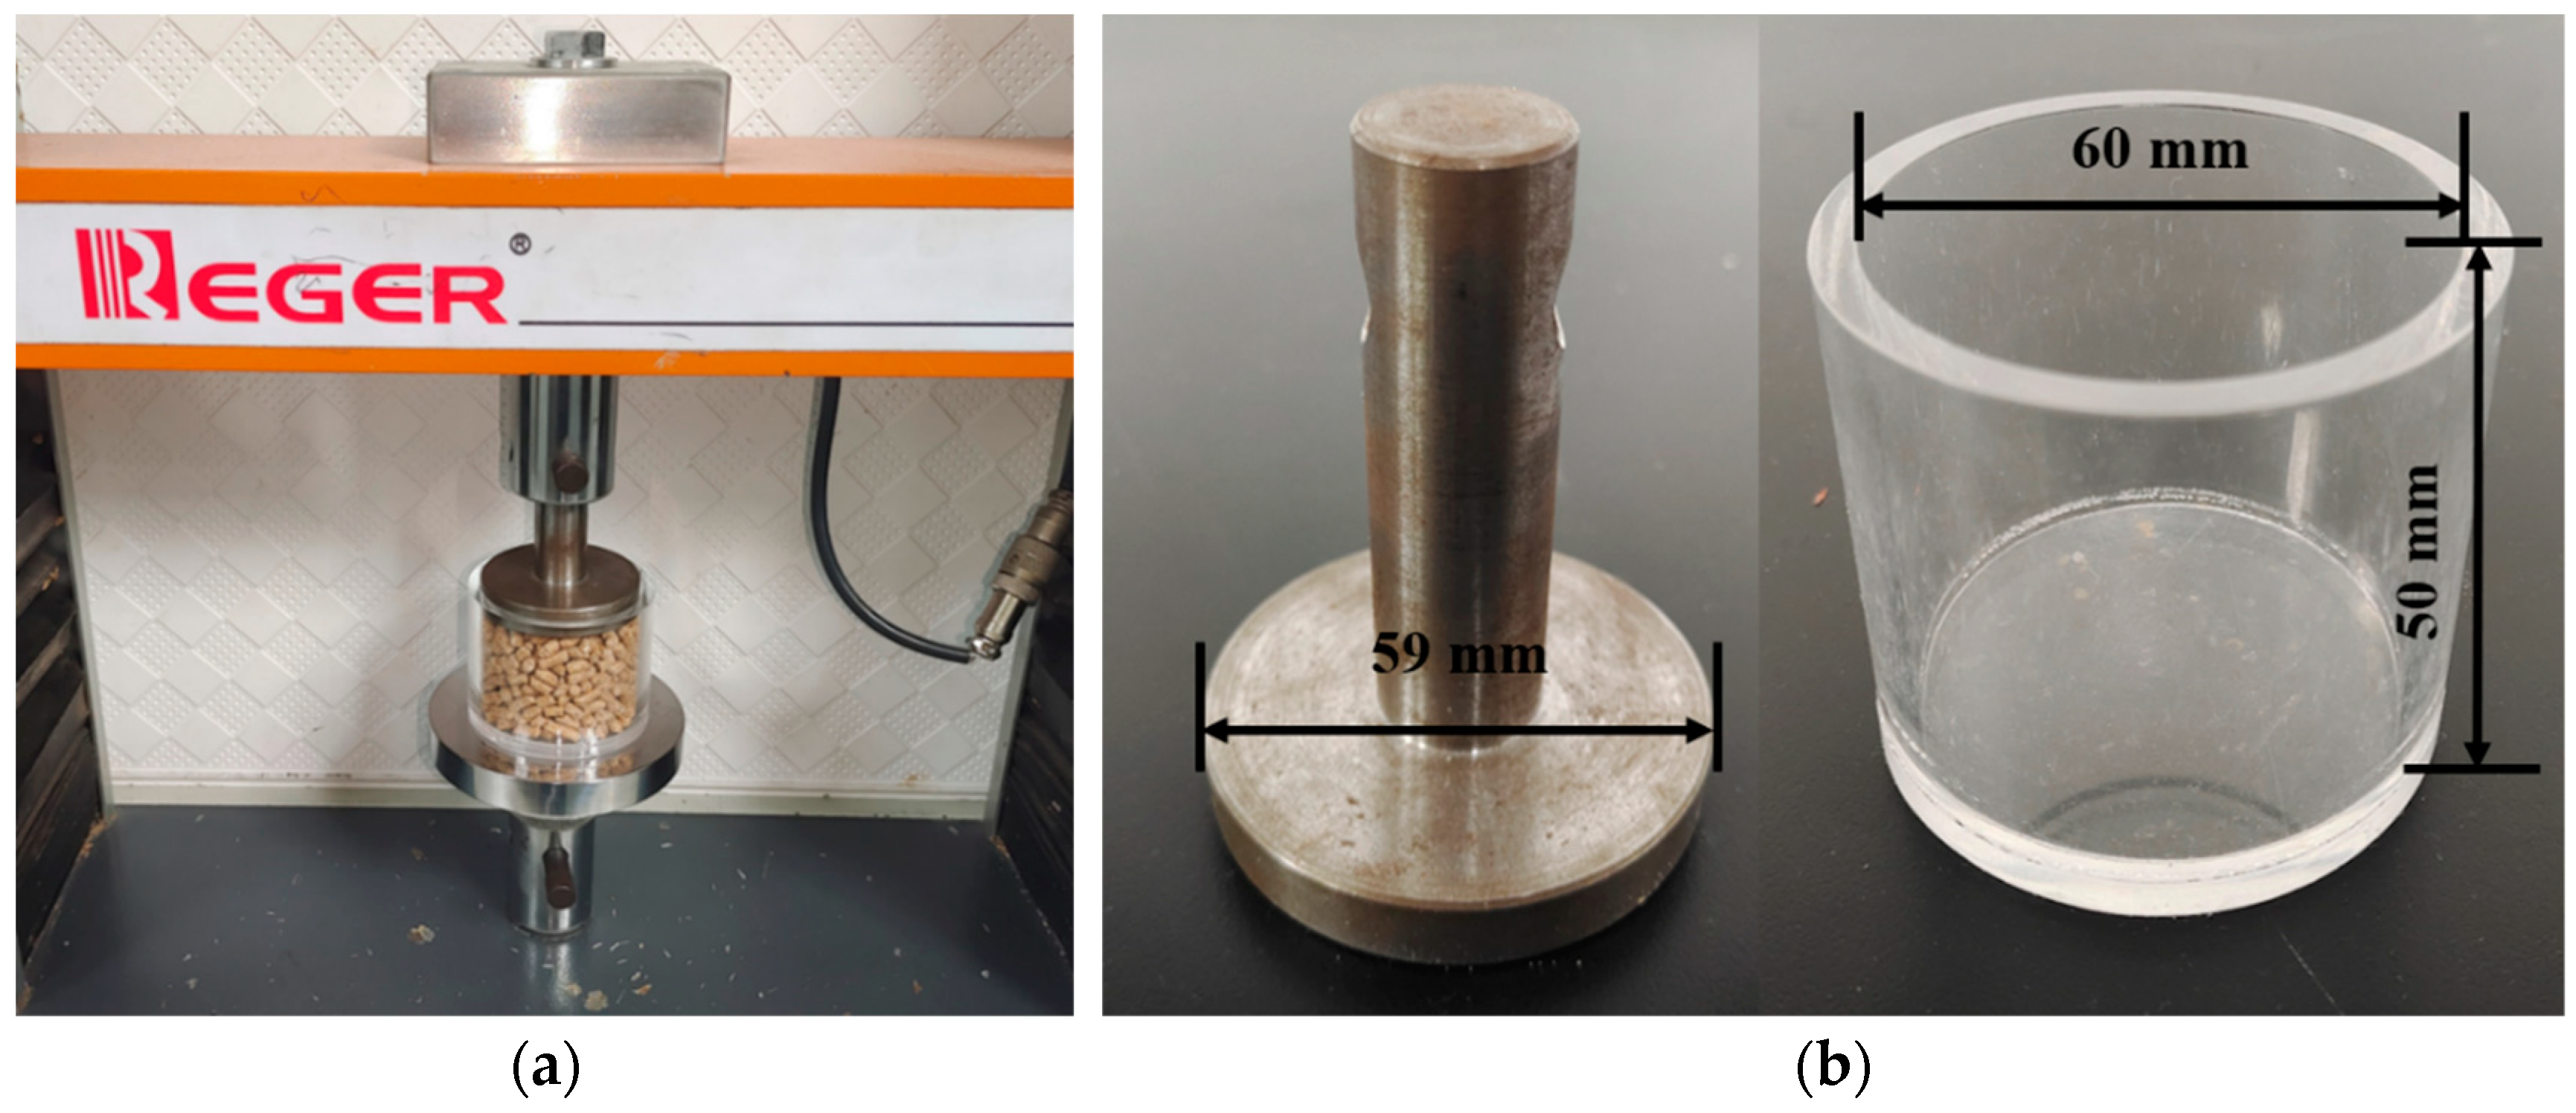
2.2. Experimental Equipment

A universal testing machine RG-M3005 (Shenzhen Reger Instrument Co., Ltd., Shenzhen, China) was used to determine the compression characteristics of feed particle beds, as shown in Figure 2a. The speed range of the loading probe driven by the servo motor was 0.5–500 mm/min, and the maximum range of the pressure sensor was 5000 N. A speed of 2 mm/min [34] was selected in this research. According to the design rules [35], the inner diameter and height of the container were designed with values of 60 mm and 50 mm. The mass of feed pellets was selected at 80 g according to the volume of the container. The diameter of the probe was designed as 59 mm (Figure 2b).
The repeated impact tests were conducted using the single particle impact equipment [14], as shown in Figure 3. The particle impact chamber, collection box, accelerator tube, and particle inlet make up the majority of this apparatus. The power source was supported by high-pressure nitrogen. The collision process was recorded using a Phantom high-speed camera (Vision Research, Wayne, NJ, USA) with a resolution of 2048 × 1952, a sample rate of 3300 fps, and an exposure time of 1 × 10⁻⁴ s. Twenty replications were conducted. The impact velocity (v) of the feed pellet could be obtained by extracting the pellet features from the captured images and substituting them into Equation (1).
v = Δ s × 3300 ( f 2 f 1 ) × D
where f1 and f2 are picture frames; Δs is the movement distance of the feed pellet in mm; and D is the ratio of the reference distance to the actual distance, which is 0.41.
The relationship between air pressure and the impact velocity of the feed pellet was obtained using a pre-test, as shown in Figure 4. In this experiment, the impact tests were conducted with air pressures of 0.25 MPa, 0.30 MPa, and 0.35 MPa, and were divided into three groups by different air pressures. The impact velocities were 6.63 m/s, 8.72 m/s, and 10.77 m/s, respectively. Samples weighing 50 g [36] were selected for each group.

2.3. Experimental Methods

2.3.1. Repeated Compression

In repeated compression tests, the test process was as follows: 80 g samples were randomly selected and put into the container, and the initial height of the feed particle bed was recorded; after clicking the start button, the probe in the universal testing machine decreased until the force on the probe was equal to the set value; the probe returned to the initial position and one cycle was finished; and the PSD of feed pellets in the container was obtained by sieving after different loading cycles. The repeated compression tests were conducted with loading forces of 2500 N, 3500 N, and 4500 N. The number of loading cycles was from one to ten in each group of loading forces. In one group, ten separate runs were conducted with the force applied once, twice, or up to ten times. Each test was repeated three times.

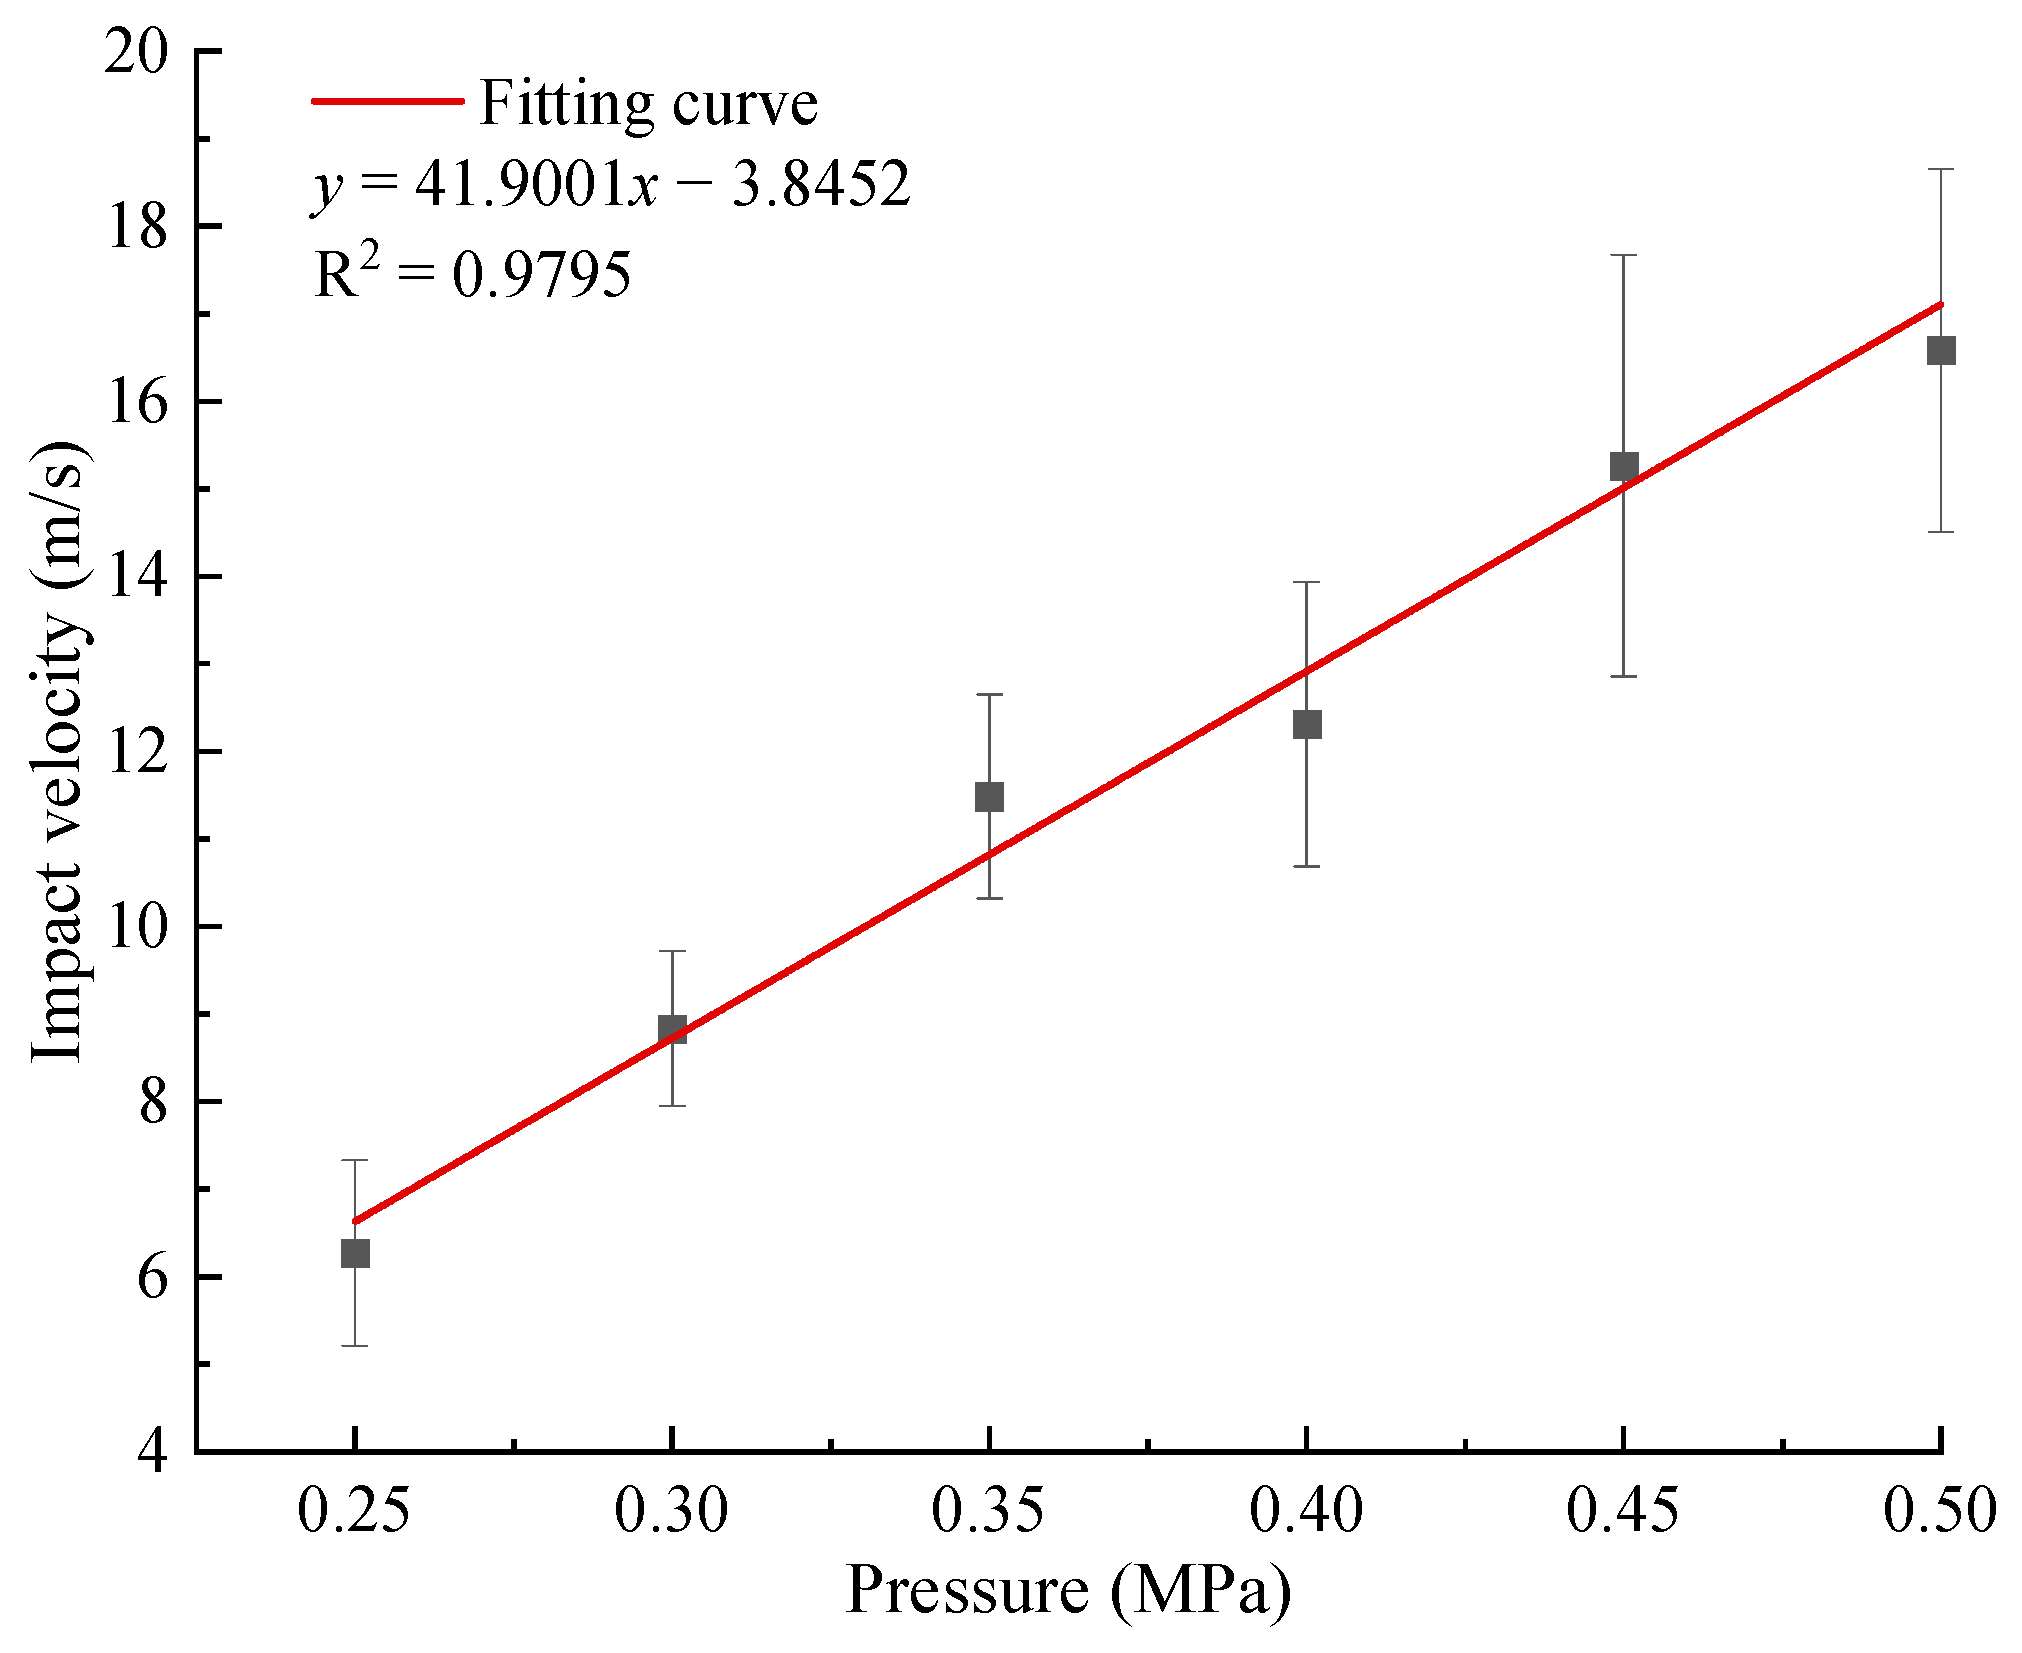
2.3.2. Repeated Impacts

In repeated impact tests, the operating principle was as follows: 50 g samples were randomly selected before impact; feed pellets were released from the ball valve one at a time into the acceleration zone, where they were accelerated by nitrogen; the accelerated feed pellet collided with a steel plate in the particle impact chamber, where pellets could be captured by a high-speed camera; and after impact, the impacted feed pellets were collected in the collection box. When all samples collided with the steel plate, one cycle was completed; the PSD of the feed pellets was obtained by sieving after one loading cycle. Unbroken particles (>3.35 mm) were tested again in the next cycle with the same settings. The number of loading cycles was from one to ten in each velocity group. In one group, feed pellets were impacted under one air pressure once, twice, or up to ten times.

2.4. Evaluation of Breakage Characteristics

2.4.1. Size Distribution Function

Some parameters were defined to quantify the particle diameter for damaged particles after compression:
x i = d i d 0
where di is the aperture of the sieve in mm; d0 is the largest diameter of feed pellets and can be valued as 4.18 mm (average diameter). Assuming that yi is the mass percentage for particles with diameters smaller than di, the following is the description of the Weibull distribution function for yi:
y i = 1 e ( x i λ ) k
where λ and k are the breakage characteristic index and breakage degree, respectively [33].
Take the logarithm twice for Equation (3), then the formula can be transformed as:
ln [ ln ( 1 1 y i ) ] = k ln x i k ln λ
In accordance with the ASAE S319.4 standard [37], mesh diameters of 3.35 mm, 2.36 mm, 1.70 mm, 1.18 mm, 0.85 mm, 0.60 mm, and 0.43 mm were selected to classify the PSD of feed pellets. The sample was sieved using a standard screen after each cycle. The mass of each fraction was collected, and the relative mass was calculated. The particles of each fraction are shown in Figure 5.

2.4.2. Pulverization Rate

According to ASAE standard [2,38], the pellet durability index (PDI) of feed pellets can be calculated by Equation (5):
P D I = ( M 0 M f ) / M 0 × 100 %
where M0 is the total mass of feed pellets in the test in g; Mf is the mass of particles (<3.35 mm), g. The pulverization rate S can be expressed by:
S = 1 P D I = M f / M 0 × 100 %

2.4.3. Mass-Specific Energy

The mass-specific compressive energy WC,m is defined as follows:
W C , m = s = 0 s = s c F ( s ) d s m p
where sc is the displacement at the maximum loading force in mm; mp is the mass of feed particle bed in g.
In impact tests, the mass-specific impact energy ES can be expressed by:
E S = 1 2 × v a 2
where va is the average velocity of feed pellets in m s−1.
The cumulative energy in the repeated compression and impact test is defined as the sum of energy before this cycle when the loading cycle is greater than 1. For example, if the compression cycle is 2, the energy is the sum of the energy of the first compression and the second compression.

2.4.4. Fitting Model

The model developed by Vogel and Peukert [39] takes loading cycles into consideration with parameter l (Equation (9)), which is important in repeated impact tests. Furthermore, the model was successfully used for agricultural material assessment [40,41]. Therefore, the model was selected to assess the pulverization rate of feed pellets during repeated compression and impacts. The breakage probability in the model of Vogel and Peukert was replaced by the pulverization rate (Equation (9)), and the model was used to evaluate the results of repeated compression tests and repeated impact tests. The formula is defined as follows:
S = 1 exp { [ f M a t l ( E m , i n E m , min ) ] α }
where fMat, Em,min, α are the fitting parameters; Em,in is the compression or impact energy in one cycle, J/kg.

3. Results and Discussion

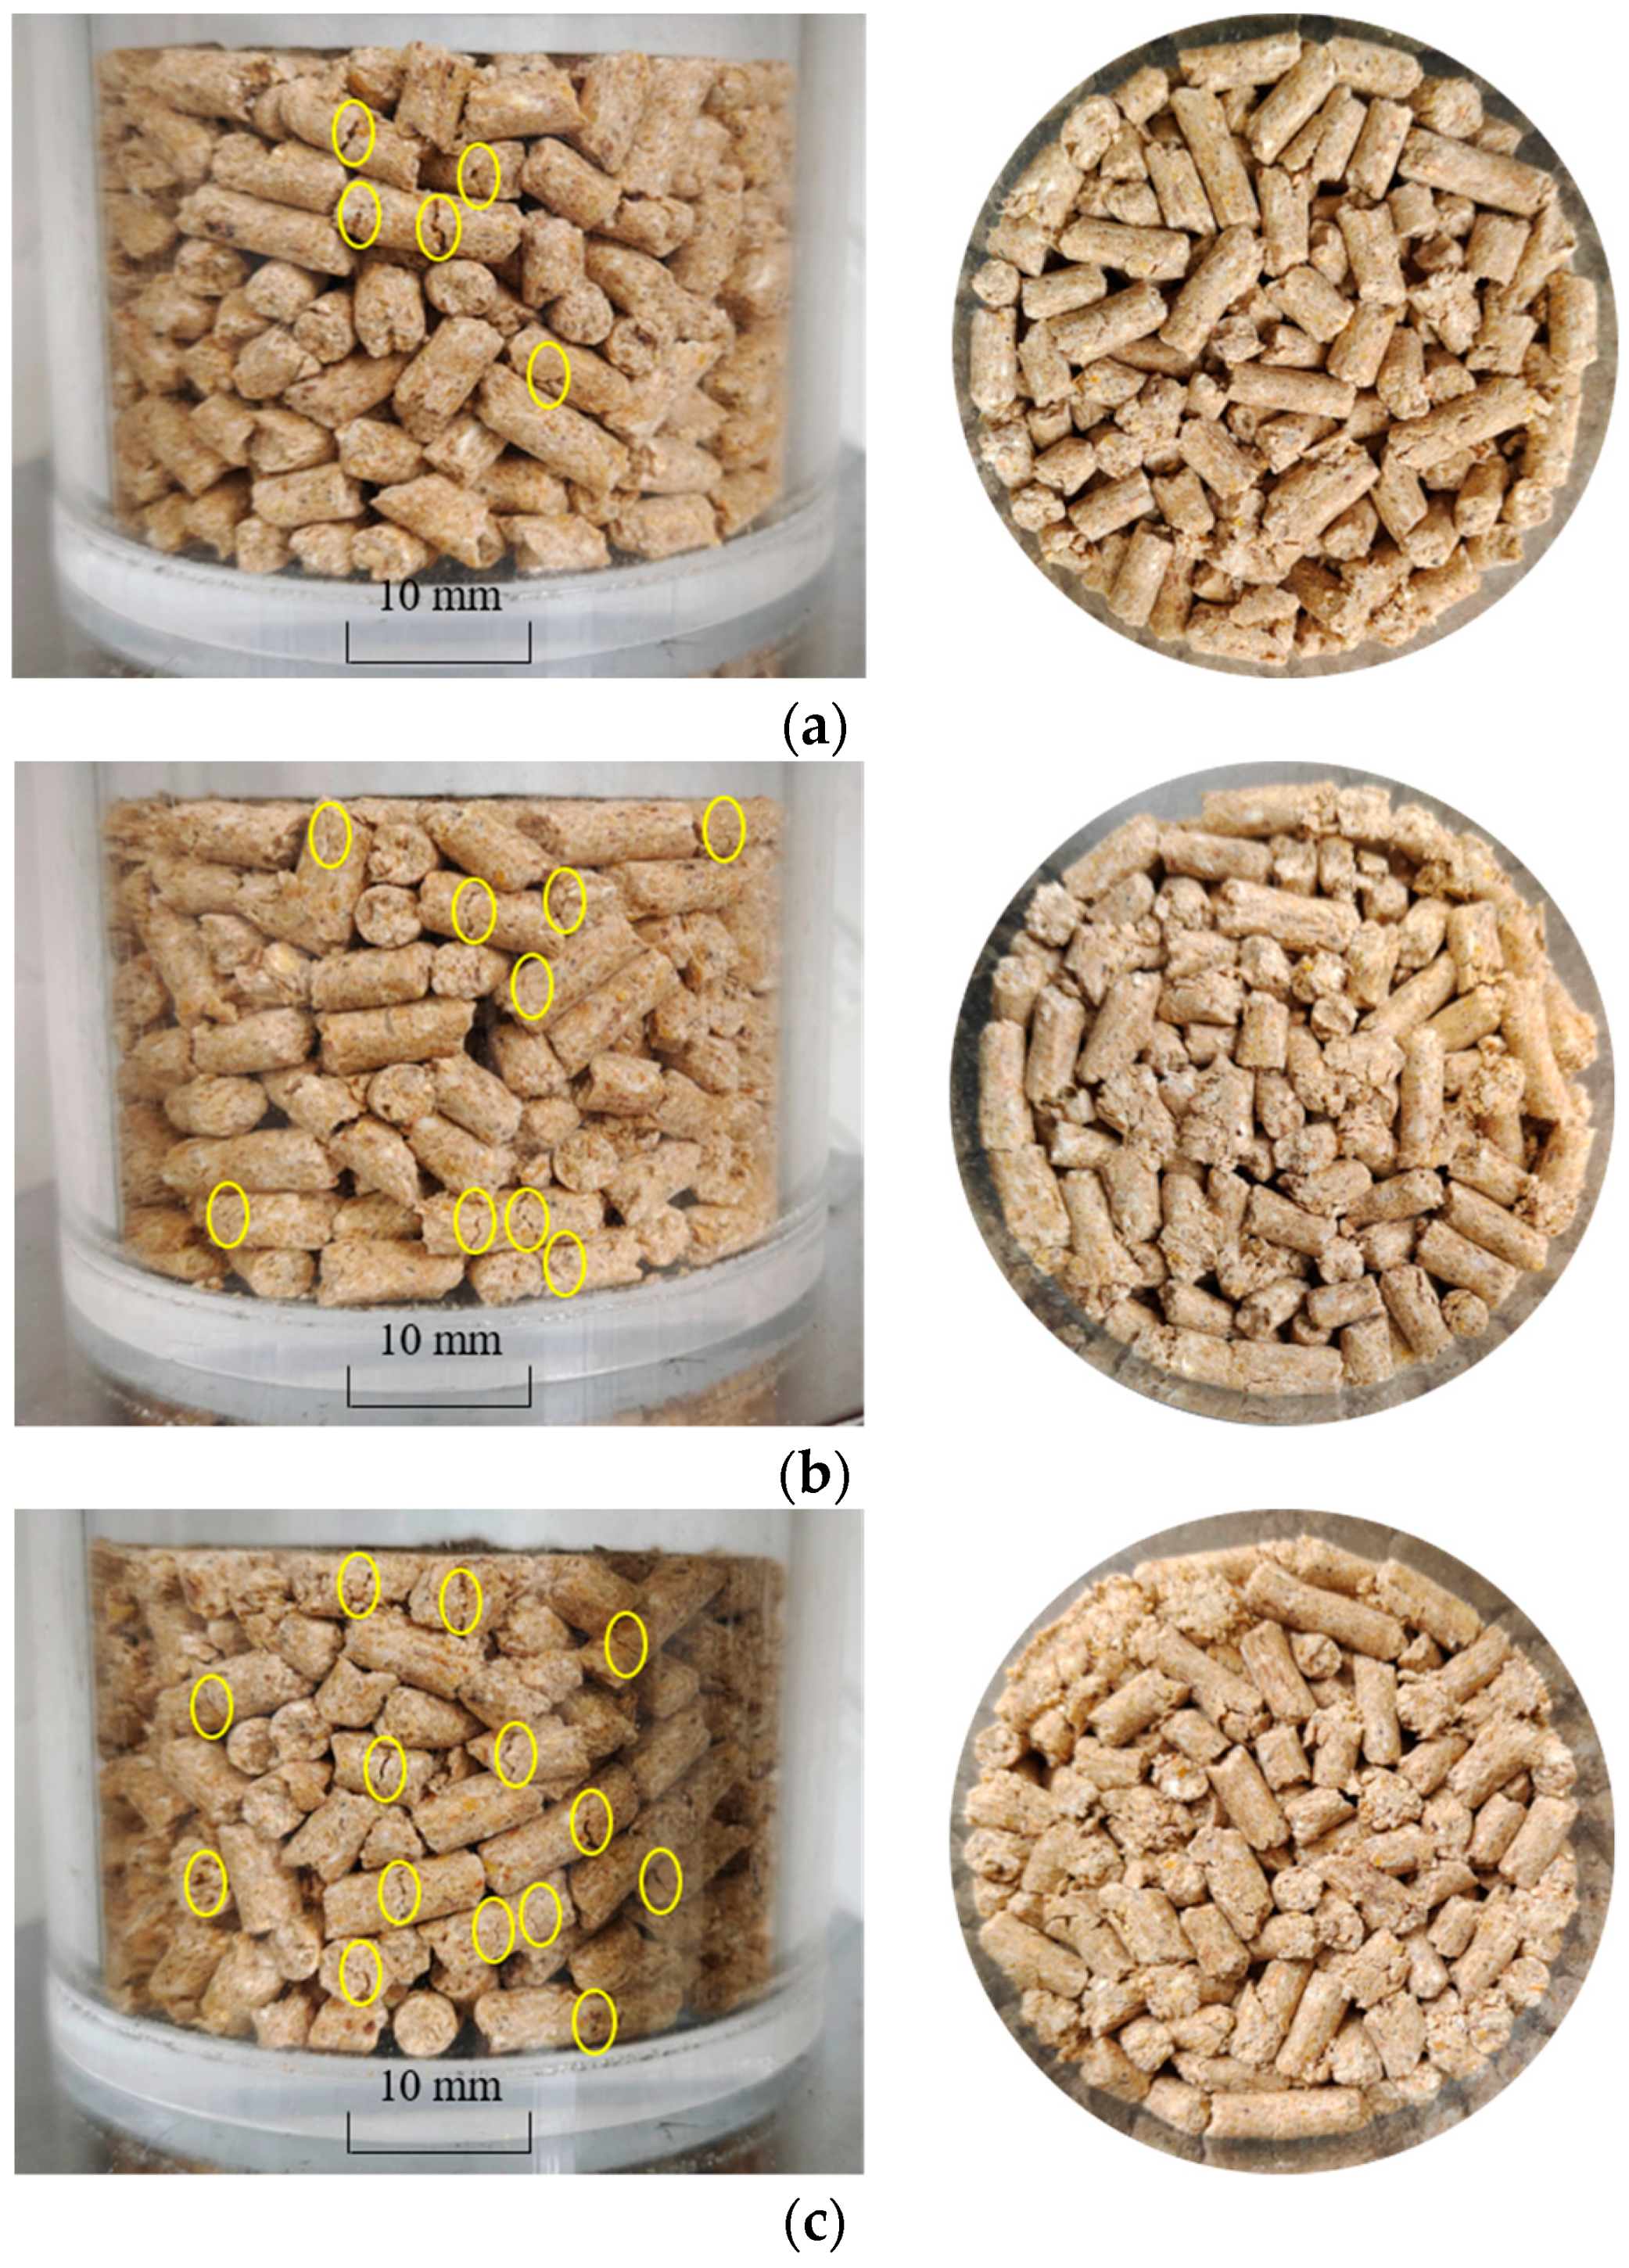
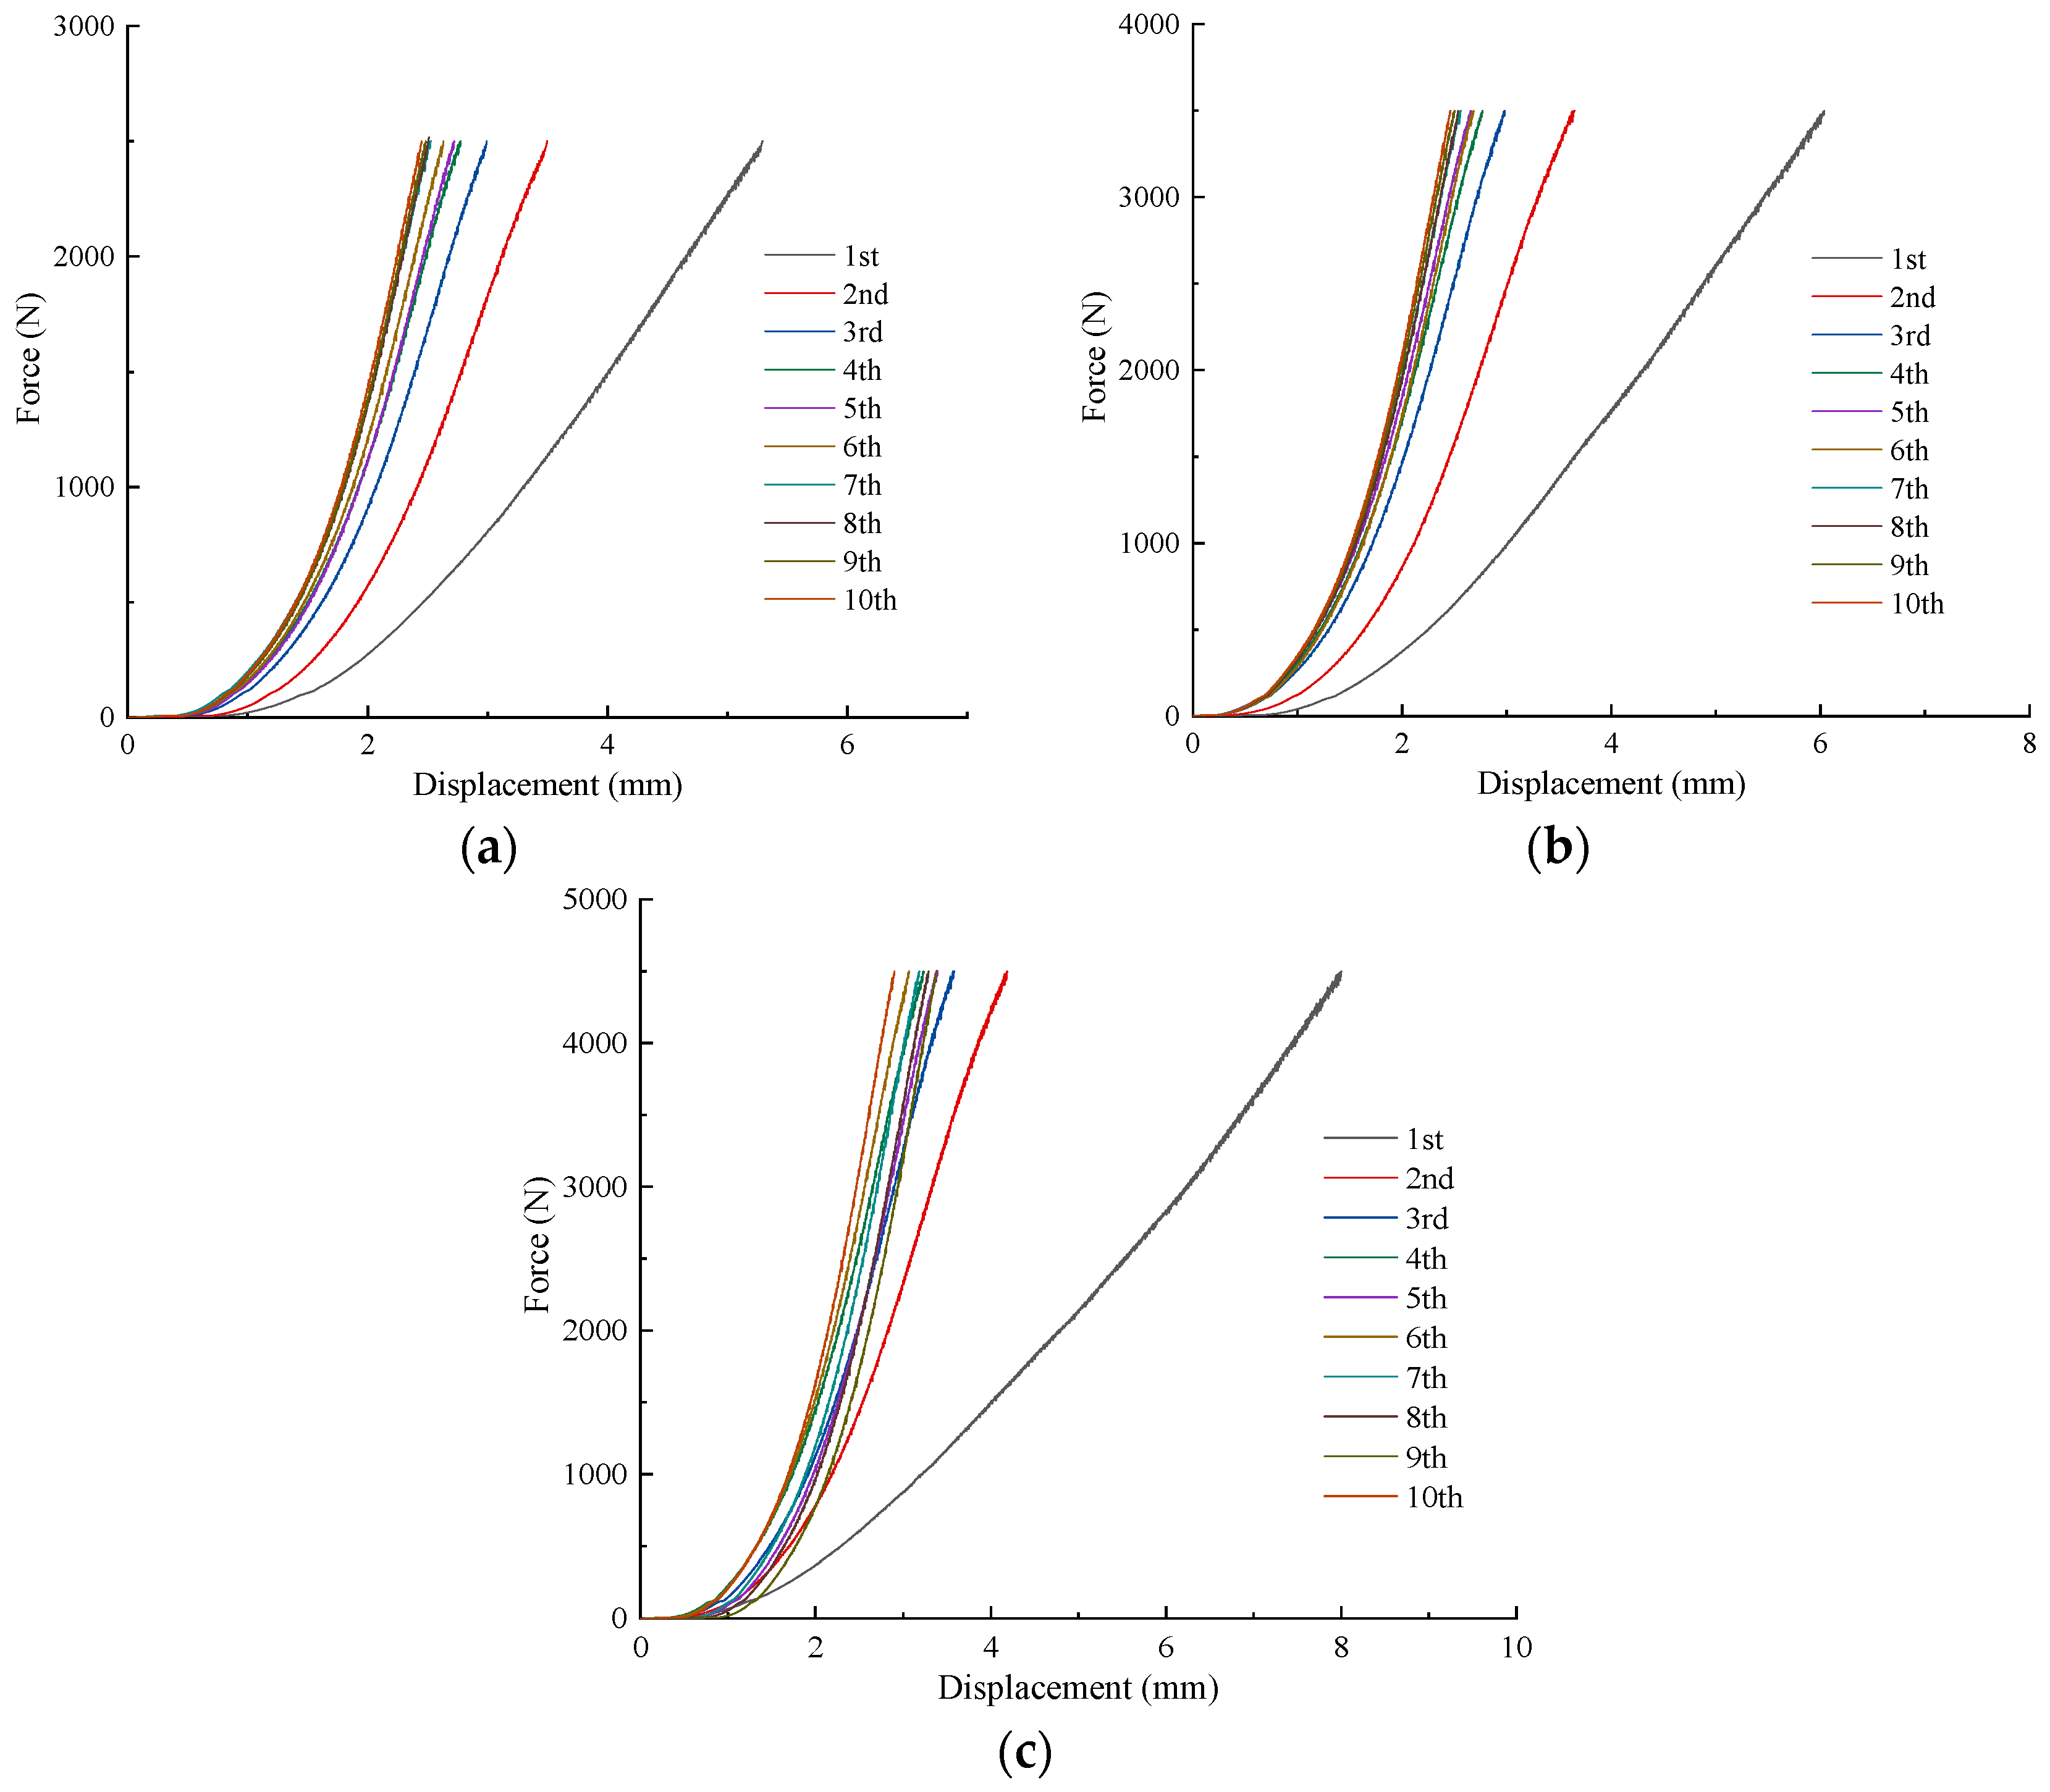
3.1. Breakage Behaviors of Feed Pellets

The breakage behaviors of feed particle beds after the tenth compression are shown in Figure 6. Notably, proximity to the probe correlates with a greater degree of breakage in the feed pellets. Figure 6 also shows that the density of cracks (circled with a yellow ellipse) increases with the increase of loading force. These phenomena can be attributed to the gradual increase in porosity from top to bottom [42] within the feed particle bed, coupled with a corresponding decrease in the deformation of the feed pellets. To further investigate the compression characteristics of feed particle beds, the force–displacement curves of the particles were analyzed.
Figure 7 shows the force–displacement curves of feed particle beds under successive compressions. In the first loading, the displacement of the feed particle bed is the largest. With the increase in loading cycles, the displacement caused by particle bed compression gradually decreases and tends to be stable. After several compressions, the feed particle bed primarily undergoes elastic deformation, with only a small amount of plastic deformation. Additionally, a decrease in loading force corresponds to a reduction in particle bed displacement, suggesting that as the loading force increases, the feed particle bed becomes more densely packed.
According to the force–displacement curves of feed particle beds and previous studies [19,43], the repeated compression process can be divided into three stages. In the first stage, contact between feed pellets is primarily point and local contact, leading to high porosity and an unstable structure within the feed particle bed. The loose structure will be destroyed under compression. In the second stage, the porosity of the feed particle bed decreases, and the contact area between feed pellets increases. Compressive stress is transmitted between the feed pellets, leading to an increase in the breakage degree. In the third stage, the feed pellets are compacted into an agglomerate under repeated stress. Feed pellets surrounded by broken particles are difficult to damage.
The feed pellets (>3.35 mm) after 10 repeated impacts are shown in Figure 8. The length of the feed pellets decreases with the increase of air pressure. Unlike the repeated compression tests, where particles are subjected to indirect forces, each pellet in the impact test is directly affected by the impact load. When the impact load exceeds the strength of the feed pellets, breakage occurs. The breakage process of a single pellet under impact could be found in the literature [14]. Therefore, it can be concluded that breakage and cracks may occur continuously, leading to a progressive reduction in the size of the feed pellets.

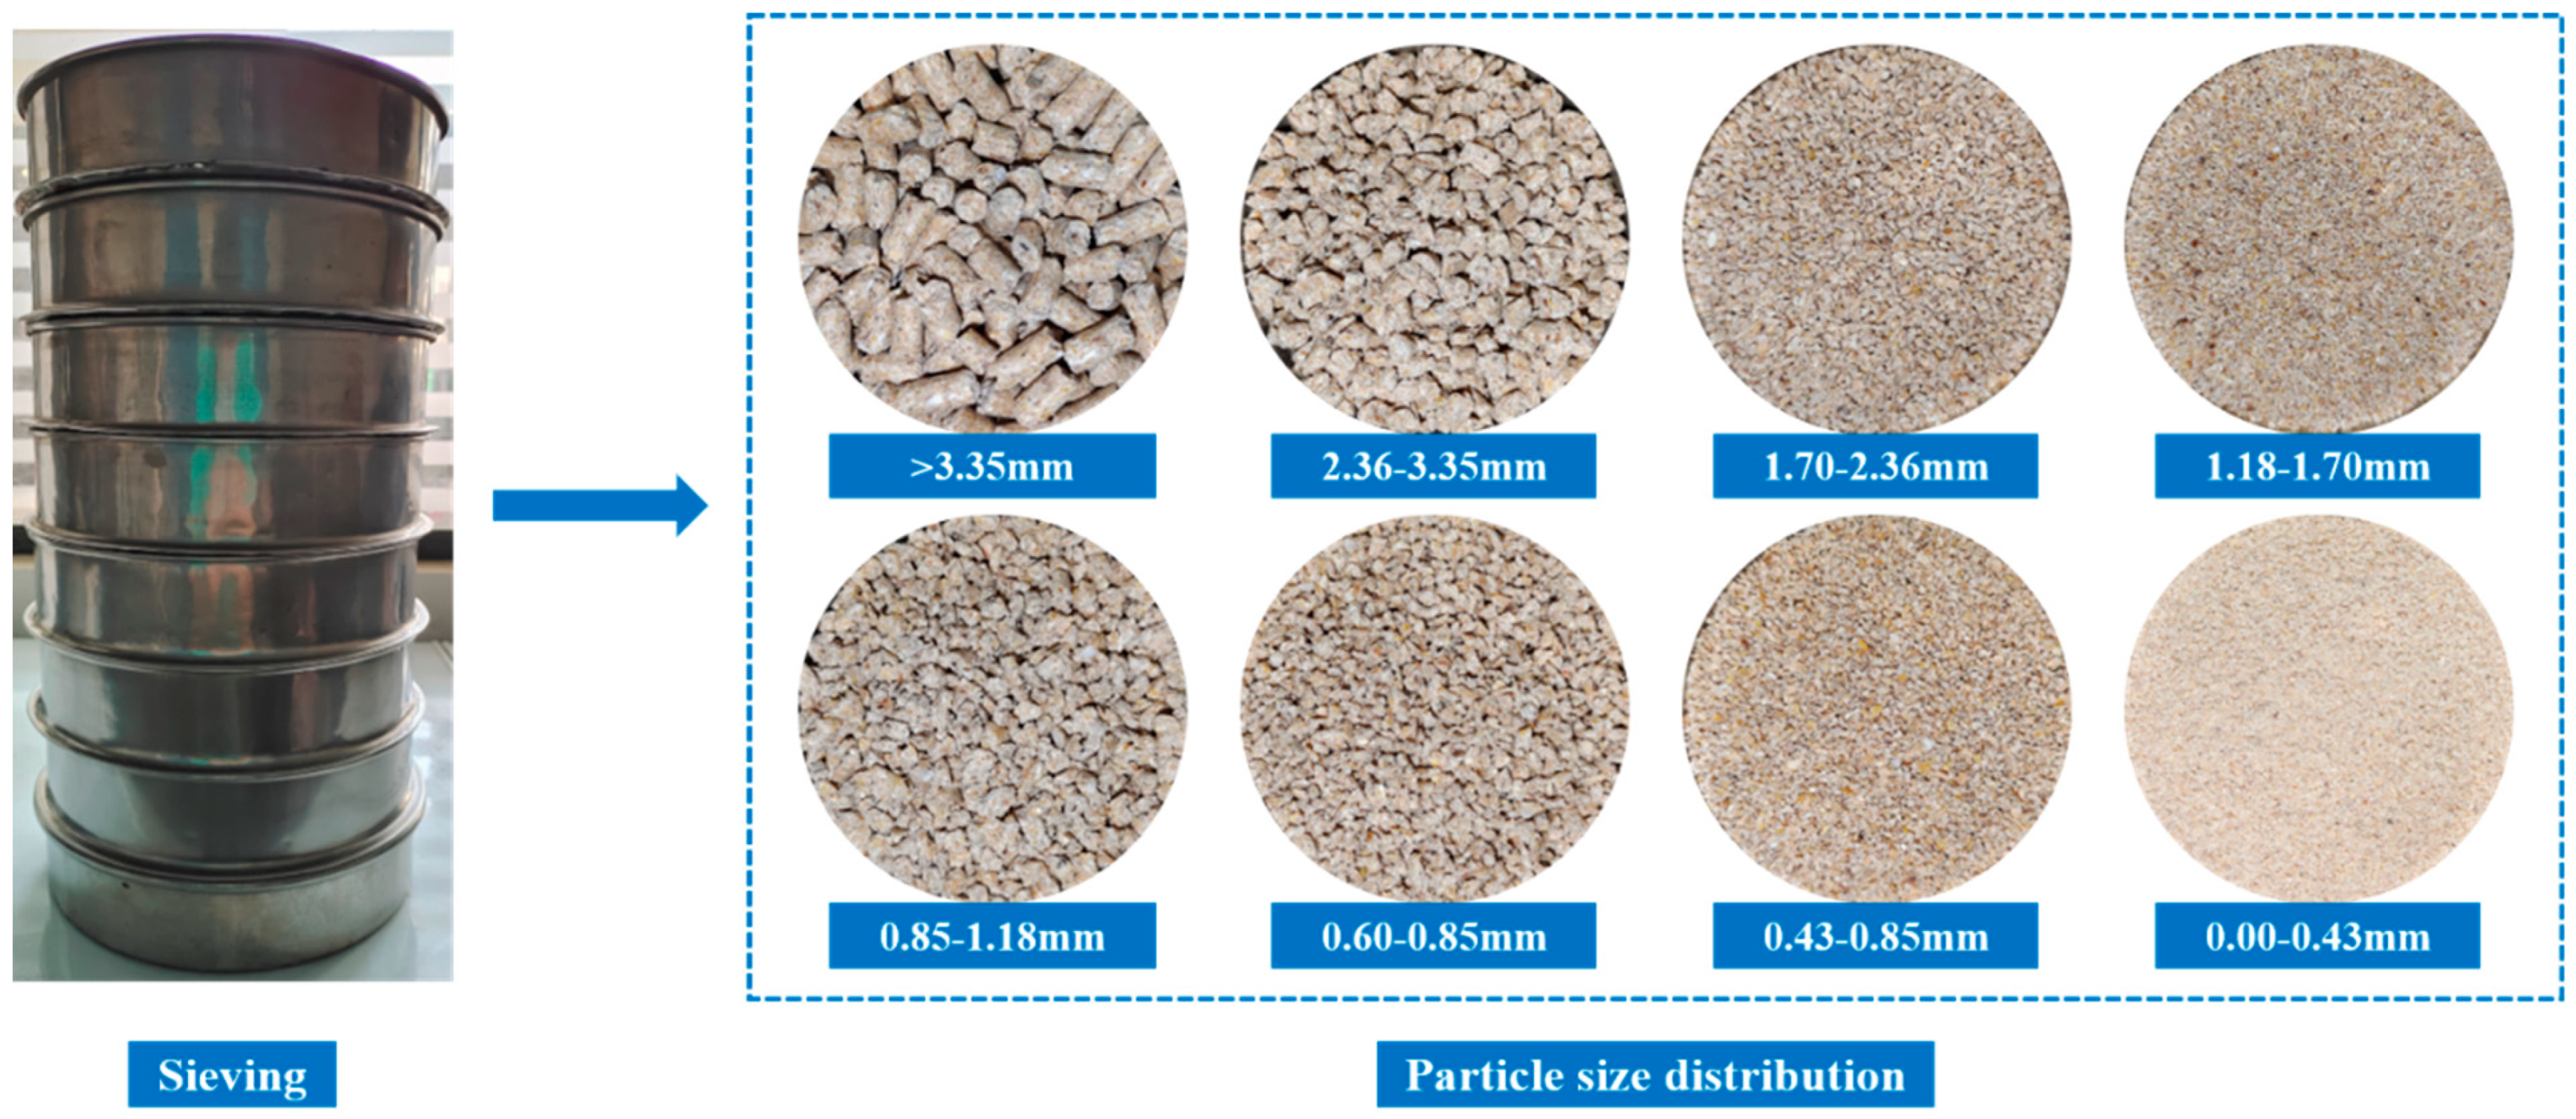
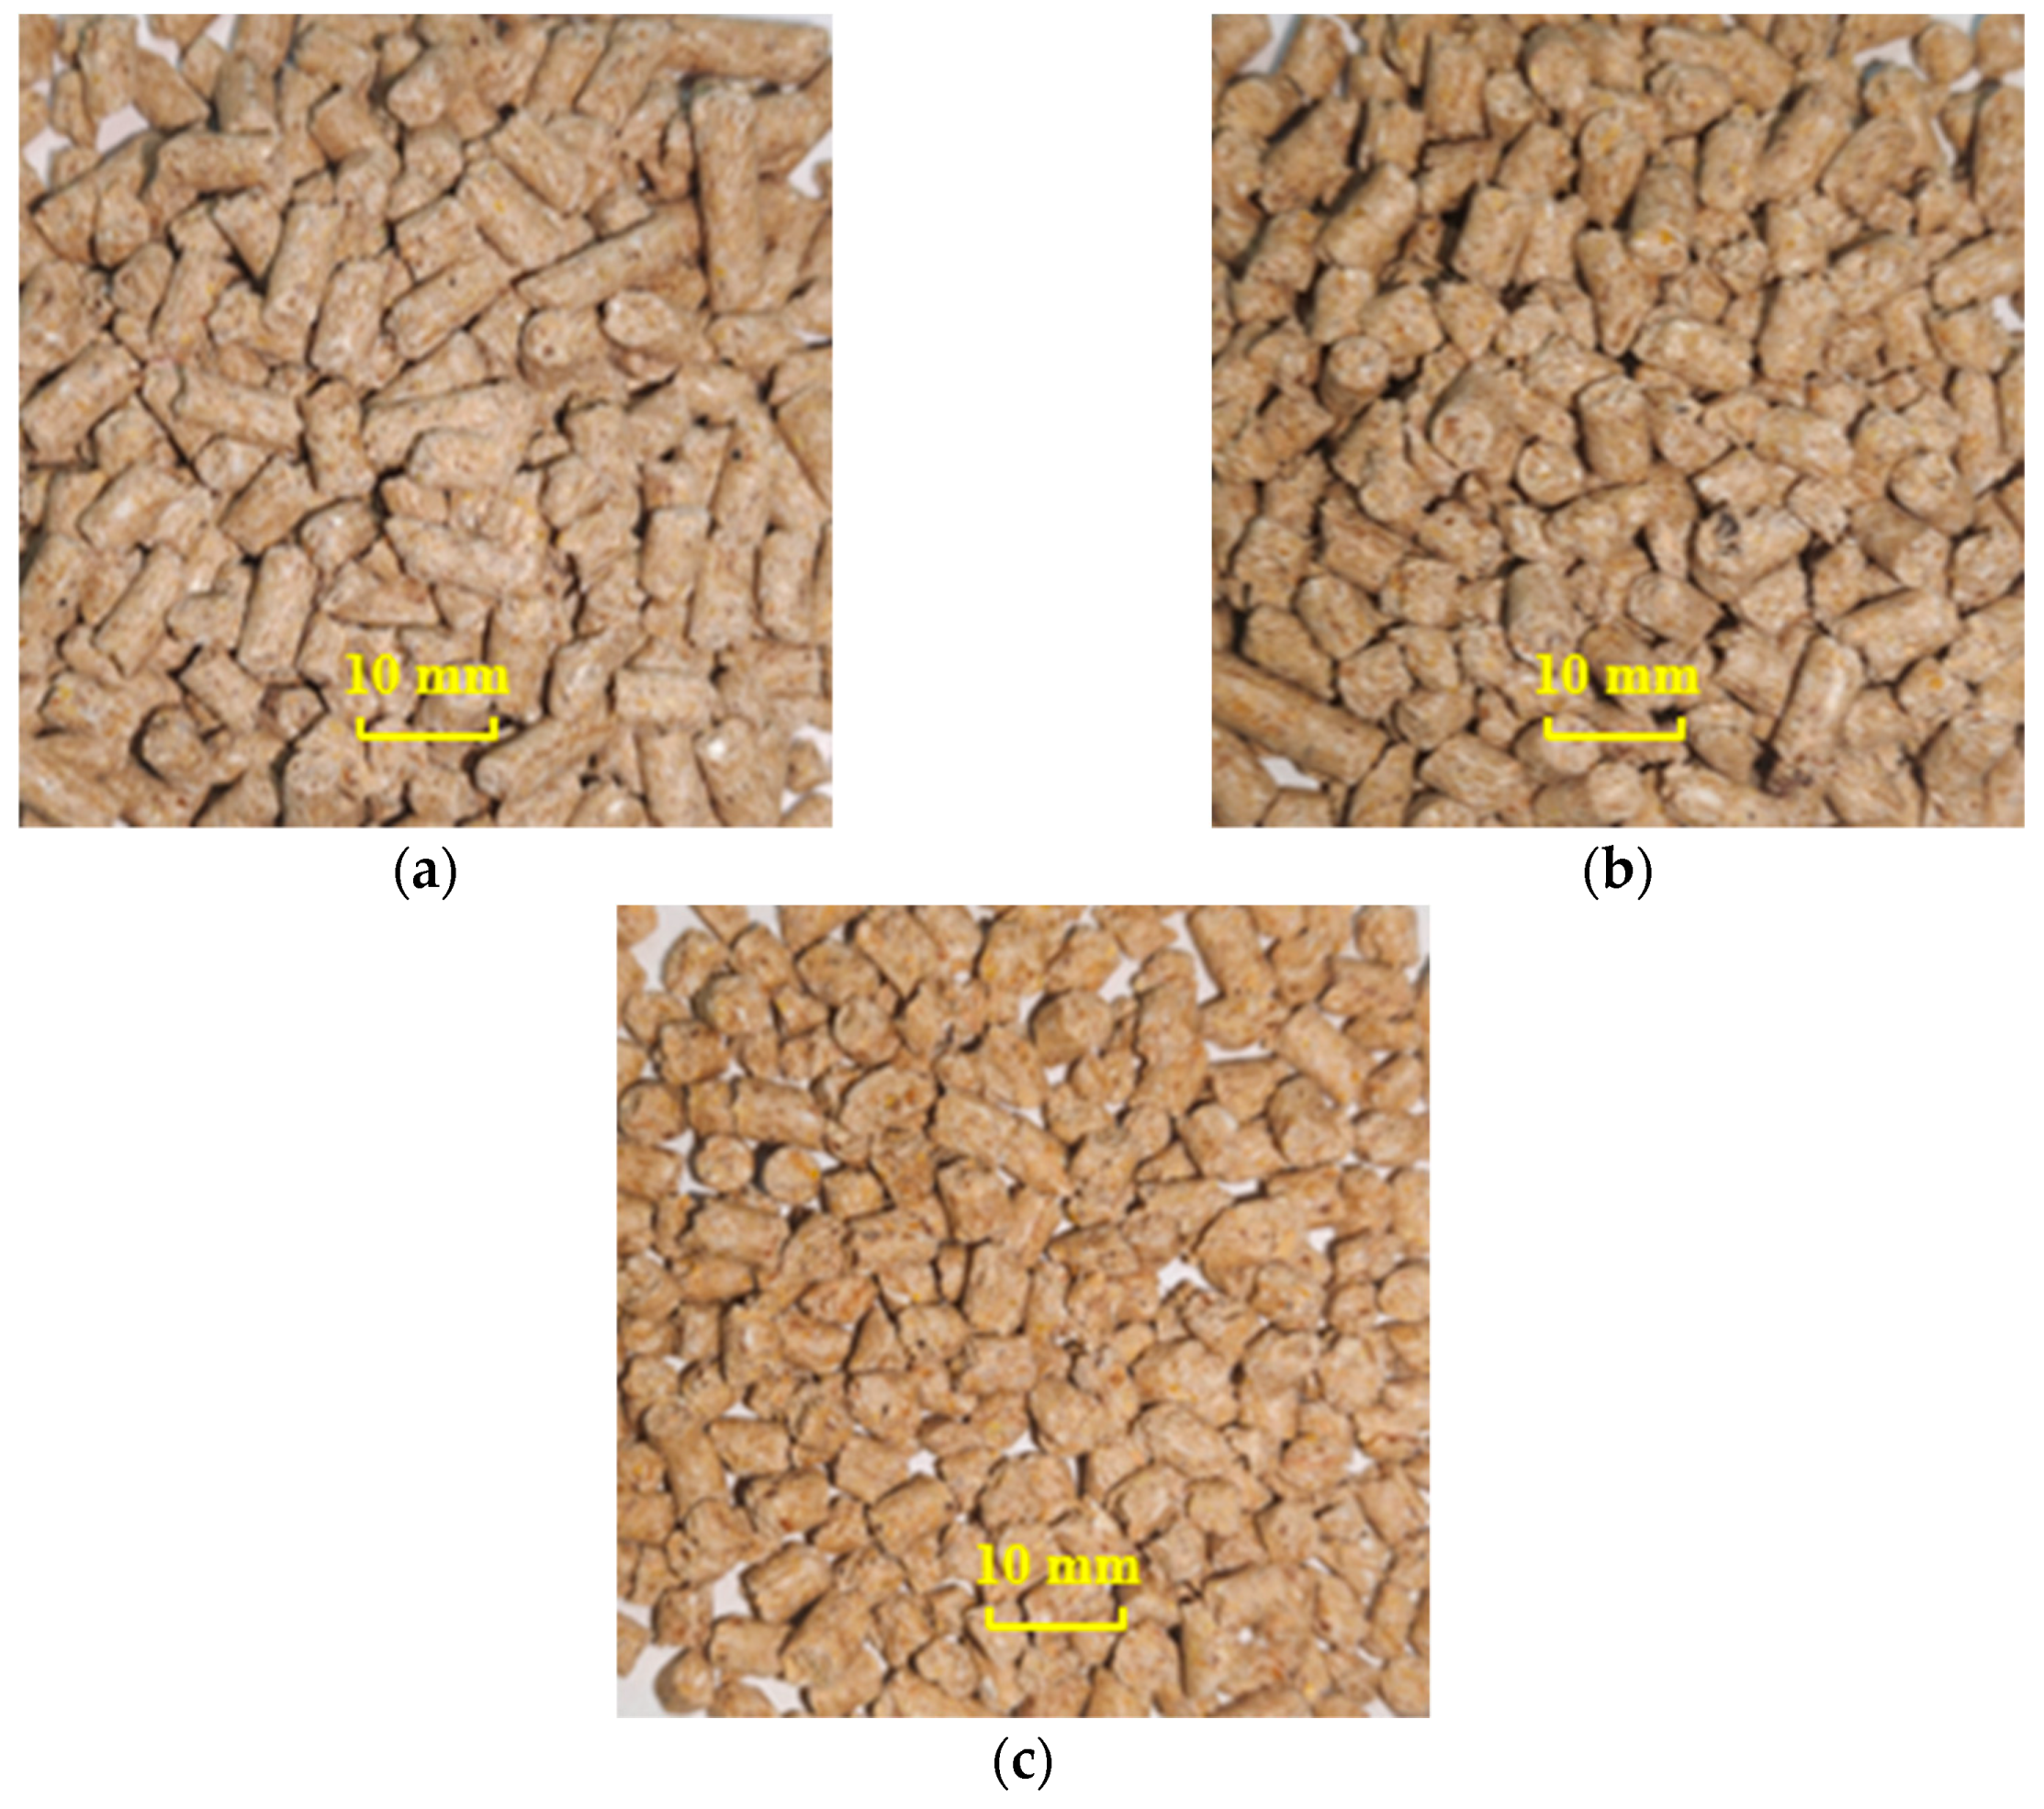
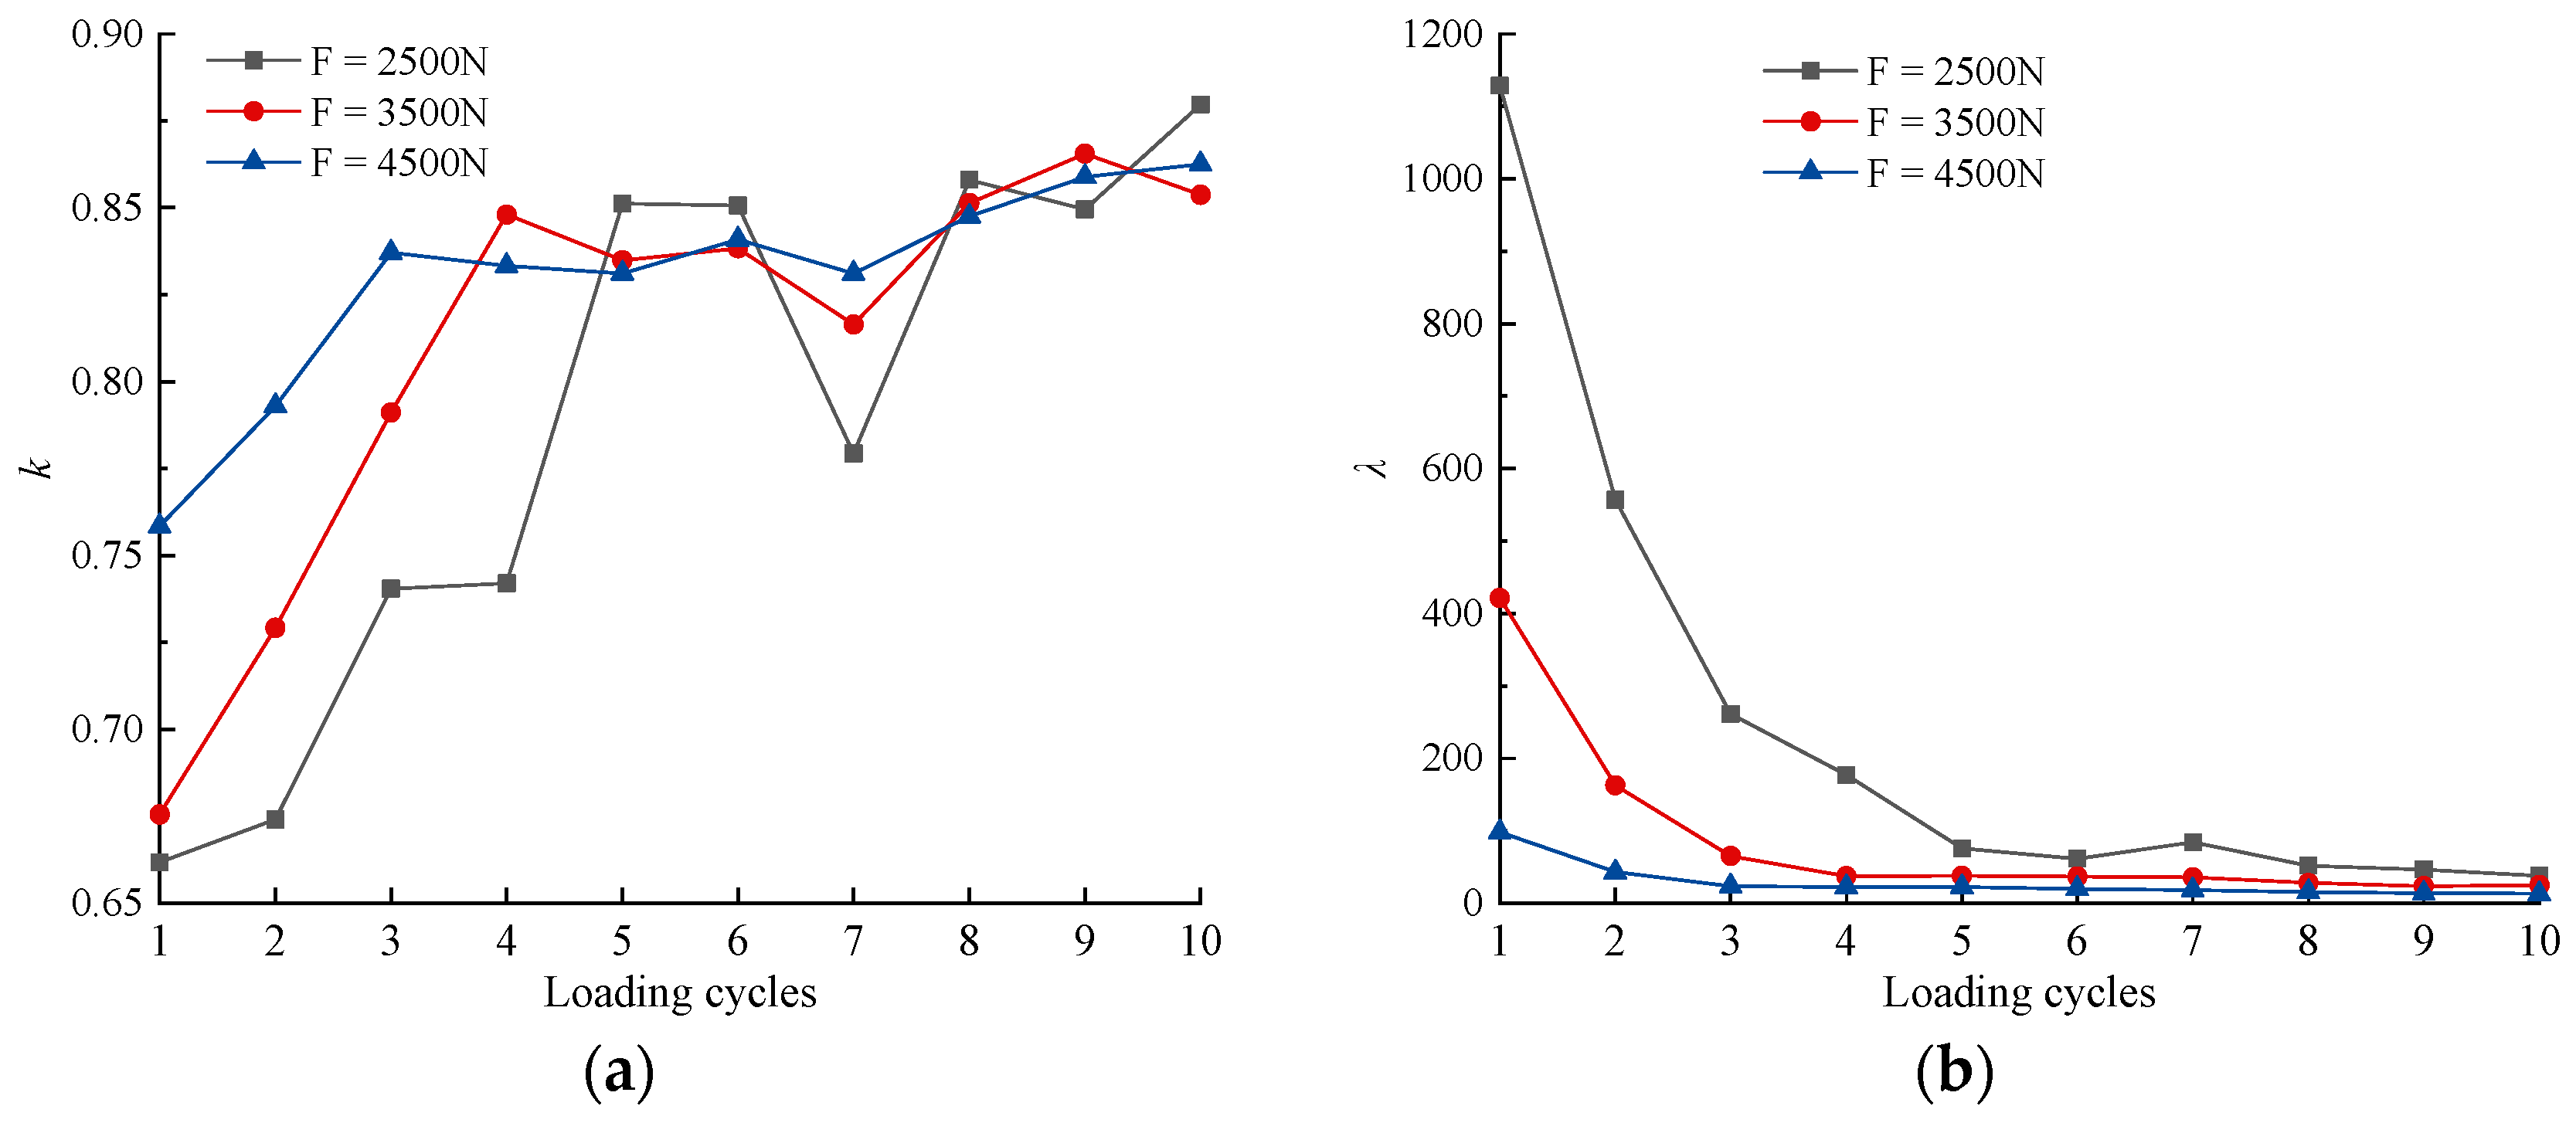
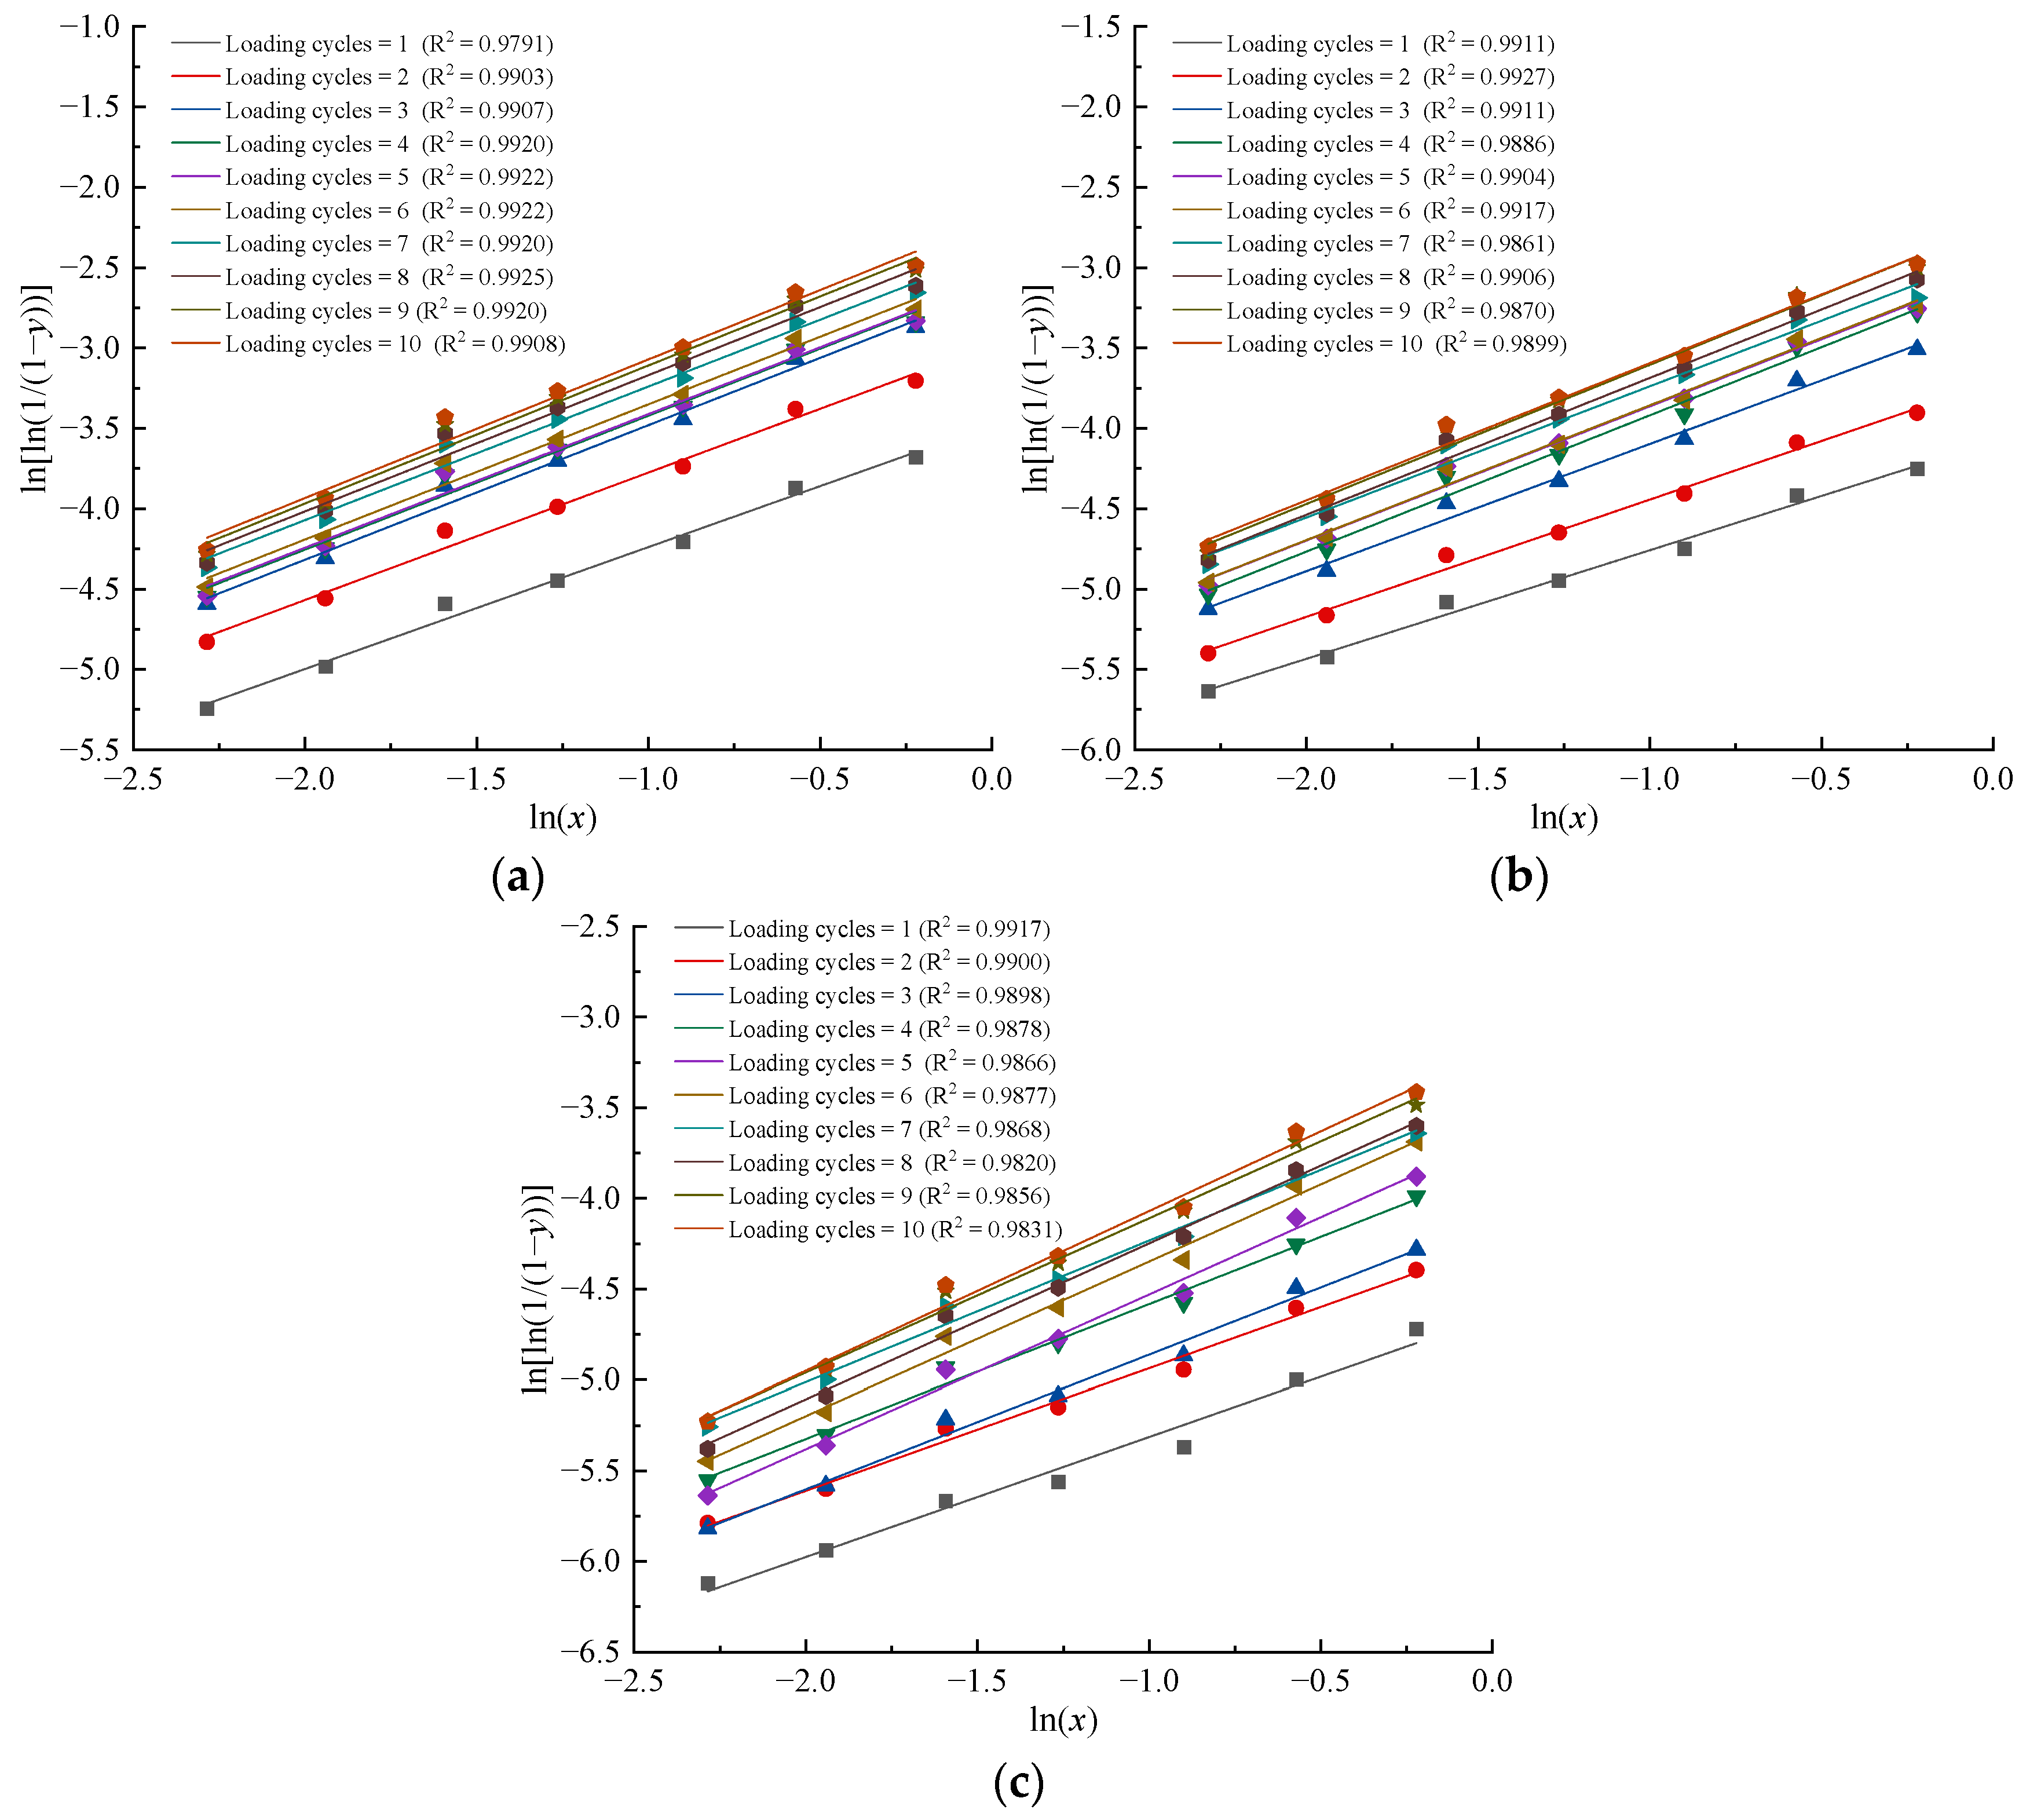
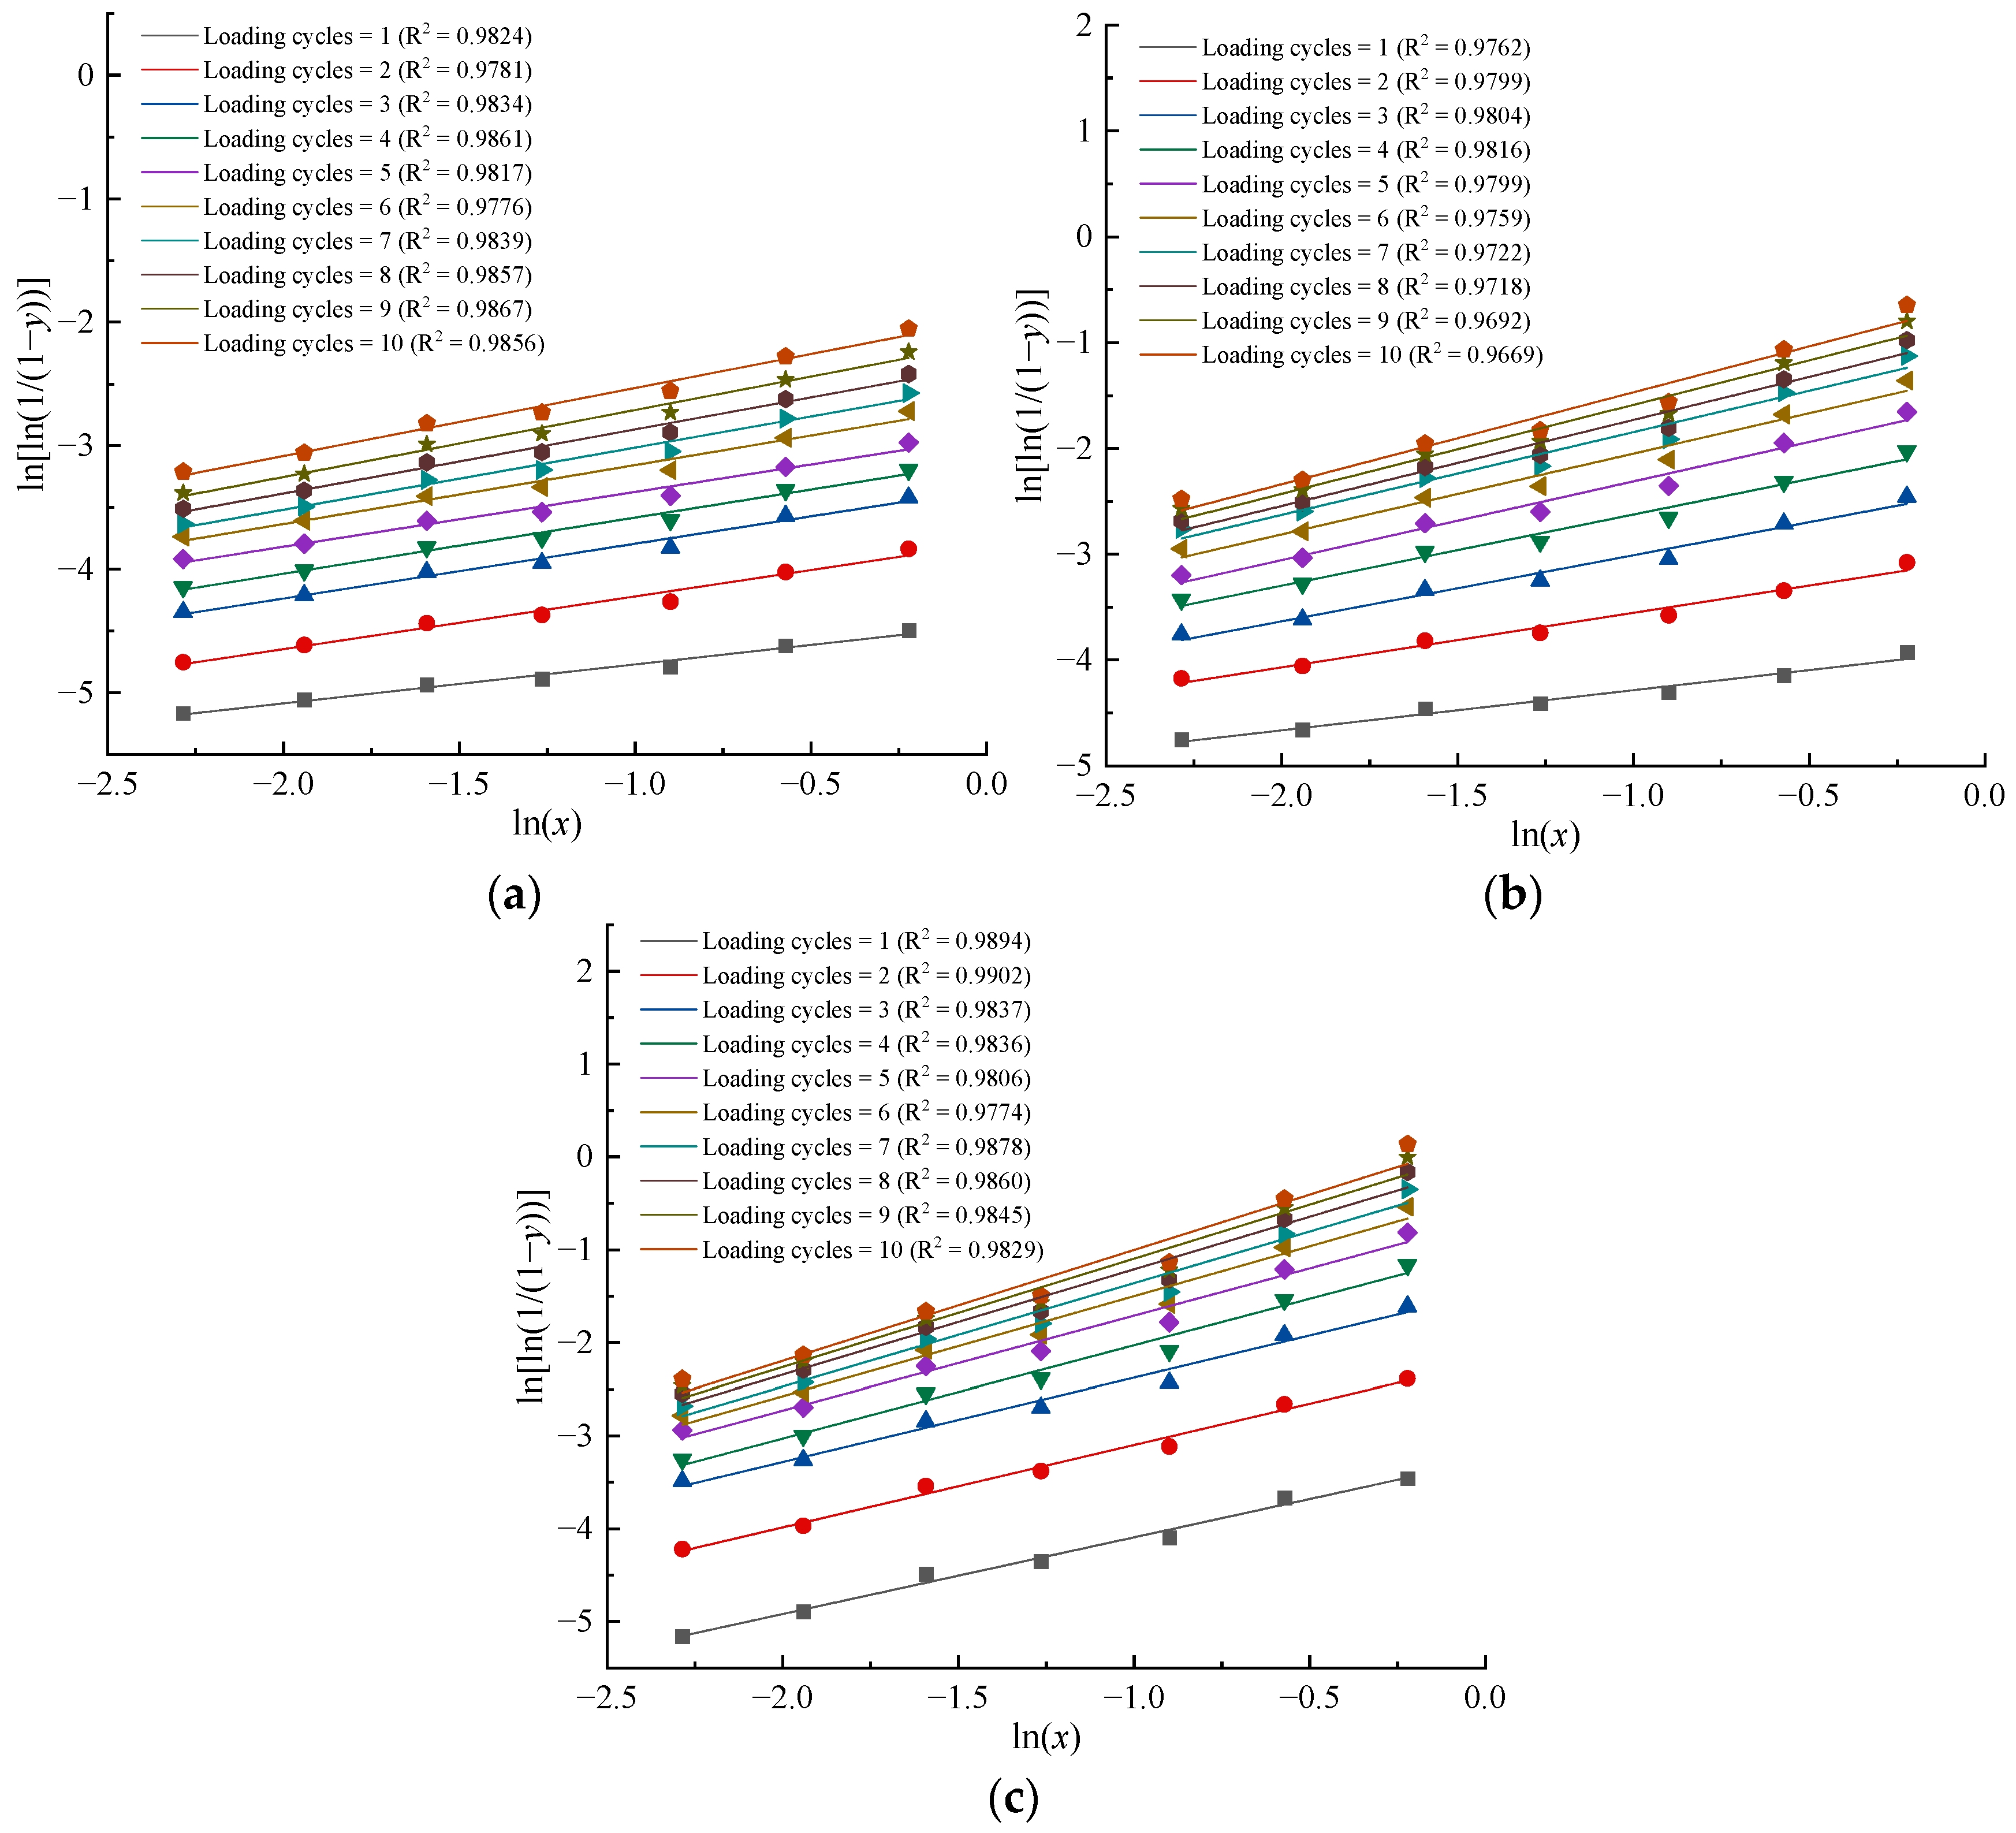
3.2. Particle Size Distribution

In order to describe the breakage characteristics quantitatively, the PSDs of feed particle beds under repeated compression were collected and fitted with the Weibull function (Equation (3)). The variations in the parameters k and λ are depicted in Figure 9. As the number of loading cycles increases, the k value curves exhibit an initial upward trend before stabilizing, while the λ value curves decrease initially and then reach a stable state. Lower loading forces correspond to smaller λ values at the same number of loading cycles, which is consistent with the observed changes in the pulverization rate. The variation in parameter λ is consistent with that in coal compression, but parameter k differs from previous studies [33]. The main reason is that the particle size distribution is considered with broken particles (<3.35 mm) in this paper. Additionally, Figure 9 indicates that the gap between the particle size distribution curves narrows as the number of loading cycles increases, suggesting that the breakage degree of the feed particle bed eventually stabilizes. Similar results have been reported in studies on red sandstone [44].
In order to observe the results directly, the fitting curves of the PSDs were obtained with ln(ln(1/(1 − y))) as the ordinate and ln(x) as the abscissa, as shown in Figure 10. The data can be well fitted with linear lines, with R2 values exceeding 0.97.
Similarly, the PSDs of feed pellets under repeated impacts were collected and fitted with the Weibull function. Figure 11 illustrates the variation in parameters k and λ. The k value curves have an upward trend as the loading cycles increase, while the λ value curves under 0.25 MPa and 0.30 MPa exhibit a negative trend. Under 0.35 MPa, the curve of λ values decreases first and then increases. A possible reason is that small particles are harder to break than large particles. Thus, the breakage degree of feed pellets will be reduced when the particle size reaches a certain extent. Unlike repeated compression tests, parameters k and λ vary continuously without a stable state. These findings corroborate the conclusion drawn in Section 3.1 that breakage and cracks occur continuously.
In order to observe the results directly, the fitting curves of PSDs were obtained, as shown in Figure 12. The data can be well fitted with lines, and R2 values are greater than 0.96.

3.3. Energy and Pulverization Rate

3.3.1. The Influence of Loading Cycles

The variation of mass-specific compressive energy and the pulverization rate of feed pellets with loading cycles is shown in Figure 13. It is shown that the mass-specific compressive energy and the pulverization rate of feed pellets increase with the number of loading cycles. In addition, the values of mass-specific compressive energy and the pulverization rate are positively related to loading force. In Figure 13b, a slight upward trend is observed in each curve, which may be attributed to the filling of pores within the feed particle bed and the subsequent formation of force chains (the main loading-bearing structure formed by feed pellets under compression) [45]. These force chains need more energy to be destroyed.
The variation of the energy and the pulverization rate during repeated impacts is shown in Figure 14. It can be seen that the energy and the pulverization rate tend to increase linearly as the number of loading cycles increases. The trend of the pulverization rate curves in repeated impact tests (Figure 14a) is different from that in repeated compression tests (Figure 13a), which might be due to different loading methods. In compression tests, the internal porosity of the feed particle bed decreases with increasing loading cycles, making the feed pellets more resistant to breakage under the protection of surrounding particles. In contrast, during impact tests, each feed particle is subjected to direct impact and may sustain damage in a single impact. Additionally, higher air pressure results in increased energy and pulverization rates for the feed pellets.

3.3.2. Relationship between Energy and Pulverization Rate

The fitting results using Equation (9) for mass-specific energy and the pulverization rate are shown in Figure 15, with the fitting parameters listed in Table 2. It can be seen from the figure that the pulverization rate increases with the increase of energy. Under the same energy, the higher the loading force or air pressure, the higher the pulverization rate. Table 2 shows that the R2 values are greater than 0.94, and the data is well fitted by this model. The results indicate that the model is applicable not only for evaluating feed pellets subjected to repeated impacts but also for assessing the feed particle bed under repeated compression.
It is observed that the Em,min value in repeated compression is higher than that in repeated impacts, indicating that a greater minimum energy is required for particle breakage under repeated compression compared to repeated impacts. The energy distribution of the single stressing event is shown in Figure 16. It can be seen that the energy required for reaching 100% breakage probability in impact is higher than that in compression. However, the parameter Em,min of repeated compression is 19.1904 J/kg in Table 2, which is higher than 5.0086 J/kg. The difference in energy requirements might be explained by the different breakage mechanisms.
Feed pellets are composed of multiple ingredients, and the scanning electron microscope (SEM) of feed pellets shows the voids and cracks in their internal structure [14]. Under quasi-static loading (compression), feed pellets will experience inelastic and elastic behaviors in the early stages until the yield occurs before breakage. The force–displacement curves show that the loading displacement gradually decreases (especially in fewer loading cycles) and tends to be stable with the increase of loading cycles. Therefore, the breakage of the feed particle bed under successive compression is limited. This phenomenon is consistent with that in Al2O3 granules [46]. Under dynamic loading (impact), feed pellets will fracture at the weaker part, which shows a decrease in the size of the feed pellets. Different breakage mechanisms lead to greater deformation of the feed pellet during compression, so dynamic loading leads to a greater degree of breakage under the same loading energy.

4. Conclusions

In this study, we compared the breakage characteristics of feed pellets under repeated compression and impact, and the relationship between breakage degree and energy was quantitatively characterized. The research method used in this study could provide support for the investigation of breakage characteristics of agricultural granular materials, and the established model between the pulverization rate and energy can provide a quality assessment of particles under different loading conditions. The main conclusions are as follows:
(1)
The breakage degree of feed particle beds decreases from top to bottom, and the crack density is positively correlated to the loading force. Unlike repeated compression tests, the feed pellets under repeated impacts will break continuously, and the size is negatively correlated to air pressure.
(2)
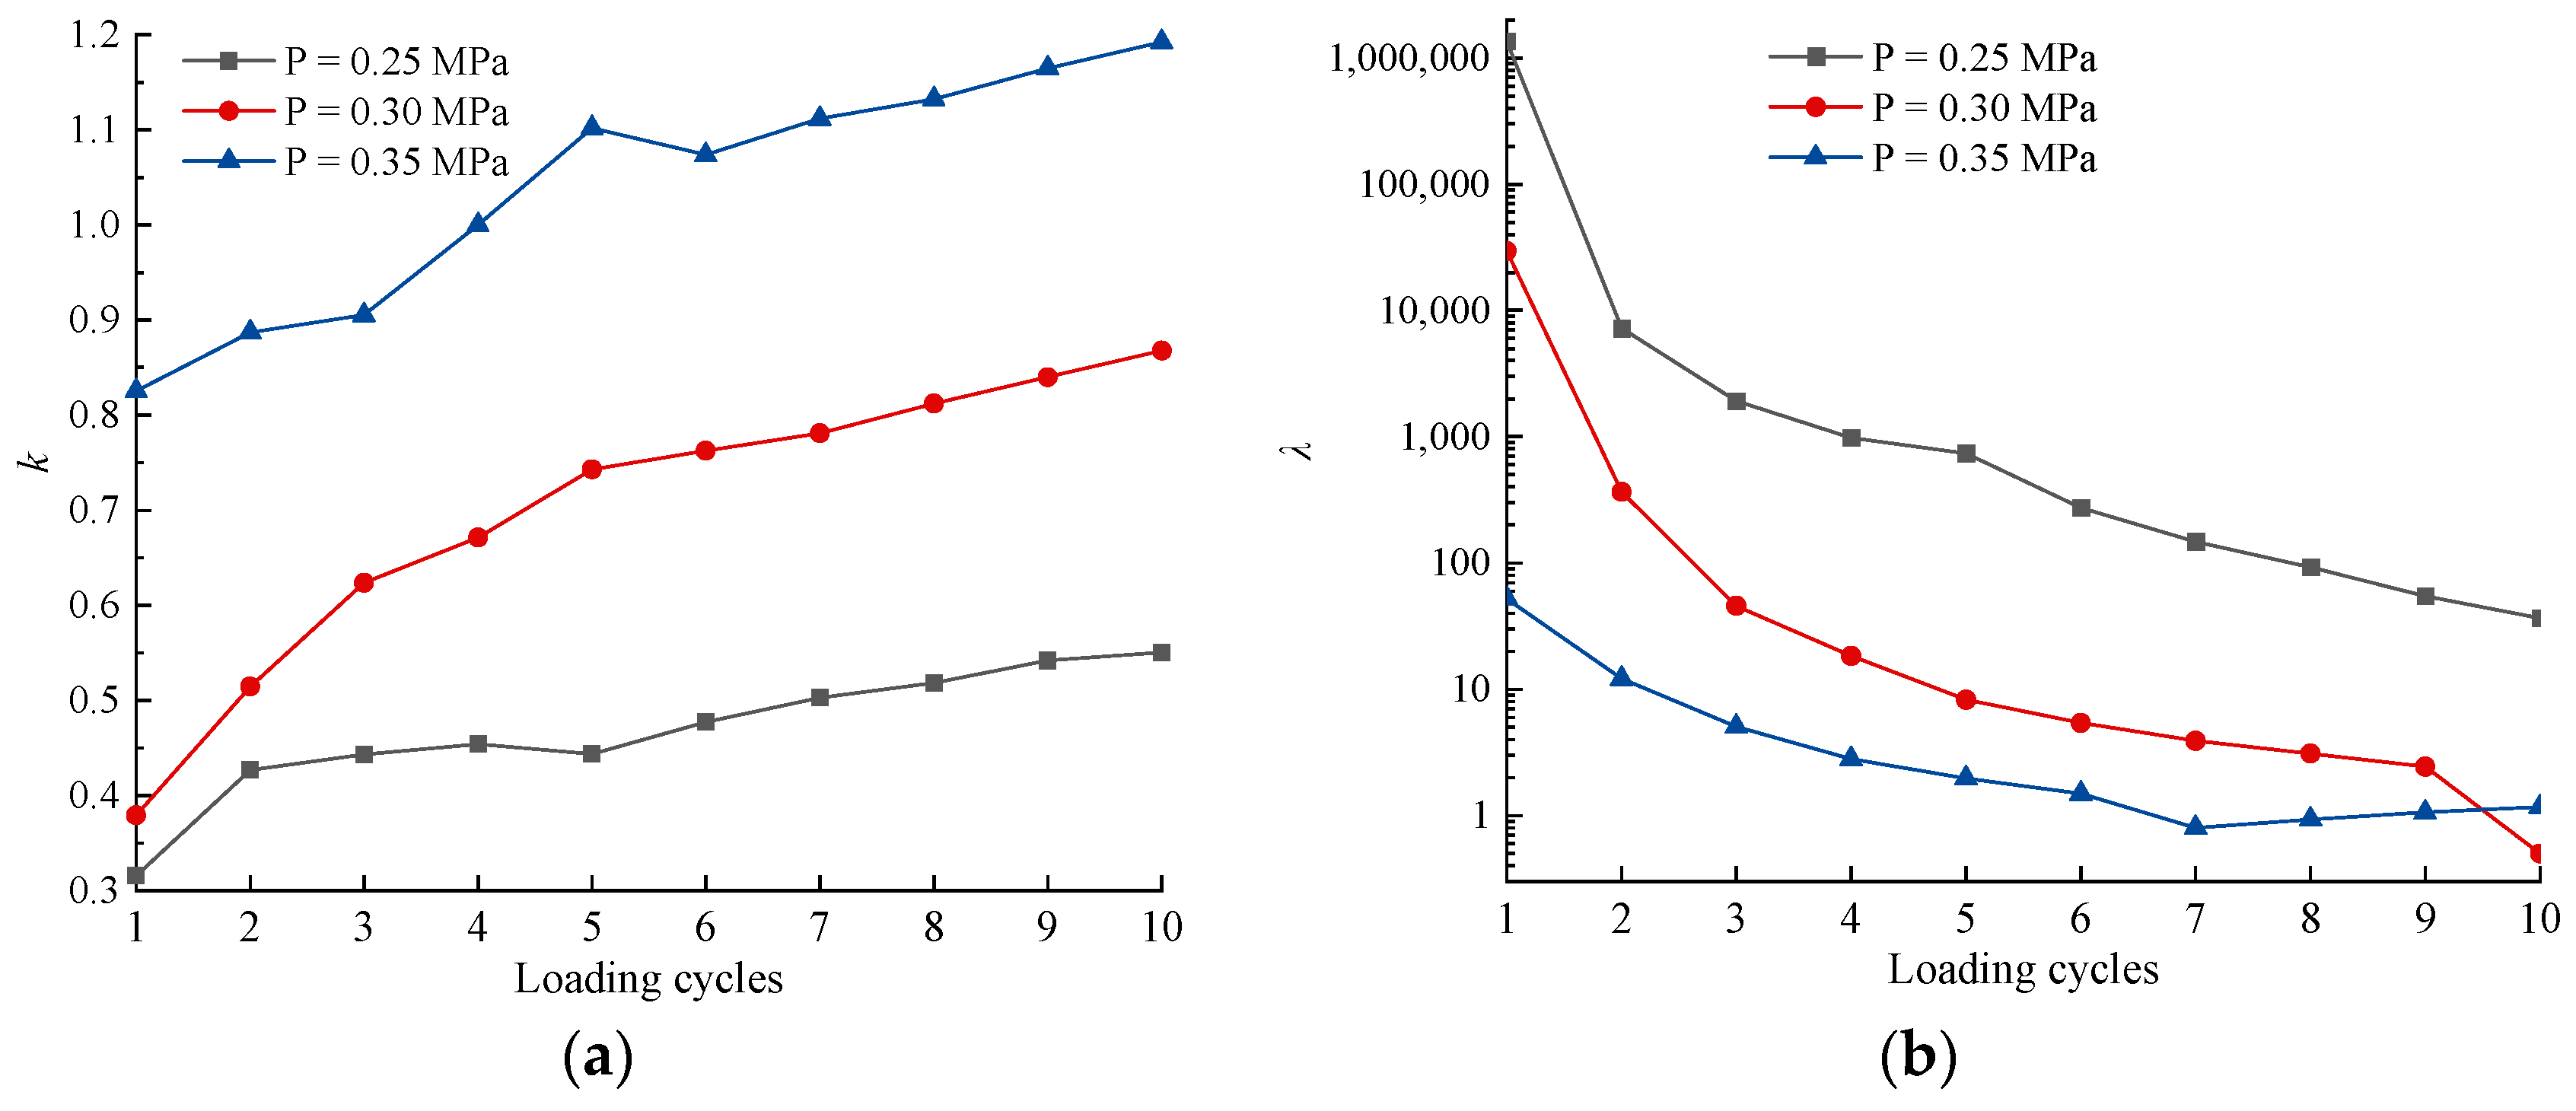
The PSDs under different loading methods can be fitted well with the Weibull function, and the R2 values are greater than 0.96. The variation in parameters k and λ shows a steady breakage degree and a growing breakage degree in repeated compression and impact tests.
(3)
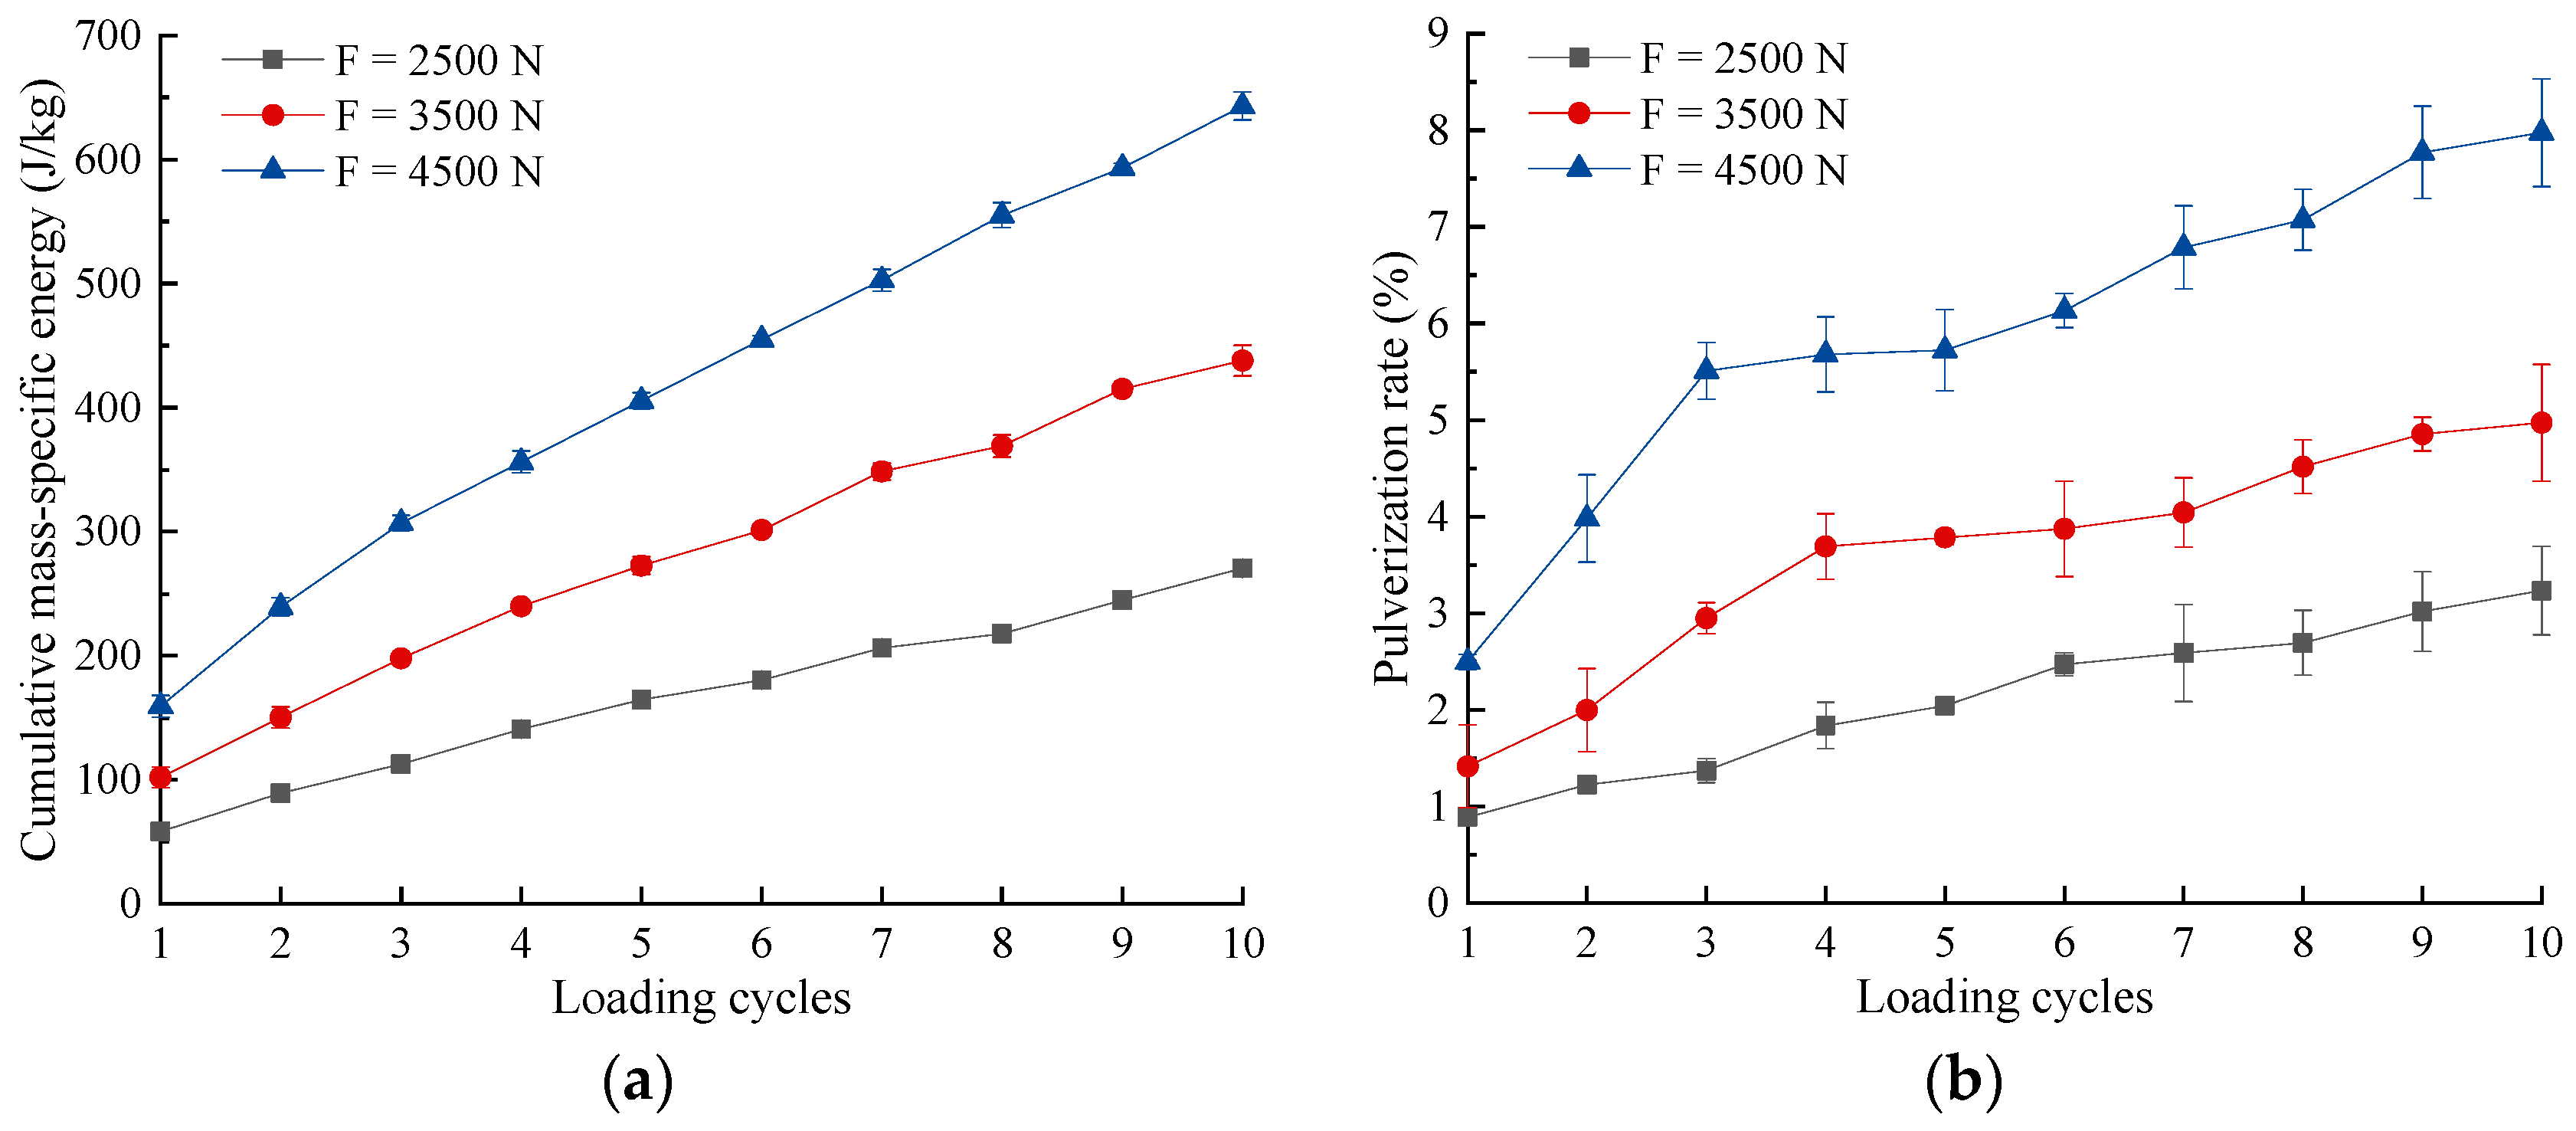
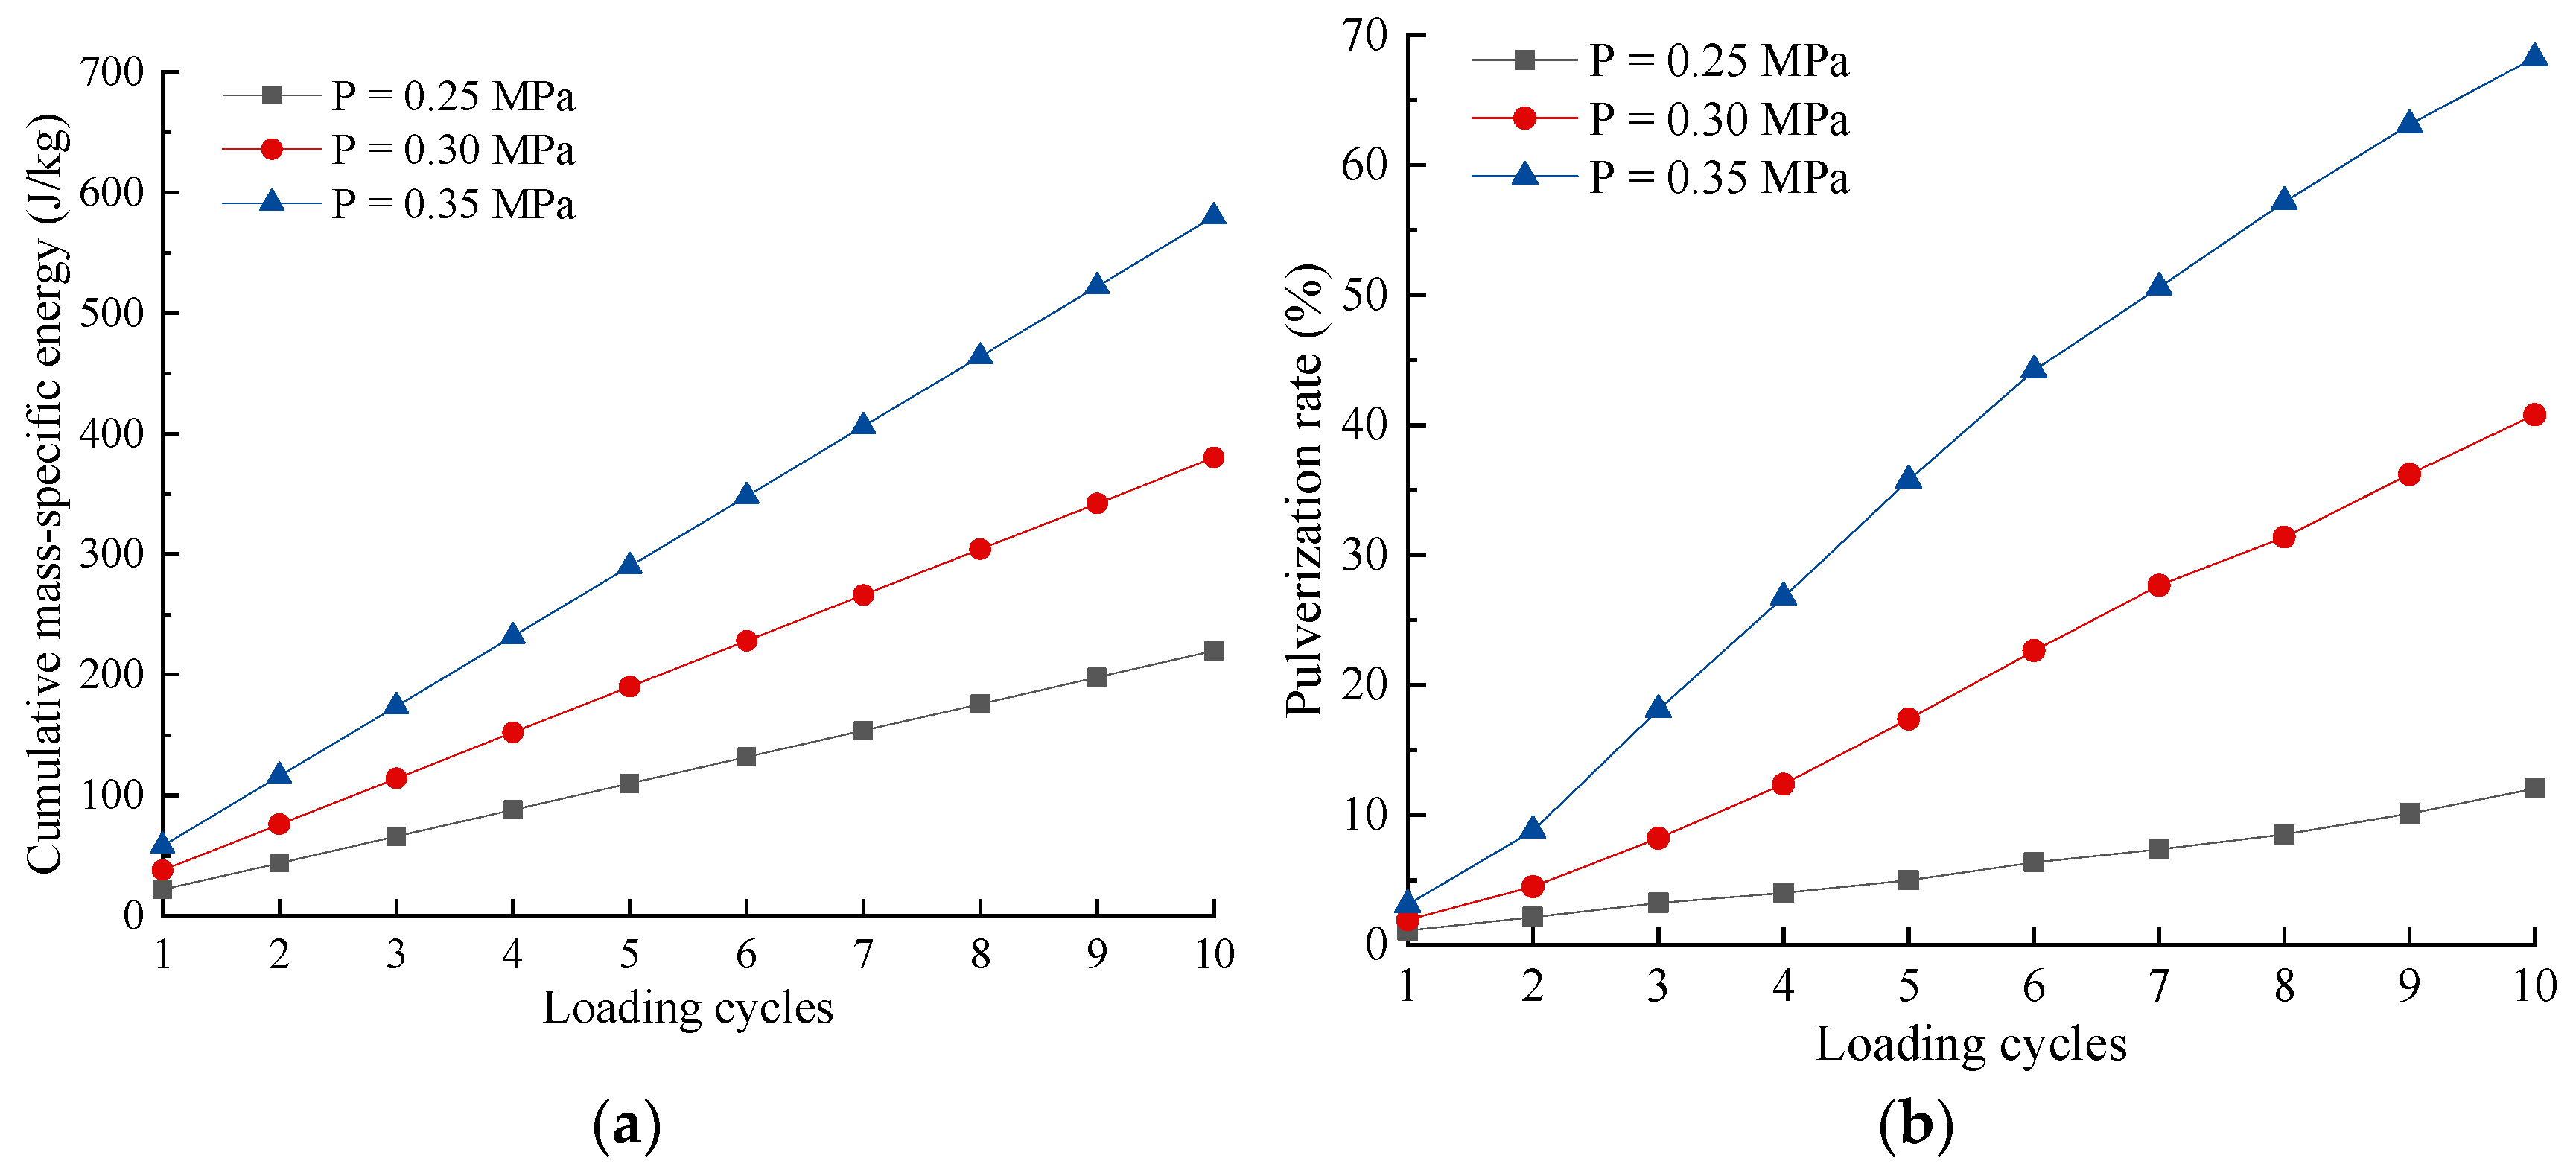
The energy and the pulverization rate of feed pellets increase with the increase of loading cycles under different loading methods, and the larger the loading force and air pressure, the higher the energy and pulverization rate. Due to the filling of pores in the feed particle bed, a slow growth stage occurs in the pulverization rate curve in repeated compression tests. In repeated impact tests, the pulverization rate curves have a linear relationship with the loading cycles, which is due to different loading methods.
(4)
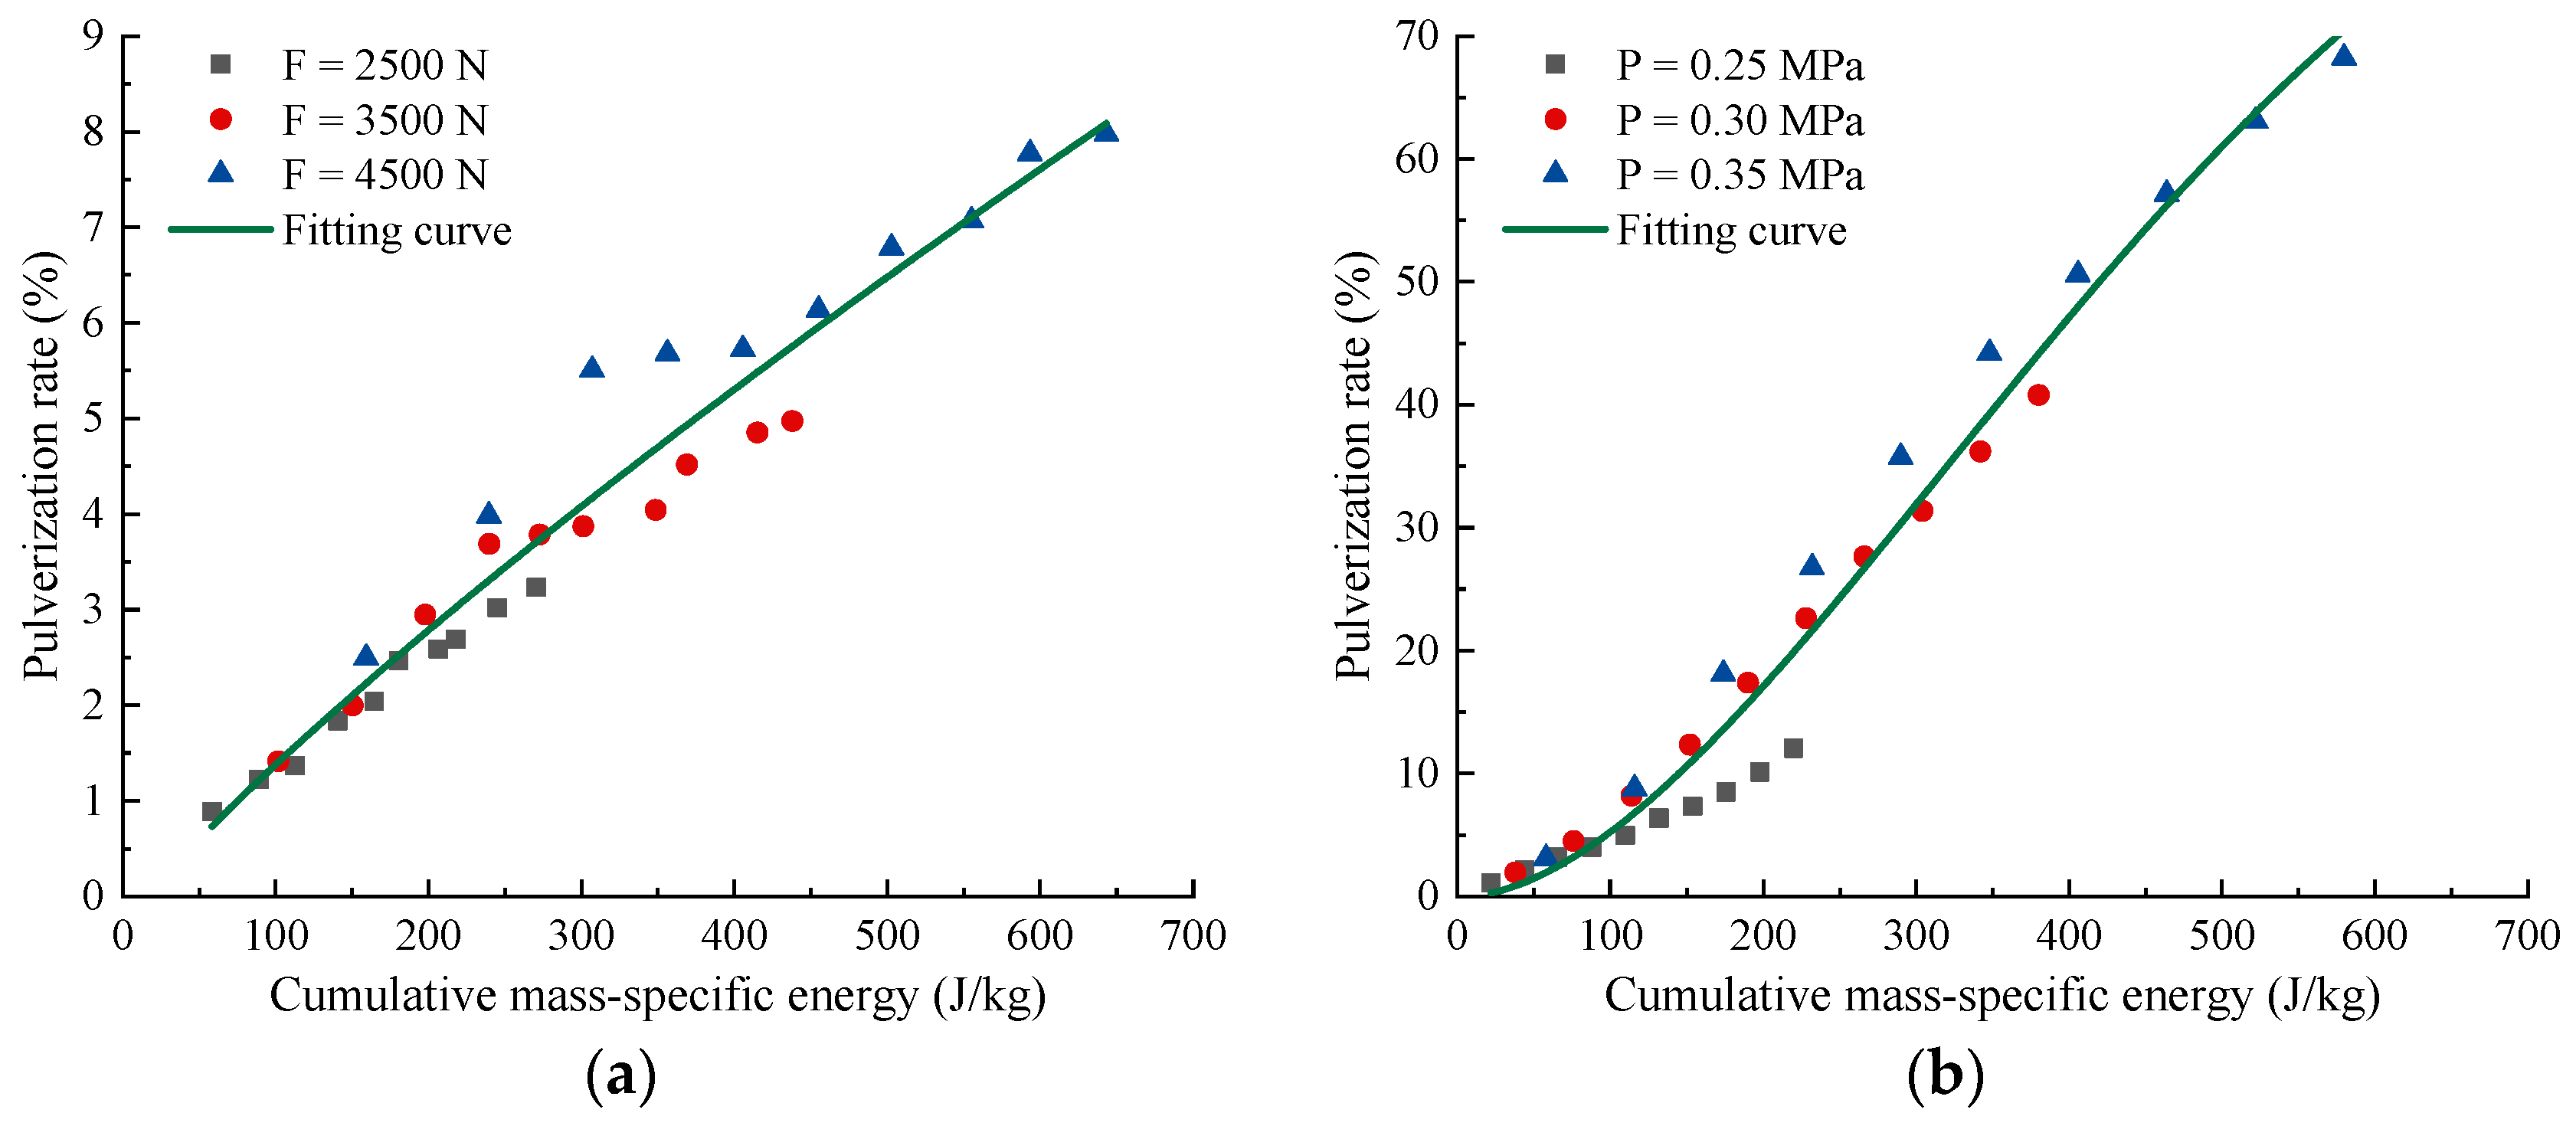
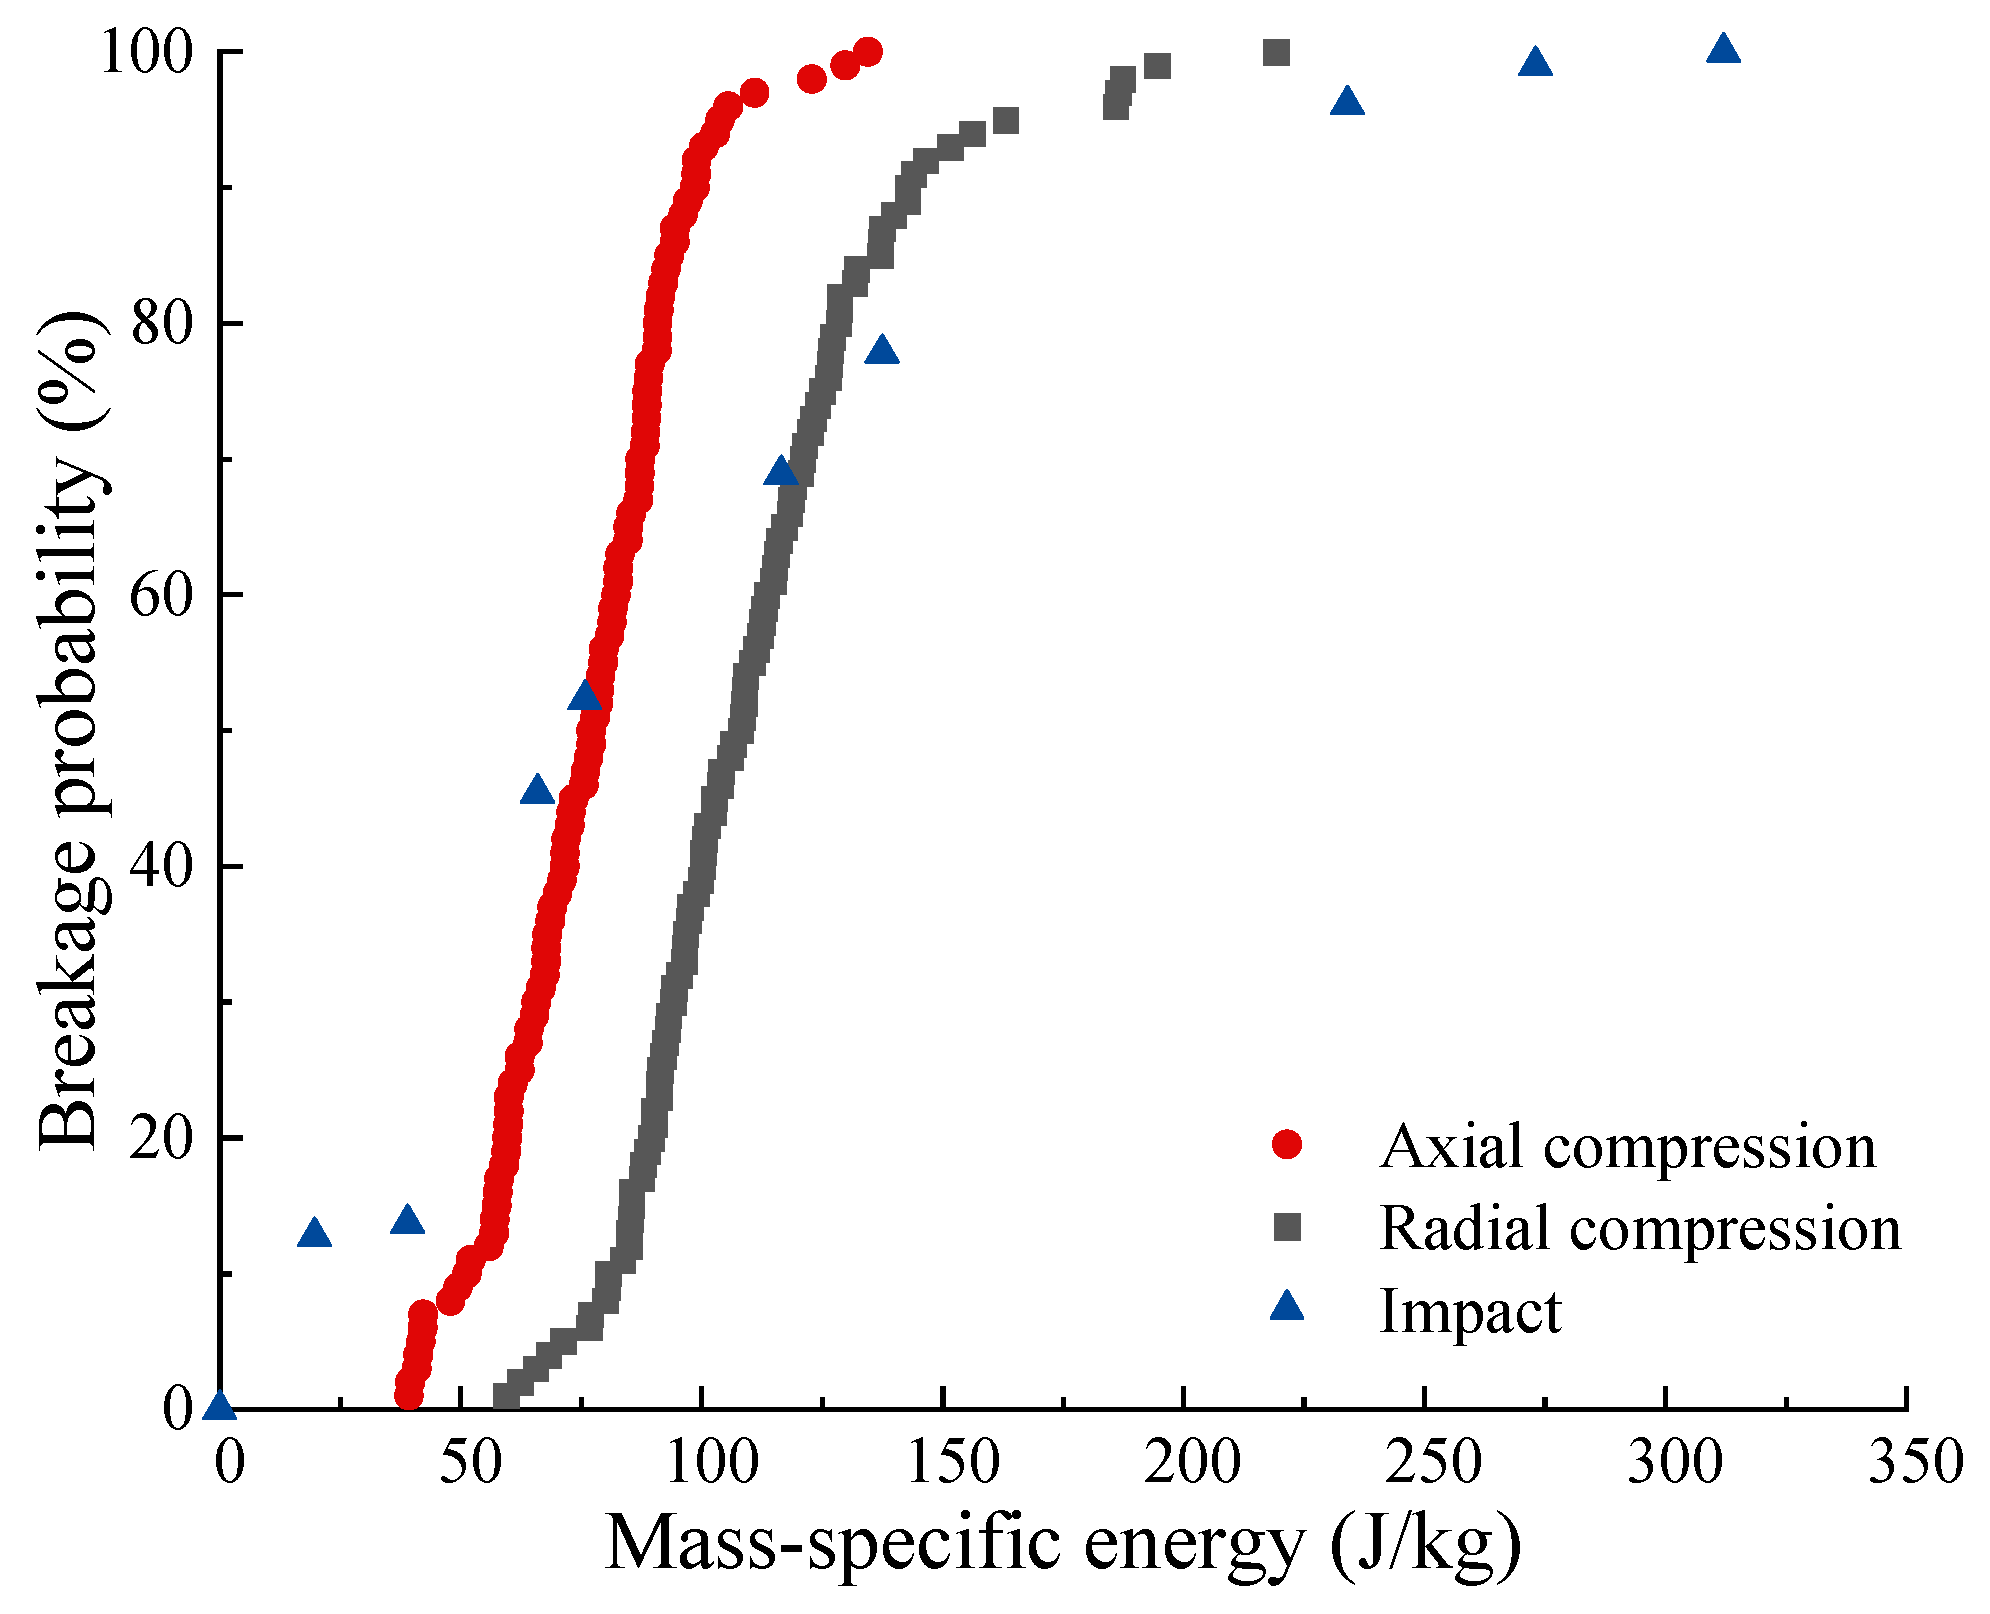
The model of Vogel and Peukert can be used to describe the relationship between energy and the pulverization rate under repeated compression and repeated impacts, and the R2 values are greater than 0.94. Unlike the single stressing event, the minimum energy required for particle breakage in compression tests was 19.1904 J/kg, which is higher than 5.0086 J/kg in impact tests. The main reason is the compaction of feed pellets in the feed particle bed.

Supplementary Materials

The following supporting information can be downloaded at: https://www.mdpi.com/article/10.3390/agriculture14081401/s1, Table S1: The Weibull analysis results of feed particle beds under repeated compression at different loading cycles; Table S2: The Weibull analysis results of feed pellets under repeated impacts at different air pressures.

Author Contributions

Methodology, X.K. and Z.N.; Formal analysis, X.K. and Q.C.; Investigation, X.K.; Resources, Z.N.; Data curation, Q.C.; Writing—original draft, X.K.; Writing—review & editing, Z.N.; Supervision, Z.N.; Project administration, Z.N.; Funding acquisition, Z.N. All authors have read and agreed to the published version of the manuscript.

Funding

This work was financially supported by the National Key Research and Development Program (project no. 2021YFD1300305), Ministry of Science and Technology of the People’s Republic of China.

Institutional Review Board Statement

Not applicable.

Data Availability Statement

The data presented in this study are available on demand from the first author at ([email protected]) and Supplementary Materials.

Conflicts of Interest

The authors declare that they have no known competing financial interests or personal relationships that could have appeared to influence the work reported in this paper.

References

  1. Halstensen, M.; Ihunegbo, F.N.; Ratnayake, C.; Sveinsvold, K. Online acoustic chemometric monitoring of fish feed pellet velocity in a pneumatic conveying system. Powder Technol. 2014, 263, 104–111. [Google Scholar] [CrossRef]
  2. Thomas, M.; van der Poel, A.F.B. Physical quality of pelleted animal feed 1. Criteria for pellet quality. Anim. Feed Sci. Technol. 1996, 61, 89–112. [Google Scholar] [CrossRef]
  3. Chang, C.M.; Fang, W.; Jao, R.C.; Shyu, C.Z.; Liao, I.C. Development of an intelligent feeding controller for indoor intensive culturing of eel. Aquac. Eng. 2005, 32, 343–353. [Google Scholar] [CrossRef]
  4. Vukmirovic, D.; Colovic, R.; Rakita, S.; Brlek, T.; Duragic, O.; Sola-Oriol, D. Importance of feed structure (particle size) and feed form (mash vs. pellets) in pig nutrition—A review. Anim. Feed Sci. Technol. 2017, 233, 133–144. [Google Scholar] [CrossRef]
  5. Ardiaca Garcia, M.; Montesinos Barcelo, A.; Bonvehi Nadeu, C.; Jekl, V. Respiratory Diseases in Guinea Pigs, Chinchillas and Degus. Vet. Clin. N. Am. Exot. Anim. Pract. 2021, 24, 419–457. [Google Scholar] [CrossRef]
  6. Briggs, J.L.; Maier, D.E.; Watkins, B.A.; Behnke, K.C. Effect of ingredients and processing parameters on pellet quality. Poult. Sci. 1999, 78, 1464–1471. [Google Scholar] [CrossRef]
  7. Amerah, A.M.; Ravindran, V.; Lentle, R.G.; Thomas, D.G. Feed particle size: Implications on the digestion and performance of poultry. Worlds Poult. Sci. J. 2007, 63, 439–455. [Google Scholar] [CrossRef]
  8. Kaliyan, N.; Morey, R.V. Factors affecting strength and durability of densified biomass products. Biomass Bioenergy 2009, 33, 337–359. [Google Scholar] [CrossRef]
  9. Aarseth, K.A.; Prestlokken, E. Mechanical properties of feed pellets: Weibull analysis. Biosyst. Eng. 2003, 84, 349–361. [Google Scholar] [CrossRef]
  10. Aarseth, K.A. Attrition of feed pellets during pneumatic conveying: The influence of velocity and bend radius. Biosyst. Eng. 2004, 89, 197–213. [Google Scholar] [CrossRef]
  11. Aarseth, K.A.; Perez, V.; Boe, J.K.; Jeksrud, W.K. Reliable pneumatic conveying of fish feed. Aquac. Eng. 2006, 35, 14–25. [Google Scholar] [CrossRef]
  12. Aas, T.S.; Oehme, M.; Sorensen, M.; He, G.; Lygren, I.; Asgard, T. Analysis of pellet degradation of extruded high energy fish feeds with different physical qualities in a pneumatic feeding system. Aquac. Eng. 2011, 44, 25–34. [Google Scholar] [CrossRef]
  13. Kong, X.; Liu, J.; Yang, T.; Su, Y.; Geng, J.; Niu, Z. Numerical simulation of feed pellet breakage in pneumatic conveying. Biosyst. Eng. 2022, 218, 31–42. [Google Scholar] [CrossRef]
  14. Kong, X.; Cao, Q.; Zhao, Z.; Niu, Z.; Liu, J. Breakage probability of feed pellet under repeated compression and impacts. Granul. Matter 2023, 25, 47. [Google Scholar] [CrossRef]
  15. Haubjerg, A.F.; Veje, C.T.; Jorgensen, B.N.; Simonsen, B.; Lovgreen, S. Structural properties and mechanical durability of extruded fish feed. J. Food Process Eng. 2015, 38, 621–631. [Google Scholar] [CrossRef]
  16. Haubjerg, A.F.; Veje, C.T. An experimental approach towards increasing mechanical durability of extruded fish feed in the drying process. Dry. Technol. 2019, 37, 1418–1426. [Google Scholar] [CrossRef]
  17. Wolska, J.; Holst, O.; Adlercreutz, P.; Jonkers, J. Standardized method for the Holmen pellet tester (NHP100) as a tool for evaluating the physical quality of fish feed. Aquac. Res. 2016, 47, 1790–1796. [Google Scholar] [CrossRef]
  18. Han, Y.; Zhao, D.; Chu, Y.; Zhen, J.; Li, G.; Zhao, H.; Jia, F. Breakage behaviour of single rice particles under compression and impact. Adv. Powder Technol. 2021, 32, 4635–4650. [Google Scholar] [CrossRef]
  19. Shen, S.; Han, Y.; Hao, X.; Chen, P.; Li, A.; Wang, Y.; Zhang, J.; Feng, W.; Fei, J.; Jia, F. Analysis of the breakage characteristics of rice particle beds under confined compression tests. Powder Technol. 2023, 418, 118319. [Google Scholar] [CrossRef]
  20. Antonyuk, S.; Tomas, E.; Heinrich, S.; Morl, L. Breakage behaviour of spherical granulates by compression. Chem. Eng. Sci. 2005, 60, 4031–4044. [Google Scholar] [CrossRef]
  21. Lin, S.S.; Chung, Y.C.; Lin, C.K.; Chen, Y.C. DEM simulation and experimental validation for mechanical response of ellipsoidal particles under confined compression. Adv. Powder Technol. 2018, 29, 1292–1305. [Google Scholar] [CrossRef]
  22. Orefice, L.; Khinast, J.G. Deformable and breakable DEM particle clusters for modelling compression of plastic and brittle porous materials—Model and structure properties. Powder Technol. 2020, 368, 90–104. [Google Scholar] [CrossRef]
  23. Saiedirad, M.H.; Tabatabaeefar, A.; Borghei, A.; Mirsalehi, M.; Badii, F.; Varnamkhasti, M.G. Effects of moisture content, seed size, loading rate and seed orientation on force and energy required for fracturing cumin seed (Cuminum cyminum Linn.) under quasi-static loading. J. Food Eng. 2008, 86, 565–572. [Google Scholar] [CrossRef]
  24. Baslar, M.; Kalkan, F.; Kara, M.; Ertugay, M.F. Correlation between the protein content and mechanical properties of wheat. Turk. J. Agric. For. 2012, 36, 601–607. [Google Scholar]
  25. Ramaj, I.; Romuli, S.; Schock, S.; Mueller, J. Discrete element modelling of bulk behaviour of wheat (Triticum aestivum L.) cv. ‘Pionier’ during compressive loading. Biosyst. Eng. 2024, 242, 123–139. [Google Scholar]
  26. Guerra, M.V.; Harshe, Y.M.; Fries, L.; Rothberg, S.; Palzer, S.; Heinrich, S. Influence of particle size distribution on espresso extraction via packed bed compression. J. Food Eng. 2023, 340, 111301. [Google Scholar] [CrossRef]
  27. Liu, X.; Shi, Z.; Zhang, Y.; Li, H.; Pei, H.; Yang, H. Characteristics of Damage to Brown Rice Kernels under Single and Continuous Mechanical Compression Conditions. Foods 2024, 13, 1069. [Google Scholar] [CrossRef]
  28. Chen, Z.P.; Wassgren, C.; Ambrose, R.P.K. Development and validation of a DEM model for predicting impact damage of maize kernels. Biosyst. Eng. 2022, 224, 16–33. [Google Scholar] [CrossRef]
  29. Chen, Z.P.; Wassgren, C.; Ambrose, R.P.K. Development and validation of a DEM model for predicting compression damage of maize kernels. Biosyst. Eng. 2023, 230, 480–496. [Google Scholar] [CrossRef]
  30. Mandelbrot, B.B.; Wheeler, J.A. The fractal geometry of nature. Am. J. Phys. 1984, 51, 286–287. [Google Scholar] [CrossRef]
  31. Xu, Y. The fractal evolution of particle fragmentation under different fracture energy. Powder Technol. 2018, 323, 337–345. [Google Scholar] [CrossRef]
  32. Weibull, W. A statistical theory of the strength of materials. J. Appl. Mech. 1939, 18, 293–297. [Google Scholar] [CrossRef]
  33. Yu, M.; Wu, M.; Yang, X.; Lou, R.; Wang, F.; Li, H.; Wang, L. Effect of temperature on the evolution and distribution for particle size of loose broken coal during the uniaxial confined compression process. Fuel 2022, 318. [Google Scholar] [CrossRef]
  34. Kruszelnicka, W.; Leda, P.; Tomporowski, A.; Ambrose, K. Breakage behavior of corn kernels subjected to repeated loadings. Powder Technol. 2024, 435, 119372. [Google Scholar] [CrossRef]
  35. Abouzeid, A.Z.M.A.; Seifelnassr, A.A.S.; Zain, G.; Mustafa, Y.S. Breakage Behavior of Quartz Under Compression in a Piston Die. Min. Metall. Explor. 2019, 36, 173–180. [Google Scholar] [CrossRef]
  36. Rozenblat, Y.; Grant, E.; Levy, A.; Kalman, H.; Tomas, J. Selection and breakage functions of particles under impact loads. Chem. Eng. Sci. 2012, 71, 56–66. [Google Scholar] [CrossRef]
  37. ANSI/ASAE S319.4; Method of Determining and Expressing Fineness of Feed Materials by Sieving. American Society of Agricultural and Biological Engineers: St Joseph, MI, USA, 2008.
  38. ASAE S269.5; Densified Products for Bulk Handling—Definitions and Method. American Society of Agricultural and Biological Engineers: St Joseph, MI, USA, 2021.
  39. Vogel, L.; Peukert, W. Breakage behaviour of different materials—Construction of a mastercurve for the breakage probability. Powder Technol. 2003, 129, 101–110. [Google Scholar] [CrossRef]
  40. Chen, Z.; Wassgren, C.; Ambrose, R.P.K. Measured damage resistance of corn and wheat kernels to compression, friction, and repeated impacts. Powder Technol. 2021, 380, 638–648. [Google Scholar] [CrossRef]
  41. Zeng, Y.; Mao, B.; Jia, F.; Han, Y.; Li, G. Modelling of grain breakage of in a vertical rice mill based on DEM simulation combining particle replacement model. Biosyst. Eng. 2022, 215, 32–48. [Google Scholar] [CrossRef]
  42. Djordjevic, N.; Morrison, R. Exploratory modelling of grinding pressure within a compressed particle bed. Miner. Eng. 2006, 19, 995–1004. [Google Scholar] [CrossRef]
  43. Zhou, Q.; Guo, Q.; Pan, Y.; Zhu, C.; Wei, Y. Experimental research on energy-size distribution model of coal particle bed comminution. Physicochem. Probl. Miner. Process. 2020, 56, 772–783. [Google Scholar] [CrossRef]
  44. Zhang, Z.T.; Gao, W.H.; Zhang, Z.M.; Tang, X.Y.; Wu, J. Evolution of particle disintegration of red sandstone using Weibull distribution. Rock Soil Mech. 2020, 41, 877–885. [Google Scholar]
  45. Kang, G.; Ning, Y.J.; Liu, R.; Chen, P.W.; Pang, S.P. Simulation of force chains and particle breakage of granular material by numerical manifold method. Powder Technol. 2021, 390, 464–472. [Google Scholar] [CrossRef]
  46. Salman; Russell, A.; Aman, S.; Tomas, J. Breakage probability of granules during repeated loading. Powder Technol. 2015, 269, 541–547. [Google Scholar] [CrossRef]
Figure 1. Specimens of feed pellets.
Agriculture 14 01401 g001
Figure 2. The compression of feed particle beds: (a) RG-M3005 universal testing machine; (b) probe and container.
Agriculture 14 01401 g002
Figure 3. Single particle impact equipment. 1. High pressure air inlet 2. Ball valve 3. Acceleration zone 4. Particle impact chamber 5. Light source 6. High speed camera 7. Collection box 8. PC.
Agriculture 14 01401 g003
Figure 4. The relationship between air pressure and impact velocity.
Agriculture 14 01401 g004
Figure 5. The PSD of feed pellet after sieving.
Agriculture 14 01401 g005
Figure 6. The state of feed particle beds after repeated compression: (a) 2500 N; (b) 3500 N; (c) 4500 N.
Agriculture 14 01401 g006
Figure 7. Force–displacement curves of feed particle beds under successive compression: (a) 2500 N; (b) 3500 N; (c) 4500 N.
Agriculture 14 01401 g007
Figure 8. The state of feed pellets after repeated impacts: (a) 0.25 MPa; (b) 0.30 MPa; (c) 0.35 MPa.
Agriculture 14 01401 g008
Figure 9. The variation of Weibull parameters under repeated compression: (a) k value; (b) λ value.
Agriculture 14 01401 g009
Figure 10. The linear fitting of PSDs after repeated compression: (a) 2500 N; (b) 3500 N; (c) 4500 N.
Agriculture 14 01401 g010
Figure 11. The variation of Weibull parameters under repeated impact: (a) k value; (b) λ value.
Agriculture 14 01401 g011
Figure 12. The linear fitting of PSDs after repeated impact: (a) 0.25 MPa; (b) 0.30 MPa; (c) 0.35 MPa.
Agriculture 14 01401 g012
Figure 13. The variation of (a) cumulative mass-specific energy; (b) pulverization rate under repeated compression.
Agriculture 14 01401 g013
Figure 14. The variation of (a) cumulative mass-specific energy; (b) pulverization rate during repeated impacts.
Agriculture 14 01401 g014
Figure 15. The fitting results of energy and pulverization rate: (a) repeated compression; (b) repeated impacts.
Agriculture 14 01401 g015
Figure 16. The energy distribution of single stressing event [14].
Agriculture 14 01401 g016
Table 1. The main chemical compositions of feed pellets.
Chemical CompositionsContent (%)
Crude protein15.00
Water content11.72
Crude ash8.00
Crude fibre7.00
Calcium0.90
Phosphorus0.50
Table 2. The parameters of fitting results.
ParameterfMat (kg J−1)Em,min (J/kg)αR2
Repeated compression9.7449 × 10−519.19040.88330.9485
Repeated impacts0.00205.00861.73340.9733
Disclaimer/Publisher’s Note: The statements, opinions and data contained in all publications are solely those of the individual author(s) and contributor(s) and not of MDPI and/or the editor(s). MDPI and/or the editor(s) disclaim responsibility for any injury to people or property resulting from any ideas, methods, instructions or products referred to in the content.

