
Spatial–Temporal Analysis of Impacts of Climate Variability on Maize Yield in Kenya

Abstract
:1. Introduction
2. Materials and Methods
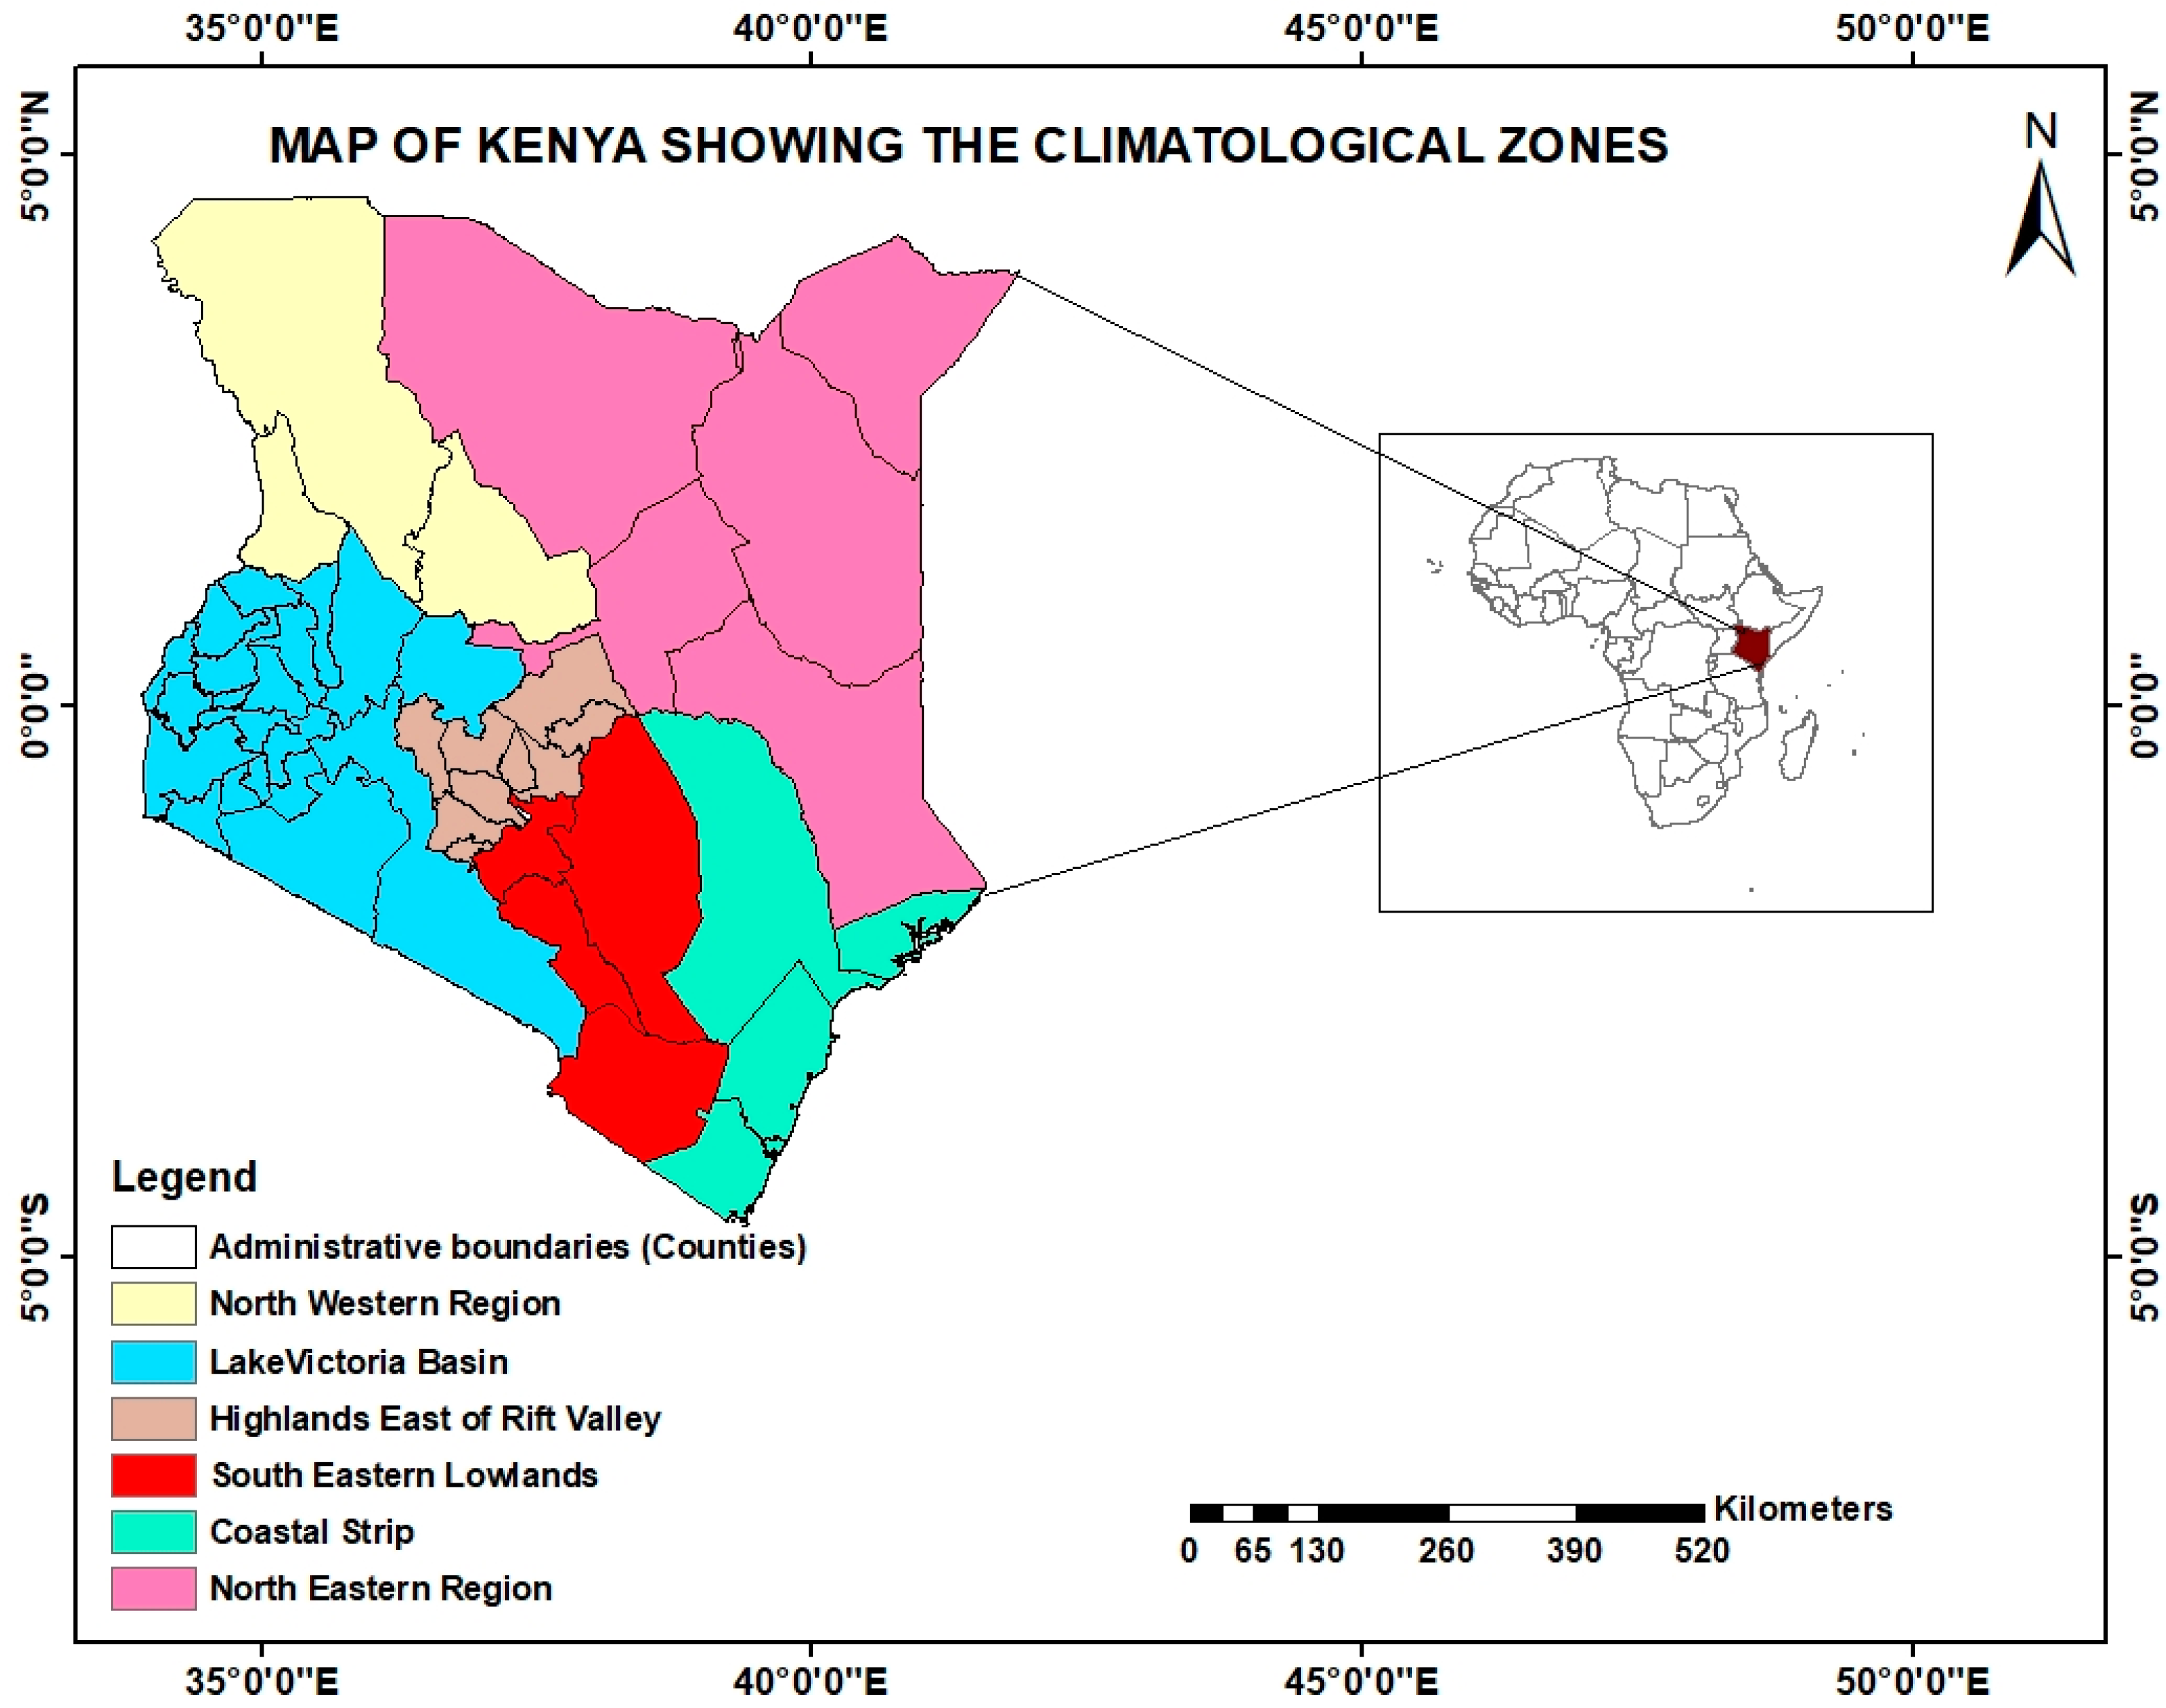
2.1. Study Area
2.2. Data Sources
2.3. Analysis
3. Results
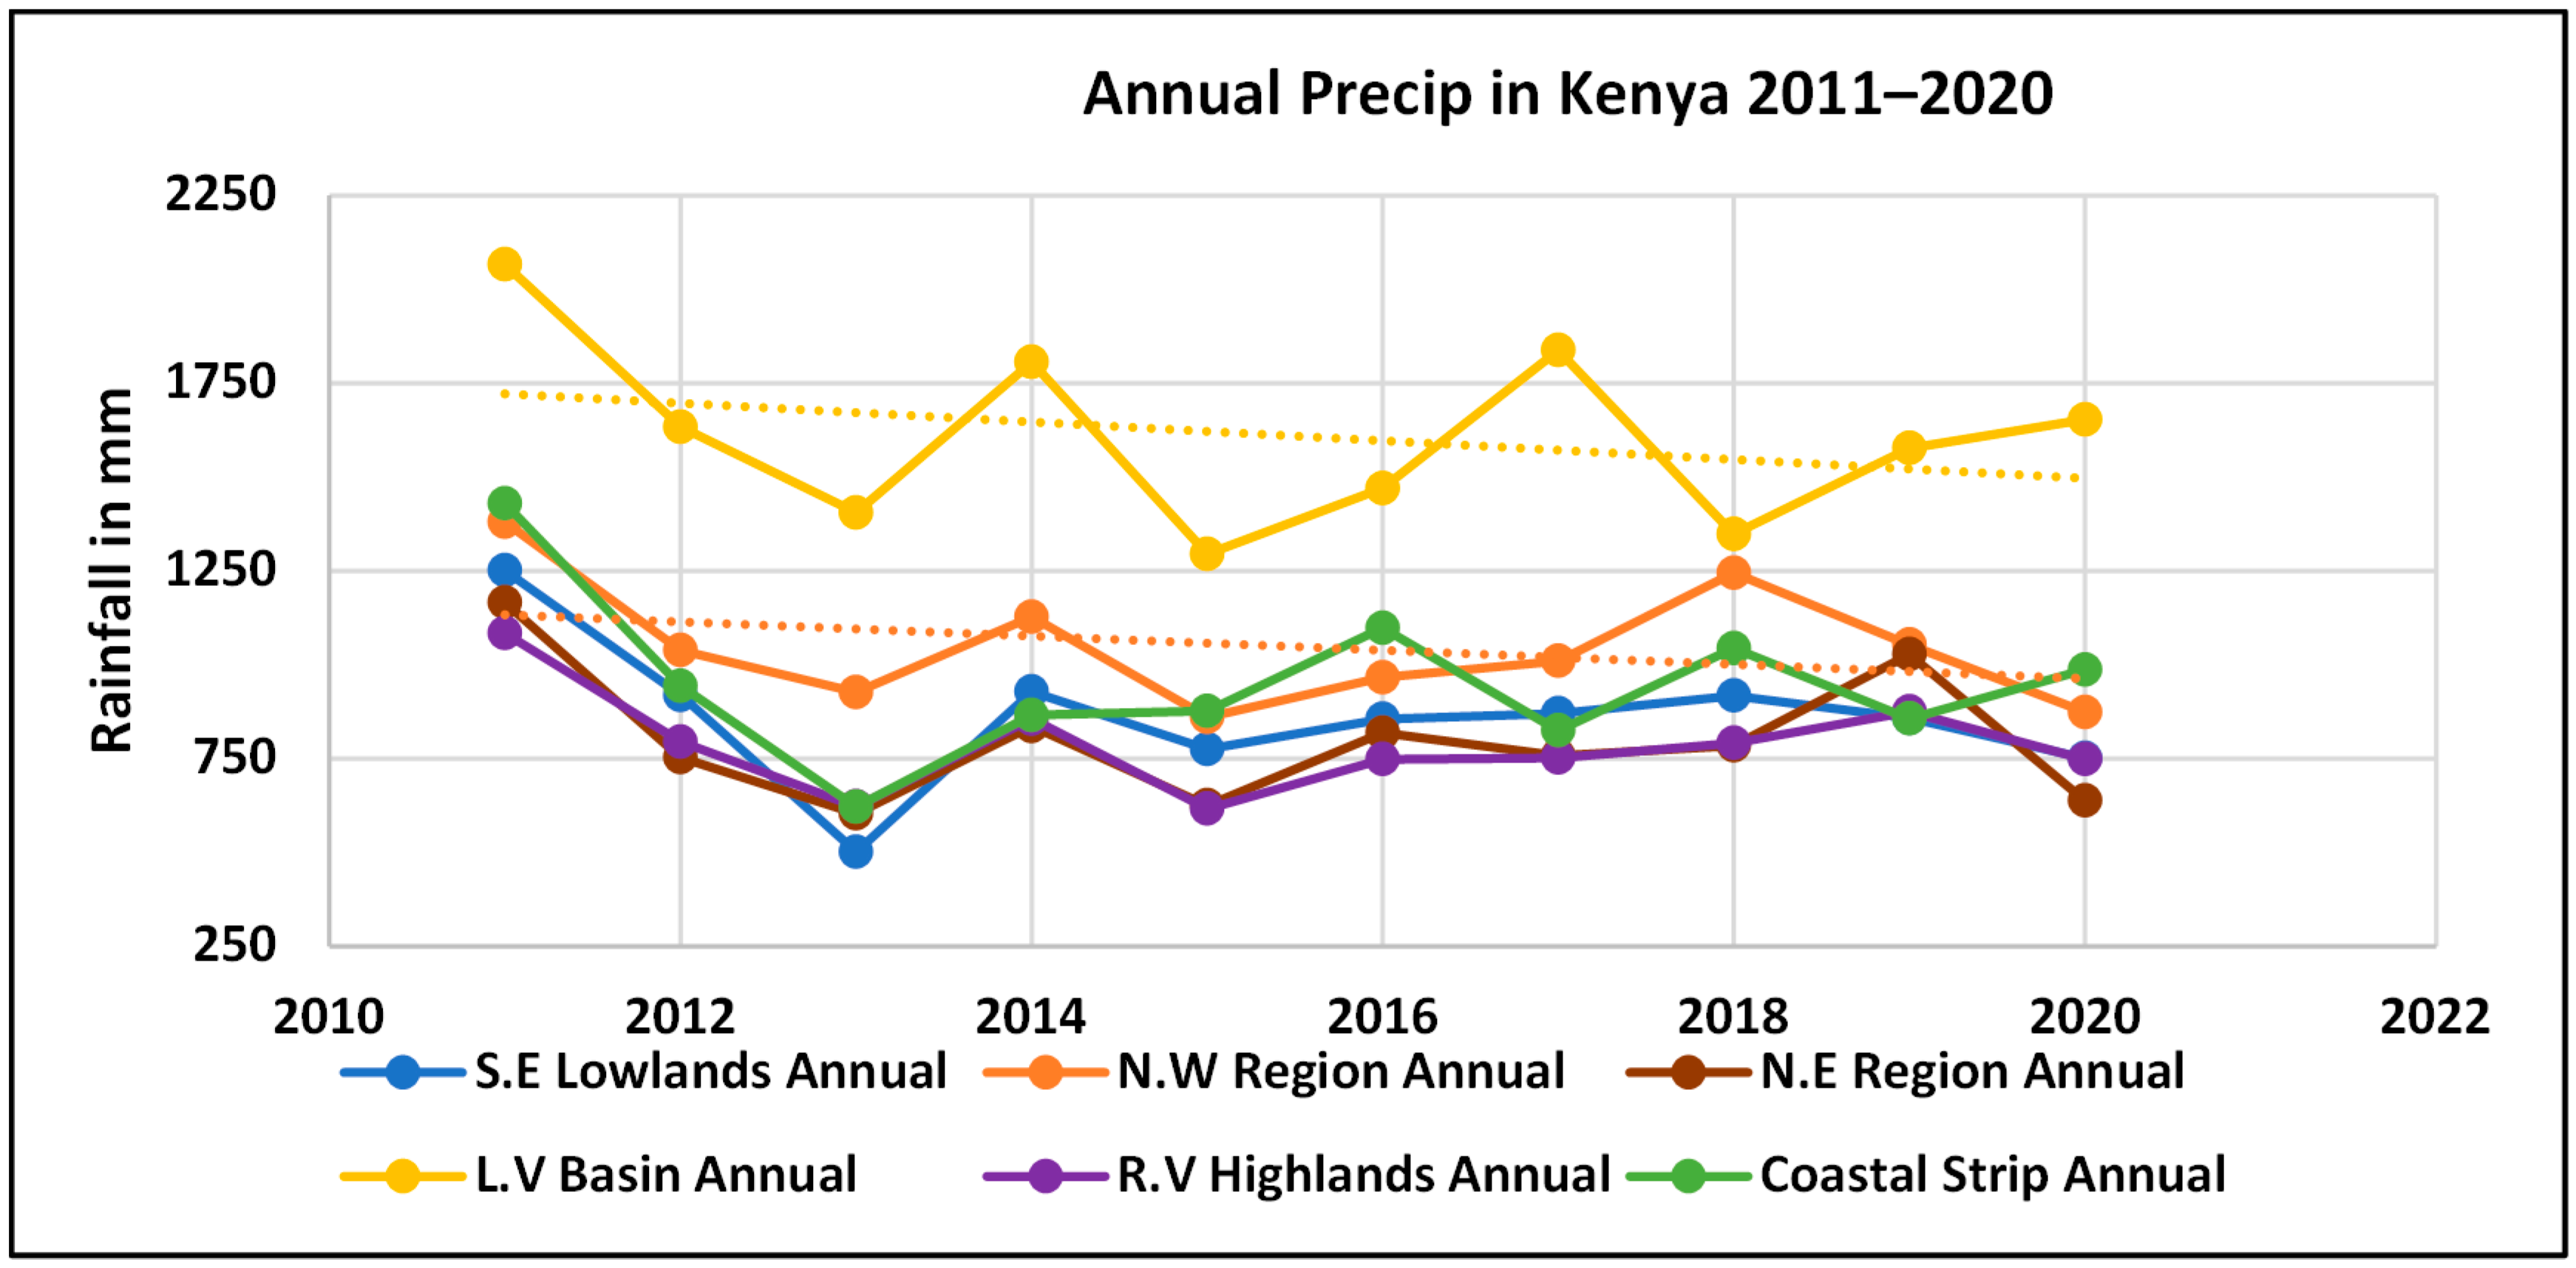
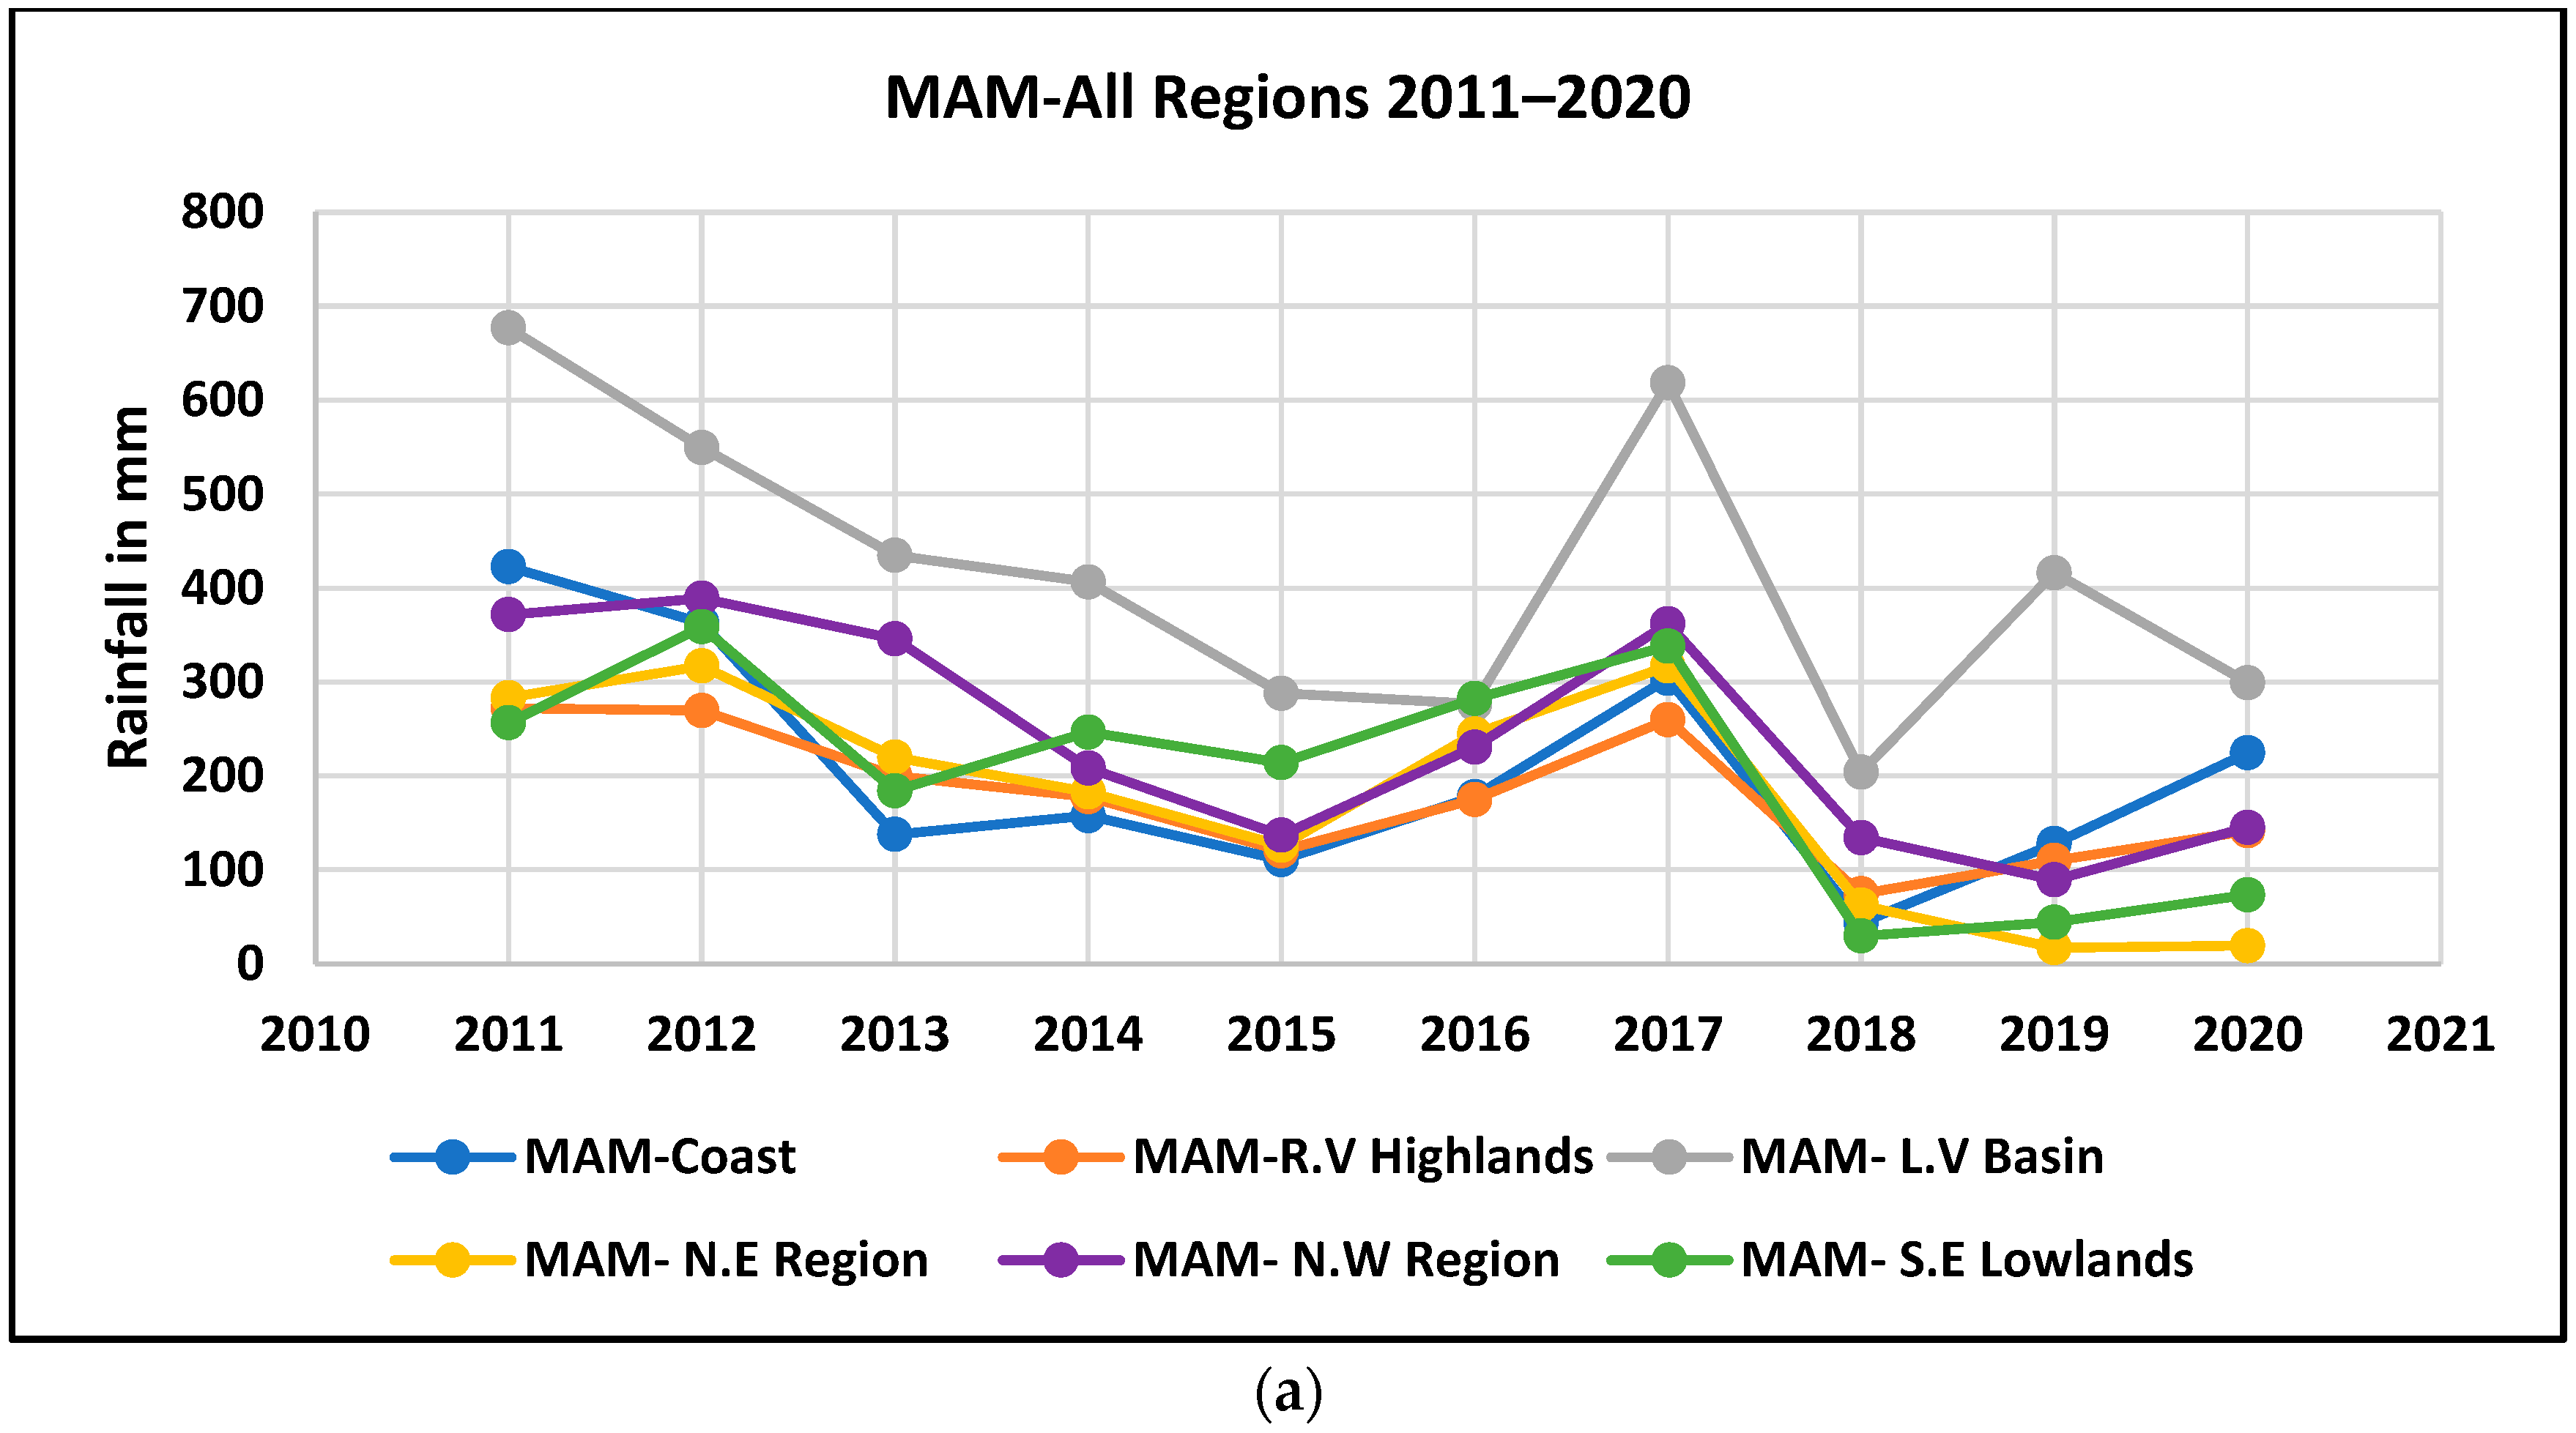
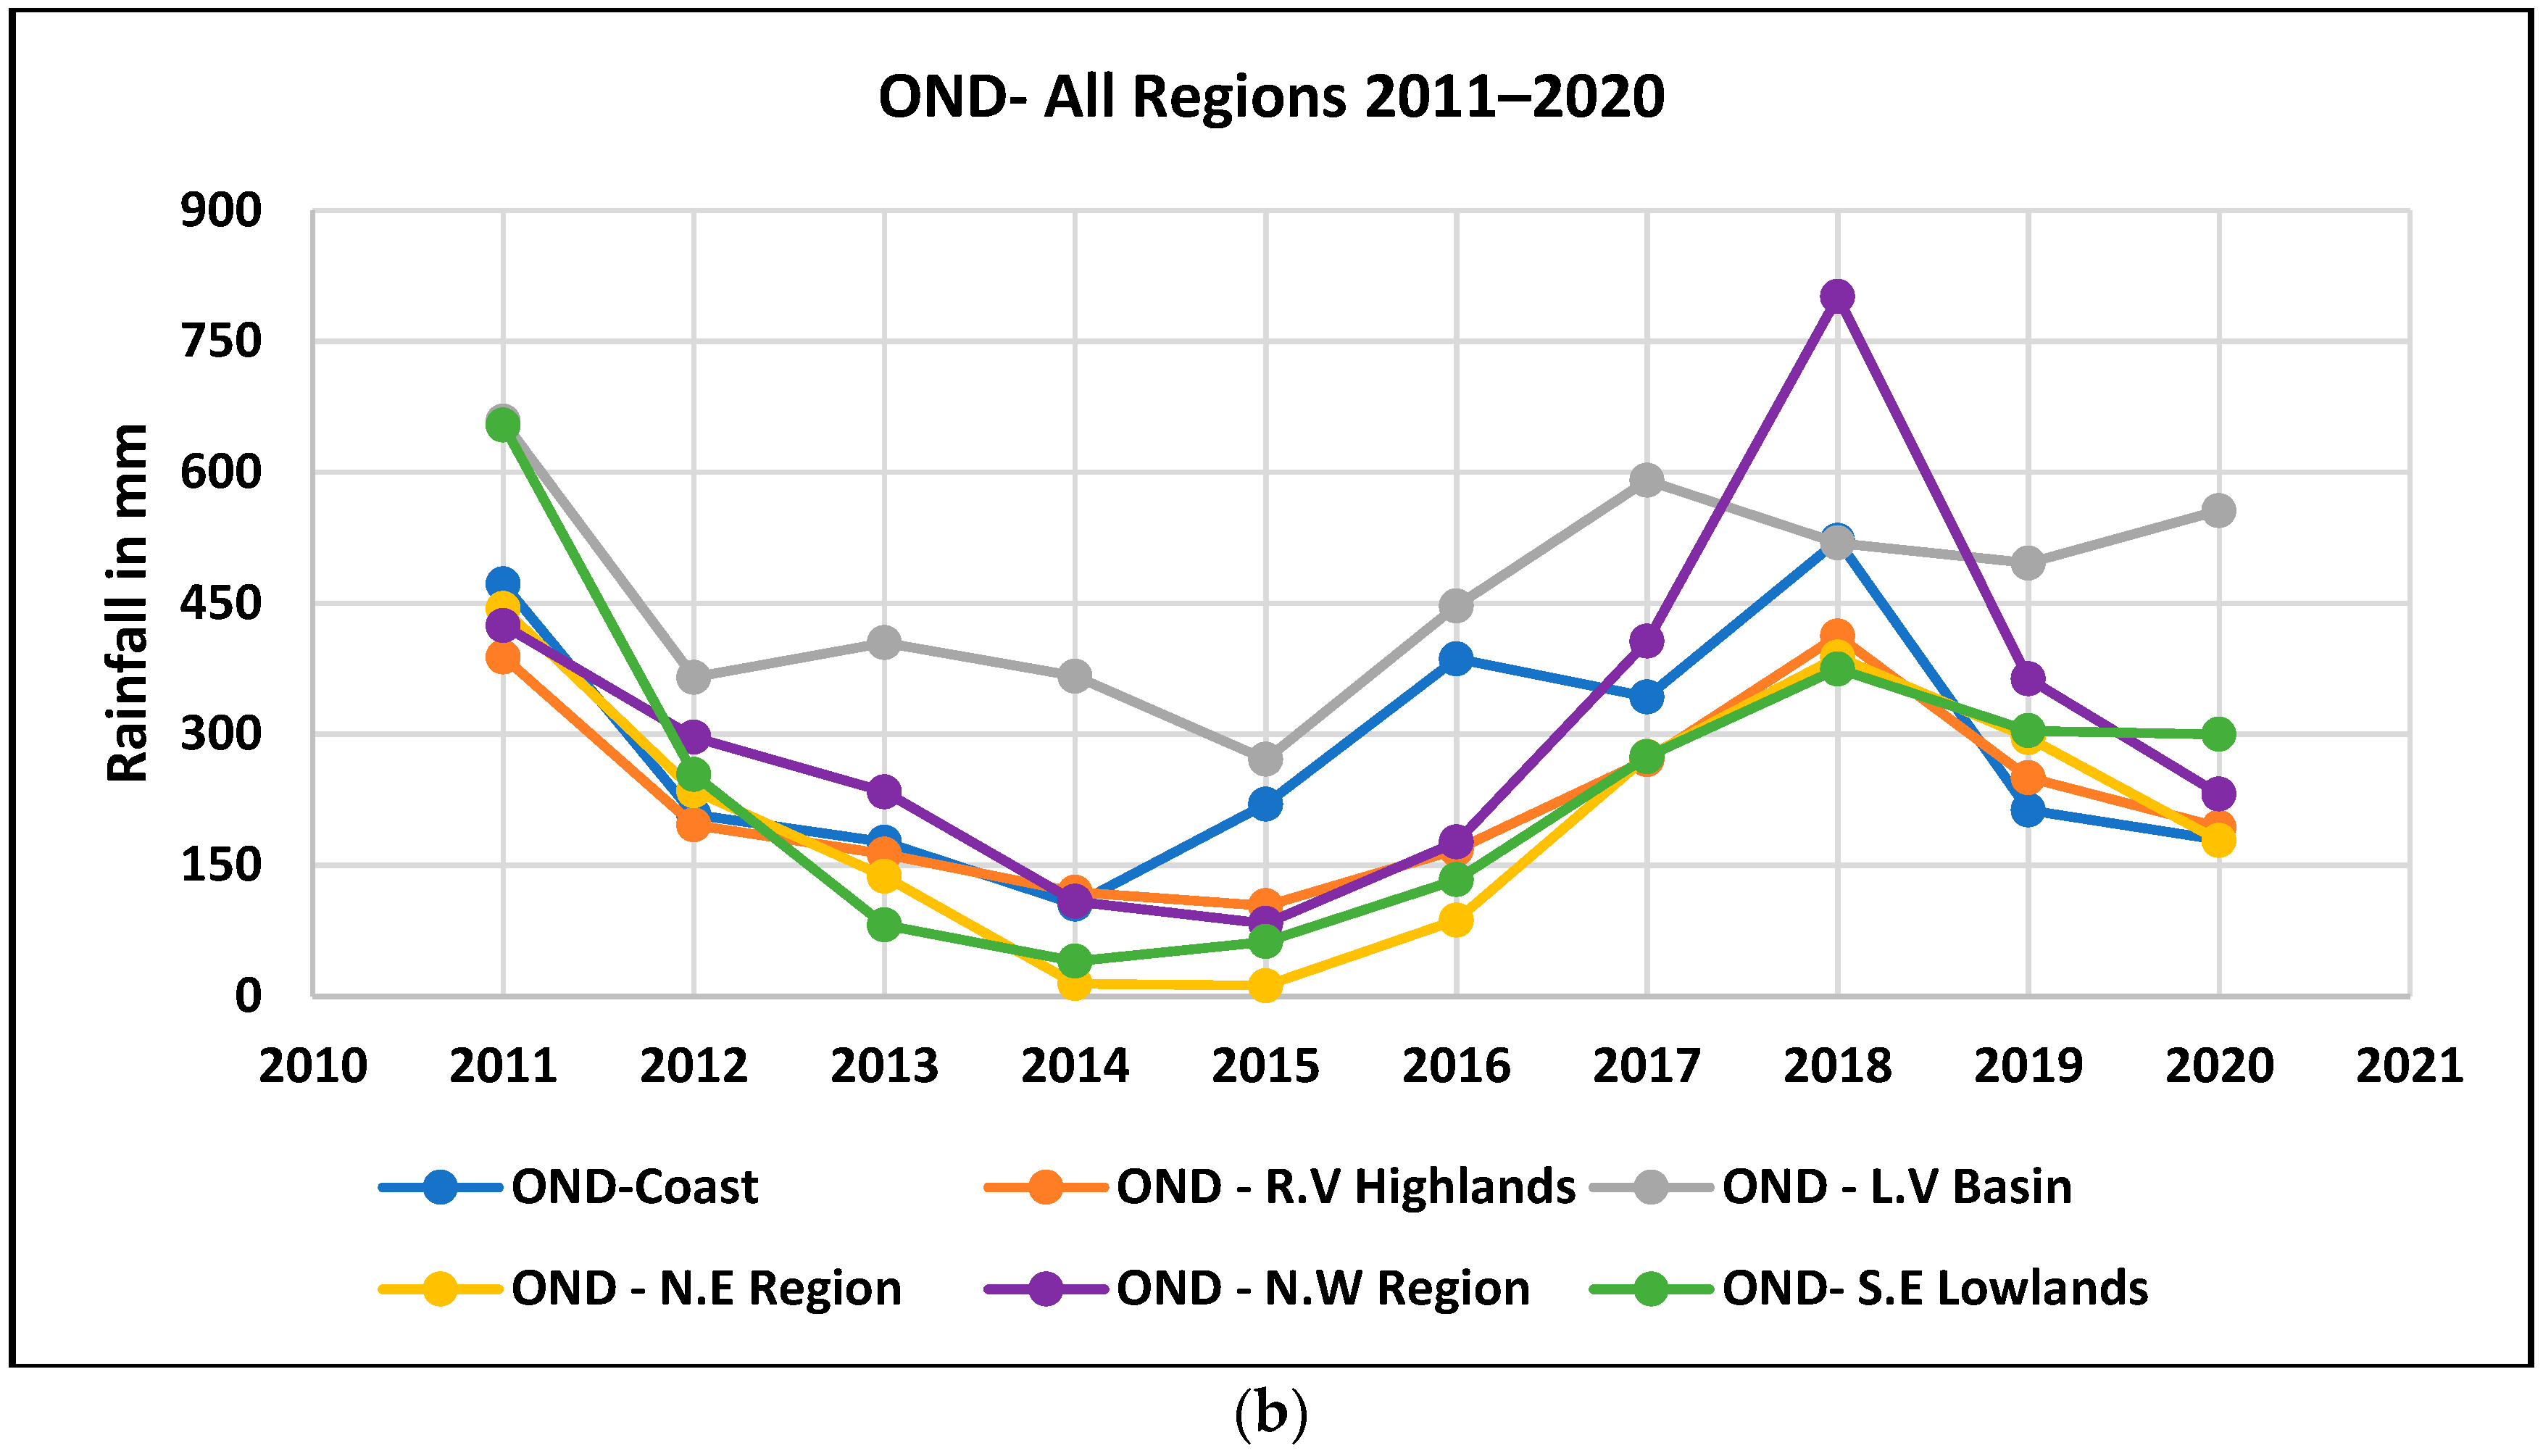
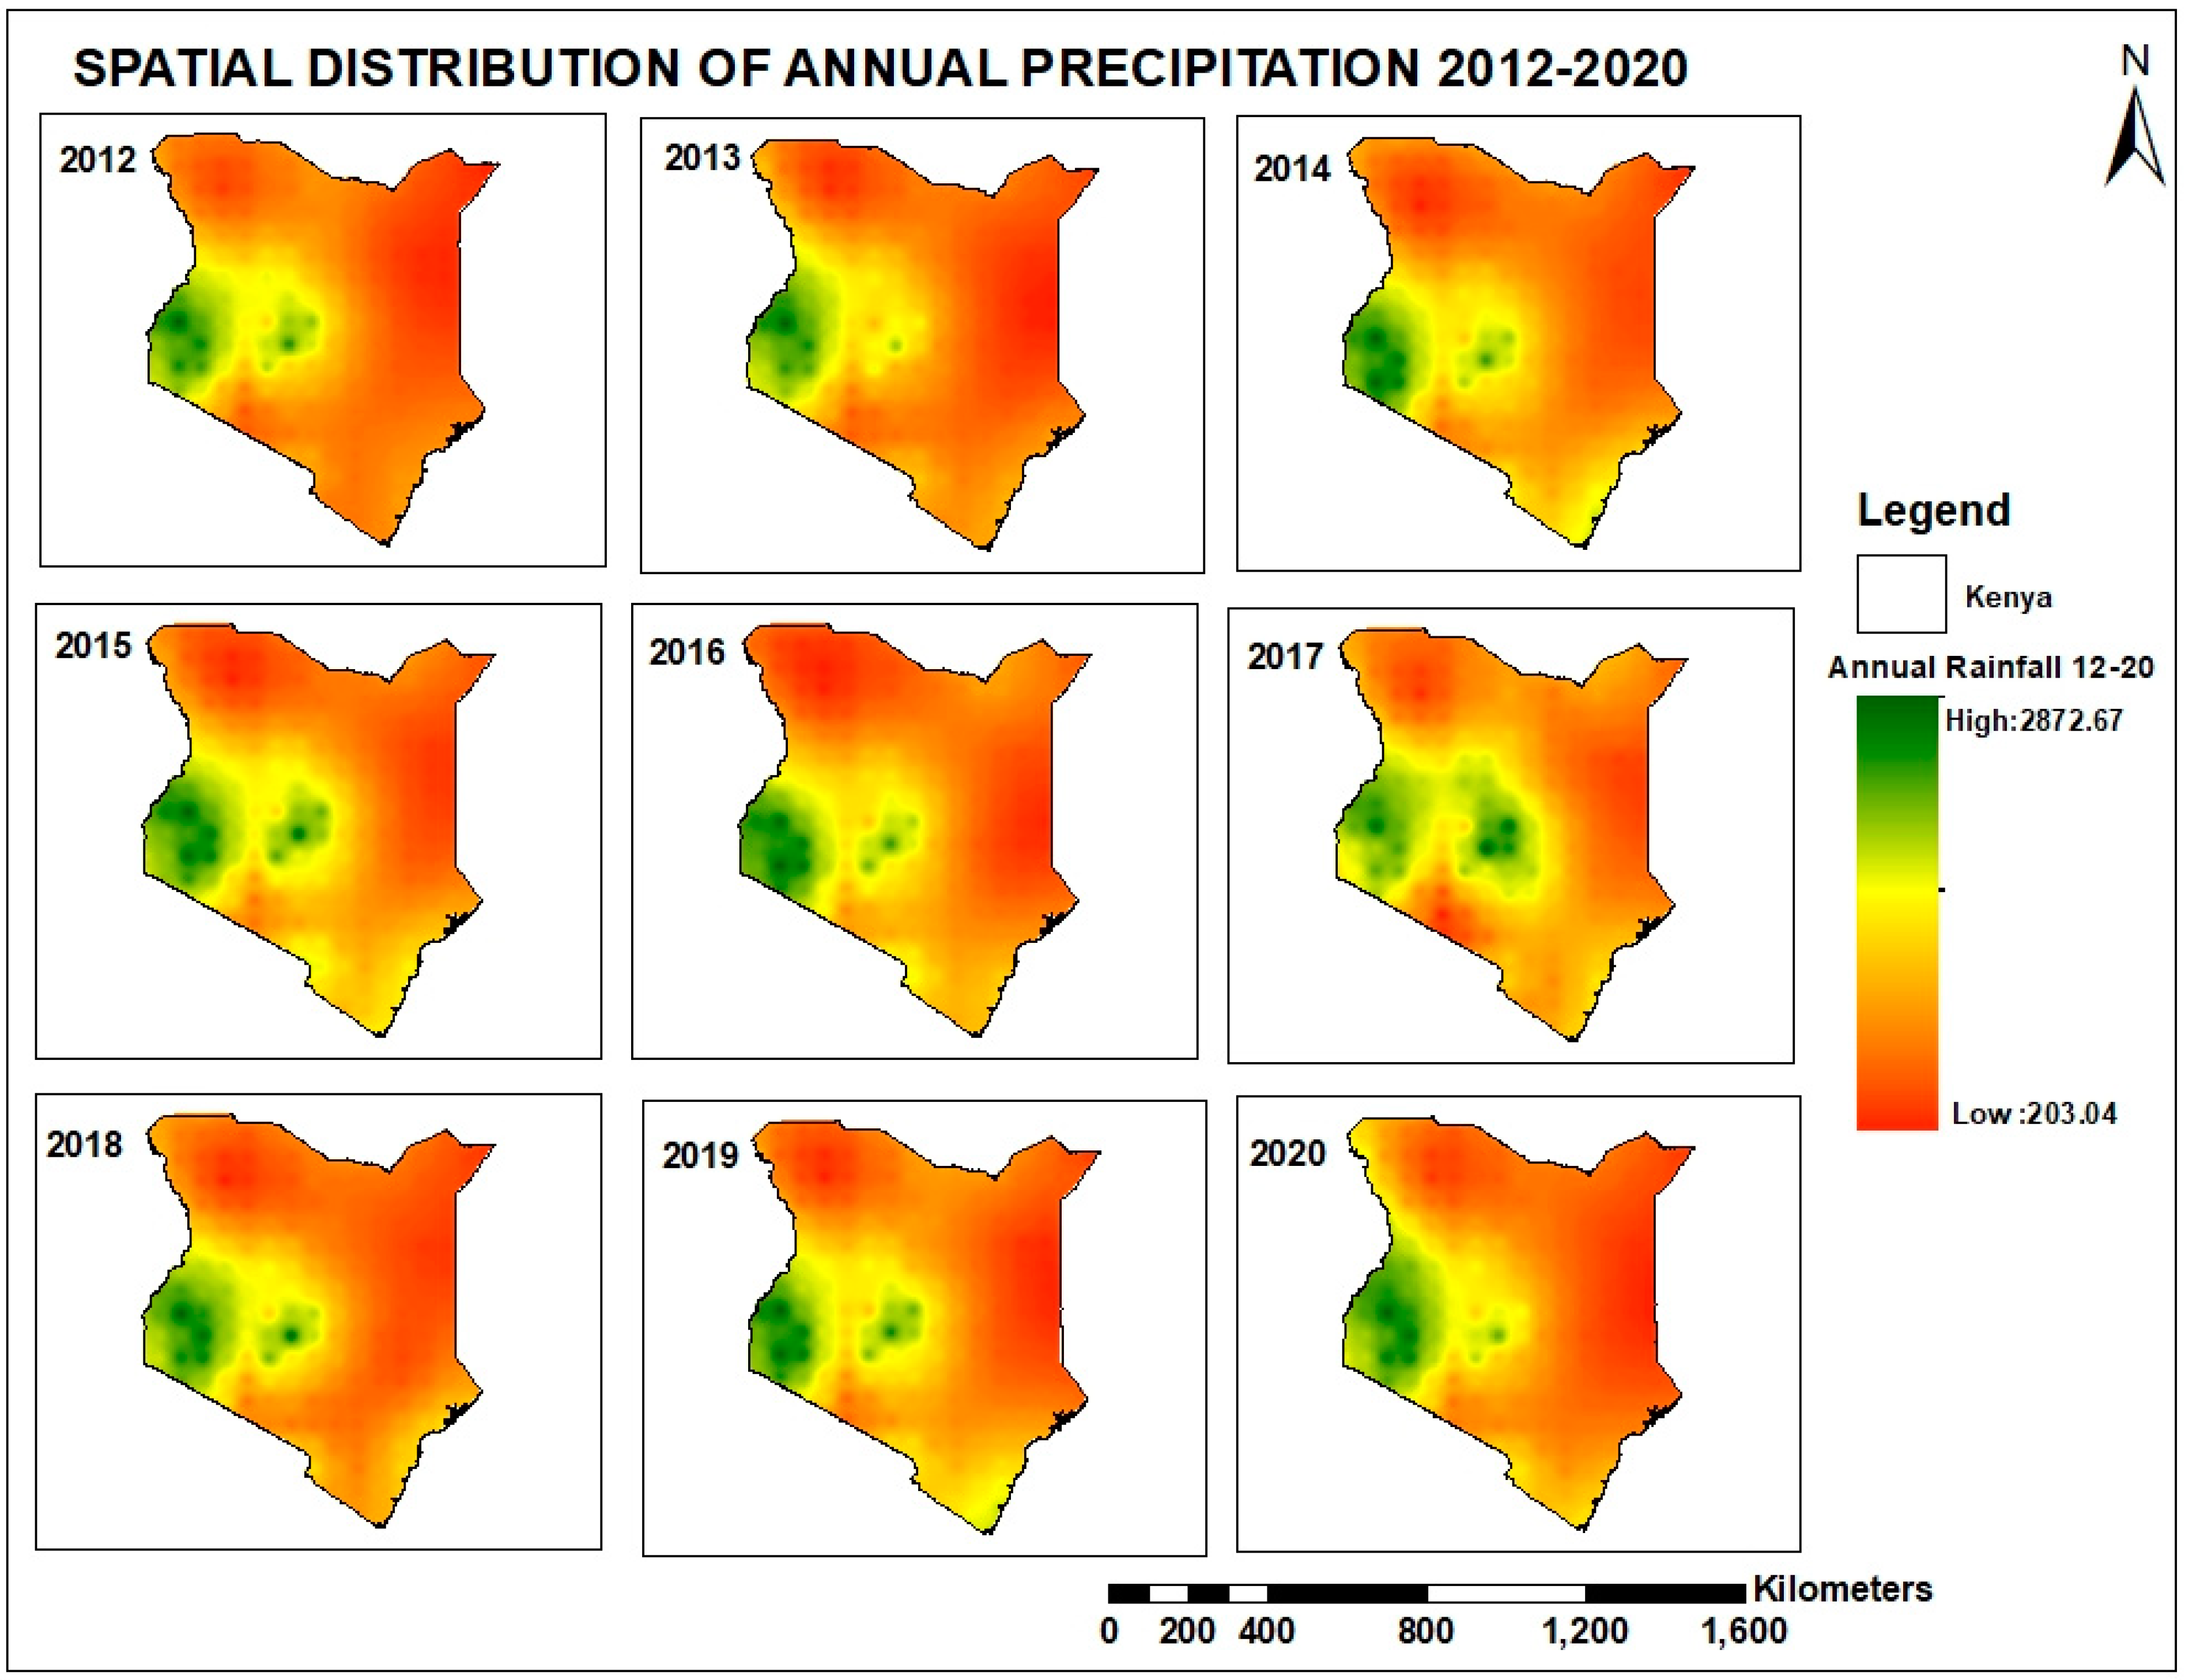
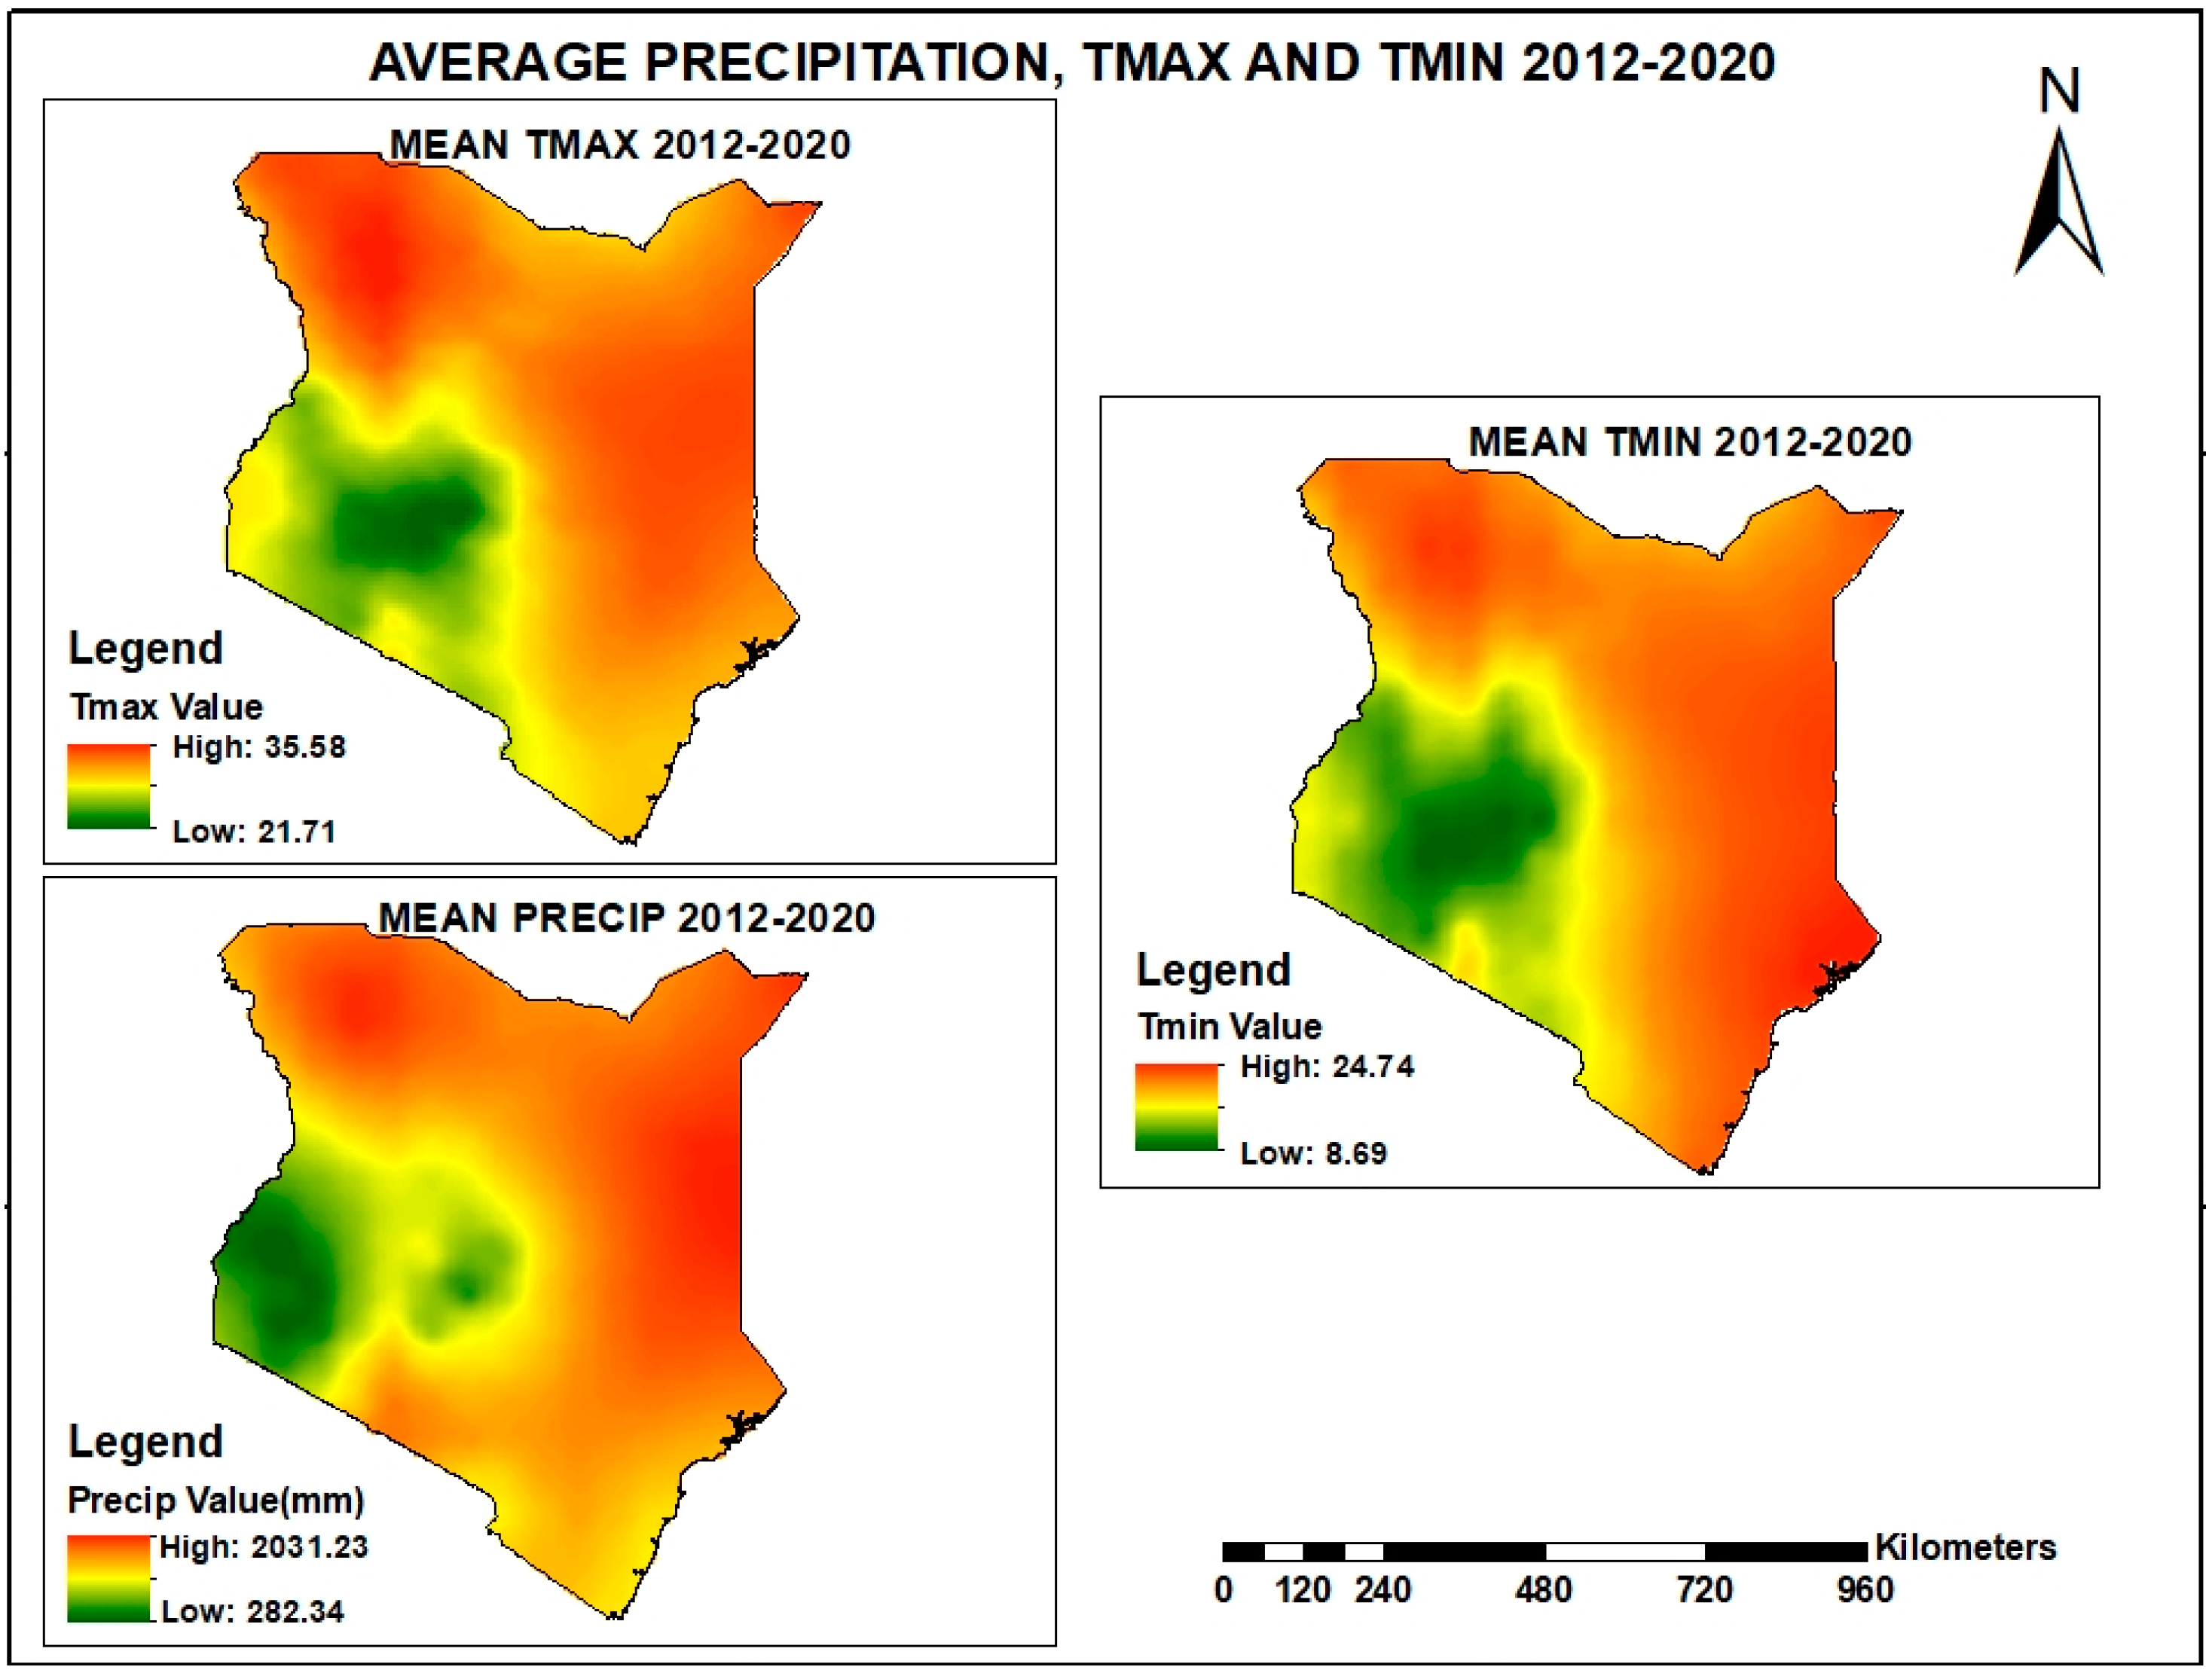
3.1. Precipitation
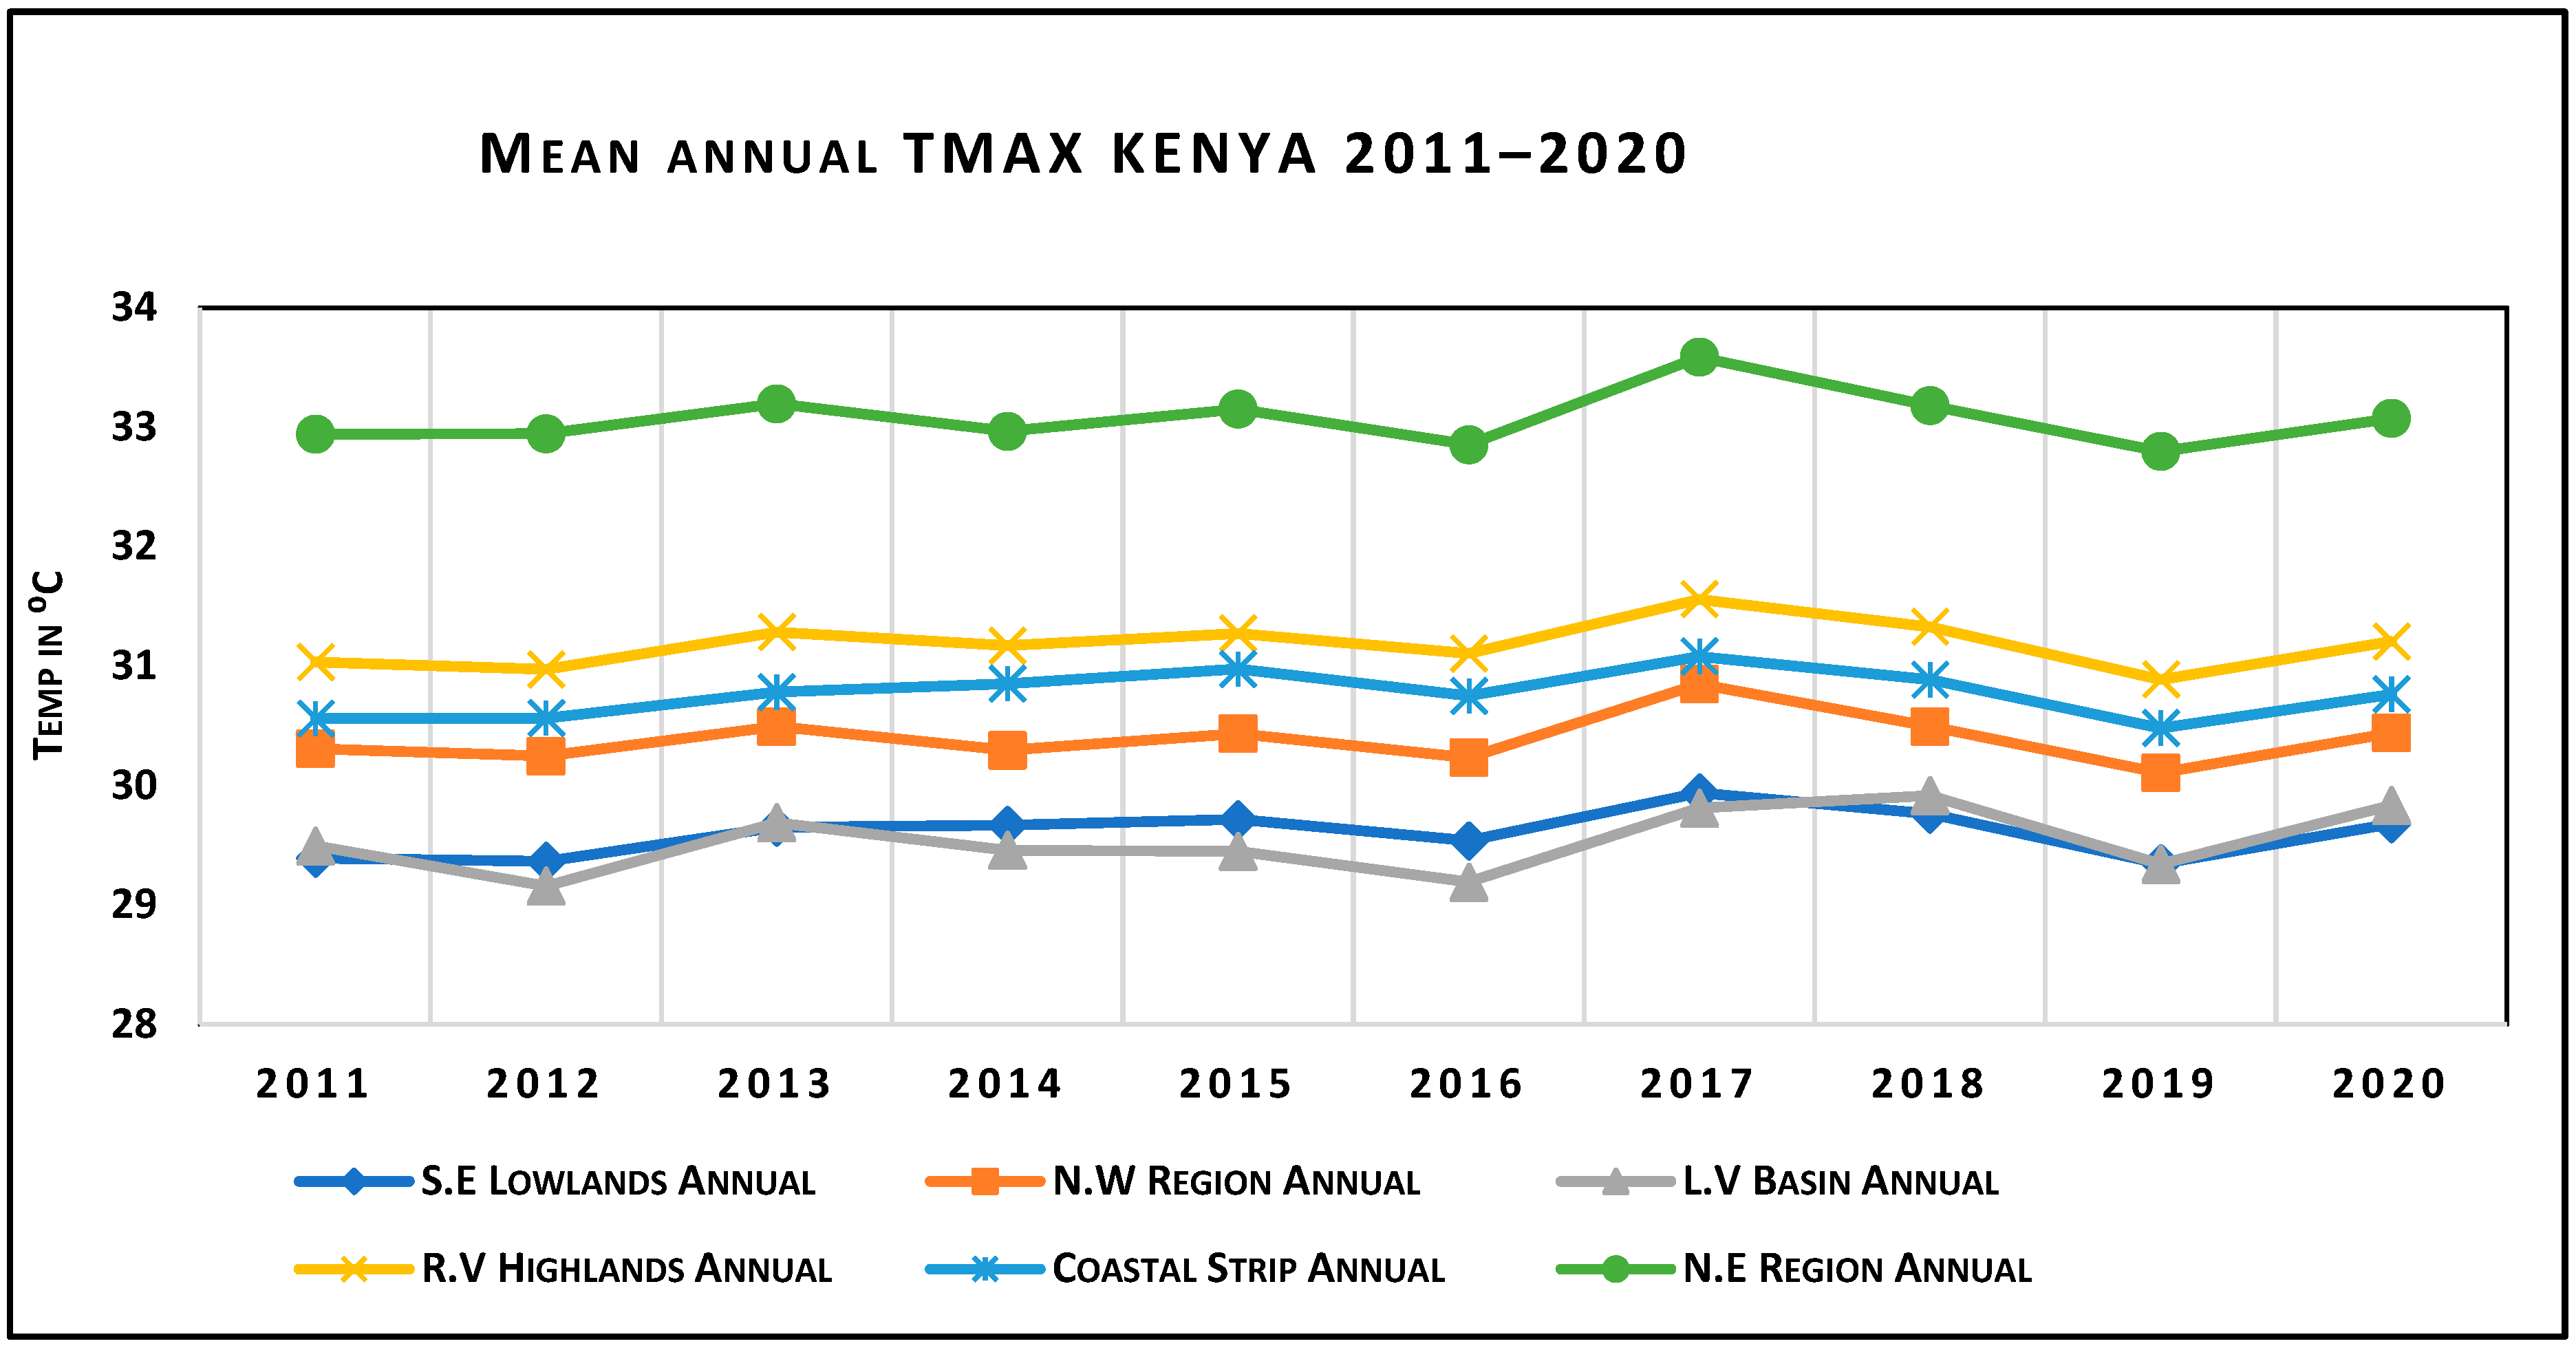
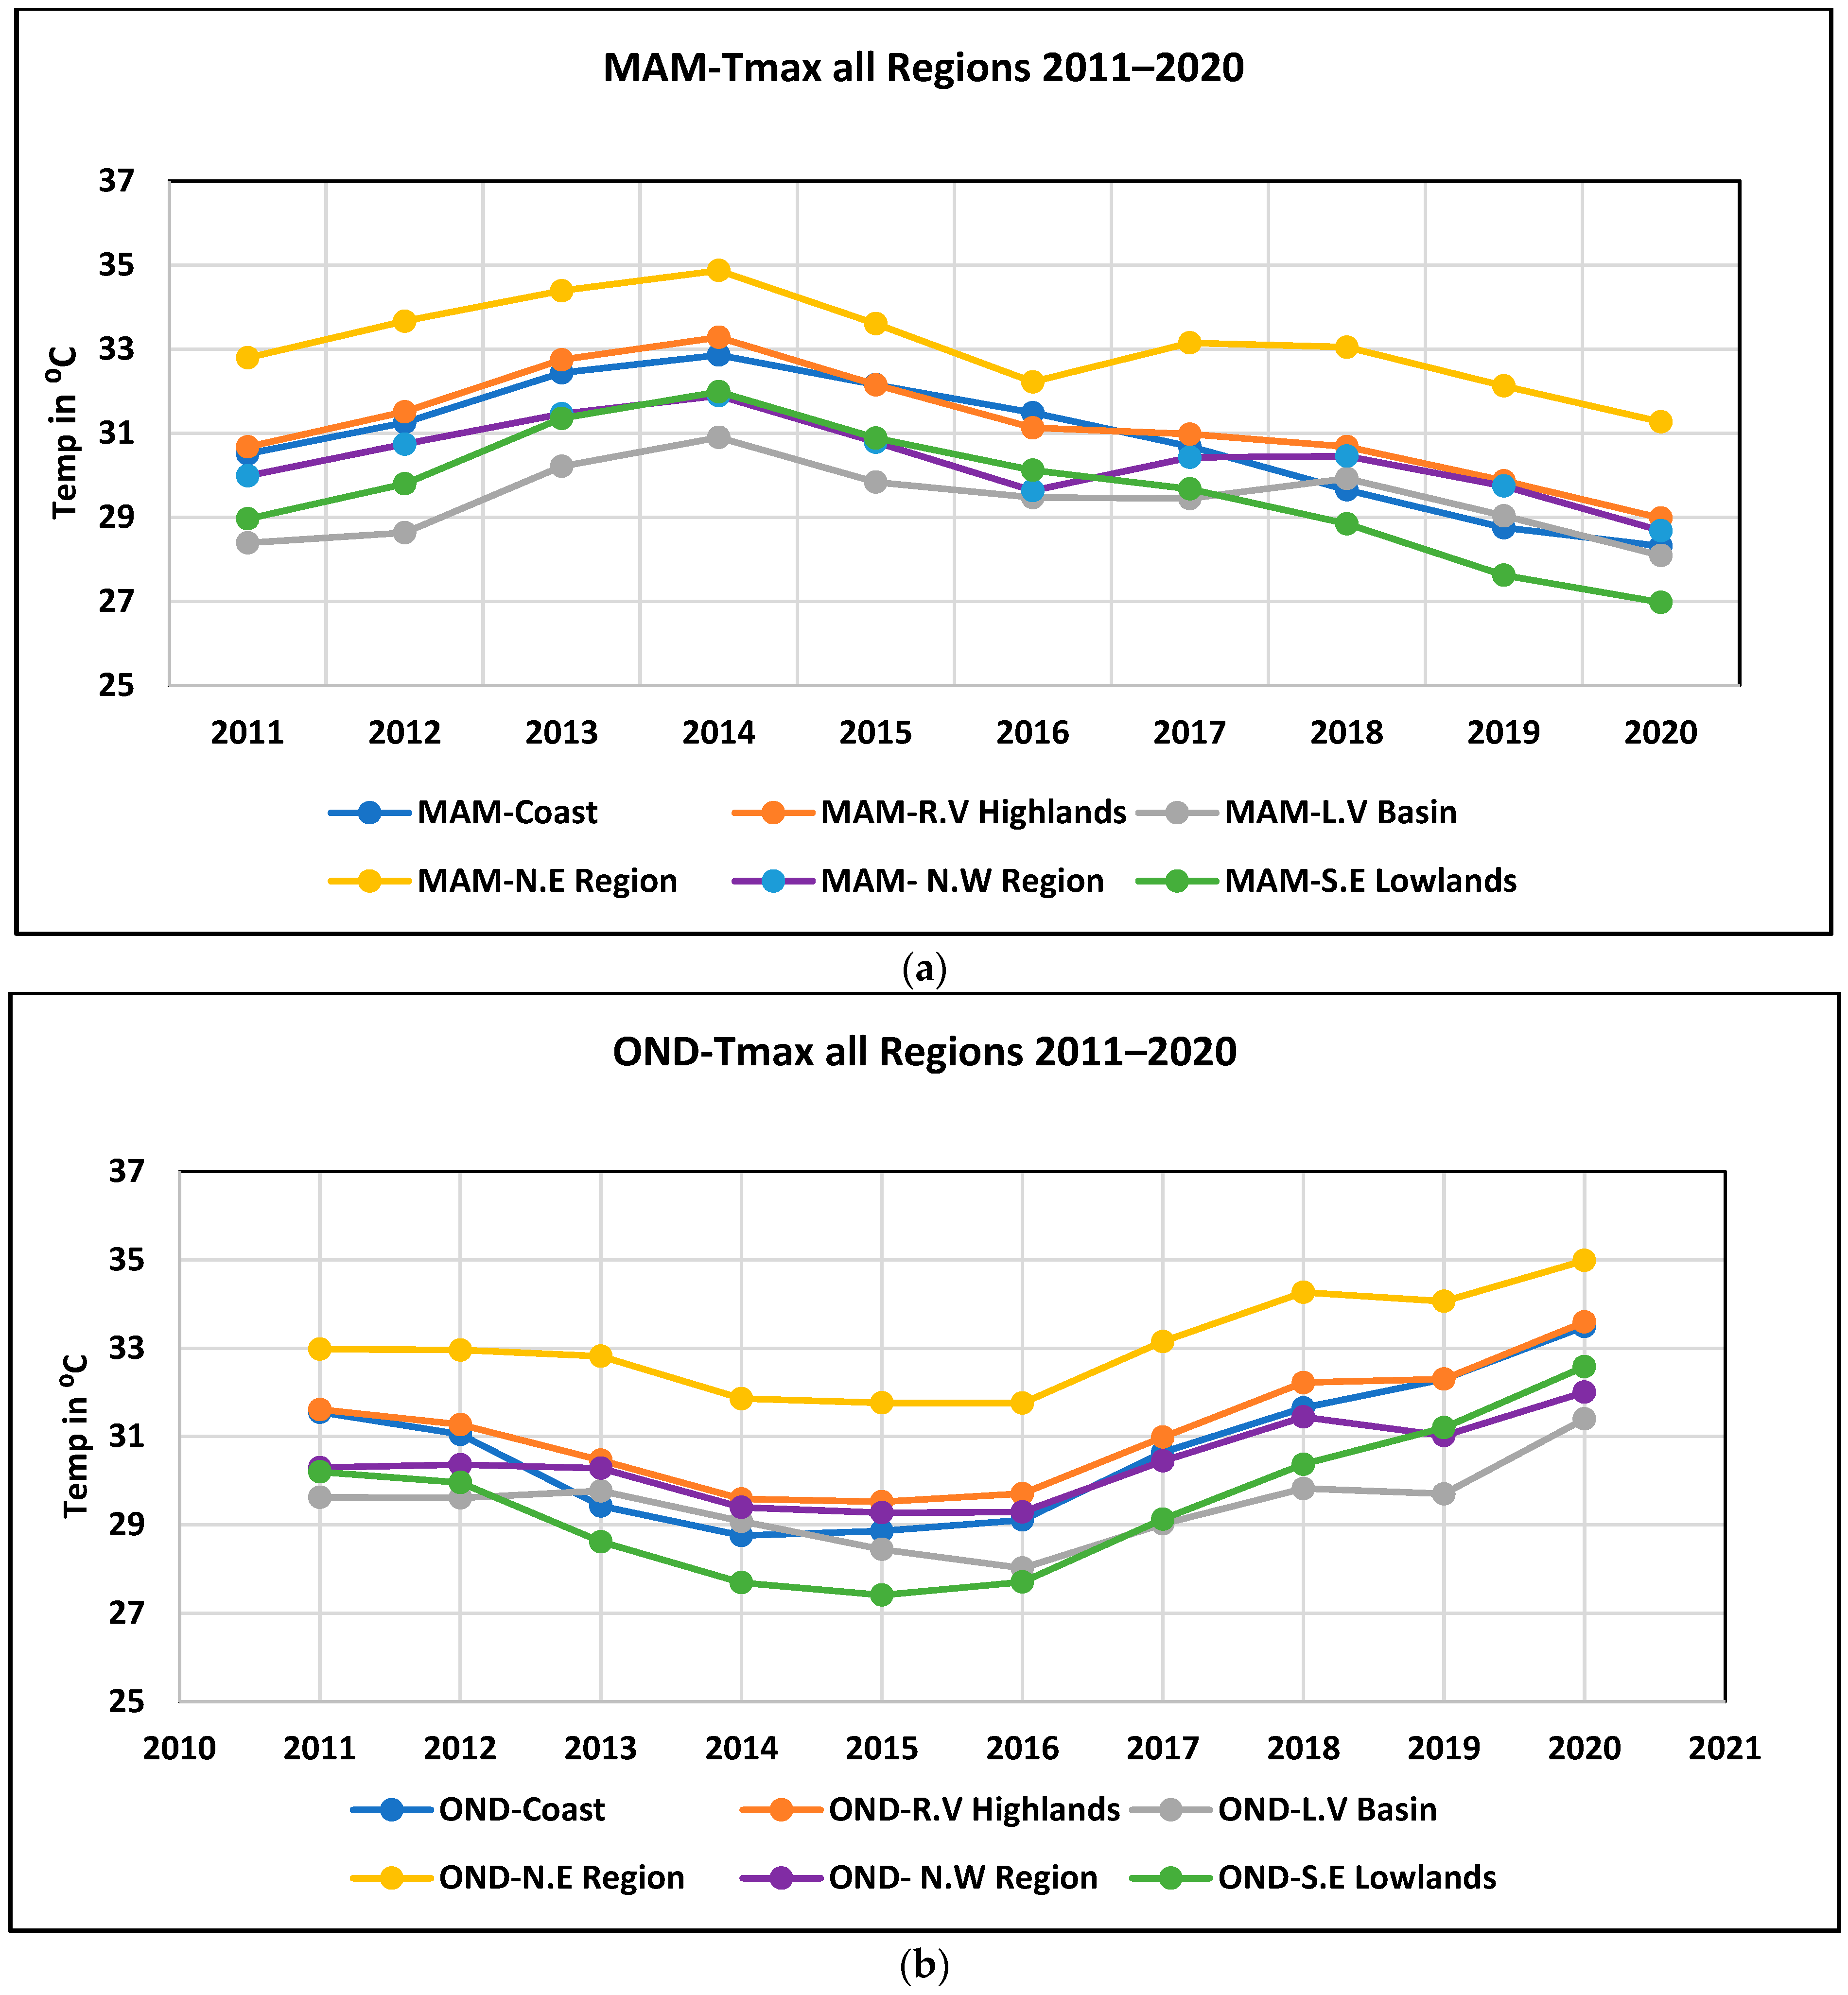
3.2. Maximum Temperature
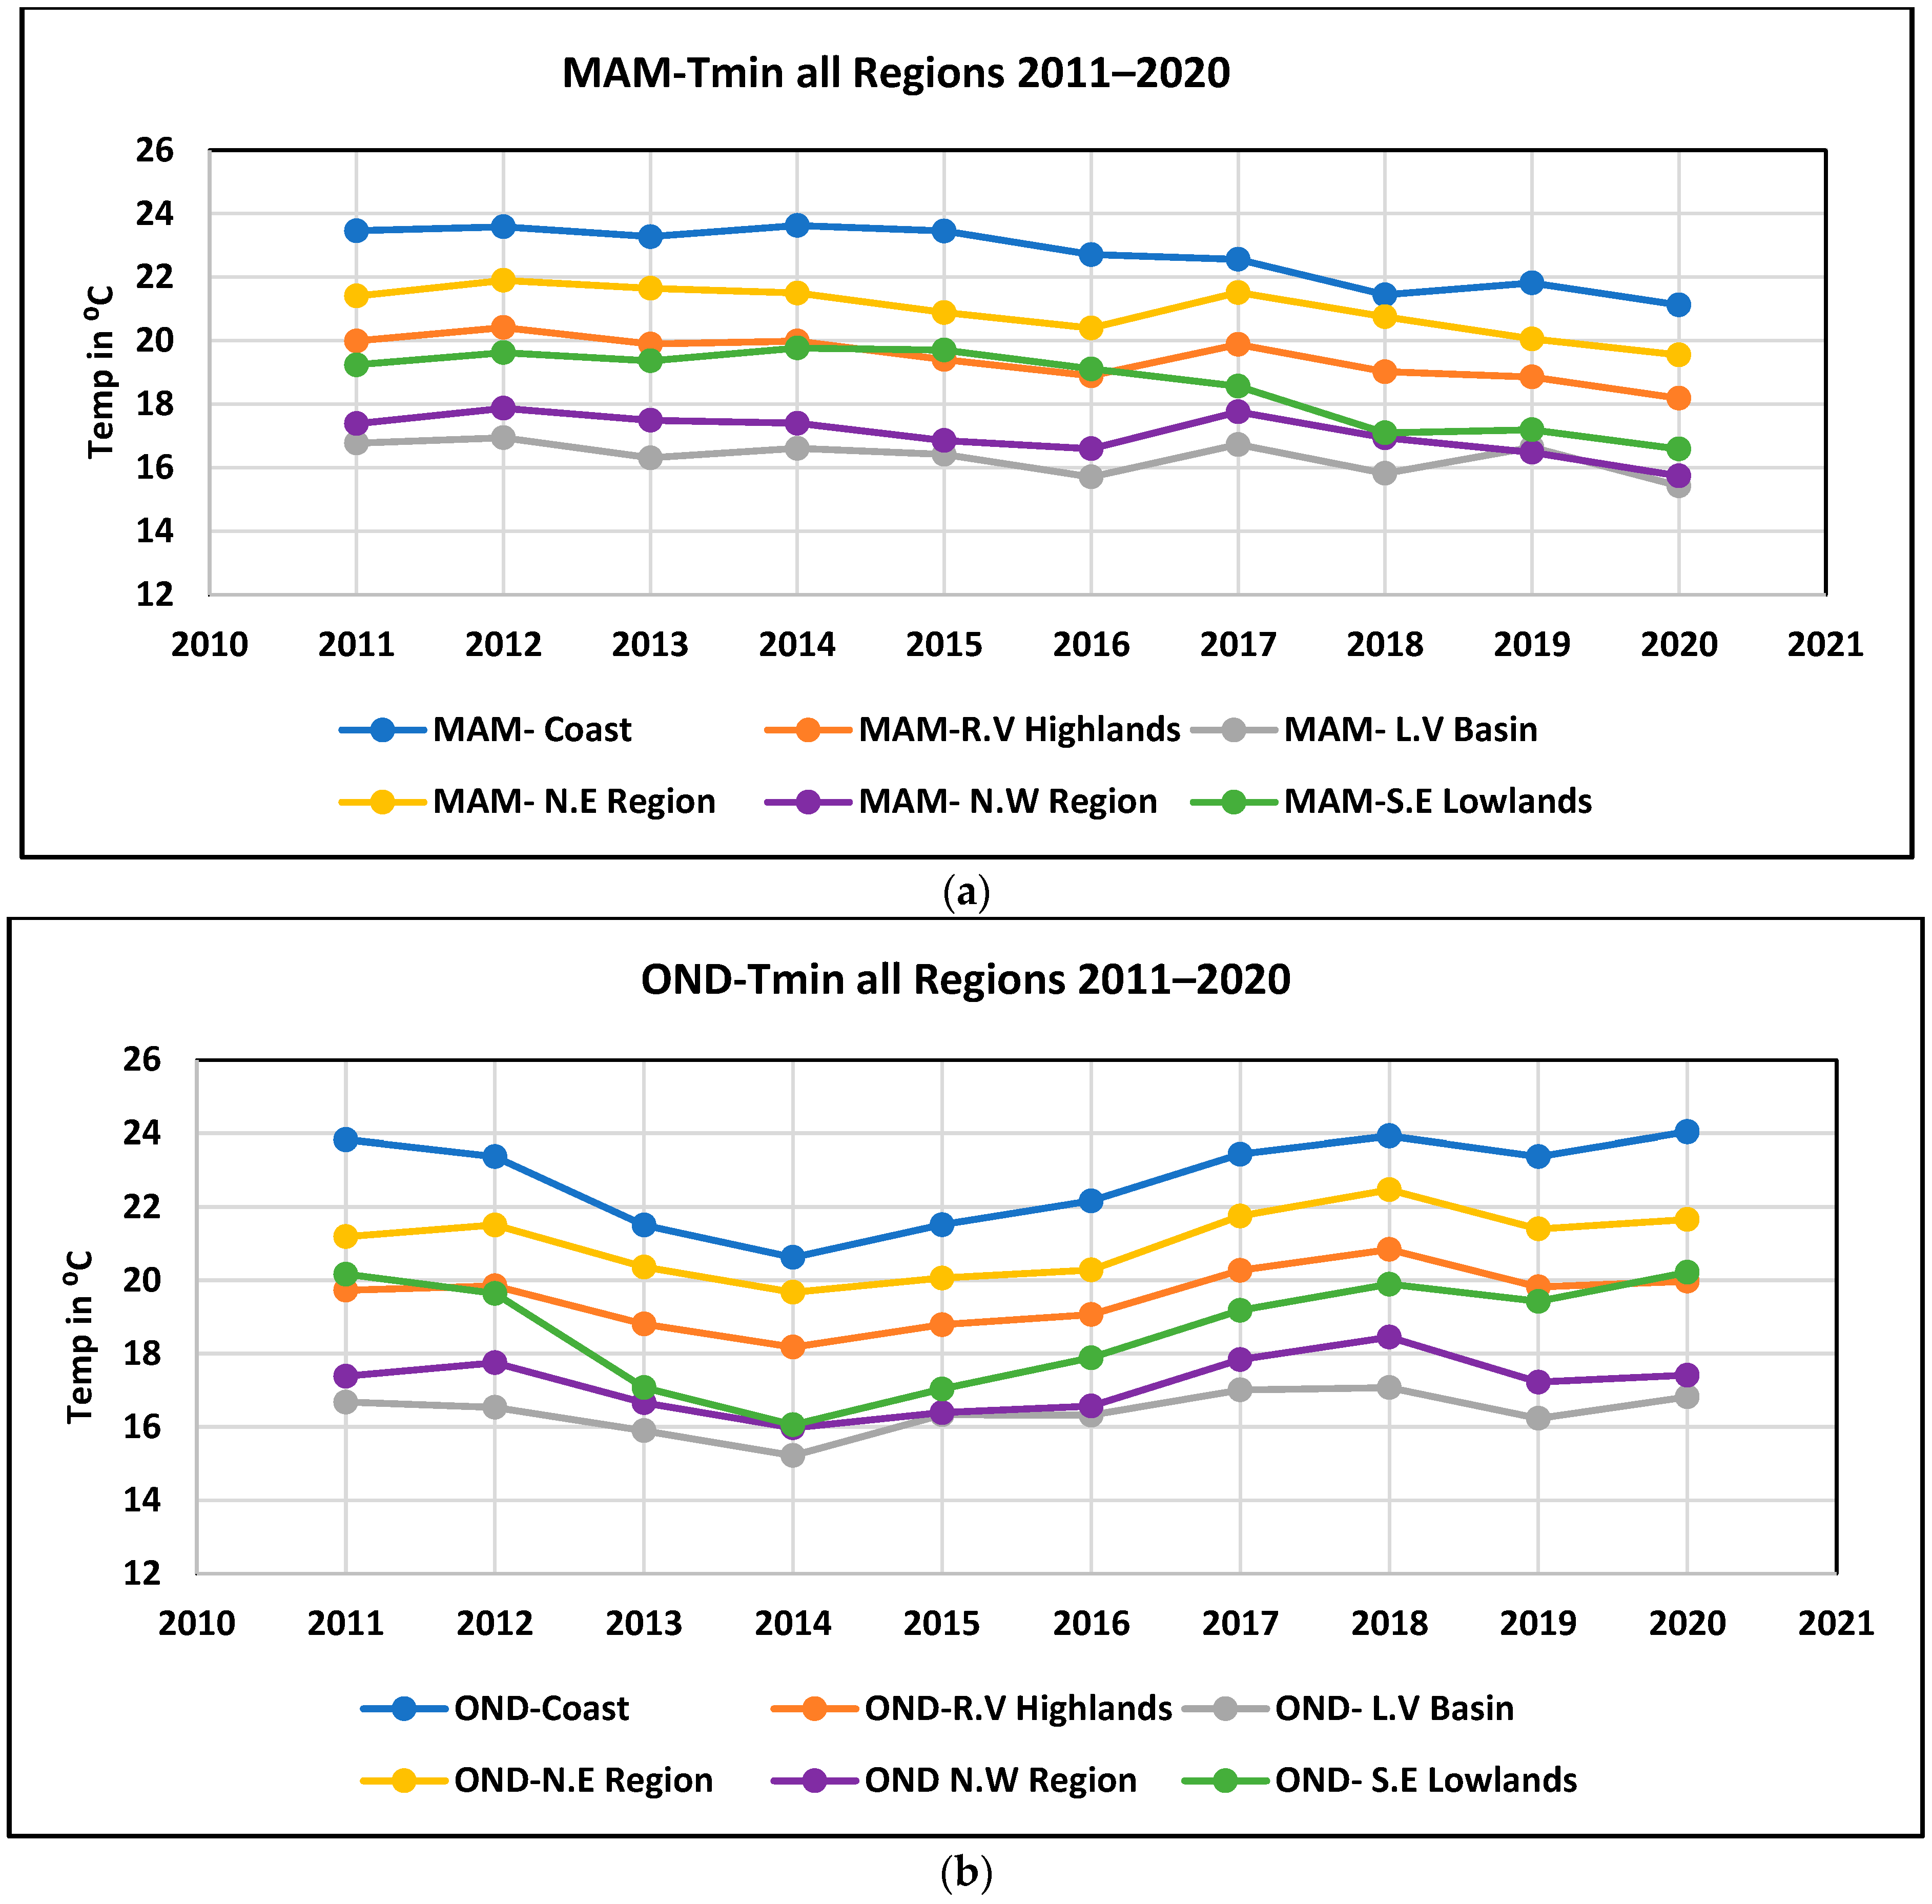
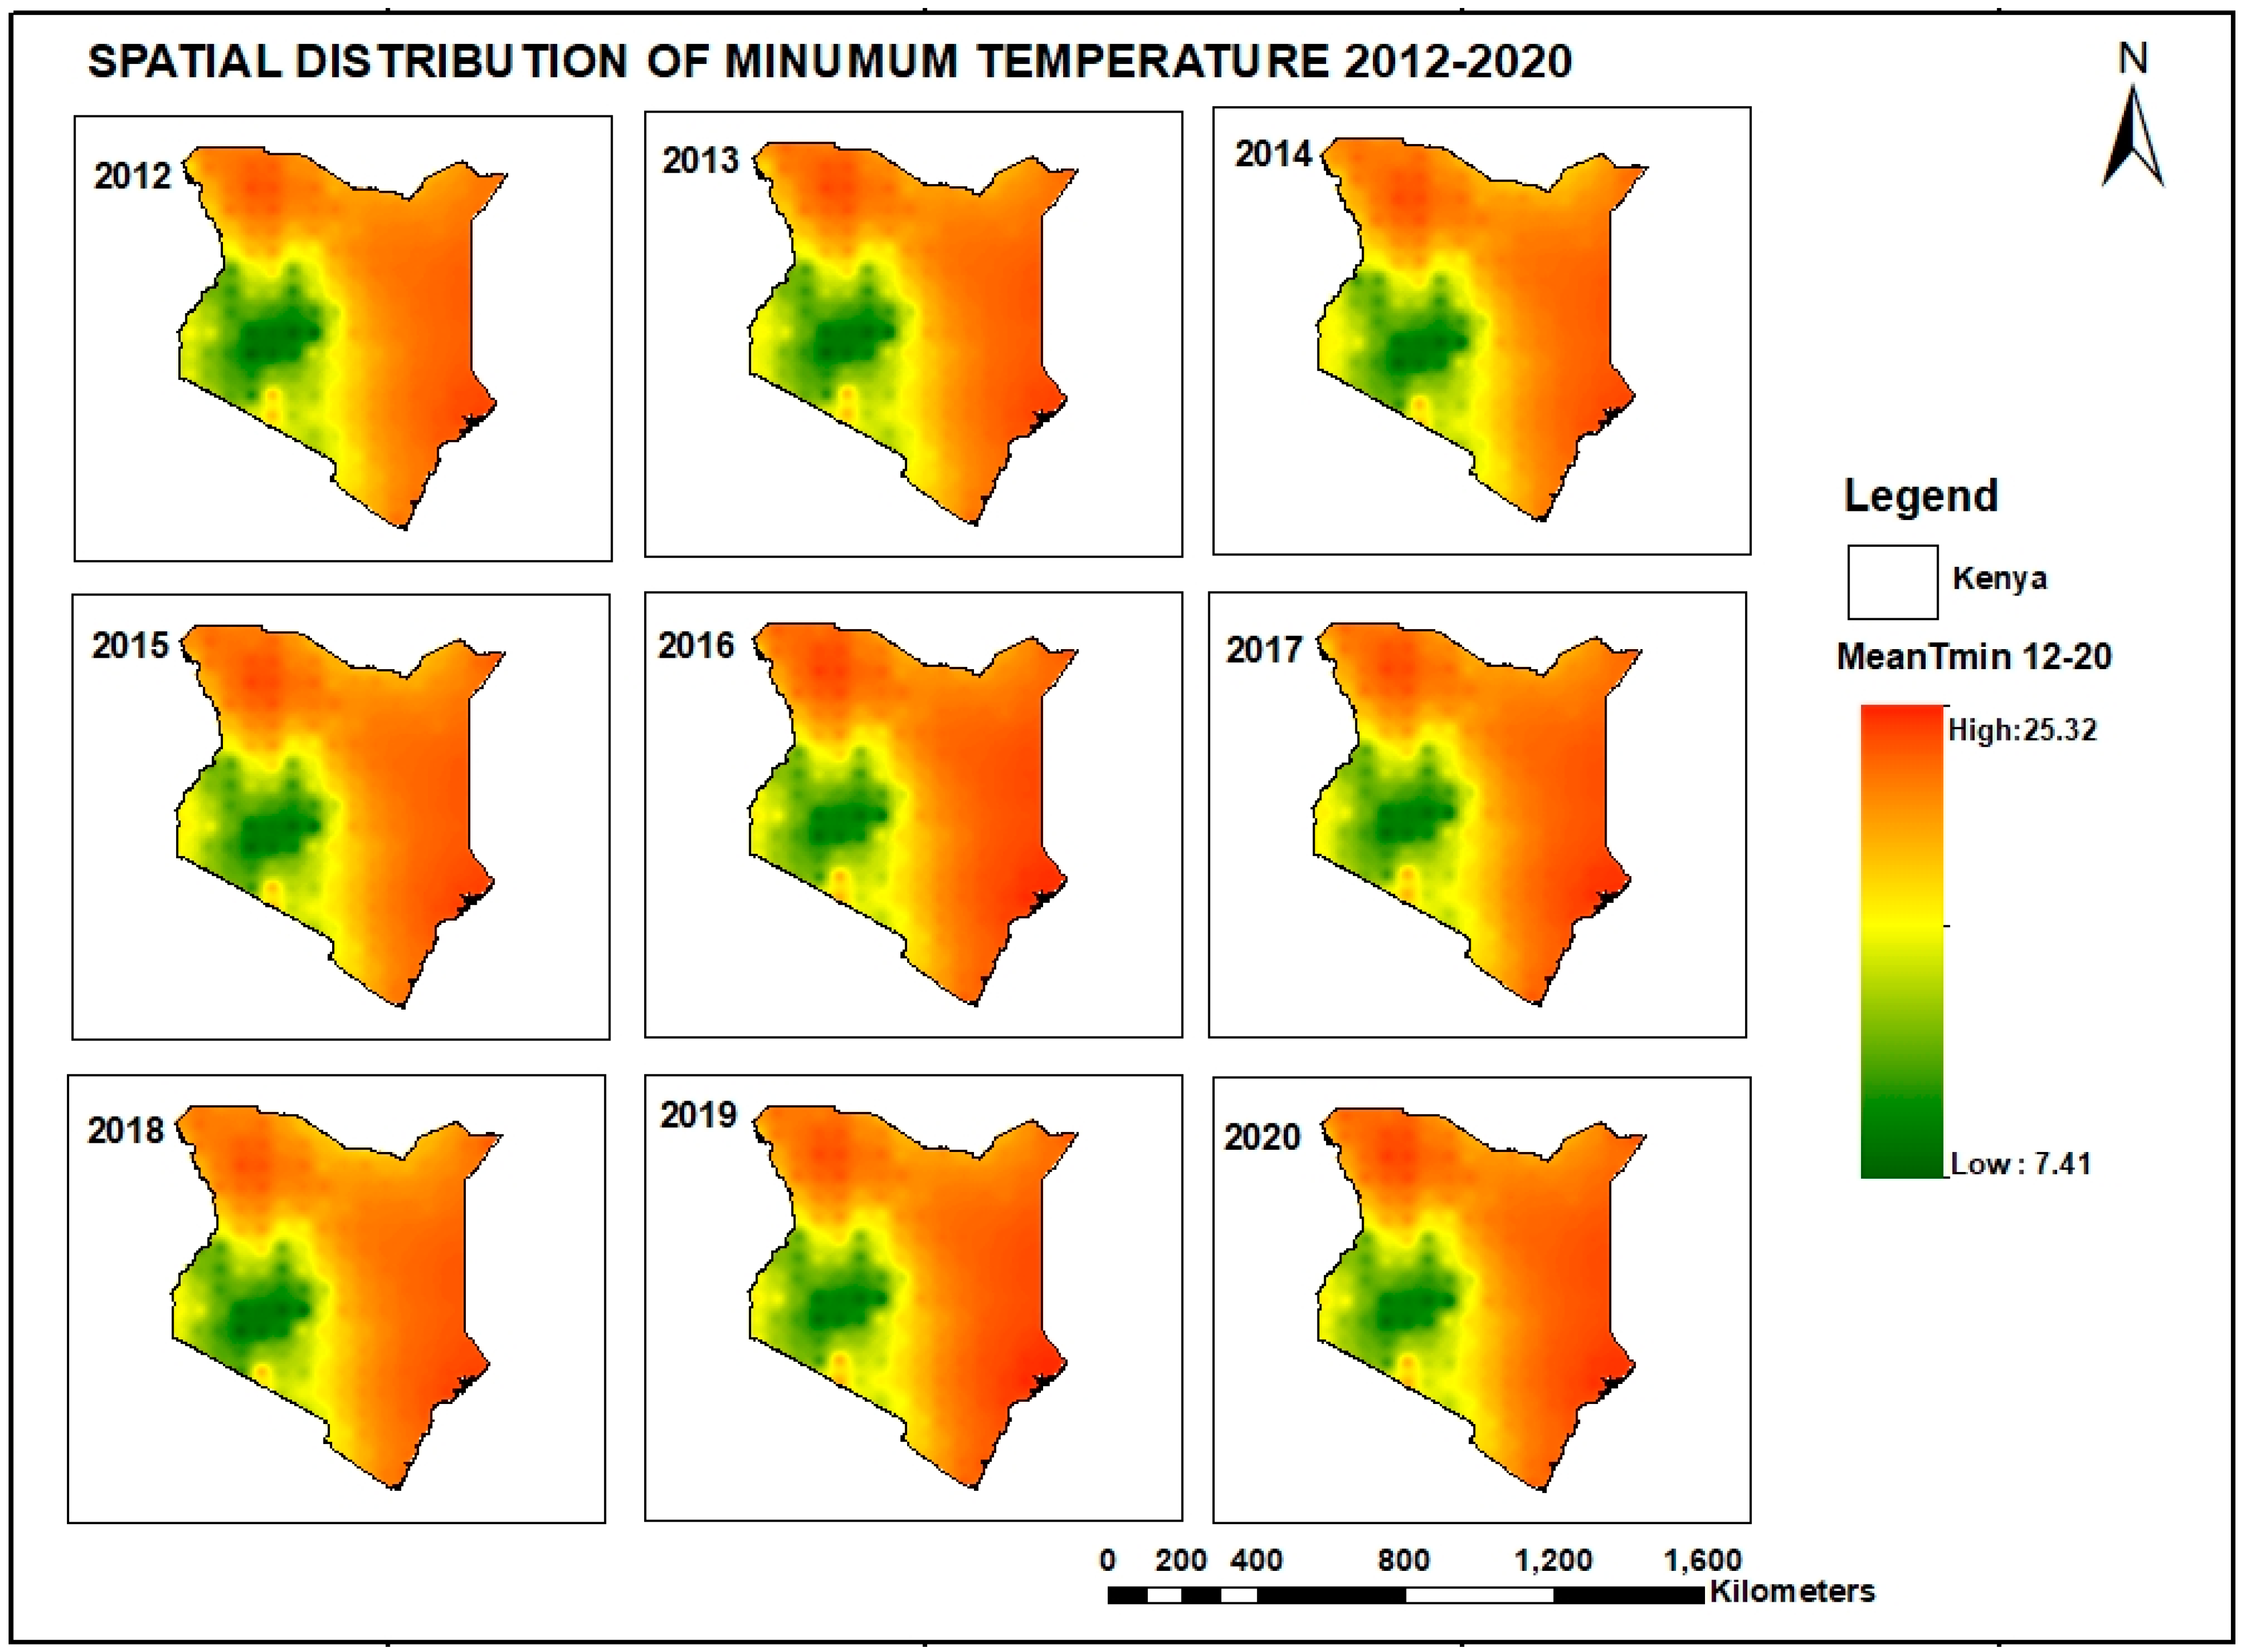
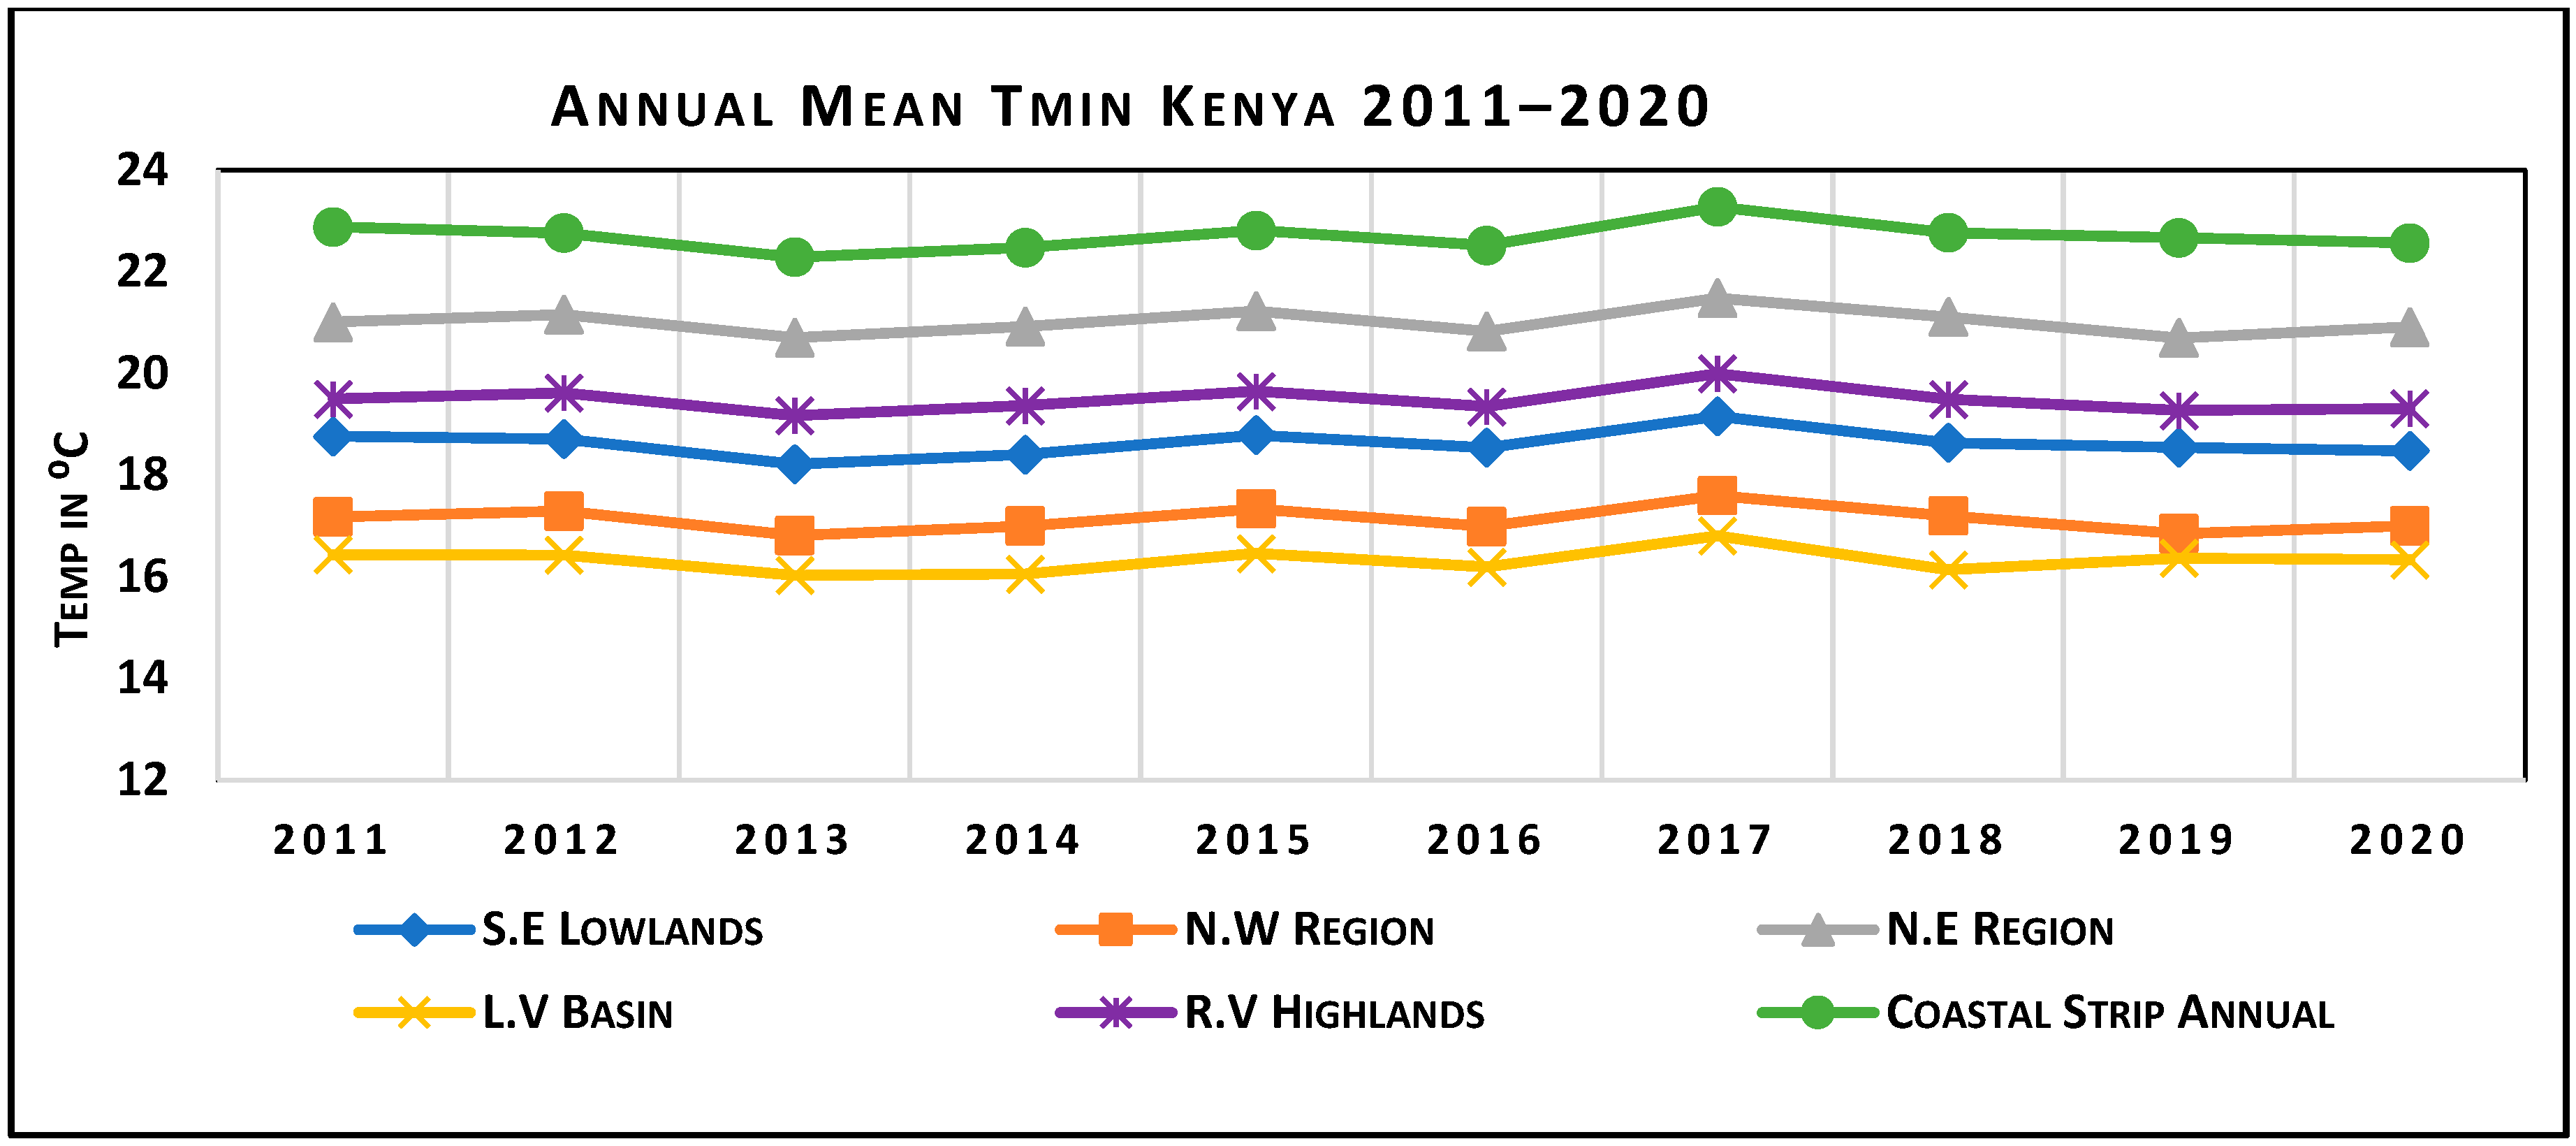
3.3. Minimum Temperature
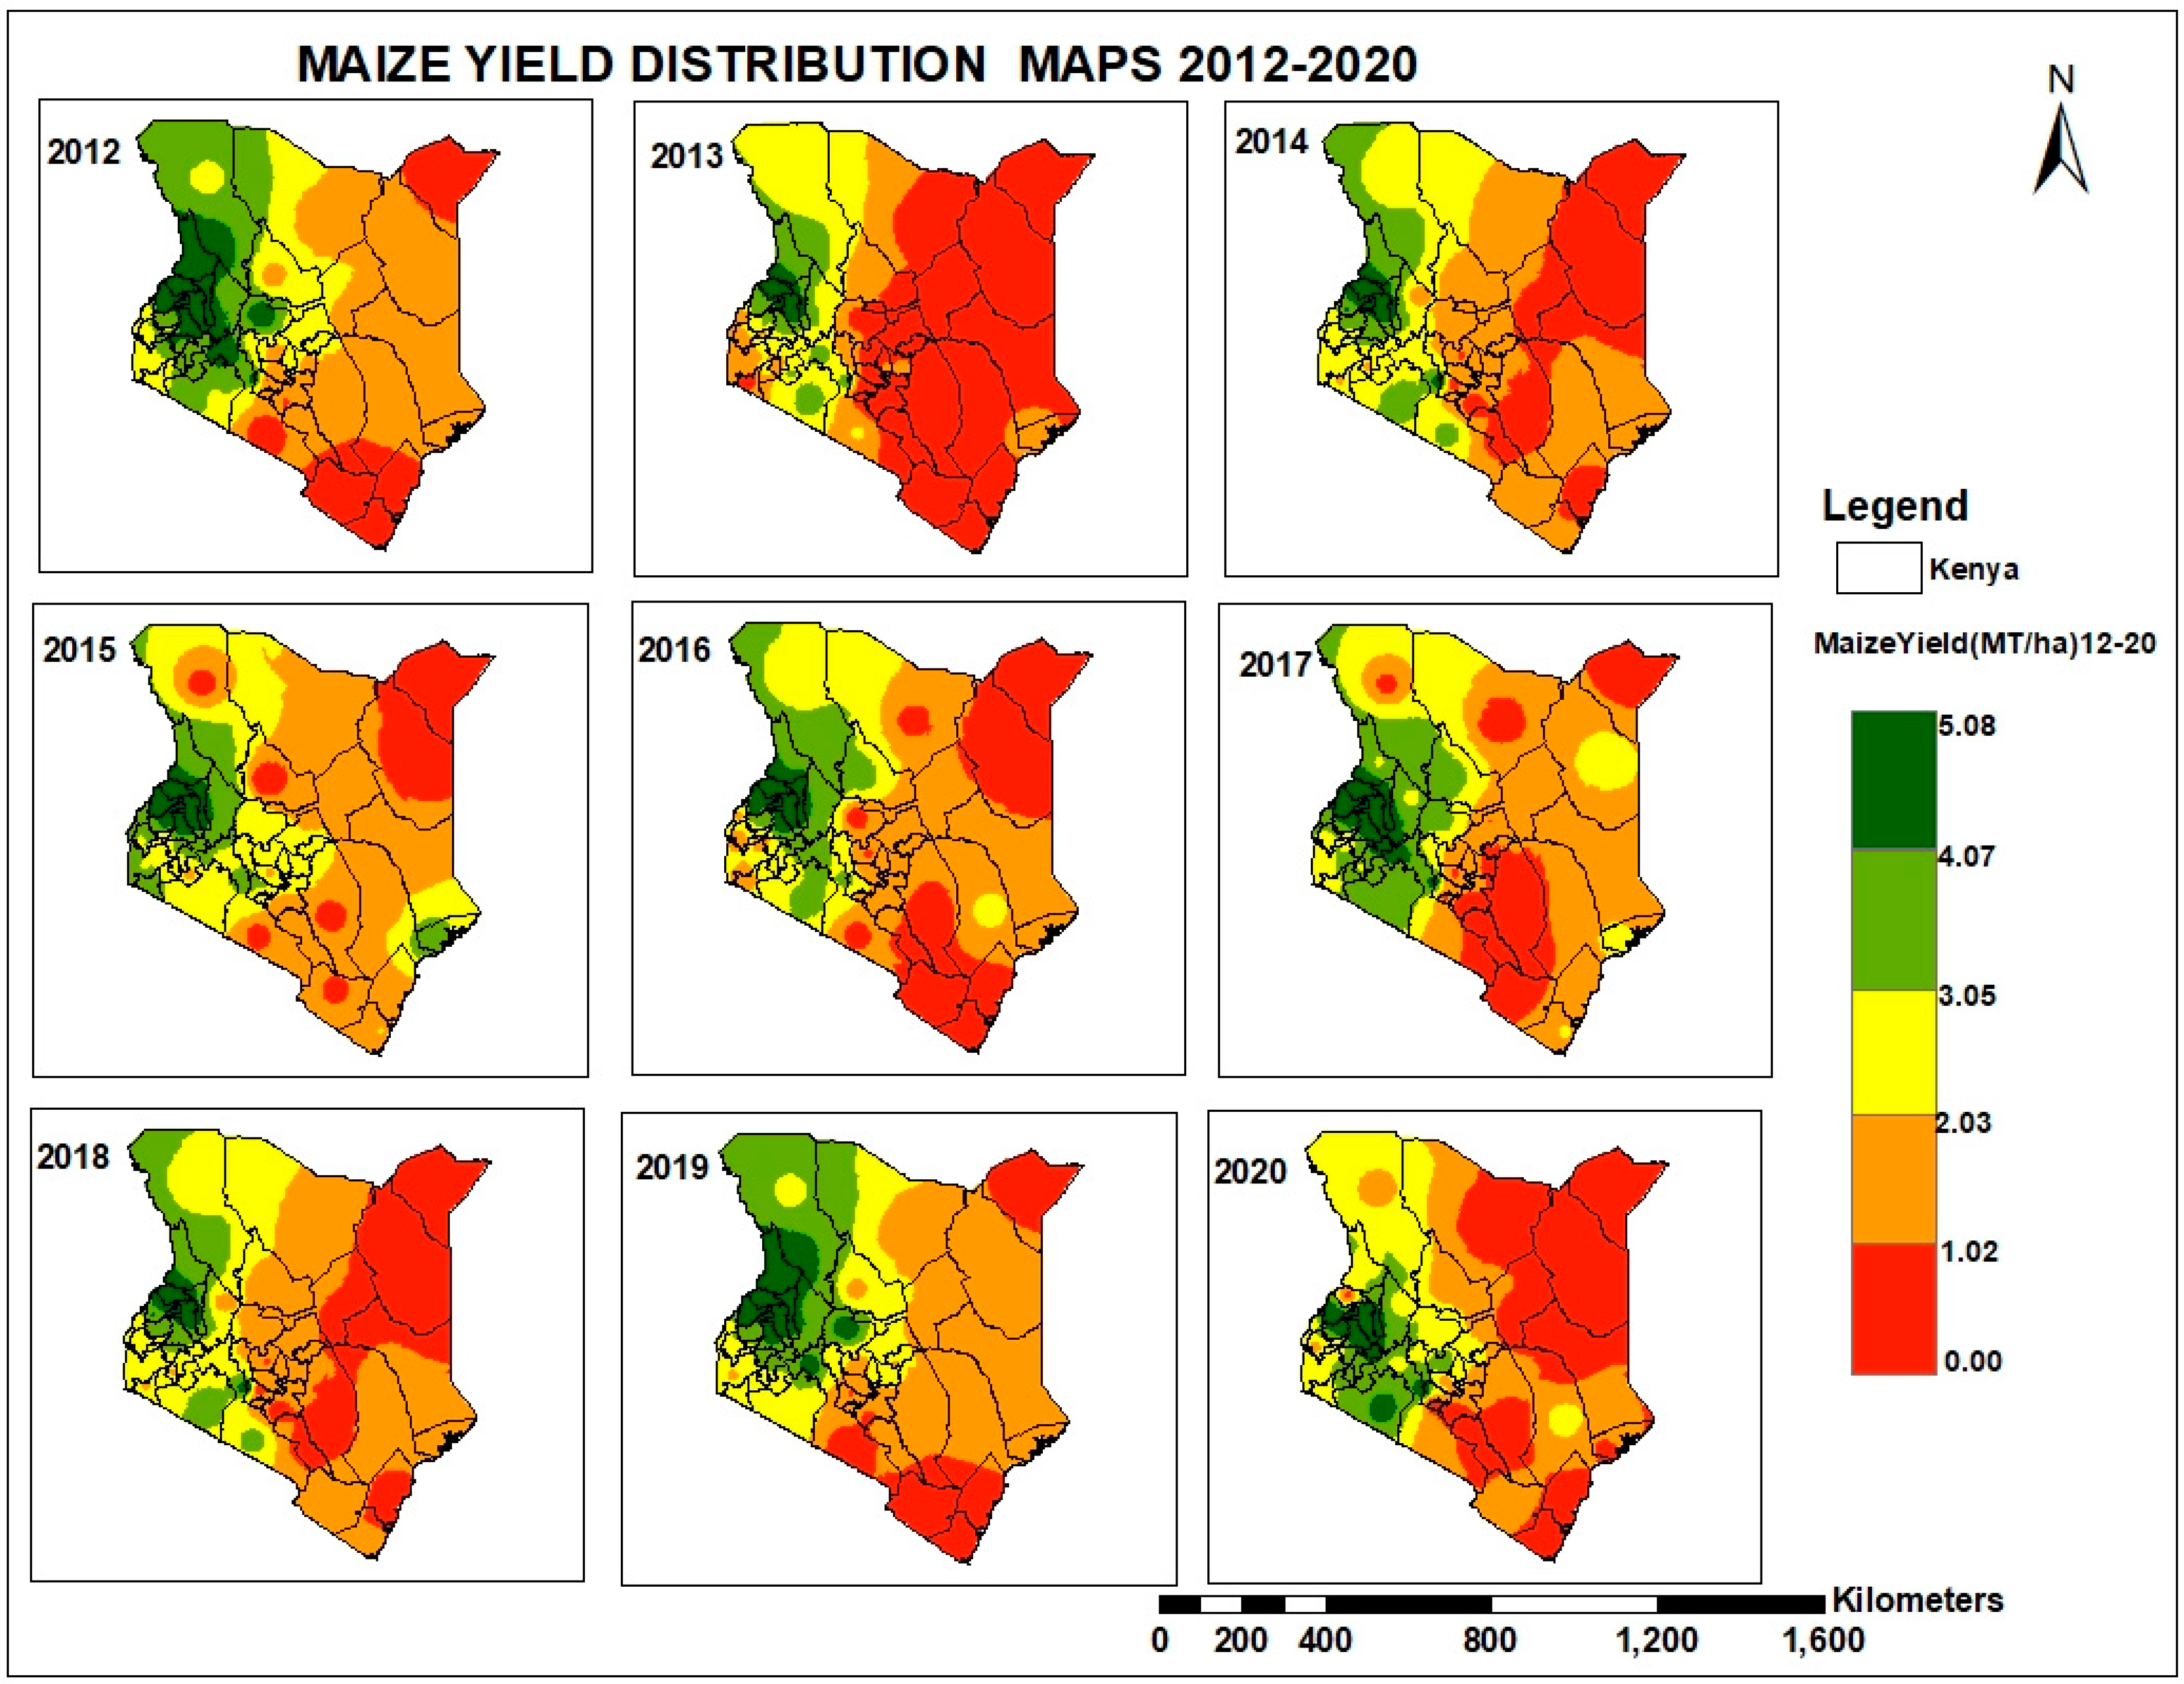
3.4. Effects of Rainfall and Temperature Variability on Maize Yield
4. Discussion
4.1. Precipitation
4.2. Maximum Temperature
4.3. Minimum Temperature
4.4. Effects of Rainfall and Temperature Variability on Maize Yield
5. Conclusions
Author Contributions
Funding
Institutional Review Board Statement
Data Availability Statement
Acknowledgments
Conflicts of Interest
Appendix A

| Mann–Kendall Test for Precipitation | |||
|---|---|---|---|
| Series/Test | Kendall’s Tau | p-Value | Sen’s Slope |
| Year | 1.000 | <0.0001 | 1.000 |
| January | −0.111 | 0.721 | −2.637 |
| February | −0.244 | 0.371 | −3.072 |
| March | −0.200 | 0.474 | −5.230 |
| April | −0.244 | 0.371 | −2.792 |
| May | −0.156 | 0.592 | −1.547 |
| June | 0.111 | 0.721 | 3.911 |
| July | 0.289 | 0.283 | 3.456 |
| August | 0.022 | 1.000 | 0.599 |
| September | −0.022 | 1.000 | −0.349 |
| October | −0.067 | 0.858 | −1.407 |
| November | −0.067 | 0.858 | −3.848 |
| December | 0.111 | 0.721 | 1.021 |
| Average | −0.022 | 1.000 | −0.311 |
| Mann–Kendall and Sen’s Slope Test Results for Tmax | |||
|---|---|---|---|
| Series/Test | Kendall’s Tau | p-Value | Sen’s Slope |
| Year | 1.000 | <0.0001 | 1.000 |
| January | −0.556 | 0.032 | −0.289 |
| February | −0.422 | 0.107 | −0.224 |
| March | −0.644 | 0.012 | −0.410 |
| April | −0.378 | 0.152 | −0.465 |
| May | −0.022 | 1.000 | −0.101 |
| June | 0.244 | 0.371 | 0.174 |
| July | 0.378 | 0.152 | 0.196 |
| August | 0.200 | 0.474 | 0.176 |
| September | 0.289 | 0.283 | 0.107 |
| October | 0.467 | 0.074 | 0.324 |
| November | 0.244 | 0.371 | 0.279 |
| December | 0.022 | 1.000 | 0.038 |
| Average | 0.156 | 0.592 | 0.019 |
| Mann–Kendall and Sen’s Slope Test Results for Tmin | |||
|---|---|---|---|
| Series/Test | Kendall’s Tau | p-Value | Sen’s Slope |
| Year | 1.000 | <0.0001 | 1.000 |
| January | −0.244 | 0.371 | −0.066 |
| February | −0.156 | 0.592 | −0.040 |
| March | −0.556 | 0.032 | −0.291 |
| April | −0.422 | 0.107 | −0.167 |
| May | −0.467 | 0.074 | −0.147 |
| June | 0.156 | 0.592 | 0.075 |
| July | 0.378 | 0.152 | 0.081 |
| August | 0.244 | 0.371 | 0.132 |
| September | 0.244 | 0.371 | 0.120 |
| October | 0.022 | 1.000 | 0.047 |
| November | 0.333 | 0.210 | 0.187 |
| December | 0.289 | 0.283 | 0.163 |
| Average | −0.156 | 0.592 | −0.008 |
References
- FAO. Climate Change and Food Security: Risks and Responses; FAO: Rome, Italy, 2015. [Google Scholar]
- Gil, J.D.B.; Reidsma, P.; Giller, K.; Todman, L.; Whitmore, A.; van Ittersum, M. Sustainable development goal 2: Improved targets and indicators for agriculture and food security. Ambio 2019, 48, 685–698. [Google Scholar] [CrossRef]
- Ngure, M.W.; Wandiga, S.O.; Olago, D.O.; Oriaso, S.O. Climate change stressors affecting household food security among Kimandi-Wanyaga smallholder farmers in Murang’a County, Kenya. Open Agric. 2021, 6, 587–608. [Google Scholar] [CrossRef]
- Kogo, B.K.; Kumar, L.; Koech, R.; Hasan, M.K. Response to climate change in a rain-fed crop production system: Insights from maize farmers of western Kenya. Mitig. Adapt. Strat. Glob. Chang. 2022, 27, 50. [Google Scholar] [CrossRef]
- FAO. Climate Change and Food Systems: Global Assessments and Implications for Food Security and Trade; FAO: Rome, Italy, 2015. [Google Scholar]
- Gornall, J.; Betts, R.; Burke, E.; Clark, R.; Camp, J.; Willett, K.; Wiltshire, A. Implications of climate change for agricultural productivity in the early twenty-first century. R. Soc. 2010, 365, 2973–2989. [Google Scholar] [CrossRef]
- IPCC. Technical Summary Frequently Asked Questions Part of the Working Group II Contribution to the Sixth Assessment Report of the Intergovernmental Panel on Climate Change. Geneva: Intergovernmental Panel on Climate Change. 2022. Available online: www.environmentalgraphiti.org (accessed on 4 March 2024).
- Rosenzweig, C.; Elliott, J.; Deryng, D.; Ruane, A.C.; Müller, C.; Arneth, A.; Boote, K.J.; Folberth, C.; Glotter, M.; Khabarov, N.; et al. Assessing agricultural risks of climate change in the 21st century in a global gridded crop model intercomparison. Proc. Natl. Acad. Sci. USA 2014, 111, 3268–3273. [Google Scholar] [CrossRef] [PubMed]
- Teixeira, E.I.; Fischer, G.; Van Velthuizen, H.; Walter, C.; Ewert, F. Global hot-spots of heat stress on agricultural crops due to climate change. Agric. Meteorol. 2013, 170, 206–215. [Google Scholar] [CrossRef]
- WMO. WMO Statement on the State of the Global Climate in 2016; WMO: Geneva, Switzerland, 2016. [Google Scholar]
- Misra, A.K. Climate change and challenges of water and food security. Int. J. Sustain. Built Environ. 2014, 3, 153–165. [Google Scholar] [CrossRef]
- Moritz, C.; Agudo, R. The future of species under climate change: Resilience or decline? Am. Assoc. Adv. Sci. 2013, 341, 504–508. [Google Scholar] [CrossRef]
- Birkmann, J.; Jamshed, A.; McMillan, J.M.; Feldmeyer, D.; Totin, E.; Solecki, W.; Ibrahim, Z.Z.; Roberts, D.; Kerr, R.B.; Poertner, H.-O.; et al. Understanding human vulnerability to climate change: A global perspective on index validation for adaptation planning. Sci. Total Environ. 2022, 803, 150065. [Google Scholar] [CrossRef]
- IPCC. Summary for Policymakers. In Climate Change 2023: Synthesis Report. Contribution of Working Groups I, II and III to the Sixth Assessment Report of the Intergovernmental Panel on Climate Change; Core Writing Team, Lee, H., Romero, J., Eds.; IPCC: Geneva, Switzerland, 2023. [Google Scholar] [CrossRef]
- Rubin, I.L.; Falk, H.; Mutic, A.D.; Rubin, L.; Professor, A. Natural disasters and vulnerable populations: A commentary. Int. J. Child. Health Hum. Dev. 2019, 12, 303–318. [Google Scholar]
- Zhou, Q.; Su, J.; Leng, G.; Luo, J. Recent changes in vulnerability and responses of economic and human systems to major extreme weather hazards in the United States. Geomat. Nat. Hazards Risk 2020, 11, 357–376. [Google Scholar] [CrossRef]
- Maina, J.; Wandiga, S.; Gyampoh, B.; Charles, K. Assessment of Land Use and Land Cover Change Using GIS and Remote Sensing: A Case Study of Kieni, Central Kenya. J. Remote Sens. GIS 2020, 9, 1–5. [Google Scholar] [CrossRef]
- Onyango, D.O.; Ikporukpo, C.O.; Taiwo, J.O.; Opiyo, S.B.; Otieno, K.O. Comparative Analysis of Land Use/Land Cover Change and Watershed Urbanization in the Lakeside Counties of the Kenyan Lake Victoria Basin Using Remote Sensing and GIS Techniques. Adv. Sci. Technol. Eng. Syst. J. 2021, 6, 671–688. [Google Scholar] [CrossRef]
- Wambugu, P.W.; Muthamia, Z.K. The State of Plant Genetic Resources for Food and Agriculture in Kenya Submitted to FAO Commission on Plant Genetic Resources for Food and Agriculture Note by FAO; FAO: Rome, Italy, 2009. [Google Scholar]
- WBG. Kenya Climate Risk Country Profile; WBG: Washington, DC, USA, 2021; Available online: www.worldbank.org (accessed on 3 March 2024).
- IITA. IITA Annual Report 2007. 2007. Available online: www.iita.org (accessed on 5 March 2024).
- Ochieng, J.; Kirimi, L.; Mathenge, M. Effects of climate variability and change on agricultural production: The case of small-scale farmers in Kenya. NJAS—Wagening. J. Life Sci. 2016, 77, 71–78. [Google Scholar] [CrossRef]
- FAO. World Food and Agriculture—Statistical Yearbook 2022; FAO: Rome, Italy, 2022. [Google Scholar] [CrossRef]
- Xu, H.; Twine, T.E.; Girvetz, E. Climate Change and Maize Yield in Iowa. PLoS ONE 2016, 11, e0156083. [Google Scholar] [CrossRef]
- Omoyo, N.N.; Wakhungu, J.; Oteng’i, S. Effects of climate variability on maize yield in the arid and semi-arid lands of lower eastern Kenya. Agric. Food Secur. 2015, 4, 8. [Google Scholar] [CrossRef]
- Fenta, A.A.; Yasuda, H.; Shimizu, K.; Haregeweyn, N.; Kawai, T.; Sultan, D.; Ebabu, K.; Belay, A.S. Spatial distribution and temporal trends of rainfall and erosivity in the Eastern Africa region. Hydrol. Process. 2017, 31, 4555–4567. [Google Scholar] [CrossRef]
- Adhikari, U.; Nejadhashemi, A.P.; Woznicki, S.A. Climate Change and Eastern Africa: A Review of Impact on Major Crops; Blackwell Publishing Ltd.: Oxford, UK, 2015. [Google Scholar] [CrossRef]
- Ayugi, B.O.; Tan, G. Recent trends of surface air temperatures over Kenya from 1971 to 2010. Meteorol. Atmos. Phys. 2019, 131, 1401–1413. [Google Scholar] [CrossRef]
- Ngila, P.M.; Chiawo, D.O.; Owuor, M.A.; Wasonga, V.O.; Mugo, J.W. Mapping suitable habitats for globally endangered raptors in Kenya: Integrating climate factors and conservation planning. Ecol. Evol. 2023, 13, e10443. [Google Scholar] [CrossRef]
- KMD. State of the Climate-Kenya 2020; KMD: Nairobi, Kenya, 2020; Available online: www.meteo.go.ke (accessed on 3 March 2024).
- Harris, I.; Osborn, T.J.; Jones, P.; Lister, D. Version 4 of the CRU TS monthly high-resolution gridded multivariate climate dataset. Sci. Data 2020, 7, 109. [Google Scholar] [CrossRef]
- Gilbert, R.O. Statistical Methods for Environmental Pollution Monitoring; John Wiley & Sons: New York, NY, USA, 1987. [Google Scholar]
- Rahman, A.U.; Dawood, M. Spatio-statistical analysis of temperature fluctuation using Mann–Kendall and Sen’s slope approach. Clim. Dyn. 2017, 48, 783–797. [Google Scholar] [CrossRef]
- Hamed, K.H. Trend detection in hydrologic data: The Mann-Kendall trend test under the scaling hypothesis. J. Hydrol. 2008, 349, 350–363. [Google Scholar] [CrossRef]
- Alhaji, U.U.; Yusuf, A.S.; Edet, C.O.; Oche, C.O.; Agbo, E.P. Trend Analysis of Temperature in Gombe State Using Mann Kendall Trend Test. J. Sci. Res. Rep. 2018, 20, 1–9. [Google Scholar] [CrossRef]
- Opiyo, F. Trend Analysis of Rainfall and Temperature Variability in Arid Environment of Turkana, Kenya. 2014. Available online: https://www.researchgate.net/publication/264458956 (accessed on 10 March 2024).
- Liebmann, B.; Hoerling, M.P.; Funk, C.; Bladé, I.; Dole, R.M.; Allured, D.; Quan, X.; Pegion, P.; Eischeid, J.K. Understanding recent eastern Horn of Africa rainfall variability and change. J. Clim. 2014, 27, 8630–8645. [Google Scholar] [CrossRef]
- Ayugi, B.O.; Yan, W.; Shanghai, W.; Tong, J.; Wen, W.; Chepkemoi, D. Analysis of Spatial and Temporal Patterns of Rainfall Variations over Kenya. 2016. Available online: www.iiste.org (accessed on 15 March 2024).
- Lyon, B.; Dewitt, D.G. A recent and abrupt decline in the East African long rains. Geophys. Res. Lett. 2012, 39. [Google Scholar] [CrossRef]
- Maidment, R.I.; Allan, R.P.; Black, E. Recent observed and simulated changes in precipitation over Africa. Geophys. Res. Lett. 2015, 42, 8155–8164. [Google Scholar] [CrossRef]
- Ongoma, V.; Chen, H. Temporal and spatial variability of temperature and precipitation over East Africa from 1951 to 2010. Meteorol. Atmos. Phys. 2017, 129, 131–144. [Google Scholar] [CrossRef]
- Ongoma, V. Variability of temperature properties over Kenya based on observed and reanalyzed datasets. Theor. Appl. Clim. 2017, 133, 1175–1190. [Google Scholar] [CrossRef]
- Tierney, J.E.; Ummenhofer, C.C.; Peter, B. Past and future rainfall in the Horn of Africa. Sci. Adv. 2015, 1, e1500682. [Google Scholar] [CrossRef]
- Ongoma, V.; Chen, H.; Omony, G.W. Variability of extreme weather events over the equatorial East Africa, a case study of rainfall in Kenya and Uganda. Theor. Appl. Clim. 2018, 131, 295–308. [Google Scholar] [CrossRef]
- Sagero, P.O.; Shisanya, C.A.; Makokha, G.L. Investigation of Rainfall Variability over Kenya (1950–2012). J. Environ. Agric. Sci. 2018, 14, 1–15. [Google Scholar]
- Ogallo, L.J. Relationships between Seasonal Rainfall in East Africa and the Southern Oscillation. J. Climatol. 1988, 8, 31–43. [Google Scholar]
- Ogallo, L.J. The Spatial and Temporal Patterns of the East African Seasonal Rainfall Derived from Principal Component Analysis. International Journal of Climatology 1989, 9, 145–167. [Google Scholar]
- Gebrechorkos, S.H.; Hülsmann, S.; Bernhofer, C. Long-term trends in rainfall and temperature using high-resolution climate datasets in East Africa. Sci. Rep. 2019, 9, 11376. [Google Scholar] [CrossRef]
- Opiyo, S.B.; Opinde, G.; Letema, S. Dynamics and drivers of land use and land cover changes in Migori River Watershed, western Kenya region. Watershed Ecol. Environ. 2022, 4, 219–232. [Google Scholar] [CrossRef]
- Ayugi, B.; Tan, G.; Niu, R.; Dong, Z.; Ojara, M.; Mumo, L.; Babaousmail, H.; Ongoma, V. Evaluation of meteorological drought and flood scenarios over Kenya, East Africa. Atmosphere 2020, 11, 307. [Google Scholar] [CrossRef]
- Gebrechorkos, S.H. Changes in temperature and precipitation extremes in Ethiopia. Int. J. Clim. 2019, 39, 18–30. [Google Scholar] [CrossRef]
- Gashaw, T.; Wubaye, G.B.; Worqlul, A.W.; Dile, Y.T.; Mohammed, J.A.; Birhan, D.A.; Tefera, G.W.; van Oel, P.R.; Haileslassie, A.; Chukalla, A.D.; et al. Local and regional climate trends and variabilities in Ethiopia: Implications for climate change adaptations. Environ. Chall. 2023, 13, 100794. [Google Scholar] [CrossRef]
- Maina, J.; Wandiga, S.; Gyampoh, B.; Charles, G. Analysis of Average Annual Rainfall and Average Maximum Annual Temperature for a period of 30 years to Establish Trends in Kieni, Central Kenya. J. Climatol. Weather. Forecast. 2019, 7, 1–4. Available online: http://erepository.uonbi.ac.ke/handle/11295/155409 (accessed on 15 August 2024).
- Mumo, L.; Yu, J.; Fang, K. Assessing Impacts of Seasonal Climate Variability on Maize Yield in Kenya. Int. J. Plant Prod. 2018, 12, 297–307. [Google Scholar] [CrossRef]
- Kabata, L.N.; Makokha, G.L.; Obiero, K. Seasonal Rainfall Variability Effects on Smallholder Farmers’ Maize Yields in Kieni East Sub-County, Nyeri County, Kenya. J. Arts Humanit. 2021, 10, 12–29. [Google Scholar] [CrossRef]
- Chabala, L.M.; Kuntashula, E.; Kaluba, P.; Miyanda, M. Assessment of Maize Yield Variations Due to Climatic Variables of Rainfall and Temperature. J. Agric. Sci. 2015, 7, 143. [Google Scholar] [CrossRef]
- Wu, J.-Z.; Zhang, J.; Ge, Z.-M.; Xing, L.-W.; Han, S.-Q.; Shen, C.; Kong, F.-T. Impact of climate change on maize yield in China from 1979 to 2016. J. Integr. Agric. 2021, 20, 289–299. [Google Scholar] [CrossRef]
- Atiah, W.A.; Amekudzi, L.K.; Akum, R.A.; Quansah, E.; Antwi-Agyei, P.; Danuor, S.K. Climate variability and impacts on maize (Zea mays) yield in Ghana, West Africa. Q. J. R. Meteorol. Soc. 2022, 148, 185–198. [Google Scholar] [CrossRef]

| Zone’s Yield (y) | Factor (x) | r | R2 | T Student | p Value |
|---|---|---|---|---|---|
| LVB_y | Rainfall | 0.83 | 0.694 | 3.99 | 0.0053 ** |
| Tmax | 0.93 | 0.871 | 6.874 | 0.0002 *** | |
| Tmin | 0.85 | 0.730 | 4.35 | 0.0034 ** | |
| RVH_y | Rainfall | 0.85 | 0.723 | 4.27 | 0.0037 ** |
| Tmax | 0.73 | 0.538 | 2.85 | 0.0246 * | |
| Tmin | 0.74 | 0.551 | 2.93 | 0.0219 * | |
| CS_y | Rainfall | 0.92 | 0.853 | 6.38 | 0.0004 *** |
| Tmax | 0.63 | 0.401 | 2.17 | 0.0671 * | |
| Tmin | 0.71 | 0.500 | 2.65 | 0.0331 * | |
| NWR_y | Rainfall | 0.82 | 0.667 | 3.74 | 0.0072 ** |
| Tmax | 0.72 | 0.514 | 2.72 | 0.0298 * | |
| Tmin | 0.75 | 0.563 | 3.00 | 0.0199 * | |
| NER_y | Rainfall | 0.33 | 0.111 | 0.94 | 0.3807 |
| Tmax | 0.07 | 0.004 | 0.18 | 0.8647 | |
| Tmin | 0.05 | 0.003 | 0.13 | 0.8984 | |
| SEL_y | Rainfall | 0.50 | 0.250 | 1.53 | 0.1705 |
| Tmax | 0.18 | 0.034 | 0.49 | 0.6368 | |
| Tmin | 0.55 | 0.303 | 1.74 | 0.1250 |
Disclaimer/Publisher’s Note: The statements, opinions and data contained in all publications are solely those of the individual author(s) and contributor(s) and not of MDPI and/or the editor(s). MDPI and/or the editor(s) disclaim responsibility for any injury to people or property resulting from any ideas, methods, instructions or products referred to in the content. |
© 2024 by the authors. Licensee MDPI, Basel, Switzerland. This article is an open access article distributed under the terms and conditions of the Creative Commons Attribution (CC BY) license (https://creativecommons.org/licenses/by/4.0/).
Share and Cite
Ondiek, R.A.; Saber, M.; Abdel-Fattah, M. Spatial–Temporal Analysis of Impacts of Climate Variability on Maize Yield in Kenya. Agriculture 2024, 14, 1415. https://doi.org/10.3390/agriculture14081415
Ondiek RA, Saber M, Abdel-Fattah M. Spatial–Temporal Analysis of Impacts of Climate Variability on Maize Yield in Kenya. Agriculture. 2024; 14(8):1415. https://doi.org/10.3390/agriculture14081415
Chicago/Turabian StyleOndiek, Renish Awuor, Mohamed Saber, and Mohammed Abdel-Fattah. 2024. "Spatial–Temporal Analysis of Impacts of Climate Variability on Maize Yield in Kenya" Agriculture 14, no. 8: 1415. https://doi.org/10.3390/agriculture14081415