Article

Erosive Rainfall Thresholds Identification Using Statistical Approaches in a Karst Yellow Soil Mountain Erosion-Prone Region in Southwest China

1
Karst Institute, School of Geographic and Environments Sciences, Guizhou Normal University, Guiyang 550001, China
2
State Engineering Technology Institute for Karst Desertification Control, Guiyang 550001, China
*
Author to whom correspondence should be addressed.
Agriculture 2024, 14(8), 1421; https://doi.org/10.3390/agriculture14081421 (registering DOI)
Submission received: 3 July 2024 / Revised: 17 August 2024 / Accepted: 19 August 2024 / Published: 21 August 2024
(This article belongs to the Section Ecosystem, Environment and Climate Change in Agriculture)

Abstract

:
Karst yellow soil is one of the most important cultivated soils in southwest China. At present, only a few studies have dealt with rainfall erosivity and erosive rainfall thresholds in the karst yellow soil region. This paper utilizes statistical methods to identify erosive rainfall thresholds and slope erosion-prone areas in the Qianzhong region. This analysis is based on long-term experimental data from 10 experimental stations and 69 experimental plots within the region in 2006 to 2022. The findings show the following: The rainfall amount threshold was 12.66 mm for woodland plots, 10.57 mm for grassland plots, 9.94 mm for farmland plots, and 8.93 mm for fallow plots. Soil and water conservation measures in forestry and grassland effectively increase the rainfall amount thresholds. Compared to farmland, the rainfall threshold increased by 27.32% for woodland and 6.32% for grassland. Bare land and farmland are erosion-prone areas in the karst yellow soil region. The erosive rainfall thresholds for farmland plots with slopes of 13°, 15°, 20°, 23°, and 25° were 10.41 mm, 10.28 mm, 9.66 mm, 9.52 mm, and 9.15 mm, respectively. With the increase in the 13–25° slope gradient of farmland, the initial rainfall required for runoff generation leads to a reduction. The wrong selection indices (WSI) of all landcover plots were less than 10%, and the efficiency indices (EFF) were between 80.43% and 90.25%. The relative error index (REI) of the erosive rainfall thresholds for all landcover runoff plots was less than 0.50%, very close to 0, indicating that these thresholds have small errors and high accuracy. This study gained a better understanding of natural rainfall-induced erosion characteristics in the study area, determined rainfall thresholds for distinguishing erosive rainfall events from non-erosive across different landcover types, and reduced the workload of calculating rainfall erosivity while enhancing the accuracy of soil erosion forecasting and simulation in the karst mountain yellow soil area.

1. Introduction

Soil erosion caused by rainfall events not only leads to the deterioration of the ecological environment but also hampers the sustainable development of the local economy, particularly hindering the growth of the agricultural industry [1,2]. Mitigating soil erosion can reduce soil nutrient loss, therefore maintaining soil quality for achieving food security and contributing to sustainable agricultural practices and long-term ecological balance [3]. As a significant factor contributing to soil erosion, the ability of rainfall to cause erosion is referred to as rainfall erosivity [4]. Among all rainfall events, those capable of triggering actual soil erosion are termed erosive rainfalls [5]. However, not all rainfall events lead to soil erosion, as only the ones that generate sufficient surface runoff to transport sediment are erosive.
The soil erosion caused by rainfall processes is closely tied to both rainfall characteristics and patterns [6,7]. Many studies have demonstrated that soil erosion due to rainfall is highly variable from year to year, with large storms contributing to the majority of total erosion. For example, in a study conducted in Guthrie, Oklahoma, erosive rainfalls over a 3-year period accounted for 14% of the total erosive rainfalls over 27 years but resulted in 51% of the total soil erosion over the same period. Similarly, in Virginia, 3-year rainfall amounts represented 18% of the total rainfall over a 17-year period yet contributed to 81% of the total soil erosion. In Clarinda, Iowa, 40% of total soil erosion from a continuous corn plot occurred in just 2 of the 12 years, during which only 14% of the total rainfall was associated with soil erosion [8].
In China, at an experimental station in small watersheds of the hilly loess area, only 45% of the total rainfall generated surface runoff over a 22-year period in Shaanxi Suide [9]. On the northwest Loess Plateau, the rainfall amounts responsible for soil loss accounted for about 26.7% of the total annual rainfall, approximately 130 mm per year. Erosive rainfall events made up about 7.2% of the annual rainfall events, with an average of 7.7 erosive rainfall events per year, ranging from 2 to 17 events per year. The soil loss from the largest rainfall event could contribute to 66.4% of the total annual loss, and in a typical year, this figure exceeded 95%. Within erosive rainfalls, 50% of the rainfalls contributed to 96.8% of the total soil loss [10]. Research has also shown that in the yellow soil area of the central Guizhou karst region in southwest China, a few large rainstorms accounted for a significant portion of the annual soil erosion, with the maximum rainfall erosivity sometimes exceeding ten times the average, and the proportion of maximum rainfall erosivity in the annual total could reach above 22.28% [7]. However, due to their high frequency, even moderate and light rainfalls contributed to some degree of soil loss, and the cumulative effect of soil loss from these events should not be overlooked.
The critical rainfall values that distinguish erosive from non-erosive rainfalls are referred to as erosive rainfall thresholds [11]. These thresholds represent the critical rainfall amounts that lead to surface runoff, as established by previous researchers [12]. The determination of the thresholds for distinguishing erosive and non-erosive rainfalls is of significant importance, both from a practical and scientific standpoint [13,14,15]. In recent decades, the categorization of erosive events has sparked heated debates in the academic community [13,16,17]. Initially, non-erosive rainfalls were excluded to simplify the computation of rainfall erosivity and reduce workload. When computers became available to facilitate data analysis, the difficulty of analyzing data was effectively eliminated. However, the question of whether rainfalls with smaller amounts should still be excluded remains a topic worth investigating.
Studies have shown a significant difference in rainfall erosivity when including or excluding small rainfalls. In the western United States, including all rainfalls in the long-term rainfall erosivity calculations resulted in an increase of 28% to 59% compared to considering only rainfalls with a rainfall amount of over 12.7 mm [18]. Similarly, in a United States watershed, the total long-term rainfall erosivity increased by 28% to 59% when all rainfalls were included [16]. In the tropical region of Australia, the average long-term rainfall erosivity increased by 4.5% when all rainfalls were included [19]. Therefore, the process of identifying erosive and non-erosive rainfalls is crucial. It not only reduces the workload of calculating rainfall erosivity but also enhances the accuracy of the calculations.
Erosive rainfall thresholds are objective for a defined land surface in a given area, but the specific values may vary due to different calculation methods and selected data series [20]. The commonly used erosive rainfall threshold of 12.7 mm total rainfall was recommended by Wischmeier and Smith, and rainfall events with less than 12.7 mm were typically excluded from rainfall erosivity calculations unless the rainfall amount exceeded 6.4 mm in 15 min [6,21].
In most research, the erosive rainfall criterion is based on the work of Wischmeier and Smith in 1978 [22,23,24]. For instance, in Rhodesia, Southern Africa, storms with intensities greater than 25 mm·h−1 were considered erosive storms [25,26]. Thresholds of both 25 mm of daily rainfall and a maximum rainwater intensity of 25 mm·h−1 were used to evaluate annual surface runoff and soil erosion in Rhodesia [27]. In Belgium, Western Europe, based on records from experimental runoff plots, soil erosion showed the strongest correlation with rainfall when the rainfall value exceeded 8 mm [28]. At Masse station in Italy, rainfalls above 14.4 mm were classified as erosive events, and they accounted for 62% of all erosive rainfall events. Meanwhile, at Sparacia station in Italy, rainfalls exceeding 18.8 mm were identified as erosive rainfall events, making up 59.2% of all erosive rainfall events [6].
In China, the commonly used erosive rainfall threshold is 10 mm. Soil loss exceeding this threshold can devote to over 95% of the total soil loss, and the secondary soil erosion amount is generally greater than or equal to 5.0 t·ha−1, which is lower than the threshold of 12.7 mm in the United States and 13.0 mm in Japan [12]. Based on measured data from a bare plot with an 18 percent slope of cropland, the threshold criteria values were determined to be 49.8 mm·h−1 for maximum rainfall intensity within a 5-min period and 55 mm for total daily rainfall [29]. Based on the data measured in a small watershed at the Zizhou station in Shanxi Provence, the rainfall threshold is 12 mm, the rainfall intensity threshold is 2.4 mm·h−1, and the maximum 30-minute rainfall intensity ( I 30 ) threshold is 13.3 mm·h−1 [13]. Using frequency analysis methods, numerous scholars in China have established their own erosive rainfall or rain intensity thresholds for various soil regions, including the northwest loess region [10,30,31,32], the black soil areas [33,34], the brown soil areas [35,36], the red soil areas [20,37,38,39], and the purple soil areas [40,41,42].
Karst yellow soil is one of the paramount tillage soils of southwest China [43]. The rainfall soil erosion research in the karst region started relatively late [7,44]. At present, only a few studies have dealt with the rainfall erosivity and erosive rainfall thresholds in the karst yellow soil region, and there is a lack of erosive rainfall threshold analyses based on comprehensive experimental data, which this study aims to fulfill. This paper utilizes statistical methods to identify erosive rainfall thresholds in the study area. The analysis is based on long-term experimental data from 10 experimental stations and 69 experimental plots in 2006 to 2022 to provide new insights and fill existing gaps in understanding erosive rainfall thresholds in the karst yellow soil region. The objectives and scope of the study were (i) to gain a better understanding of natural rainfall-induced erosion characteristics in the study areas, (ii) to identify the erosive rainfall thresholds of different landcovers in the karst mountain yellow soil region, (iii) to identify the erosive rainfall intensity I30 thresholds of different landcover in the karst mountain yellow soil region, and (iv) to identify the rainfall thresholds of farmland with different slopes.

2. Materials and Methods

2.1. Study Area

This investigation collected data from experimental stations in central Guizhou Province, southwest China. The central part of Guizhou, known as the “Qianzhong region”, consists primarily of karst hilly terrain within the Yunnan–Guizhou Plateau. The Qianzhong region encompasses 33 counties, cities, and districts of Guizhou Province, including Guiyang City, Honghuagang District, and Zunyi County, among others. This region covers an area of 53,802 km2, accounting for 31% of Guizhou Province. The area is characterized by the widespread presence of carbonate rocks of various properties, and the lithologic categories include dolomite, dolomite interlayer, interbedded dolomite and clastic rocks, non-carbonate rock, limestone, limestone sandwich, interbedded limestone and dolomite, interbedded limestone and clastic rocks, carbonatite–clastic rocks, and inter-bedded carbonate and clastic rocks, which are distributed in a staggered pattern on the extensive karst landscapes, overlapped with significant karst yellow soil (as shown in Figure 1). The average elevation in this area is approximately 1300 m, and it experiences a northern subtropical monsoon humid climate, with warm winters and cool summers, and an average annual precipitation of around 1100 mm.
In the Qianzhong region, a total of 10 experimental stations, 69 runoff plots, and two small watershed control stations were established. The 10 experimental stations are Yangjichong Station (YJC), Huyangshui Station (HYS), Kaizhang Station (KZ), Yunwu (YW), Longchang (LC), Sangushui (SGS), Jingmen (JM), Yuming (YM), Maolike (MLK), and Shiqiao (SQ). The 69 plots were categorized into four groups based on landcover types: woodland plots, grassland plots, farmland plots, and fallow plots. The key details of the experimental stations and runoff plots are summarized in Table 1.
Table 1 shows that there were 22 woodland plots, 11 grassland plots, 30 farmland plots, and 4 fallow plots with slopes ranging from 13° to 25°. Among these experimental stations, YJC station has the earliest observation records starting from 2006, while YM station and MLK station have the most recent observation records starting from 2017.

2.2. Research Methods

Based on the experimental stations and runoff plots monitor data, the rainfall and soil loss relevant parameters were calculated, and then, the statistical models were built for threshold determination, and the indices of R E I , W S I , and E F F were used to assess the effectiveness of the thresholds. The methodological flow diagram is shown in Figure 2.

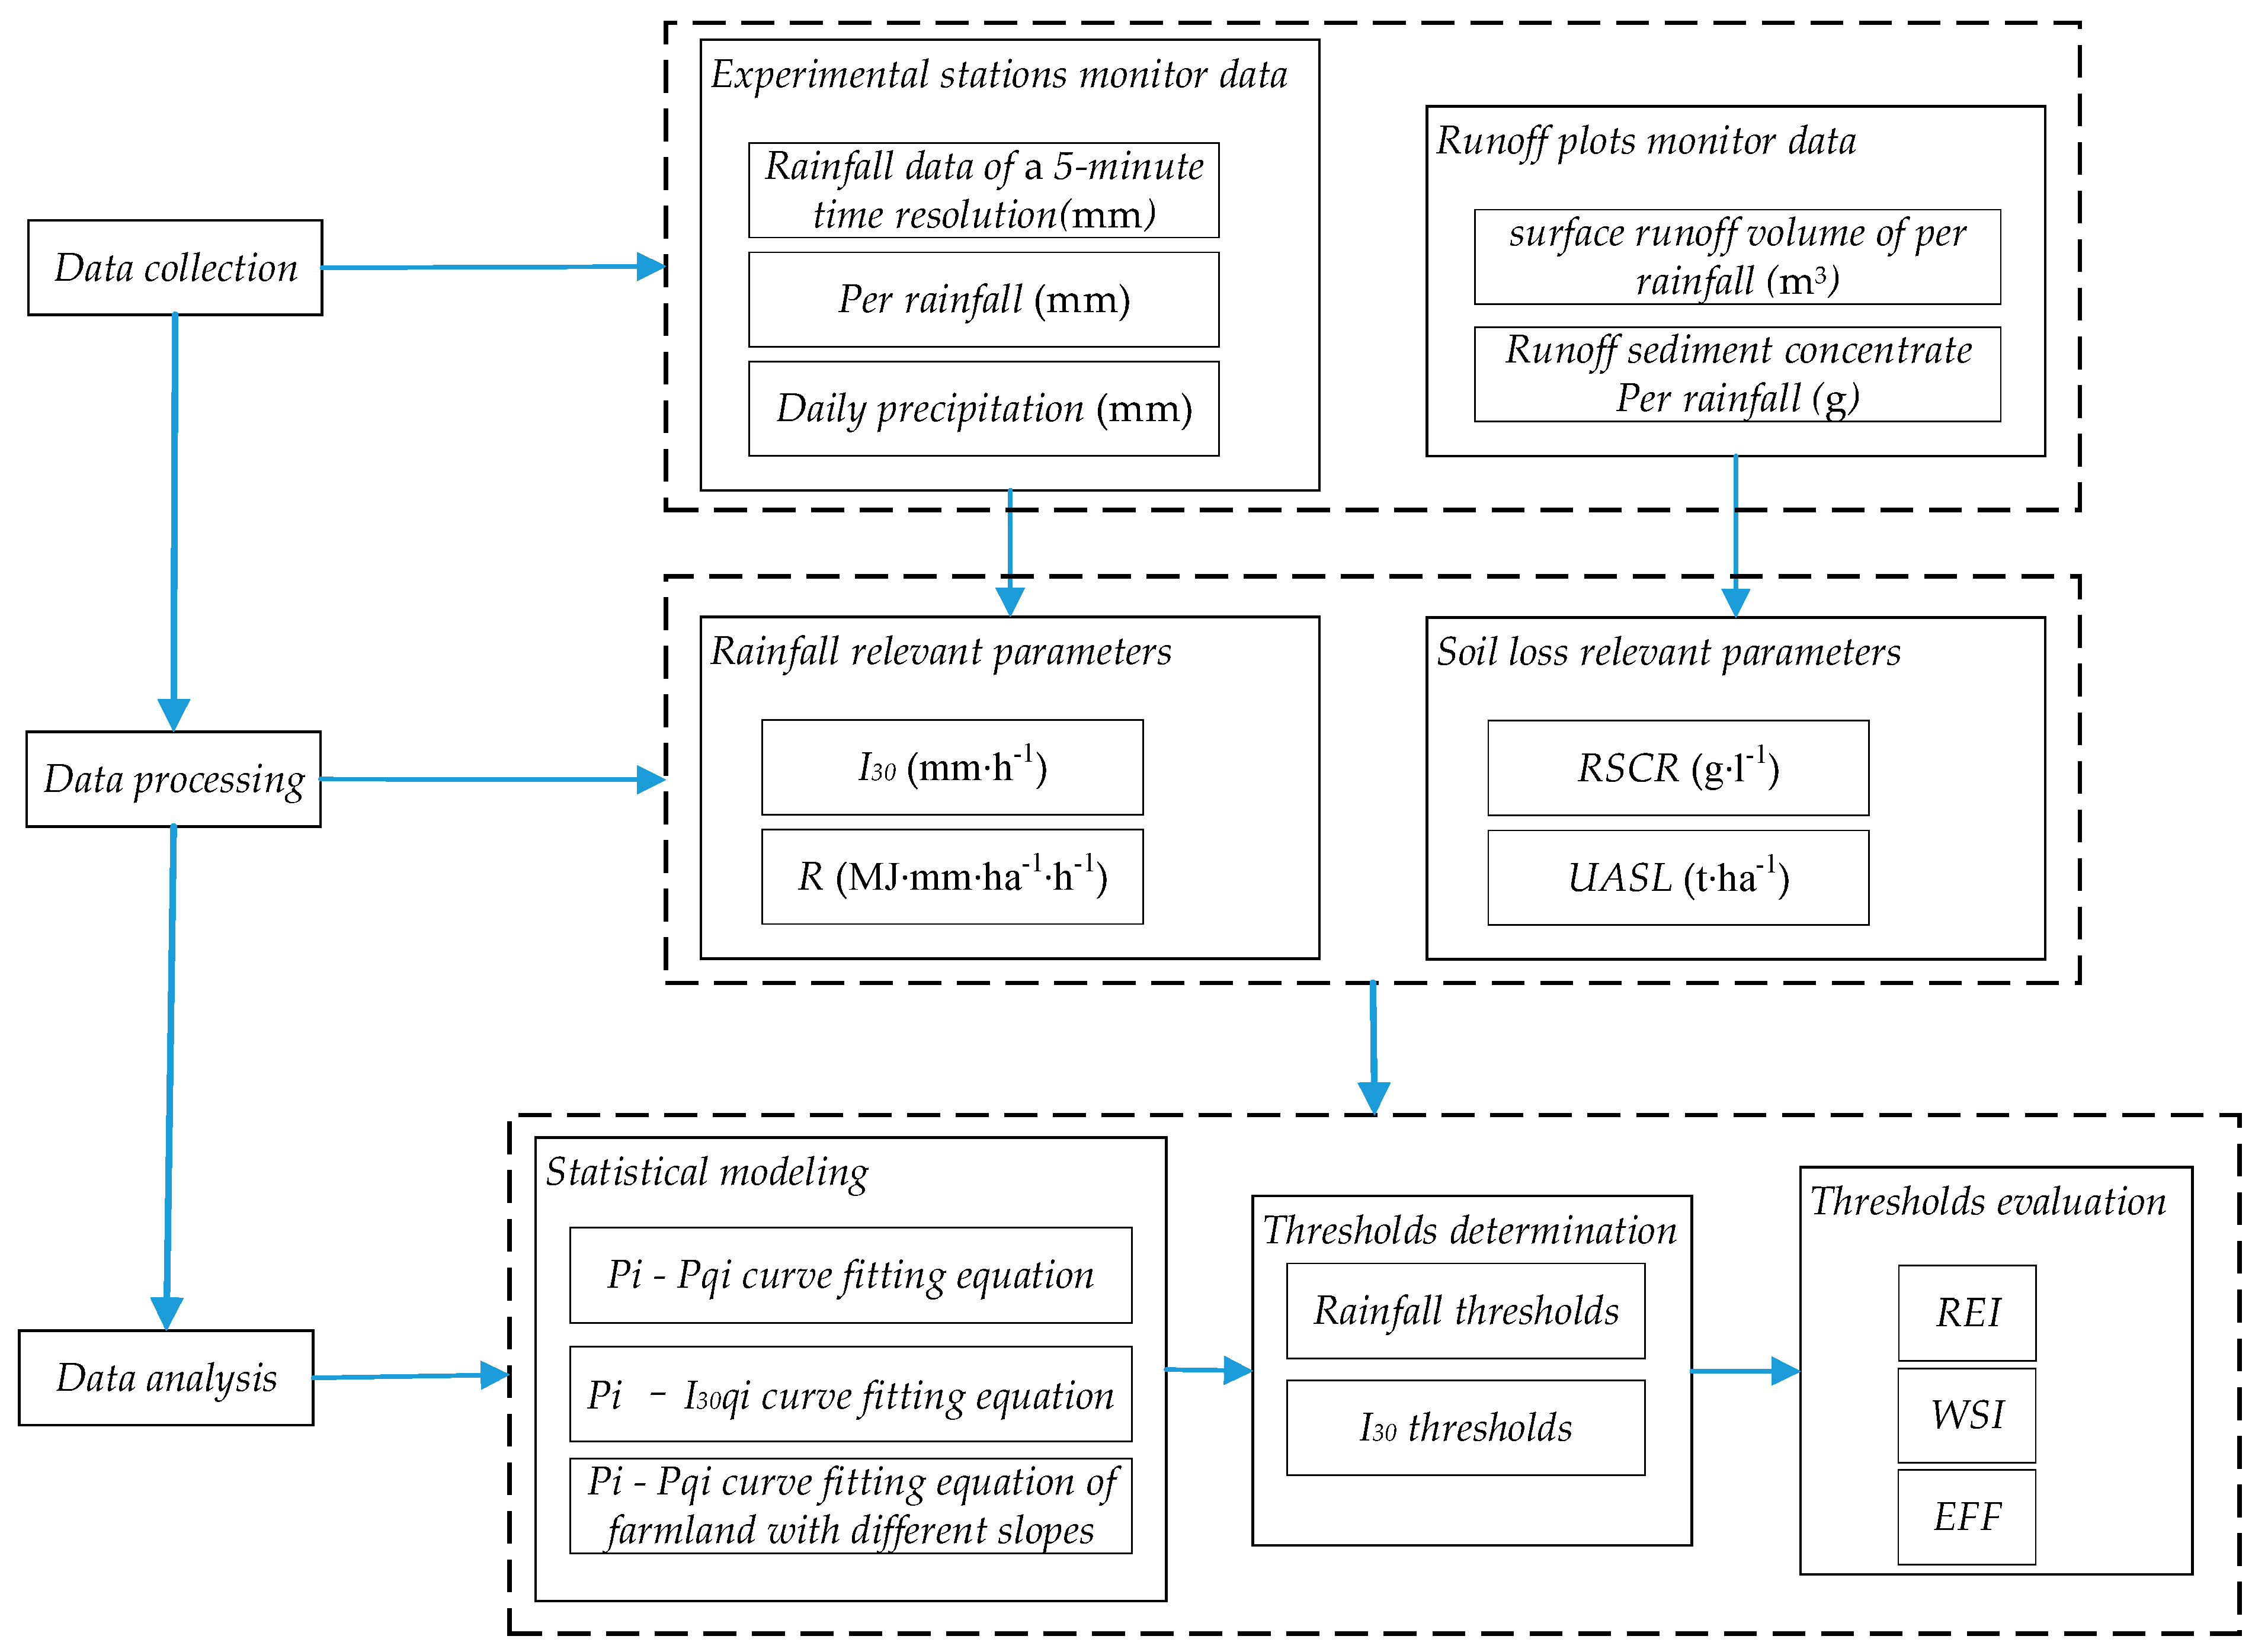
2.2.1. Data Collection and Processing

Rainfall, surface runoff, and sediment data are the main monitor data of experimental stations and runoff plots and the basic data for calculating rainfall and soil loss relevant parameters, and these data are the data basis for the estimation of rainfall thresholds and rainfall intensity thresholds.
(1) Rainfall data collection and processing
The self-recording rain gauge was utilized to record rainfall data. Rainfall was observed daily at 8:00 a.m. On days with rain, the rain gauge’s functionality was checked. The frequency of checks was increased as needed during heavy rainfalls to promptly identify and resolve issues and avoid missing rainfall records. Rainfall data were recorded at a 5-min time resolution and for rainfall intervals exceeding 6 h, which were recorded as two separate events [45].
(2) Surface runoff and sediment data collection and processing
At the conclusion of the rainfall event, right after the surface runoff ceased, the sampling and observation process commenced. Initially, the water and any sediment within the collection tank were transferred into a collection pool and thoroughly mixed. Two manual samples were collected from each runoff plot when the sediment in the collection pool had been evenly mixed. Each water sample amounted to 1000 mL. These water samples were left to stand undisturbed for 24 h, then filtered and dried at a constant temperature of 105 °C to determine the dry weight of the sediment samples.

2.2.2. Rainfall and Surface Runoff Parameter Determination

Rainfall and surface runoff in this study were characterized by parameters, including rainfall amount ( P , mm), 30-min maximum rainfall intensities ( I 30 , mm·h−1), rainfall erosivity R value ( R , MJ·mm·ha−1·h−1), and surface runoff volume ( S R V , m3). Rainfall amount ( P , mm) was measured by the self-recording rain gauge. Based on the gauge recording data of the 5-min intervals rainfall process data, 30-min maximum rainfall intensities ( I 30 , mm·h−1) and rainfall erosivity R value ( R , MJ·mm·ha−1·h−1) were calculated.
I 30 (mm·h−1) was the maximum total rainfall in any 30-min period during a rainfall process and then the rainfall amount multiplied by 2 to be converted into mm/h.
I 30 = max m { 0 , 1 , 2 , } ( i = 1 6 p m + i ) × 2
P j was the rainfall in 5 ( j 1 ) to 5 j minutes (mm), j = 1 , 2 , .
R was calculated using the following calculation formula [46].
R = E I 30
E = r = 1 n ( e r p r )
e r = 0.29 [ 1 0.72 exp ( 0.082 i r ) ]
E was total kinetic energy of a rainfall process (MJ·ha−1); r was a rainfall process divided into n periods, r = 1 , 2 , , n ; P r was the rainfall amount of r -th rainfall period (mm); e r was the unit rainfall kinetic energy of r -th rainfall period (MJ·ha−1·mm−1); i r was the rainfall intensity of r -th rainfall (mm·h−1).
Surface runoff volume ( S R V , m3) of the runoff plot was calculated by measuring muddy water depth (cm) of the diversion pools after each flow production.
S R V = S b o t t o m × D w a t e r ÷ 100
S R V was the surface runoff volume of the runoff plots (m3); S b o t t o m was the bottom area of the diversion pool (m2); D w a t e r was the muddy water depths (cm) of the diversion pool.

2.2.3. Runoff Sediment Concentration and Soil Loss Calculation

Runoff sediment concentrate rate ( R S C R , g·L−1) was calculated based on the collecting samples. The average dry sediment weight of the samples ( A D S W s , g) calculation formula was as follows:
A D S W s = ( D F P W s D F P W ) / 2
A D S W s was the average dry sediment weight of the samples (g); D F P W s was the drying filter paper weight of the samples (g); D F P W was the drying filter paper weight (g).
Runoff sediment concentrate rate ( R S C R , g·L−1) was calculated using the following calculation formula:
R S C R = A D S W s / V s
R S C R was the runoff sediment concentrate rate (g·L−1); A D S W s was the average dry sediment weight of the samples (g); V s was the volume of samples (L).
Unit area soil loss ( U A S L , t/ha) of the runoff plots calculating formula was as follows:
U A S L = ( S R V × R S C R / 1000 ) / ( S / 10000 )
U A S L was the unit area soil loss of the runoff plots (t·ha−1); S R V was the surface runoff volume of the runoff plots (m3); R S C R was the runoff sediment concentrate rate (g·L−1); S was the runoff plot area (m2).

2.2.4. Erosive Rainfall Threshold Identification Methods

The main mechanism of surface runoff generation was that rainfall intensity exceeded soil infiltration capacity [47]. Rainfall intensity was the main factor affecting surface runoff yield on slopes. Therefore, rainfall amount and rainfall intensity were chosen as indicators of the rainfall threshold of erosion on the karst yellow soil slope.
(1) Four steps of the procedure for determining rainfall amount thresholds
The procedure for determining rainfall amount thresholds involves four steps. Based on statistical analysis, all rainfall events that led to soil erosion were used as statistical analysis samples. The determination of the rainfall amount thresholds was carried out as follows:
(a) We arranged all rainfall events in descending order according to rainfall amount ( P i , mm), along with the corresponding unit area soil loss ( U A S L i , t·ha−1). i was the rainfall amount ranking order, i = 1 , 2 , , n .
(b) We summed up the U A S L i values from the greatest rainfall amount one by one, obtained the cumulative U A S L i value ( q i , t·ha−1), and listed q i corresponding to the rainfall amount order.
(c) We calculated the total U A S L i value of all rainfall events ( Q , t·ha−1) and then obtained cumulative percentages ( P q i , %).
P q i = q i Q × 100 %
P q i was the cumulative percentage of the U A S L i cumulative value corresponding to each rainfall amount (%); q i was the U A S L i cumulative value corresponding to each rainfall (t·ha−1); Q was the total U A S L i value of all rainfall events; i was the rainfall amount ranking order, i = 1 , 2 , , n .
(d) We plotted P i - P q i scatterplot and constructed P i - P q i curve fitting equation. The rainfall amounts at the definitive cumulative percentage points were identified as the threshold values of rainfall amounts ( T P , mm). Based on the curve fitting equation (let P q = 95 % ), the general rainfall threshold was calculated [4].
(2) Rainfall intensity threshold determining method
The threshold of rainfall intensity in this study was characterized by I 30 . By replacing the above process of sorting by rainfall amount with sorting by I 30 , the thresholds of I 30 ( T I 30 , mm·h−1) were obtained.
(3) Effectiveness of the threshold evaluation
Based on the identified thresholds, some rainfall events exceeding the thresholds may not lead to measurable runoff and soil loss, while some excluded rainfall events below the thresholds may cause measurable runoff and soil loss. To assess the effectiveness of these thresholds, the following indices were employed [5]:
(a) Relative Error Index ( R E I ). R E I represented the estimation accuracy of erosivity relative to the “true” erosivity value.
R E I = | R c R t | R t × 100 %
R t was total R value for all the rainfall events that caused erosion; R c was sum of the R value for the chosen rainfall events exceeding the designated threshold. R E I was closer to 0, and the estimation threshold was more accurate [6].
(b) Wrong Selection Index ( W S I , %). W S I was the ratio of the incorrectly chosen rainfall events and total number of all the rainfall events.
W S I = N c n + N n c e N t × 100 %
N c n was number of the incorrectly chosen rainfall events (non-erosive); N n c e was number of the incorrectly non-chosen rainfall events (erosive); N t was total number of rainfall events.
(c) Efficiency Index ( E F F , %). E F F was calculated as the ratio of the not-chosen rainfall events and the total events, which accounted for time or work reduction by neglecting small rainfalls.
E F F = N n c N t × 100 %
N n c was number of the not-chosen rainfall events; N t was total number of rainfall events.
The indices of R E I , W S I , and E F F assess the effectiveness of thresholds from different perspectives, and the use of any one of these indices for assessment is incomplete; accordingly, the three indices of R E I , W S I , and E F F were all selected for assessing threshold effectiveness.

3. Results

3.1. Rainfall Characteristics Analysis

The measured natural rainfall data during the rainy season from 2006 to 2022, collected from 10 experimental stations with 69 plots, were analyzed. These experimental stations are located in key national soil and water erosion management areas and are an important part of the national and Guizhou provincial soil and water conservation monitoring network. Based on the measurements obtained from the 10 experimental stations in the central Guizhou karst yellow soil area, it was observed that from 2006 to 2022, 6856 rainfall events resulted in 1226 incidents of soil erosion. The average rainfall amount for these 1226 erosive rainfall events was 26.32 mm, with an average rainfall duration of 621.64 min. The rainfall intensity I 30 among the rainfall events varied from 0.53 to 50.30 mm·h−1. The rainfall erosivity R value varied widely among the rainfall events, with a minimum value of 4.01 MJ·mm·ha−1·h−1, a maximum value of 2661.13 MJ·mm·ha−1·h−1, and an average R value of 78.82 MJ·mm·ha−1·h−1 (Table 2).
According to the Chinese rainfall grading standard, rainfall is categorized into six levels: light rain (less than 10 mm), moderate rain (10 mm to 25 mm), heavy rain (25 mm to 50 mm), rainstorm (50 mm to 100 mm), heavy rainstorm (100 mm to 250 mm), and very heavy rainstorm (larger than 250 mm) [48]. The rainfall erosivity ( R value) generated by light rain at each experimental station accounted for less than 5.00% of the total R value. Moderate and heavy rain, rainstorms, and heavy rainstorms were the primary rain contributing to R values. Heavy rain, due to its relatively high frequency and prolonged duration, had the most substantial contribution to the total R value, and the average contribution was 35.07%. Heavy rain and rainstorms had two peaks in the R value distribution, and the total R values generated by heavy rain and rainstorms exceeded 60.00%. Although heavy rainstorms occurred less frequently, their erosivity R value per event was significant, so much so that it could affect the overall R value distribution. There were no records of very heavy rainstorms at any monitoring station during the study period (Table 3, Figure 3a).
Rainfall intensity ( I 30 ) was divided into five levels: <15 mm·h−1, 15–30 mm·h−1, 30–45 mm·h−1, 45–60 mm·h−1, and >60 mm·h−1 [11]. The rainfall erosivity R value generated by I 30 < 15 mm·h−1 at each station was below 10.00%. The R value was concentrated on 15 I 30 < 30 mm·h−1, with an average of 31.99%. The R value was distributed in 30 I 30 < 45 mm·h−1, with an average of 27.66%. The rainfall events with high erosivity had a high randomness of occurrence, and the ratio of the rainfall erosivity R values generated by rain intensity I 30 > 60 mm·h−1 varies greatly in spatial distribution (Figure 3b).

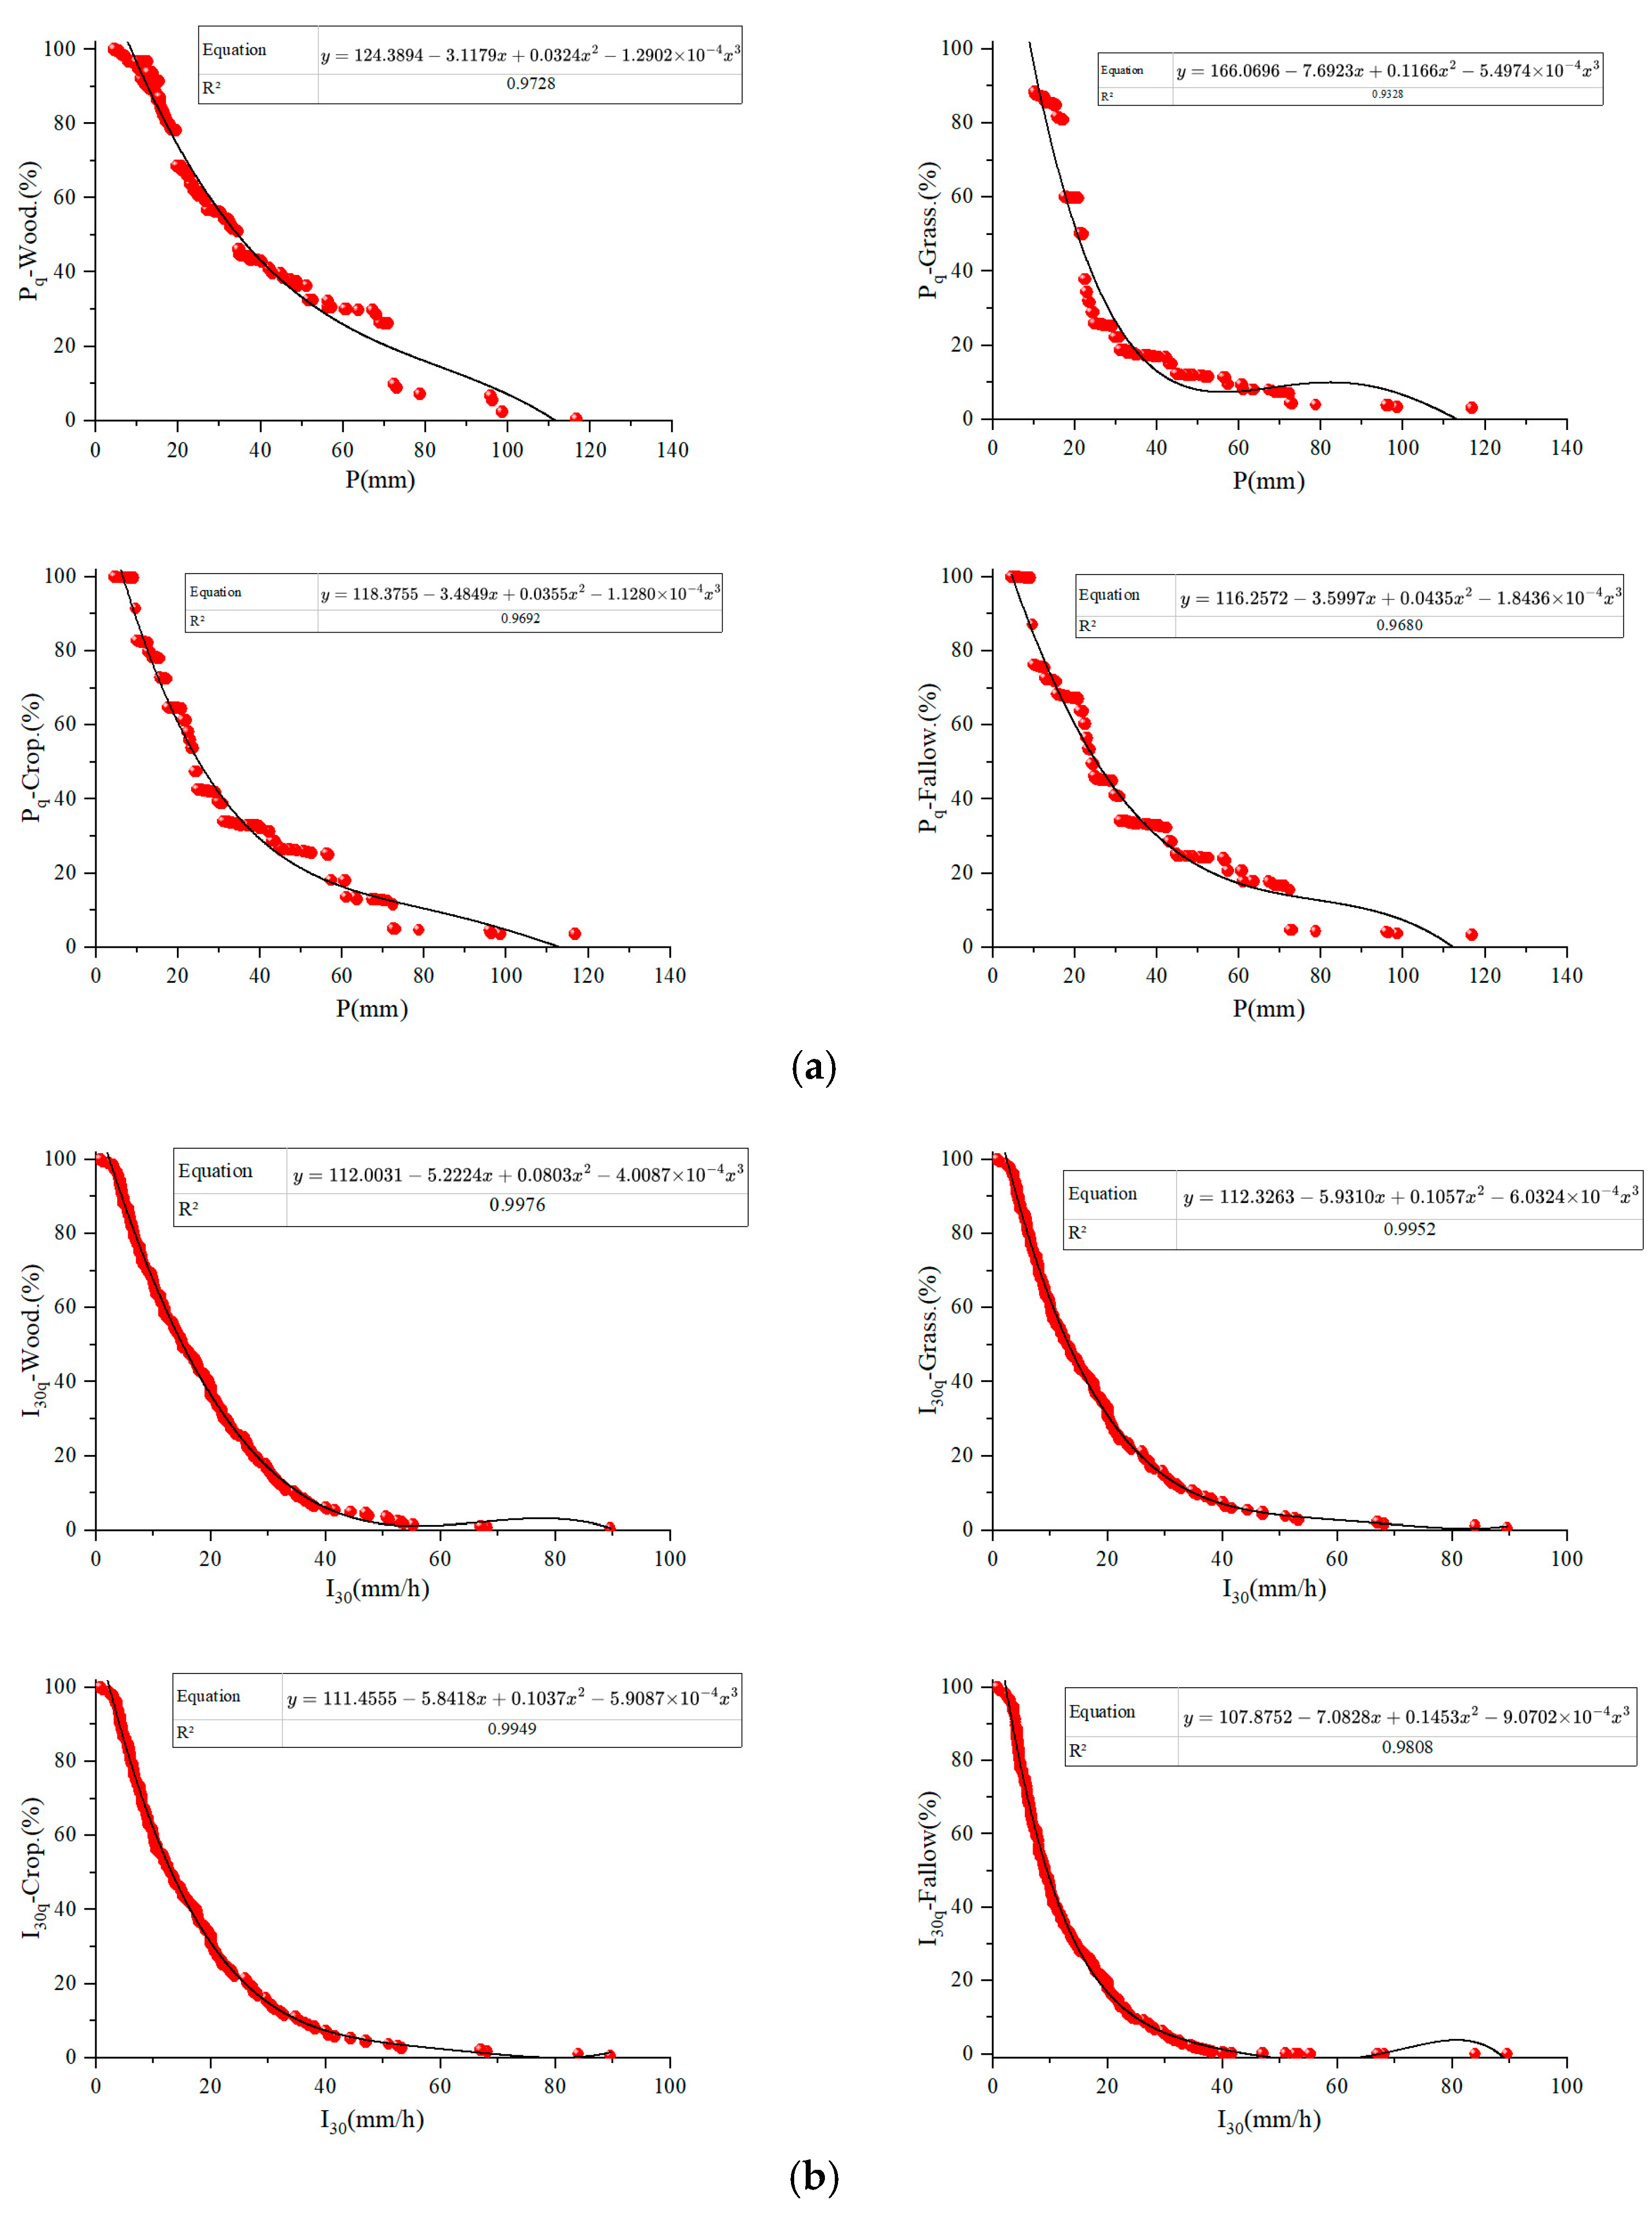
3.2. Erosive Rainfall Thresholds Identification

Different underlying surfaces exhibited varying erosive rainfall thresholds under the same amount of rainfall. This is both a phenomenon and a result of the research in this paper, where rainfall thresholds for four different categories of landcover types were identified through statistical modeling. The 69 plots in the study area were divided into four groups of landcover types as previously mentioned. Applications of the four steps of the procedure for determining rainfall thresholds, P i - P q i scatterplots of the four landcover types were plotted, and P i - P q i curve fitting equations were constructed, respectively (Figure 4a). In the P i - P q i curve fitting estimation, the cubic polynomial had the goodness of fitting with statistical significance (p < 0.001, R2 >0.9328), and the cubic polynomial was selected for curve fitting in this paper. I 30 i - P q i scatterplots and curve fitting equations were also plotted and constructed, as shown in Figure 4b.
Based on the curve fitting equations in Figure 3a (let P q = 90 % ), the rainfall thresholds of the four types of landcover plots were calculated. Meanwhile, the thresholds of I 30 ( T I 30 , mm·h−1) of the four types of landcover plots were calculated by the same method. The proposed effectiveness evaluating indices, relative error index ( R E I ), wrong selection indices ( W S I ), and efficiency indices ( E F F ), were also calculated (Table 4).
According to Table 4, it can be observed that the erosive rainfall amount thresholds varied significantly. The rainfall amount threshold was 12.66 mm for woodland plots, 10.57 mm for grassland plots, 9.94 mm for farmland plots, and 8.93 mm for fallow plots. The erosive rainfall amount thresholds were ranked as follows: woodland > grassland > farmland > fallow. Soil and water conservation measures in forestry and grassland effectively increase the rainfall amount thresholds. Compared to farmland, the rainfall threshold increased by 27.32% for woodland and 6.32% for grassland. In comparison to fallow bare land, the rainfall threshold for woodland increased by 41.62%, and that of grassland increased by 18.26%. The thresholds of I 30 ( T I 30 , mm·h−1) of the four types of landcover plots were 4.52 mm·h−1, 4.05 mm·h−1, 3.93 mm·h−1, and 3.51 mm·h−1, respectively. The erosive rainfall I 30 thresholds were also ordered as follows: woodland > grassland > farmland > fallow.
The effectiveness of the threshold evaluation indicated that the wrong selection indices ( W S I ) of all landcover plots were less than 10%, and the efficiency indices ( E F F ) were between 80.43% and 90.25%. The relative error index ( R E I ) of the erosive rainfall thresholds for all landcover runoff plots were less than 0.50%, very close to 0, indicating that these thresholds have small errors and high accuracy.

3.3. Rainfall Thresholds of Farmland with Different Slopes

Larger rainfall thresholds for landcover types indicate less susceptibility to erosion, and smaller rainfall thresholds indicate more susceptibility to erosion. The aforementioned rainfall threshold study shows that bare land and farmland are erosion-prone areas in the karst yellow soil region. The karst yellow soil of farmland accounts for more than 30.00% of the total area, while bare land occupies less than 1.00% [49]. To enhance the relevance of research on erosion-prone areas, the rainfall thresholds for farmland were further validated under different slope gradients. The experimental farmland plots were selected with slopes of 13°, 15°, 20°, 23°, and 25°. P i - P q i scatterplots of the five slope grades were plotted, and P i - P q i curve fitting equations were constructed (p < 0.001, R2 ≥ 0.9291), respectively (Figure 5).
Based on the curve fitting equations in Figure 4 (let P q = 90 % ), the rainfall thresholds of farmland plots with different slopes were calculated. The proposed effectiveness evaluating indices, relative error index ( R E I ), wrong selection indices ( W S I ), and efficiency indices ( E F F ), were also calculated (Table 5).
The velocity of flow along the slope direction increases with the increase in slope gradient, which leads to a reduction in the initial rainfall required for runoff generation. This means that an increased slope gradient lowers the rainfall threshold. The erosive rainfall thresholds for farmland plots with slopes of 13°, 15°, 20°, 23°, and 25° were 10.41 mm, 10.28 mm, 9.66 mm, 9.52 mm, and 9.15 mm, respectively. The W S I of all slopes were less than 10%, the E F F of all slopes were above 80.00%, and the R E I of all slopes were less than 0.50%. The threshold’s evaluation has few errors and high accuracy.

4. Discussion

4.1. Rainfall Characteristics Comparative Analysis

Rainfall characteristics and patterns are closely linked to soil water erosion processes and their extents. The southwestern karst mountain area, the northwestern loess plateau area, the southern red loam hill area, and the southwestern purple soil hill area are the major water erosion areas in China. The Qianzhong region is a typical karst mountainous area and experiences a humid subtropical monsoon climate with an average annual rainfall of approximately 1100 mm. Erosive rainfall in this region accounts for about 70–80% of the total rainfall [49], with an average erosive event of about 20 rainfalls per year and an average annual R value of about 4000 MJ·mm·ha−1·h−1 [7]. This climate profile is distinct from that of the northwest loess plateau region but bears similarity to the red soil zone in the south and the purple soil zone in the southwest of China. In the northwest loess plateau region, the average annual rainfall is about 400 mm, with around 10 erosive events annually and an average annual R value of about 1000 MJ·mm·ha−1·h−1. In the southern and southwestern regions, the annual rainfall is about 1300 mm, with around 24 erosive events annually, and the average annual R value is about 4500 MJ·mm·ha−1·h−1 [14]. Although the annual rainfall and annual R value of the loess plateau are small, the precipitation is concentrated and stormy, and the erosive power of the secondary rainfall is large, which causes serious soil erosion problems. The annual rainfall and annual R value are smaller in the southwestern karstic mountains compared to the southern red-loamy hilly areas and the southwestern purple-soil hilly areas, but because of the thin soil layers in the southwestern karstic mountains, erosion causes more harm to the cultivated soils.

4.2. Erosive Rainfall Thresholds in Different Zones in China

China is one of the countries with the most severe soil erosion, and there are significant regional variations in soil erosion. The Ministry of Water Resources (MWR) has classified hydraulic erosion zones into five secondary types: the northwest loess plateau region, the northeastern black soil hilly region, the north earth-rocky mountain region (mainly brown soil), the southern red soil hilly region, and the southwest earth-rocky mountain region (including mainly purple soil, red soil, yellow soil, and yellow-brown soil, among others) [50]. These regions exhibit diverse topographical and climatic conditions, and various researchers have employed different methods to estimate the erosive rainfall thresholds, as presented in Table 6.
According to Table 6, it is evident that the erosive rainfall thresholds formulated by different scholars vary across regions, and the thresholds obtained through different research methodologies exhibit significant variations. Therefore, a universally accepted criterion for determining the rainfall threshold at which erosion commences is still lacking.

4.3. Erosive Rainfall Thresholds in Karst Yellow Soil Region

Karst mountainous areas in southwest China possess a unique hydrogeological environment. In the yellow soil distribution of Karst areas, the soil layer is typically shallow, making it highly susceptible to rainfall erosion [6]. The only available study on erosive rainfall thresholds in the karst yellow soil area dates back nearly a decade and is related to runoff plots conducted by Zhang Wenyuan et al. in 2014 [52]. Based on the observed data from slope runoff plots spanning from 2009 to 2013, the maximum 30-min rainfall intensity thresholds for yellow soil land ranged from 8.9 mm·h−1 to 15.2 mm·h−1, while the erosive rainfall thresholds were between 11.6 mm and 25.8 mm. In this study, erosive rainfall thresholds were determined to be 12.66 mm for forested land, 10.57 mm for grassland, 9.94 mm for cropland, and 8.93 mm for fallow land in the karst yellow soil area. These values were relatively lower than those reported by Zhang Wenyuan et al. in 2014. The maximum 30-min rainfall intensity thresholds were 4.52 mm·h−1 for forested land, 4.05 mm·h−1 for grassland, 3.93 mm·h−1 for cropland, and 3.51 mm·h−1 for bare land. These values also showed significant differences compared to Zhang Wenyuan’s findings. The study by Zhang Wenyuan et al. is more than a decade old. The erosive rainfall thresholds and the maximum 30-min rainfall intensity thresholds were all larger than this study, especially for the maximum 30-min rainfall intensity thresholds. The erosive rainfall thresholds in this study were more aligned with the results reported by Wang Ying et al. in 2022, where the maximum 30-min rainfall intensity thresholds were 5.2 mm·h−1 for red soil in southern China and 3.2 mm·h−1 for purple soil in southwest China [51], which may benefit from longer time series of monitoring data, the longer the time series of monitoring data, the higher the confidence level that the rainfall threshold can be achieved, and the more guiding significance it has for erosion management [20]. Bare land and farmland are erosion-prone areas in the karst yellow soil region. The erosive rainfall thresholds for farmland plots with slopes of 13°, 15°, 20°, 23°, and 25° were 10.41 mm, 10.28 mm, 9.66 mm, 9.52 mm, and 9.15 mm, respectively. With the increase in the 13–25° slope gradient of farmland, the initial rainfall required for runoff generation leads to a reduction threshold.

5. Conclusions

Utilizing data from 10 experimental stations and 69 experimental plots, this paper employed statistical methods and utilized 1226 erosion rainfall events that occurred from 2006 to 2022 to gain a better understanding of natural rainfall-induced erosion characteristics and determine rainfall thresholds in the karst yellow soil region. The results of the research are as follows:
The rainfall amount threshold was 12.66 mm for woodland plots, 10.57 mm for grassland plots, 9.94 mm for farmland plots, and 8.93 mm for fallow plots. The erosive rainfall amount thresholds are ranked as follows: woodland > grassland > farmland > fallow. Soil and water conservation measures in forestry and grassland effectively increase the rainfall amount thresholds. Conservation measures increased the rainfall threshold by 27.32% in woodland and 6.32% in grassland compared to farmland. In comparison to fallow bare land, the rainfall threshold for woodland increased by 41.62%, and that of grassland increased by 18.26%.
The I 30 thresholds were 4.52 mm·h−1 for woodland, 4.05 mm·h−1 for grassland, 3.93 mm·h−1 for farmland, and 3.51 mm·h−1 for fallow land. The erosive rainfall I 30 thresholds were also ordered as woodland > grassland > farmland > fallow.
The effectiveness of the threshold’s evaluation indicated that the wrong selection indices ( W S I ) of all landcover plots were less than 10%, and the efficiency indices ( E F F ) were between 80.43% and 90.25%. The relative error index ( R E I ) of the erosive rainfall thresholds for all landcover runoff plots were less than 0.50%, very close to 0, indicating that these thresholds have small errors and high accuracy.
Bare land and farmland are highly prone to erosion, with the slope gradient increasing as thresholds decrease. For farmland, the erosive rainfall thresholds decreased with increasing slope, with high accuracy in evaluation metrics (WSI < 10%, EFF > 80%, REI < 0.50%).
The study is insightful but overlooks other methodologies and geographic variations. Future research should incorporate additional methods, address data limitations, and explore a broader range of conditions to enhance threshold accuracy and soil erosion forecasting.

Author Contributions

Conceptualization, O.D., G.Y., and Y.L.; methodology, O.D.; software, G.Y. and M.L.; validation, O.D.; formal analysis, B.Y.; investigation, O.D. and B.Y.; resources, O.D., Y.L., G.Y., and B.Y.; data curation, O.D. and Y.L.; writing—original draft preparation, O.D. and Y.L.; writing—review and editing, O.D., Y.L., G.Y., and M.L.; visualization, O.D., Y.L., G.Y., and M.L.; supervision, Y.L. and G.Y.; project administration, Y.L. and G.Y.; funding acquisition, M.L., G.Y., and Y.L. All authors have read and agreed to the published version of the manuscript.

Funding

This work was funded by Guizhou Provincial Basic Research Program (Natural Science) Program, grant number Qiankehe base ZK2024 normal 445, Guizhou Provincial Key Technology R&D Program, grant number Qiankehe key 2023 normal 175, Guizhou Provincial Water Conservancy Science and Technology Project, grant number KT201825, and the Science and Technology Program of Guizhou Province, grant number 2020 1Z031.

Institutional Review Board Statement

Not applicable.

Informed Consent Statement

Not applicable.

Data Availability Statement

Data are contained within the article.

Conflicts of Interest

The authors declare no conflicts of interest.

References

  1. Wang, Y.; Li, H.; Xu, Z. Rainfall-induced nutrient losses from manure-fertilized farmland in an alluvial plain. Environ. Monit. Assess. 2016, 188, 8. [Google Scholar] [PubMed]
  2. Vijith, H.; Dodge-Wan, D. Spatial and statistical trend characteristics of rainfall erosivity (R) in upper catchment of Baram River. Borneo. Environ. Monit. Assess. 2019, 191, 494. [Google Scholar]
  3. Borrelli, P.; Robinson, D.A.; Fleischer, L.R.; Lugato, E.; Ballabio, C.; Alewell, C.; Meusburger, K.; Modugno, S.; Schütt, B.; Ferro, V. An assessment of the global impact of 21st century land use change on soil erosion. Nat. Commun. 2017, 8, 2013. [Google Scholar]
  4. Wang, W.Z. Study on the Relations between Rainfall Characteristics and Loss of Soil in Loess Region (III). Bull. Soil Water Conserv. 1984, 4, 5862. [Google Scholar]
  5. Xie, Y.; Liu, B.Y.; Zhang, W.B. Study on Standard of Erosive Rainfall. J. Soil Water Conserv. 2000, 14, 6–11. [Google Scholar]
  6. Todisco, F.; Vergni, L.; Vinci, A.; Pampalone, V. Practical thresholds to distinguish erosive and rill rainfall events. J. Hydrol. 2019, 579, 124173. [Google Scholar]
  7. Li, Y.Q.; Deng, O.; Yang, G.B.; Fang, Q.B. Distribution characteristics of rainfall erosivity R value in yellow soil area of karst mountainous region in Central Guizhou Province. Bull. Soil Water Conserv. 2021, 41, 39–45. [Google Scholar]
  8. Wischmeier, W.H. Storms and soil conservation. J. Soil Water Conserv. 1962, 17, 55–59. [Google Scholar]
  9. Jia, S.; Xu, X. Study on rainfall characteristics of small watersheds in sub-region I of hilly loess area. In Mathematical Models and Applying Research on Runoff and Erosion Process of Small Basins in Sub-Region of Hilly Loess Area; Scientific Experiment Station of Soil and Water Conversation in Suide: Xian, China, 1992; pp. 16–35. [Google Scholar]
  10. Wang, W.Z. Study on the Relations between Rainfall Characteristics and Loss of Soil in Loess Region. Bull. Soil Water Conserv. 1983, 3, 7–13. [Google Scholar]
  11. Wischmeier, W.H.; Smith, D.D. Rainfall energy and its relationship to soil loss. Trans. Am. Geophys. Union. 1958, 39, 285. [Google Scholar]
  12. Wang, W.Z.; Jiao, J.Y. Quantitative Evaluation on Factors Influencing Soil Erosion in China. Bull. Soil. Water Conserv. 1996, 16, 1–20. [Google Scholar]
  13. Xie, Y.; Liu, B.; Nearing, M.A. Practical thresholds for separating erosive and non-erosive storms. Trans. ASAE 2002, 45, 1843–1847. [Google Scholar]
  14. Xie, Y.; Yin, S.; Liu, B.; Nearing, M.A.; Zhao, Y. Models for estimating daily rainfall erosivity in China. J. Hydrol. 2016, 535, 547–558. [Google Scholar]
  15. Dunkerley, D. What does I30 tell us? An assessment using high-resolution rainfall event data from two Australian locations. Catena 2019, 180, 320–332. [Google Scholar]
  16. Renard, K.G.; Foster, G.R.; Weesies, G.A.; McCool, D.K.; Yoder, D.C. Predicting Soil Erosion by Water: A Guide to Conservation Planning with the Revised Universal Soil Loss Equation (RUSLE); USDA Agriculture Handbook No. 703; United States Department of Agriculture: Washington, DC, USA, 1997.
  17. Efthimiou, N. Evaluating the performance of different empirical rainfall erosivity (R) factor formulas using sediment yield measurements. Catena 2018, 169, 195–208. [Google Scholar]
  18. Cooley, K.R.; Hanson, C.L.; Johnson, C.W. Precipitation erosivity index estimates in cold climates. Trans. Am. Soc. Agric. Eng. 1988, 31, 1445–1450. [Google Scholar]
  19. Yu, B. A comparison of the R-factor in the universal soil loss equation and revised universal soil loss equation. Trans. ASAE 1999, 42, 1615–1620. [Google Scholar]
  20. Wang, B.W.; Fang, S.W.; Song, Y.J.; Yang, E. Research for standard of erosive rainfall on Quaternary Red Soil area in north of Jiangxi province in China. Trans. CSAE 2013, 29, 100–106. [Google Scholar]
  21. Wischmeier, W.H.; Smith, D.D. Predicting Rainfall Erosion Losses: A Guide to Conservation Planning; USDA Agricultural Handbook No. 537; USDA: Washington, DC, USA, 1978; Volume 1.
  22. Angulo-Martínez, M.; López-Vicente, M.; Vicente-Serrano, S.M.; Beguería, S. Mapping rainfall erosivity at a regional scale: A comparison of interpolation methods in the Ebro Basin (NE Spain). Hydrol. Earth Syst. Sci. 2009, 13, 1907–1920. [Google Scholar]
  23. Meusburger, K.; Steel, A.; Panagos, P.; Montanarella, L.; Alewell, C. Spatial and temporal variability of rainfall erosivity factor for Switzerland. Hydrol. Earth Syst. Sci. 2012, 16, 167–177. [Google Scholar]
  24. Porto, P. Exploring the effect of different time resolutions to calculate the rainfall erosivity factor R in Calabria, southern Italy. Hydrol. Process. 2016, 30, 1551–1562. [Google Scholar]
  25. Hudson, N.W. Soil Conservation; Cornell Univ. Press: Ithaca, NY, USA, 1971. [Google Scholar]
  26. Hudson, N. Soil Conservation, 3rd ed.; Iowa State University Press: Ames, IA, USA, 1995. [Google Scholar]
  27. Elwell, H.A.; Stocking, M.A. Parameters for estimating annual runoff and soil loss from agricultural lands in Rhodesia. Water Resour. Res. 1975, 11, 601–605. [Google Scholar]
  28. Sinzot, A.; Bollinne, A.; Laurant, A.; Erpicum, M.; Pissart, A. A contribution to the development of an erosivity index adapted to the prediction of erosion in Belgium. Earth Surf. Proc. Land 1989, 14, 509–515. [Google Scholar]
  29. Zhang, H.; Wang, W. Rainfall characteristics and its distribution on Loess Plateau. Bull. Soil Water Conserv. 1982, 1, 35–44. [Google Scholar]
  30. Jiang, Z.S.; Song, W.J.; Li, X.Y. Characterization of natural rainfall raindrops in loess areas. Soil Water Conserv. 1983, 3, 32–36. [Google Scholar]
  31. Liu, B.Y.; Xie, Y.; Zhang, K.L. Soil Erosion Forecasting Model; Science and Technology Press: Beijing, China, 2001. [Google Scholar]
  32. Xia, L.; Song, X.Y.; Fu, N.; Li, H.Y.; Li, Y.B. Threshold standard of erosive rainfall under different underlying surface conditions in the Loess Plateau Gully Region of East Gansu, China. Advances Water Sci. 2018, 29, 828–838. [Google Scholar]
  33. Gao, F.; Zhan, M.; Zhan, H. Study on criteria of erosive rain in farmland of chernozem in Heilongjiang Province. Soil Water Conserv. China 1989, 11, 19–21. [Google Scholar]
  34. Zhang, X.K.; Xu, L.K.; Lu, X.Q.; Deng, Y.J.; Gao, D.W. A Study on the Soil Loss Equation in Heilongjiang Province. Bull. Soil Water Conserv. 1992, 12, 1–9, 18. [Google Scholar]
  35. Liu, H.P.; Yuan, A.P.; Lu, B.J.; Chao, D.I. Study on erosive rainfall standard of Beijing. Res. Soil Water Conserv. 2007, 14, 215–217, 220. [Google Scholar]
  36. Zhao, G.Y. Temporal and Spatial Variations of Erosive Rainfall and Rainfall Erosivity in Tang-Qin Areas; Hebei Agriculture University: Baoding, China, 2019. [Google Scholar]
  37. Chen, F.Y.; Wang, Z.M. Research on the kinetic energy of rainfall erosion at Xiaoliang water and soil conservation experiment station. Bull. Soil Water Conserv. 1992, 12, 42–51. [Google Scholar]
  38. Zheng, H.J.; Yang, J.; Zuo, C.Q.; Yu, R.G.; Zhang, H.M.; Zhang, L. Analysis of the Erosive Rainfall and Rainfall Erosion Energy on Red soil Slope land. Res. Soil Water Conserv. 2009, 16, 30–33. [Google Scholar]
  39. Ma, L.; Zuo, C.Q.; Qiu, G.J. Erosive rainfall characteristics on red soil slope land in Northern Jiangxi Province. Bull. Soil Water Conserv. 2010, 30, 74–79. [Google Scholar]
  40. Zhang, Q. A preliminary study on the erosion law of J2s Parent Material. Bull. Soil Water Conserv. 1992, 12, 34–39. [Google Scholar]
  41. Li, L.Y.; Wang, Z.J.; Jiao, J.Y. Erosive rainfall and rainfall erosivity in purple hilly area. Sci. Soil Water Conserv. 2013, 11, 8–16. [Google Scholar]
  42. Lin, C.H. Research on the erosive rainfall factor in arenaceous shale mountain lands. Bull. Bull. Soil Water Conserv. 1991, 11, 11–14. [Google Scholar]
  43. Dai, H.L.; Yuan, S.; Zhang, K.L.; Zhu, Q. Spatial and temporal variation of rainfall erosion force in Guizhou Province. Res. Soil Water Conserv. 2013, 20, 37–41. [Google Scholar]
  44. Cai, X.F. Influencing Factors Analysis and Numerical Simulation on Erosion of Yellow Soil in Southwest Karst Area. Master’s Thesis, Guizhou Normal University, Guiyang, China, 2009. [Google Scholar]
  45. Liang, W.L.; Chan, M.C. Spatial and temporal variations in the effects of soil depth and topographic wetness index of bedrock topography on subsurface saturation generation in a steep natural forested headwater catchment. J. Hydrol. 2017, 546, 405–418. [Google Scholar]
  46. Wischmeier, W.H. Estimating the loss equation’s cover and management factor for undisturbed areas. In Proceedings of Sediment Yield Workshop; U.S. Department of Agriculture Sedimentation Laboratory: Oxford, MS, USA, 1972. [Google Scholar]
  47. Feng, P.; Li, J. Infiltration mechanism of soil moisture and its application in runoff generation modelling. J. Arid Land Resour. Environ. 2008, 22, 95–98. [Google Scholar]
  48. GB T 20486-2017; Surface Rainfall Grade in River Basin. China Standards Press: Beijing, China, 2017.
  49. Xie, B.; Yang, G.B.; Li, Y.Q.; Li, M.; Fang, Q.B. Analysis of erosion rainfall characteristics and erosion response in karst mountain of central Guizhou. Ecol. Sci. 2021, 40, 222–230. [Google Scholar]
  50. Ministry of Water Resources of the People’s Republic of China. SL 190-2007 Standards for Classification and Gradation of Soil Erosion; China Water & Power Press: Beijing, China, 2008.
  51. Wang, Y.; Yang, Y.; Liu, B.Y.; Liu, Y.N. Erosive rainfall thresholds for five typical soils in water erosion region of China. Bull. Soil Water Conserv. 2022, 42, 227–233. [Google Scholar]
  52. Zhang, W.Y.; Wang, B.T.; Yang, G.X.; Zhang, K.L. Erosive rainfall and characteristics analysis of sediment yield on yellow soil area in karst mountainous. Ecol. Environ. Sci. 2014, 23, 1776–1782. [Google Scholar]
Figure 1. Location of study area and experimental station distribution.
Agriculture 14 01421 g001
Figure 2. The methodological flow diagram.
Agriculture 14 01421 g002
Figure 3. (a) Composition of erosivity ratios for different rainfall amount grades; (b) Composition of erosivity ratios for different maximum rainfall intensity within a 30-min period ( I 30 ).
Agriculture 14 01421 g003
Figure 4. P i - P q i and I 30 i - P q i scatterplots and curve fitting equations. (a) P i - P q i scatterplots and curve fitting equations. (b) I 30 i - P q i scatterplots and curve fitting equations.
Agriculture 14 01421 g004
Figure 5. P i - P q i scatterplots and curve fitting equations of farmland with different slopes.
Agriculture 14 01421 g005
Table 1. The main conditions of the runoff plots.
StationsInitial Observation
Year
Land Use
Types
No. of PlotsSlope/
Degree
Plot Size
Width × Length, m
YJC2006Woodland625.020.0 × 5.0
Grassland225.020.0 × 5.0
Farmland820.020.0 × 5.0
Fallow225.020.0 × 5.0
HYS2008Woodland513.020.0 × 10.0
Farmland113.020.0 × 10.0
KZ2008Woodland215.020.0 × 5.0
Grassland113.020.0 × 5.0
Farmland215.020.0 × 5.0
YW2007Woodland225.020.0 × 5.0
Grassland125.020.0 × 5.0
Farmland225.020.0 × 5.0
LC2010Woodland115.020.0 × 5.0
Grassland115.020.0 × 5.0
Farmland315.020.0 × 5.0
SGS2008Woodland115.020.0 × 5.0
Grassland115.020.0 × 5.0
Farmland115.020.0 × 5.0
JM2015Woodland115.020.0 × 5.0
Grassland215.020.0 × 5.0
Farmland215.020.0 × 5.0
Fallow115.020.0 × 10.0
YM2017Woodland123.020.0 × 5.0
Grassland123.020.0 × 5.0
Farmland223.020.0 × 5.0
MLK2017Woodland115.020.0 × 5.0
Farmland315.020.0 × 5.0
Fallow115.020.0 × 5.0
SQ2009Woodland225.020.0 × 10.0
Grassland225.020.0 × 5.0
Farmland625.020.0 × 5.0
Fallow225.020.0 × 5.0
Table 2. Rainfall characteristic parameter statistics.
Characteristic ParametersMinimum ValueMaximum ValueAverage Value
Rainfall (mm)2.45102.1026.32
Duration (min)7.122980621.64
I 30 (mm·h−1)2.8689.6020.34
Average rainfall intensity (mm·h−1)0.5350.306.15
Rainfall erosivity R value (MJ·mm·ha−1·h−1)4.012661.1378.82
Table 3. Percentage composition of values for rainfall amount and intensity grade %.
Sta.Rainfall Amount GradeRainfall Intensity Grade
Light Rain
<10 mm
Moderate Rain
10–25 mm
Heavy Rain 25–50 mmRainstorm
50–100 mm
Heavy Rainstorm
100–250 mm
<15 mm·h−115–30 mm·h−130–45 mm·h−145–60 mm·h−1>60 mm·h−1
YJC0.4518.7732.1327.7720.668.1431.3835.2112.5512.74
HYS3.1220.5631.8831.7912.855.6630.4428.2623.5311.94
KZ2.4821.9437.8923.3613.9315.4132.8624.1313.8813.76
YW0.3212.3323.9234.2829.464.7428.8222.3124.4719.74
LC4.5619.2130.2426.0920.588.7634.6424.8514.2417.65
SGS1.2429.2446.6615.047.9911.4437.6521.2111.5118.24
JM2.1425.5938.9722.4210.668.1130.3827.5224.199.66
YM2.0120.3438.9227.1612.0110.4130.5426.7625.337.31
MLK2.8819.4230.7826.2420.058.5633.6627.9713.5116.01
SQ1.0620.6639.2628.4810.187.4629.4938.3620.444.68
Ave.2.0320.8135.0726.2615.848.8731.9927.6618.3713.17
Table 4. Erosive rainfall thresholds and their evaluation for each landcover type.
Landcover TypesIndex TypesRainfall ThresholdsREI (%)WSI (%)EFF (%)
woodlandTP (mm)12.660.132.2880.43
TI30 (mm·h−1)4.520.221.6586.14
GrasslandTP (mm)10.570.184.4681.86
TI30 (mm·h−1)4.050.113.8787.36
FarmlandTP (mm)9.940.316.3583.17
TI30 (mm·h−1)3.930.254.8682.05
FallowTP (mm)8.930.434.1185.43
TI30 (mm·h−1)3.510.323.0490.25
Table 5. Erosive rainfall thresholds and their evaluation for farmland plots with different slopes.
Landcover TypesIndex TypesRainfall ThresholdsREI (%)WSI (%)EFF (%)
13°TP (mm)10.410.267.8183.47
15°TP (mm)10.280.375.2681.22
20°TP (mm)9.660.326.2484.12
23°TP (mm)9.520.287.3386.24
25°TP (mm)9.150.355.5885.36
Table 6. Erosive rainfall thresholds in different water erosion zones in China.
RegionsSoil TypesExperimental SitesTP (mm)TI10
(mm·h−1)
TI30
(mm·h−1)
References
NorthwestLoessZizou, Shanxi9.95.27.2Wang Wanzhong, 1983 [10]
Xifeng, Gansu10.0 7.5Jiang Zhongshan et al., 1983 [30]
Zizou, Shanxi9.6 7.1Liu Baoyuan, 2001 [31]
Qingyang, Gansu8.7 12.3Xia Lu et al., 2018 [32]
Mizhi, Shanxi9.5 8.9Wang Ying et al., 2022 [51]
NortheastBlack soilBinxian, Heilongjiang8.95.08.0Gao Feng et al., 1989 [33]
Lengjiang, Heilongjiang10.0 10.2Wang Ying et al., 2022 [51]
Keshan, Heilongjiang9.8 7.6Zhang Xiankui et al., 1992 [34]
NorthBrown soilMiyun, Beijing18.9 17.8Liu Heping et al., 2007 [35]
Miyun, Beijing10.0 10.2Wang Ying et al., 2022 [51]
Weixian, Hebei16.0 Zhao Guangyao, 2019 [36]
SouthRed soilDianbai, Guangdong9.4 Chen and Wang, 1992 [37]
Dean, Jiangxi9.97
11.2
Zheng Haijin et al., 2009 [38];
Ma Liang et al., 2010 [39]
Dean, Jiangxi11.4 10Wang Bangwen et al., 2013 [20]
Anxi, Fujian6.1 5.2Wang Ying et al., 2022 [51]
SouthwestPurple soilZiyang, Sichuan8.9 10.7Zhang Qi, 1992 [40]
West Sichuan11.3 Li Linyu et al., 2013 [41]
Bijie, Guizhou 7.0 Lin Changhu, 1991 [42]
Nanchong, Sichuan5.4 3.2Wang Ying et al., 2022 [51]
Yellow soilLongli, Guizhou
Bijie, Guizhou
11.6–25.8 8.9–15.2Zhang Wenyuan et al., 2014 [52]
Disclaimer/Publisher’s Note: The statements, opinions and data contained in all publications are solely those of the individual author(s) and contributor(s) and not of MDPI and/or the editor(s). MDPI and/or the editor(s) disclaim responsibility for any injury to people or property resulting from any ideas, methods, instructions or products referred to in the content.

