Article

Impact of Fertilization and Seasonal Changes on Paddy Soil: Unveiling the Interplay between Agricultural Practices, Enzyme Activity, and Gene Diversity

by
Yu-Pei Chen
1,2,
Hsi-Yuan Huang
3,
Chia-Fang Tsai
4 and
Chiu-Chung Young
4,5,*
1
School of Public Health, Fujian Medical University, Fuzhou 350122, China
2
Department of Public Health and Medical Technology, Xiamen Medical College, Xiamen 361023, China
3
Warshel Institute for Computational Biology, School of Medicine, The Chinese University of Hong Kong, Shenzhen 518172, China
4
Department of Soil and Environmental Sciences, National Chung Hsing University, Taichung 40227, Taiwan
5
Innovation and Development Center of Sustainable Agriculture, National Chung Hsing University, Taichung 40227, Taiwan
*
Author to whom correspondence should be addressed.
Agriculture 2024, 14(8), 1424; https://doi.org/10.3390/agriculture14081424
Submission received: 15 July 2024 / Revised: 19 August 2024 / Accepted: 19 August 2024 / Published: 22 August 2024
(This article belongs to the Section Agricultural Soils)

Abstract

:
Climate change and soil acidification are critical factors affecting crop production and soil quality. This study comprehensively analyzed the impact of fertilization practices, including conventional (CA), sustainable (SA), and unfertilized (BK), on soil properties, enzyme activities, and gene diversity in paddy fields across seasonal changes. Soil pH was significantly influenced by fertilization, with higher pH in BK and a decrease in pH with increased fertilization. Soil enzyme activities and Biolog EcoPlate™ analysis revealed the lowest activities in September, with the highest in December under different practices. Metagenomic analysis showed the highest genetic richness in CA soil, with seasonal variations influencing genetic diversity. From the perspective of genes in species taxonomy, Sorangium cellulosum and Anaeromyxobacter sp. were the most abundant taxa. Soil genes annotated by CAZy, COG, and GO databases revealed highly similar gene structures among different practices. Moreover, the genetic origins of soil enzymes were linked to specific bacterial contributors. While not all gene’s diversity and abundance were associated with soil enzyme activity, arylsulfatase showed an obvious correlation. Enzyme activities proved more sensitive indicators of microbial activity than gene abundance. This study emphasizes the need for rational fertilization strategies to maintain soil enzyme activities, considering agricultural practices and seasonal variations.

1. Introduction

Rice (Oryza sativa L.) is the primary food source for many countries, especially in Asia. The global rice production in Asia was approximately 686.7 million tons according to the latest issue of Food and Agriculture Organization’s rice market monitor in 2017. However, the increase in extreme weather events, rising temperatures, land degradation, and desertification caused by climate change may adversely affect crop production [1]. Additionally, soil acidification is a serious problem that can reduce soil fertility and result in crop failure [2]. The combination of climate change and soil acidification poses a significant threat to the viability of agricultural crops, as indicated by the EcoCrop crop suitability model [3]. Climate change phenomena, such as acid rain, resulting from both natural processes and exacerbated by human activities, can contribute to soil acidification. The increase in chemical fertilizers has also exacerbated the acidification of agricultural soils. The change in soil acidity indirectly leads to changes in the biological processes of soil. The interplay of biological processes, including the decomposition of organic matter from plant residues and the metabolic activities of microorganisms, plays a substantial role in this environmental shift. Therefore, implementing proactive strategies to mitigate soil acidification is imperative and should be integral to comprehensive climate change adaptation plans.
Numerous studies have reported on the impacts of long-term chemical fertilizer application on soil. Prolonged use of chemical fertilizers can lead to a decline in soil quality, encompassing issues such as soil acidification, reduction in microbial diversity, deterioration of soil structure, and impairment of soil ecosystem functions [4]. While long-term chemical fertilizer use does not directly cause heavy metal accumulation in soil such as cadmium, its potential influence on cadmium uptake in rice warrants closer scrutiny [5,6]. In agricultural ecosystems, rational fertilization is essential for improving crop yield and nutrient utilization efficiency, especially in semi-arid areas, due to water scarcity and low soil fertility [7]. Moreover, rational fertilization can not only improve microbial diversity but also improve water use efficiency [8,9,10]. Under different fertilization levels, the use efficiency of nitrogen and phosphorus in maize varied [7], with moderate fertilization achieving optimal utilization efficiency [7,11], whereas excessive fertilization may lead to nutrient leaching and decreased agronomic efficiency [12,13].
Microbial communities play a crucial role in soil nutrient cycling through their metabolic activities. Many researchers are increasingly focusing on the correlation between soil microbial genes and enzyme activity to better understand how microbes regulate soil chemical processes and environmental functions [14]. Several studies have shown a significant correlation between gene abundance and enzyme activity related to nitrogen cycling in soil. For instance, the transformation process under the land-use change from natural forest to tea plantation markedly elevated the potential for N2O emissions due to directly increased denitrifying enzyme activity and the abundance of nirS and nirK genes, indirectly influenced by the abundance of amoA genes of ammonia-oxidizing bacteria [15]. Moreover, the abundance of genes associated with the ammonification, dissimilatory nitrogen reduction, nitrification, and denitrification pathways rose considerably in the acidified tea soil. In contrast, the prevalence of functional genes involved in glutamate synthesis and the assimilatory nitrogen reduction pathway exhibited an opposite trend [16]. On the other hand, pollution from metal mining and smelting has been shown to alter the community structure of denitrifiers in contaminated rice paddies, as indicated by changes in nirK and nosZ genes [17]. Adding phosphorus to phosphorus-deficient paddy soils can alter the dynamics of soil nitrogen cycle functional genes, specifically by reducing the abundance of ammonia-oxidizing bacteria and increasing that of denitrifying genes [18].
Current research predominantly examines individual genes or assesses bacterial communities through 16S rDNA sequencing, with less emphasis on broad-scale metagenomic analysis and comparison. In this study, the relationship between agricultural management with different applications of chemical fertilizers, soil gene abundance, and extracellular enzyme activity in the paddy field was explored. By employing soil metagenomic analysis, we aim to address two critical questions:
(1)
How do agricultural management and seasonal change influence soil enzyme activity, genetic richness, and diversity, and which factors exert a more significant impact?
(2)
Does the genetic richness and diversity within the soil lead to changes in enzyme activity?

2. Materials and Methods

2.1. Field Site and Soil Properties

The Xikou farm (9 ha) in Chiayi, Taiwan (23°34′56″ N, 120°24′15″ E), established under the long-term agricultural ecological research funded by the Ministry of Agriculture, Taiwan, has been exploring the impacts of fertilization, pesticides, and fungicides on biodiversity under different agricultural managements since 2006 (Figure S1). The soil is Typic Udifluvents based on the soil taxonomy of the United States Department of Agriculture. The Xikou Farm was designed for double cropping paddy fields, incorporating conventional agroecosystem (CA) and sustainable agroecosystem (SA) practices. A blank control (BK) without fertilization was added in 2012. Under the SA practice, fertilizer application was used as follows: nitrogen at 80 to 100 kg/ha, P2O5 and K2O at 30 kg/ha. The fertilization amount of CA soil was higher than that of SA soil, with nitrogen at 120 to 180 kg/ha, P2O5 at 60 to 72 kg/ha and K2O at 60 to 85 kg/ha. The fertilizers applied annually are shown in Table S1. Periodic inspections of the field were conducted to monitor the occurrence of diseases. Under CA management, pesticides, and fungicides were applied appropriately and regularly. In contrast, in SA and CK management, pesticides and fungicides were used only as a last resort when insect pests and diseases threatened to cause complete yield loss.
Soil samples were collected during the first fertilization of rice in September 2018 and at the rice harvest in December 2018. The rice yields from the December 2018 harvest, under CA, SA, and BK agricultural management practices, were 7449 kg/ha, 6604 kg/ha, and 4862 kg/ha, respectively. Sample designations like CA-9, BK-9, and SA-9 specifically refer to the soil samples gathered in September 2018. In contrast, the CA-12, BK-12, and SA-12 represent the soil samples obtained in December 2018. During the sampling days in September and December of 2018, the average temperatures were recorded at 27.4 °C and 18.6 °C, respectively, while the relative humidity levels were 85.2% and 75.8%, respectively. Surface soil (0–10 cm depth) from each of the five replicate plots per treatment was collected, pooled, and placed into sterile plastic tubes. The samples were promptly transported to the laboratory, passed through a 2 mm mesh sieve, and homogenized using a centrifugal ball mill (S100, Retsch, Haan, Germany) for enzymatic activity assays. Separate soil aliquots were stored at −20 °C for subsequent DNA extraction and physicochemical analyses. Soil was mixed with water at a 1:1 (w/v) ratio to measure the pH value. Soil pH was measured by mixing soil with water at a 1:1 (w/v) ratio. Electrical conductivity (EC) was determined by mixing soil with water at a 1:5 (w/v) ratio. Available phosphorus (P), potassium (K), calcium (Ca), magnesium (Mg), iron (Fe), manganese (Mn), copper (Cu), and zinc (Zn) were analyzed using an Inductively Coupled Plasma Optical Emission Spectrometer (ICP-OES) (Ultima Expert) (Horiba France SAS, Lyon, France). Organic matter content was determined by ashing samples at 430 °C overnight and calculating the loss on ignition. Nitrogen content was measured using the Kjeldahl distillation method.

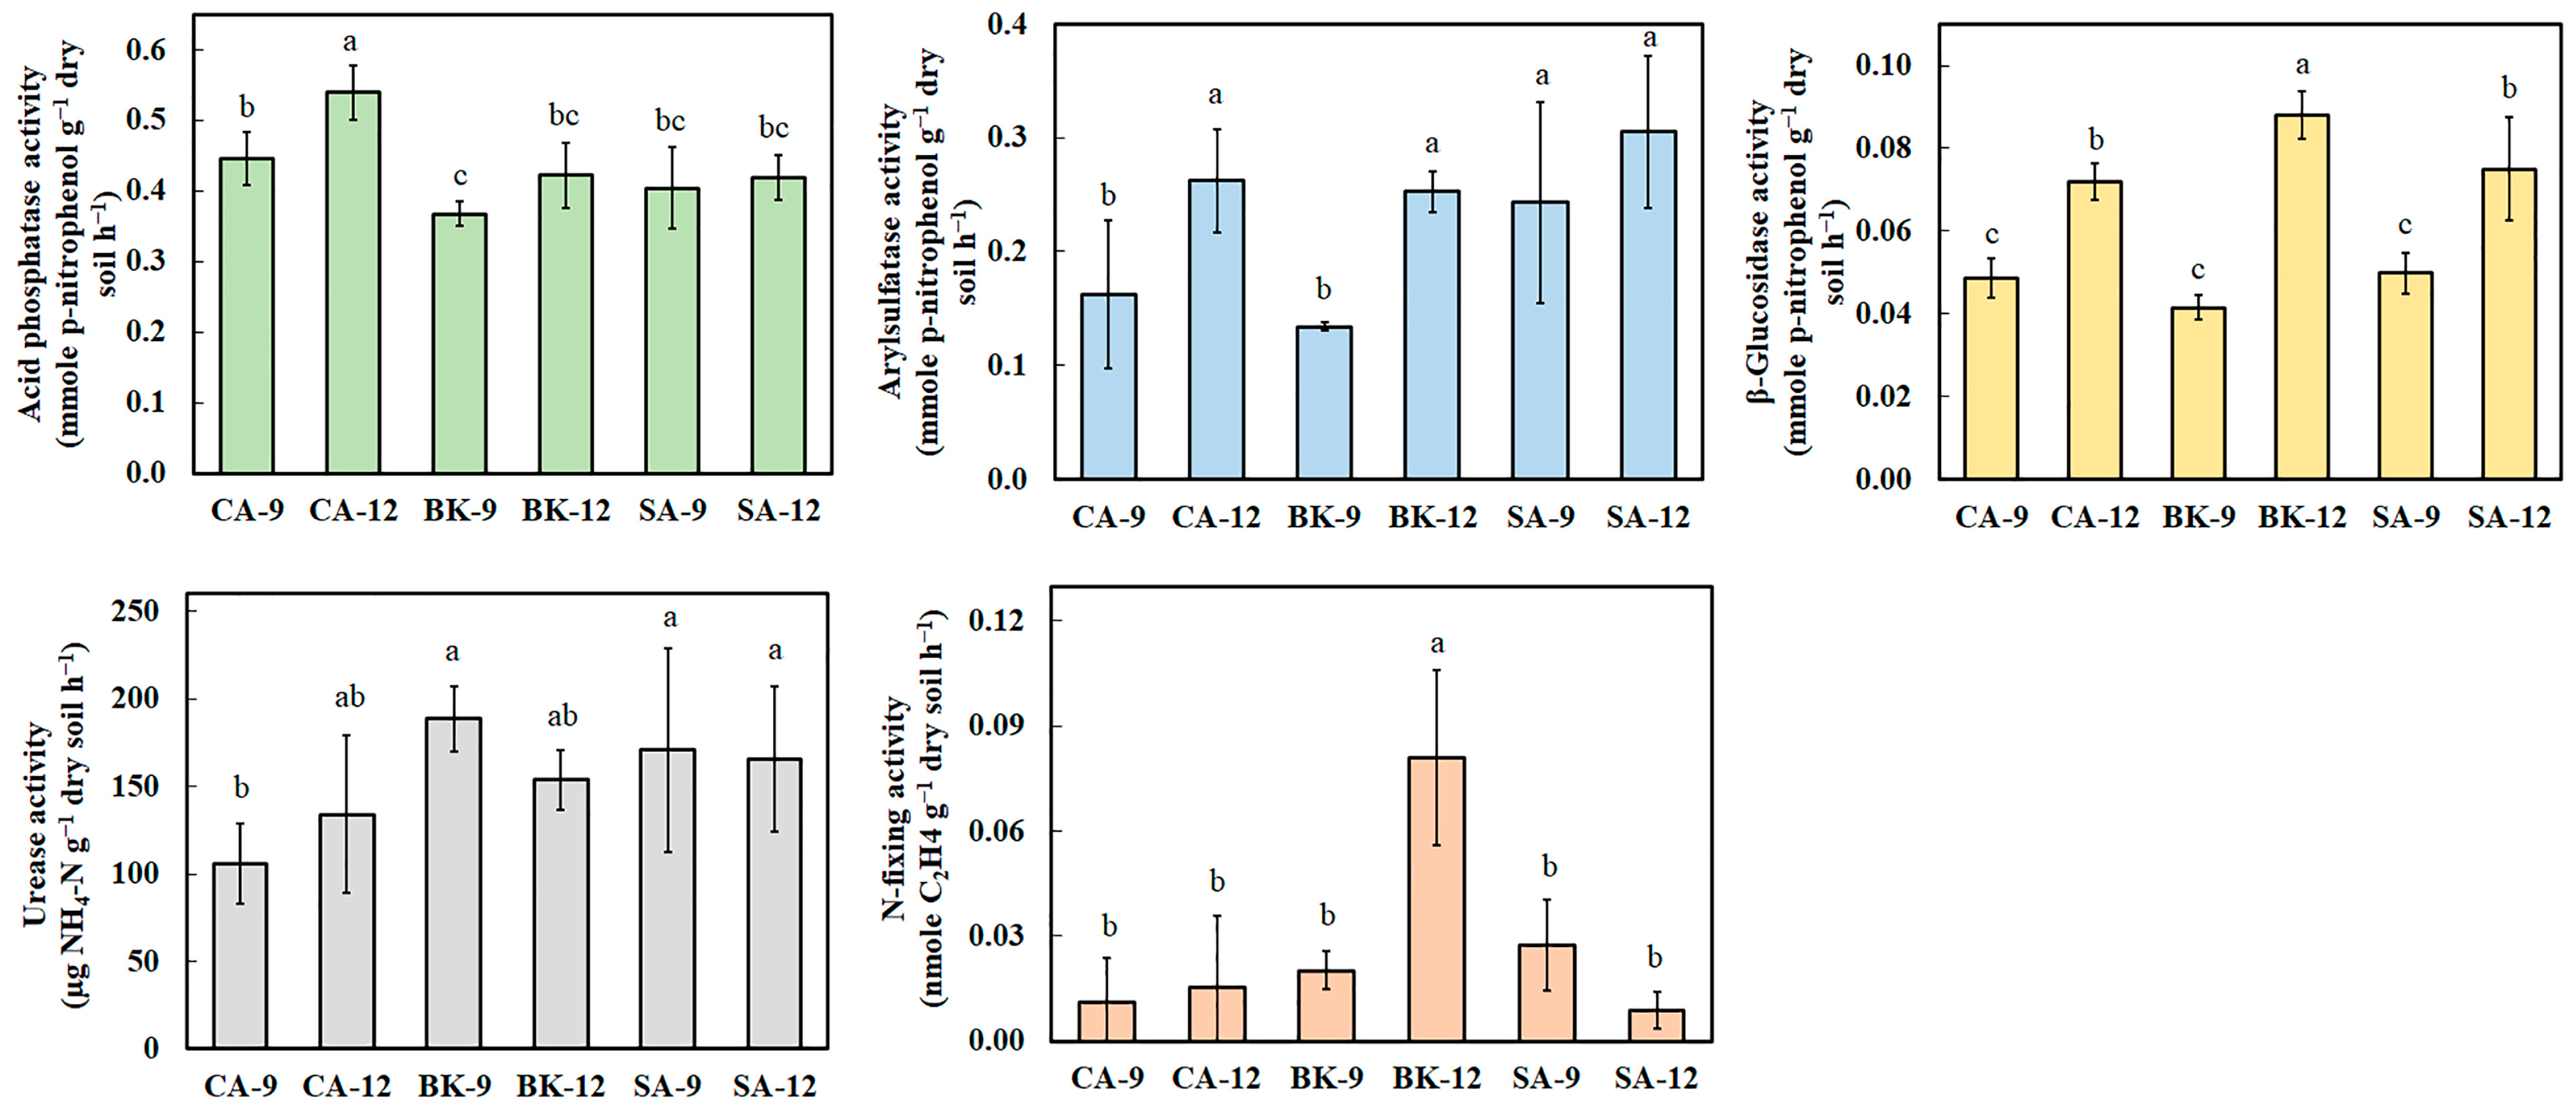
2.2. Soil Enzyme Activity

To analyze the activity of acid phosphatase, and arylsulfatase, a mixture containing 0.5 g of soil, 0.2 mL of toluene, and 2 mL of modified universal buffer (MUB) was mixed with p-nitrophenyl phosphate (0.05 M), and p-nitrophenyl-sulfate (0.05 M), respectively, and incubated at 37 °C for 1 h [19,20]. The reaction was terminated with 2 mL of 0.5 M NaOH and 0.5 mL of 0.5 M CaCl2, followed by filtration. The filtrate was analyzed for p-nitrophenol at 420 nm using a spectrophotometer. β-Glucosidase activity was determined by combining 0.5 g of soil, 0.2 mL of toluene, and 2 mL of MUB with p-nitrophenyl-β-D-glucoside (0.05 M) and incubating at 37 °C for 1 h [21]. The reaction was stopped with 2 mL of 0.5 M Tris buffer (pH 12), and 0.5 mL of 0.5 M CaCl2 solution, followed by filtration. The filtrate was analyzed for p-nitrophenol concentration at 420 nm using a spectrophotometer. Urease activity was assessed by mixing 1 g of soil with 0.5 mL of 0.08 M urea solution and incubating at 37 °C for 2 h. The reaction was terminated with 10 mL of 1 N KCl solution, and the mixture was filtered. The filtrate (200 μL) was combined with 400 μL of 0.1% dichloroisocyanuric acid sodium salt, 1 mL of Na-salicylate/NaOH, and 1.8 mL of deionized water, then assessed for NH4-N content at 690 nm using a spectrophotometer. Acetylene reduction was employed to assess nitrogen fixation activity in the soil [22]. Soil samples, measured by volume at 17 mL in 80 mL serum vials, were incubated at 25 °C for 24 h in an atmosphere containing 10% acetylene, and then the weight of the soil was measured. The production of ethylene, a byproduct of nitrogenase-catalyzed reduction, was quantified using a gas chromatography (GC) system (HITACHI model 163, Hitachi Ltd., Tokyo, Japan) equipped with a flame ionization detector (FID) and a packed column (1.0 m in length with a 2.0 mm internal diameter, filled with Porapak-T 80–100 mesh). GC operational parameters were set with nitrogen as the carrier gas at a flow rate of 35 mL h−1, FID maintained at 110 °C, and the column temperature at 65 °C.

2.3. Biolog EcoPlate™ Analysis

The Biolog EcoPlate™ system (Biolog Inc., Hayward, CA, USA) was utilized to assess the carbon source utilization patterns of soil. The system incorporates a triple replicate design and includes 31 different carbon sources, generating a fingerprint spectrum of carbon source utilization. After inoculating the soil suspension into Biolog EcoPlate™ 96-well microtiter plates, they were incubated at 30 °C for 3 d. The average well color development (AWCD) and differences in the carbon source utilization were then analyzed. The optical density readings from triplicate samples that exceeded 0.15 were interpreted as positive carbon source utilization (richness).

2.4. Soil Metagenomic Analysis

For soil metagenomic analysis, soil DNA was obtained using the UltraClean Soil DNA Isolation Kit (MO BIO Laboratories, Inc., Carlsbad, CA, USA) for next-generation sequencing. Soil DNA concentration was quantified using a spectrophotometer, employing the absorbance ratio at 260 and 280 nm (OD260/280), with a range of 1.8 to 2.0. DNA sequencing analysis was commissioned by the Sequencing-tech company (Taipei, Taiwan). DNA was sheared into fragments averaging 350 bp, and DNA libraries were constructed using MGIEasy DNA Library Prep Kit (MGI Tech Co., Ltd., Shenzhen, China). Circularized DNA was used to create DNA NanoBalls (DNB) following the BGISEQ-500RS High-throughput Sequencing Set (PE100) V3.0 operating manual (MGI Tech Co., Ltd.). After the DNA preparation was completed, high-throughput sequencing was performed using the BGISEQ500 sequencer. Raw DNA sequence data were preprocessed to remove adapters, short sequences (<35 bp), and low-quality bases (<Q20) using CutAdapt [23]. Clean reads were used to analyze microbial taxonomical abundance, alpha diversity, beta diversity, and rarefaction curves using Kraken2 [24]. Metagenome de novo assembly, ORF prediction, gene annotation, and similarity search (NR database) were conducted using MegaHit, Prokka, EggNot Mapper, and Diamond. Gene classification utilized the Gene Ontology (GO), KEGG pathway, Clusters of Orthologous Groups (COG), and Carbohydrate-Active enZYmes (CAZy) databases.

2.5. Statistical Analysis

Data are expressed as the mean ± standard deviation (SD). Duncan’s multiple range test was applied at a 95% confidence level using the IBM SPSS Statistics v20 software (SPSS Inc., Chicago, IL, USA). Repeated measures analysis of variance (ANOVA) and Pearson correlation coefficient were performed by IBM SPSS Statistics to assess the relationship between soil physicochemical properties, enzymatic activity, carbon utilization, and agricultural practices.

2.6. Nucleotide Sequence Accession Numbers and Data Availability

The metagenome of paddy soil was deposited at GenBank under accession numbers of BioProject PRJNA1103882 and BioSample SAMN41064306, SAMN41064307, SAMN41064308, SAMN41064309, SAMN41064310, and SAMN41064311.

3. Results

3.1. Soil Physicochemical Properties

To evaluate the impact of fertilization practices, soil properties such as pH, electrical conductivity (EC), total nitrogen, organic matter, and nutrient content were analyzed. The results showed that unfertilized soil (BK) had a higher pH, with 6.746 in BK-9 and 6.811 in BK12, which significantly decreased with increased fertilization. Conventional agriculture (CA) practice resulted in the lowest pH with 6.108 in CA-9 and 5.753 in CA-12. In contrast, EC values followed an opposite trend, increasing with fertilization intensity (Figure 1). Although the BK soil exhibited the lowest total nitrogen content, statistical analysis revealed no significant difference in total nitrogen levels when compared to soils under conventional (CA) and sustainable agriculture (SA) practices. Organic matter content was highest in SA soil, followed by CA and BK soils. The analysis of eight soil elements revealed significant variations in phosphorus (P), potassium (K), iron (Fe), manganese (Mn), and zinc (Zn) due to different agricultural management practices and seasonal changes. P and K were most abundant in September, with particularly high K levels in CA-9, as determined by ICP-OES analysis (Table 1). K, Fe and Mn peaked in September regardless of agricultural management, while Zn levels were higher in December. Further Pearson correlation analysis indicated a significantly negative relationship between soil pH and EC, as well as between pH and K levels (Table S2). EC was positively correlated with several elements, including total nitrogen, organic matter, K, and calcium (Ca). Additionally, there was a significant positive correlation between total nitrogen and organic matter, both of which were also positively correlated with Ca. Moreover, soil P and K levels were significantly positively correlated.

3.2. Correlation among Soil Enzyme Activity, Soil Physicochemical Properties and Agricultural Management

To elucidate the impact of agricultural management practices and seasonal changes on soil enzyme activity, we analyzed five enzymes involved in the cycling of phosphorus, sulfur, carbon, and nitrogen: acid phosphatase, arylsulfatase, β-glucosidase, urease, and N-fixation. The results showed that different agricultural management practices led to the lowest activities of acid phosphatase, arylsulfatase, and β-glucosidase in September, with the highest activities observed in December under CA for acid phosphatase, SA for arylsulfatase, and BK for β-glucosidase (Figure 2). In contrast, urease and N-fixing activities exhibited different patterns. The highest fertilized CA soil had the lowest urease activity while N-fixing activity was highest only in December under BK. Overall, soil enzyme activities in SA were less affected by seasonal changes. Pearson correlation analysis further revealed significant relationships between soil enzyme activities and soil physicochemical properties. Soil pH exhibited a negative relationship with acid phosphatase and a positive relationship with urease and N-fixation (Table 2). Additionally, soil EC, organic matter, and Ca were significantly positively correlated with acid phosphatase and arylsulfatase. Conversely, P, K and Fe were negatively correlated with acid phosphatase, arylsulfatase, β-glucosidase, urease, and N-fixation.
To further investigate the influence of different seasons and agricultural management practices on soil enzyme activities, repeated measures ANOVA was employed. The analysis revealed that acid phosphatase, arylsulfatase, β-glucosidase, and N-fixation all exhibited significant associations with seasonal changes (Table 3). In addition to this temporal correlation, β-glucosidase and N-fixing activities also showed a significant relationship with agricultural management practices, underscoring the complex interplay between fertilization and soil biochemistry.

3.3. Correlation among Soil Carbon Utilization, Soil Physicochemical Properties and Agricultural Management

Using Biolog EcoPlate™ analysis to assess the soil carbon source utilization, it was found that the highest levels of carbon source utilization activity (richness), the greatest activity (AWCD), and the most diverse carbon source utilization (Shannon) were all recorded in December across different agricultural management practices (Figure 3). The elements of K and Fe showed a significantly negative correlation with Biolog EcoPlate™’s richness and Shannon indices, a trend also observed with β-glucosidase activity (Table 4). These findings suggested that soil K and Fe were negatively related to the efficiency of soil carbon source utilization. Further analysis using repeated measures ANOVA to evaluate the impact of various soil Biolog EcoPlate™ activities across different seasons and agricultural management practices indicated that the richness, AWCD, and Shannon indices of Biolog EcoPlate™ were all significantly correlated with time (Table 5). Additionally, the expression intensity of Biolog EcoPlate™ AWCD was found to be significantly associated with agricultural management, highlighting the variability in soil carbon utilization under distinct farming regimes.

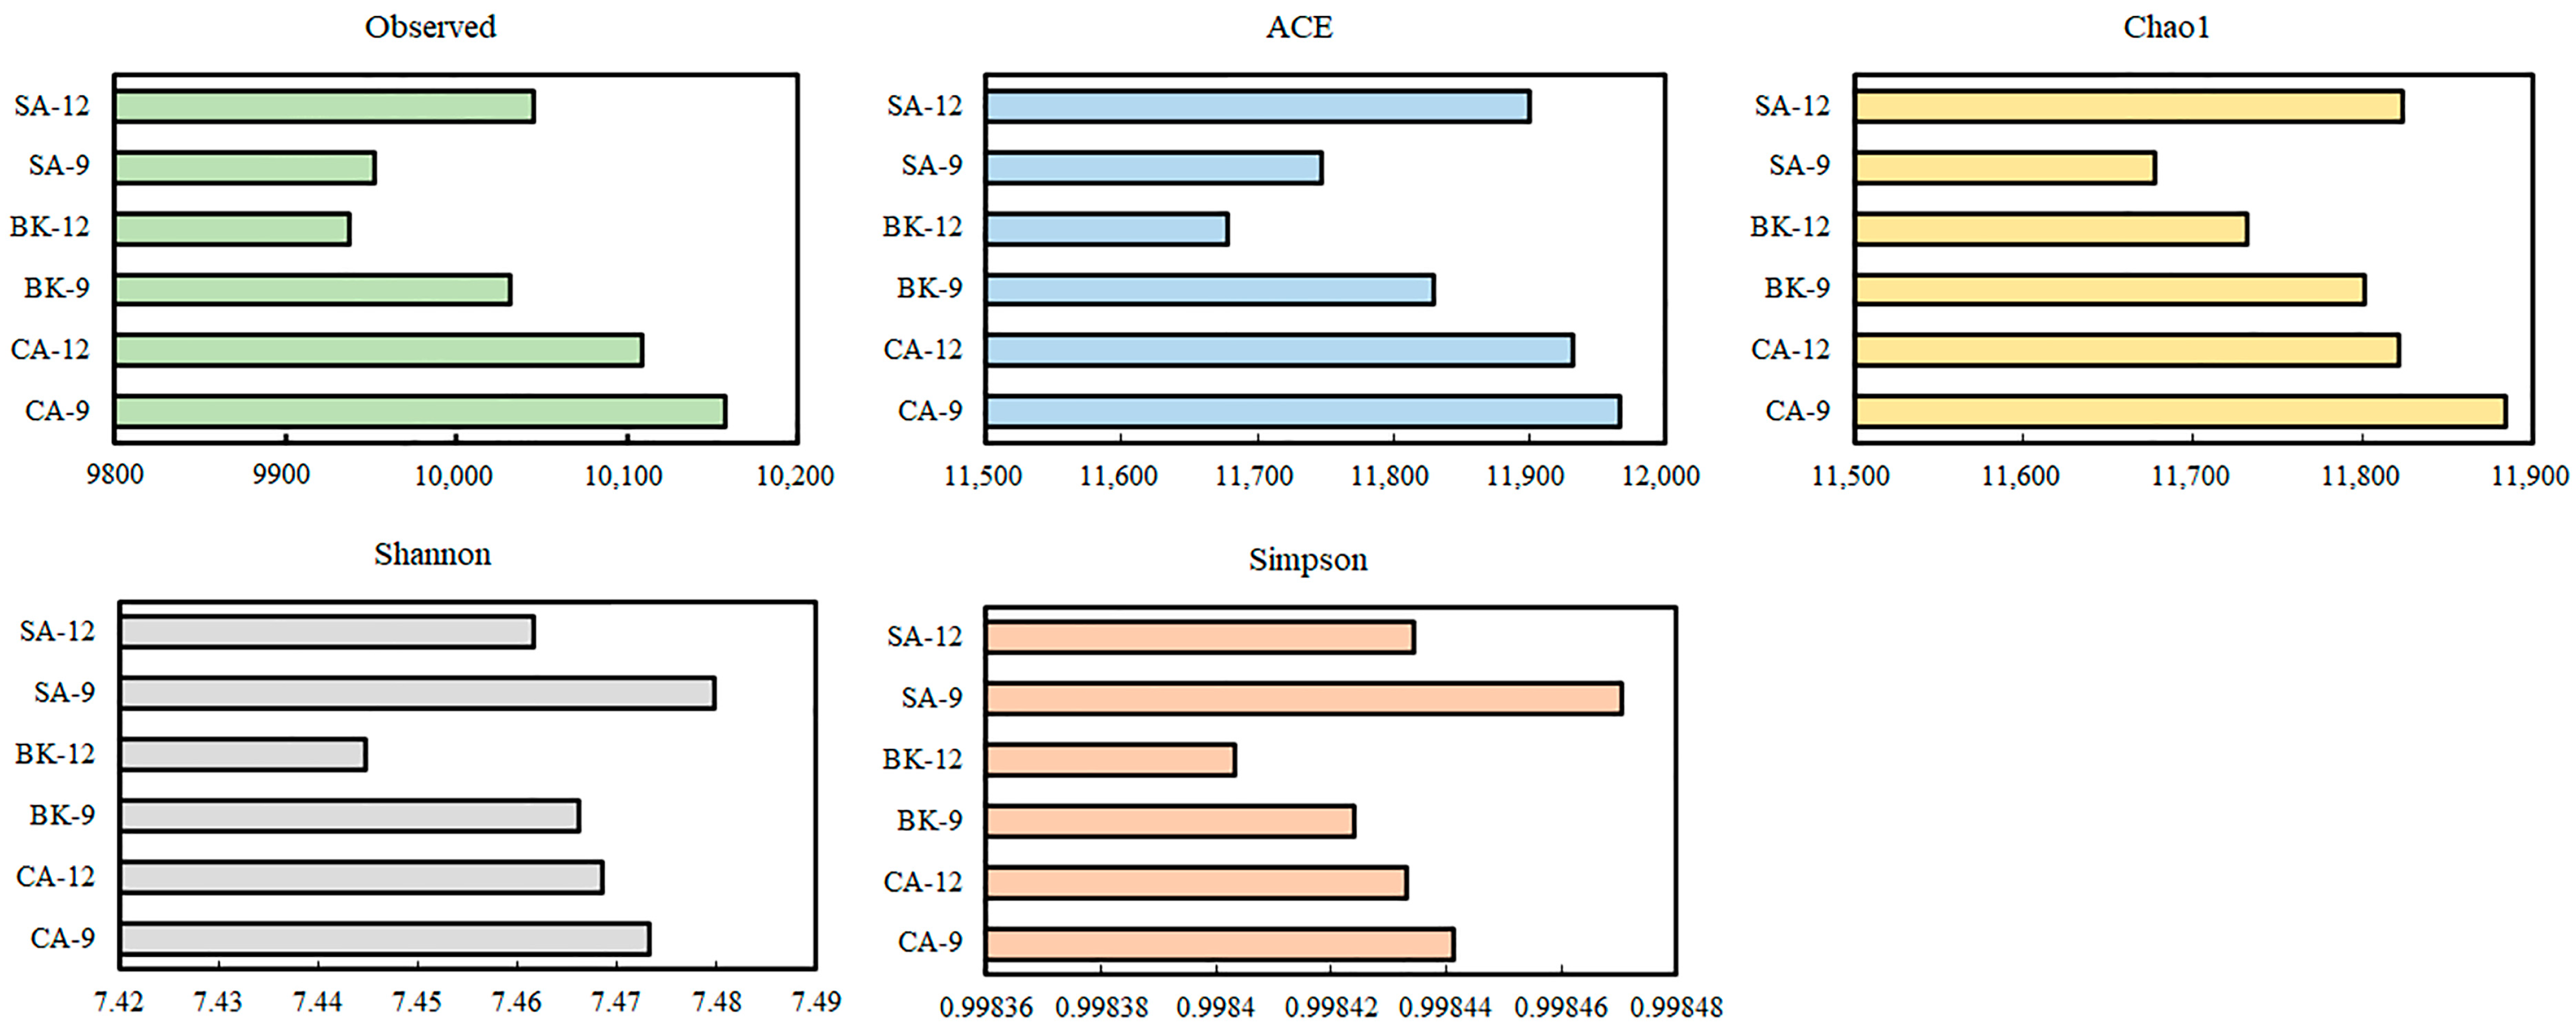
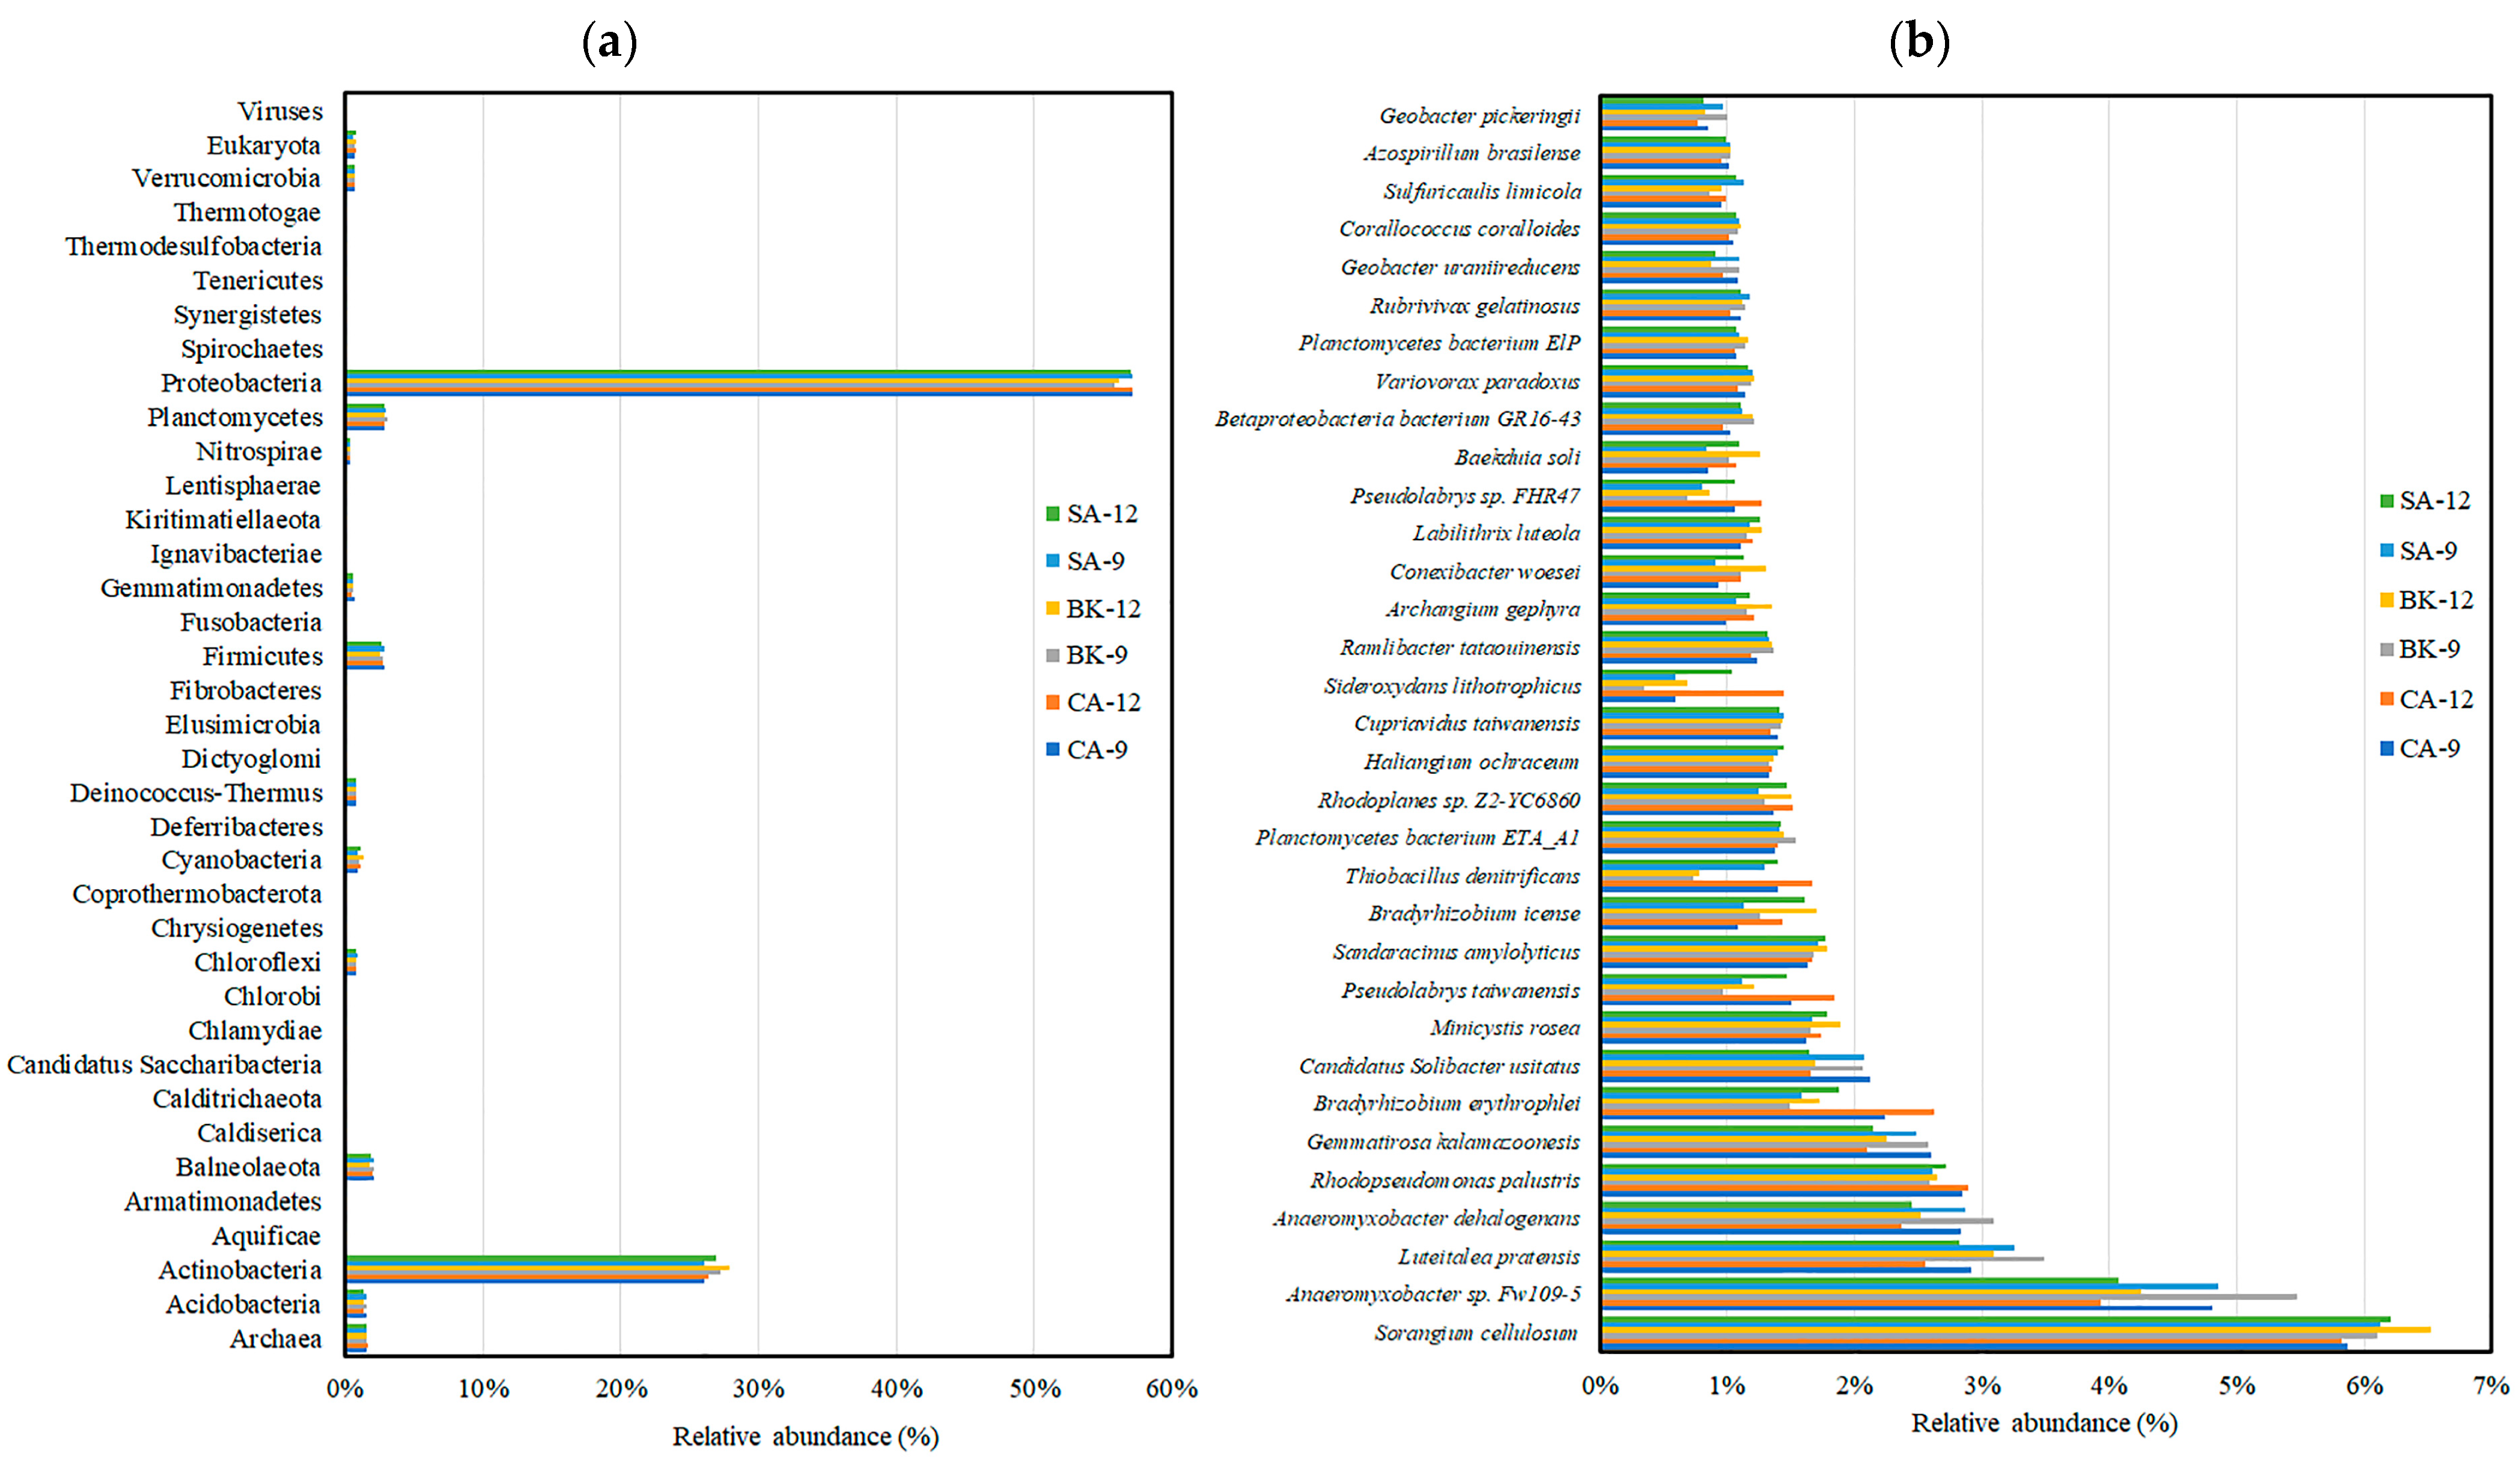
3.4. Soil Metagenomic Analysis

The average of total raw reads and nucleotides obtained through next-generation sequencing was 497,024,951 and 49.7 Gb, respectively (Table S3). After trimming low-quality bases, and removing adapter and short sequences, the average of clean bases amounted to 1.7 Gb, resulting in 1,514,830 contigs. The average number of coding sequences (CDSs) predicted by open reading frames was 1,725,985, with a GC content of 61.8%. Analysis of soil genomic alpha diversity under different agricultural management practices revealed that in terms of observed species, ACE (species richness and evenness), and Chao (operational taxonomic units), the patterns in September showed a hierarchy of CA > BK > SA (Figure 4). The application of CA practices maintained the highest species count regardless of time variation. However, with reduced fertilization (SA), the species count in December exceeded that in September. The Shannon diversity index, which accounts for both species richness and evenness, indicated higher diversity with greater index values, showing SA > CA > BK in September, and CA > SA > BK in December. The Simpson diversity index, which emphasizes species evenness, approached values closer to 1, indicating higher diversity with more uniform species distribution. This index consistently ranked SA > CA > BK in both September and December. Notably, soil genomic diversity was higher in September than in December.
From a phylogenetic perspective at the phylum level, Proteobacteria dominated the soil composition across all agricultural management practices, accounting for over 55% of the microbial community (Figure 5). Actinobacteria was the next prevalent group, with these two microbial phyla constituting more than 83% of the soil biome. At the species level, Sorangium cellulosum was the most abundant, representing over 5.8% of the microbial population, followed by Anaeromyxobacter sp. Sankey visualization analysis indicated that the distribution of six specific species—Sorangium cellulosum, Anaeromyxobacter sp., Luteitalea pratensis, Anaeromyxobacter dehalogenans, Rhodopseudomonas palustris, and Gemmatirosa kalamazoonesis—remained consistent across different seasons and agricultural management practices (Figure S2). Under reduced fertilization management (SA), the distribution of these dominant microbial populations was more stable, followed by conventional agriculture (CA), with the least stability observed in unfertilized soil (BK).

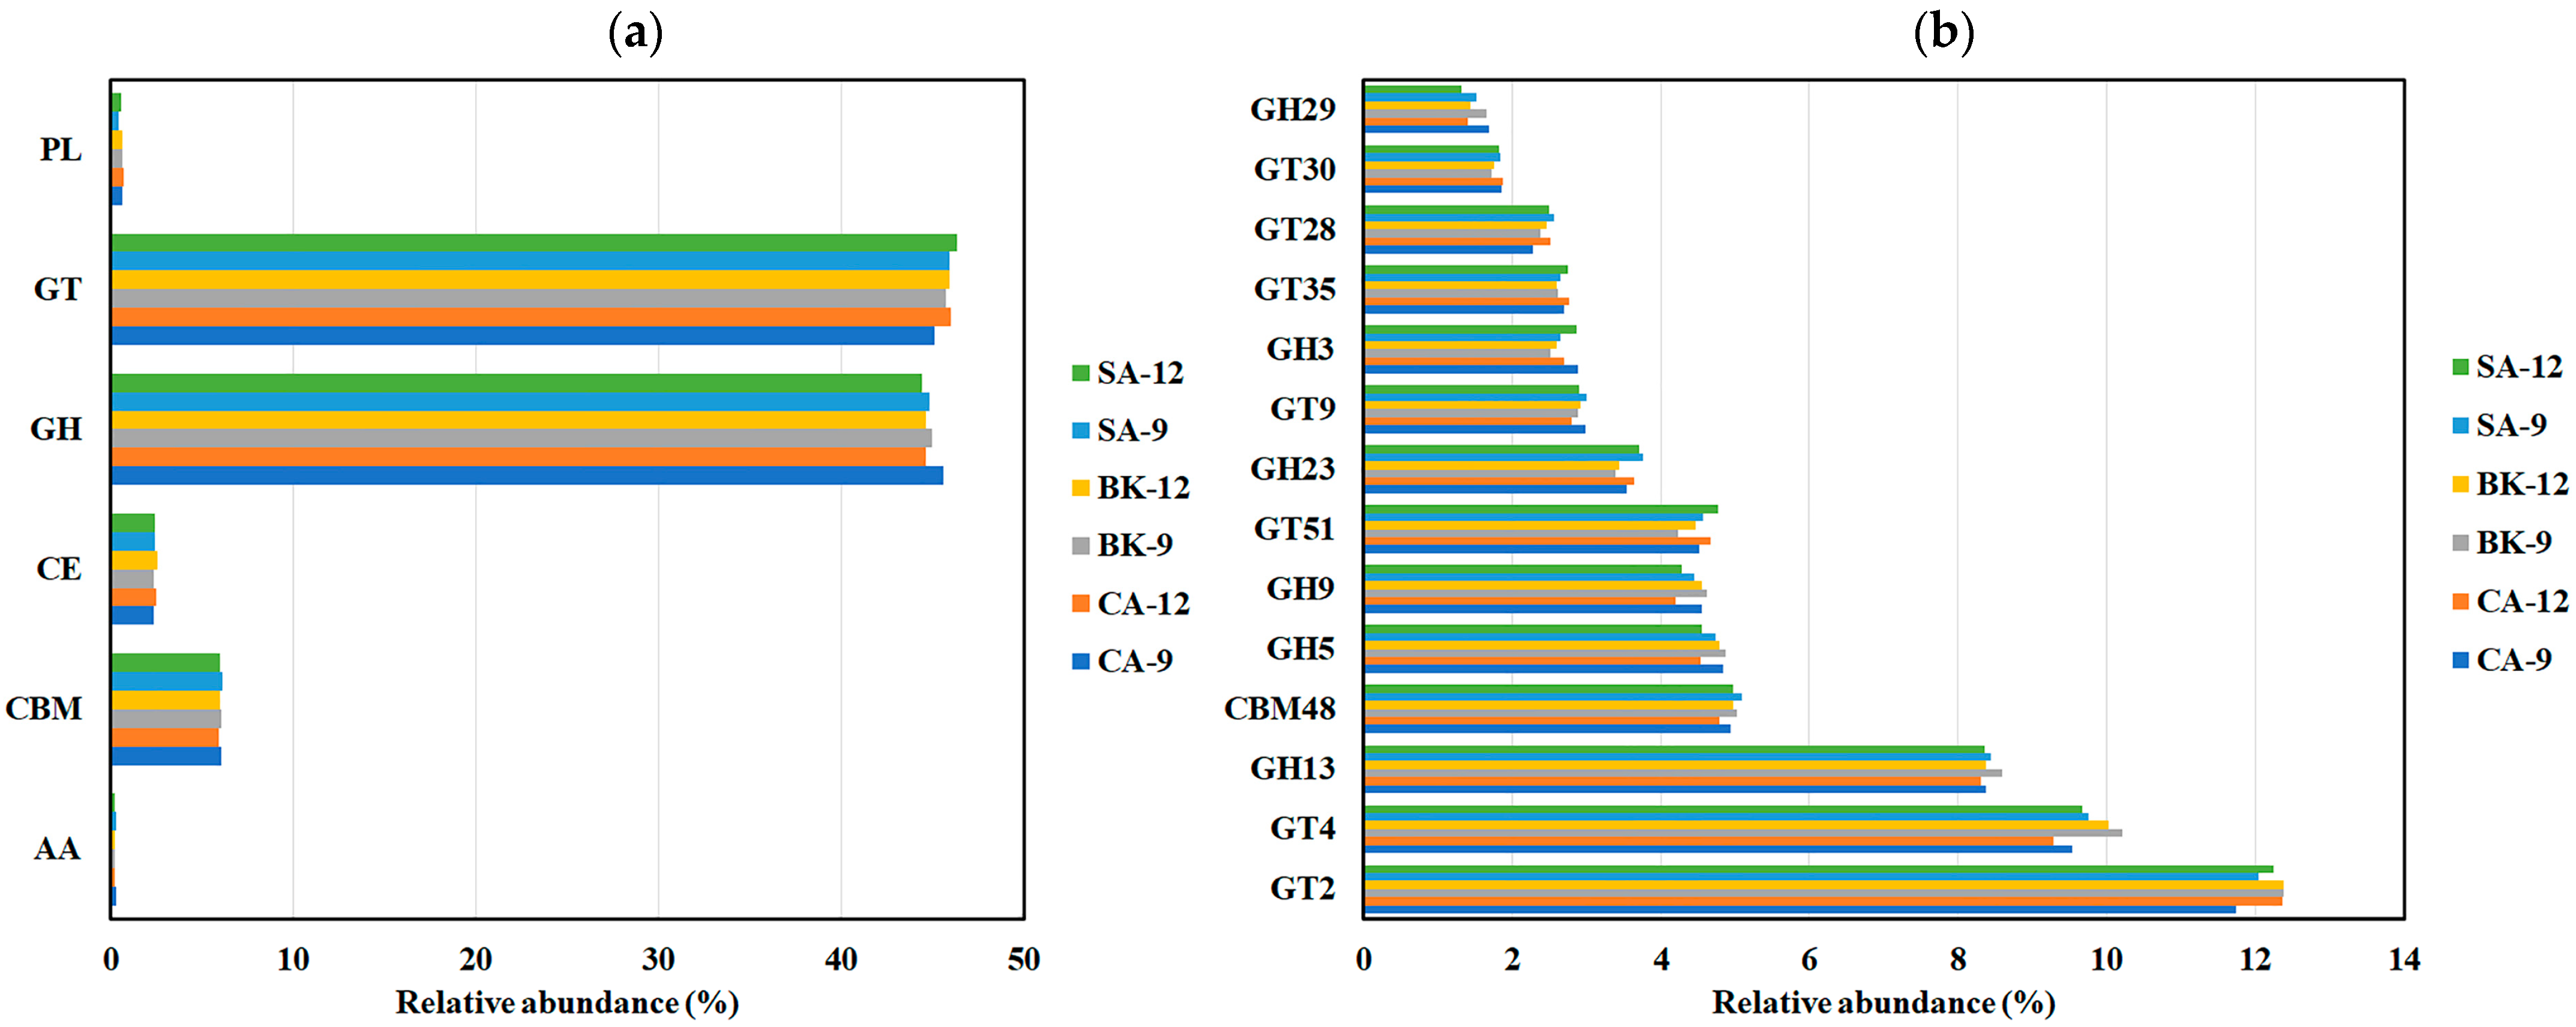
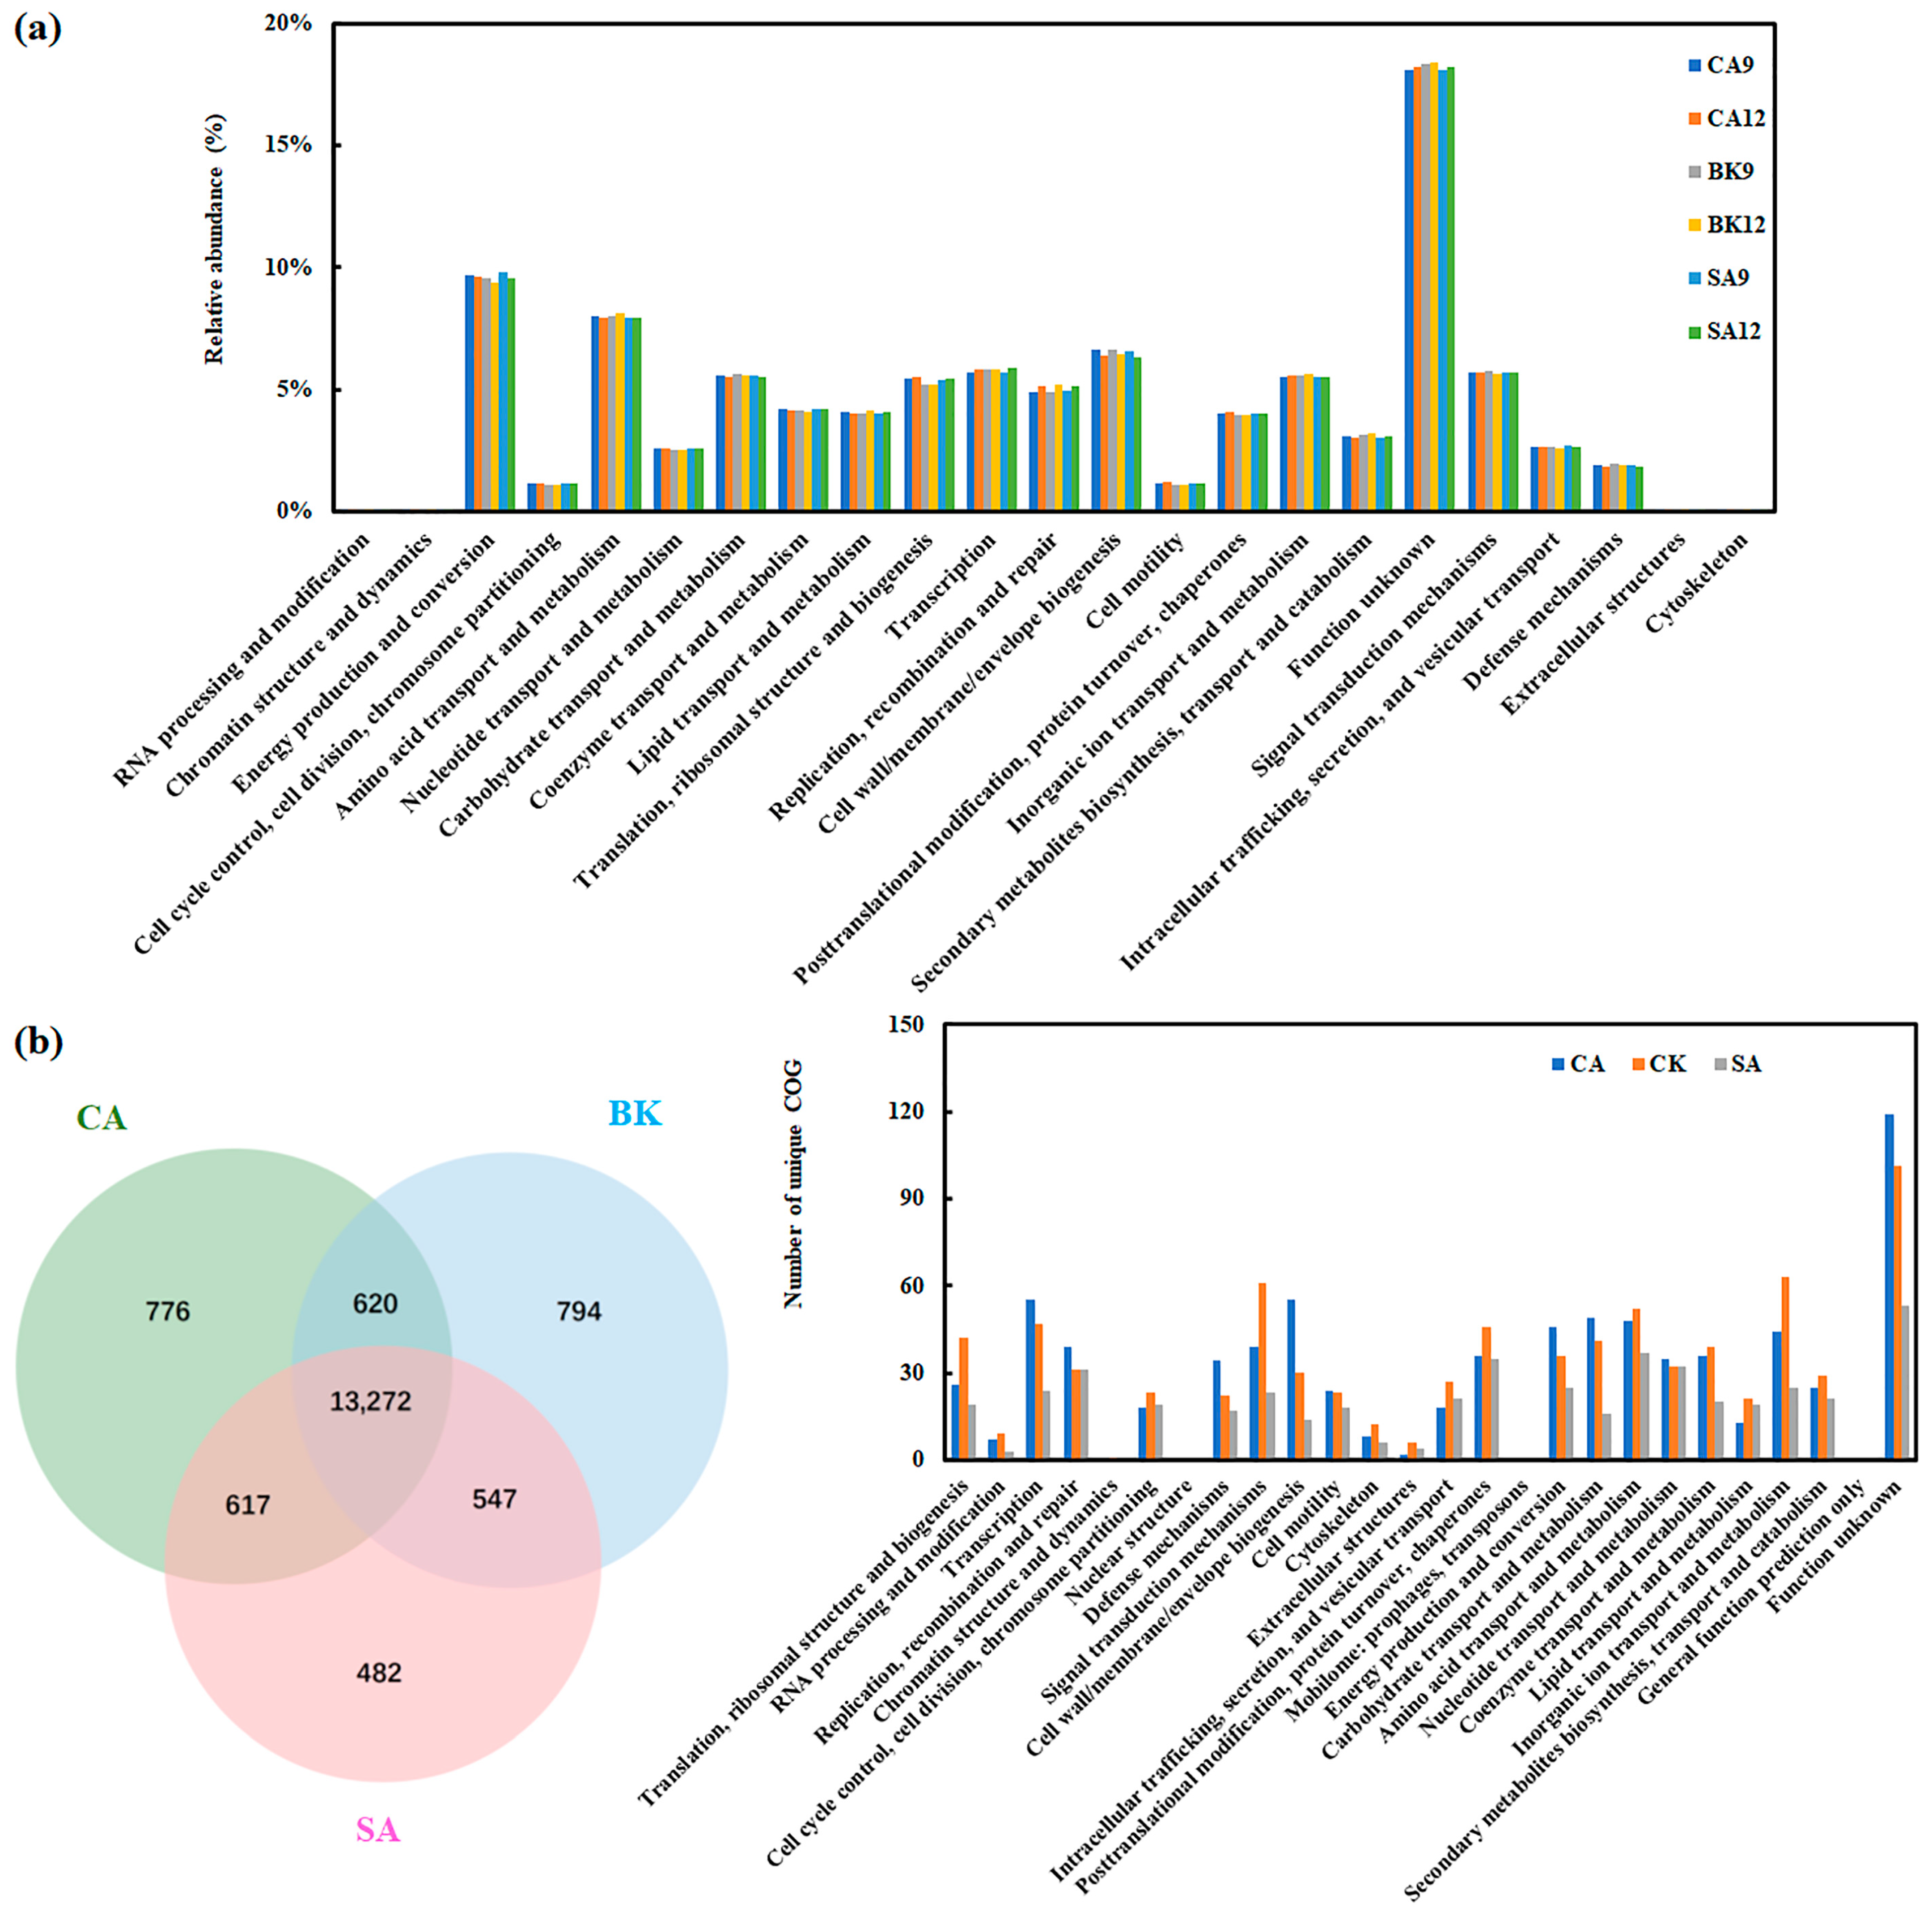
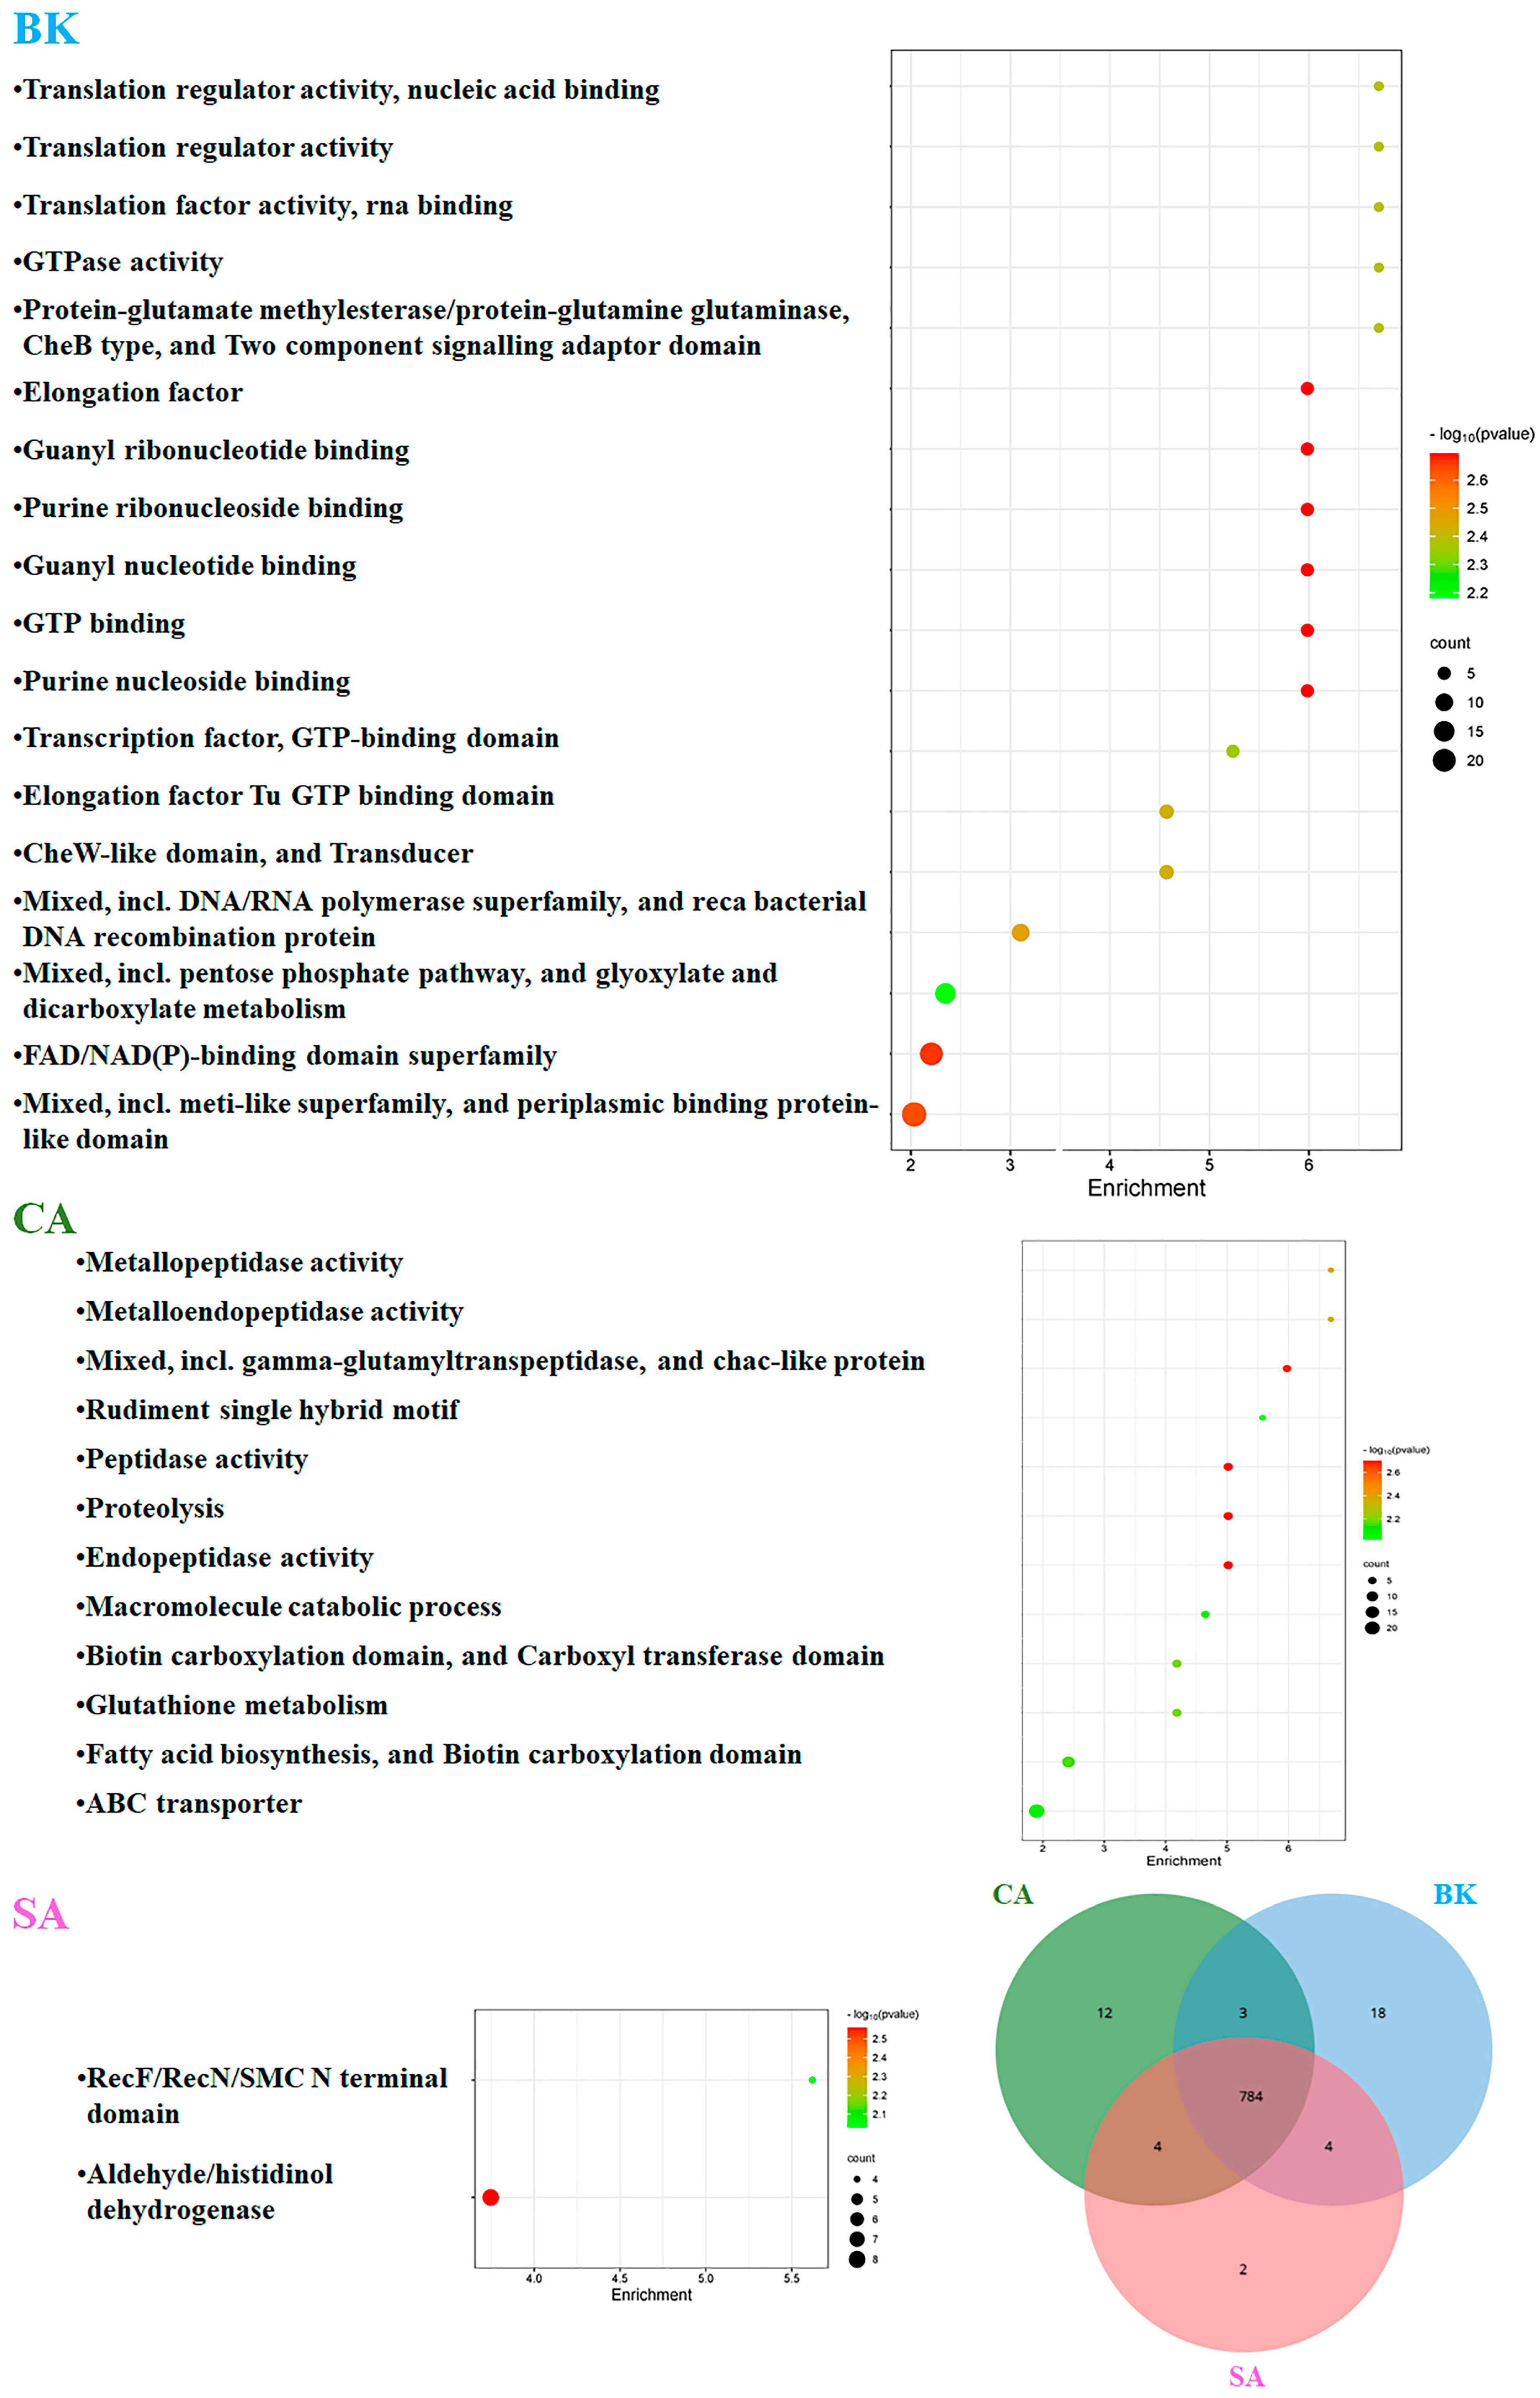
3.5. Soil Gene Annotation According to CAZy, COG and GO Databases

The CAZy database (Carbohydrate-Active enZYmes Database) is a bioinformatics resource focused on the collection and annotation of carbohydrate-active enzymes, which are crucial for the degradation and synthesis of carbohydrates. Analysis of soil metagenome data revealed that the distribution of carbohydrate-active enzymes remained relatively stable across different agricultural management practices (Figure 6). However, the relative abundance of AA, CBM, and GH classes was higher in September compared to December, while GT class enzymes showed an opposite trend. Notably, enzymes classified under the families GT2, GT4, and GH13 represented the highest proportions.
Analysis of the COG (Clusters of Orthologous Groups) database indicated that the “Function unknown” category was the most prevalent across seasons and agricultural management practices, followed closely by “Energy production and conversion” and “Amino acid transport and metabolism” (Figure 7). When comparing different agricultural management practices, the shared functional characteristics accounted for over 86%, with unique functions comprising only 5.1% in CA soil, 5.2% in BK soil, and 3.2% in SA soil. Similarly, seasonal analysis showed that shared functional characteristics exceeded 92%, with unique functions making up just 7.7% in September and 7.3% in December (Figure S3). Furthermore, under the same agricultural management practices, the common functional traits across different times consistently exceeded 90%, demonstrating a strong consistency in the functional profiles despite temporal variations.
Analysis of the Gene Ontology (GO) enrichment database revealed that across different agricultural management practices, the proportion of shared functional characteristics exceeded 96% (Figure 8). The unique functions were relatively minimal, with CA, BK, and SA soils each predominantly featuring ABC transporter, mixed including meti-like superfamily, and periplasmic binding protein-like domain, and aldehyde/histidinol dehydrogenase as their most unique functions, respectively. Seasonal analysis showed that the shared functional characteristics still accounted for over 96%, while unique functions constituted only 1.1% in September and 3.4% in December (Figure S4). Notably, the number of unique differences in BK soil was lower compared to the CA and SA soil in September.

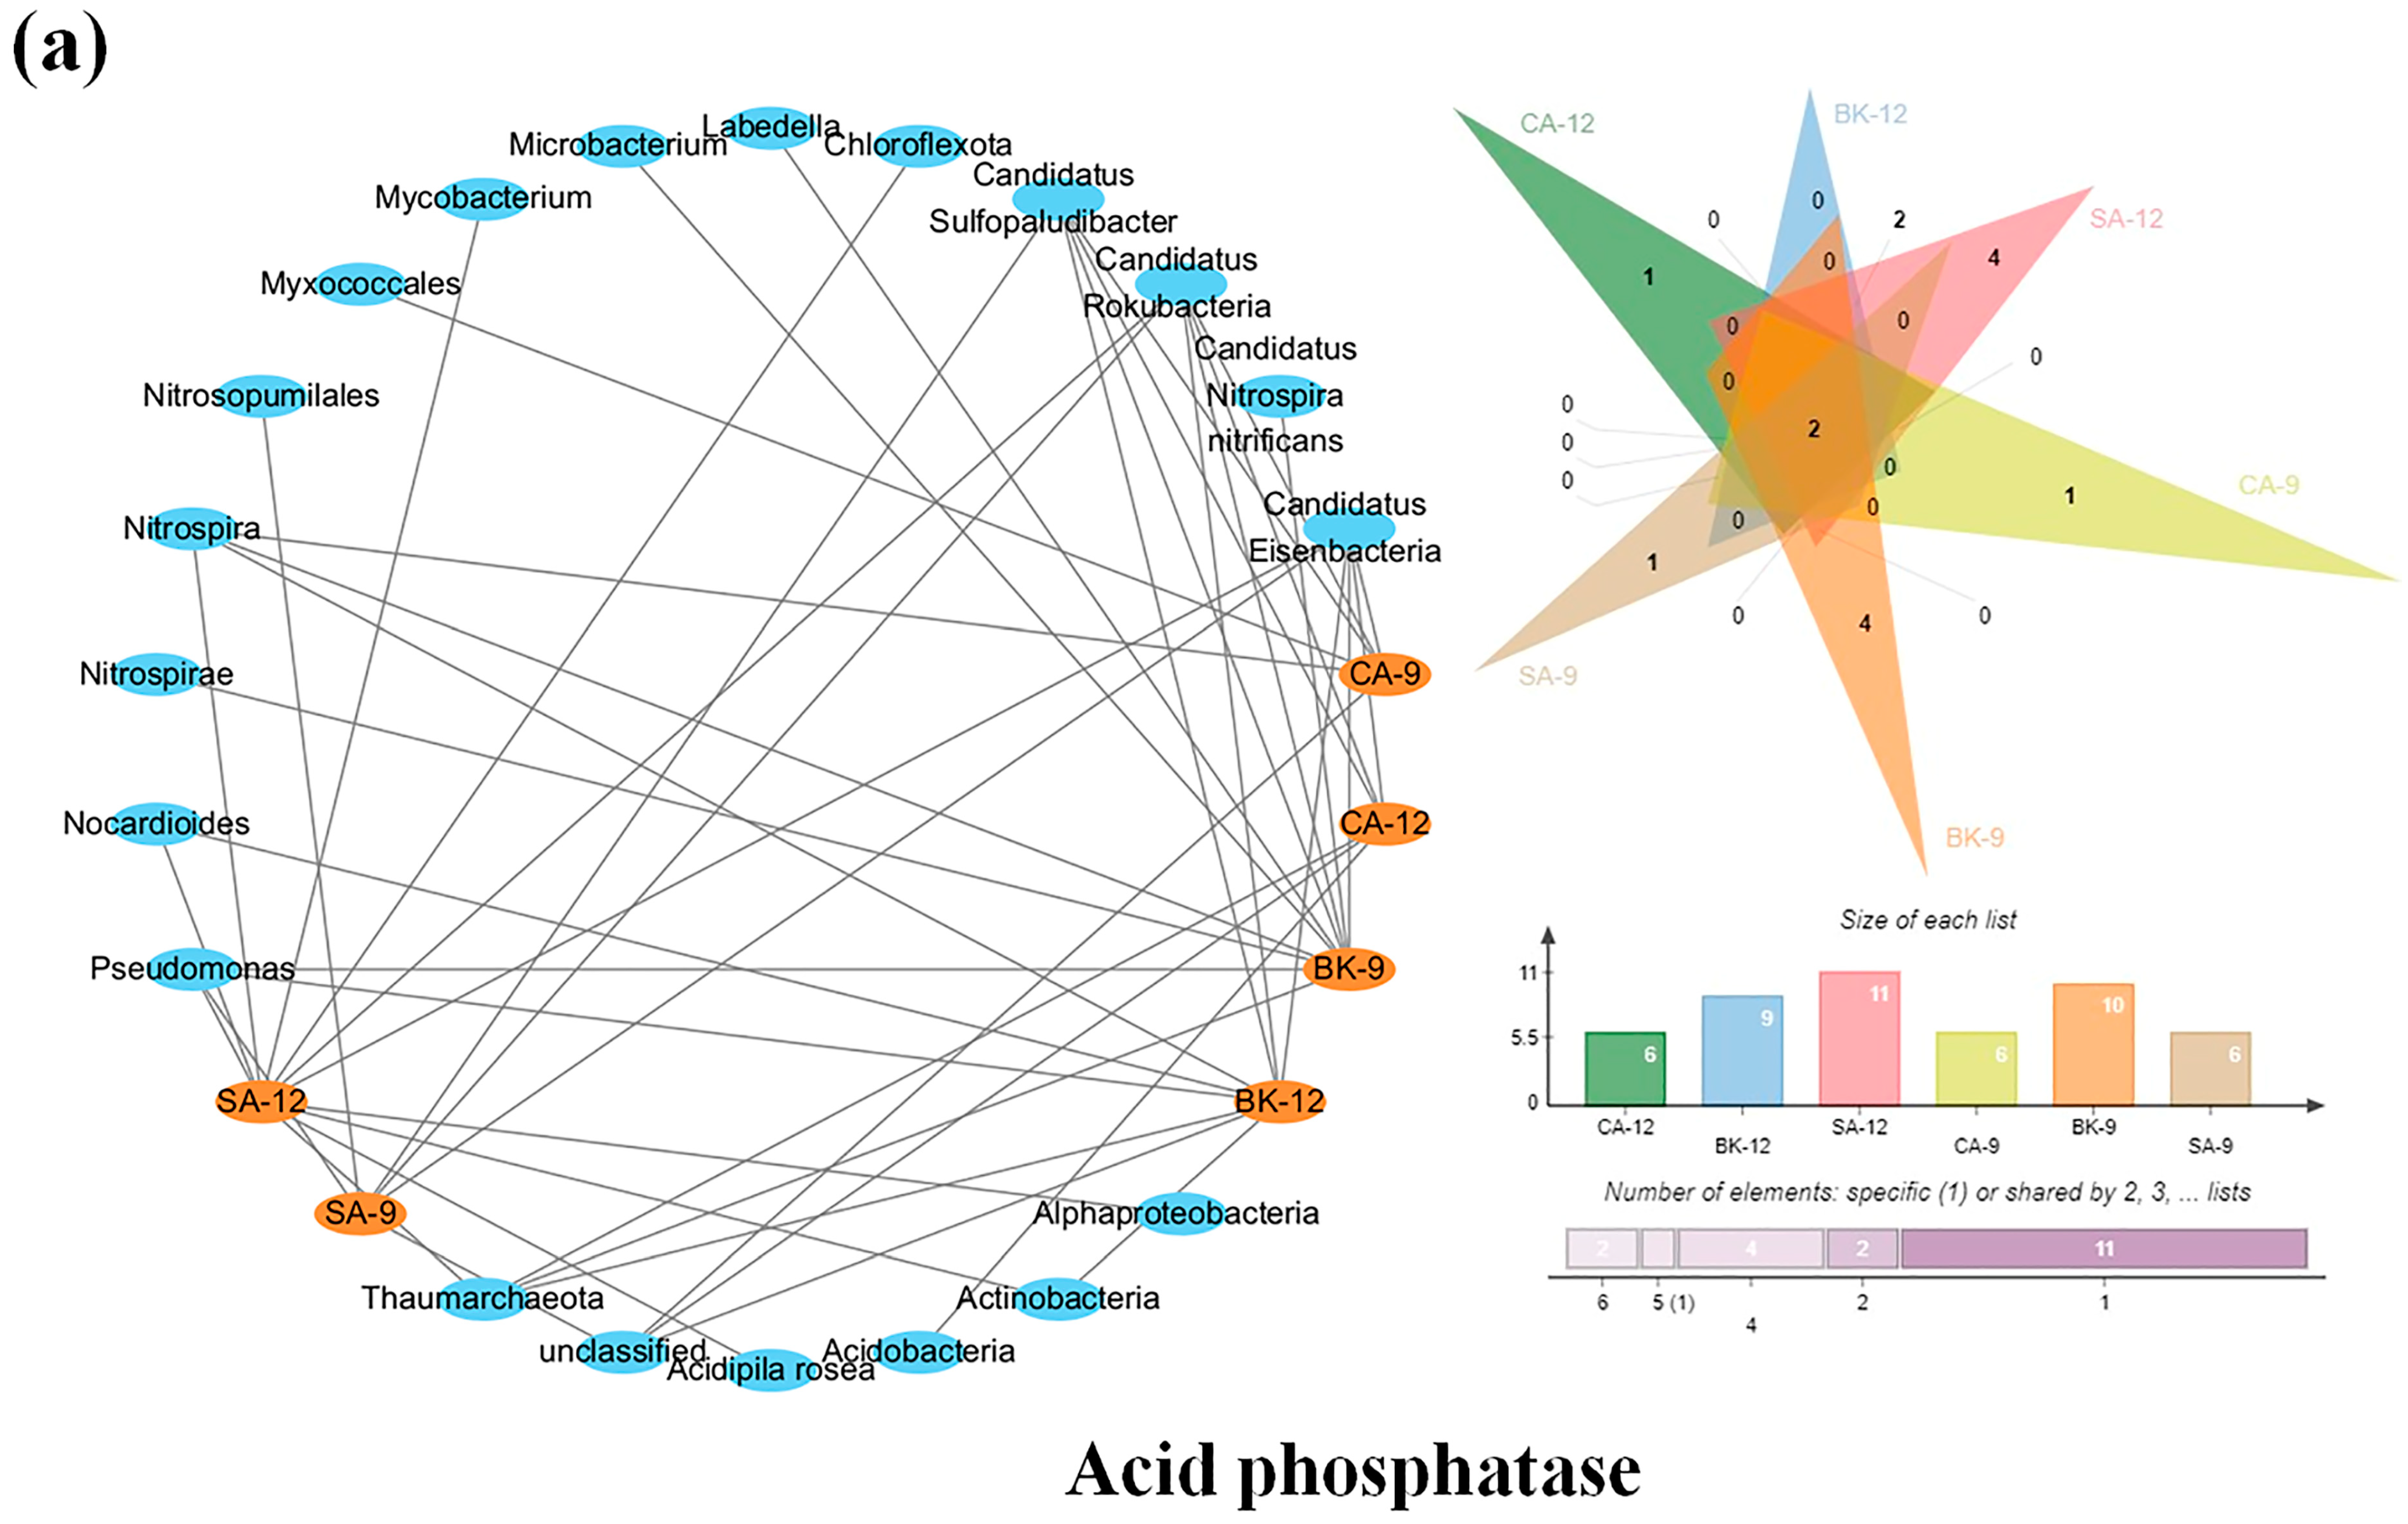
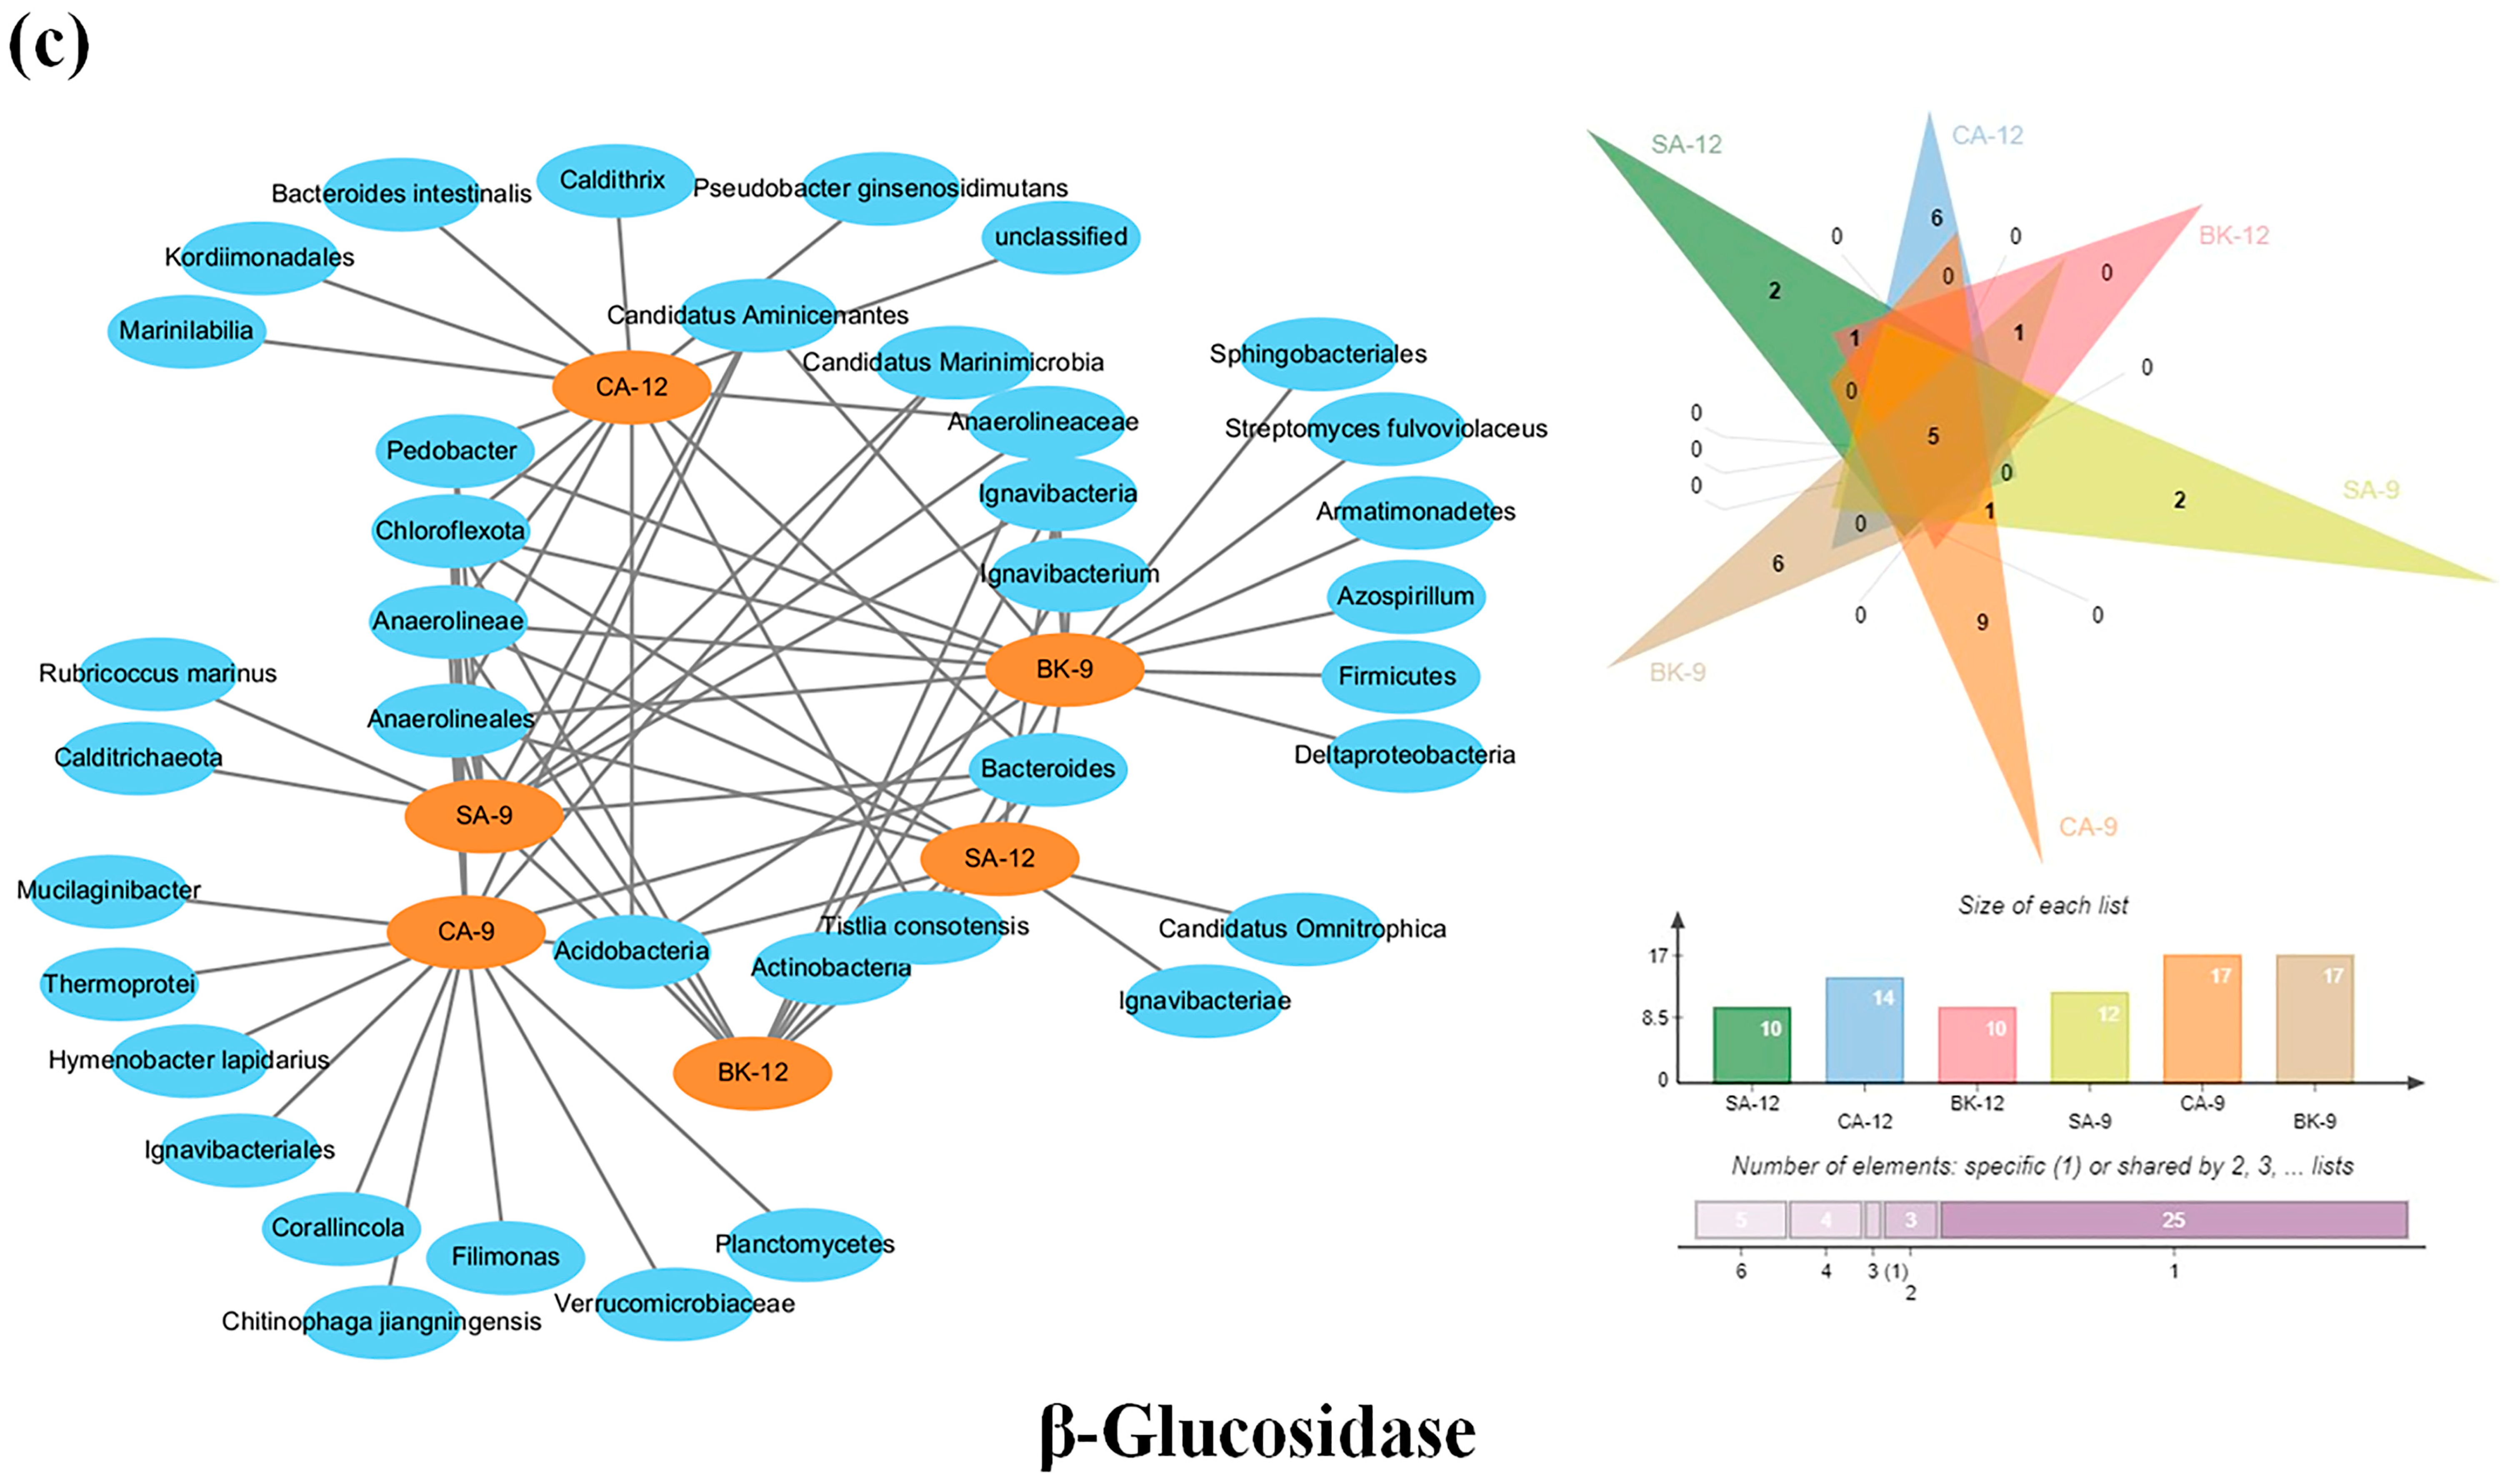
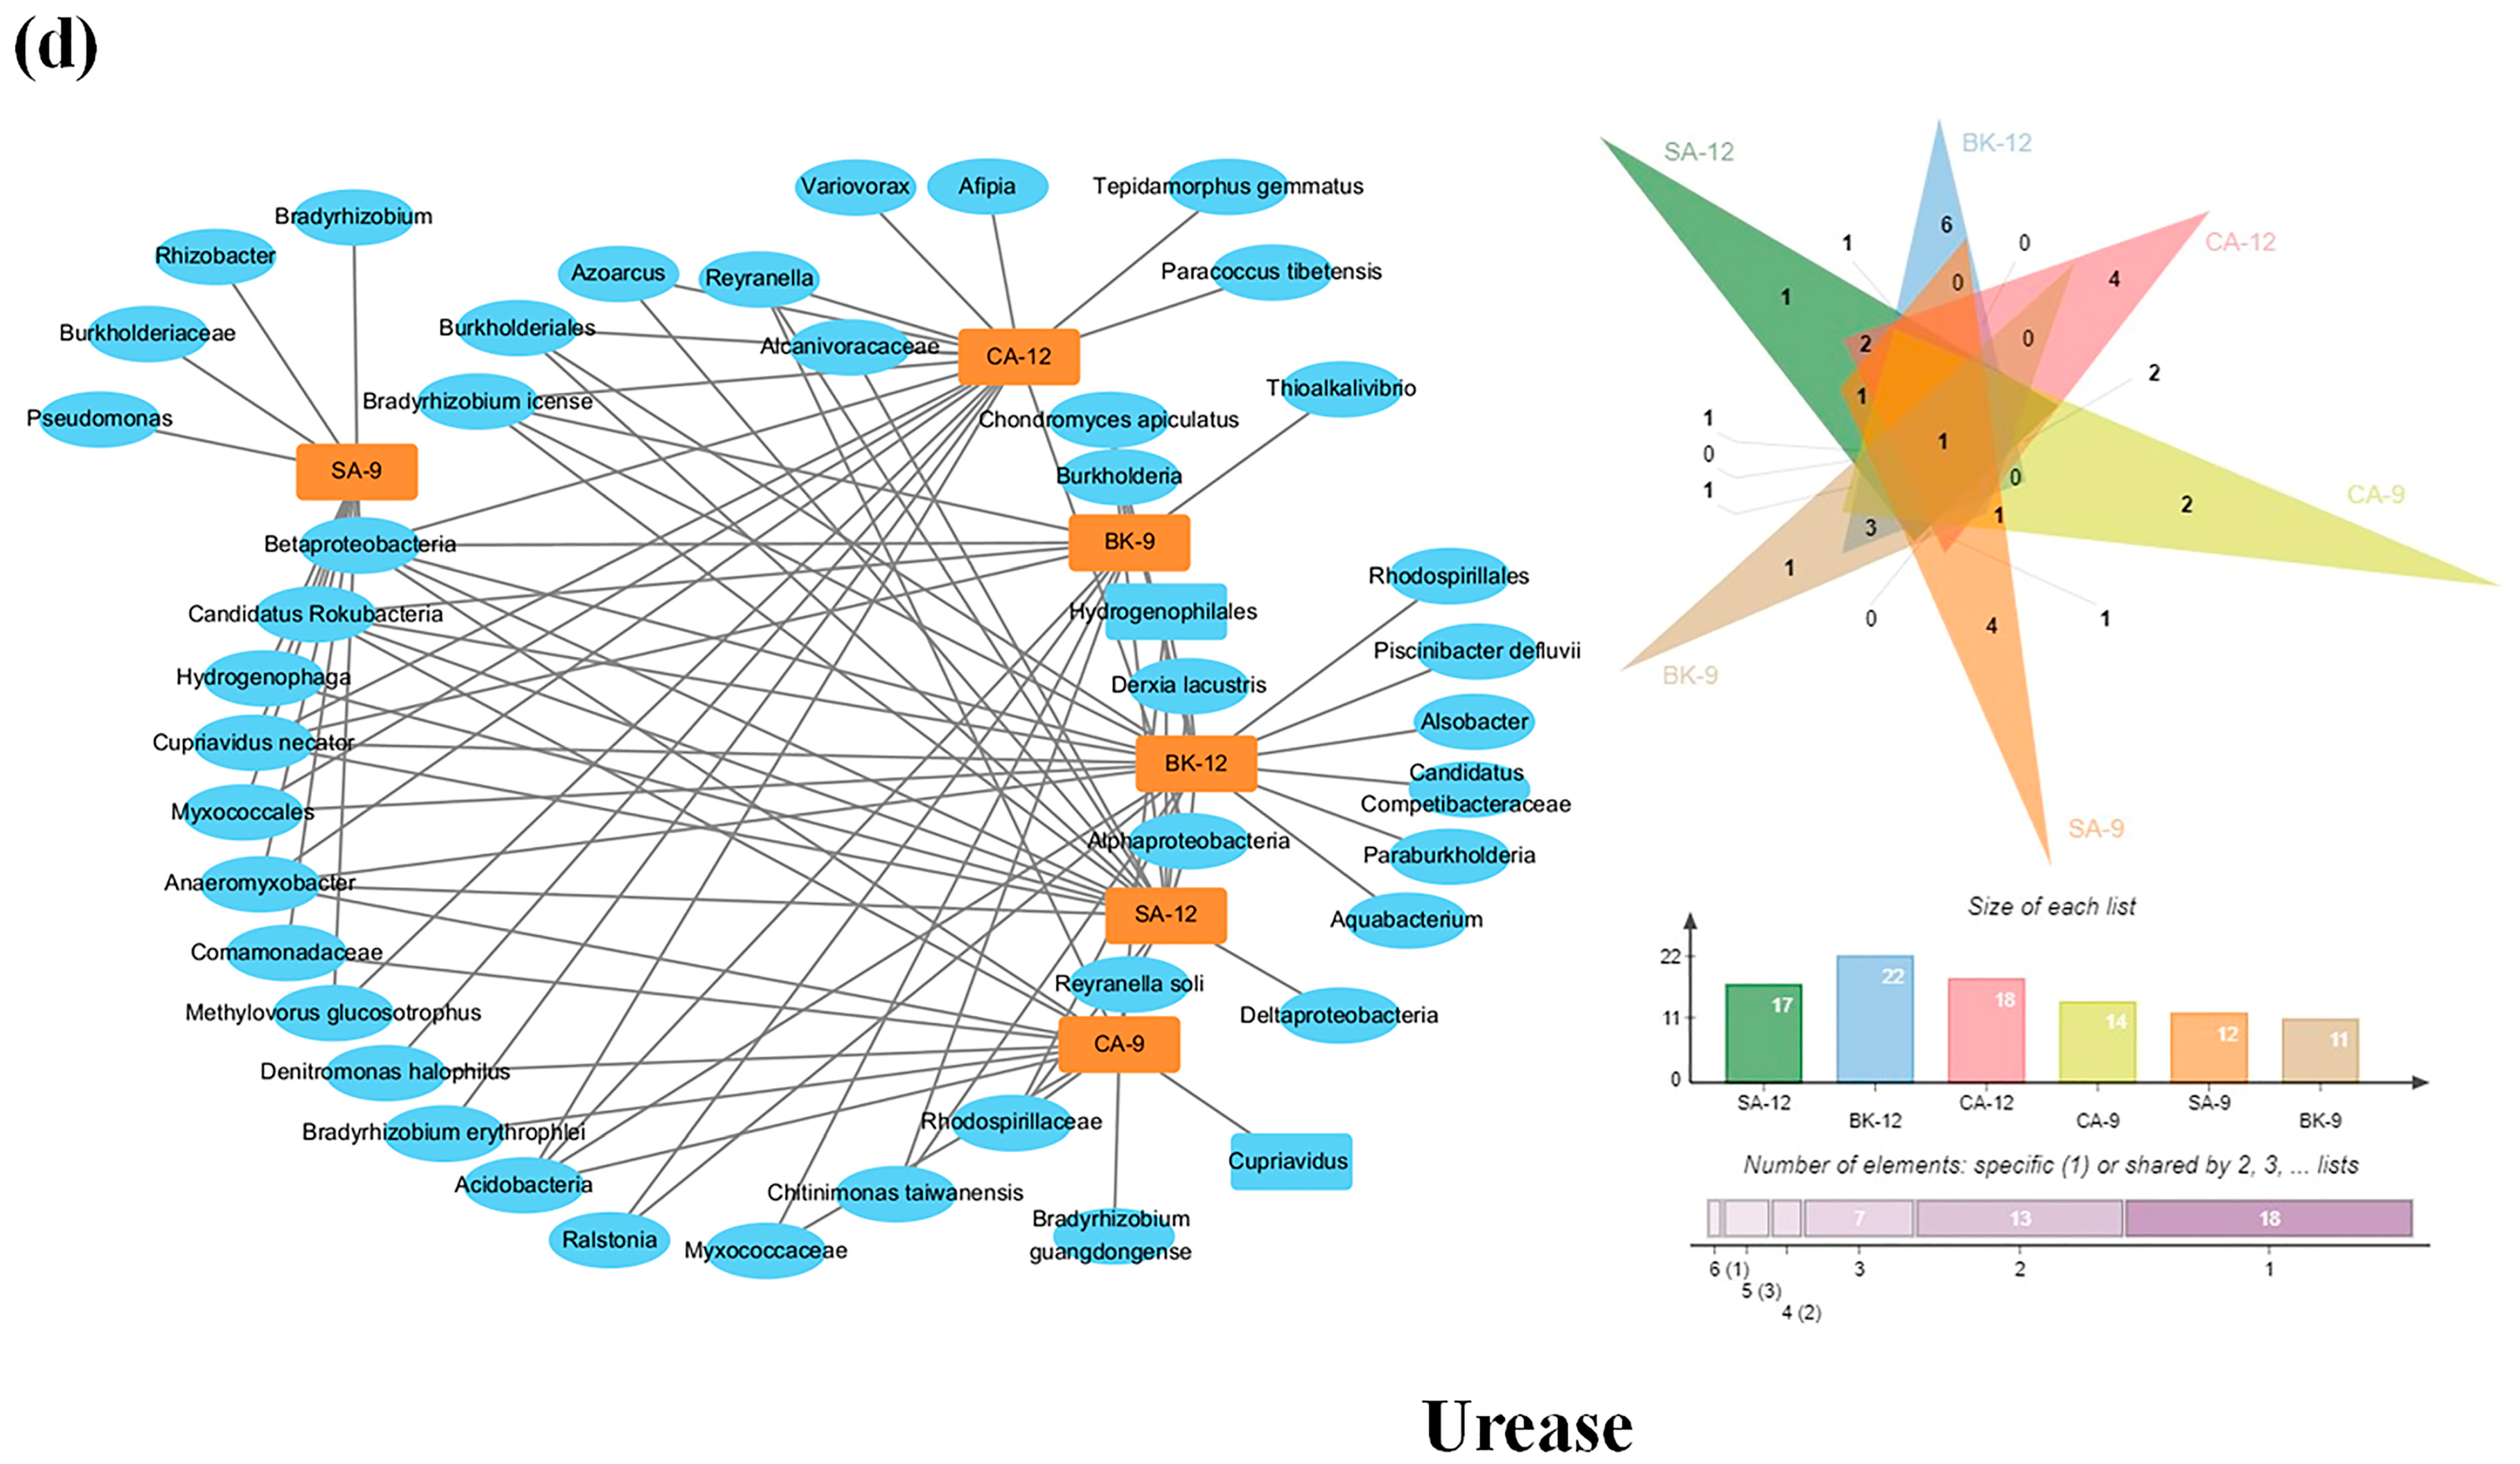
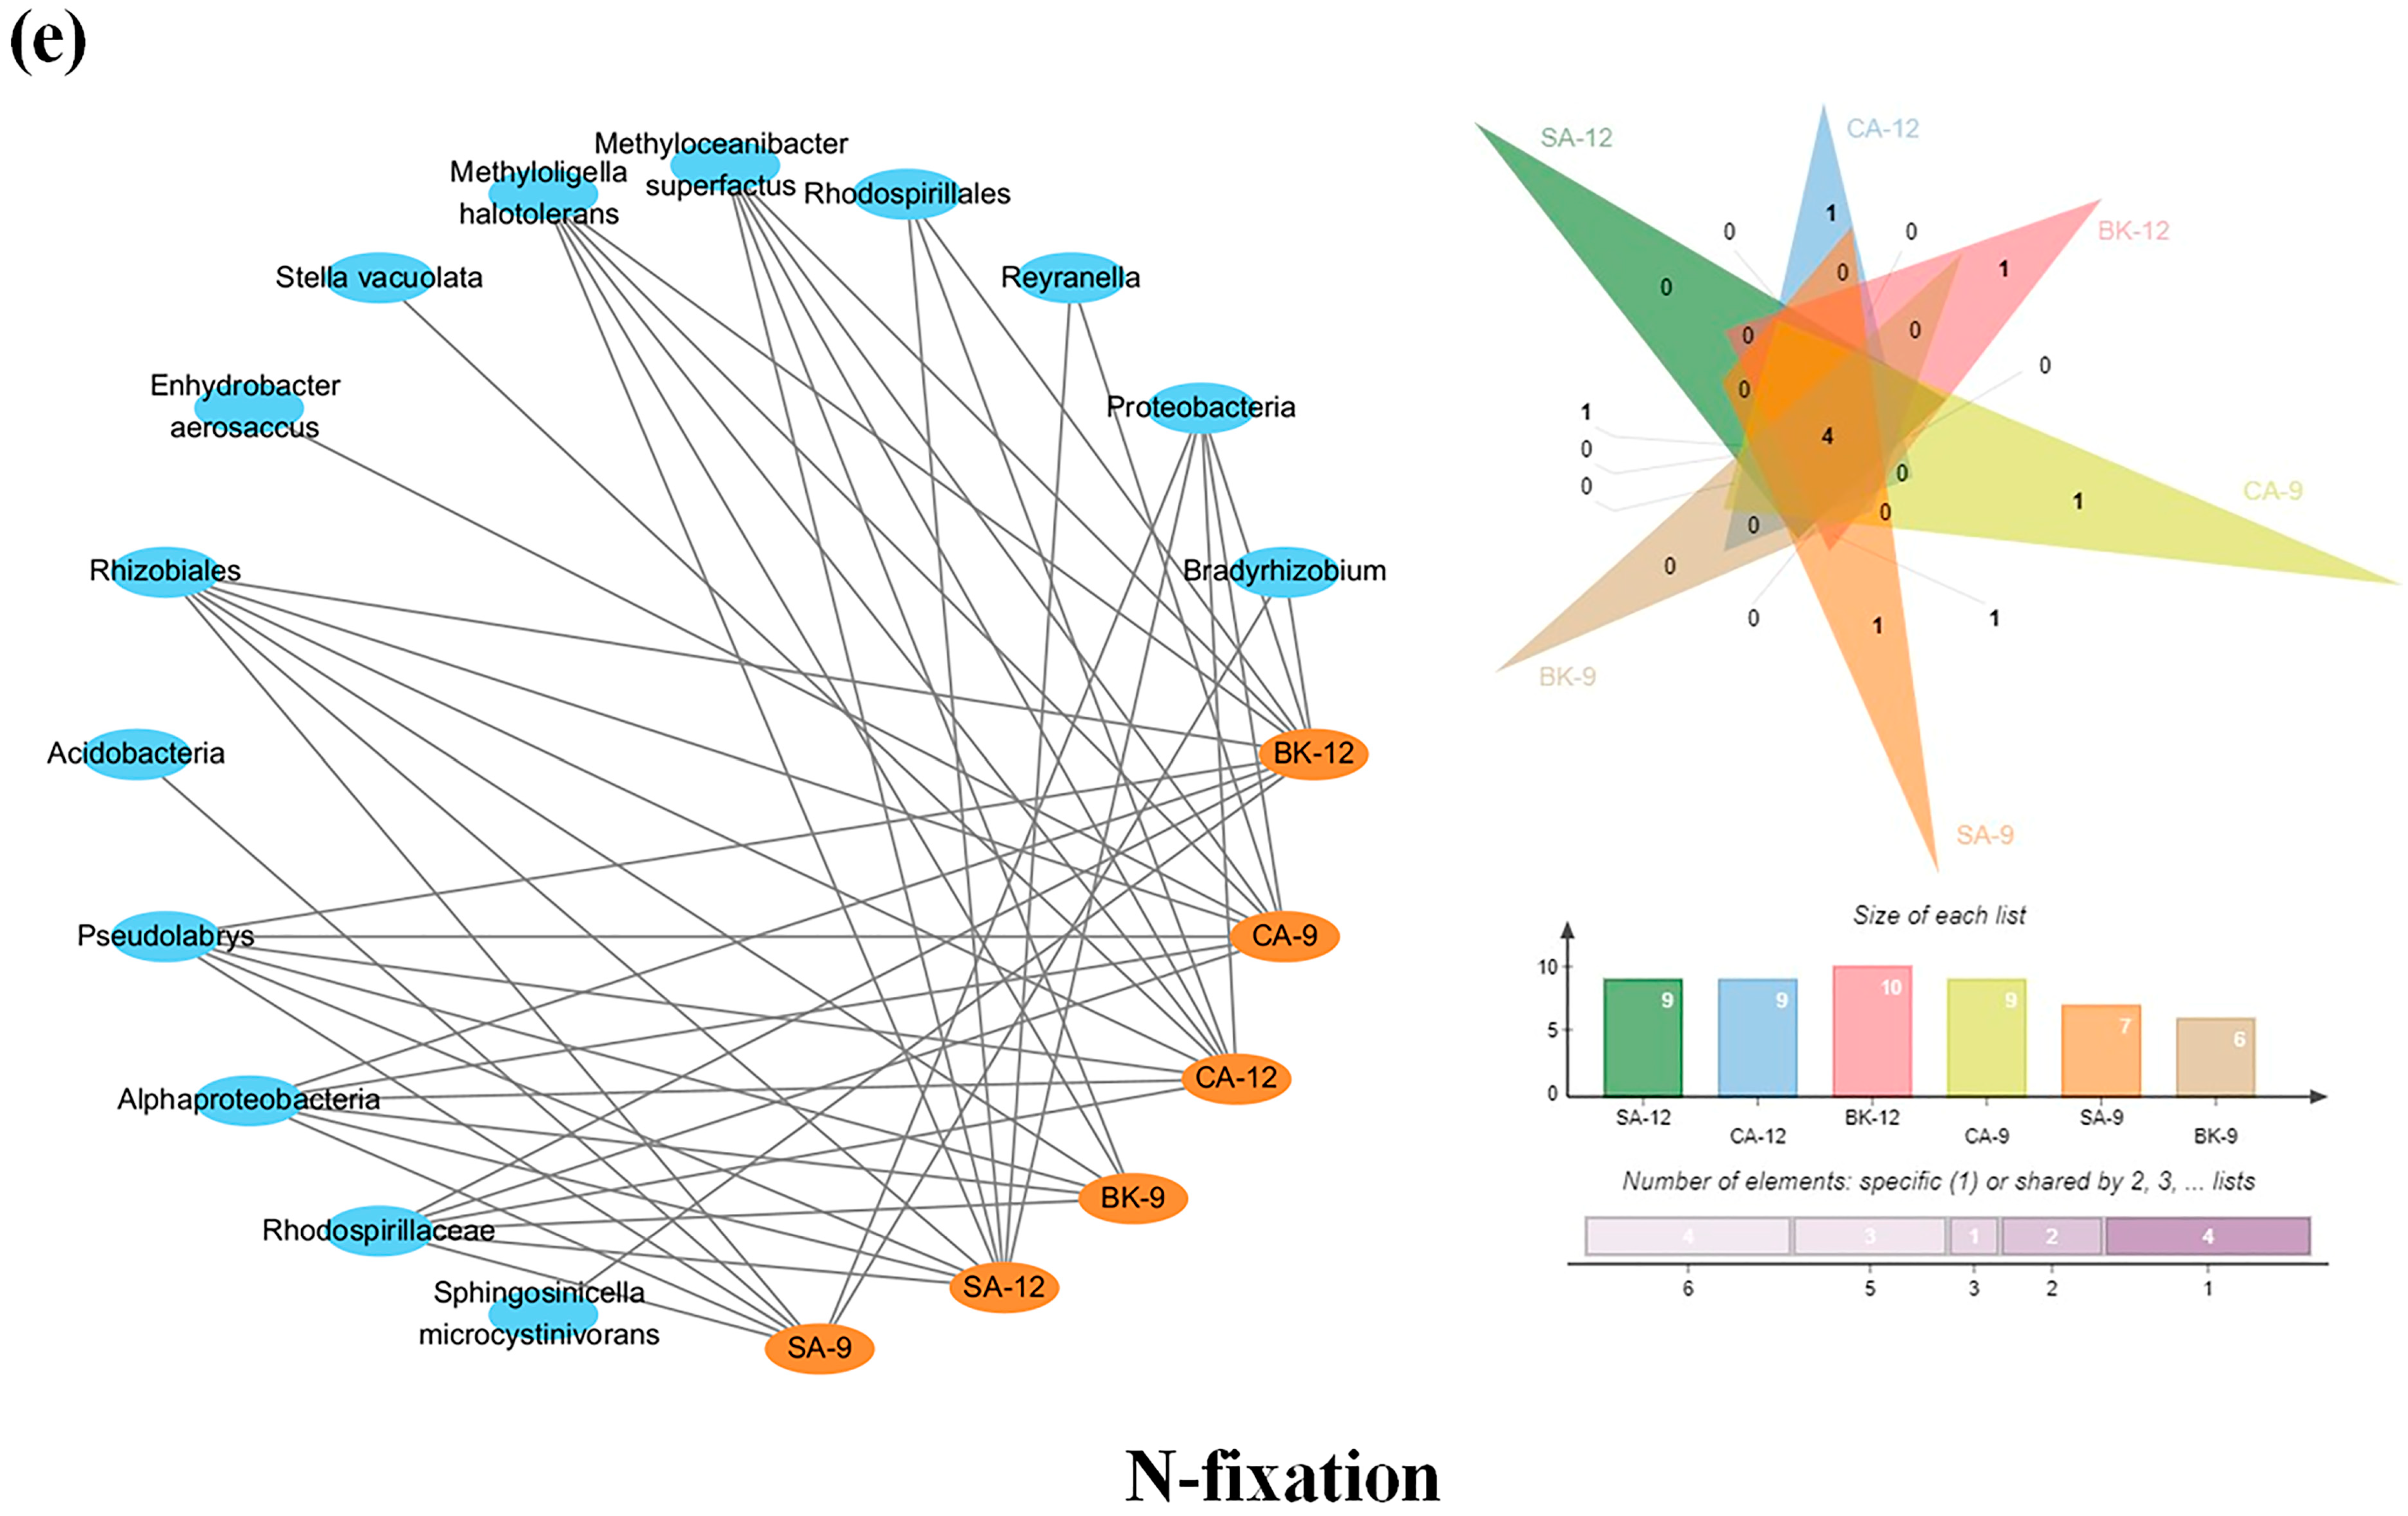
3.6. Soil Enzymes Sourced from Bacterial Diversity and Abundance

Integrating vast microbial functional gene databases with a diverse array of enzymes presents a significant challenge in the field. Further analysis utilizing the Gene Ontology (GO) database to examine the genetic origins of five distinct enzymes revealed specific species contributions. For acid phosphatase, analysis across different agricultural management practices and seasons identified Candidatus Rokubacteria and Candidatus Eisenbacteria as common contributors (Figure 9). In the soil metagenome analyses for September and December, the bacterial diversity for acid phosphatase ranked as SA > BK > CA. Arylsulfatase was found to be associated with Syntrophobacterales, Desulfobacteraceae, Betaproteobacteria, Mycolicibacterium brumae, Syntrophorhabdus, Pseudanabaena, Candidatus Jettenia caeni, Agromyces, Synechococcus, and Candidatus Brocadia as common across agricultural management practices and seasons. Under the same agricultural management, the bacterial diversity for arylsulfatase was higher in December than in September, showing a positive correlation with enzyme activity. For β-glucosidase, common contributors included Chloroflexota, Anaerolineae, Bacteroides, Anaerolineales, and Acidobacteria. Under the same agricultural management, the bacterial diversity for β-glucosidase was higher in September than in December, showing a negative correlation with enzyme activity. Urease was primarily sourced from Betaproteobacteria. In September, the bacterial diversity for urease was CA > SA > BK, while in December it was BK > CA > SA. N-fixation was commonly associated with Pseudolabrys, Rhodospirillaceae, Alphaproteobacteria, and Rhizobiales. Under the same agricultural management practices, the bacterial diversity for N-fixation was higher in December than in September.
To explore the relationship between gene abundance and soil enzyme activity, fragments per kilobase of exon model per million mapped fragments (FPKM) for five genes were calculated (Figure 10). The results indicated that under the same agricultural management practices, gene abundance varied over time, with higher frequencies of reads of arylsulfatase and N-fixation genes observed in December compared to September. When comparing gene abundance with soil enzyme activity, it was found that only arylsulfatase showed an obviously higher correlation between its FPKM values and its enzymatic activity.

4. Discussion

Excessive fertilization can indeed cause soil acidification, as observed in this study. The BK soil, which was subjected to chemical fertilization, maintained a high pH, with SA soil showing a slightly lower pH due to reduced fertilization. This was in agreement with the low EC values recorded for both BK and SA soils. Nevertheless, the CA soil, with pH values ranging from 5.75 to 6.11, did not experience the anticipated severe loss of available elements (Figure 1). In comparison with other studies, a notable trend of soil acidification in the central subtropical Chinese paddy fields has been observed over the past three decades, despite multiple-field liming practices. The application rate of chemical fertilizers, calculated on the basis of nitrogen (N), phosphorus pentoxide (P2O5), and potassium oxide (K2O), observed a logarithmic rise from an average of 274 kg per hectare per year in the 1980s to 600 kg per hectare per year in the 2010s. The average pH decreased by 0.94 units, equating to a yearly decline rate of 0.031 units from the 1980s to 2014 [25]. Moreover, the VSD+ model depicted the soil acidification in Qiyang County’s (China) non-calcareous croplands from 1985 to 2019, with the average pH in paddy soils decreasing from 6.2 to 5.4, and in upland soils from 6.2 to 5.2, at annual rates of 0.024 and 0.029 units, respectively [2]. The substantial increase in fertilizer usage, ranging from 50 to 100% since 1985, has been the driving force behind the notable decrease in topsoil pH, predominantly due to the overuse of nitrogen-based fertilizers. However, in this study, the average soil pH in 2006 was 6.64. After 12 years of varying fertilization levels, the average pH values for CA and SA soils in December 2018 were 5.75 and 6.20, respectively. The CA and SA soils exhibited an average annual decrease of 0.074 and 0.037 units, respectively. Similar patterns of soil acidification have been observed globally, particularly in regions with intensive agricultural practices because of the aggravating application of chemical fertilizers. These findings suggest that reducing fertilization can effectively mitigate soil acidification. Furthermore, to better combat soil acidification, a combination of alternative strategies alongside rational fertilization practices is essential. The increase in the pH buffering capacity of the paddy soil was facilitated by both inorganic alkalis and organic anions present in the biochars. Inorganic alkalis had a more pronounced effect in enhancing the soil’s resistance to acidification than organic anions [26].
The use of enzymes as indicators of soil quality is based on their sensitivity to soil management practices and their ease of analysis. However, relying solely on a single enzyme’s activity to assess soil fertility and plant yield is inaccurate due to the intricate nature of soil microbiological activity and the substrate specificity of individual enzymes [27]. Therefore, a series of enzymes, including β-glucosidase, phosphatase, arylsulfatase, and urease, which are integral to the cycling of key nutrients carbon, phosphorus, sulfur and nitrogen, are emphasized. These enzymes provide a more comprehensive evaluation of soil quality and are highly responsive to environmental management practices. Moreover, numerous studies have demonstrated that sampling time or seasonal change can significantly influence soil enzyme activities [28]. Our findings, including acid phosphatase, arylsulfatase, β-glucosidase, N-fixation, and Biolog EcoPlate™ activities, were consistent with previous studies based on repeated measures ANOVA analysis (Table 3 and Table 5). In our previous studies conducted in tea and lychee orchards, we found that various soil properties were influenced by agricultural management practices and seasonal variations, which in turn affected enzyme activities [29,30]. In tea plantations, acid phosphatase, arylsulfatase, and urease activities were significantly impacted not only by agricultural management but also by season variations [29]. Similarly, in lychee orchards, arylsulfatase, β-glucosidase, and urease activities were affected by both agricultural management and seasons [30]. In our recent paddy field study, we discovered that β-glucosidase and nitrogen-fixation enzyme activities were influenced by agricultural management practices and seasonal changes. Additionally, these activities were correlated with the AWCD and Shannon diversity indices derived from the Biolog EcoPlate™ analysis. It is important to note that enzyme activities can fluctuate not only in response to climatic variations but also due to the unique metabolic activities of the various crops grown in the soil [31,32]. Variations in soil enzyme activity are pivotal bioindicators for evaluating the quality and health of soil environments. For instance, shifts in the activity levels of β-glucosidase in paddy soils and lychee orchard soils, along with those of arylsulfatase in tea plantation soils, provided critical insights into the processes of soil acidification. Furthermore, β-glucosidase activity and Biolog EcoPlate™ analysis exhibited a strong correlation with the content of K and Fe (Table 2 and Table 4). This finding is consistent with ecological restoration efforts around the Chaohu Lake wetland, where Biolog EcoPlate™ analysis revealed a significant correlation between carbon utilization and K content [33]. Iron in Fe-rich peatland soil can protect soil organic carbon (SOC) from decomposition by β-glucosidase, although there is a potential for carbon loss due to the destabilization of Fe–C complexes during the biogeochemical cycling of carbon [34,35]. Thus, soil total K and Fe were identified as crucial factors affecting the efficiency of carbon source utilization across seasons. Monitoring these enzyme activities offers valuable insights into the current soil health and carries profound implications for ensuring the long-term sustainability of agricultural ecosystems.
According to the previous study via 16S rRNA gene for soil microbial community, the long-term application of a combination of chemical fertilization and organic manure had shown varied effects on the alpha diversity of soil bacterial communities. In paddy soil from Jiaxing City, Zhejiang Province, China, this combination significantly enhanced diversity indices such as Chao 1, Shannon, and ACE, compared to the control treatment with no fertilizer (Jiaxing City, Zhejiang Province, China). However, no significant differences were found between the chemical fertilization and no fertilizer treatments [36]. In another study conducted in paddy soil at the Chinese Academy of Sciences in Hunan Province, China, the Shannon–Weaver index similarly revealed no significant differences in bacterial community alpha diversity between the control and different fertilization treatments. Nevertheless, evenness was comparable between the control and organic fertilization treatments but significantly higher in treatments with both chemical and organic fertilizers [37]. From a metagenomic analysis perspective, the genetic richness of soil with chemical fertilizer application (CA) was higher than that of soil with no fertilizer (BK) or reduced fertilizer (SA) application (Figure 4). Soil diversity also exhibited seasonal differences, with higher gene diversity observed in September compared to December. This indicates that seasonal changes play a crucial role in shaping the soil microbial community diversity [38,39].
Microorganisms in soil promote the decomposition of organic matter and nutrient cycling by secreting various extracellular enzymes. The activity of these extracellular enzymes can reflect the metabolic status and functional potential of microbial communities [14]. From the perspective of gene distribution in microbial species, Sorangium cellulosum and Anaeromyxobacter sp. were the dominant species in the paddy soil (Figure 5). The myxobacterium Sorangium cellulosum, known for its cellulolytic properties, is of significant interest in drug screening and demonstrates remarkable capabilities in degrading diverse macromolecules, including lipids and polysaccharides [40,41]. Anaeromyxobacter, widely isolated from paddy soils, utilizes acetate or hydrogen as electron donors to reduce Fe(III) to Fe(II), harnessing energy for growth [42,43]. The combined proportions of Anaeromyxobacter sp. and Anaeromyxobacter dehalogenans in the soil samples from CA-9, CA-12, BK-9, BK-12, SA-9, and SA-12 exhibited distinct patterns, with percentages of 7.65%, 6.31%, 8.58%, 6.77%, 7.73%, and 6.52%, respectively. The total proportion of Anaeromyxobacter genus was higher than that of Sorangium cellulosum. Notably, the relative abundance of Anaeromyxobacter peaked in the September samples, mirroring the soil’s iron content distribution. This correlation suggests a potentially significant ecological role for this bacterial genus in the biogeochemical cycling of iron during this period (Table 1). Moreover, when reducing fertilizers (SA), the major microbial population was less susceptible to seasonal changes according to the Sankey visualization analysis (Figure S2).
The abundance of genes in soil, particularly functional genes related to nutrient cycling, provides crucial insights into microbial-mediated biogeochemical processes. Analysis using various databases to identify functional genes reveals that over 90% of the same genes were present across soils with different fertilization application. According to the CAZy database analysis, the relative content of carbohydrate-active enzymes exhibited varying trends across different soil environments. For instance, pollution by perfluorinated compounds activated glycosyl transferases (GTs) while suppressing glycoside hydrolases (GHs), thereby affecting key metabolic pathways in soil microbes [44]. Conversely, no significant effect of mercury concentration on carbon cycling was observed in soils from an agricultural floodplain [45]. In a Larix gmelinii forest soil, CAZy database analysis indicated that the majority of carbohydrate-active enzymes exhibited heightened activity during the summer with a notable suppression of activity occurring in the spring [46]. In this study, the relative abundance of carbohydrate-active enzymes was found to be higher in September than in December, underscoring the influence of seasonal variations on gene richness (Figure 6). Furthermore, categorization based on COG and GO enrichment analysis suggested that specific genes were influenced by different agricultural management practices and seasonal changes, with unique genes accounting for less than 4% of the total (Figure 7, Figure 8, Figures S3 and S4). Compared to soil enzyme activity, the genetic structure of soil showed a lower sensitivity to agricultural practices and seasonal changes. Expanding metagenomic analyses to include different soil types and climatic regions could provide a more comprehensive understanding of the global patterns of microbial-mediated biogeochemical processes.
Revealing the correlation between soil genes and enzyme activity is crucial for evaluating soil health and ecosystem function. The addition of nitrogen and phosphorus is an important factor affecting soil genes and enzyme activity. For instance, in Inner Mongolia grasslands, nitrogen addition significantly impacted soil enzyme activity and the abundance of nitrogen-cycling genes [47]. Similar correlations between soil gene abundance and enzymatic activity have been observed in studies on land-use changes from natural forests to tea plantations, as well as in acidified tea soils [15,16]. However, this study indicated that not all gene diversity and abundance were directly associated with soil enzyme activity (Figure 9). While gene diversity derived from different bacteria showed correlations between arylsulfatase and β-glucosidase with soil enzyme activity, the correlation was less consistent when considering gene abundance based on FPKM. In fact, only arylsulfatase demonstrated a positive correlation with FPKM values (Figure 10). Interestingly, the FPKM of arylsulfatase and N-fixation genes also exhibited seasonal variation, with both genes being more abundant in December than in September. This suggested that while agricultural management influenced soil enzyme activity and the diversity and abundance of genes, seasonal changes exerted an even broader impact on these factors.

5. Conclusions

In conclusion, rational fertilization of soil and crops needs to avoid nutrient surpluses or deficiencies. The application of chemical fertilizers notably modified the soil’s organic matter composition, a key determinant for carbon sequestration. This alteration implies that by satisfying the microbial demand for nitrogen (N), phosphorus (P), and potassium (K), the introduction of these nutrients could have potentially reduced the microbial demand for these elements, thereby indirectly enhancing carbon’s role as a limiting factor in the soil ecosystem. As a result, this study detected a pronounced correlation between enzyme activities associated with carbon utilization and agricultural management practices. When comparing the impacts of agricultural management and seasonal changes, the latter was found to have a more pronounced effect on soil enzyme activities and gene diversity. In paddy soil, extracellular enzymes were more reliable indicators of microbial activity than the abundance of specific microbial functional genes. It could be as a bioindicator in soil health assessments to guide management decisions. However, it is essential to recognize that agricultural management can also influence soil’s physicochemical properties, which in turn affect enzyme activity. These interactions indicate a complex interplay between different factors. While short-term seasonal fluctuations can lead to notable shifts in soil enzyme activity and gene diversity, long-term alterations in soil physicochemical properties may exert a more profound and lasting impact on soil quality. Understanding these dynamics is vital for developing sustainable agricultural practices that maintain soil health and productivity. Furthermore, additional attention must be given to the long-term impacts of climate change on the soil environment to address potential future food shortages.

Supplementary Materials

The following supporting information can be downloaded at: https://www.mdpi.com/article/10.3390/agriculture14081424/s1, Figure S1: Geographical maps of Xikou paddy farm including CA, SA, and BK managements; Figure S2: Taxonomic distribution of soil metagenome using Sankey visualization at the species level in paddy soil; Figure S3: Annotation of soil metagenome with and between agricultural management across time based on COG database through Venn diagram presentation in paddy soil; Figure S4: Annotation of soil metagenome with and between agricultural management across time based on GO database enrichment analysis through Venn diagram presentation in paddy soil; Table S1: The agricultural management practices from CA, BK, and SA agriculture between 2006–2019; Table S2: Pearson correlation between the soil properties; Table S3: Summary of metagenome sequences from soil DNA extracted from CA, BK, and SA soils in September 2018 and December 2018 according to the BGISEQ-500 analysis.

Author Contributions

Conceptualization, Y.-P.C. and C.-C.Y.; methodology, Y.-P.C., H.-Y.H. and C.-F.T.; software, H.-Y.H.; validation, Y.-P.C. and H.-Y.H.; formal analysis, C.-F.T.; investigation, Y.-P.C., H.-Y.H. and C.-F.T.; resources, C.-C.Y.; data curation, Y.-P.C.; writing—original draft preparation, Y.-P.C.; writing—review and editing, Y.-P.C., H.-Y.H. and C.-C.Y.; visualization, Y.-P.C.; supervision, C.-C.Y.; project administration, C.-C.Y.; funding acquisition, C.-C.Y. All authors have read and agreed to the published version of the manuscript.

Funding

This research was funded by the Ministry of Science and Technology, Taiwan (Grant 109-2621-M-005-006), and the Innovation and Development Center of Sustainable Agriculture from The Featured Areas Research Center Program within the framework of the Higher Education Sprout Project by the Ministry of Education (MOE) in Taiwan.

Institutional Review Board Statement

Not applicable.

Data Availability Statement

Data will be made available on request.

Acknowledgments

We would like to thank the Taiwan Agricultural Research Institute, Ministry of Agriculture, and Chiayi Agricultural Experiment Branch for the paddy field site and data support.

Conflicts of Interest

The authors declare no conflicts of interest.

References

  1. Porter, J.R.; Challinor, A.J.; Henriksen, C.B.; Howden, S.M.; Martre, P.; Smith, P. Invited review: Intergovernmental panel on climate change, agriculture, and food-A case of shifting cultivation and history. Glob. Change Biol. 2019, 25, 2518–2529. [Google Scholar] [CrossRef]
  2. Xu, D.; Ros, G.H.; Zhu, Q.; Xu, M.; Wen, S.; Cai, Z.; Zhang, F.; de Vries, W. Major drivers of soil acidification over 30 years differ in paddy and upland soils in China. Sci. Total Environ. 2024, 916, 170189. [Google Scholar] [CrossRef]
  3. Jimma, T.B.; Chemura, A.; Spillane, C.; Demissie, T.; Abera, W.; Ture, K.; Terefe, T.; Solomon, D.; Gleixner, S. Coupled impacts of soil acidification and climate change on future crop suitability in Ethiopia. Sustainability 2024, 16, 1468. [Google Scholar] [CrossRef]
  4. Gupta, A.; Singh, U.B.; Sahu, P.K.; Paul, S.; Kumar, A.; Malviya, D.; Singh, S.; Kuppusamy, P.; Singh, P.; Paul, D.; et al. Linking soil microbial diversity to modern agriculture practices: A review. Int. J. Environ. Res. Public Health 2022, 19, 3141. [Google Scholar] [CrossRef]
  5. Nie, X.; Duan, X.; Zhang, M.; Zhang, Z.; Liu, D.; Zhang, F.; Wu, M.; Fan, X.; Yang, L.; Xia, X. Cadmium accumulation, availability, and rice uptake in soils receiving long-term applications of chemical fertilizers and crop straw return. Environ. Sci. Pollut. Res. 2019, 26, 31243–31253. [Google Scholar] [CrossRef] [PubMed]
  6. Xu, Y.; Tang, H.; Liu, T.; Li, Y.; Huang, X.; Pi, J. Effects of long-term fertilization practices on heavy metal cadmium accumulation in the surface soil and rice plants of double-cropping rice system in Southern China. Environ. Sci. Pollut. Res. 2018, 25, 19836–19844. [Google Scholar] [CrossRef] [PubMed]
  7. Wang, J.; Liu, G.; Cui, N.; Liu, E.; Zhang, Y.; Liu, D.; Ren, X.; Jia, Z.; Zhang, P. Suitable fertilization can improve maize growth and nutrient utilization in ridge-furrow rainfall harvesting cropland in semiarid area. Front. Plant Sci. 2023, 14, 1198366. [Google Scholar] [CrossRef]
  8. Jin, X.; Cai, J.; Yang, S.; Li, S.; Shao, X.; Fu, C.; Li, C.; Deng, Y.; Huang, J.; Ruan, Y.; et al. Partial substitution of chemical fertilizer with organic fertilizer and slow-release fertilizer benefits soil microbial diversity and pineapple fruit yield in the tropics. Appl. Soil Ecol. 2023, 189, 104974. [Google Scholar] [CrossRef]
  9. Jiang, M.; Dong, C.; Bian, W.; Zhang, W.; Wang, Y. Effects of different fertilization practices on maize yield, soil nutrients, soil moisture, and water use efficiency in northern China based on a meta-analysis. Sci. Rep. 2024, 14, 6480. [Google Scholar] [CrossRef]
  10. Sun, L.; Wang, R.; Li, J.; Wang, Q.; Lyu, W.; Wang, X.; Cheng, K.; Mao, H.; Zhang, X. Reasonable fertilization improves the conservation tillage benefit for soil water use and yield of rain-fed winter wheat: A case study from the Loess Plateau, China. Field Crops Res. 2019, 242, 107589. [Google Scholar] [CrossRef]
  11. Hu, K.; Zhao, P.; Wu, K.; Yang, H.; Yang, Q.; Fan, M.; Long, G. Reduced and deep application of controlled-release urea maintained yield and improved nitrogen-use efficiency. Field Crops Res. 2023, 295, 108876. [Google Scholar] [CrossRef]
  12. Lian, Y.; Ali, S.; Zhang, X.; Wang, T.; Liu, Q.; Jia, Q.; Jia, Z.; Han, Q. Nutrient and tillage strategies to increase grain yield and water use efficiency in semi-arid areas. Agri. Water Manag. 2016, 178, 137–147. [Google Scholar] [CrossRef]
  13. Wang, Y.; Huang, C.; Liu, M.; Yuan, L. Long-term application of manure reduced nutrient leaching under heavy N deposition. Nutr. Cycl. Agroecosyst. 2021, 119, 153–162. [Google Scholar] [CrossRef]
  14. Chen, J.; Sinsabaugh, R.L. Linking microbial functional gene abundance and soil extracellular enzyme activity: Implications for soil carbon dynamics. Glob. Change Biol. 2021, 27, 1322–1325. [Google Scholar] [CrossRef]
  15. Zhang, H.; Fang, Y.; Chen, Y.; Li, Y.; Lin, Y.; Wu, J.; Cai, Y.; Chang, S.X. Enhanced soil potential N2O emissions by land-use change are linked to AOB-amoA and nirK gene abundances and denitrifying enzyme activity in subtropics. Sci. Total Environ. 2022, 850, 158032. [Google Scholar] [CrossRef]
  16. Lin, S.; Liu, Z.; Wang, Y.; Li, J.; Wang, G.; Ye, J.; Wang, H.; He, H. Soil metagenomic analysis on changes of functional genes and microorganisms involved in nitrogen-cycle processes of acidified tea soils. Front. Plant Sci. 2022, 13, 998178. [Google Scholar] [CrossRef] [PubMed]
  17. Liu, Y.; Shen, K.; Wu, Y.; Wang, G. Abundance and structure composition of nirK and nosZ genes as well as denitrifying activity in heavy metal-polluted paddy soils. Geomicrobiol. J. 2018, 35, 100–107. [Google Scholar] [CrossRef]
  18. Wei, X.; Hu, Y.; Peng, P.; Zhu, Z.; Atere, C.T.; O’Donnell, A.G.; Wu, J.; Ge, T. Effect of P stoichiometry on the abundance of nitrogen-cycle genes in phosphorus-limited paddy soil. Biol. Fert. Soils 2017, 53, 767–776. [Google Scholar] [CrossRef]
  19. Ho, I. Acid phosphatase activity in forest soil. Forest Sci. 1979, 25, 567–568. [Google Scholar] [CrossRef]
  20. Tabatabai, M.A.; Bremner, J.M. Arylsulfatase activity of soils. Soil Sci. Soc. Am. J. 1970, 34, 225–229. [Google Scholar] [CrossRef]
  21. Eivazi, F.; Tabatabai, M.A. Glucosidases and galactosidases in soils. Soil Biol. Biochem. 1988, 20, 601–606. [Google Scholar] [CrossRef]
  22. Hardy, R.W.F.; Burns, R.C.; Holsten, R.D. Application of acetylene reduction assay for measurement of nitrogen fixation. Soil Biol. Biochem. 1973, 5, 47–81. [Google Scholar] [CrossRef]
  23. Martin, M. Cutadapt removes adapter sequences from high-throughput sequencing reads. EMBnet J. 2011, 17, 10–12. [Google Scholar] [CrossRef]
  24. Wood, D.E.; Salzberg, S.L. Kraken: Ultrafast metagenomic sequence classification using exact alignments. Genome Biol. 2014, 15, R46. [Google Scholar] [CrossRef]
  25. Zhu, H.; Chen, C.; Xu, C.; Zhu, Q.; Huang, D. Effects of soil acidification and liming on the phytoavailability of cadmium in paddy soils of central subtropical China. Environ. Pollut. 2016, 219, 99–106. [Google Scholar] [CrossRef]
  26. He, X.; Lu, H.-l.; Wu, C.-m.; Xu, R.-k. Effects of inorganic alkalis and organic anions in biochars on acidic paddy soil resistance to acidification. J. Soils Sediments 2022, 22, 1201–1213. [Google Scholar] [CrossRef]
  27. Adetunji, A.T.; Lewu, F.B.; Mulidzi, R.; Ncube, B. The biological activities of β-glucosidase, phosphatase and urease as soil quality indicators: A review. J. Soil Sci. Plant Nut. 2017, 17, 794–807. [Google Scholar] [CrossRef]
  28. Adetunji, A.T.; Ncube, B.; Meyer, A.H.; Olatunji, O.S.; Mulidzi, R.; Lewu, F.B. Soil pH, nitrogen, phosphatase and urease activities in response to cover crop species, termination stage and termination method. Heliyon 2021, 7, e05980. [Google Scholar] [CrossRef] [PubMed]
  29. Chen, Y.-P.; Tsai, C.-F.; Rekha, P.D.; Ghate, S.D.; Huang, H.-Y.; Hsu, Y.-H.; Liaw, L.-L.; Young, C.-C. Agricultural management practices influence the soil enzyme activity and bacterial community structure in tea plantations. Bot. Stud. 2021, 62, 8. [Google Scholar] [CrossRef]
  30. Chen, Y.-P.; Tsai, C.-F.; Hameed, A.; Chang, Y.-J.; Young, C.-C. Agricultural management and cultivation period alter soil enzymatic activity and bacterial diversity in litchi (Litchi chinensis Sonn.) orchards. Bot. Stud. 2021, 62, 13. [Google Scholar] [CrossRef]
  31. Zhu, J.; Qu, B.; Li, M. Phosphorus mobilization in the Yeyahu Wetland: Phosphatase enzyme activities and organic phosphorus fractions in the rhizosphere soils. Int. Biodeter. Biodegr. 2017, 124, 304–313. [Google Scholar] [CrossRef]
  32. Puissant, J.; Jassey, V.E.J.; Mills, R.T.E.; Robroek, B.J.M.; Gavazov, K.; De Danieli, S.; Spiegelberger, T.; Griffiths, R.; Buttler, A.; Brun, J.-J.; et al. Seasonality alters drivers of soil enzyme activity in subalpine grassland soil undergoing climate change. Soil Biol. Biochem. 2018, 124, 266–274. [Google Scholar] [CrossRef]
  33. Zhen, T.; Fan, W.; Wang, H.; Cao, X.; Xu, X. Monitoring soil microorganisms with community-level physiological profiles using biolog EcoPlates™ in Chaohu lakeside wetland, east China. Eurasian Soil Sci. 2020, 53, 1142–1153. [Google Scholar] [CrossRef]
  34. Wang, Y.; Wang, H.; He, J.S.; Feng, X. Iron-mediated soil carbon response to water-table decline in an alpine wetland. Nat. Commun. 2017, 8, 15972. [Google Scholar] [CrossRef]
  35. Li, R.; Luo, H.; Luo, L.; He, Y.; Deng, S.; Huang, C.; Deng, O.; Tang, X. Iron additions accelerate carbon loss from drained soil but promote carbon accumulation in waterlogged soil of Zoige plateau peatland. Int. Biodeter. Biodegr. 2024, 190, 105782. [Google Scholar] [CrossRef]
  36. Zhao, X.; Li, J.; Hu, X.; Hu, B.; Chu, G.; Tao, R. Three decades of organic manure and chemical fertilizers co-application enhanced rice productivity through increasing the diversity and key network module of soil bacterial community. J. Soils Sediments 2023, 23, 2175–2188. [Google Scholar] [CrossRef]
  37. Ding, L.-J.; Su, J.-Q.; Sun, G.-X.; Wu, J.-S.; Wei, W.-X. Increased microbial functional diversity under long-term organic and integrated fertilization in a paddy soil. Appl. Microbiol. Biot. 2018, 102, 1969–1982. [Google Scholar] [CrossRef]
  38. Daraz, U.; Erhunmwunse, A.S.; Dubeux, J.C.B.; Mackowiak, C.; Guerra, V.A.; Hsu, C.-M.; Ma, J.; Li, Y.; Yang, X.; Liao, H.-L.; et al. Soil bacterial communities across seven rhizoma peanut cultivars (Arachis glabrata Benth.) respond to seasonal variation. Microb. Ecol. 2023, 86, 2703–2715. [Google Scholar] [CrossRef]
  39. Wang, M.; Sun, M.; Zhao, Y.; Shi, Y.; Sun, S.; Wang, S.; Zhou, Y.; Chen, L. Seasonal changes of soil microbiota and its association with environmental factors in coal mining subsidence area. AMB Express 2023, 13, 147. [Google Scholar] [CrossRef]
  40. Jiang, D.M.; Zhao, L.; Zhang, C.Y.; Li, J.; Xia, Z.J.; Wang, J.; Wu, Z.H.; Li, Y.Z. Taxonomic analysis of Sorangium strains based on HSP60 and 16S rRNA gene sequences and morphology. Int. J. Syst. Evol. Microbiol. 2008, 58, 2654–2659. [Google Scholar] [CrossRef]
  41. Yuan, S.F.; Yue, X.J.; Hu, W.F.; Wang, Y.; Li, Y.Z. Genome-wide analysis of lipolytic enzymes and characterization of a high-tolerant carboxylesterase from Sorangium cellulosum. Front. Microbiol. 2023, 14, 1304233. [Google Scholar] [CrossRef]
  42. Wang, K.; Jia, R.; Li, L.; Jiang, R.; Qu, D. Community structure of Anaeromyxobacter in Fe(III) reducing enriched cultures of paddy soils. J. Soils Sediments 2020, 20, 1621–1631. [Google Scholar] [CrossRef]
  43. Itoh, H.; Xu, Z.; Mise, K.; Masuda, Y.; Ushijima, N.; Hayakawa, C.; Shiratori, Y.; Senoo, K. Anaeromyxobacter oryzae sp. nov., Anaeromyxobacter diazotrophicus sp. nov. and Anaeromyxobacter paludicola sp. nov., isolated from paddy soils. Int. J. Syst. Evol. Microbiol. 2022, 72, 005546. [Google Scholar] [CrossRef] [PubMed]
  44. Cai, Y.; Chen, H.; Yuan, R.; Wang, F.; Chen, Z.; Zhou, B. Metagenomic analysis of soil microbial community under PFOA and PFOS stress. Environ. Res. 2020, 188, 109838. [Google Scholar] [CrossRef] [PubMed]
  45. Frey, B.; Rast, B.M.; Qi, W.; Stierli, B.; Brunner, I. Long-term mercury contamination does not affect the microbial gene potential for C and N cycling in soils but enhances detoxification gene abundance. Front. Microbiol. 2022, 13, 1034138. [Google Scholar] [CrossRef]
  46. Bao, T.; Deng, S.; Yu, K.; Li, W.; Dong, A. Metagenomic insights into seasonal variations in the soil microbial community and function in a Larix gmelinii forest of Mohe, China. J. For. Res. 2021, 32, 371–383. [Google Scholar] [CrossRef]
  47. Xiao, H.; Yang, H.; Zhao, M.; Monaco, T.A.; Rong, Y.; Huang, D.; Song, Q.; Zhao, K.; Wang, D. Soil extracellular enzyme activities and the abundance of nitrogen-cycling functional genes responded more to N addition than P addition in an Inner Mongolian meadow steppe. Sci. Total Environ. 2021, 759, 143541. [Google Scholar] [CrossRef]
Figure 1. Soil properties including pH, EC, total nitrogen and organic matter in paddy soil. CA-9, BK-9, and SA-9 indicated the soil collected in September 2018. CA-12, BK-12, and SA-12 indicated the soil collected in December 2018. Results are shown as mean ± standard deviation. Significance is labeled by the different letters at columns according to Duncan’s test (p < 0.05).
Agriculture 14 01424 g001
Figure 2. Soil enzyme activity including acid phosphatase, arylsulfatase, β-glucosidase, urease, and N-fixing activities in paddy soil. CA-9, BK-9, and SA-9 indicated the soil collected in September 2018. CA-12, BK-12, and SA-12 indicated the soil collected in December 2018. Results are shown as mean ± standard deviation. Significance is labeled by the different letters at columns according to Duncan’s test (p < 0.05).
Agriculture 14 01424 g002
Figure 3. Soil Biolog EcoPlate™ analysis in paddy soil. CA-9, BK-9, and SA-9 indicated the soil collected in September 2018. CA-12, BK-12, and SA-12 indicated the soil collected in December 2018. Results are shown as mean ± standard deviation. Significance is labeled by the different letters at columns according to Duncan’s test (p < 0.05).
Agriculture 14 01424 g003
Figure 4. Alpha diversity of soil metagenome including observed OUT, ACE, Chao1, Shannon, and Simpson indices in paddy soil. CA-9, BK-9, and SA-9 indicated the soil collected in September 2018. CA-12, BK-12, and SA-12 indicated the soil collected in December 2018.
Agriculture 14 01424 g004
Figure 5. Taxonomic distribution of soil metagenome at the phylum (a) and species (b) levels in paddy soil. CA-9, BK-9, and SA-9 indicated the soil collected in September 2018. CA-12, BK-12, and SA-12 indicated the soil collected in December 2018.
Agriculture 14 01424 g005
Figure 6. Carbohydrate-active enzymes distribution of soil metagenome based on CAZy database in paddy soil. CA-9, BK-9, and SA-9 indicated the soil collected in September 2018. CA-12, BK-12, and SA-12 indicated the soil collected in December 2018. PL, GT, GH, CE, CBM, and AA indicated Polysaccharide Lyases, Glycosyl Transferases, Glycoside Hydrolases, Carbohydrate Esterases, Carbohydrate-Binding Modules, and Auxiliary Activities, respectively (a). The detailed carbohydrate-active enzyme families were present (b).
Agriculture 14 01424 g006
Figure 7. Annotation of soil metagenome based on COG database (a) and identification of unique genes through Venn diagram presentation (b) in paddy soil.
Agriculture 14 01424 g007
Figure 8. Annotation of soil metagenome based on GO database enrichment analysis and identification of unique genes through Venn diagram analysis in paddy soil.
Agriculture 14 01424 g008
Figure 9. Analysis of soil enzymes (acid phosphatase (a), arylsulfatase (b), β-glucosidase (c), urease (d), and N-fixation(e)) across different agricultural management practices over time using the GO database to link microbial taxonomy.
Agriculture 14 01424 g009aAgriculture 14 01424 g009bAgriculture 14 01424 g009cAgriculture 14 01424 g009dAgriculture 14 01424 g009e
Figure 10. Fragments per kilobase of exon model per million mapped fragments (FPKM) analysis for reads of five genes including acid phosphatase, arylsulfatase, β-glucosidase, urease, and N-fixation.
Agriculture 14 01424 g010
Table 1. Extractable elements of paddy soils. The extractable elements from the CA, BK, and SA soils were determined by ICP-OES. CA-9, BK-9, and SA-9 indicated the soil collected in September 2018. CA-12, BK-12, and SA-12 indicated the soil collected in December 2018.
SoilsPKCaMgFeMnCuZn
mg/kg Soil
CA-927.62 a86.35 a1626.32 a214.49 a1028.86 a131.85 a0.75 a1.14 c
CA-1216.68 b59.25 b1601.28 a216.24 a852.72 b49.55 b0.65 a3.75 b
BK-914.34 b54.44 bc1492.46 a187.92 a1103.58 a137.40 a1.18 a1.31 c
BK-1210.91 b45.60 c1560.92 a195.19 a909.85 b50.90 b1.05 a3.36 b
SA-912.16 b61.50 b1714.49 a262.53 a1074.20 a154.15 a0.93 a1.62 c
SA-126.75 b54.74 bc1784.36 a279.55 a865.28 b77.32 b0.94 a4.32 a
Significance is labeled by the different letters at columns according to Duncan’s test (p < 0.05).
Table 2. Pearson correlation between soil enzyme activity and soil property.
pHECTotal NO.M.PKCaFe
Acid phosphatase−0.708 **0.609 **0.2290.0910.1480.1610.021−0.507 *
Arylsulfatase−0.0790.3410.4590.691 **−0.630 **−0.3630.694 **−0.721 **
β-Glucosidase−0.0040.0600.0790.273−0.453−0.484 *0.236−0.843 **
Urease0.515 *−0.3900.2490.105−0.640 **−0.534 *0.3800.031
N-fixation0.574 *−0.362−0.179−0.029−0.179−0.488 *−0.070−0.104
Significance is indicated by ** p-value < 0.01, and * p-value < 0.05.
Table 3. Statistical significance (p-value) for repeated measures ANOVA on acid phosphatase, arylsulfatase, β-glucosidase, urease, and nitrogen-fixing activity.
Model TermEnzymatic Activity
Acid PhosphataseArylsulfataseβ-GlucosidaseUreaseN-Fixation
FpFpFpFpFp
Test of within-subjects effects
Time8.1450.011 *74.001<0.001 **200.371<0.001 **0.0770.78412.7670.002 **
Time × Management2.3210.1272.60.1028.0510.003 **1.7280.20623.355<0.001 **
Test of between-subjects effects
Intercept10,792.035<0.001 **226.756<0.001 **2014.698<0.001 **387.223<0.001 **92.288<0.001 **
Management68.01<0.001 **3.1860.0650.8180.4576.3330.008 *12.326<0.001 **
Significance is indicated by ** p-value < 0.01, and * p-value < 0.05.
Table 4. Pearson correlation between soil Biolog EcoPlate™ and soil property.
pHECTotal NO.M.PKCaFe
Richness−0.2060.044−0.0970.115−0.443−0.548 *0.096−0.875 **
AWCD−0.3520.1910.0080.140−0.399−0.4380.163−0.910 **
Shannon−0.2140.034−0.1470.057−0.405−0.543 *0.047−0.863 **
Significance is indicated by ** p-value < 0.01, and * p-value < 0.05.
Table 5. Statistical significance (p-value) for repeated measures ANOVA on Biolog EcoPlate™ analysis.
Model TermBiolog
RichnessAWCDShannon
FpFpFp
Test of within-subjects effects
Time212.180<0.001 **771.930<0.001 **232.802<0.001 **
Time × Management1.3400.33024.8670.001 **3.0490.122
Test of between-subjects effects
Intercept5163.559<0.001 **2411.997<0.001 **66,412.047<0.001 **
Management0.2060.8191.8830.2320.6320.564
Significance is indicated by ** p-value < 0.01.
Disclaimer/Publisher’s Note: The statements, opinions and data contained in all publications are solely those of the individual author(s) and contributor(s) and not of MDPI and/or the editor(s). MDPI and/or the editor(s) disclaim responsibility for any injury to people or property resulting from any ideas, methods, instructions or products referred to in the content.

