Article

Utilizing Principal Component Analysis to Assess the Effects of Complex Foliar Fertilizers Regarding Maize (Zea mays L.) Productivity

1
Faculty of Agriculture, University of Life Sciences “King Michael I” from Timișoara (U.L.S.T.), 300645 Timișoara, Romania
2
I.N.M.A., 013813 București, Romania
*
Author to whom correspondence should be addressed.
Agriculture 2024, 14(8), 1428; https://doi.org/10.3390/agriculture14081428
Submission received: 25 June 2024 / Revised: 16 August 2024 / Accepted: 20 August 2024 / Published: 22 August 2024
(This article belongs to the Special Issue Foliar Fertilization for Sustainable Crop Production)

Abstract

:
This study sought to determine the effects of foliar fertilization (FF) on both the quantity and quality of maize grains using principal component analysis (PCA). This chemometric approach enabled the selection of the best foliar treatment model for enhancing maize yield and quality. The results were analyzed via PCA, providing valuable insights into identifying the FF recipe with the greatest influence on maize grain production and quality. These field experiments were run during the time period 2020–2022 in the university’s experimental field. Seven experimental variants with three repetitions were tested, including a control group and various FF formulations labeled V1 through V7, each with different chemical compositions. FF applications were conducted during specific vegetative phases of the maize, respectively, in stages 15–16 BBCH (5–6 unfolded leaves) and 20–22 BBCH (10–12 unfolded leaves), with application rates varying from 2 to 6 Lha1 according to the product’s chemical properties. The application of FF treatments positively impacted both the production and quality of maize grains, as evidenced by specific quality indices such as moisture, protein, lipid, carbohydrate, fiber, and mineral content.

1. Introduction

Maize (Zea mays L.) is the second-largest arable crop worldwide. Due to its great adaptability, this culture occupies considerable areas not only in Romania [1] but also in Europe [2] and other countries in the world [3].
In 2021, Romania occupied first place in Europe both in cultivated area, 2,493,000 hectares and in production, 14,445,000 tons [2]. Maize culture has attracted and will always attract increased economic interest, both agricultural and industrial, in different countries, including Romania, which present excellent pedoclimatic conditions for this [1]. In the last three decades, maize cultivation in Romania has consistently occupied at least 2 million hectares. Moreover, within this period, the cultivated area exceeded 3 million hectares on several occasions, with a peak of 3.3 million hectares in 1992, which remains the record to date [4]. Maize is both a vital source of food for both humans and animals, and an important source of energy for obtaining ecological fuel. Contemporary agriculture depends heavily on the widespread use of fertilizers to achieve high-quality yields while minimizing costs. The efficiency of nitrogen (N), phosphorus (P), and potassium (K) fertilizers in agriculture must be enhanced. Farmers are increasingly mandated by law to reduce mineral soil fertilization to protect the environment and preserve its ecological and chemical balance [5].
The escalating costs of fertilizers over the past few decades, primarily driven by soaring energy consumption, especially fossil fuels, have renewed interest in foliar fertilization. These fertilizers typically contain lower levels of traditional mineral nutrients but are enriched with oligoelements and microelements which enhance plant uptake and utilization of essential macronutrients. Applied in aqueous solutions, they also supply plants with a substantial amount of water, a crucial factor for plant growth. Since classic mineral fertilizers are large consumers of fossil fuel energy, in the present economic situation, when a special emphasis is placed on reducing energy consumption, the use of FF returns to the actuality. These compounds contain smaller amounts of mineral fertilizers supplemented by various oligoelements and microelements, but an appreciable amount of water, which favors their rapid absorption of nutrients by plants [6,7].
Numerous studies have identified several factors influencing the absorption and translocation of foliar fertilizers. These include: 1—the physicochemical properties of the spray solution (e.g., particle size, solubility, surface tension); 2—environmental conditions (e.g., humidity, temperature, light); and 3—plant characteristics (e.g., leaf structure, nutrient mobility). However, effective foliar fertilization depends not only on leaf uptake but also on the efficient movement of nutrients to other plant parts, such as developing leaves, grains, or fruits [6,7,8,9]. Nutrient absorption in the root system is well studied, but their adsorption through leaf follicles is less well known [10]. Cuticles, stomata, and trichomes are potential pathways for nutrient absorption in leaves, but the mechanisms remain poorly understood. The precise chemical composition and structural intricacies of the plant cuticle, as well as the mechanisms by which substances are absorbed through it, remain largely unclear. Substances applied to the leaf surface can penetrate the epidermis via two primary pathways based on their water solubility: a lipophilic route for non-polar compounds like insecticides and herbicides, and a hydrophilic route for polar compounds such as essential mineral nutrients [11]. The absorption and movement of foliar-applied nutrients vary significantly based on leaf morphology. Herbaceous species, with their linear leaf arrangement and closely spaced stomata and veins, facilitate nutrient transport compared to broadleaf species. The latter’s palmate venation and randomly distributed stomata create a more complex pathway for nutrient movement [12,13,14].
After nitrogen, phosphorus, and potassium (NPK), classic mineral fertilizers with a well-known role in increasing grain production, including maize, sulfur (S) is the fourth essential macronutrient for optimal plant growth. A normal supply of sulfur to crops is mainly associated with high production, which leads to a removal of S from the soil. To supply the soil, it is necessary to apply fertilizers with this nutrient. Although sulfur ranks thirteenth in abundance in the soil crust, it holds a crucial fourth place in the mineral nutrition of plants, following nitrogen, phosphorus, and potassium [15]. Sulfur deficiency is common in high sulfur-demanding crops like oilseed rape and sunflower, as well as in less demanding crops such as maize. In plants, sulfur indirectly contributes to chlorophyll formation by being essential for the biosynthesis of sulfur-containing amino acids like cystine (27% sulfur), cysteine (26% sulfur), and methionine (21% sulfur) [16]. Consequently, sulfur plays a role in photosynthesis as a component of succinyl CoA, which is involved in chlorophyll function, thereby accelerating photosynthesis and promoting vegetative growth. Generally, sulfur acts as a cofactor or prosthetic group for the Fe-S cluster, participating in various redox systems, including nitrogen and potassium metabolism and the conversion of carbohydrates into lipids via thiokinase. Symptoms of sulfur deficiency include leaf yellowing (chlorosis), which, unlike nitrogen deficiency, first appears in young leaves and persists even after nitrogen deficiency is corrected [17,18].
Boron (B), though a micronutrient required in small quantities, plays a vital role in plant health, both for monocotyledonous and dicotyledonous plants. Boron contributes to cell wall stability and elasticity by bonding two rhamnogalacturonan-II monomers through borate esters in the pectin fraction of primary cell walls. This is crucial for sustaining growth and development by ensuring the stability and elasticity of plant cell walls and maintaining meristem activity [19,20]. Since monocots have less pectin in their tissues, boron’s influence is reduced [21]. In B-deficient conditions, maize, like other monocots, develops typical white stripes between leaf veins [22]. In field conditions, B deficiency in maize results in abnormal development of ears, silks, tassels, and anthers, leading to reduced grain yield and quality [23].
Metal trace elements (MEs) with an important role in maize nutrition and commonly found in foliar fertilizers are represented by the following: Cu, Fe, Mn, Zn, Co, and Mo. Although found only in traces, they have an important role in metabolism, being involved together with S and B in numerous physiological processes. They are related to the transport of electrons or as part of the prosthetic group (cofactor) of many key enzymes involved in various metabolic pathways, including ATP synthesis. Also, through the carbonic anhydrase chain, they are involved in the process of hardening (lignification) of cell walls, and involved in the metabolism of carbohydrates, lipids, and proteins [24,25,26].
In maize, Zn deficiency is most often manifested, from the top of the plant to its base (Zn as Mn having reduced mobility), through growth stagnation, shortening of stem internodes, and the appearance of chlorotic spotting on the leaves (the ribs remain green), quickly followed by necroses of different sizes. The application of foliar fertilizers (FF) containing zinc (Zn) positively impacts maize yield and quality, enhancing both the aboveground and underground parts of the plant [27].
Although useful in very small amounts (traces), an excess of ME can cause damage to most plants at the cellular level. Especially susceptible are Cu and Fe, metals that can attach to the sulfhydryl groups of membrane proteins or can cause the induction of lipid peroxidation through the formation of active oxygen species in the cell (Haber–Weiss reaction) [28]. These contradictory effects determine not only their use in very small amounts in foliar fertilizers, but also the pursuit of possible toxic effects after treatment. Since they can accumulate and reach toxic levels in the final production, it is necessary to monitor their presence in this phase as well [25,26].
The purpose of our research was the quantitative and qualitative determination of the effects, of treatments with complex FF with the addition of various oligoelements and microelements as a sustainable fertilization method, on grain maize production and quality [5,6,7]. From the point of view of sustainable agriculture, it is essential to optimize the fertilizing effect of the treatments, that is, to find the optimal composition and doses. This is possible by using different mathematical methods. In our work, we achieved this by using the principal component analysis (PCA) method. Production, humidity, ash content, macroelements and microelements, lipids, crude proteins, fibers, and carbohydrates were the parameters used to establish the effects of seven types of treatments with foliar fertilizers.

2. Materials and Methods

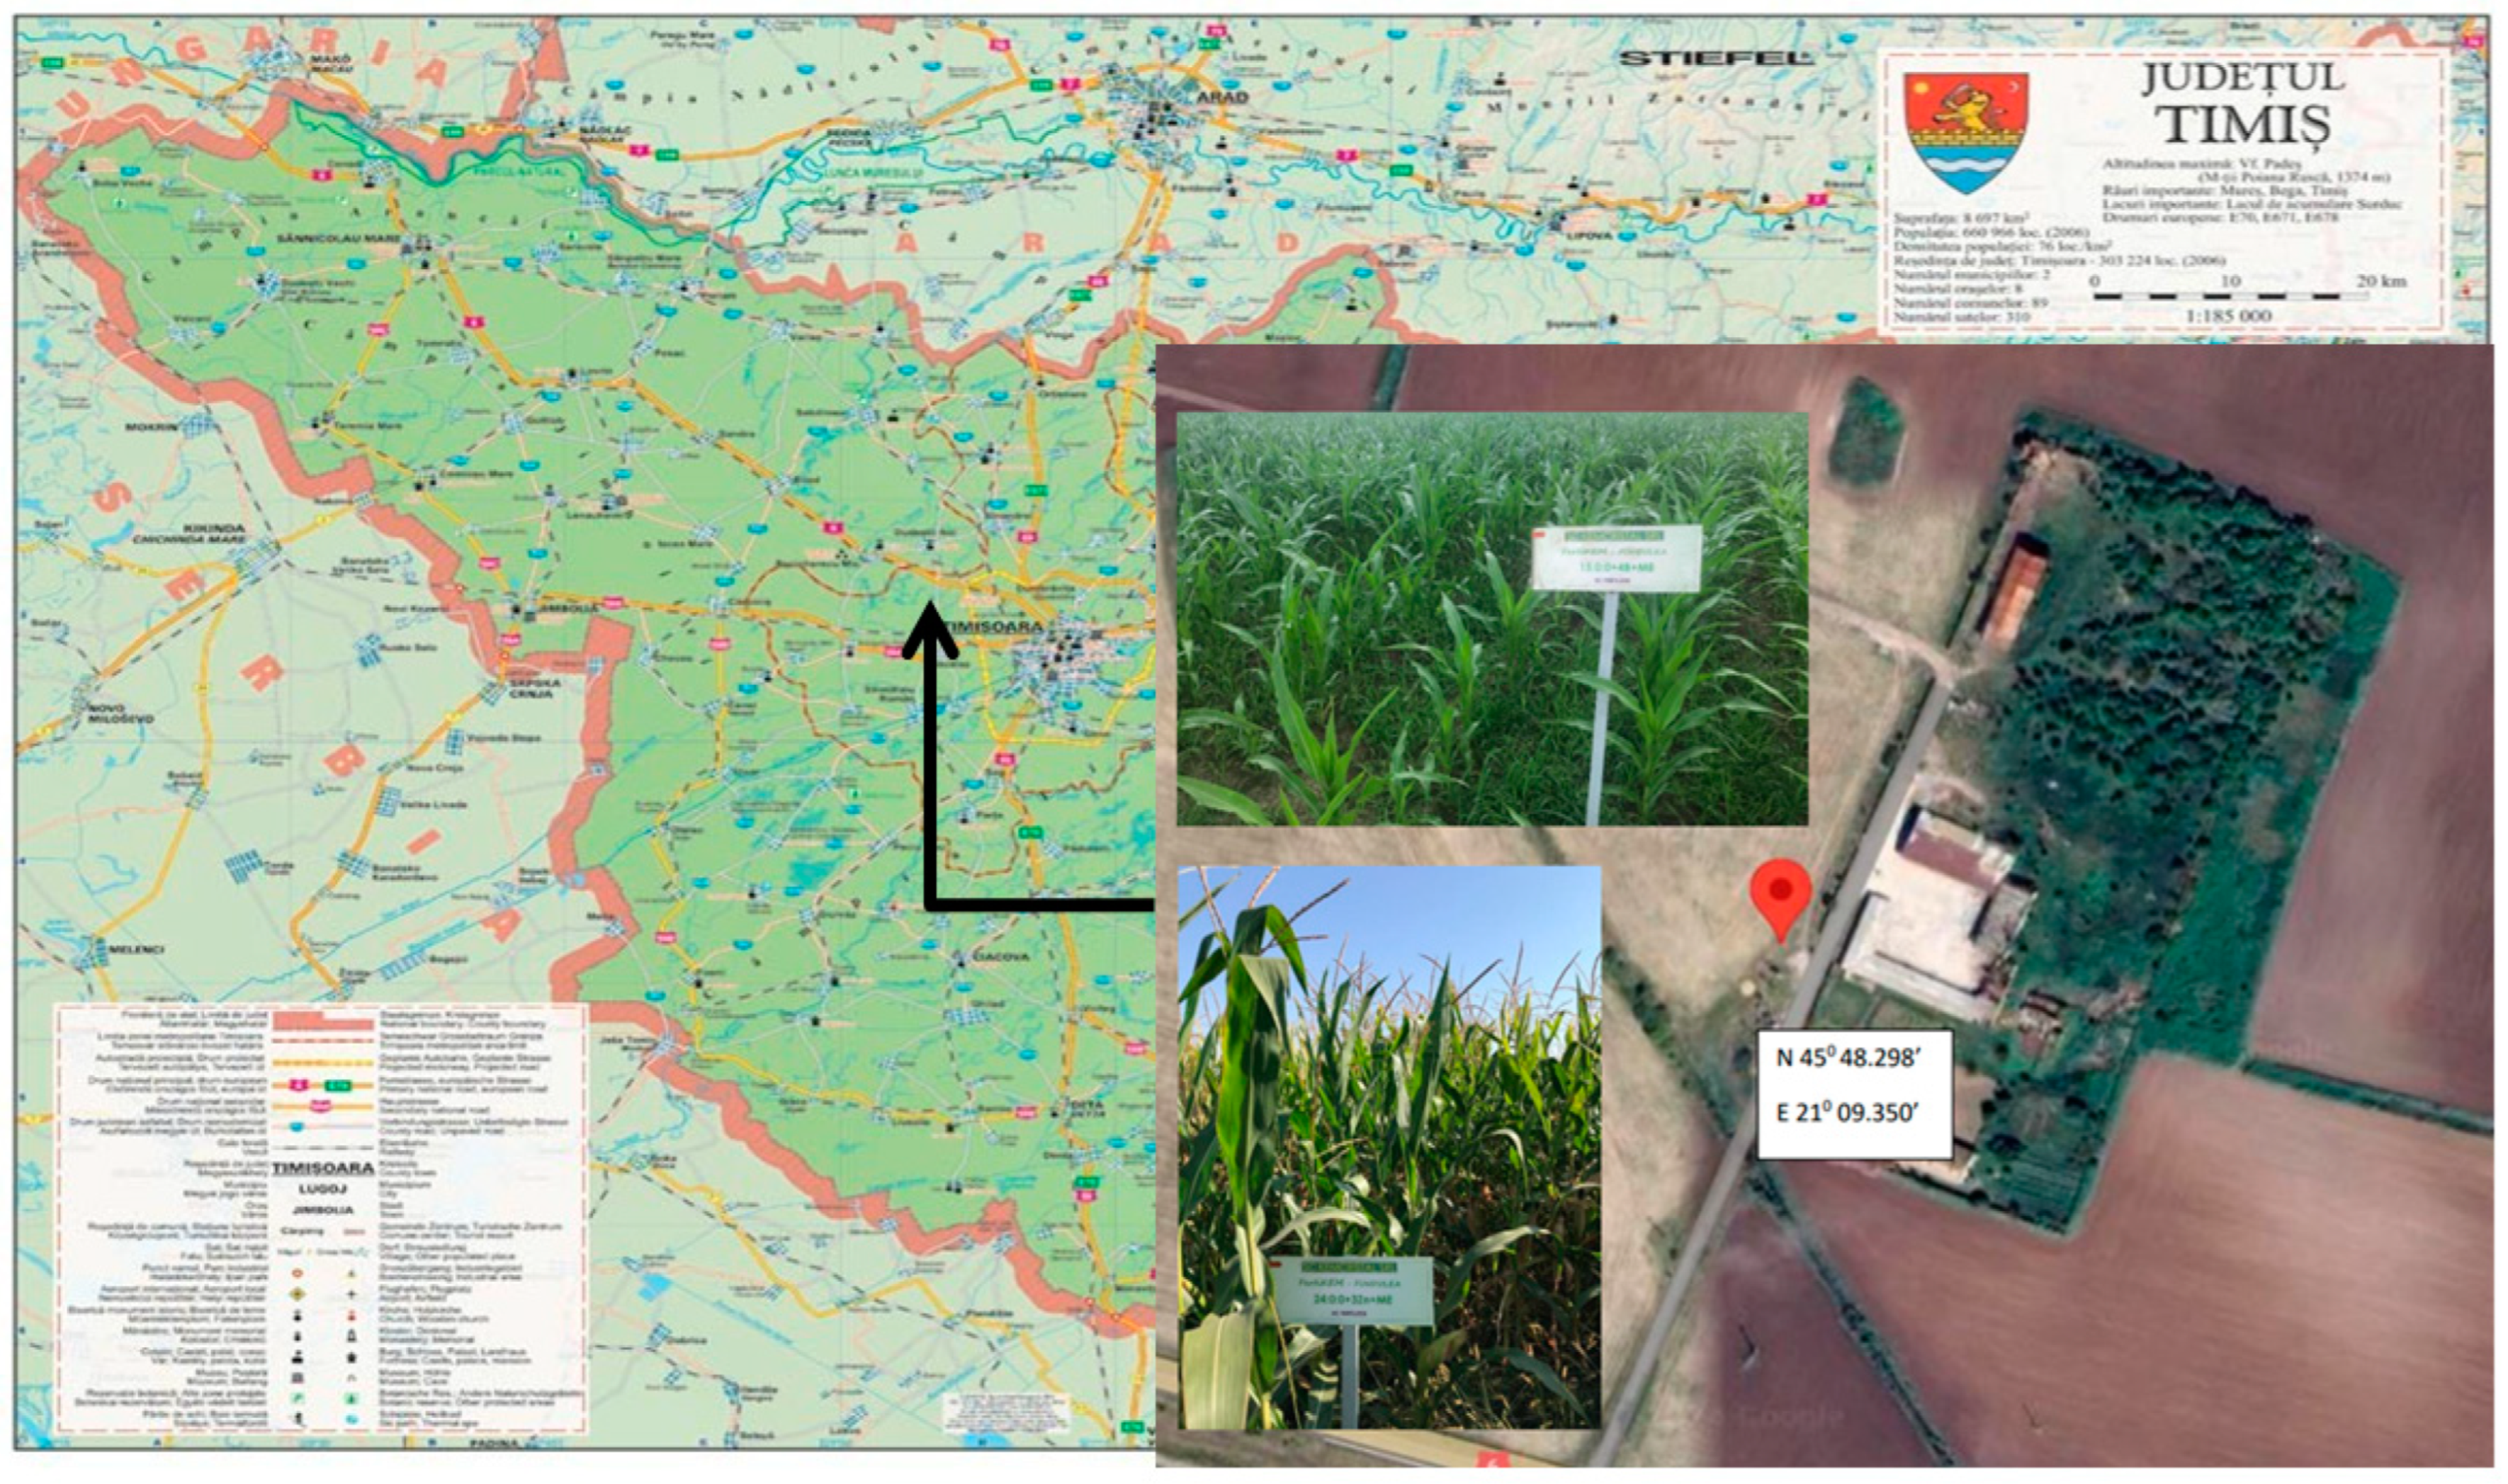
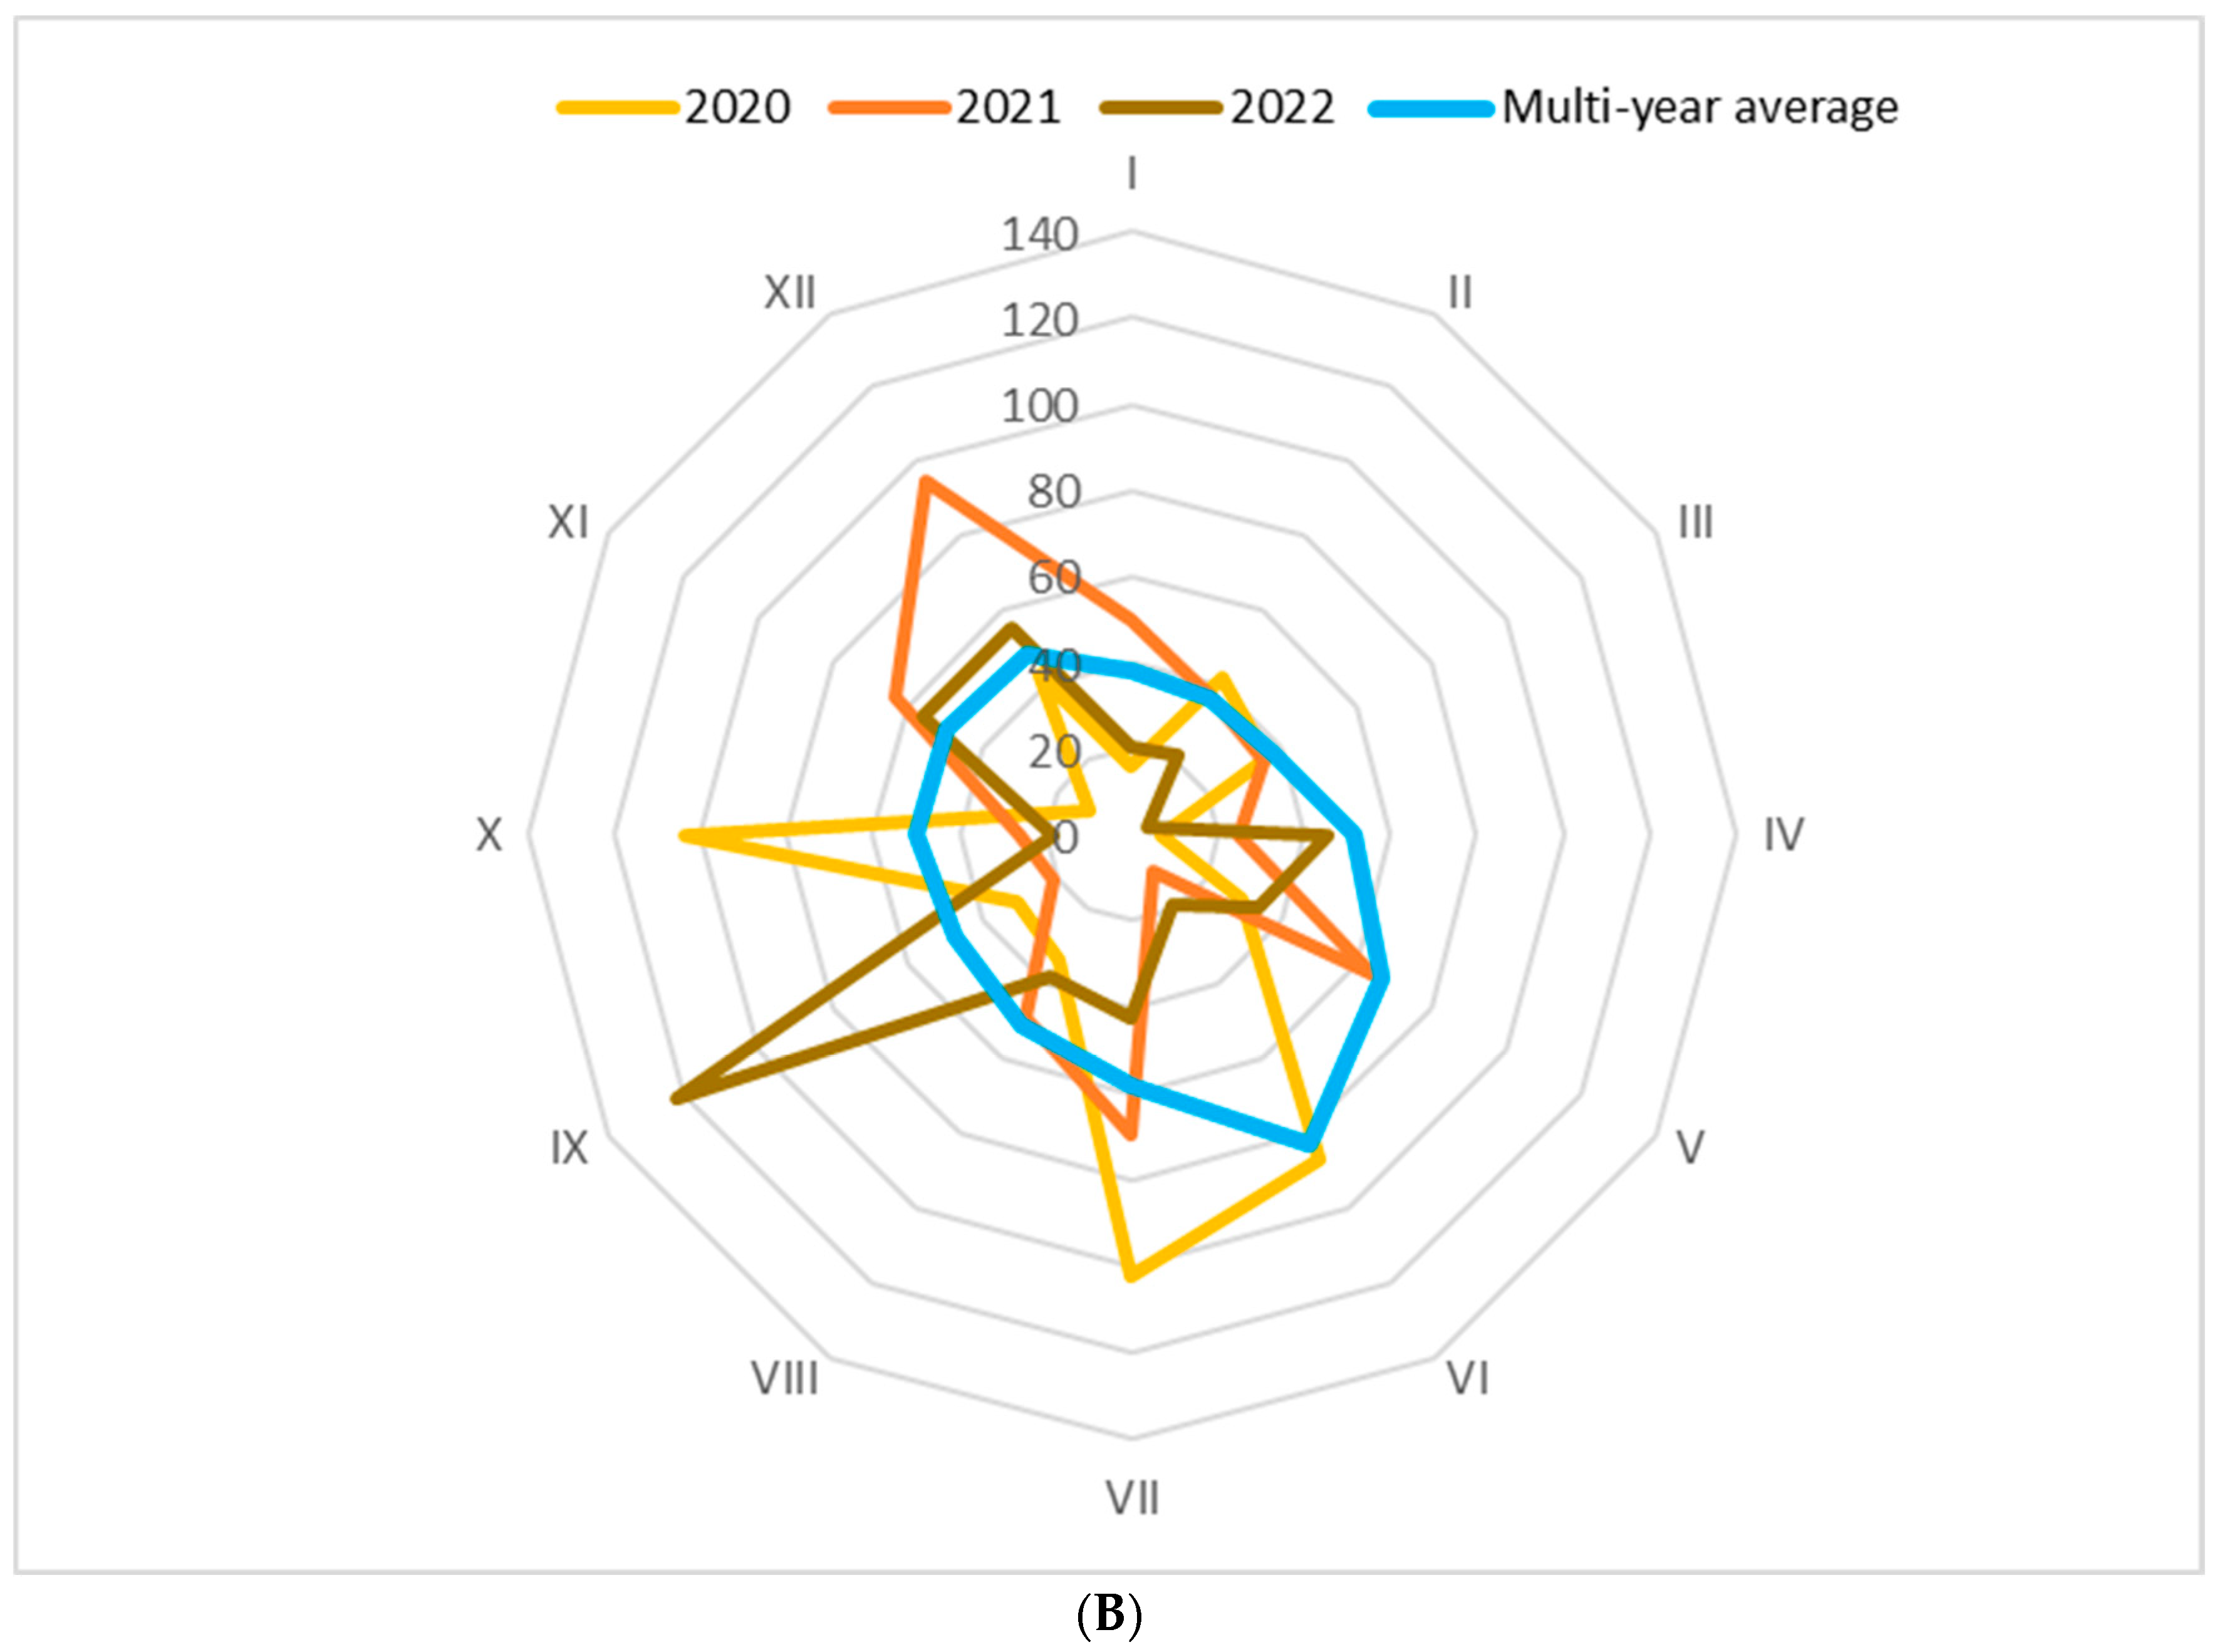
2.1. Natural Framework of Experimentation: Relief, Climate, and Soil

The study took place during 2020–2022, and the experimental fields were located near the city of Timișoara, on U.S.V.T. lands. As a form of relief, the area is located in a vast plain, called the Western Plain, one of the most important agricultural regions of Romania. The coordinates of the location are 45°48.298′ N 21°09.350′ E (Figure 1).
The territory of Romania falls, in general, into a continental climate. In the Western Plain, the characteristics of this climate are moderately manifested, being slightly blurred by oceanic and even sub-Mediterranean influences [29,30,31]. The average annual temperature is 10.8 °C, with a noticeable upward trend in recent years. In April, the typical month for corn sowing, only 2020 experienced temperatures above the multi-year average. In the other two years, temperatures were slightly below this average. Consequently, we opted for a variable sowing date to ensure that the soil temperature at sowing depth exceeds 8 °C. July and August are the warmest months, contributing most visibly to the annual temperature increase (Figure 2A).
Rainfall in the area normally amounts to just over 600 L/m2/year, but in recent years, the annual amount of precipitation has been much lower: about 540 mm in 2020 and 2021, and less than 500 mm in 2022 [29,32]. In addition, there is also an increasingly uneven distribution of precipitation throughout the year (Figure 2B). The most favorable period for sowing maize in the 3 years of the experiment was between 10 and 20 April, taking into account the temperature and precipitation regime.
The experimental fields were located on a weakly glazed chernozem soil, salinized in depth (weakly below 100 cm), decarbonated, on medium loessic deposits, loam–clay/loam–clay. Relief conditions in which the soil unit occurs: flat relief, low plain. Parent rock/underlying rock: medium loessic deposits. The depth of the water table: 2–3 m [31,32,33,34].
Chemical properties:
The soil reaction is slightly acidic in the first 59 cm, slightly alkaline between 59 and 119 cm and alkaline in depth. Humus levels in the upper 50 cm of soil are medium. The reserve of humus in the first 50 cm is very high (273.45 t/ha). The content of mobile phosphorus in the plowed layer indicates a medium insurance status. The content of mobile potassium in the plowed layer indicates a medium insurance status. The content of carbonates indicates a weak salinization in depths below 100 cm. The CaCO3 content is high, starting from 59 cm to 170 cm [33,34].
Physical and hydro-physical properties:
The texture is medium–fine (LA) throughout the soil profile (0–148 cm) and medium (LL) in depth. Porosity and water permeability are very low. The degree of subsidence is accentuated. Drainage (internal, external, global) is very low. The morphological thickness of the soil (up to the parent rock) attests to a deep soil, and the useful physiological thickness (on which most plant roots develop) is very high [33,34].

2.2. Sowing and Fertilization, Experimental Scheme

The establishment of the maize crop (sowing) was carried out between 10 and 20 April, considered the most favorable in the area, but taking into account the soil moisture and especially the soil temperature at the sowing depth (6–8 cm). We used the P0216 hybrid, created by the Pioneer company, following the maize model with a seeding rate of 62,000 seeds per hectare. Some general characteristics of this [35] are as follows:
  • Semi-late hybrid (FAO 450) with extraordinary production potential proven every year.
  • It loses water very quickly at maturity.
  • Very strong roots and stem.
  • Intensive hybrid intended for farmers who apply cutting-edge technology.
  • It is recommended for arid and semi-arid lowland areas in the south and west of the country.
Recommended densities:
  • Non-irrigated: 60,000–65,000 harvestable plants/ha.
  • Irrigated: 68,000–75,000 harvestable plants/ha
    • number of rows per tin: 16–18
    • number of seeds per row: 47–50
    • MMB: 365–400 g.
The maize crop received fertilization with 100 kg/ha of solid complex fertilizer (18:46:0 N, P2O5, K2O) and 150 kg/ha of ammonium nitrogen. The complex fertilizer was applied once during seedbed preparation, and ammonium nitrate was added when the corn plants had 2–3 leaves. This basic soil fertilization was followed by two foliar fertilizations for all V1-V7 variants, using doses recommended by the manufacturer and during maize-specific growth stages, according to data in the literature [36]: stages 15–16 BBCH (5–6 unfolded leaves) and stages 20–22 BBCH (10–12 unfolded leaves), when plant growth is intense and nutrient requirements are highest. Due to the maize’s slow initial growth, early weed management was achieved by pre-emergent application of the herbicide Adengo SC 465 (225 g/L Isoxaflutole + 90 g/L Thiencarbazone-methyl + 150 g/L Cyprosulfamide) at 2 L/ha [37]. For this purpose, we used SCHACHTNER equipment, type BOSPHO (boom sprayer: horizontal, 300 cm length and 50 cm height, 2.6 bar operation pressure), equipped with 6 LECHLER Nozzles, Type FLAFAN, Model IDK120-02, calibrated at 758 mL/min (application amount 300 L/ha [38]). Application conditions were as follows: air temperature 18.3–21.7 °C, wind speed 0.3–0.8 m/s, and relative humidity 52.3–61.2%. Foliar fertilizer application rates varied between 2 and 6 L/ha, depending on the product’s chemical makeup. Precipitation during May and June favored the application of foliar fertilizers. Field trials were conducted in subdivided plots with three repetitions for each variant. There were seven fertilization variants (factors) and one control variant (Mt). The size of the harvest area for each experimental unit was 24.5 m2 (length 7 m, width 3.5 m), with a 1 m path between variants. The treatments applied were as follows: V1—FF 10:10:10+ME at 6 L/ha; V2—FF 8:8:8+8B+ME at 6 L/ha; V3—FF 8:10:0+8B+ME at 2 L/ha; V4—FF 15:0:0+2S+1B+ME at 6 L/ha; V5—FF 24:0:0+3Zn+ME at 4 L/ha; V6—FF 15:0:0+5Zn+ME at 4 L/ha; V7—FF 15:0:0+4B+ME at 4 L/ha; Mt—control (no foliar treatment, only basic soil fertilization). FF denotes foliar fertilizers containing varying concentrations of soluble nitrogen (N), phosphorus (P2O5), and potassium (K2O), expressed as a percentage of total weight (w/w). The first digit represents nitrogen content, the second phosphorus, and the third potassium (1 kg P2O5 = 0.437 kg P, 1 kg K2O = 0.830 kg K). The foliar fertilizers also contained boron (B) at a concentration of 0.01% (w/w) and sulfur (S) at 1% (w/w). Additionally, a micronutrient mixture (ME) was included, consisting of iron (Fe), copper (Cu), manganese (Mn), zinc (Zn), and cobalt (Co) chelated with EDTA, at concentrations of 0.057%, 0.006%, 0.026%, 0.008%, and 0.002%, respectively. Molybdenum (Mo) was also included at 0.004% (w/w).

2.3. Chemical Analysis and Statistical Data Processing Methods

The processing of the samples of maize grains harvested from the 7 variants (3 samples from each variant) was carried out in the Soil and Plant Analysis Laboratory of the Office for Pedological and Agrochemical Studies Timișoara (OSPA-Timișoara), which is accredited by RENAR (the Romanian national organization that deals with standardization), and which also serves the University of Life Sciences, King Michael I from Timișoara [39,40]. The analysis methods used to characterize the quality of maize kernels (moisture, protein, lipids, fiber, ash) are ISO standardized methods.
These methods are:
  • Humidity (%): this was performed by drying the samples at 110 °C in an electric oven, POL-EKO-equipment, Nitech-Romania, SR EN ISO 712:2010 [41].
  • Ash (%): this was made by burning at 5500 °C using electric furnace equipment (Lenton Thermal Design, England), SR ISO 2171:2002 [42].
  • Crude protein (%): this was classically determined by the Kjeldahl method, using a VELP kit (DK20 heating digestion and UDK 149 distillation unit) [43].
  • The determination of total fat (%) was carried out by the classical method of Soxhlet extraction, SR ISO 1443:2008 [44,45].
  • Dietary fiber (%) extraction was carried out by the FOSS Fibertec device and method 2010&M6 [46].
  • The mineralization of the samples from the maize grains was carried out by calcination followed by a wet mineralization of the ash using concentrated HNO3+HCl in the ratio 1:3 (aqua regia), followed by dilution. From the properly diluted solutions, total phosphorus content was determined colorimetrically using a CINTRA spectrophotometer (GBC Australia). Metal nutrients were determined by FAAS method (air-acetylene flame), using a fast sequential atomic absorption spectrometer VARIAN AA 240 FS (Australia) [47,48].
  • The percentage content of carbohydrates was calculated by subtracting from 100 the sum of the other macronutrients.
Mathematical treatment of data:
The study investigated the impact of foliar treatments on maize yield and quality characteristics. While classical statistical methods were used initially [49], the growing complexity of agricultural data demands techniques for simplifying large datasets. Principal component analysis (PCA) addresses this need by identifying a smaller set of variables (principal components) that capture most of the information from the original data [50,51]. Principal component analysis (PCA) was conducted using the PAST (Version 4.04) software package [52] to identify correlations between variables. It achieved this by creating new variables (principal components) that explain the maximum variance in the data. These new variables are combinations of the original ones (e.g., yield and maize quality parameters). PCA helps identify groups based on these variables:
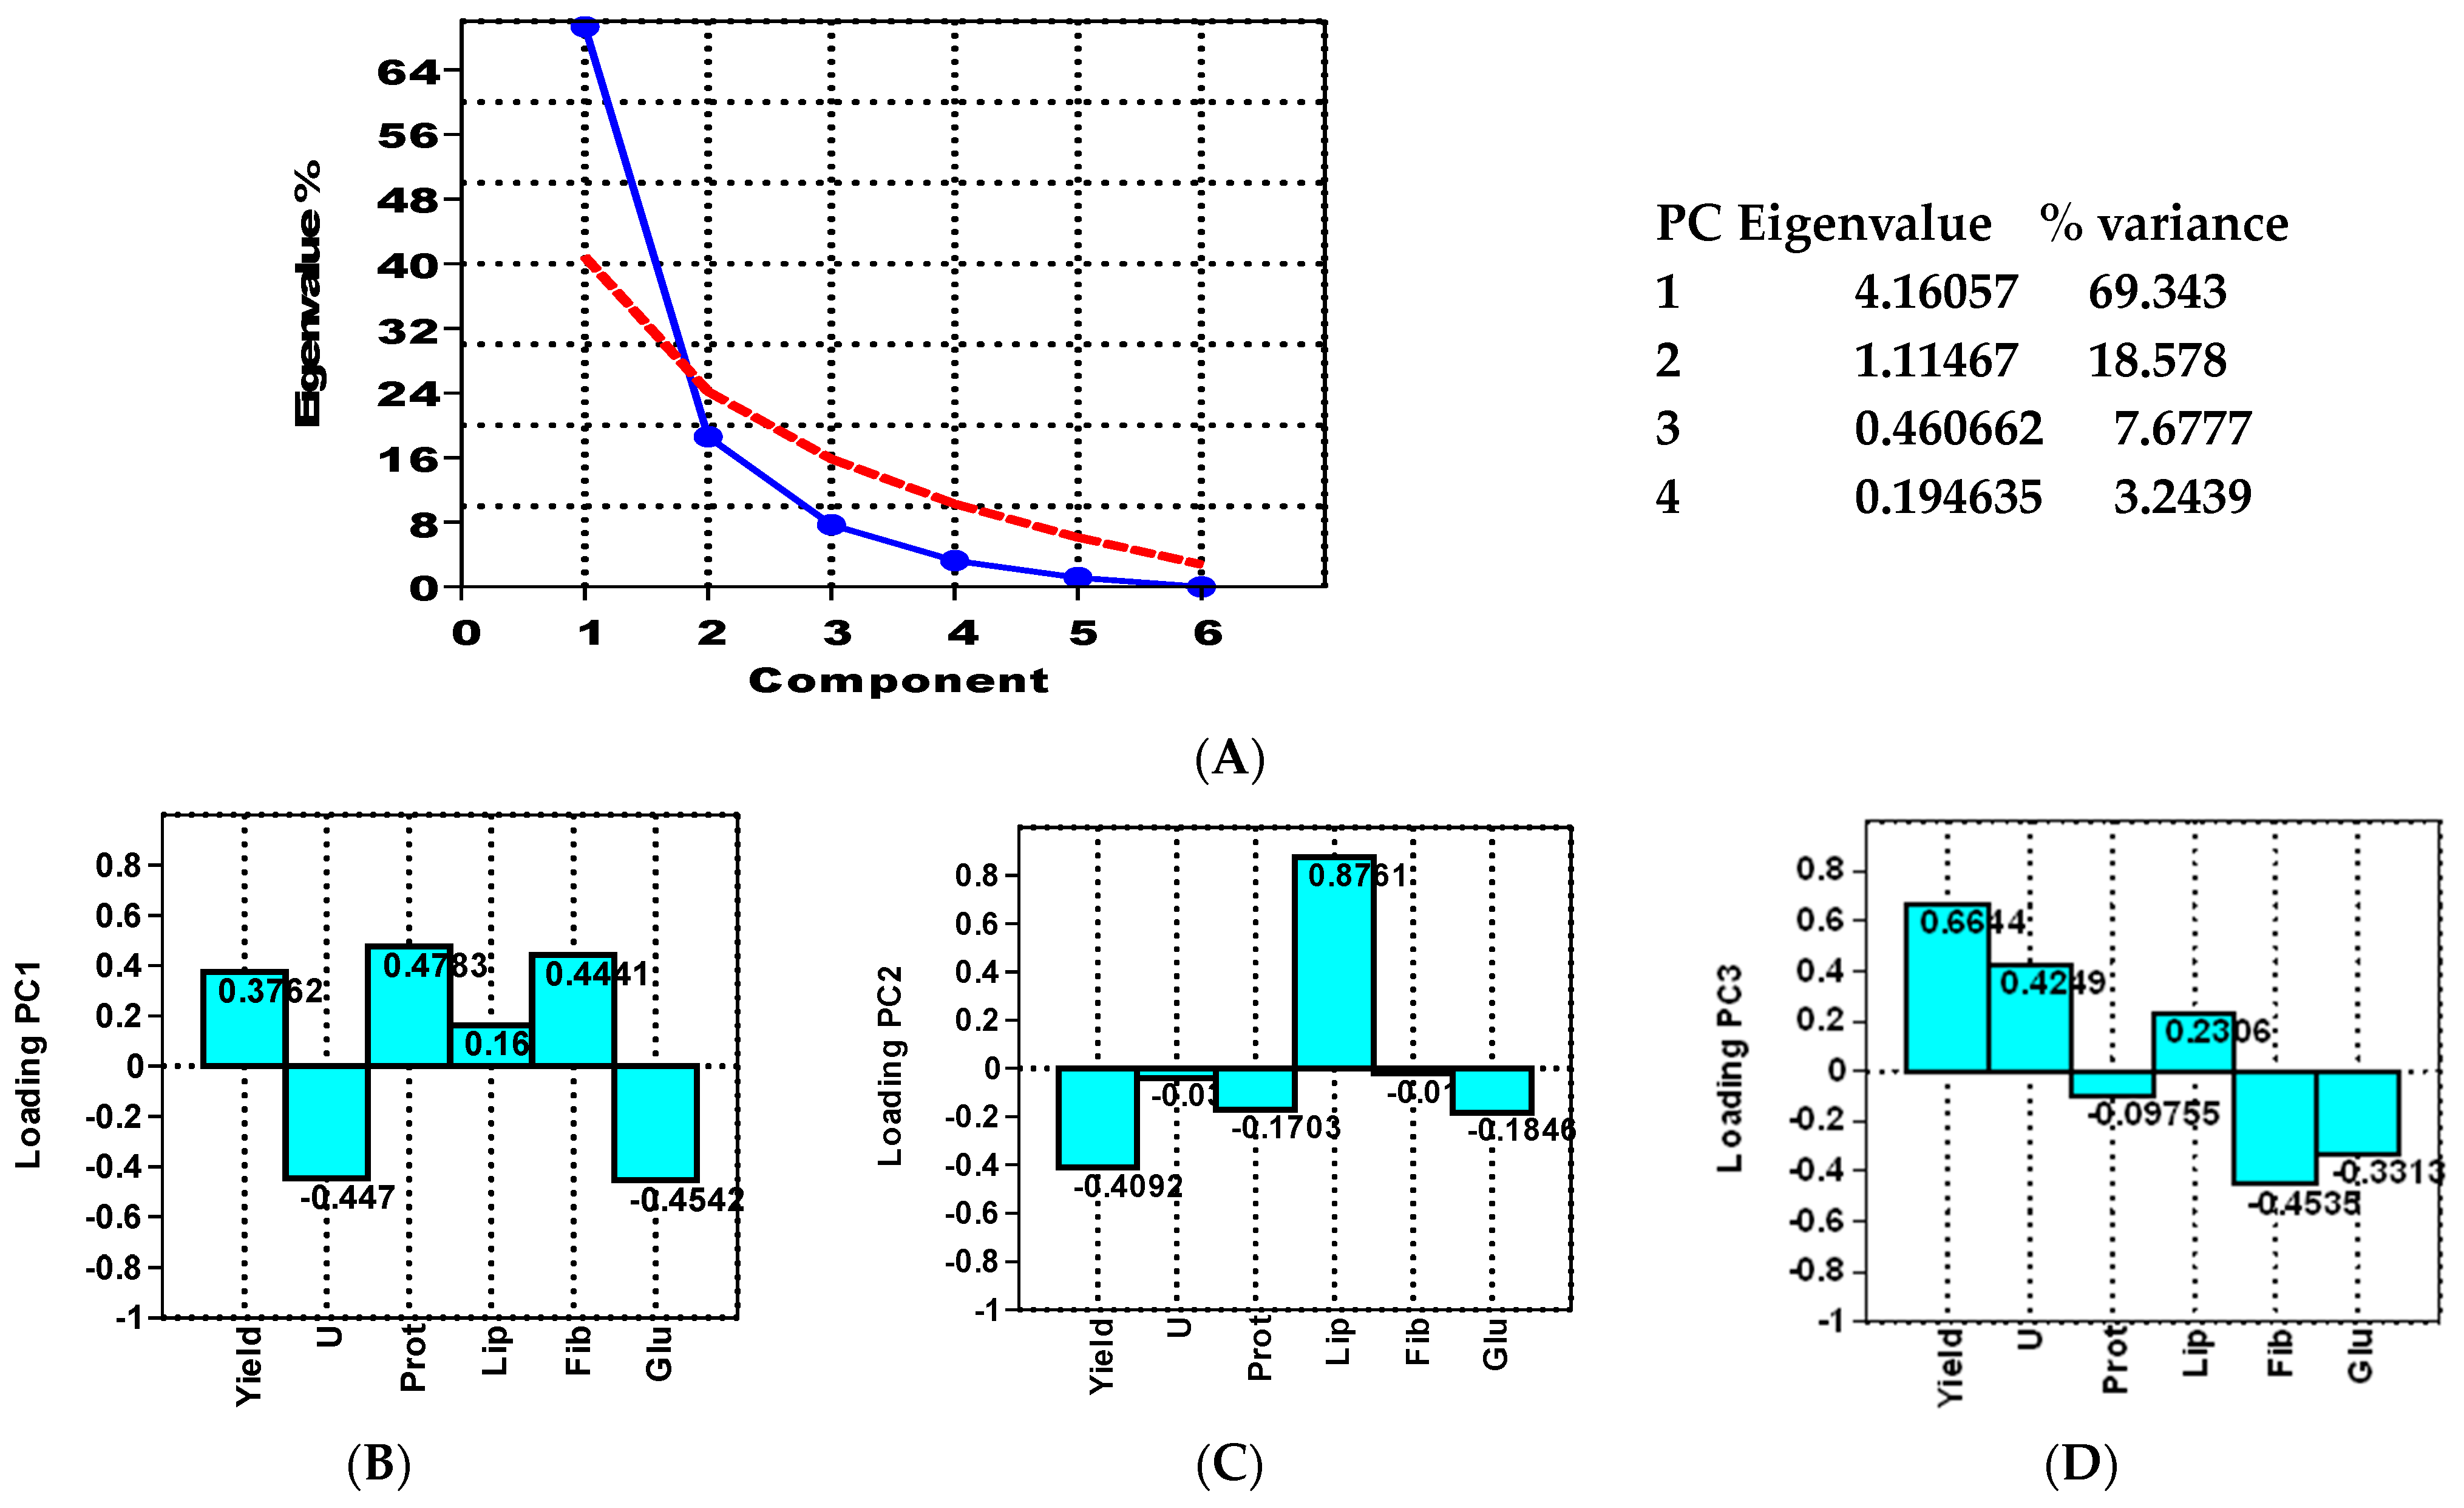
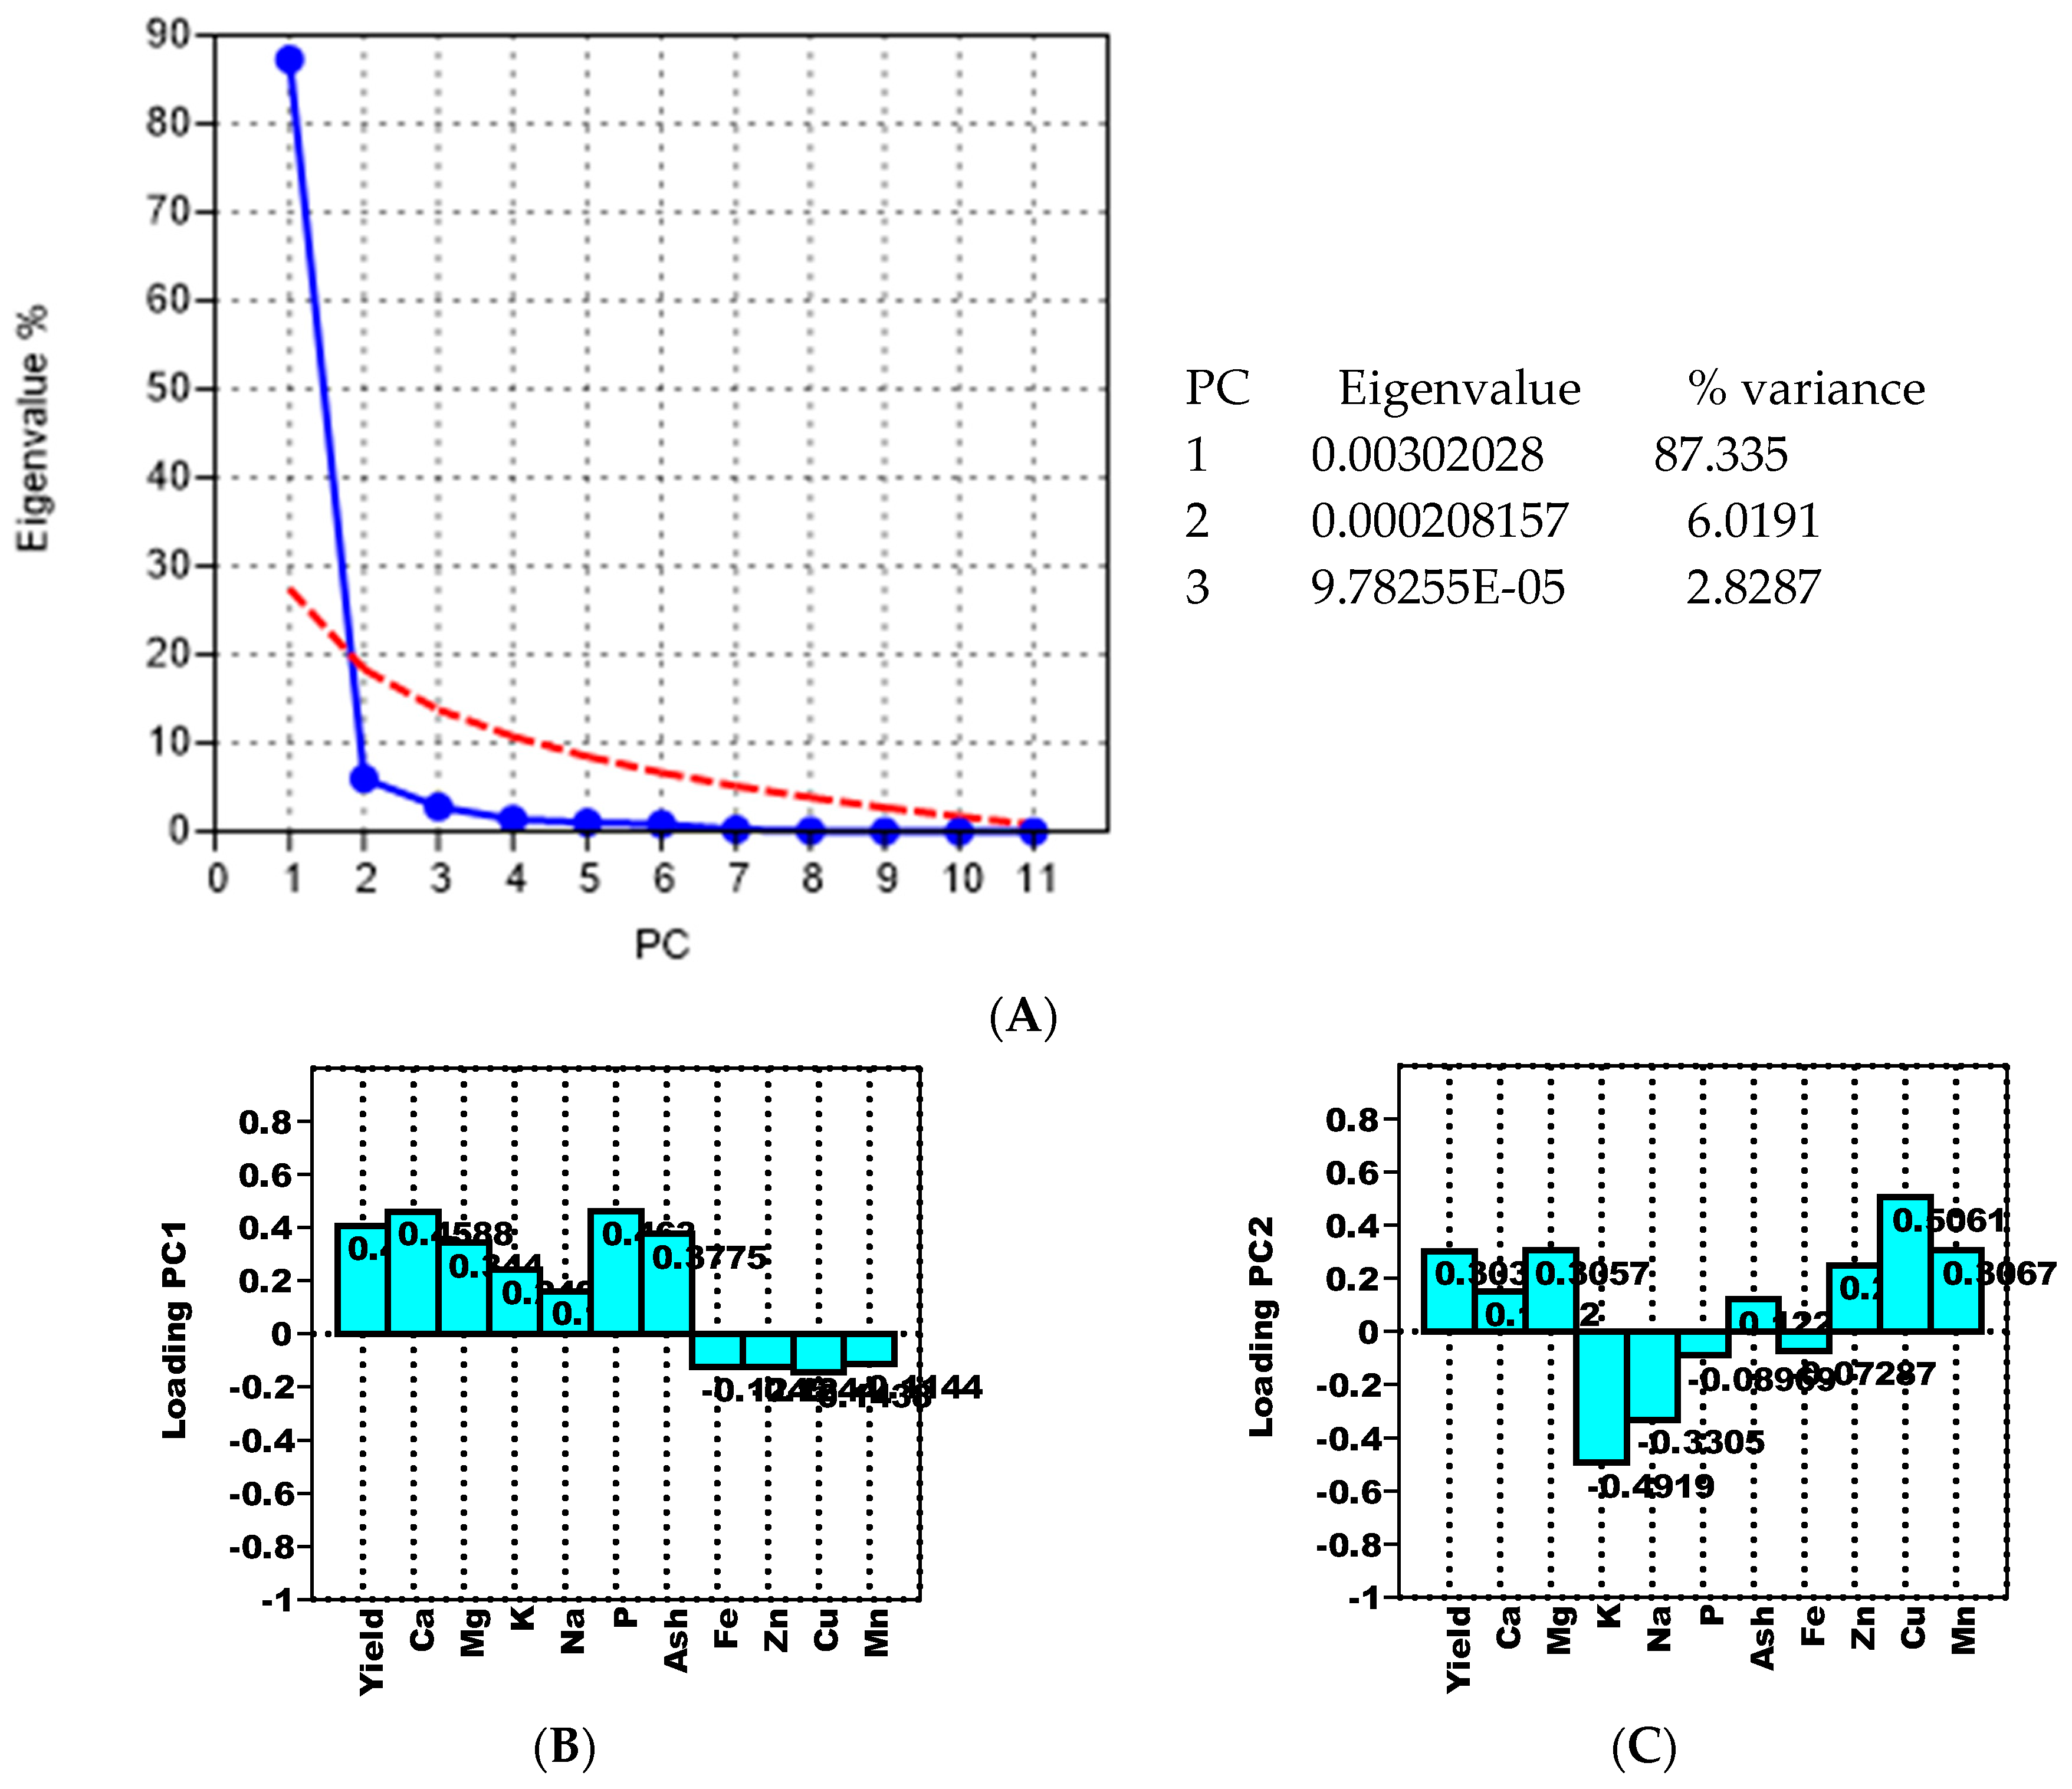
  • Groups of variables: Based on the “loadings” (weights assigned to original variables in the principal components), PCA can group related quality parameters (e.g., protein and lipids).
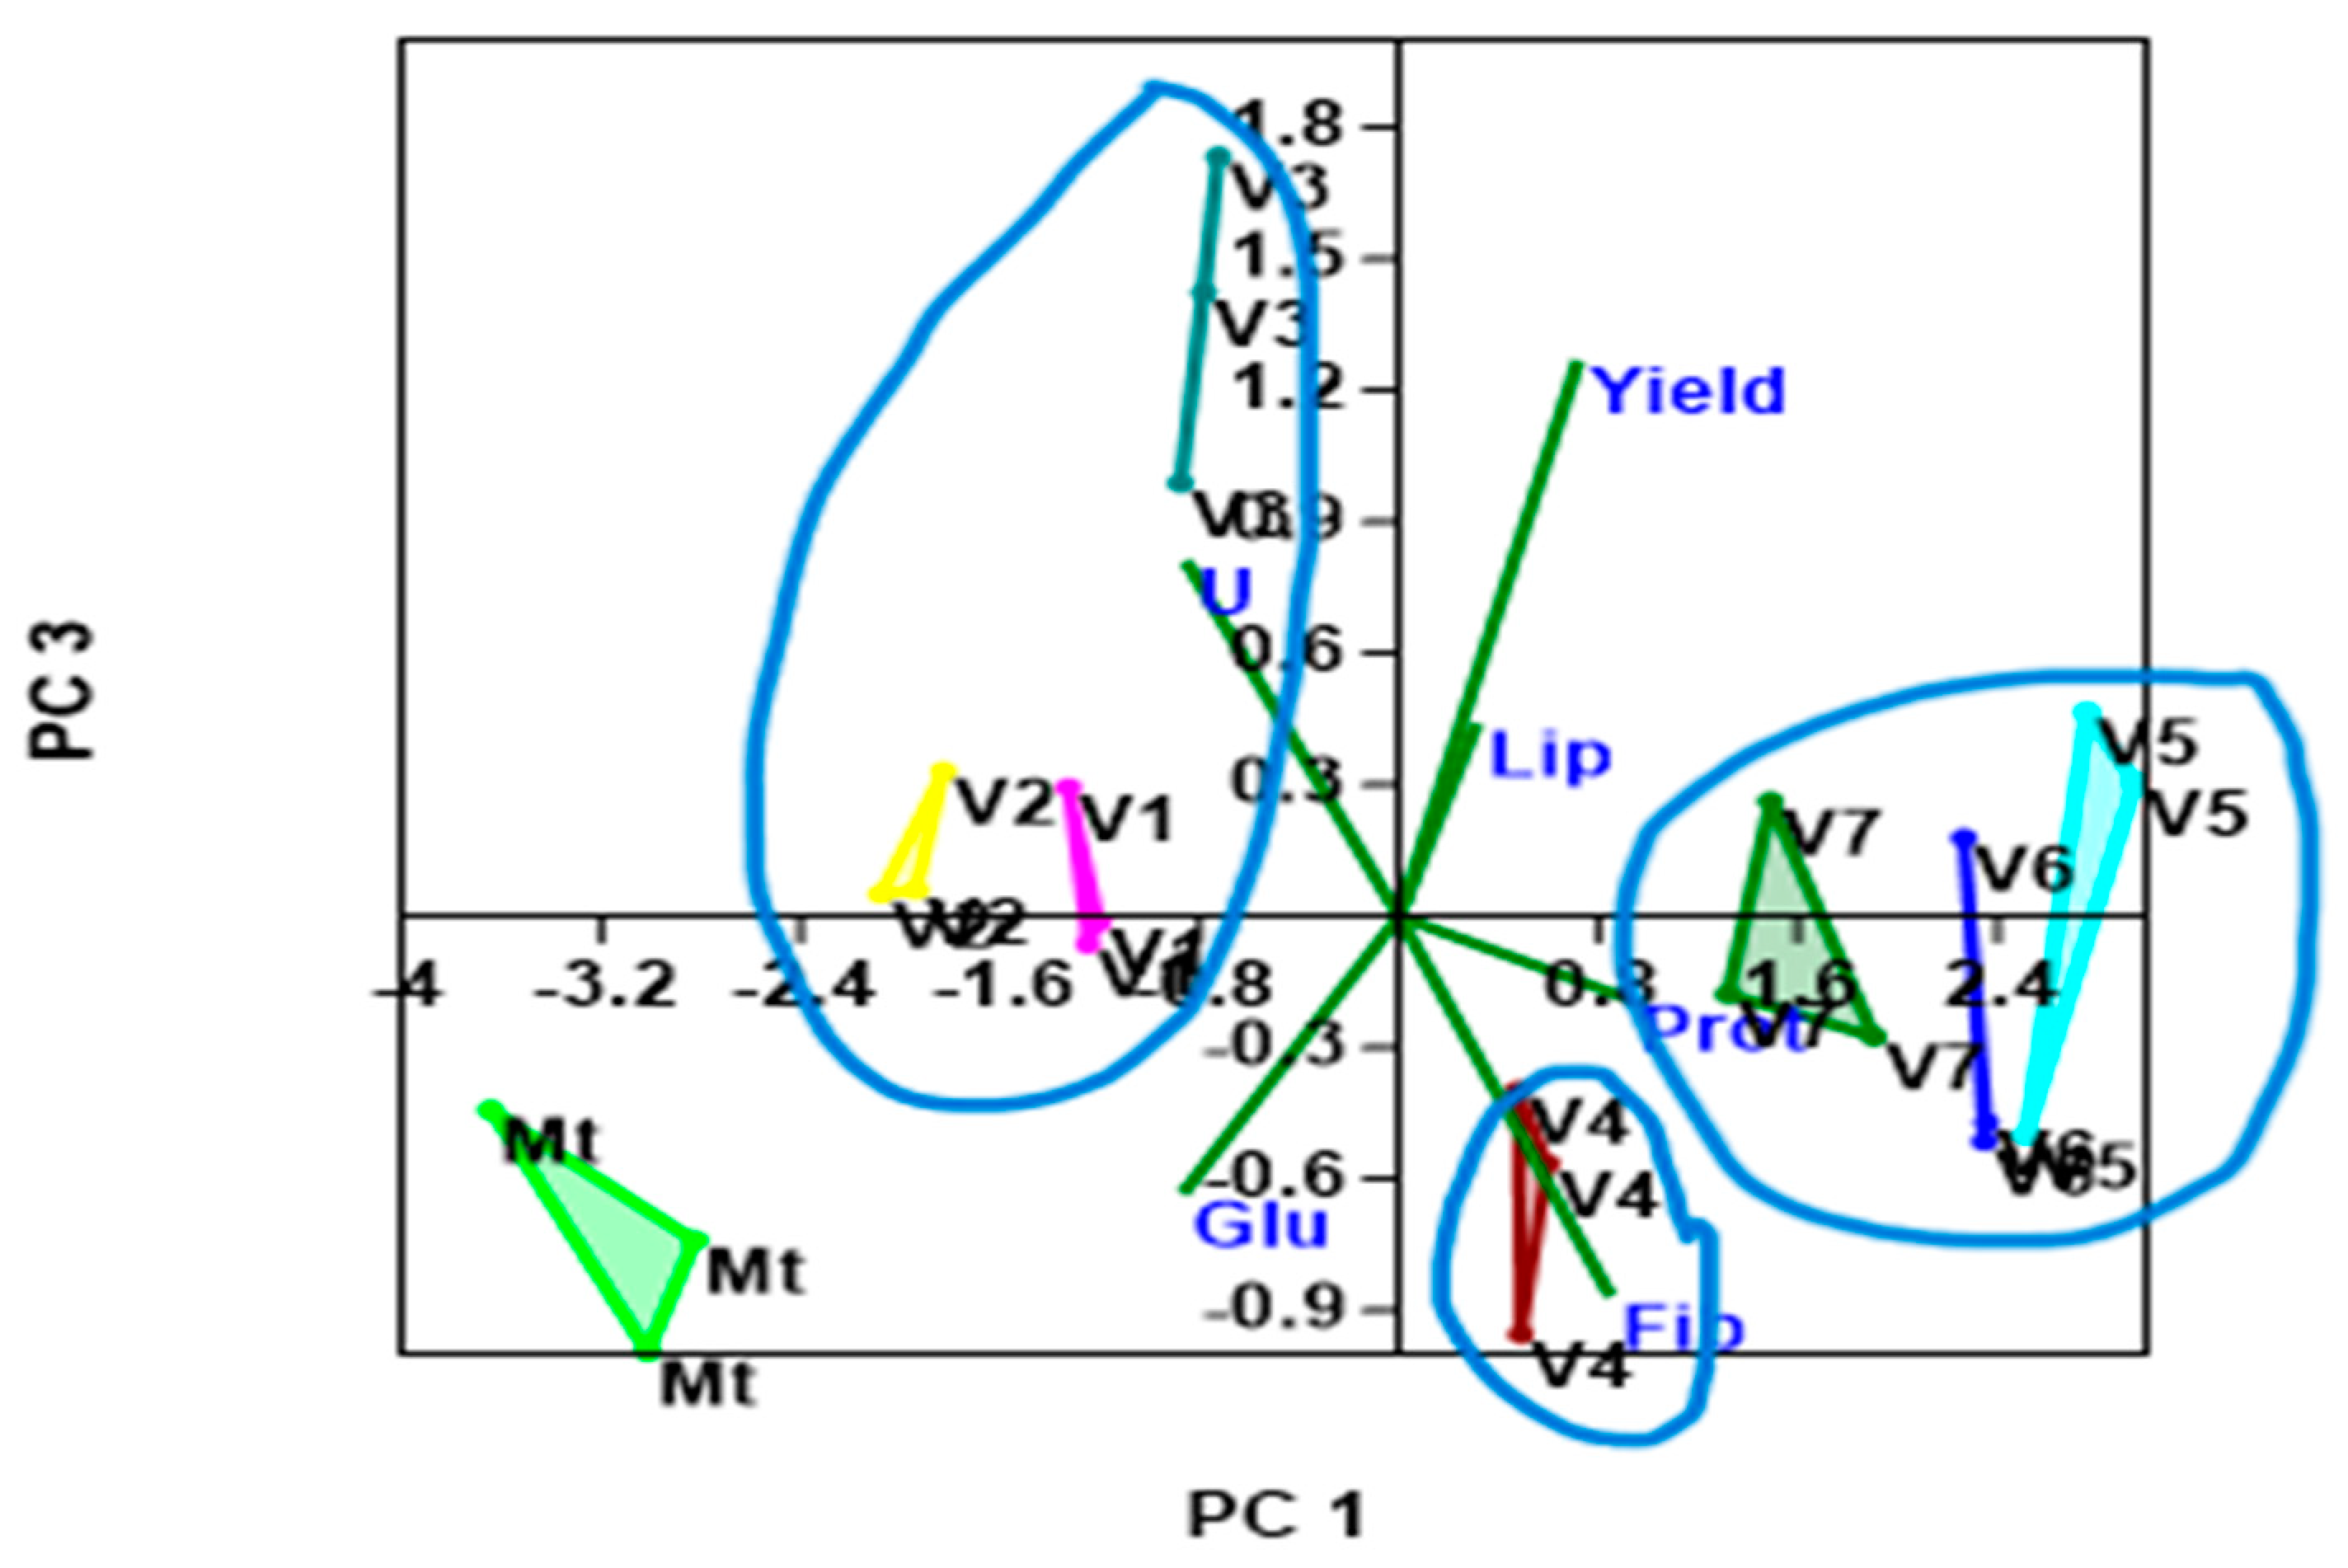
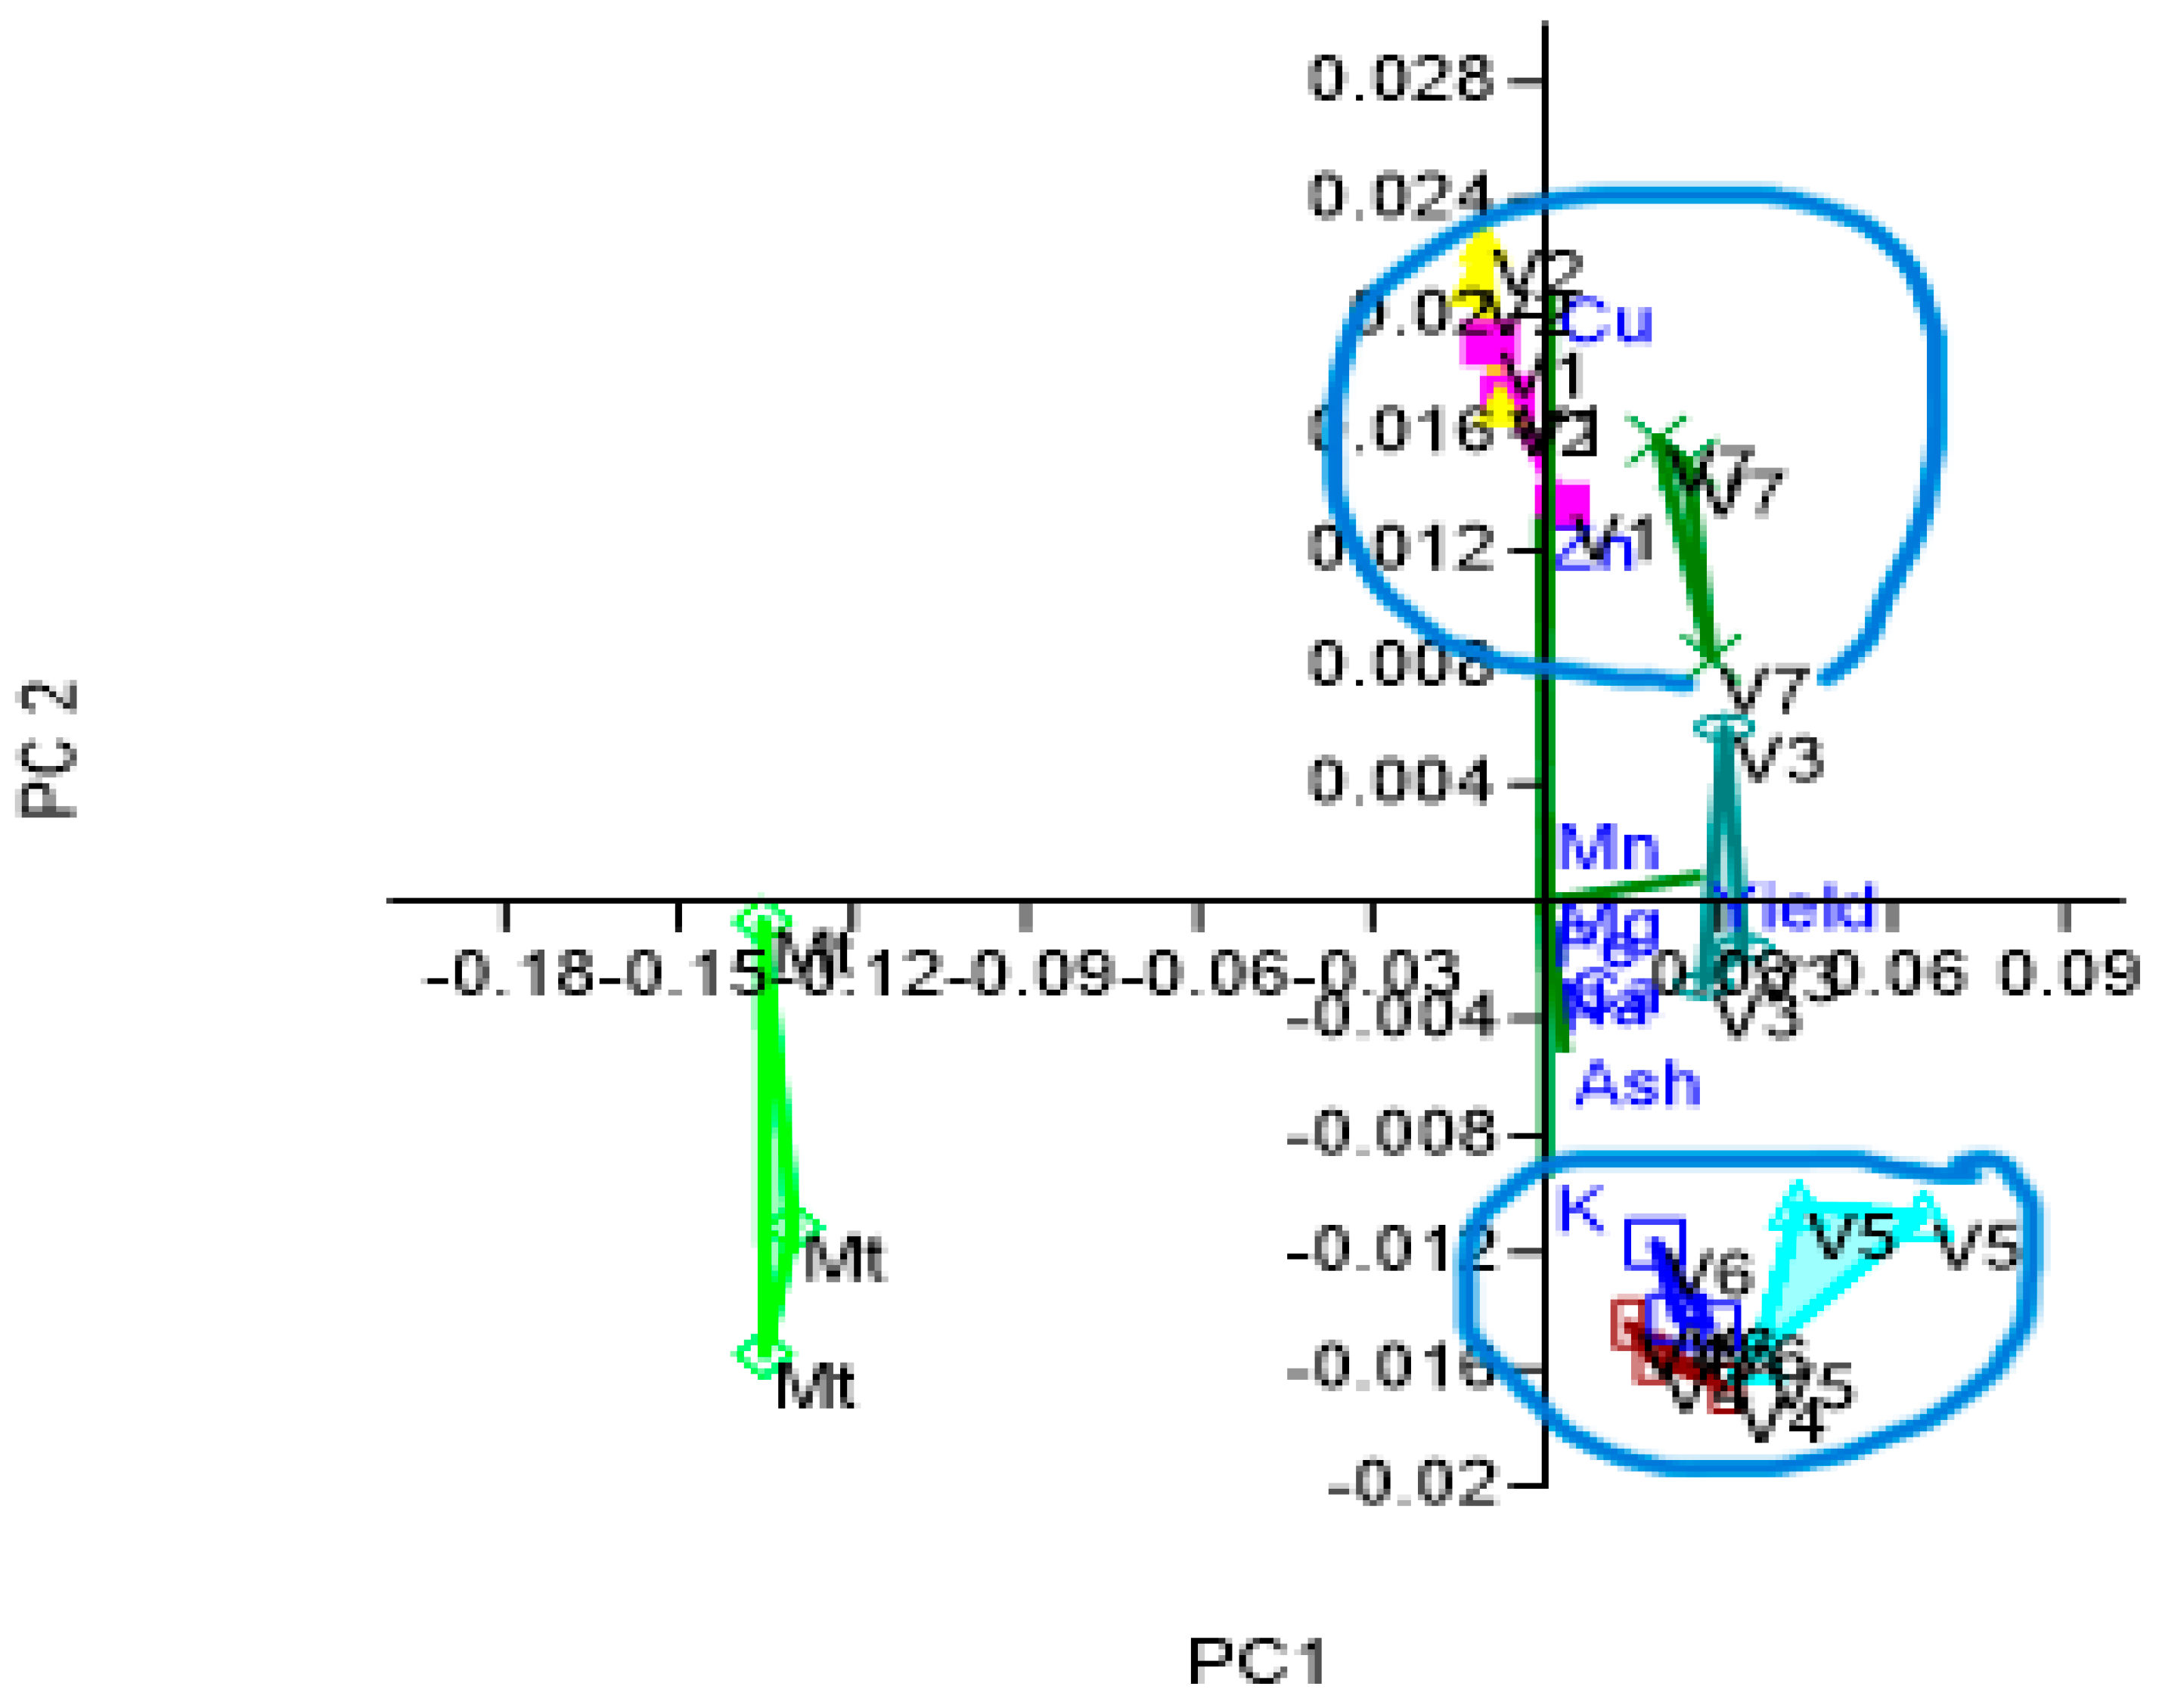
  • Groups of samples: Based on the “scores” (values of each sample on the principal components), PCA can group grain maize samples that respond similarly to the treatments (e.g., samples with high yield and similar protein content).
Unlike multiple regression, PCA has no limitation on the number of variables. This allows us to analyze even large datasets effectively. To achieve a clear visualization, only the first two or three principal components, which capture the most variance, are typically used for data reduction and plotting [50,51]. Since the values of macronutrients and minerals varied greatly (from units to thousands), data were log-transformed for standardization [52,53]. To better understand the complex relationships between treatments and various parameters, two separate PCA models were employed:
  • PCA-nutrient: This model explores the interactions between treatments and key maize quality aspects (yield, moisture, protein, lipids, fibers, carbohydrates).
  • PCA-mineral: This model focuses on the interactions between treatments and mineral content (yield, ash, macronutrients, and micronutrients).
For the biplot-type graphic representations, the mean values from the three years of experience for each experimental variant were used. This representation was chosen to obtain a more suggestive image of the presented data.

3. Results and Discussions

3.1. Impact of FF on Production and Humidity of Maize Grain

The production yields and seed moisture content resulting from the applied foliar treatments are presented in Table 1.
Maize yields significantly increased in all groups that received FF compared to the control group (Mt). The highest yields, that is 11,433 kg ha−1, were obtained in the V5 variant (with Zn) and 10,987 kg ha−1 in the V3 variant (with B), in which the base application of nitrogen and phosphorus was enriched with micronutrients. Generally, applying nitrogen fertilizers directly to leaves (foliar application) can improve grain production for a variety of crops, including maize [54,55]. Maize grains from all foliar-fertilized groups had lower moisture content compared to the control group (Mt). This difference was particularly significant for variants V4–V7. Studies on maize and other crops like sunflower and brassica have shown that boron and zinc can also improve seed production, particularly when applied alongside molybdenum [55,56,57].

3.2. The Influence of Foliar Fertilizers on the Protein, Lipid, Carbohydrate, and Fiber Content of Maize Grains

Raw protein, total lipid, carbohydrate, and fiber contents of maize grains are given in Table 2.
Mineral fertilization plays a significant role in influencing the qualitative parameters of crop production, including protein, lipid, and carbohydrate content [58,59]. The following observations were made regarding these parameters in the context of foliar fertilization:
Protein content: The application of FF, particularly those containing nitrogen, resulted in higher raw protein content compared to the control group (8.29%). Variants V5 and V6, which received foliar fertilization with nitrogen along with Zn-enriched ME (V5, V6), exhibited the highest protein content, reaching 11.62% and 11.38%, respectively. The statistical significance of this increase, particularly in the V5 variant, highlights the positive impact of micronutrient supplementation with zinc playing a particularly supportive role in enhancing protein content [27,59].
Lipid content: Interestingly, the lipid content decreased, especially when nitrogen fertilizers predominated. For example, variant V4 (15:0:0+2S+1B+ME, 6 Lha−1), which received predominantly nitrogen FF, showed the lowest lipid content at 3.72%, compared to 4.57% in the control group. Although both sulfur and boron enhance the growth and development of corn plants—sulfur by aiding the synthesis of sulfur-containing amino acids necessary for protein and lipid synthesis, and boron by improving cell wall structure and carbohydrate transport—our results indicate a significant decrease in lipid content as a result of foliar fertilization with nitrogen and these microelements [18,19,23]. This decrease in lipid content was statistically significant across the foliar-fertilized variants.
Carbohydrate content: The carbohydrate content showed relatively minor variation among the different treatments, ranging from 70.91% for variant V5 (24:0:0+3Zn+ME, 4 Lha−1) to 72.82% for the control variant. However, application of foliar fertilizer with predominantly nitrogen (V5) led to a reduction in carbohydrate content. This effect was consistently significant across all foliar fertilizer treatments, supporting a consistent impact of nitrogen fertilization on carbohydrate levels.
Regarding fiber content, all variants showed higher average fiber content than the control. However, the V5 (7.30% fiber content) and V6 (7.27% fiber content) variants, which used Zn-enriched foliar fertilizers, had the highest fiber content in maize grains, with strong statistical assurance. The positive effect of Zn on carbonic anhydrase, an enzyme involved in the production of polymeric carbohydrates, could explain these findings
In summary, foliar fertilization with various mineral combinations, particularly those containing nitrogen and micronutrients such as zinc, can significantly influence the qualitative parameters of crop production. While it tends to increase protein content, it often leads to a decrease in lipid content, especially when nitrogen predominates. Carbohydrate content may also be affected, particularly by nitrogen fertilization. These findings underscore the importance of carefully balancing nutrient inputs to optimize both yield and quality in crop production.
[25,54]
Principal component analysis (PCA) is a powerful statistical method used to analyze the relationships between variables and identify patterns in data [49,50,59]. In the context of foliar fertilizers and their effects on plant production and composition of macronutrients and minerals, PCA can provide valuable insights by reducing the dimensionality of the data while retaining as much information as possible. The objective of the PCA analysis was to elucidate the relationship between yield, plant characteristics, and the efficacy of foliar fertilizer treatments, focusing on variables such as yield, ash, humidity, lipid, protein, and carbohydrate and fiber contents, as well as macronutrients and micro-mineral contents. The analysis utilized PAST software, a tool commonly used for statistical analysis in ecological and paleontological research. PCA was applied to derive a limited set of linear combinations, known as principal components of the original variables, while retaining maximum information [60]. To simplify the analysis and graphical representation, two separate PCA models were constructed: PCA-nutrient model (Figure 3, Figure 4 and Figure 5) and PCA-mineral model (Figure 6 and Figure 7). These models aimed to explore the associations between types of fertilization (the seven variants) and macronutrients or minerals separately.
PCA-nutrient model: The screen plot graph of eigenvalues (Figure 3A) revealed that the first three principal components (PC1, PC2, and PC3) were sufficient to explain more than 96% of the variation in the dataset. PC1 captured 69% of the total variation, while PC2 and PC3 explained 19% and 8%, respectively. This suggests that these three components captured the majority of the variability in the relationship between foliar fertilizers and macronutrients.
In the PCA-nutrient model, yield, protein, and lipids present the highest coefficients of PCs loadings (Figure 3B–D). These three variables had the strongest influence on the grouping of treatments, according to their effects on the quantitative and qualitative parameters measured. The grouping results are illustrated in Figure 4 and Figure 5.
The graphical representations (Figure 4 and Figure 5) clearly illustrate distinct differences among the various variants compared to the control group. Here is a breakdown of the observed patterns:
Distinct Groupings:
Figure 4 displays three distinct groupings of the fertilized variants, each exhibiting unique characteristics compared to the control.
Group 1: Variants V1, V2, and V3, characterized by complex mineral fertilization with separate intakes of sulfur (S) and boron (B), showed maize grains with higher humidity and carbohydrate content, similar to the control group.
Group 2: Variants V5, V6, and V7, characterized by foliar mineral fertilization with nitrogen and the presence of zinc (Zn) and boron (B) in V7, demonstrated the highest productions. These variants also exhibit maize grains with the highest protein, fiber, and lipid content, particularly in V5 and V6.
Group 3: Variant V4, which received foliar fertilization with only nitrogen and a combination of sulfur and boron, represents the third group. The maize grains in this variant had the lowest lipid content, but high yield and protein compared to the other groups.
Effects of foliar fertilization:
Different experimental variants showed how foliar fertilization, with varying combinations of nutrients, influences both the yield and composition of maize grains.
Complex mineral fertilization (V1, V2, and V3-Group 1) resulted in maize grains with characteristics closer to the control group in terms of humidity and carbohydrate content.
Variants with foliar mineral fertilization primarily featuring nitrogen, zinc, and boron (Group 2: V5, V6, and V7) displayed the highest production levels and superior nutritional profiles, with elevated protein, fiber, and lipid content.
The variant receiving foliar fertilization with nitrogen and a combination of sulfur and boron (Group 3: V4) revealed the lowest lipid content but had the highest yield and protein among all the variants studied.
Overall, the graphical representations highlight the distinct effects of different FF strategies on both the composition and yield of maize grains. These findings provide valuable insights for optimizing fertilization practices to achieve desired production goals and improve crop quality.
Various research studies have indicated a similar effect of fertilizers with S, B, and other micronutrients when they are used together with classic mineral fertilizers [16,17,18,23,25].

3.3. The Effect of Foliar Fertilization on Essential Macroelement Contents in Maize Seeds

Alongside proteins, lipids, and carbohydrates, minerals are fundamental building blocks of plants, serving essential roles in both structural formation and enzymatic processes. Macroelements such as potassium (K), calcium (Ca), and magnesium (Mg) contribute to a plant’s physical structure, while microelements or trace metals like iron (Fe), manganese (Mn), zinc (Zn), copper (Cu), and molybdenum (Mo) play crucial roles in enzymatic functions [24]. The levels of these minerals in plants are subject to strong genetic control, with significant variability across different plant species. However, environmental factors, particularly the mineral nutrient content in water, soil, and air, can significantly influence the uptake and accumulation of minerals in crops. Studies conducted under various environmental conditions consistently demonstrate that higher concentrations of minerals in soil, groundwater, irrigation water, and air lead to increased mineral content in plants [61]. While genetics sets the upper limit, both organic and mineral fertilization can increase the concentration of macroelements and microelements in crops. This supplementation can improve the nutritional quality of plant-derived foods for both humans and animals. However, excessive exposure to metals can lead to serious contamination of plants and agricultural produce. While plants generally possess mechanisms to defend against metal toxicity, contamination events can pose significant risks to consumers. Even when plants show no visible signs of damage, high metal exposure via contaminated food can have harmful effects on human health. Therefore, careful management of fertilization practices and monitoring of environmental factors are essential to balance the benefits of mineral supplementation with the risks of contamination, ensuring the safety and quality of food derived from plants [61,62].

3.3.1. The Impact on Macronutrient Content of Maize Grains

The main macronutrients, K, P, Mg, and Ca, in the form of different inorganic or organic compounds, are present in maize grains [62]. Table 3 presents the effects of FF on the content of essential macronutrients in maize grains, including natrium alongside potassium, magnesium, calcium, and phosphorus, as well as the overall ash content.
The grains of the V4–V7 variants revealed a statistically significant enhancement in potassium content compared to the control variant. In contrast, for the V1–V3 variants, the measured values for these parameters were significantly decreased relative to the same benchmark.
Despite a modest increase compared to the control, magnesium levels were consistently elevated in the seeds of foliar-treated plants, with the highest levels in the V5 (24:0:0+3Zn+ME) and V6 (15:0:0+5Zn+ME) variants. An improvement in calcium content was also observed in all foliar-fertilized variants, with the biggest increases in the V5 and V6 variants. Except for the V1 (10:10:10+ME) variant, all other variants showed higher phosphorus content compared to the control, with small but significant increases (1–3 ppm).
Although the ash content was not significantly influenced by the foliar treatments, differences were observed among the minerals. Magnesium, calcium, and phosphorus, the primary macronutrients, exhibited increased concentrations, particularly in the V5 and V6 variants where the presence of foliar zinc was notable. Statistical analyses revealed that foliar fertilization significantly increased the content of primary macronutrients in all treated maize plants (Table 3).

3.3.2. The Influence of FF on the Content of Some Micronutrients in Maize Grains

Micronutrients, despite being present in smaller quantities compared to macronutrients, play a crucial role in plant and animal health, including humans. They act as cofactors for many enzymes, influencing respiration and nutrient uptake. A deficiency in micronutrients can have cascading effects, impacting various aspects of cell development such as cell division, cell wall formation, and proper hormone production, ultimately reducing overall plant or animal health and productivity [26]. Table 4 presents the analytical data regarding the presence of essential microelements (Zn, Fe, Mn, and Cu) in maize grains.
The main micronutrients are represented by Fe, Zn, Mn, and Cu, as compounds with organic acids of the plants. These metal compounds play a crucial metabolic role for both maize and their consumers, with plant-based food being the primary source of microelements for animals and humans [62,63]. Iron and zinc are the dominant trace elements, followed by manganese (Mn) and copper (Cu). In all treated variants, their values were like those in the controls, with statistical significance varying from insignificant to significant.
The scree plot of eigenvalues from the PCA-mineral model (Figure 6A) shows that the first two principal components (PCs) explain over 93% of the pattern variation, with PC1 accounting for 87% and PC2 around 6%. The loading coefficients (Figure 6B,C) indicate that calcium (Ca), phosphorus (P), potassium (K), and copper (Cu) were the primary variables responsible for most of the observed variation in the two principal components. Figure 7 clearly demonstrates the distinct effects of the different foliar treatments applied.
The analysis from Figure 7 reveals distinct groupings among the fertilized variants compared to the control treatment. The observed patterns were:
Group 1 (Variants V1, V2, and V7): these variants are characterized by complex mineral fertilization with separate intakes of sulfur (S) and boron (B). Maize grains from these variants exhibited higher contents of copper (Cu) and zinc (Zn).
Group 2 (Variants V4, V5, and V6): this group consisted of variants primarily receiving foliar mineral fertilization with nitrogen, with variant V4 additionally receiving sulfur. Maize grains from these variants displayed higher potassium (K) contents, especially in variants V5 and V6, and relatively uniform microelement compositions. Variant V5, which also belongs to this group, represents the variant with the highest production.
Variant V3, which lacks foliar potassium supplementation but includes boron (B) addition, did not exhibit significant differences in the composition of macroelements (sodium, magnesium, calcium, and phosphorus) or the microelement manganese (Mn) compared to the control.
Overall, the analysis highlights the differential effects of various fertilization treatments on the composition of maize grains. The distinct groupings indicate how different combinations of foliar fertilizers influence the macroelement and microelement contents of maize grains, as well as their overall production levels.

4. Conclusions

All foliar fertilizers tested yielded positive results in seed production. The V5 variant (24:0:0+3Zn+ME at 4L ha−1) showed the most significant increase in grain yield. This variant also displayed improvements in protein and fiber content, along with the lowest grain moisture percentage. Additionally, it had high levels of both macro-minerals (calcium, magnesium, potassium, phosphorus) and micro-minerals (iron, zinc, copper, manganese).
Also, the PCA-nutrient model reveals that variants V5 (24:0:0+3Zn+ME 4 Lha−1), V6 (15:0:0+5Zn+ME 4 Lha−1), and V7 (15:0:0+4B+ME 4 Lha−1), treated with FF containing only nitrogen as macro-fertilizer and, respectively, Zn and B as dominant micronutrients, form a distinct group characterized by high yield and quality parameters. The PCA-mineral model (Figure 7) reveals the isolated position of the V3 variant (8:10:0+8B+ME 2 Lha−1), characterized by a good yield and a superior quality of maize kernels. Our field experiment, conducted under the specific soil and climate conditions presented, determined that the combined foliar use of nitrogen, boron, and zinc was the most effective treatment for maximizing both yield and grain quality of maize.
By analyzing the complex interactions between FF and maize grain composition using PCA, we can develop a more targeted and practical approach. This allows the composition of FF to be adapted to achieve desired grain characteristics or to avoid undesirable ones. This information has the potential to significantly enhance the efficacy and precision of foliar fertilizer applications, ultimately leading to both higher maize crop quality and yield. This in turn contributes to both food security and sustainable agricultural practices.

Author Contributions

Conceptualization, F.C.; Methodology, I.R. and I.G.; Software, M.B.; Validation, F.C. and D.N.M.; Formal analysis, A.A.I.; Investigation, F.I.; Writing—original draft, D.N.M. and I.G.; Project administration, L.C. and A.L.; Funding acquisition, I.R. and F.I. All authors have read and agreed to the published version of the manuscript.

Funding

This research received no external funding.

Institutional Review Board Statement

Our studies not involving humans or animals.

Data Availability Statement

Data is contained within the article.

Conflicts of Interest

The authors declare no conflict of interest.

References

  1. Available online: https://insse.ro/cms/sites/default/files/com_presa/com_pdf/prod_veg_r22.pdf (accessed on 12 April 2023).
  2. Available online: https://www.profit.ro/povesti-cu-profit/agribusiness/romania-locul-1-in-ue-la-porumb-boabe-si-floarea-soarelui-atat-la-suprafata-cultivata-cat-si-la-productia-realizata-20657884 (accessed on 12 April 2023).
  3. Available online: https://www.agrimedia.ro/articole/temeri-privind-viitorul-porumbului-in-europa (accessed on 2 May 2023).
  4. Available online: https://www.lumeasatului.ro/articole-revista/agrotehnica/7471-evolutia-suprafetelor-si-recoltelor-de-porumb-in-ultimii-30-de-ani.html (accessed on 2 May 2023).
  5. Penuelas, J.; Fernando Coello, F.; Sardans, J. A better use of fertilizers is needed for global food security and environmental sustainability. Agric. Food Secur. 2023, 12, 5. [Google Scholar] [CrossRef]
  6. Girma, K.; Martin, K.L.; Freeman, K.W.; Mosali, J.; Teal, R.K.; Raun, W.R.; Moges, S.M.; Arnall, D.B. Determination of Optimum Rate and Growth Stage for Foliar-Applied Phosphorus in Maize. Commun. Soil. Sci. Plant Anal. 2007, 38, 1137–1154. [Google Scholar] [CrossRef]
  7. Fernández, V.; Eichert, T. Uptake of Hydrophilic Solutes Through Plant Leaves: Current State of Knowledge and Perspectives of Foliar Fertilization. Crit. Rev. Plant Sci. 2009, 28, 36–68. [Google Scholar] [CrossRef]
  8. Fernández, V.; Brown, P.H. From plant surface to plant metabolism: The uncertain fate of foliar-applied nutrients. Front. Plant Sci. 2013, 4, 289. [Google Scholar] [CrossRef]
  9. Fernández, V.; Sotiropoulos, T.; Brown, P.H. Foliar Fertilization: Scientific Principles and Field Pratices; International Fertilizer Industry Association (IFA): Paris, France, 2013; ISBN 979-10-92366-00-6. [Google Scholar]
  10. White, P.J.; Brown, P.H. Plant nutrition for sustainable development and global health. Ann. Bot. 2010, 105, 1073–1080. [Google Scholar] [CrossRef]
  11. Schreiber, L.; Schönherr, J. Water and Solute Permeability of Plant Cuticles. Measurement and Data Analysis; Springer-Verlag: Berlin/Heidelberg, Germany, 2009; pp. 1–29. [Google Scholar] [CrossRef]
  12. Yousaf, N.; Ishfaq, M.; Qureshi, H.A.; Saleem, A.; Yang, H.; Sardar, M.F.; Zou, C. Characterization of Root and Foliar-Applied Iron Oxide Nanoparticles (α-Fe2O3, γ-Fe2O3, Fe3O4, and Bulk Fe3O4) in Improving Maize (Zea mays L.) Performance. Nanomaterials 2023, 13, 3036. [Google Scholar] [CrossRef]
  13. Ishfaq, M.; Kiran, A.; Hafeezur, R.; Farooq, M.; Ijaz, N.H.; Nadeem, F.; Azeem, I.; Li, X.; Wakeel, A. Foliar nutrition: Potential and challenges under multifaceted agriculture. Environ. Exp. Bot. 2022, 200, 104909. [Google Scholar] [CrossRef]
  14. Otto, R.; Marques, J.P.R.; Pereira de Carvalho, H.W. Strategies for probing absorption and translocation of foliar applied nutrients. J. Exp. Bot. 2021, 72, 4600–4603. [Google Scholar] [CrossRef]
  15. Sager, M. Levels of Sulfur as an Essential Nutrient Element in the Soil-Crop-Food System in Austria. Agriculture 2012, 2, 1–11. [Google Scholar] [CrossRef]
  16. Carciochi, W.D.; Sadras, V.O.; Pagani, A.; Ciampitti, I.A. Co-limitation and stoichiometry capture the interacting effects of nitrogen and sulfur on maize yield and nutrient use efficiency. Eur. J. Agron. 2020, 113, 125973. [Google Scholar] [CrossRef]
  17. Ma, Y.; Zhang, H.; Xue, Y.; Gao, Y.; Qian, X.; Dai, H.; Liu, K.; Li, Q.; Li, Z. Effect of sulfur fertilizer on summer maize grain yield and soil water utilization under different irrigation patterns from anthesis to maturity. Agric. Water Manag. 2021, 250, 106828. [Google Scholar] [CrossRef]
  18. Wang, H.; Cui, S.; Fu, J.; Gong, H.; Liu, S. Sulfur Application Improves the Nutritional Quality of Maize by Regulating the Amino Acid Balance of Grains. Agronomy 2023, 13, 2912. [Google Scholar] [CrossRef]
  19. Matthes, M.S.; Robil, J.M.; McSteen, P. From element to development: The power of the essential micronutrient boron to shape morphological processes in plants. J. Exp. Bot. 2020, 71, 1681–1693. [Google Scholar] [CrossRef] [PubMed]
  20. Wimmer, M.A.; Abreu, I.; Bell, R.W.; Bienert, M.D.; Brown, P.H.; Dell, B.; Fujiwara, T.; Goldbach, H.E.; Lehto, T.; Mock, H.P.; et al. Boron: An essential element for vascular plants: A comment on Lewis (2019) Boron: The essential element for vascular plants that never was. New Phytol. 2020, 226, 1232–1237. [Google Scholar] [CrossRef] [PubMed]
  21. Fátima Gotz, L.; Silvestrin, F.; Motta, A.C.V.; Pauletti, V. Response to Application and Tissue Diagnosis of Boron Deficiency and Toxicity in Maize. Commun. Soil. Sci. Plant Anal. 2021, 52, 2898–2911. [Google Scholar] [CrossRef]
  22. Luz, P.H.C.; Marin, M.A.; Devechio, F.F.S.; Romualdo, L.M.; Zuñiga, A.M.G.; Oliveira, M.W.S.; Bruno, O.M. Boron Deficiency Precisely Identified on Growth Stage V4 of Maize Crop Using Texture Image Analysis. Commun. Soil. Sci. Plant Anal. 2018, 49, 159–169. [Google Scholar] [CrossRef]
  23. Lordkaew, S.; Dell, B.; Jamjod, S.; Rerkasem, B. Boron deficiency in maize. Plant Soil. 2011, 342, 207–220. [Google Scholar] [CrossRef]
  24. Kumar, S.; Mohapatra, T. Interaction Between Macro- and Micro-Nutrients in Plants. Front. Plant Sci. 2021, 12, 665. [Google Scholar] [CrossRef]
  25. Grabovskyi, M.; Kucheruk, P.; Pavlichenko, K.; Roubík, H. Influence of macronutrients and micronutrients on maize hybrids for biogas production. Environ. Sci. Pollut. Res. Int. 2023, 30, 70022–70038. [Google Scholar] [CrossRef]
  26. Sharma, R.K.; Agrawal, M. Biological Effects of Heavy Metals: An Overview. J. Environ. Biol. 2005, 26 (Suppl. S2), 301–313. [Google Scholar]
  27. Brankov, M.; Simíc, M.; Dolijanoviíc, Z.; Rajkovíc, M.; Mandíc, V.; Dragcevíc, V. The Response of Maize Lines to Foliar Fertilizing. Agriculture 2020, 10, 365. [Google Scholar] [CrossRef]
  28. Faraz, A.M.; Jamil, M.; Ahmad, K.; Bakar, A.M.; Abbas, M.S.; Nadeem, M.; Batool, T. Effect of Copper on Sunflower (Helianthus annus L.). Int. J. Sci. Res. Publ. 2020, 10, 205. [Google Scholar] [CrossRef]
  29. Available online: https://www.meteoromania.ro/servicii/date-meteorologice/ (accessed on 19 May 2023).
  30. Șmuleac, L.; Rujescu, C.; Șmuleac, A.; Imbrea, F.; Radulov, I.; Manea, D.N.; Ienciu, A.; Adamov, T.; Pașcalău, R. Impact of Climate Change in the Banat Plain, Western Romania, on the Accessibility of Water for Crop Production in Agriculture. Agriculture 2020, 10, 437. [Google Scholar] [CrossRef]
  31. Nortjé, G.P.; Laker, M.C. Soil Fertility Management in Conservation Agriculture. South Afr. J. Plant Soil. 2021, 38, 247–257. [Google Scholar] [CrossRef]
  32. Radulov, I.; Sala, F.; Berbecea, A.; Crista, F. Changes of soil microelements content after intesive mineral fertilization. Res. J. Agric. Sci. 2009, 41, 487–492. [Google Scholar]
  33. Barrow, N.J.; Hartemink, A.E. The effects of pH on nutrient availability depend on both soils and plants. Plant Soil. 2023, 487, 21–37. [Google Scholar] [CrossRef]
  34. Crista, F.; Radulov, I.; Crista, L.; Berbecea, A.; Lațo, A. Influence of mineral fertilization on the amino acid content and raw protein of wheat grain. J. Food Agric. Environ. (JFAE) 2012, 10, 47–50. [Google Scholar]
  35. Hybrid Description. Available online: https://search.app/QhEFA17P3J8xCtYB8 (accessed on 11 August 2024).
  36. BBCH. Available online: https://www.bionity.com/en/encyclopedia/BBCH-scale_%28maize%29.html (accessed on 28 March 2024).
  37. Adengo Herbicide. Available online: http://www.royalagroscience.com/en/bayer6/adengo-sc-4652.html (accessed on 19 March 2024).
  38. Available online: https://schachtner-sprayer.de/en (accessed on 19 March 2024).
  39. Available online: www.ospatimisoara.ro (accessed on 15 February 2023).
  40. Available online: www.renar.ro (accessed on 15 February 2023).
  41. SR EN ISO 712:2010; Determinarea Umidității. ISO: Geneva, Switzerland, 2010. Available online: https://magazin.asro.ro/ro/standard/181049 (accessed on 22 April 2023).
  42. SR ISO 2171:2002; Determinarea Cenușii la Cereale. ISO: Geneva, Switzerland, 2002. Available online: https://magazin.asro.ro/ro/standard/28087 (accessed on 22 April 2023).
  43. SR EN ISO 20483:2014; Metoda Kjeldahl, Cereale. ISO: Geneva, Switzerland, 2014. Available online: https://magazin.asro.ro/ro/standard/226094 (accessed on 22 April 2023).
  44. Norma Sanitară-Veterinară din 21 Februarie 2007, Metoda Soxhlet. Available online: https://legislatie.just.ro/Public/DetaliiDocument/80122 (accessed on 22 April 2023).
  45. Hărmănescu, M. Comparative researches on two direct transmethylation without prior extraction methods for fatty acids analysis in vegetal matrix with low fat content. Chem. Cent. J. 2012, 6, 8. [Google Scholar] [CrossRef]
  46. Available online: https://www.servitechexpres.ro/analizoare-furaje/sistem-determinare-fibra-foss-fibertec-8000/ (accessed on 22 April 2023).
  47. Bordean, D.M.; Borozan, A.B.; Cojocariu, L.; Moigradean, D.; Cojocariu, A.; Nica, D.; Pirvulescu, L.; Alda, S.; Horablaga, M. Seasonal variation in nutrient content of some leafy vegetables from Banat County, Romania. Rev. Agric. Rural Dev. 2013, 2, 170–174. [Google Scholar]
  48. Kiandokht Ghanati, K.; Farid Zayeri, F.; Hedayat Hosseinia, H. Potential Health Risk Assessment of Different Heavy Metals in Wheat Products. Iran J Pharm Res. 2019, 18, 2093–2100. [Google Scholar] [CrossRef]
  49. Boldea, M.; Sala, F.; Radulov, I.; Crista, F. A Mathematical Model on the Dependence between the Agricultural Production and Chemical Fertilizer. In International Conference on Numerical Analysis and Applied Mathematics; American Institute of Physics (AIP): College Park, MY, USA, 2010; pp. 1363–1366. [Google Scholar] [CrossRef]
  50. Olive, D.J. Principal Component Analysis. In Robust Multivariate Analysis; Springer: Cham, Switzerland, 2017; pp. 189–217. [Google Scholar]
  51. Gergen, I.; Hărmănescu, M. Application of principal component analysis in the pollution assessment with heavy metals of vegetable food chain in the old mining areas. Chem. Cent. J. 2012, 6, 156. [Google Scholar] [CrossRef] [PubMed]
  52. The PAST Software. Available online: https://www.nhm.uio.no/english/research/resources/past/ (accessed on 15 February 2023).
  53. Ter Braak, C.J.F.; Van Tongeren, O.F.R. Data Analysis in Community and Landscape Ecology; Jongman, R.H., Ed.; Pudoc Wageningen: Wageningen, The Netherlands, 1987; Available online: https://edepot.wur.nl/410376 (accessed on 22 April 2023).
  54. Cassim, B.M.A.R.; Martins Machado, A.P.; Fortune, D.; Moreira, F.R.; De Oliveira Zampar, E.J.; Batistand, M.A. Effects of Foliar Application of Urea and Urea-Formaldehyde/Triazone on Soybean and Maize Crops. Agronomy 2020, 10, 1549. [Google Scholar] [CrossRef]
  55. Yang, M.; Shi, L.; Xu, F.-S.; Lu, J.-W.; Wang, Y.H. Effects of Bo, Mo, Zn, and Their Interactions on Seed Yield of Rapeseed (Brassica napus L.). Pedosphere 2009, 19, 53–59. [Google Scholar] [CrossRef]
  56. Crista, F.; Radulov, I.; Imbrea, F.; Manea, D.N.; Boldea, M.; Gergen, I.; Ienciu, A.A.; Dunea-Banatean, I. The Study of the Impact of Complex Foliar Fertilization on the Yield and Quality of Sunflower Seeds (Helianhtus annuus L.) by Principal Component Analysis. Agronomy 2023, 13, 2074. [Google Scholar] [CrossRef]
  57. Ali, A.; Ali, Q.; Ahsan, M. Foliar application of micronutrients enhances growth, yield, and quality of maize (Zea mays L.) grown under two different irrigation regimes. Turk. J. Field Crops 2017, 22, 236–247. [Google Scholar]
  58. Sabourifard, H.; Estakhr, A.; Bagheri, M.; Hosseini, S.J.; Keshavarz, H. The quality and quantity response of maize (Zea mays L.) yield to planting date and fertilizers management. Food Chem. Adv. 2023, 2, 100196. [Google Scholar] [CrossRef]
  59. Crista, F.; Radulov, I.; Crista, L.; Lațo, A.; Stroia, C.; Băghină, N.; Gaica, I. Changing quality indicators of maize grain following mineral fertilizers application. Curr. Opin. Biotechnol. 2013, 24, S69. [Google Scholar] [CrossRef]
  60. Ferraz, G.A.S.; Ferraz, P.F.P.; Martins, F.B.; Silva, F.M.; Damasceno, F.A.; Barbari, M. Principal components in the study of soil and plant properties in precision coffee farming. Agron. Res. 2019, 17, 418–429. [Google Scholar] [CrossRef]
  61. Kabata, A.; Pendias, H. Trace Elements in Soils and Plants, 3rd eds.; CRC Press: Boca Raton, FL, USA, 2001; p. 365. [Google Scholar]
  62. McDowell, L.R. Minerals in Animal and Human Nutrition; Academic Press: New York, NY, USA, 1992. [Google Scholar]
  63. Available online: https://www.vedantu.com/biology/role-of-macronutrients-and-micronutrients (accessed on 15 February 2023).
Figure 1. The location of the experimental field in Timis county, Romania, and some pictures of the corn crop.
Agriculture 14 01428 g001
Figure 2. (A). The monthly temperatures (°C, average values), Timișoara, (2020–2022), compared to the 1880–2018 multi-year average temperatures [29]. (B). The monthly precipitation (average values, mm), Timișoara, (2020–2022), compared to the multi-year average (1880–2018) [29,32].
Agriculture 14 01428 g002aAgriculture 14 01428 g002b
Figure 3. A scree plot visualizing the eigenvalues was generated to determine the optimal number of principal components (A). Loadings for the first three components, PC1 (B), PC2 (C), and PC3 (D) were extracted for further analysis. (Red line represents mathematical extrapolation, and the blue line represents the calculated values).
Agriculture 14 01428 g003
Figure 4. The PCA-nutrient model biplot shows the first two principal components (PC1 and PC2) from a variance–covariance perspective. The color gradients indicate the data distribution points for each experimental variant across the three study years.
Agriculture 14 01428 g004
Figure 5. A biplot scatterplot illustrating the relationship between PC1 and PC3 in the PCA-nutrient model, using a variance–covariance matrix. PC3 might be less informative due to capturing a smaller portion of the variance. The color gradients indicate the data distribution points for each experimental variant across the three study years.
Agriculture 14 01428 g005
Figure 6. Eigenvalue scree plot (A) and loadings for PC1 (B) and PC2 (C) in the PCA-mineral model. (Red line represents mathematical extrapolation and the blue line represents the calculated values).
Agriculture 14 01428 g006
Figure 7. A biplot illustrating the relationship between the first two principal components (PC1 and PC2) within the PCA-mineral model is presented. Data points representing each experimental variant across the three-year study period are color-coded for clarity.
Agriculture 14 01428 g007
Table 1. Impact of foliar fertilizers on maize yield and grain moisture content.
Measured ParametersGrain YieldHumidity (Relative to the Fresh Mass)
Unitskg ha−1% (Regarding Mt)%
VariantsMean/SD Mean/SD
V110,147 ***
146
13413.10 NS
0.05
V29997 ***
50
13212.91 NS
0.06
V310,987 ***
81
14612.97 NS
0.14
V410,723 ***
219
14211.99 **
0.17
V511,433 ***
416
15111.71 ***
0.20
V610,777 ***
108
14311.51 ***
0.23
V710,813 ***
96
14311.71 **
0.27
Mt7550
60
10013.15
0.21
Statistical significance was determined using t-tests. Differences between sample means and the control (Mt) were considered statistically significant at p ≤ 0.01 (**), and p ≤ 0.001 (***). Values without a significant difference from the control are denoted as NS (p > 0.05).
Table 2. The total protein, lipid, carbohydrate, and fiber contents of maize grains.
Analyzed NutrientsProteinsLipidsCarbohydratesFibers
Variants/Unit%, Mean/SD
V19.40 ***
0.02
3.93 ***
0.03
72.36 **
0.05
7.17 *
0.02
V2 (S)9.18 ***
0.03
3.95 **
0.10
72.76 NS
0.10
7.10 NS
0.01
V3 (B)9.46 ***
0.11
4.45 NS
0.04
71.91 **
0.28
7.10 NS
0.02
V4 (S+B)10.97 ***
0.08
3.72 ***
0.12
72.09 **
0.17
7.21 *
0.04
V5 (Zn)11.62 ***
0.11
4.54 NS
0.10
70.91 **
0.37
7.30 ***
0.02
V6 (Zn)11.38 ***
0.02
4.65 NS
0.02
71.21 ***
0.23
7.27 **
0.02
V7 (B)10.81 ***
0.03
4.68 NS
0.07
71.58 **
0.29
7.24 *
0.06
Mt8.29
0.17
4.57
0.11
72.82
0.12
7.09
0.04
Statistical significance was determined using t-tests. Differences between sample means and the control (Mt) were considered statistically significant at p ≤ 0.05 (*), p ≤ 0.01 (**), and p ≤ 0.001 (***). Values without a significant difference from the control are denoted as NS (p > 0.05).
Table 3. Ash and macronutrient contents of maize grains in the analyzed variants.
MineralsAshCaMgKNaP
Units%mg kg−1
VariantsMean/SD
V11.21 NS
0.01
7.10 *
0.03
128.07 ***
0.31
278.50 ***
0.10
34.67 *
0.15
211.07 NS
0.21
V21.21 NS
0.00
7.08 *
0.03
127.97 **
0.21
278.37 ***
0.06
34.73 *
0.21
211.70 *
0.40
V31.22 NS
0.01
7.13 **
0.02
127.37 *
0.12
278.83 ***
0.06
35.17 NS
0.15
212.53 ***
0.15
V41.24 *
0.01
7.16 **
0.01
127.70 **
0.20
288.07 **
0.06
34.63 **
0.06
213.57 ***
0.32
V51.22 NS
0.01
7.20 **
0.02
128.40 ***
0.10
288.70 **
0.20
35.20 NS
0.10
214.63 ***
0.21
V61.24 NS
0.03
7.18 **
0.01
128.23 ***
0.12
288.57 **
0.21
35.40 *
0.10
214.57 ***
0.12
V71.21 NS
0.02
7.16 **
0.02
127.73 *
0.40
288.33 **
0.15
35.23 NS
0.06
213.63 ***
0.25
Mt1.17
0.04
6.96
0.05
126.77
0.25
286.8.
0.35
35.10
0.09
210.40
0.36
Statistical significance was determined using t-tests. Differences between sample means and the control (Mt) were considered statistically significant at p ≤ 0.05 (*), p ≤ 0.01 (**), and p ≤ 0.001 (***). Values without a significant difference from the control are denoted as NS (p > 0.05).
Table 4. The microelement contents of maize grains in the investigated variants.
MineralsFeZnCuMn
Unitmg kg−1
VariantsMean/SD
V12.66 NS
0.06
2.34 *
0.01
0.33 *
0.00
0.48 NS
0.00
V22.72 NS
0.02
2.29 NS
0.02
0.33 **
0.00
0.49 *
0.00
V32.76 NS
0.01
2.21 NS
0.06
0.32 NS
0.00
0.49 **
0.00
V42.71 NS
0.01
2.19 NS
0.02
0.32 NS
0.00
0.48 NS
0.00
V52.66 NS
0.04
2.22 NS
0.02
0.31 NS
0.00
0.49 *
0.00
V62.70 NS
0.02
2.28 NS
0.01
0.31 NS
0.00
0.48 *
0.00
V72.70 NS
0.04
2.28 NS
0.03
0.33 **
0.00
0.48 NS
0.00
Mt2.72
0.03
2.25
0.04
0.31
0.00
0.48
0.00
Statistical significance was determined using t-tests. Differences between sample means and the control (Mt) were considered statistically significant at p ≤ 0.05 (*) and p ≤ 0.01 (**). Values without a significant difference from the control are denoted as NS (p > 0.05).
Disclaimer/Publisher’s Note: The statements, opinions and data contained in all publications are solely those of the individual author(s) and contributor(s) and not of MDPI and/or the editor(s). MDPI and/or the editor(s) disclaim responsibility for any injury to people or property resulting from any ideas, methods, instructions or products referred to in the content.

