Article

Construction of Indicators of Low-Temperature Stress Levels at the Jointing Stage of Winter Wheat

1
Collaborative Innovation Center of Forecast and Evaluation of Meteorological, Nanjing University of Information Science & Technology, Nanjing 210044, China
2
State Key Laboratory of Severe Weather (LASW), Chinese Academy of Meteorological Sciences, No. 46, Zhongguancun South Street, Haidian District, Beijing 100081, China
3
National Meteorological Center, Beijing 100081, China
4
Department of Atmospheric Science, School of Environmental Studies, China University of Geosciences, Wuhan 430074, China
*
Authors to whom correspondence should be addressed.
Agriculture 2024, 14(8), 1430; https://doi.org/10.3390/agriculture14081430
Submission received: 9 July 2024 / Revised: 9 August 2024 / Accepted: 21 August 2024 / Published: 22 August 2024
(This article belongs to the Section Crop Production)

Abstract

:
This study aimed to investigate the impact of low-temperature (LT) stress during the jointing stage on three most representative wheat varieties in the Huang-Huai-Hai region: “Shannong 38” (a robust winter wheat variety), “Jimai 22” (a semi-winter wheat variety), and “Zhenmai 12” (a weak winter wheat variety). The objective was to explain the sensitivity and change thresholds of various physiological and yield indicators of three winter wheat varieties to low temperatures during the jointing stage and to construct an index for the grading of LT disasters during the jointing stage using principal component analysis. Controlled environment experiments were conducted using an artificial climate chamber during the jointing stage of winter wheat. Five daily minimum temperature treatments were applied, namely (T1, −6 °C); (T2, −3 °C); (T3, 0 °C); (T4, 3 °C); (T5, 6 °C); and control (CK, 8 °C). The duration of treatments was divided into three levels: (D1: 2 days), (D2: 4 days), and (D3: 6 days). It was found that the photosynthetic parameters and chlorophyll content showed a decreasing trend with the increase in the degree of LT stress. The activities of protective enzymes and endogenous hormones increased during the early stages of LT stress or at relatively high temperatures. However, they decreased significantly with an increase in LT stress. Among the varieties, “Zhenmai 12” exhibited a yield reduction rate exceeding 10% under 3 °C LT stress for more than 4 days and a yield reduction rate exceeding 20% under 0 °C LT stress for more than 6 days. “Jimai 22” showed a yield reduction rate exceeding 10% under 3 °C LT stress lasting more than 2 days, and a yield reduction rate exceeding 20% under −3 °C LT stress lasting more than 4 days. “Shannong 38” experienced a yield reduction rate exceeding 10% under 0 °C LT stress lasting more than 4 days and a yield reduction rate exceeding 20% under −6 °C LT stress lasting more than 6 days. Principal component analysis (PCA) conducted on all trait indicators of the three winter wheat varieties revealed that “Zhenmai 12” experienced mild LT stress at 6 °C for 2 days, moderate LT stress at 0 °C for 6 days, and severe LT stress at −3 °C for 6 days. “Jimai 22” experienced mild LT stress under 6 °C for 6 days, moderate LT stress under 0 °C for 4 days, and severe LT stress under −6 °C for 2 days. “Shannong 38” experienced mild LT stress under 3 °C for 4 days, moderate LT stress under 0 °C for 4 days, and severe LT stress under −6 °C for 6 days.

Graphical Abstract

1. Introduction

Wheat (Triticum aestivum L.), a grass family and wheat genus member, is an annual or overwintering herb [1,2]. It is one of the three staple grains, and its yield is second only to corn and rice in the global scope. It has a relatively wide range of planting [3]; there are 43 countries, and about 40 of the population has wheat as the primary food [4]. Its cultivation also has prominent regional characteristics, mainly concentrated in the United States, Canada, Australia, China, and other temperate and subtropical regions [5]. Wheat is classified into spring wheat and winter wheat, based on whether it is sown in spring or autumn. China is the world’s largest producer of winter wheat, and its planting areas are mainly distributed south of the Great Wall [6]. According to data from the National Bureau of Statistics of China, in 2023, the winter wheat planting area in China was 23.6 million ha, of which the winter wheat planting area in the Huang-Huai-Hai region was 17.8 million ha, accounting for 75.42% of the total winter wheat area in China. This region is considered the “golden area” for winter wheat production in China [7].
In recent years, the damage caused by meteorological disasters to agricultural production has become increasingly severe due to changes in the global ecological environment and meteorological conditions [8]. The impact of various extreme weather events has continued to increase, posing significant threats to the agricultural economy and food production [9]. High temperatures and droughts are major factors that lead to a reduction in wheat production. Studies have shown that for every degree Celsius increase in global temperature, wheat production is reduced by about 6% [10]. Drought can significantly affect the growth and development of wheat, leading to a decrease in yield [11]. Extremely high temperatures and droughts have occurred in many locations, such as India, Europe, the United States, and other major wheat-producing areas, which have been affected to varying degrees, resulting in a significant decline in wheat production [12,13]. Meanwhile, Low-temperature (LT) stress also affects wheat production worldwide [14]. LT stress not only affects specific regions but is also widespread in several winter wheat-growing regions around the globe. From the United States, Europe, China, and India in Asia in the Northern Hemisphere to Australia and South Africa in the Southern Hemisphere, winter wheat is threatened by low temperatures at different growth stages. In significant wheat-exporting countries such as the United States, extreme cold weather has reduced wheat production, with far-reaching effects on the global grain market [15]. Mainland China spans warm and temperate climate zones, with most regions exhibiting distinct characteristics of the East Asian monsoon climate and pronounced temperate continental features [16]. LT stress constitutes one of the significant meteorological disasters in the Huang-Huai-Hai winter wheat region [17]. On the one hand, the evident global warming trend and the increasing frequency of warm winters have led to early germination of overwintering crops and a heightened potential threat from late frost, indicating that management departments or growers need to increase their attention to LT disasters [18]. On the other hand, intensified climate fluctuations have exacerbated the occurrence of LT disasters, resulting in increased vulnerability of crops and posing severe challenges to the stable and high-yield production of winter wheat [19,20]. This situation seriously threatens the rural economic growth and national food security.
Photosynthesis is an essential physiological process of crop metabolism and is one of the first physiological functions to be affected by LT stress in plants. It was found that LT caused profound inhibition of photosynthetic metabolism in seedling maize leaves, profound loss of chlorophyll content, and decreased Pn, Gs, and Tr. At the same time, cold-tolerant varieties showed a specific adaptability to low temperatures [21]. LT stress also greatly impacted the photosynthetic characteristics of rice leaves. Compared with the control, the relevant indexes of photosynthetic characteristics of rice leaves decreased by 4.98%–93.94% on average after LT treatment [22]. Winter wheat yield primarily depends on partitioning the total canopy biomass into harvestable organs [23]. By studying the photosynthetic characteristics of winter wheat under LT stress, scholars have found that even short-term LT stress can disrupt photosynthesis in winter wheat leaves, reducing the area of source organs and ultimately resulting in grain yield loss [24]. LT stress also restricts stomatal conductance (Gs), affecting leaf transpiration rate (Tr), reducing the content of photosynthetic pigments and light utilization efficiency in winter wheat leaves, and ultimately decreasing leaf photosynthetic capacity [3].
The effects of temperature or environmental changes on plants can also be observed by studying leaf-protective enzyme activities and endogenous hormone contents under adversity [25]. It was found that maize leaf and root protective enzyme activities under water stress increased significantly in the pre-intermediate stage (male tetrad stage) but declined at the physiological maturity stage. The proline content, growth hormone (IAA), gibberellin (GA), and zeatin (ZT) of winter wheat leaves under drought stress showed an increasing trend and then decreased with an increase in stress time [26]. Rehydration after mild drought could regulate the changes in endogenous hormone contents, optimizing the root morphology and promoting dry matter transfer to the ear and yield formation [27]. By investigating protective enzyme activity and endogenous hormones in winter wheat subjected to LT stress, scholars have discovered that LT exposure during the flowering stage elevates the concentration of reactive oxygen species (ROS) in winter wheat leaves [28]. The superoxide dismutase (SOD), catalase (CAT), and peroxidase (POD) within the plant play a role in inhibiting oxidative damage caused by LT, and their activities show an increasing trend [29]. Studies have revealed that when winter wheat is subjected to stresses such as high temperature, low temperature, or drought, the abscisic acid (ABA) content in its roots and leaves significantly increases [30]. Moreover, winter wheat varieties with strong cold resistance generally have higher ABA contents than those with weaker cold resistance. Gibberellin (GA) consistently shows a decreasing trend under stress conditions [31,32]. Endogenous hormones act as signaling molecules involved in the regulation of plant adaptation to stress, which is mainly reflected in changes in the levels of zeatin riboside (ZR), indole-3-acetic acid (IAA), abscisic acid (ABA), and gibberellin (GA). Research indicates that LT during the flowering stage decreases IAA and GA contents in the floral organs of winter wheat, with a slight increase in ABA content [33]. LT stress during the grain-filling stage significantly reduces the ZR and IAA contents in the roots of winter wheat, indirectly affecting its yield [34].
The extent of damage to winter wheat’s physiological growth and yield caused by LT stress primarily depends on the intensity, duration, and growth stage of the stress [35]. In China, LT events typically occur in March and April, during which winter wheat is in the jointing stage after the resumption of growth. Currently, research on LT disasters in winter wheat mainly focuses on booting, flowering, and grain-filling stages. There is relatively little research on LT stress during the jointing stage, which is the most frequent period of LT occurrence. In addition, previous studies on the impact of LT on winter wheat yield and its mechanisms have mainly focused on a single variety without comparing the differences between different winter wheat varieties. The degree of LT stress was significantly different from that of the control (CK), making it impossible to observe the effects of mild LT stress on various physiological characteristics of winter wheat. Furthermore, based on mechanism analysis, no information with application value, such as LT disaster levels, was provided. The objectives of this study were: (1) to quantify the impact of LT stress during the jointing stage on the photosynthetic characteristics, senescence characteristics, endogenous hormone content, yield, and its component indicators of winter wheat; (2) to explore the differences in the response of various trait indicators of different winter wheat varieties to changes in LT stress, in order to better understand their response to LT stress during the jointing stage; and (3) to construct LT disaster level indicators based on various physiological and yield indicators of different winter wheat varieties, providing a theoretical basis for formulating corresponding disaster prevention and mitigation measures.

2. Materials and Methods

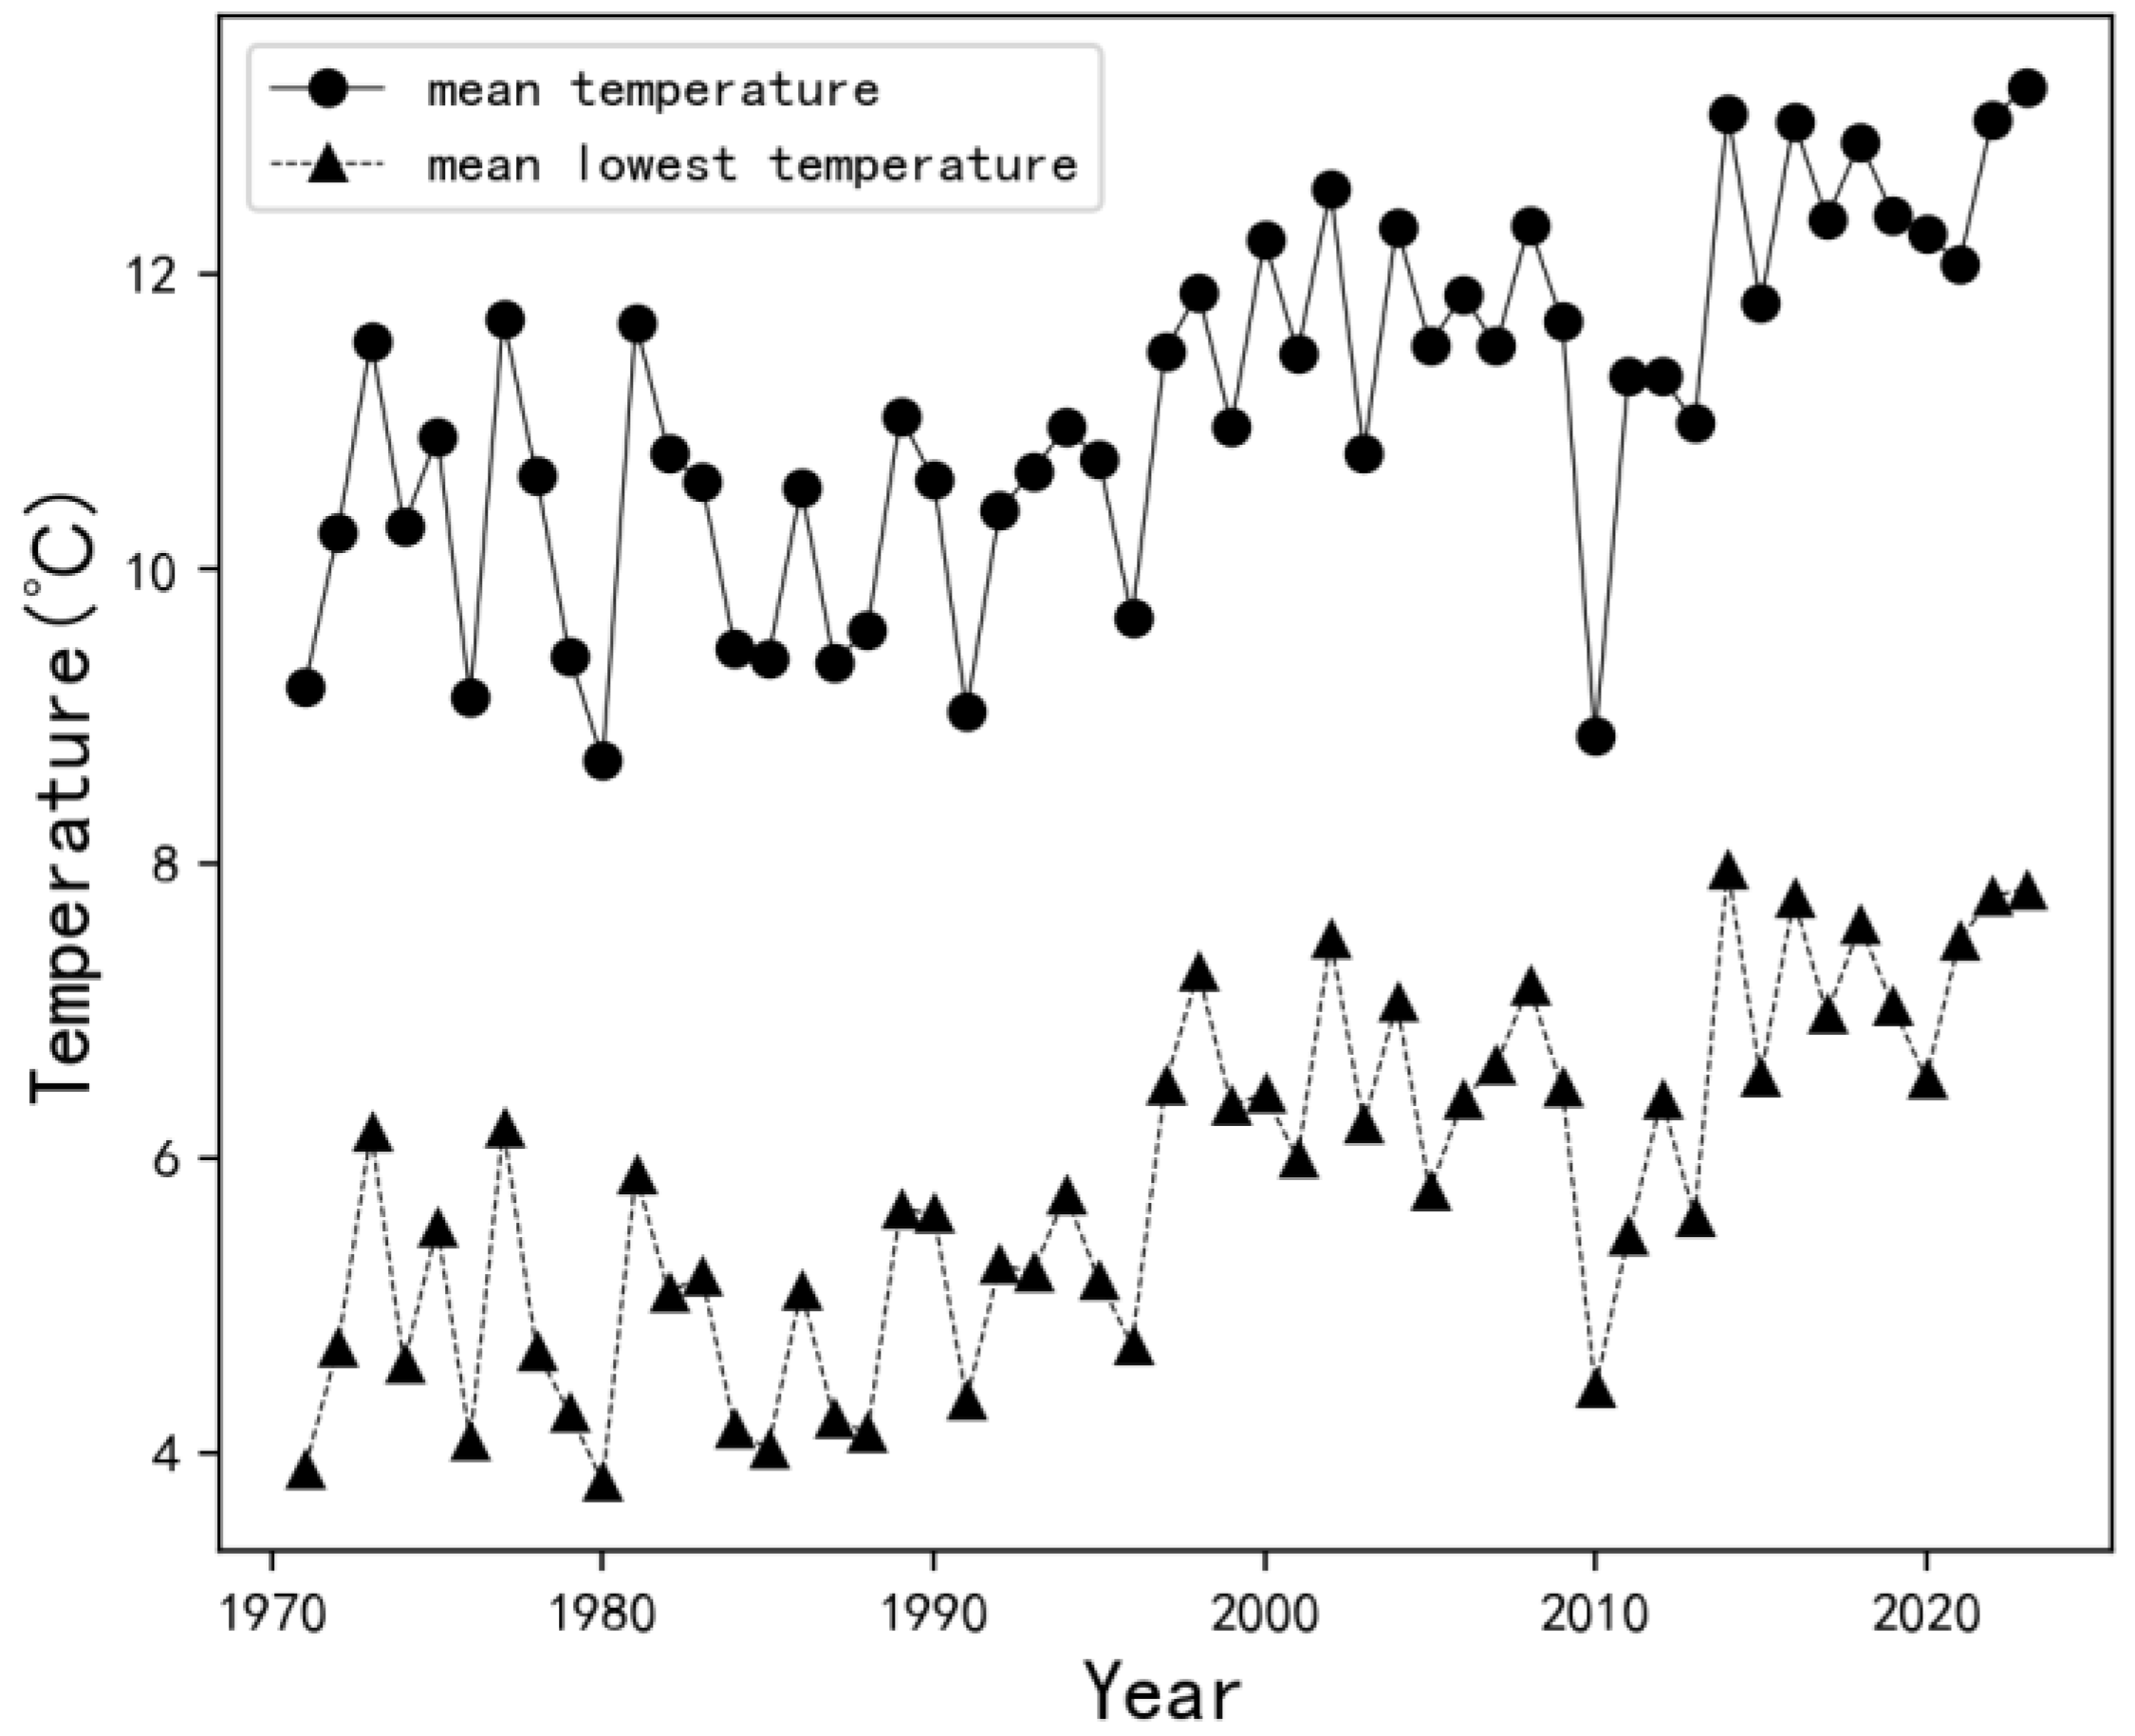
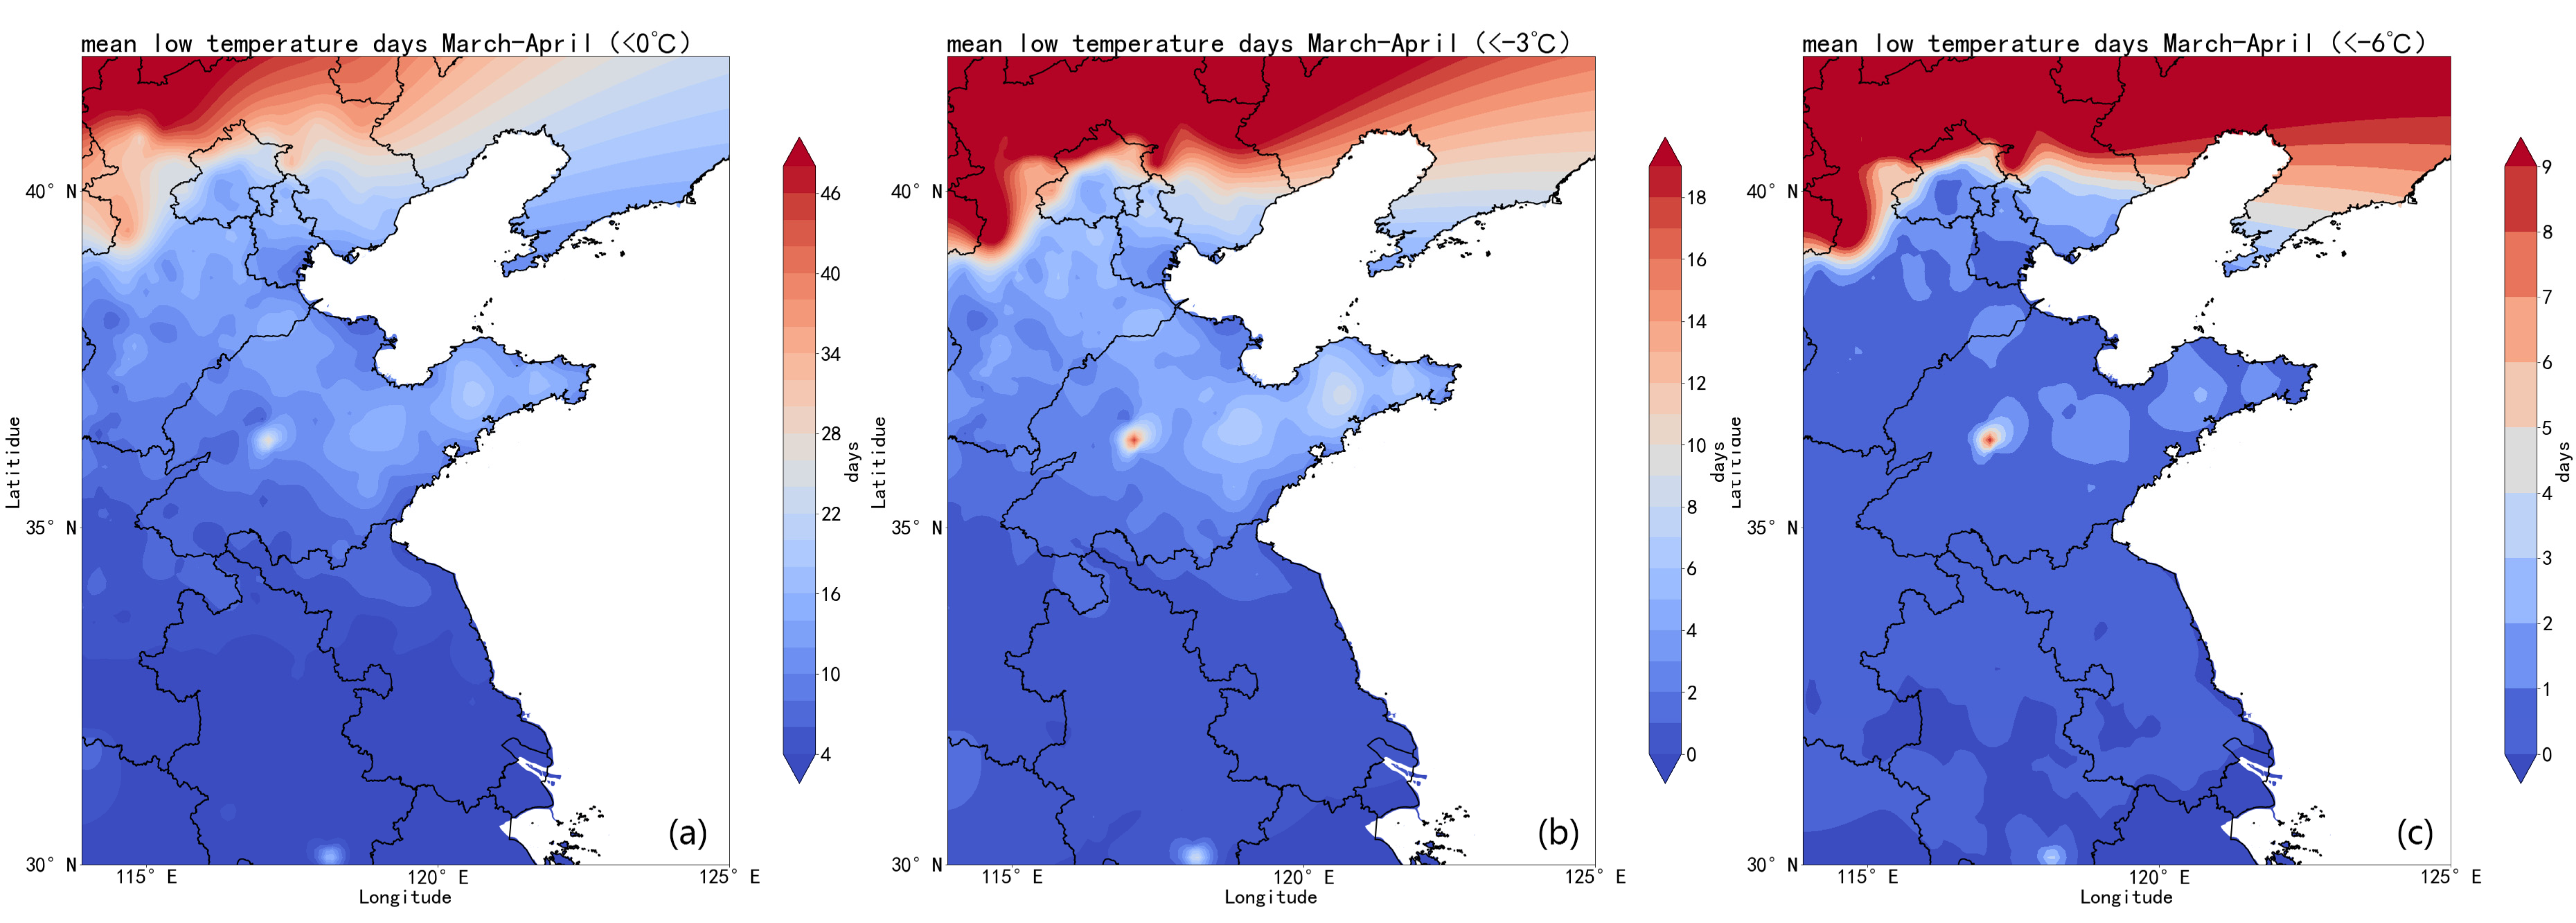
2.1. Meteorological Data Sources for the Study Area

The meteorological data used in this paper were selected from 569 meteorological stations in the Huang-Huai-Hai region (29°72′ to 41°85′ N, 113°98′ to 121°65′ E), including average temperature and minimum temperature. Data were obtained from the China Meteorological Data Sharing Service System (https://data.cma.cn, accessed on 20 June 2024).

2.2. Analysis of Low-Temperature Disasters in the Study Area

Winter wheat typically enters the jointing stage in mid-March, although this may be delayed until early April in northern regions of China [36]. The jointing stage usually lasts for about 20 days [37]. To better investigate the effects of different LT conditions during the jointing stage on the physiological growth and yield of winter wheat, this study analyzed the average temperature and average minimum temperature from early March to late April across 569 stations in the Huang-Huai-Hai region from 1970 to 2023, as shown in Figure 1. The figure indicates that the average temperature in March and April over the past 53 years in the Huang-Huai-Hai region has remained above 8 °C, while the average minimum temperature is below 4 °C. Station data were used to calculate the frequency of extreme LT below 0 °C, −3 °C, and −6 °C, as shown in Figure 2. Figure 2a–c reveals that the frequency of extreme LT disasters gradually increases from south to north. The highest frequency is observed for temperatures below 0 °C, reaching up to 46 days, while temperatures below −6 °C also occur for 9 days. Considering the scientific and rational design of the experiment, as well as the actual LT disasters in the Huang-Huai-Hai region, the control temperature (CK) in this experiment is set to 18 °C (maximum temperature)/8 °C (minimum temperature), and the lowest temperature (T6) is set to 4 °C/−6 °C, with durations of 2, 4, and 6 days.

2.3. Experimental Materials

Experiment 1 was conducted from 13 October 2021 (sowing completed) to 28 May 2022 (all harvested) at the Agricultural Experiment Station of Nanjing University of Information Science and Technology (32.19° N, 118.71° E), using the wheat variety “Jimai 22”. Experiments 2 and 3 were conducted from 17 October 2022 (sowing completed) to 30 May 2023 (all harvest) and from 15 October 2023 (sowing completed) to 24 May 2024 (all harvest), respectively, using three different winter wheat varieties: “Shannong 38”, “Jimai 22”, and “Zhenmai 12” (Table 1). Among them, “Jimai 22” is a semi-winter variety with cold solid resistance, good stalk elasticity, and good lodging resistance [38]. This hybrid variety is cultivated extensively in the Huang-Huai-Hai wheat region. “Shannong 38” is a robust winter variety with excellent overwintering cold resistance and strong resistance to basal stem rot [7]. “Zhenmai 12” is a weak winter variety with relatively weak cold resistance, strong lodging resistance, and moderate resistance to Fusarium head blight [39].
Winter wheat seeds were obtained from a reputable agricultural supply website and planted in a Venlo-type greenhouse at Nanjing University of Information Science and Technology, with 5.0 m height × 9.6 m width × 30.0 m length, oriented north-south.
All seeds were planted in a square culture tank (0.3 m height × 1.0 m width × 5.0 m length) built of concrete in the greenhouse, with a soil matrix consisting of peat soil, coir, vegetal soil, perlite, and vermiculite in a ratio of 3:1:6:2:1 (v/v/v/v/v/v) and a pH value in the range of 7.5–8.0. The sowing depth was maintained at 2.5 ± 0.5 cm, and the planting density was set at 300 plants per square meter. Experiment 1, involving one winter wheat variety, was sown on the evening of 13 October 2021; Experiment 2, with three winter wheat varieties, was sown on the evening of 17 October 2022; and Experiment 3, featuring three winter wheat varieties, was sown on the evening of 15 October 2023. Immediately after sowing, a base fertilizer was applied. Nitrogen, phosphorus, and potassium compound fertilizer (N-P-K: 30%-10%-30%) was applied at a rate of 2500 g per square meter (fertilizer/water: 1/100). During the overwintering period, the plants were watered once every 7 days, and all plants were irrigated to 70% of the field water capacity (monitored using a soil moisture meter) to avoid water shortage.
To ensure optimal environmental conditions for winter wheat growth [37,40], the greenhouse temperature was maintained between 8 °C and 18 °C, with a humidity of 75% ± 5. The light intensity was set to 800 μmol∙m−2∙s−1, and a 12/12-h photoperiod was implemented (6:00 AM to 6:00 PM). When the first internode at the base of the winter wheat elongated and emerged from the soil surface by 1.5–2.0 cm (jointing stage), the plants were transplanted into nutrient pots (height: 21 cm, top diameter: 24 cm, bottom diameter: 19 cm). Five holes were dug near the center of each pot, and three winter wheat plants were transplanted into each hole. The nutrient pots contained a substrate mixture of peat soil, coconut coir, plain soil, perlite, and vermiculite at a ratio of 3:1:6:2:1 (v/v/v/v/v). After transplantation and a two-day recovery period, top-dressing was applied once using a nitrogen, phosphorus, and potassium compound fertilizer (N-P-K: 15%-15%-15%) and urea, in a 4:1 ratio, at a rate of 2500 g per square meter (fertilizer/water: 1/100). Plants were watered daily (or twice daily in most cases) to maintain 80% of the field water capacity and were monitored using a soil moisture meter to prevent water shortage. The pots were then placed in an artificial climate chamber (TPG1260, Melbourne, VIC, Australia) for the environmental control experiments.

2.4. Experimental Design

From 2021 to 2024, three controlled environmental experiments were conducted in an artificial climate chamber (PGC-FLEX) at the Nanjing University of Information Science and Technology, which was manufactured by Conviron, a Canadian company. Dynamic changes in temperature and humidity were set according to Zhuang [40], simulating outdoor variations in the Huang-Huai-Hai region, as depicted in Figure 3. Six temperature levels (daily maximum/minimum) were established: 4 °C/−6 °C, 7 °C/−3 °C, 10 °C/0 °C, 13 °C/3 °C, 16 °C/6 °C, and 18 °C/8 °C (CK) (Table 2). The light intensity was set to 800 μmolm−2s−1. Experimental stress days were 2, 4, and 6 days. During the experiments, the relative humidity was maintained at 70 ± 5%, with a 12/12-h light period (6:00–18:00). Experiment 1 (2021) was an artificial environmental control experiment that involved placing 216 pots of wheat at the jointing stage in 4 climate chambers with 4 different temperature gradients. Experiment 2 (2022) involved 485 pots of wheat at the jointing stage that were placed in 6 climate chambers with 6 different temperature gradients for an artificial environmental control experiment. Similarly, Experiment 3 (2023) placed 520 pots of wheat at the jointing stage in 6 climate chambers, each with a distinct temperature gradient, for the purpose of artificial environmental control experimentation. Six pots of winter wheat were placed under each low-temperature stress treatment and each indicator measurement was repeated three times.
At the end of the 6-day dynamic LT treatments, all treated plants were removed and placed in their pots (as grown in the artificial climate chambers) in a natural environment for subsequent recovery growth to facilitate yield measurements at a later stage. During the experiment, water and fertilizer management for each treatment was consistent with that of field management measures.

2.5. Measurement Contents and Methods

2.5.1. The Measurement of Photosynthetic Parameters

The photosynthetic parameters of winter wheat were measured using a portable LI-6400 photosynthesis measurement system (LI-COR Biosciences Inc., Lincoln, NE, USA) equipped with red and blue light sources. From 9:00–11:00 on the second, fourth, and sixth days of LT stress (during the jointing stage), mature leaves with good growth conditions and uniform leaf ages were selected. The LI-6400 cuvette temperature was set at 22 °C, the CO2 concentration was set to ambient levels, approximately 400 μmol·mol−1, and photosynthetic photon flux density (PPFD) was set at 0, 50, 100, 200, 300, 400, 600, 800, 1000, 1200, 1400, 1600, and 1800 μmol·m−2·s−1. Measured values encompassed Pn (instantaneous photosynthetic rate), Gs (stomatal conductance), and Tr (transpiration rate). Each treatment was assessed on three pots, with values expressed as “mean ± standard deviation (SD).” After measuring the light response curves of the winter wheat leaves, a rectangular hyperbola correction model was used for fitting [41,42]. The expression for this model is as follows:
p n i = α 1 β I 1 + γ I I R d
where, p n i represents the net photosynthetic rate (μmol·m−2·s−1), where I stand for photosynthetically active radiation (μmol·m−2·s−1). α represents the slope of the plant’s photosynthetic response curve to light at I = 0, which is the initial slope of the light response curve and is also known as the initial quantum efficiency. β is the correction coefficient, γ is a coefficient independent of light intensity, and Rd represents dark respiration.

2.5.2. Measurement of Photosynthetic Pigment Content

When measuring the photosynthetic pigment content of winter wheat, functional leaves from the top of the plants were collected from the climate chamber at 9:00 AM on the second, fourth, and sixth days of the low-temperature stress treatment (consistent with the timing of photosynthetic parameter measurements). The absorbance at wavelengths of 665, 649, and 470 nanometers was measured using a spectrophotometer (UV1800 Shimadzu, Fukuoka, Japan) [43]. The measurement of leaf chlorophyll content was repeated three times for each LT treatment, and the formula for calculating chlorophyll content is as follows:
C h l a = 13.95 D 665 6.88 D 649
C h l b = 24.96 D 665 7.32 D 665
C a r = ( 1000 D 470 2.05 C h l a 114.8 C h l b ) / 245
In the context of photosynthetic pigment content measurements, Chla represents chlorophyll A (mg·g−1), Chlb represents chlorophyll B (mg·g−1), and Car represents carotenoids (mg·g−1). D665, D649, and D470 represent the absorbance values of the extracts at 665, 649, and 470 nm, respectively.

2.5.3. Measurement of Protective Enzyme Activity

When measuring the protective enzyme activity in winter wheat leaves, functional leaves from the top of the plants were collected from the climate chamber at 9:00 AM on the second, fourth, and sixth days of the low-temperature stress treatment (consistent with the timing of photosynthetic parameter measurements). The activity of superoxide dismutase (SOD) was measured using the nitroblue tetrazolium (NBT) colorimetric method, as described by Li [29]. The activity of peroxidase (POD) was determined using the guaiacol method, as described by Zhang [44]. The activity of catalase (CAT) is assayed using the ultraviolet spectrophotometric method as described by Zhang [28].

2.5.4. Measurement of Endogenous Hormone Content

First, a standard solution was prepared. Take Frozen samples (1 g) were ground with 10 mL of 80% cold methanol on ice. The mixture was transferred to a test tube, sealed with plastic wrap, and stored at 4 °C in the dark overnight (16 h). The mixture was centrifuged at 4 °C and 10,000 rpm for 10 min using a refrigerated centrifuge in a 10 mL centrifuge tube. The supernatant was collected and the residue was extracted with 5 mL of 80% cold methanol for 10 min. This step was repeated twice, the supernatants were combined, and the mixture was filtered. The mixture was evaporated to between 1/3 and1/4 of its original volume at 37 °C using a vacuum rotary evaporator with a lifting water bath. Adjust the pH to 2.8 using 0.5 mol/L hydrochloric acid and 0.5 mol/L sodium hydroxide. The mixture was diluted to 2 mL with the mobile phase, passed through a 0.45 μm microporous filter membrane, and stored in a brown bottle at 4 °C for later measurement [45].
Before the samples were measured, the needle was rinsed with methanol. The chromatographic conditions were as follows: column temperature was set at 35 °C; the mobile phase volume ratio was 45:55 for pump A (methanol) and pump B (0.075% glacial acetic acid solution); the flow rate was 0.7 mL/min; the injection volume was 20 μL; the wavelengths of the maximum absorption peaks of ZR, GA, IAA, and ABA were 268 nm, 253 nm, 274 nm, and 261 nm, and the contents of the endogenous hormones were determined by the area in the region of the peaks at the respective wavelengths. Similarly, when measuring the endogenous hormone content in winter wheat leaves, functional leaves from the top of the plants were collected from the climate chamber at 9:00 AM on the second, fourth, and sixth days of the LT stress treatment (consistent with the timing of photosynthetic parameter measurements). During sampling, mature functional leaves of winter wheat were selected from the top, and the content of endogenous hormones in leaves was measured three times repeatedly for each LT treatment [46].

2.5.5. Measurement of Yield and Its Constituent Indicators

When winter wheat reached maturity, five pots with similar growth patterns were selected from each LT treatment group. The length of the individual spikes was measured after removing the soil from the pots. Following this, all spikes were cut and threshed to calculate the weight per spike and the sterility rate of individual spikes. Finally, all wheat grains were dried to determine the yield, and 1000 grains were randomly selected from the measured grains to calculate the 1000-grain weight, adjusted to a grain moisture content of 13%.

2.6. Statistical Analysis

All data are presented as the mean ± standard deviation (SD) of three biological replicates. SPSS (version 24.0; SPSS, Chicago, IL, USA) was used for the two-way analysis of variance (ANOVA), Duncan’s multiple range test (p = 0.05), correlation analysis, and principal component analysis.

3. Results

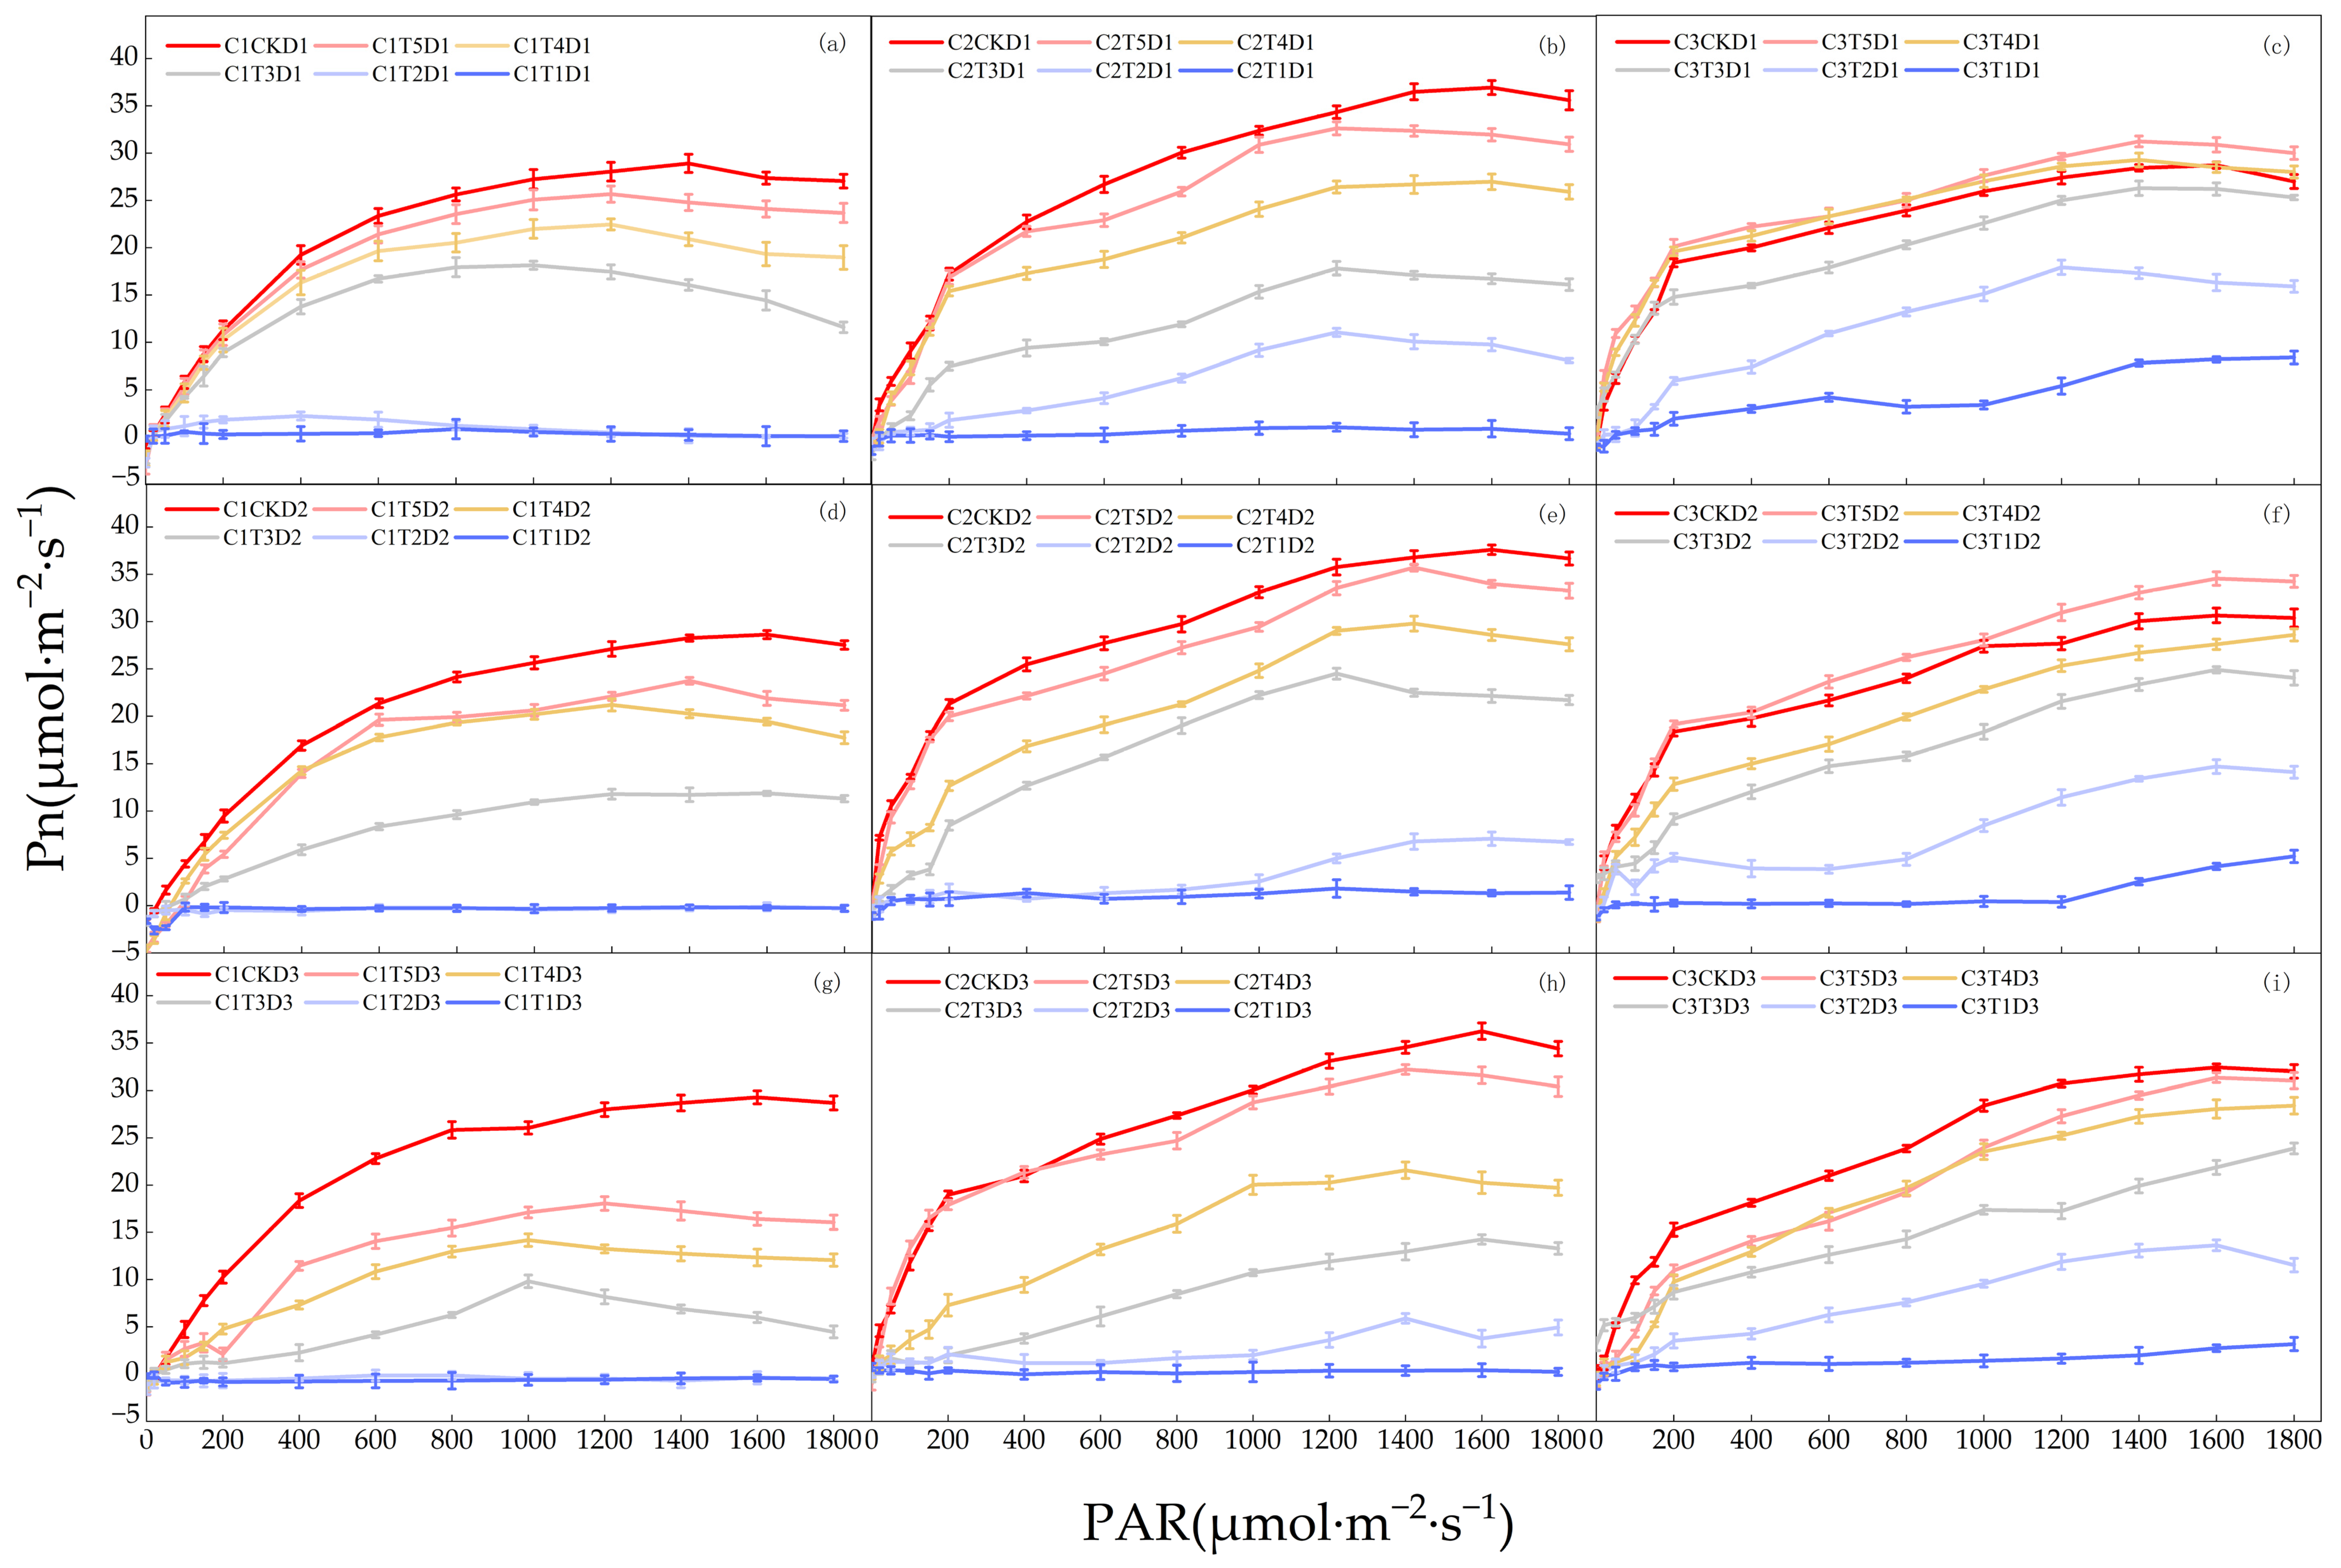
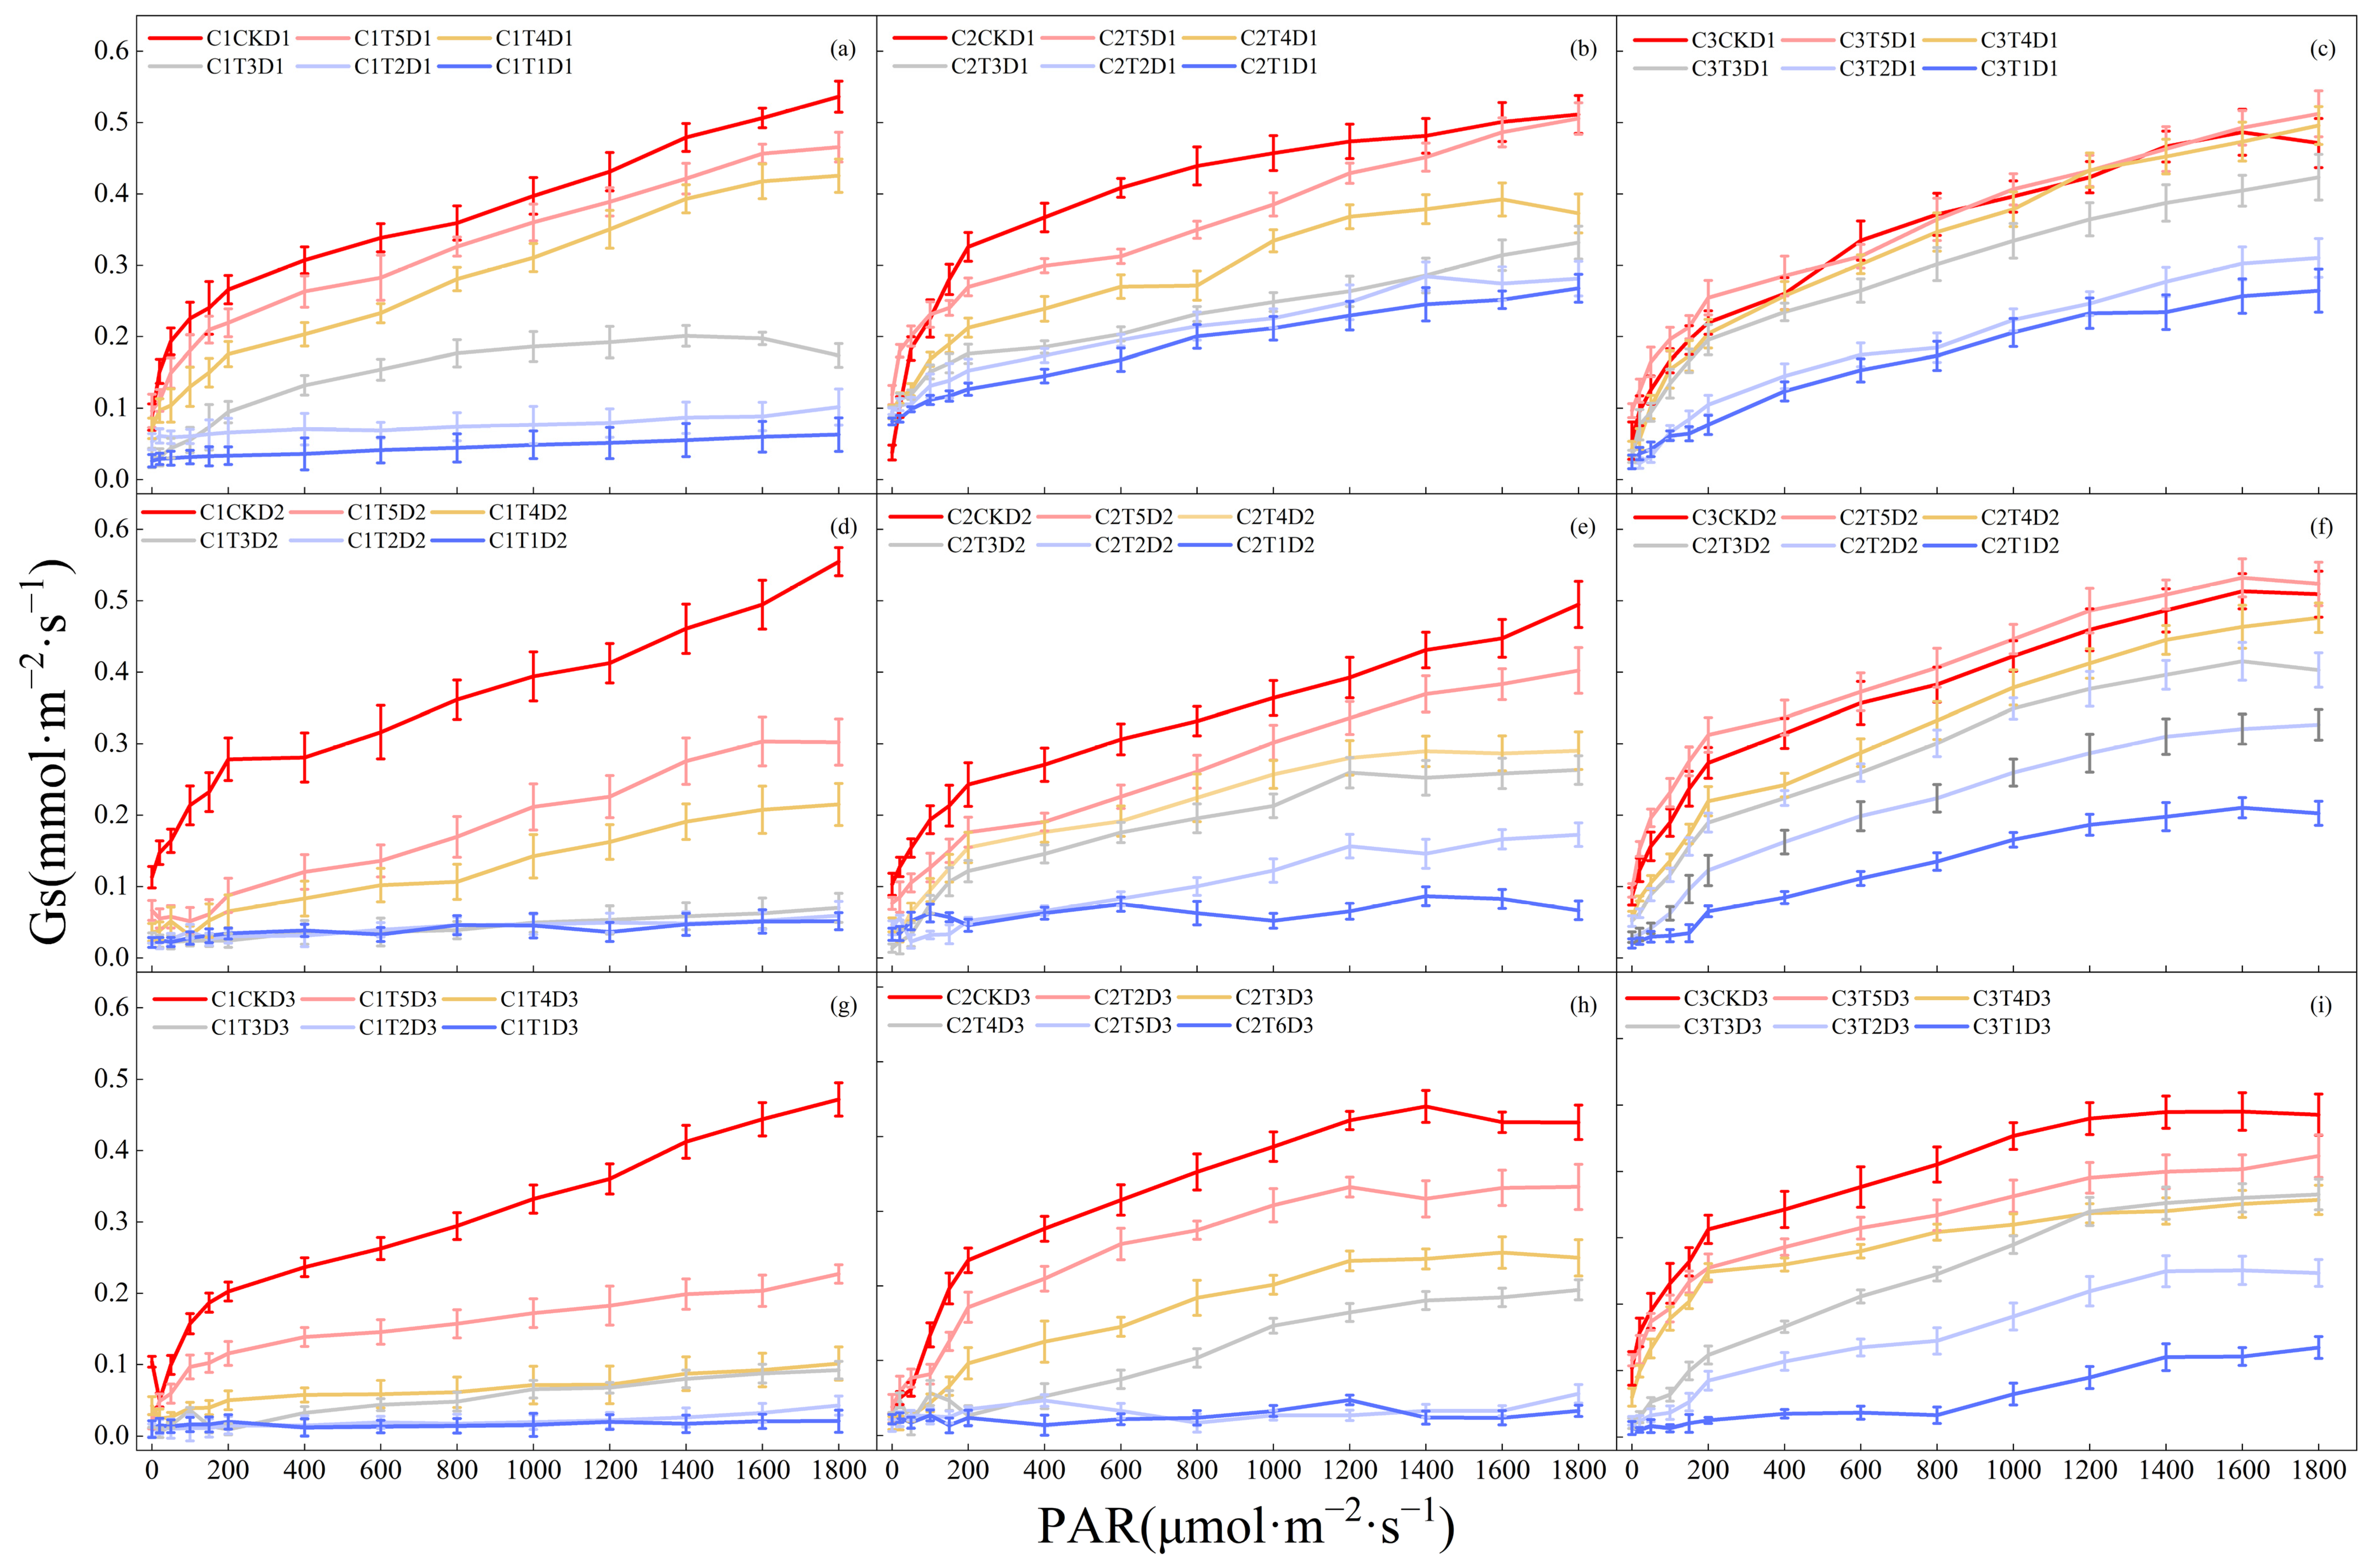
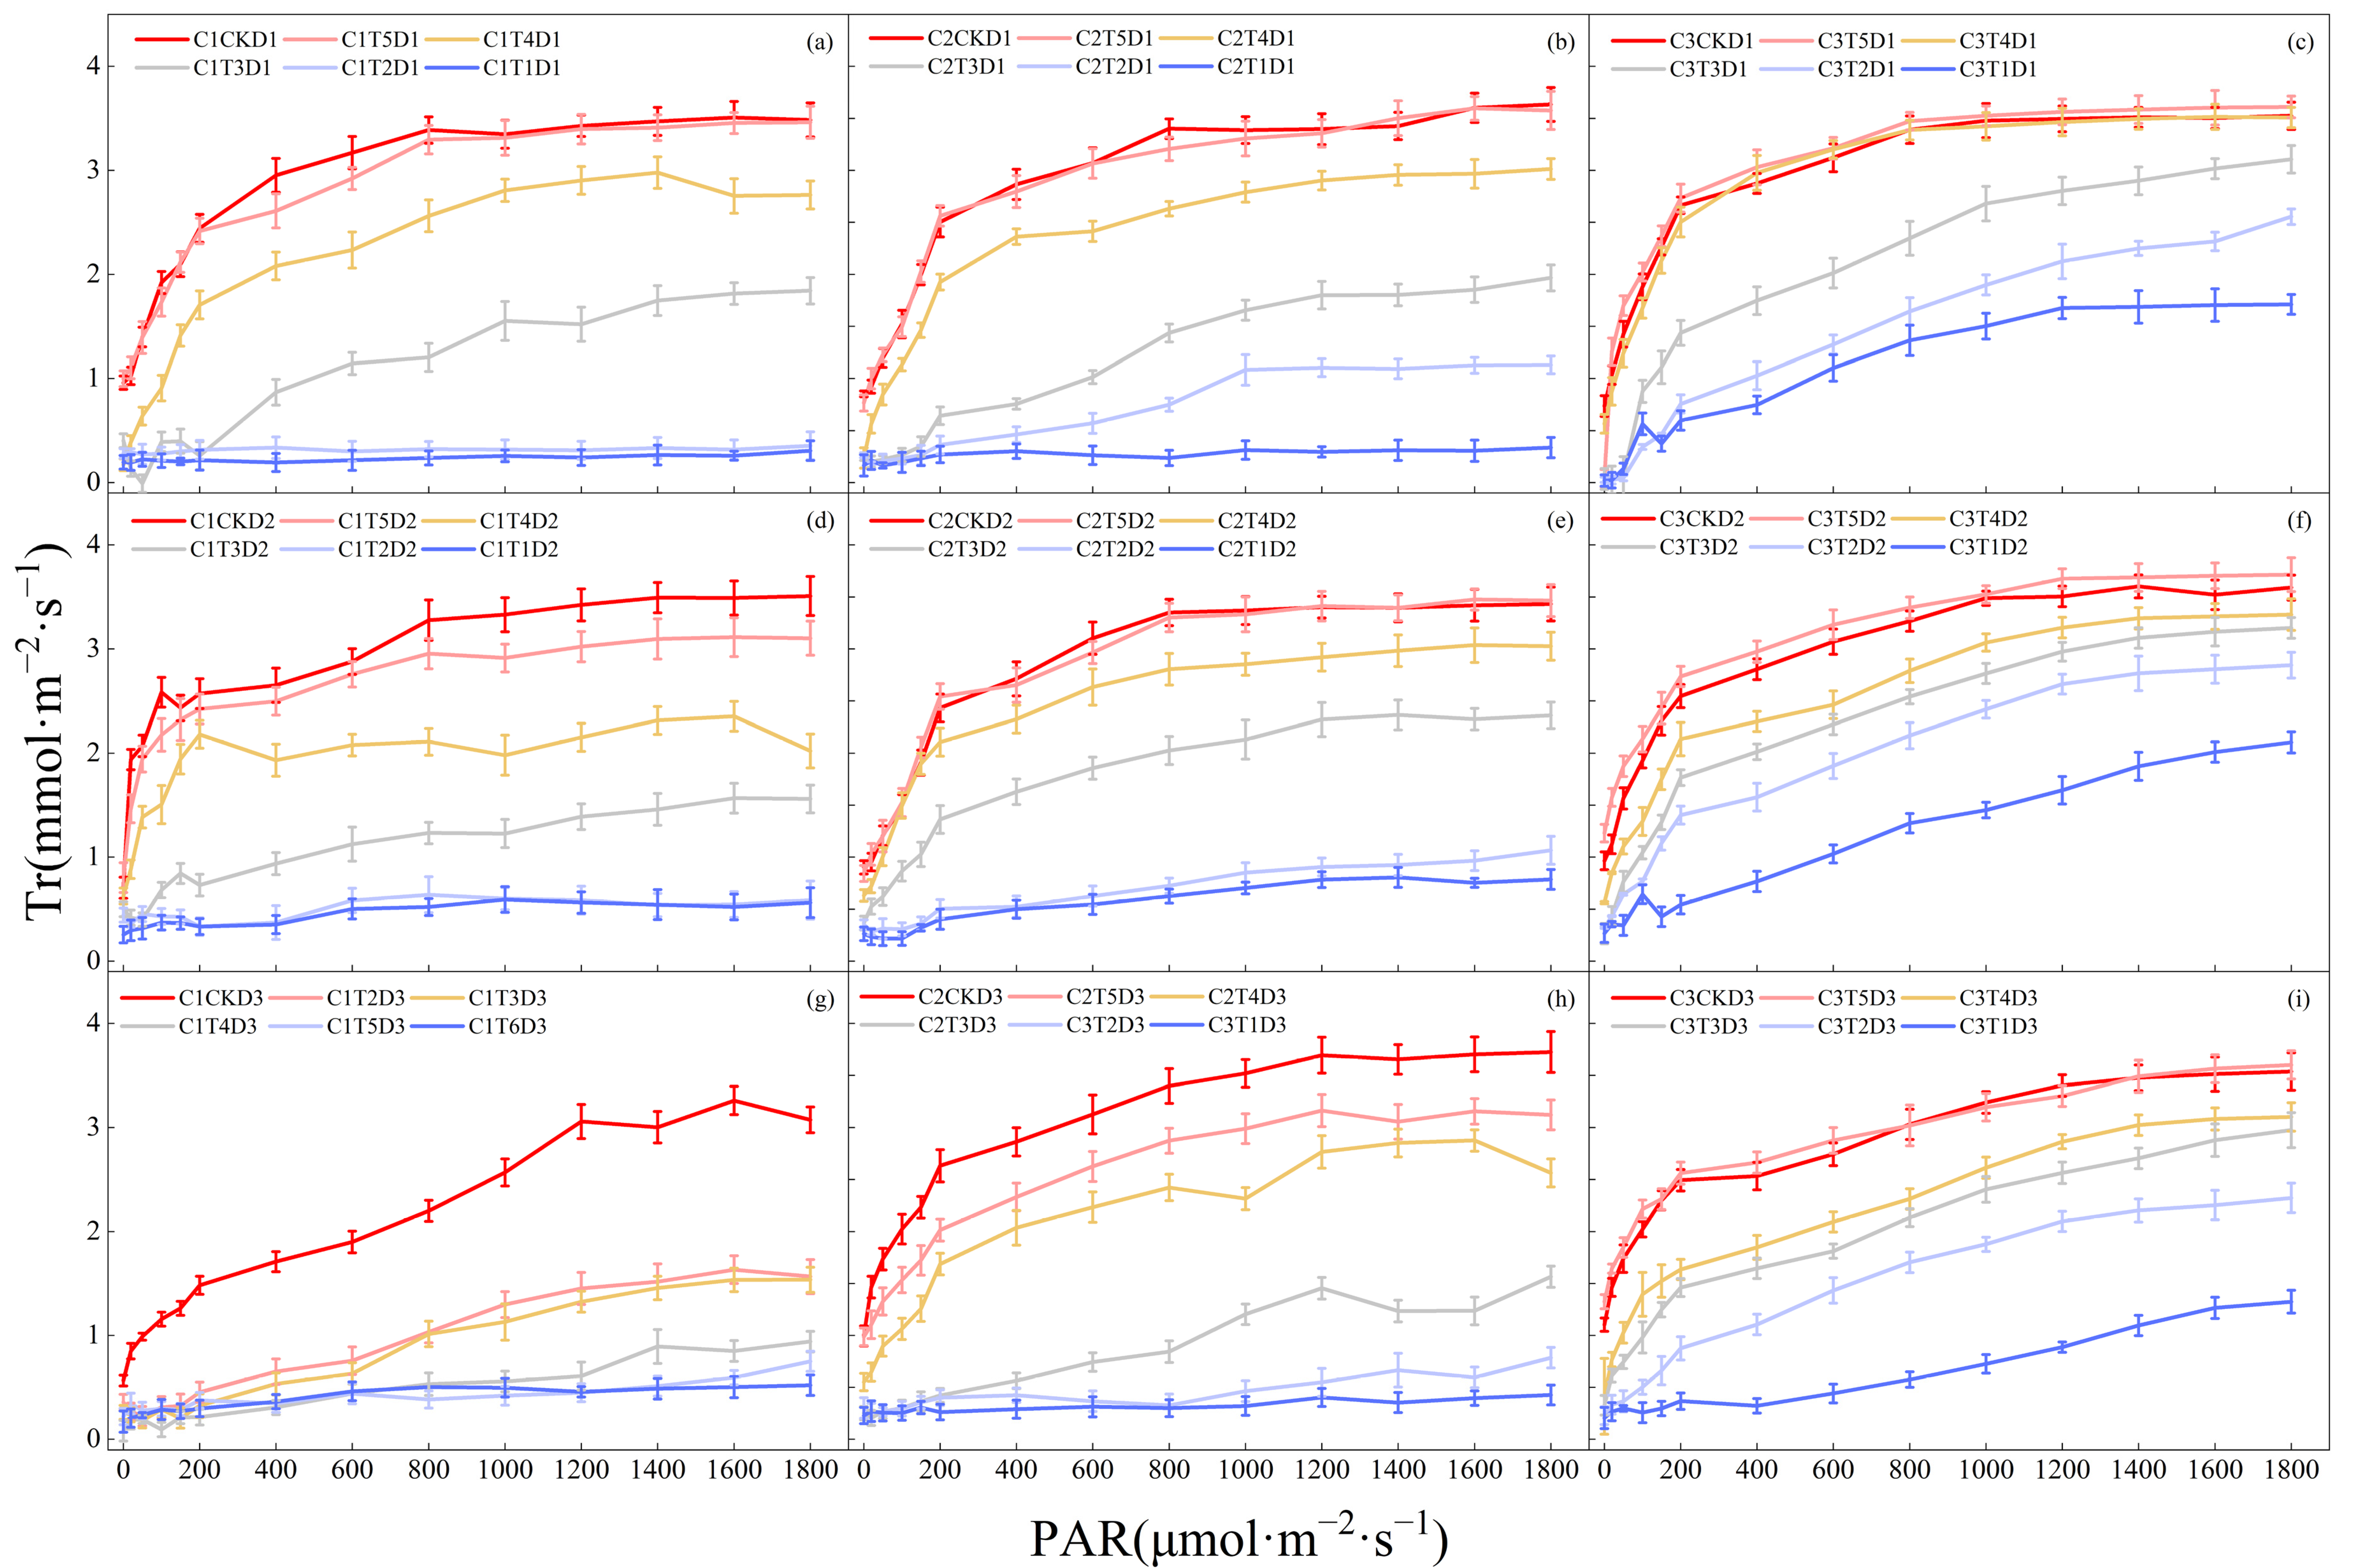
3.1. Effects of Low-Temperature Stress during the Jointing Stage on Photosynthetic Parameters of Leaves in Different Winter Wheat Varieties

Analysis of variance (ANOVA) of photosynthetic parameters revealed that changes in Pn, Gs, and Tr in leaves of the same variety under different low-temperature (LT) treatments and in leaves of different varieties under the same LT treatments passed the analysis of significance at p < 0.05 (Tables S1 and S2). In addition, most of the coefficients of variation remained within 15%, indicating that the data were stable and informative. Under the Control (CK) treatment, cultivar C2 exhibited the highest light saturation point, surpassing cultivars C1 and C3 by 16.5% and 10.6%, respectively. Under D1 (Figure 4a–c) and D2 (Figure 4d–f) treatments, the trends of peak net photosynthetic rate (Pn) variation with temperature were relatively similar among the three cultivars. Specifically, cultivar C1 displayed a marked decrease in its peak Pn under the T4 treatment, with a significant reduction of 34.5% and 45.2% compared to the CK treatment. Notably, photosynthesis ceased in C1 under both the T2 and T1 treatments. Cultivar C2 also showed a pronounced decline in peak Pn under the T3 treatment, with reductions of 47.6% and 41.6% from the CK treatment, and photosynthesis both ceased under the T1 treatment. Cultivar C3 displayed a notable decrease in peak Pn solely under the T2 treatment, while maintaining a marginal level of photosynthesis under the T1 treatment. Under the D3 treatment (Figure 4g–i), a clear downward trend in peak Pn values was observed across all three cultivars as the temperature decreased. Notably, even cultivar C3, which had previously maintained some photosynthetic activity under certain conditions, ceased photosynthesis under the T1 treatment.
Under the control (CK) treatment, the mean Gs value of variety C3 was the lowest, exhibiting a significant reduction of 8.9% and 11.6% compared to varieties C1 and C2, respectively. Under the D1 treatment (Figure 5a–c), the stomatal conductance (Gs) of the winter wheat leaves in variety C1 exhibited a marked decrease under the T3 treatment, with its peak value dropping by 60.4% compared to the CK treatment. In contrast, varieties C2 and C3 maintained gas exchange even under the T1 treatment, albeit with reduced peak values of 44.4% and 40.9%, respectively, compared to the CK treatment. Under the D2 treatment (Figure 5d–f), the Gs of variety C1 leaves notably declined across all LT treatments. Notably, variety C3 displayed a remarkable phenomenon, in which both the mean and peak Gs values surpassed those of the CK treatment under T5 conditions. Under the D3 treatment (Figure 5g–i), the Gs of variety C1 leaves remained consistently low across all LT treatments. Notably, variety C2 ceased gas exchange under T2 and T1 treatments, whereas variety C3 sustained minimal gas exchange, even under T1 treatment.
Under the D1 treatment (Figure 6a–c), the mean transpiration rate (Tr) of leaves from both the C1 and C2 varieties significantly decreased under the T3 treatment, with peak reductions of 47.1% and 42.8%, respectively, compared with the control (CK) treatment. Notably, the leaves of variety C1 ceased transpiration under T2 and T1 treatments, whereas those of variety C2 halted transpiration only under the T1 treatment. In contrast, the leaves of variety C3 maintained a remarkable transpiration rate, achieving a peak value of 37.8% of the CK peak, even under the T1 treatment. Under the D2 treatment (Figure 6d–f), the trends in the mean and peak values of the transpiration rate (Tr) across the leaves of the three varieties followed a similar pattern to that observed under the D1 treatment, with a slight further decline as the intensity of LT stress increased. The D3 treatment (Figure 6g–i) had the most pronounced effect on the leaf transpiration rate (Tr) of variety C1. Specifically, under the T5 treatment, the maximum Tr value for C1 leaves reached 1.63 mmol·m−2·s−1, representing a notable decrease of 49.1% compared to the CK treatment. For variety C2, a significant decline in Tr was observed under T4 and T3 treatments, with peak reductions of 28.6% and 36.1%, respectively, compared to the D2 treatment. In contrast, the mean and peak Tr values for variety C3 remained relatively unchanged compared to those under the D2 treatment.

3.2. Effects of Low-Temperature Stress during the Jointing Stage on Pigment Content in Leaves of Different Winter Wheat Varieties

The results of the two-way ANOVA indicated that both temperature, stress duration, and their interaction had significant effects (p < 0.01) on the chlorophyll content of leaves in the three varieties of winter wheat (Tables S3–S5). Furthermore, upon conducting an ANOVA (Analysis of Variance) to compare the differences among various winter wheat varieties and across the individual low-temperature (LT) treatments within each variety (Tables S6 and S7), and it was observed that the majority of the coefficient of variation (CV) values were below 10%. This finding signifies high data stability and reliability, underscoring the valuable reference points provided by these data for further investigation and analysis. Under the D1 treatment (Figure 7a), the chlorophyll A content in the leaves of all three varieties exhibited an upward trend compared with the control (CK) treatment, indicating that the leaves were still in their growth phase during the early jointing stage. Notably, in variety C1, a marked decrease in chlorophyll A content was observed under the T4 treatment, reaching a minimum value of 0.71 mg·g−1, constituting a substantial decline of 60.6% from the CK treatment. Conversely, in varieties C2 and C3, the decline in chlorophyll A content was relatively modest as the intensity of the LT stress increased. Under the D2 (Figure 7b) and D3 (Figure 7c) treatments, the chlorophyll A content in the leaves of all varieties exhibited a pronounced downward trend as the severity of the LT stress increased. Notably, in variety C3, even under the combined stress of T1 and D3, the chlorophyll content remained at 51.3% relative to the CK treatment, indicating a relatively resilient response to adverse conditions.
The variation in chlorophyll B content in winter wheat leaves in response to LT stress was relatively lower than that of chlorophyll A. Specifically, under the D1 (Figure 7d), D2 (Figure 7e), and D3 (Figure 7f) treatments, the chlorophyll B content in leaves of all three varieties decreased significantly as the intensity of LT stress increased. Notably, the minimum values of 0.18 mg·g−1, 0.20 mg·g−1, and 0.27 mg·g−1 were reached by varieties C1, C2, and C3, respectively, under the combined stress of T1 and D3. These minima represent declines of 64.3%, 60.2%, and 49.8% from the CK treatment.
We found that under the D1 (Figure 7g), D2 (Figure 7h), and D3 (Figure 7i) treatments, the carotenoid content in the leaves of all three wheat varieties consistently decreased as the intensity of LT stress increased. Notably, the declining trends observed in the C1 and C2 varieties mirrored those seen in chlorophyll A and chlorophyll B, whereas the C3 variety exhibited a more gradual decrease in carotenoid content. Specifically, the minimum carotenoid levels of 0.16 mg·g−1, 0.21 mg·g−1, and 0.31 mg·g−1 were attained by the C1, C2, and C3 varieties, respectively, under the combined T1 and D3 treatment conditions. These minima signify notable reductions of 62.5%, 59.6%, and 39.8% compared to the CK treatment.

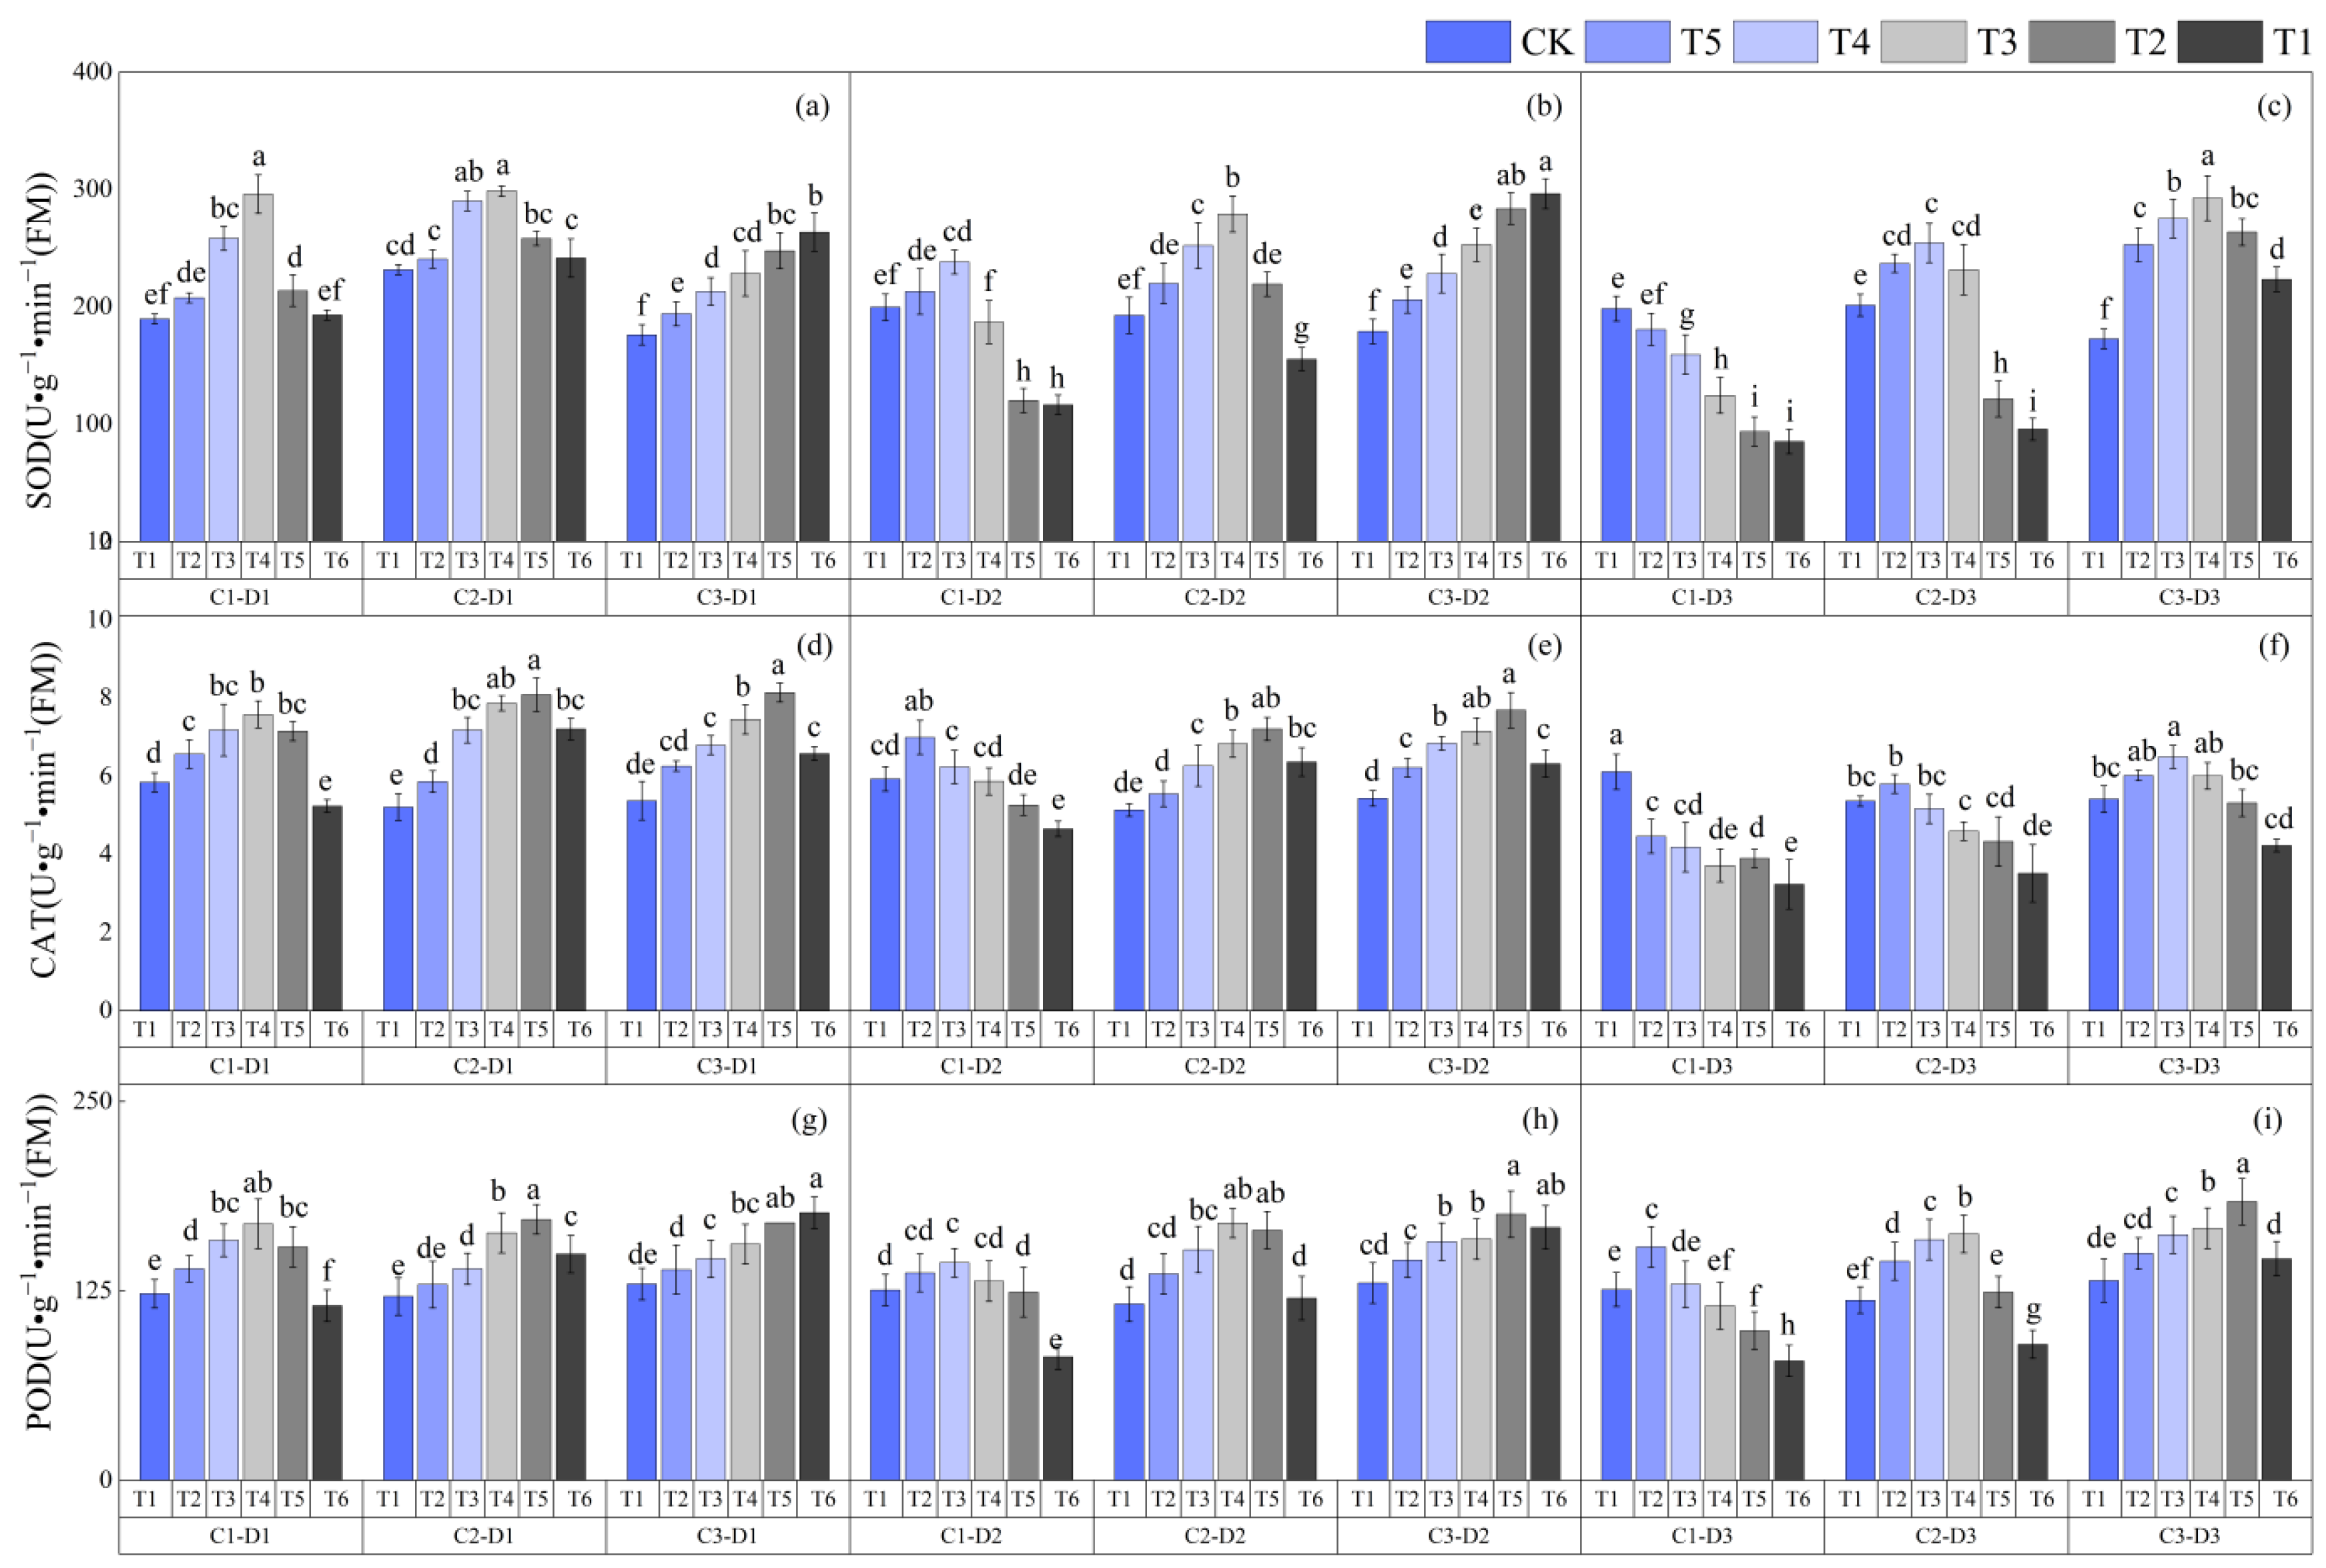
3.3. Effects of Low-Temperature Stress during the Jointing Stage on the Activities of Protective Enzymes in Leaves of Different Winter Wheat Varieties

The results of the two-way ANOVA indicated that both temperature, stress duration, and their interaction had significant effects (p < 0.01) on the protective enzyme activity in the leaves of the three varieties of winter wheat (Tables S8–S10). Furthermore, upon conducting an ANOVA (Analysis of Variance) to compare the differences among various winter wheat varieties and across the individual low-temperature (LT) treatments within each variety (Tables S11 and S12), and it was observed that the majority of the coefficient of variation (CV) values were below 10%. This finding signifies high data stability and reliability, underscoring the valuable reference points provided by these data for further investigation and analysis. By investigating the impact of LT stress on the superoxide dismutase (SOD) activity in the leaves of three winter wheat cultivars (Figure 8a–c), it was observed that all three varieties exhibited a consistent trend of initially elevated SOD activity, followed by a subsequent decrease under varying degrees of LT stress. This finding underscores the complex yet dynamic response of SOD enzymatic activity in wheat leaves to environmental stressors, such as low temperatures. Specifically, under the D1 treatment, the SOD activity of varieties C1 and C2 peaked under the T2 treatment and then decreased, while the SOD activity of variety C3 continued to increase as the temperature decreased. Under the D2 treatment, the SOD activity of variety C1 remained at a lower level under the T2 and T1 treatments, and the SOD activity of variety C2 remained at a lower level under the T1 treatment, while the SOD activity of variety C3 increased significantly as the temperature decreased. Under the D3 treatment, the SOD activity of variety C1 continued to decrease as the temperature decreased; the SOD activity of variety C2 peaked under the T4 treatment. It then decreased significantly, and the SOD activity of variety C3 peaked under the T3 treatment and then decreased slightly.
By studying the effects of LT stress on catalase (CAT) activity in the leaves of winter wheat cultivars (Figure 8d–f), we observed a pronounced trend in the catalase (CAT) activity in the leaves of winter wheat: an initial enhancement, followed by a subsequent decrease. The changes in CAT activity in the C2 and C3 leaves under D1 and D2 treatments were similar, peaking under the T2 treatment and then decreasing slightly. In contrast, CAT activity in the leaves of variety C1 peaked earlier and decreased significantly as the number of stress days increased. Under D3 treatment, the CAT activity of variety C1 decreased significantly with temperature stress, reaching a minimum value of 3.32 U·g−1·min−1 under T1 treatment and 40.6% lower than that under CK treatment. The CAT activity of variety C3 also decreased significantly after peaking under T3 treatment, reaching a minimum value of 4.2 U·g−1·min−1 under T1 treatment, which was 25.2% lower than that of the CK treatment.
By studying the effects of LT on the catalase (CAT) activity in the leaves of winter wheat, we found that as the degree of LT stress increased, the changes in POD activity in the leaves of the three varieties were similar to those of SOD and CAT. POD activity in the leaves of variety C1 reached a maximum value of 169.4 U·g−1·min−1 under T3 and D1 treatments, which was 37.5% higher than that of the CK treatment. As the stress time increased, POD activity in the leaves of varieties C1 and C2 peaked under higher temperature stress and then decreased significantly. The POD activity in the leaves of variety C3 continued to increase with the degree of LT stress and only decreased slightly under T1, D2, and T1 and D3 treatments. It reached a minimum value of 143.4 U·g−1·min−1 under T6, D3 treatment, which was still 9.2% higher than CK treatment.

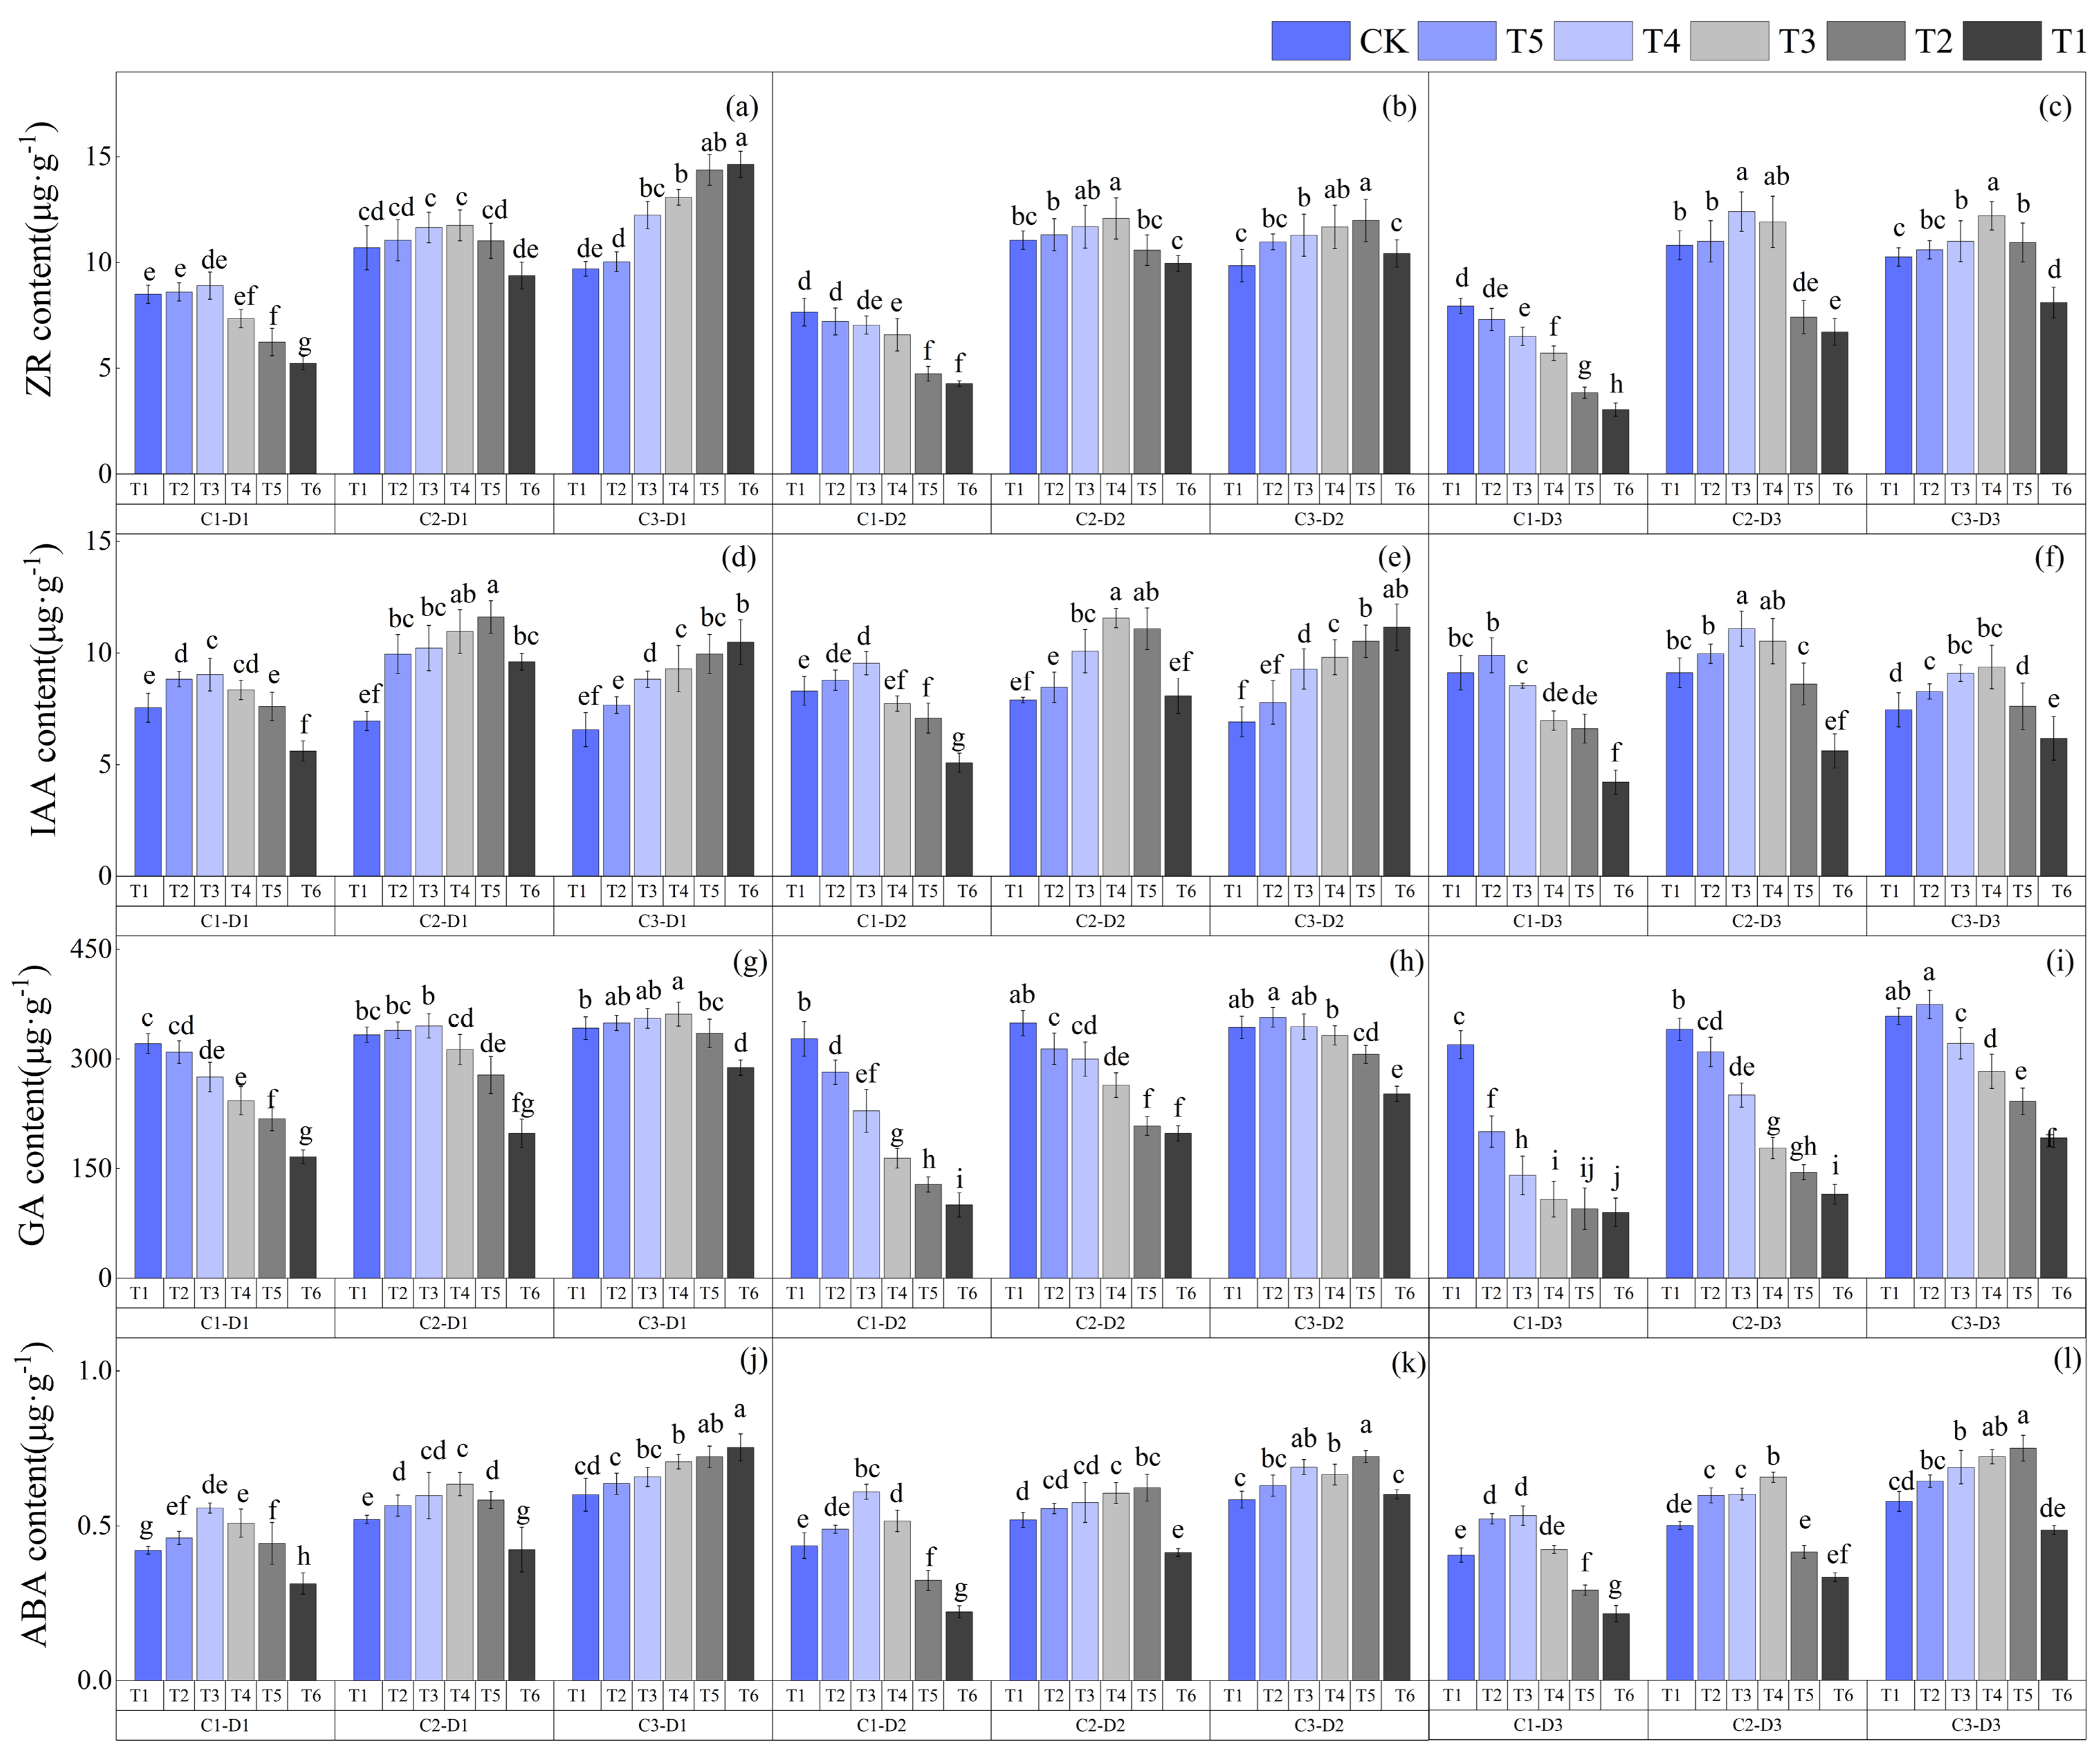
3.4. Effects of Low-Temperature Stress during the Jointing Stage on Endogenous Hormones in Leaves of Different Winter Wheat Varieties

The two-way ANOVA analysis showed that both temperature, stress duration, and their interaction had significant effects (p < 0.01) on the endogenous hormone content in the leaves of the three varieties of winter wheat (Tables S13–S15). Furthermore, upon conducting an ANOVA (Analysis of Variance) to compare the differences among various winter wheat varieties and across the individual low-temperature (LT) treatments within each variety (Tables S16 and S17), and it was observed that the majority of the coefficient of variation (CV) values were below 10%. This finding signifies high data stability and reliability, underscoring the valuable reference points provided by these data for further investigation and analysis. By studying the impact of LT stress on the zeatin riboside (ZR) content in the leaves of winter wheat, we found that the ZR content in the leaves of variety C2 under CK treatment was significantly higher than that of varieties C1 and C3 (Figure 9a–c). The ZR content in leaves of variety C1 shows a trend of first increasing and then decreasing with decreasing temperature in the early stage of LT stress (D1), reaching a peak of 8.9 μg·g−1 under T4, D1 treatment, which is 5.9% higher than CK treatment, D1 treatment. During the mid and late stages of LT stress (D2 and D3), ZR content decreased significantly with decreasing temperature. The ZR content in leaves of variety C2 shows a trend of first increasing and then decreasing throughout the LT stress period (D1, D2, D3), reaching a peak of 13.4 μg·g−1 under T3, D3 treatment, which is 36.7% higher than CK treatment, D3. The ZR content in the leaves of variety C3 continued to increase with decreasing temperature in the early stage of LT stress (D1), reaching a peak of 14.6 μg·g−1 under T1 and D1 treatments, 50.5% higher than that under CK treatment. During the mid and late stages of LT stress (D2, D3), the ZR content shows a trend of first increasing and then decreasing with decreasing temperature, reaching a minimum of 8.1 μg·g−1 under T1 and D3 treatments, which was 20.6% lower than that under CK treatment.
By studying the impact of LT stress on indole-3-acetic acid (IAA) content in the leaves of winter wheat, we found that the IAA content in the leaves of varieties C1 and C2 showed a trend of first increasing and then decreasing with decreasing temperature throughout the LT stress period. The IAA content in the leaves of variety C3 continued to increase with decreasing temperature in the early and mid-stages of LT stress (D1, D2). It only decreased under the T2 and T1 treatments in the late stage of stress (D3).
By studying the impact of LT stress on gibberellin (GA) content in the leaves of winter wheat, we found that the GA content in leaves of variety C1 decreased significantly with decreasing temperature throughout the LT stress period (D1, D2, D3), reaching a minimum of 90.1 μg·g−1 under T1 and D3 treatments, which was 71.8% lower than that under CK treatment. The GA content in the leaves of variety C2 showed a trend of slightly increasing and then rapidly decreasing with decreasing temperature in the early stage of LT stress (D1), reaching a peak of 345.5 μg·g−1 under T4 and D1 treatments, which is 3.7% higher than that under CK treatment. During the mid and late stages of LT stress, the GA content decreased significantly, reaching a minimum of 115.1 μg·g−1 under T1 and D3 treatments, which was 66.2% lower than that under CK treatment. The GA content in leaves of variety C3 shows a trend of first increasing and then decreasing with decreasing temperature throughout the LT stress period (D1, D2, D3), reaching a peak of 374.8 μg·g−1 under T5, D3 treatment, which is 4.5% higher than that under CK treatment, and reaching a minimum of 192.1 μg·g−1 under T6, D3 treatment, which is 46.4% lower than that under CK treatment.
By studying the impact of LT stress on abscisic acid (ABA) content in the leaves of winter wheat, we found that the ABA content in the leaves of varieties C1 and C2 showed a trend of first increasing and then decreasing with increasing LT stress. In contrast, the ABA content in the leaves of variety C3 increased with increasing stress and only decreased slightly under T1, D2, and T1 and D3 treatments. Specifically, the ABA content in leaves of variety C1 reached a peak of 0.61 μg·g−1 under T4 and D2 treatments, which was 38.6% higher than that under CK treatment. It reaches a minimum of 0.2 μg·g−1 under T1 and D3 treatments, which was 45.1% lower than that under CK and D3 treatments. The ABA content in leaves of variety C2 reaches a peak of 0.6 μg·g−1 under T3, D1 treatment, which is 23.1% higher than that under CK treatment, and reaches a minimum of 0.3 μg·g−1 under T1, D3 treatment, which is 34.0% lower than that under CK treatment. The ABA content in leaves of variety C3 reaches a peak of 0.8 μg·g−1 under T1, D1 treatment, which is 20.1% higher than that under CK treatment, and reaches a minimum of 0.5 μg·g−1 under T1, D3 treatment, which is 15.8% lower than that under CK treatment.

3.5. Effects of Low-Temperature Stress during the Jointing Stage on the Yield of Different Winter Wheat Varieties

After analyzing the ANOVA and Dunnett’s test for each winter wheat cultivar and their respective treatments, it was found that the data on yield and its components passed the significance test at p < 0.05. Furthermore, upon conducting an ANOVA (Analysis of Variance) to compare the differences among various winter wheat varieties and across the individual low-temperature (LT) treatments within each variety (Tables S18 and S19), it was observed that the majority of the coefficient of variation (CV) values were below 10%. This finding signifies high data stability and reliability, underscoring the valuable reference points provided by these data for further investigation and analysis. Specifically, notable disparities emerged in the single-spike length among the three cultivars under different treatment conditions. Regarding single-spike weight, cultivar C2 exhibited significant differences from the other two cultivars, and significant variations were detected among treatments within each cultivar. Conversely, no significant differences were found between cultivars C1 and C3 in terms of single-spike weight. As for thousand-grain weight, no significant differences were discernible among the three cultivars, whereas marked variations were observed among the various LT treatments.
Table 3 shows three winter wheat varieties’ yield and component indicators under LT stress during the jointing stage. As can be seen from the table, under the CK treatment, variety C2 with moderate winter hardness had the highest 1000-kernel weight and yield per pot, followed by variety C1 with poorer winter hardness. In contrast, variety C3, which had the most robust winter hardness, had the lowest 1000-kernel weight and yield per pot. With the increase in the degree of LT stress, ear length, ear weight, 1000-kernel weight, and yield per pot of the three winter wheat varieties showed a decreasing trend. Among them, the changes in ear length and ear weight of wheat variety C1 were the most pronounced as the degree of LT stress increased, reaching minimum values of 5.09 cm and 1.31 g under CK treatment, D3 treatment, respectively, which were 28.4% and 41.3% lower than those under the CK treatment. The changes in ear length and ear weight of variety C3 were relatively more minor compared to the CK treatment, reaching minimum values of 5.94 cm and 1.52 g under T6 and D3 treatment, respectively, which were 12.9% and 27.3% lower than those under the CK treatment. There was little difference in the yield of winter wheat varieties C1 and C2 under the T5 and T4 treatments. The decreasing trend in the yield of winter wheat variety C1 increased significantly under the T3 treatment, while the decreasing trend of winter wheat variety C2 increased significantly under the T2 treatment. However, the decreasing trend in the yield of variety C3 increased only slightly under the T1 treatment, reaching a minimum yield reduction rate of 20.21% under the T6 and D3 treatments.

3.6. Constructing Indicators for Assessing Low-Temperature Disaster Levels in Different Winter Wheat Varieties under Low-Temperature Stress during the Jointing Stage

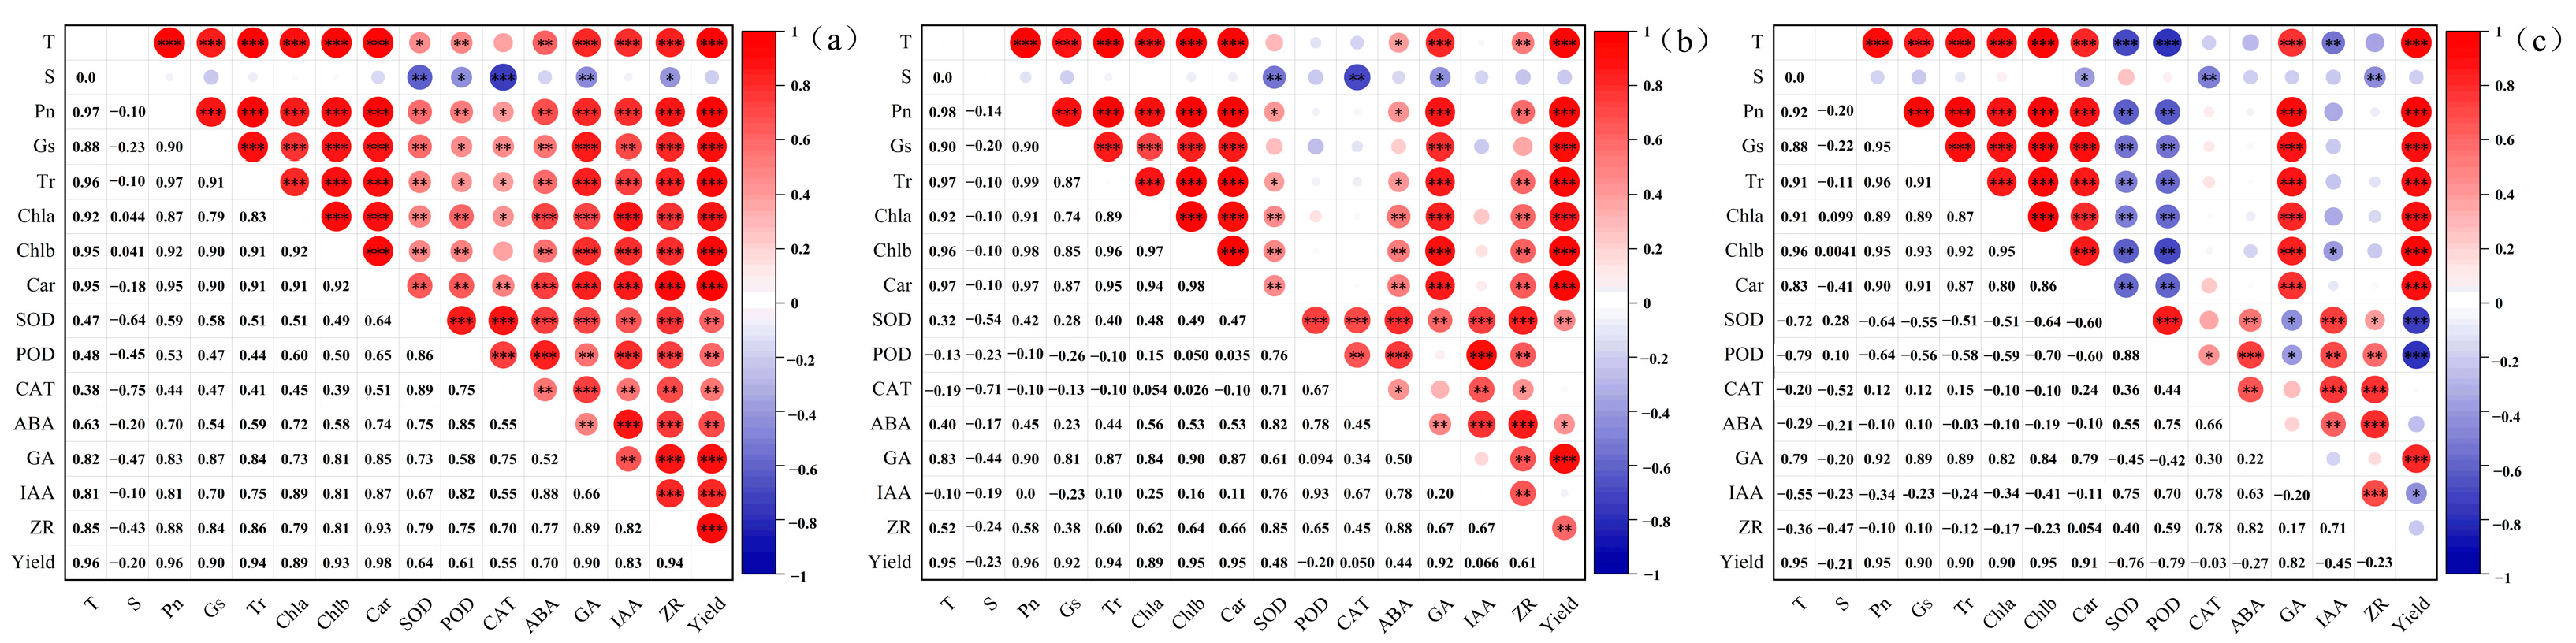
3.6.1. Correlation Analysis of Trait Indicators in Different Winter Wheat Varieties under Low-Temperature Stress during the Jointing Stage

A correlation analysis was conducted on various physiological indices and yield indices of the three winter wheat varieties under LT stress at the jointing stage. It can be seen from Figure 10a–c that there are varying degrees of positive and negative correlations among the trait indices. The absolute values of most of the correlation coefficients ranged between 0.65 and 0.95. In variety C1, all trait indicators showed a positive correlation with temperature and a negative correlation with duration. Under different treatments, the positive correlations between the various indicators and SOD, POD, and CAT were relatively weak. The correlation patterns of trait indicators in variety C2 were similar to those in “Zhenmai.” However, the positive correlations with SOD, POD, CAT, and ABA were even weaker or even began to show negative correlations. In variety C3, negative correlations between various trait indicators and SOD and POD increased, and negative correlations with IAA and ZR began to emerge.

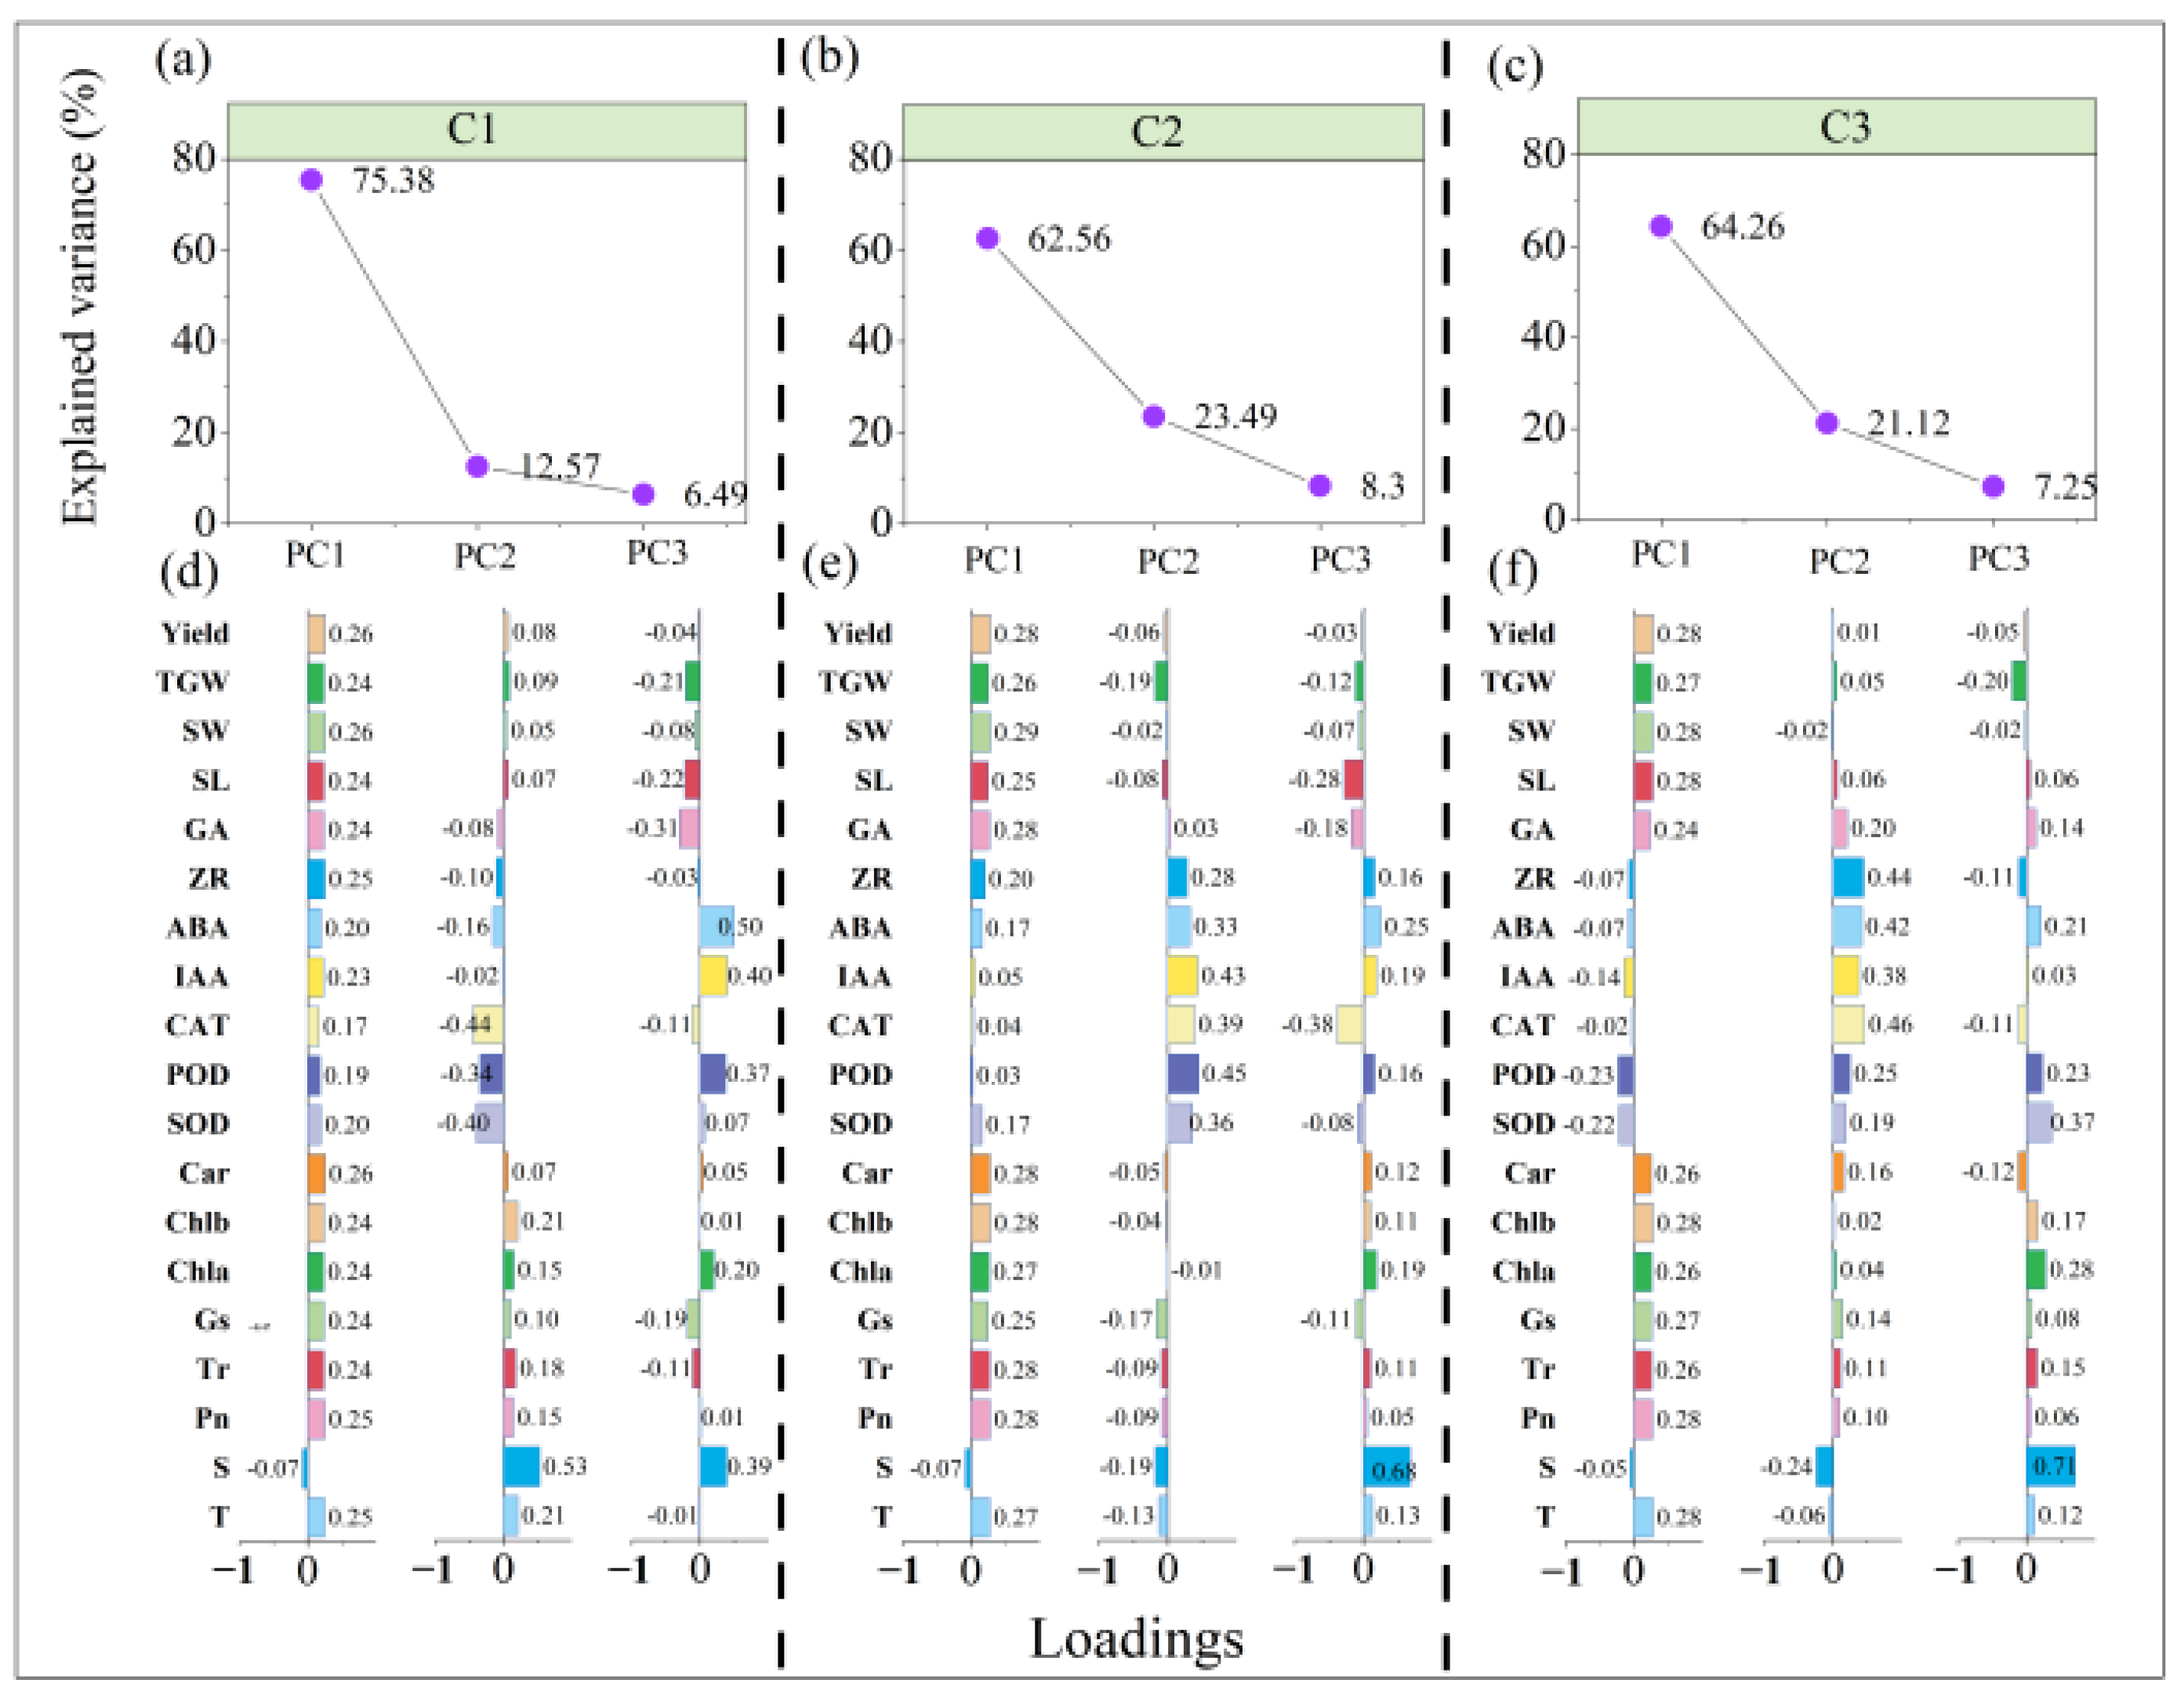
3.6.2. Principal Component Analysis of Trait Indicators in Different Winter Wheat Varieties under Low-Temperature Stress during the Jointing Stage

Principal component analysis was conducted on 19 indicators, including temperature, duration, photosynthetic parameters, photosynthetic pigment content, protective enzyme activity, endogenous hormone content, yield, and its component factors, for the three winter wheat varieties. The scree plots and factor contribution rates are depicted in Figure 11. The results showed that the cumulative variance contribution rate of the first three components for variety C1 reached 94.5%, for variety C2 it reached 94.4%, and for variety C3 it reached 92.6%. All of them met the criteria of having an eigenvalue greater than 1 and a cumulative variance contribution rate greater than 85% [47]. Selecting the first three principal components can effectively explain more than 90% of the variation in the original 19 indicators (Table S10).
After standardizing the original data of the three winter wheat varieties and substituting them into the principal component expressions to calculate the PC1, PC2, and PC3 principal component scores, the comprehensive score Z was obtained by multiplying the scores of the three principal components by their respective weights. Using the “mean − standard deviation” method, the comprehensive scores calculated under various LT stress treatments for varieties C1, C2, and C3 were analyzed (Table 4). The results showed that the mean Z value for variety C1 was −0.02 with a standard deviation of 1.12; the mean Z value for variety C2 was 0.47 with a standard deviation of 0.89; and the mean Z value for variety C3 was 0.63 with a standard deviation of 0.53. The LT disaster levels for the three winter wheat varieties during the jointing stage were classified based on the mean values as the center and expanding outward by the standard deviations.
The LT disaster levels for the three winter wheat varieties under different treatments are shown in the table. It can be seen from the table that under the CK treatment, none of the three winter wheat varieties experienced LT stress, while under treatment D3, most of the treatments were subject to severe stress. Specifically, variety C1 experienced mild stress in treatments T5 and D1, moderate stress in treatments T4 and D3, and severe stress in treatments T2 and D3. Variety C2 experienced mild stress under treatments T5 and D3, moderate stress under treatments T3 and D2, and severe stress under treatments T1 and D1. Variety C3 experienced mild stress under treatments T4 and D2, moderate stress under treatments T3 and D2, and severe stress under treatments T1 and D3 (Table 5).

4. Discussion

Photosynthesis is one of the most fundamental metabolic activities in winter wheat’s growth and development process [48]. This study found that LT inhibited the net photosynthetic rate (Pn) in three winter wheat varieties. As the stress intensity increased, stomatal conductance (Gs) and transpiration rate (Tr) also showed decreasing trends of varying degrees. This may be because winter wheat leaves gradually close their stomata to reduce excessive water loss and adapt to the LT environment. However, the leaves of the robust winter wheat variety “Shannong 38” could maintain slight gas exchange even in the later stages of LT stress. Additionally, LT significantly reduced the photosynthetic pigment content in the leaves of all the three varieties. This indicates that the decline in the photosynthetic capacity of winter wheat leaves under LT conditions may be due to non-stomatal limitations, such as damage to the photosystem and inhibition of ribulose diphosphate carboxylase (Rubisco)/oxygenase [49,50]. The study found that as the degree of LT stress increased, the contents of chlorophyll a (Chla), chlorophyll b (Chlb), and carotenoids (Car) in the leaves of “Zhenmai 12” and “Jimai 22” decreased significantly. This may be because LT caused the chloroplast stroma and grana lamellae in the winter wheat leaves to become loose, and the integrity of the double membrane was disrupted [51].
The protective enzyme system is an essential metabolic mechanism in winter wheat that produces a series of protective enzymes, including SOD, POD, and CAT, to cope with oxidative damage and metabolic disorders caused by stress [52]. This study found that LT stress led to an initial increase and a subsequent decrease in the activity of protective enzymes in the three varieties. This suggests that short-term LT activates the antioxidant enzyme system to enhance cold resistance [53]. However, at lower temperatures or later stages of LT stress, protein synthesis is inhibited and reactive oxygen metabolism becomes imbalanced, leading to an overload of the protective enzyme system and a subsequent decrease in activity [53,54]. The protective enzyme activity in the leaves of the less cold-proof varieties “Zhenmai 12” and “Jimai 22” reached a peak rapidly and decreased significantly under relatively higher LT stress, while the protective enzyme activity in the leaves of the most cold-proof variety “Shannong 38” could still maintain a strong ability to scavenge reactive oxygen species in the later stages of LT stress. Endogenous hormones in winter wheat leaves (including indole-3-acetic acid, gibberellin, zeatin riboside, and abscisic acid) are signaling molecules in plants that play essential regulatory roles in plant growth and development [55]. Early studies have shown that LT stress can cause stomatal closure, metabolic slowdown, decreased synthetic enzyme activity, inhibited cell growth in winter wheat leaves, decreasing ABA, ZR, and IAA content, and increasing GA content. This study found that under short-term LT stress, the ABA, ZR, and IAA contents in the semi-winter wheat variety “Jimai 22” and the robust winter wheat variety “Shannong 38” showed a slight upward trend. This may be because winter wheat promotes the formation of proteins related to stress resistance to adapt to adverse environments [56]. As the degree of LT stress increased, GA content in the leaves showed a downward trend. This may be because LT and longer durations inhibit the expression of many genes in the GA precursor GGPP synthesis pathway [57].
Yield is one of the most intuitive indicators for measuring the damage caused by LT disasters in winter wheat [58]. LT stress during different growth stages can lead to varying yield reductions in winter wheat [59]. This study found that under CK treatment, “Jimai 22” had the highest thousand-grain weight and yield per pot, followed by “Zhenmai 12” and “Shannong 38” had the lowest, indicating significant differences in agronomic traits among different varieties. Under LT stress during the jointing stage, the yield and component indicators of the three varieties exhibited varying decreasing trends. As the cold resistance of winter wheat decreased, its yield indicators also decreased significantly. Principal Component Analysis (PCA) is commonly used to evaluate quality indicators and assess disaster loss levels. This study selected principal components with eigenvalues greater than 1 and cumulative variance contribution rates exceeding 85% to evaluate various indicators of the three winter wheat varieties comprehensively. The “mean standard deviation” method was used to classify the LT disaster levels during the jointing stage of winter wheat, quantifying the impact of LT disasters on winter wheat during this stage. This offers a theoretical foundation for enhancing the understanding of winter wheat’s response to LT stress during the jointing stage and developing effective disaster prevention and mitigation measures.

5. Conclusions

This paper examines the changes in various physiological parameters of leaves and subsequent growth yield indicators of three winter wheat varieties, namely “Zhenmai 12”, “Jimai 22”, and “Shannong 38”, under different low temperature (LT) treatments during the jointing stage through controlled experiments in LT environments. This study revealed that the physiological parameters and yield indicators of wheat varieties exhibited significant variations under different LT stresses. Interestingly, during the early stages of LT stress or under relatively higher temperature stress, the protective enzyme activities and endogenous hormone contents in the leaves of winter wheat partially continue to show an upward trend, accompanied by a slight increase in yield. Furthermore, we comprehensively evaluate each variety under different LT treatments using correlation and principal component analysis and establish an LT disaster index for the jointing stage.
These studies not only delve into the mechanisms underlying the effects of LT stress on winter wheat but also investigate the differences in cold tolerance among the three winter wheat varieties by comparing various indicators. Moreover, the established LT disaster grade index for the jointing stage of winter wheat categorizes the comprehensive impact of LT stress into four levels: none, mild, moderate, and severe, based on different temperatures and durations. This classification better explains the comprehensive impacts of LT stress on winter wheat. This provides a solid theoretical foundation for future disaster prevention and mitigation efforts related to LT disasters.

Supplementary Materials

The following supplementary information can be downloaded from https://www.mdpi.com/article/10.3390/agriculture14081430/s1; we have also provided variance analyses for photosynthetic parameters (Table S1), chlorophyll content (Table S6), protective enzyme activities (Table S11), endogenous hormone content (Table S16), and yield and its component indicators (Table S18) under the same low-temperature stress treatment across different winter wheat varieties. Variance analyses are also available for photosynthetic parameters (Table S2), chlorophyll content (Table S7), protective enzyme activities (Table S12), endogenous hormone content (Table S17), and yield and its component indicators (Table S19) under different low-temperature treatments within the same winter wheat variety. Additionally, two-way variance analyses are provided for the effects of temperature and duration on chlorophyll content in winter wheat leaves (Tables S3–S5), protective enzyme activities (Tables S8–S10), and endogenous hormone levels (Tables S13–S15).

Author Contributions

Conceptualization, F.Z. and Z.Y.; methodology, Z.H. and N.W.; software, L.Z.; validation, M.L., M.J. and Q.M.; formal analysis, F.Z.; investigation, H.W.; resources, Z.H.; data curation, F.Z., Z.H. and Z.Y.; writing—original draft preparation, F.Z.; writing—review and editing, F.Z., Z.H. and Z.Y.; visualization, N.W.; supervision, M.J. and R.K.; project administration, L.Z.; funding acquisition, Q.M. and L.Z. All authors have read and agreed to the published version of the manuscript.

Funding

This study was supported by the National Key Research and Development Program of China (2022YFD2300202), the Basic Research Fund of the Chinese Academy of Meteorological Sciences (2024Z001), and the Science and Technology Development Foundation of the Chinese Academy of Meteorological Sciences (2023KJ024). The authors would like to thank the editors and anonymous reviewers for their helpful and constructive comments in improving this manuscript.

Institutional Review Board Statement

Not applicable (studies not involving humans or animals).

Data Availability Statement

Data are not readily available for public consumption due to privacy and other issues.

Conflicts of Interest

The authors declare no conflicts of interest.

References

  1. Wu, J.; Han, Z.-Y.; Gao, X.-J.; Liu, Z.-J. Climatic impacts induced by winter wheat irrigation over North China simulated by the nonhydrostatic RegCM4.7. Adv. Clim. Change Res. 2024, 15, 197–210. [Google Scholar] [CrossRef]
  2. Tao, F.; Li, Y.; Chen, Y.; Yin, L.; Zhang, S. Daily, seasonal and inter-annual variations in CO2 fluxes and carbon budget in a winter-wheat and summer-maize rotation system in the North China Plain. Agric. For. Meteorol. 2022, 324, 109098. [Google Scholar] [CrossRef]
  3. Wang, D.; Rianti, W.; Gálvez, F.; van der Putten, P.E.L.; Struik, P.C.; Yin, X. Estimating photosynthetic parameter values of rice, wheat, maize and sorghum to enable smart crop cultivation. Crop Environ. 2022, 1, 119–132. [Google Scholar] [CrossRef]
  4. Karatayev, M.; Clarke, M.; Salnikov, V.; Bekseitova, R.; Nizamova, M. Monitoring climate change, drought conditions and wheat production in Eurasia: The case study of Kazakhstan. Heliyon 2022, 8, e08660. [Google Scholar] [CrossRef]
  5. Wu, X.; Liu, H.; Li, X.; Tian, Y.; Mahecha, M.D. Responses of Winter Wheat Yields to Warming-Mediated Vernalization Variations Across Temperate Europe. Front. Ecol. Evol. 2017, 5, 126. [Google Scholar] [CrossRef]
  6. Zhao, J.; Peng, H.; Yang, J.; Huang, R.; Huo, Z.; Ma, Y. Response of winter wheat to different drought levels based on Google Earth Engine in the Huang-Huai-Hai Region, China. Agric. Water Manag. 2024, 292, 108662. [Google Scholar] [CrossRef]
  7. Chen, W.; Zhang, J.; Deng, X.-P. Winter wheat yield improvement by genetic gain across different provinces in China. J. Integr. Agric. 2023, 23, 468–483. [Google Scholar] [CrossRef]
  8. Albahri, A.S.; Khaleel, Y.L.; Habeeb, M.A.; Ismael, R.D.; Hameed, Q.A.; Deveci, M.; Homod, R.Z.; Albahri, O.S.; Alamoodi, A.H.; Alzubaidi, L. A systematic review of trustworthy artificial intelligence applications in natural disasters. Comput. Electr. Eng. 2024, 118, 109409. [Google Scholar] [CrossRef]
  9. Rastgoo, H.; Abbasi, E.; Bijani, M. Analysis of agricultural insurance vulnerability in the face of natural disasters: Insights from Iran. Environ. Sustain. Indic. 2024, 23, 100429. [Google Scholar] [CrossRef]
  10. Innes, P.J.; Tan, D.K.Y.; Van Ogtrop, F.; Amthor, J.S. Effects of high-temperature episodes on wheat yields in New South Wales, Australia. Agric. For. Meteorol. 2015, 208, 95–107. [Google Scholar] [CrossRef]
  11. Tian, Y.; Tian, X.; Yang, B.; Ma, J.; Shan, J.; Xing, F. Analysis of the impact of drying on common wheat quality and safety. Heliyon 2024, 10, e33163. [Google Scholar] [CrossRef] [PubMed]
  12. Abys, C.; Skakun, S.; Becker-Reshef, I. Two decades of winter wheat expansion and intensification in Russia. Remote Sens. Appl. Soc. Environ. 2024, 33, 101097. [Google Scholar] [CrossRef]
  13. Wang, B.; Li, L.; Feng, P.; Chen, C.; Luo, J.-J.; Taschetto, A.S.; Harrison, M.T.; Liu, K.; Liu, D.L.; Yu, Q.; et al. Probabilistic analysis of drought impact on wheat yield and climate change implications. Weather Clim. Extrem. 2024, 45, 100708. [Google Scholar] [CrossRef]
  14. Zhao, J.; Yang, J.; Huang, R.; Xie, H.; Qin, X.; Hu, Y. Estimating evapotranspiration and drought dynamics of winter wheat under climate change: A case study in Huang-Huai-Hai region, China. Sci. Total Environ. 2024, 949, 175114. [Google Scholar] [CrossRef] [PubMed]
  15. Shoukat, M.R.; Wang, J.; Habib-ur-Rahman, M.; Hui, X.; Hoogenboom, G.; Yan, H. Adaptation strategies for winter wheat production at farmer fields under a changing climate: Employing crop and multiple global climate models. Agric. Syst. 2024, 220, 104066. [Google Scholar] [CrossRef]
  16. Zhao, X.; Deng, G.; Xi, Y. Spatial–Temporal Characteristics and Driving Factors of Disaster-Induced Grain Yield Loss in China. Front. Environ. Sci. 2022, 10, 808565. [Google Scholar] [CrossRef]
  17. Donatti, C.I.; Nicholas, K.; Fedele, G.; Delforge, D.; Speybroeck, N.; Moraga, P.; Blatter, J.; Below, R.; Zvoleff, A. Global hotspots of climate-related disasters. Int. J. Disaster Risk Reduct. 2024, 108, 104488. [Google Scholar] [CrossRef]
  18. Cheng, W.; Li, Y.; Zuo, W.; Du, G.; Stanny, M. Spatio-temporal detection of agricultural disaster vulnerability in the world and implications for developing climate-resilient agriculture. Sci. Total Environ. 2024, 928, 172412. [Google Scholar] [CrossRef]
  19. Osawa, T. Evaluating the effectiveness of basin management using agricultural land for ecosystem-based disaster risk reduction. Int. J. Disaster Risk Reduct. 2022, 83, 103445. [Google Scholar] [CrossRef]
  20. Huang, C.; Li, N.; Zhang, Z.; Liu, Y. Examining the relationship between meteorological disaster economic impact and regional economic development in China. Int. J. Disaster Risk Reduct. 2024, 100, 104133. [Google Scholar] [CrossRef]
  21. Hu, J.; Ren, B.; Dong, S.; Liu, P.; Zhao, B.; Zhang, J. Poor development of spike differentiation triggered by lower photosynthesis and carbon partitioning reduces summer maize yield after waterlogging. Crop J. 2022, 10, 478–489. [Google Scholar] [CrossRef]
  22. Kang, M.; Wang, S.; Xu, Z.; Xu, C.; An, J.; Zhang, Y.; Zeng, Y.; Ali, I.; Tang, L.; Xiao, L.; et al. Simulating the effects of low-temperature stress during flowering stage on leaf-level photosynthesis with current rice models. Agric. For. Meteorol. 2024, 354, 110087. [Google Scholar] [CrossRef]
  23. Hayman, G.; Redhead, J.W.; Brown, M.; Pinnington, E.; Gerard, F.; Brown, M.; Fincham, W.; Robinson, E.L.; Huntingford, C.; Pywell, R.F. A framework for improved predictions of the climate impacts on potential yields of UK winter wheat and its applicability to other UK crops. Clim. Serv. 2024, 34, 100479. [Google Scholar] [CrossRef]
  24. Pang, H.; Lian, Y.; Zhao, Z.; Guo, H.; Li, Z.; Hu, J.; Ren, Y.; Lin, T.; Wang, Z. Compensatory effect of supplementary irrigation on winter wheat under warming conditions. Agric. Water Manag. 2024, 295, 108778. [Google Scholar] [CrossRef]
  25. Zeng, X.; Ma, L.; Yuan, J.; Xie, Y.; Guan, T.; Wang, X.; Ma, G.; Xu, Y.; Sun, W. Antioxidant metabolic system and comparative proteomics analysis in winter turnip rape (Brassica rapa L.) under cold stress. Oil Crop Sci. 2022, 7, 95–102. [Google Scholar] [CrossRef]
  26. Shah, T.; Latif, S.; Saeed, F.; Ali, I.; Ullah, S.; Abdullah Alsahli, A.; Jan, S.; Ahmad, P. Seed priming with titanium dioxide nanoparticles enhances seed vigor, leaf water status, and antioxidant enzyme activities in maize (Zea mays L.) under salinity stress. J. King Saud Univ. Sci. 2021, 33, 101207. [Google Scholar] [CrossRef]
  27. Ullah, S.; Afzal, I.; Shumaila, S.; Shah, W. Effect of naphthyl acetic acid foliar spray on the physiological mechanism of drought stress tolerance in maize (Zea mays L.). Plant Stress 2021, 2, 100035. [Google Scholar] [CrossRef]
  28. Zhang, W.; Wang, J.; Huang, Z.; Mi, L.; Xu, K.; Wu, J.; Fan, Y.; Ma, S.; Jiang, D. Effects of Low Temperature at Booting Stage on Sucrose Metabolism and Endogenous Hormone Contents in Winter Wheat Spikelet. Front. Plant Sci. 2019, 10, 498. [Google Scholar] [CrossRef]
  29. Li, Q.; Chang, X.-h.; Meng, X.-h.; Li, D.; Zhao, M.-h.; Sun, S.-l.; Li, H.-m.; Qiao, W.-c. Heat stability of winter wheat depends on cultivars, timing and protective methods. J. Integr. Agric. 2020, 19, 1984–1997. [Google Scholar] [CrossRef]
  30. Kosakivska, I.; Voytenko, L.; Vasyuk, V.; Shcherbatiuk, M. ABA-induced alterations in cytokinin homeostasis of Triticum aestivum and Triticum spelta under heat stress. Plant Stress 2024, 11, 100353. [Google Scholar] [CrossRef]
  31. Wang, X.; Li, Q.; Xie, J.; Huang, M.; Cai, J.; Zhou, Q.; Dai, T.; Jiang, D. Abscisic acid and jasmonic acid are involved in drought priming-induced tolerance to drought in wheat. Crop J. 2021, 9, 120–132. [Google Scholar] [CrossRef]
  32. Love, B.; Molero, G.; Rivera-Amado, C.; Müller, M.; Munné-Bosch, S.; Reynolds, M.P.; Foulkes, M.J. Associations between endogenous spike cytokinins and grain-number traits in spring wheat genotypes. Eur. J. Agron. 2024, 152, 127011. [Google Scholar] [CrossRef]
  33. Malko, M.M.; Khanzada, A.; Wang, X.; Samo, A.; Li, Q.; Jiang, D.; Cai, J. Chemical treatment refines drought tolerance in wheat and its implications in changing climate: A review. Plant Stress 2022, 6, 100118. [Google Scholar] [CrossRef]
  34. Zhang, W.; Zhao, Y.; Li, L.; Xu, X.; Yang, L.; Luo, Z.; Wang, B.; Ma, S.; Fan, Y.; Huang, Z. The Effects of Short-Term Exposure to Low Temperatures During the Booting Stage on Starch Synthesis and Yields in Wheat Grain. Front. Plant Sci. 2021, 12, 684784. [Google Scholar] [CrossRef] [PubMed]
  35. Huang, N.; Song, Y.; Wang, J.; Zhang, Z.; Ma, S.; Jiang, K.; Pan, Z. Climatic threshold of crop production and climate change adaptation: A case of winter wheat production in China. Front. Ecol. Evol. 2022, 10, 1019436. [Google Scholar] [CrossRef]
  36. Hamani, A.K.M.; Abubakar, S.A.; Si, Z.; Kama, R.; Gao, Y.; Duan, A. Suitable split nitrogen application increases grain yield and photosynthetic capacity in drip-irrigated winter wheat (Triticum aestivum L.) under different water regimes in the North China Plain. Front. Plant Sci. 2022, 13, 1105006. [Google Scholar] [CrossRef]
  37. Yang, G.; Li, X.; Liu, P.; Yao, X.; Zhu, Y.; Cao, W.; Cheng, T. Automated in-season mapping of winter wheat in China with training data generation and model transfer. ISPRS J. Photogramm. Remote Sens. 2023, 202, 422–438. [Google Scholar] [CrossRef]
  38. Sani Shawai, R.; Liu, D.; Li, L.; Chen, T.; Li, M.; Cao, S.; Xia, X.; Liu, J.; He, Z.; Zhang, Y. QTL mapping for pre-harvest sprouting in a recombinant inbred line population of elite wheat varieties Zhongmai 578 and Jimai 22. Crop J. 2023, 11, 863–869. [Google Scholar] [CrossRef]
  39. Ma, Y.; Agathokleous, E.; Xu, Y.; Cao, R.; He, L.; Feng, Z. Cultivar-specific regulation of antioxidant enzyme activity and stomatal closure confer tolerance of wheat to elevated ozone: A two-year open-field study with five cultivars. Plant Stress 2024, 12, 100479. [Google Scholar] [CrossRef]
  40. Wu, J.; Gu, Y.; Sun, K.; Wang, N.; Shen, H.; Wang, Y.; Ma, X. Correlation of climate change and human activities with agricultural drought and its impact on the net primary production of winter wheat. J. Hydrol. 2023, 620, 129504. [Google Scholar] [CrossRef]
  41. Morozumi, T.; Kato, T.; Kobayashi, H.; Sakai, Y.; Tsujimoto, K.; Nakashima, N.; Buareal, K.; Lan, W.; Ninomiya, H. Row orientation influences the diurnal cycle of solar-induced chlorophyll fluorescence emission from wheat canopy, as demonstrated by radiative transfer modeling. Agric. For. Meteorol. 2023, 339, 109576. [Google Scholar] [CrossRef]
  42. Wu, L.; Quan, H.; Wu, L.; Zhang, X.; Feng, H.; Ding, D.; Siddique, K.H.M. Responses of winter wheat yield and water productivity to sowing time and plastic mulching in the Loess Plateau. Agric. Water Manag. 2023, 289, 108572. [Google Scholar] [CrossRef]
  43. Chao, E.; Wu, M.; Yue, D.; Yuan, Y.; Qiu, N.; Zhou, F. Promoting effect of low concentration strontium on photosynthetic performance of Chinese cabbage seedlings: Combined leaf characteristics, photosynthetic carbon assimilation and chlorophyll fluorescence. Ecotoxicol. Environ. Saf. 2024, 274, 116200. [Google Scholar] [CrossRef]
  44. Zhang, Q.; Peng, J.; Wang, J. Protective enzyme activity regulation in cotton (Gossypium hirsutum L.) in response to Scirpus planiculmis stress. Front. Plant Sci. 2022, 13, 1068419. [Google Scholar] [CrossRef]
  45. Ge, W.; Bu, H.; Wang, X.; Xia, Y.; Martinez, S.A.; Wang, X.; Qi, W.; Liu, K.; Du, G. Changes in endogenous hormone contents during seed germination of Anemone rivularis var. flore-minore. Glob. Ecol. Conserv. 2020, 24, e01200. [Google Scholar] [CrossRef]
  46. Zhuang, H.; Zhang, Z.; Cheng, F.; Han, J.; Luo, Y.; Zhang, L.; Cao, J.; Zhang, J.; He, B.; Xu, J.; et al. Integrating data assimilation, crop model, and machine learning for winter wheat yield forecasting in the North China Plain. Agric. For. Meteorol. 2024, 347, 109909. [Google Scholar] [CrossRef]
  47. Zhang, H.; Dean, L.; Wang, M.L.; Dang, P.; Lamb, M.; Chen, C. GWAS with principal component analysis identify QTLs associated with main peanut flavor-related traits. Front. Plant Sci. 2023, 14, 1204415. [Google Scholar] [CrossRef]
  48. Ahmed, N.; Zhang, Y.; Li, K.; Zhou, Y.; Zhang, M.; Li, Z. Exogenous application of glycine betaine improved water use efficiency in winter wheat (Triticum aestivum L.) via modulating photosynthetic efficiency and antioxidative capacity under conventional and limited irrigation conditions. Crop J. 2019, 7, 635–650. [Google Scholar] [CrossRef]
  49. Lin, F.; Li, C.; Xu, B.; Chen, J.; Chen, A.; Hassan, M.A.; Liu, B.; Xu, H.; Chen, X.; Sun, J.; et al. Late spring cold reduces grain number at various spike positions by regulating spike growth and assimilate distribution in winter wheat. Crop J. 2023, 11, 1272–1278. [Google Scholar] [CrossRef]
  50. Xiao, L.; Asseng, S.; Wang, X.; Xia, J.; Zhang, P.; Liu, L.; Tang, L.; Cao, W.; Zhu, Y.; Liu, B. Simulating the effects of low-temperature stress on wheat biomass growth and yield. Agric. For. Meteorol. 2022, 326, 109191. [Google Scholar] [CrossRef]
  51. Zhai, L.; Song, S.; Zhang, L.; Huang, J.; Lv, L.; Dong, Z.; Cui, Y.; Zheng, M.; Hou, W.; Zhang, J.; et al. Subsoiling before winter wheat alleviates the kernel position effect of densely grown summer maize by delaying post-silking root-shoot senescence. J. Integr. Agric. 2023; in press. [Google Scholar] [CrossRef]
  52. Liu, X.-J.; Yin, B.-Z.; Hu, Z.-H.; Bao, X.-Y.; Wang, Y.-D.; Zhen, W.-C. Physiological response of flag leaf and yield formation of winter wheat under different spring restrictive irrigation regimes in the Haihe Plain, China. J. Integr. Agric. 2021, 20, 2343–2359. [Google Scholar] [CrossRef]
  53. Gholizadeh, F.; Mirzaghaderi, G.; Marashi, S.H.; Janda, T. Polyamines-Mediated amelioration of cold treatment in wheat: Insights from morpho-physiological and biochemical features and PAO genes expression analyses. Plant Stress 2024, 11, 100402. [Google Scholar] [CrossRef]
  54. Onyemaobi, O.; Sangma, H.; Garg, G.; Wallace, X.; Kleven, S.; Dolferus, R. Transcriptome profiling of the chilling response in wheat spikes: I, acclimation response to long-term chilling treatment. Curr. Plant Biol. 2022, 31, 100255. [Google Scholar] [CrossRef]
  55. Cann, D.J.; Schillinger, W.F.; Hunt, J.R.; Porker, K.D.; Harris, F.A.J. Agroecological Advantages of Early-Sown Winter Wheat in Semi-Arid Environments: A Comparative Case Study From Southern Australia and Pacific Northwest United States. Front. Plant Sci. 2020, 11, 568. [Google Scholar] [CrossRef]
  56. Zhu, T.; Liu, B.; Liu, N.; Xu, J.; Song, X.; Li, S.; Sui, S. Gibberellin-related genes regulate dwarfing mechanism in wintersweet. Front. Plant Sci. 2022, 13, 1010896. [Google Scholar] [CrossRef]
  57. Shang, Q.; Wang, Y.; Tang, H.; Sui, N.; Zhang, X.; Wang, F. Genetic, hormonal, and environmental control of tillering in wheat. Crop J. 2021, 9, 986–991. [Google Scholar] [CrossRef]
  58. Xu, X.; He, W.; Zhang, H. A novel habitat adaptability evaluation indicator (HAEI) for predicting yield of county-level winter wheat in China base on multisource climate data from 2001 to 2020. Int. J. Appl. Earth Obs. Geoinf. 2023, 125, 103603. [Google Scholar] [CrossRef]
  59. Dong, Z.Q.; Jiang, M.Y.; Xue, X.P.; Pan, Z.H.; Li, N.; Zhao, H.; Hou, Y.Y. The applicability evaluation and drought validation of the WOFOST model for the simulation of winter wheat growth in Shandong Province, China. Heliyon 2022, 8, e12004. [Google Scholar] [CrossRef]
Figure 1. Changes in average temperature and average minimum temperature in the Huang-Huai-Hai region.
Agriculture 14 01430 g001
Figure 2. Regional distribution of the frequency of extremely low-temperature disasters in the Huang-Huai-Hai region. (a) Statistical map of extreme minimum temperatures below 0 °C; (b) statistical map of extreme minimum temperatures below −3 °C, (c) statistical map of extreme minimum temperatures below −6 °C.
Agriculture 14 01430 g002
Figure 3. Setting of dynamic temperature and humidity in the artificial climate chamber.
Agriculture 14 01430 g003
Figure 4. Changes in the net photosynthetic rate (Pn) of the leaves of different winter wheat varieties under low-temperature stress. (ac) represent the changes in Pn of “Zhenmai 12” (C1), “Jimai 22” (C2), and “Shannong 38” (incorrectly labeled as C2, should be C3) under different low-temperature stresses for a duration of 2 days (D1), respectively. (df) represent the changes in Pn of “Zhenmai 12” (C1), “Jimai 22” (C2), and “Shannong 38” (C3) under different low-temperature stresses for a duration of 4 days (D2), respectively. (gi) represent the changes in Pn of “Zhenmai 12” (C1), “Jimai 22” (C2), and “Shannong 38” (C3) under different low-temperature stresses for a duration of 6 days (D3), respectively. Measurements were performed in triplicate, representing each value as “mean ± standard deviation (SD)”.
Agriculture 14 01430 g004
Figure 5. Changes in stomatal conductance (Gs) of leaves of different winter wheat varieties under low-temperature stress. (ac) represent the changes in Gs of “Zhenmai 12” (C1), “Jimai 22” (C2), and “Shannong 38” (incorrectly labeled as C2, should be C3 for consistency) under different low-temperature stresses for a duration of 2 days (D1), respectively. (df) represent the changes in Gs of “Zhenmai 12” (C1), “Jimai 22” (C2), and “Shannong 38” (C3) under different low-temperature stresses for a duration of 4 days (D2), respectively. (gi) represent the changes in Gs of “Zhenmai 12” (C1), “Jimai 22” (C2), and “Shannong 38” (C3) under different low-temperature stresses for a duration of 6 days (D3), respectively. Measurements were performed in triplicate, representing each value as “mean ± standard deviation (SD)”.
Agriculture 14 01430 g005
Figure 6. Changes in leaf transpiration rate (Tr) in different winter wheat varieties under low-temperature stress. (ac) represent the changes in stomatal conductance (Gs) of leaves in “Zhenmai 12” (C1), “Jimai 22” (C2), and “Shannong 38” (incorrectly labeled as C2, should be labeled consistently, let’s use C3 for “Shannong 38”) under different low-temperature stresses for a duration of 2 days (D1), respectively. (df) represent the changes in Tr of leaves in “Zhenmai 12” (C1), “Jimai 22” (C2), and “Shannong 38” (C3) under different low-temperature stresses for a duration of 4 days (D2), respectively. (gi) represent the changes in Tr of leaves in “Zhenmai 12” (C1), “Jimai 22” (C2), and “Shannong 38” (C3) under different low-temperature stresses for a duration of 6 days (D3), respectively. Measurements were performed in triplicate, representing each value as “mean ± standard deviation (SD)”.
Agriculture 14 01430 g006
Figure 7. Changes in pigment content in leaves of different winter wheat varieties under low-temperature stress. (ac) represent the changes in chlorophyll A (Chla) content in the leaves of “Zhenmai 12” (C1), “Jimai 22” (C2), and “Shannong 38” (incorrectly labeled as C2, which should be C3) under different low-temperature stresses for durations of 2 days (D1), 4 days (D2), and 6 days (D3), respectively. (df) represent the changes in chlorophyll B (Chlb) content in the leaves of “Zhenmai 12” (C1), “Jimai 22” (C2), and “Shannong 38” (C3) under different low-temperature stresses for durations of 2 days (D1), 4 days (D2), and 6 days (D3), respectively. (gi) represent the changes in carotenoid (Car) content in the leaves of “Zhenmai 12” (C1), “Jimai 22” (C2), and “Shannong 38” (C3) under different low-temperature stresses for durations of 2 days (D1), 4 days (D2), and 6 days (D3), respectively. Measurements were performed in triplicate, representing each value as “mean ± standard deviation (SD).” Note: According to Duncan’s test, lowercase letters indicate significant differences at p < 0.05.
Agriculture 14 01430 g007
Figure 8. Changes in protective enzyme activities in the leaves of different winter wheat varieties under low-temperature stress. (ac) show the changes in superoxide dismutase (SOD) activity in the leaves of “Zhenmai 12” (C1), “Jimai 22” (C2), and “Shannong 38” (C3) under different low-temperature treatments with durations of 2 days (D1), 4 days (D2), and 6 days (D3), respectively. (df) show the changes in catalase (CAT) activity in the leaves of “Zhenmai 12” (C1), “Jimai 22” (C2), and “Shannong 38” (C3) under different low-temperature stresses with durations of 2 days (D1), 4 days (D2), and 6 days (D3), respectively. (gi) show the changes in peroxidase (POD) activity in the leaves of “Zhenmai 12” (C1), “Jimai 22” (C2), and “Shannong 38” (C3) under different low-temperature stresses with durations of 2 days (D1), 4 days (D2), and 6 days (D3), respectively. Measurements were performed in triplicate, representing each value as “mean ± standard deviation (SD)”. Note: According to Duncan’s test, lowercase letters indicate significant differences at p < 0.05.
Agriculture 14 01430 g008
Figure 9. Changes in endogenous hormone content in the leaves of different winter wheat varieties under low-temperature stress. (ac) show the changes in zeatin riboside (ZR) content in leaves of “Zhenmai 12” (C1), “Jimai 22” (C2), and “Shannong 38” (C3, though mislabeled as C2 in the figure) under different low-temperature treatments for 2d (D1), 4d (D2), and 6d (D3), respectively. (df) represent the changes in indole-3-acetic acid (IAA) content in leaves of the same wheat varieties under the same low-temperature stress durations. (gi) show the changes in gibberellin (GA) content in the leaves of wheat varieties under the same stress conditions. (jl) show the changes in abscisic acid (ABA) content in the leaves of the wheat varieties under the same stress duration. Measurements were performed in triplicate, representing each value as “mean ± standard deviation (SD)”. Note: According to Duncan’s test, lowercase letters indicate significant differences at p < 0.05.
Agriculture 14 01430 g009
Figure 10. Correlation analysis of different trait indices under low-temperature stress. (a) shows the correlation analysis of various indices of “Zhenmai 12” under different low-temperature stresses, (b) shows the correlation analysis of various indices of “Jimai 22” under different low-temperature stresses, and (c) shows the correlation analysis of various indices of “Shannong 38” under different low-temperature stresses. *** denotes a highly significant correlation at p < 0.001, ** denotes a significant correlation at p < 0.05, * denotes a significant correlation at p < 0.1.
Agriculture 14 01430 g010
Figure 11. Principal component analysis under different Low-Temperature treatments. (a) shows the scree plot of the principal component analysis (PCA) for the “Zhenmai 12” variety, (b) shows the scree plot of the PCA for the “Jimai 22” variety, (c) represents the scree plot of the PCA for the “Shannong 38” variety, (d) depicts the individual contribution rates of the factors in the PCA for “Zhenmai 12”, (e) depicts the individual contribution rates of the factors in the PCA for “Jimai 22”, (f) depicts the individual contribution rates of the factors in the PCA for “Shannong 38”.
Agriculture 14 01430 g011
Table 1. Arrangement of low-temperature trials in winter wheat in different years.
YearCultivarStageTemperature (Tmix/Tmax) (°C)Duration(d)
2021(C2)Jimai22Joint StageCK (8/18), T4(3/13), T3(0/10), D1(2d), D2(4d),
T2(−3/7)D3(6d)
2022(C1)Zhenmai12, (C2)Jimai22,CK (8/18), T5(6/16), T4(3/13),D1(2d), D2(4d),
(C3)Shannong38T3(0/10), T2(−3/7), T1(−6/4)D3(6d)
2023(C1)Zhenmai12, (C2)Jimai22,CK (8/18), T5(6/16), T4(3/13),D1(2d), D2(4d),
(C3)Shannong38T3(0/10), T2(−3/7), T1(−6/4)D3(6d)
Table 2. Experimental design.
MarkerCultivated SpeciesTemperature [°C]Duration [d]
C1CKD1/C2CKD1/C3CKD1Zhen Mai 12/Ji Mai 22/Shan Nong 2818/82
C1CKD2/C2CKD2/C3CKD2Zhen Mai 12/Ji Mai 22/Shan Nong 2818/84
C1CKD3/C2CKD3/C3CKD3Zhen Mai 12/Ji Mai 22/Shan Nong 2818/86
C1T5D1/C2T5D1/C3T5D1Zhen Mai 12/Ji Mai 22/Shan Nong 2816/62
C1T5D2/C2T5D2/C3T5D3Zhen Mai 12/Ji Mai 22/Shan Nong 2816/64
C1T5D3/C2T5D3/C3T5D3Zhen Mai 12/Ji Mai 22/Shan Nong 2816/66
C1T4D1/C2T4D1/C3T4D1Zhen Mai 12/Ji Mai 22/Shan Nong 2813/32
C1T4D2/C2T4D2/C3T4D2Zhen Mai 12/Ji Mai 22/Shan Nong 2813/34
C1T4D3/C2T4D3/C2T4D3Zhen Mai 12/Ji Mai 22/Shan Nong 2813/36
C1T3D1/C2T3D1/C3T3D1Zhen Mai 12/Ji Mai 22/Shan Nong 2810/02
C1T3D2/C2T3D2/C3T3D2Zhen Mai 12/Ji Mai 22/Shan Nong 2810/04
C1T3D3/C2T3D3/C3T3D3Zhen Mai 12/Ji Mai 22/Shan Nong 2810/06
C1T2D1/C2T2D1/C3T2D1Zhen Mai 12/Ji Mai 22/Shan Nong 287/−32
C1T2D2/C2T2D2/C3T2D2Zhen Mai 12/Ji Mai 22/Shan Nong 287/−34
C1T2D3/C2T2D3/C3T2D3Zhen Mai 12/Ji Mai 22/Shan Nong 287/−36
C1T1D1/C2T1D1/C3T1D1Zhen Mai 12/Ji Mai 22/Shan Nong 284/−62
C1T1D2/C2T1D2/C3T1D2Zhen Mai 12/Ji Mai 22/Shan Nong 284/−64
C1T1D3/C2T1D2/C3T1D3Zhen Mai 12/Ji Mai 22/Shan Nong 284/−66
For the convenience of analyzing the research results, C1, C2, and C3 are used to represent the three wheat varieties “Shannong 38”, “Jimai 22”, and “Zhenmai 12”, respectively. CK, T5, T4, T3, T2, and T1 are used to represent the six temperature gradients of 18 °C/8 °C, 16 °C/6 °C, 13 °C/3 °C, 10 °C/0 °C, 7 °C/−3 °C, and 4 °C/−6 °C, respectively. D1, D2, and D3 are used to represent the three durations of 2 days, 4 days, and 6 days, respectively. To facilitate the observation of the experimental conclusions, the treatments of CKD1, CKD2, and CKD3 under controlled temperatures are collectively referred to as CK.
Table 3. Changes in yield and its component indicators of different winter wheat varieties under low-temperature stress during the jointing stage.
Temperature (a)Stress Days (d)Spikelet Length (cm)Spikelet Weight (g)Thousand-Grain Weight (g)Yield/Pot (g·pot−1)Reduction Rate (%)
C1C2C3C1C2C3C1C2C3C1C2C3C1C2C3
CKD1-D2-D37.25 ± 0.13 Ba7.25 ± 0.13 Ba7.96 ± 0.23 Aa6.94 ± 0.27 Bab2.23 ± 0.12 Bab2.74 ± 0.2 Aa2.32 ± 0.21 Bab45.27 ± 4.95 ABab50.99 ± 2.63 Aa39.33 ± 3.39 Ba73.71 ± 3.83 Ba81.79 ± 2.78 Aa64.06 ± 3.14 Cab
T5D16.62 ± 0.28 Bb6.62 ± 0.28 Bb8.04 ± 0.3 Aa7.05 ± 0.31 Ba2.43 ± 0.22 Aa2.67 ± 0.18 Aab2.42 ± 0.18 Aa47.93 ± 2.28 Aa47.95 ± 2.28 Aab39.27 ± 2.28 Ba70.4 ± 2.28 Bab77.83 ± 2.28 Ab65.6 ± 2.28 Ca−4.640.70
D26.35 ± 0.29 Bbcd6.35 ± 0.29 Bbcd7.65 ± 0.29 Aabc6.94 ± 0.29 Bab2.34 ± 0.29 Aa2.6 ± 0.2 Aabc2.26 ± 0.2 Aab46.26 ± 2.29 Aab46.28 ± 2.29 Abc39.47 ± 2.29 Ba67.62 ± 2.29 Bbc76.64 ± 2.29 Abc65.08 ± 2.29 Bab−6.04−0.06
D36.29 ± 0.29 Bbcd6.29 ± 0.29 Bbcd7.23 ± 0.31 Abcd7.08 ± 0.32 Aa2.34 ± 0.23 Aa2.58 ± 0.19 Aabc2.39 ± 0.19 Aa42.85 ± 2.29 Abc42.87 ± 2.29 Acd39.18 ± 2.29 Ba67.21 ± 2.29 Bbc74.3 ± 2.29 Abc65.22 ± 2.29 Bab−9.00−0.06
T4D16.47 ± 0.3 Bbc6.47 ± 0.3 Bbc7.71 ± 0.31 Aab6.89 ± 0.33 Bab2.32 ± 0.23 Aa2.57 ± 0.2 Aabc2.24 ± 0.2 Aabc38.9 ± 2.3 Bcd40.53 ± 2.3 Ade38.94 ± 2.3 Ba68.37 ± 2.3 Bbc72.99 ± 2.3 Ac62.49 ± 2.3 Cabc−10.56−4.09
D26.3 ± 0.32 Bbcd6.3 ± 0.32 Bbcd7.4 ± 0.32 Abcd6.89 ± 0.32 ABab2.24 ± 0.32 Aab2.55 ± 0.22 Aabc2.19 ± 0.22 Aabc34.35 ± 2.32 Bdefg39.95 ± 2.32 Ade34.39 ± 2.32 Bbcd65.53 ± 2.32 Bc72.7 ± 2.32 Ac61.86 ± 2.32 Babc−10.96−5.11
D35.99 ± 0.27 Bcde5.99 ± 0.27 Bcde6.61 ± 0.27 Aefg6.79 ± 0.27 Aabc2.1 ± 0.27 Aabc2.49 ± 0.17 Aabcd2.1 ± 0.17 Aabcd33.58 ± 2.27 Befg37.23 ± 2.27 Aefg33.62 ± 2.27 Bbcde64.35 ± 2.27 Bcd72.27 ± 2.27 Ac59.34 ± 2.27 Ccde−11.46−8.97
T3D16.35 ± 0.29 Bbcd6.35 ± 0.29 Bbcd7.6 ± 0.29 Aabc6.79 ± 0.29 Babc2.08 ± 0.29 Aabc2.53 ± 0.19 Aabcd2.1 ± 0.19 Aabcd36.8 ± 2.29 Bde39.12 ± 2.29 Adef36.84 ± 2.29 Bab60.87 ± 2.29 Bde72.49 ± 2.29 Ac60.9 ± 2.29 Bbcd−11.20−6.58
D26.18 ± 0.29 Bbcd6.18 ± 0.29 Bbcd7.13 ± 0.29 Acde6.69 ± 0.29 ABabcd1.93 ± 0.29 Aabcd2.4 ± 0.19 Aabcde1.98 ± 0.19 Abcde35.56 ± 2.29 Bdef38.14 ± 2.29 Aef35.6 ± 2.29 ABab60.18 ± 2.29 Bdef72.4 ± 2.29 Ac58.31 ± 2.29 Bcde−11.30−10.56
D35.93 ± 0.29 Bcde5.93 ± 0.29 Bcde7.22 ± 0.29 Abcd6.7 ± 0.29 Aabcd1.75 ± 0.29 Bbcde2.28 ± 0.19 Acdef1.95 ± 0.19 ABbcde30.32 ± 2.29 Bghi34.84 ± 2.29 Afgh30.36 ± 2.29 Bde56.44 ± 2.29 Bfg65.59 ± 2.29 Ad55.02 ± 2.29 Befg−19.72−15.65
T2D15.87 ± 0.31 Bdef5.87 ± 0.31 Bdef7.03 ± 0.31 Adef6.41 ± 0.31 Bbcde1.8 ± 0.31 Bbcde2.33 ± 0.21 Abcdef1.88 ± 0.21 ABcde32.83 ± 2.29 Befgh35.41 ± 2.29 Afgh35.07 ± 2.29 Aabc58.22 ± 2.29 Bef67.77 ± 2.29 Ad57.24 ± 2.29 Bg−16.90−12.07
D25.54 ± 0.29 Befg5.54 ± 0.29 Befg6.65 ± 0.29 Aefg6.31 ± 0.29 Acde1.66 ± 0.29 Bcde2.28 ± 0.19 Acdef1.8 ± 0.19 Bde31.16 ± 2.29 Bfghi35.23 ± 2.29 Afgh33.4 ± 2.29 ABbcde52.56 ± 2.29 Bgh64.41 ± 2.29 Ad55.32 ± 2.29 Befg−20.84−15.07
D35.3 ± 0.32 Bg5.3 ± 0.32 Bg6.53 ± 0.32 Afg6.17 ± 0.32 Ade1.52 ± 0.32 Ade2.05 ± 0.22 Aefg1.75 ± 0.22 Ade28.54 ± 2.32 Bgi33.49 ± 2.32 Agh30.78 ± 2.32 ABcde50.21 ± 2.32 Bhi59.89 ± 2.32 Ae52.54 ± 2.32 Bdef−26.59−19.32
T1D15.55 ± 0.29 Cefg5.55 ± 0.29 Cefg7.04 ± 0.29 Adef6.36 ± 0.29 Bbcde1.66 ± 0.29 Bcde2.17 ± 0.19 Adefg1.79 ± 0.19 ABde30.84 ± 2.29 Bfghi35.07 ± 2.29 Afgh33.08 ± 2.29 ABbcde52.39 ± 2.29 Bfg63.78 ± 2.29 Ad53.43 ± 2.29 Bfg−24.81−17.97
D25.36 ± 0.29 Bfg5.36 ± 0.29 Bfg6.54 ± 0.29 Afg6.19 ± 0.29 Ade1.52 ± 0.29 Ade1.98 ± 0.19 Afg1.69 ± 0.19 Ae28.01 ± 2.29 Bi33.46 ± 2.29 Agh30.25 ± 2.29 ABde47.37 ± 2.29 Cij58.86 ± 2.29 Ae52.42 ± 2.29 Bg−27.83−19.48
D35.1 ± 0.29 Bg5.1 ± 0.29 Bg6.44 ± 0.29 Ag5.98 ± 0.28 Ae1.37 ± 0.28 Be1.84 ± 0.17 Ag1.61 ± 0.17 ABe27.42 ± 2.26 Bi32.14 ± 2.26 Ah29.65 ± 2.25 ABe45.68 ± 2.25 Cj57.82 ± 2.24 Ae51.88 ± 2.24 Bg−29.04−20.21
Symbol definitions are as follows: “CK” represents the control treatment, “T” represents stress temperature (T5, T4, T3, T2, T1 respectively represent minimum temperatures of 6 °C, 3 °C, 0 °C, −3 °C, −6 °C), “D” represents duration (D1, D2, D3 respectively represent stress durations of 2 days, 4 days, 6 days), and “C” represents wheat varieties (C1, C2, C3 respectively represent wheat varieties Zhenmai 12, Jimai 22, and Shannong 38). Capital letters indicate significant differences in yield data among different winter wheat varieties under the same low temperature treatment based on Duncan’s test, while lowercase letters indicate significant differences in yield data among different low temperature treatments within the same winter wheat variety based on Duncan’s test.
Table 4. Classification of disaster levels based on the comprehensive scores of different winter wheat varieties.
Cultivated SpeciesC1C2C3
Stress LevelComprehensive Score (Z)Comprehensive Score (Z)Comprehensive Score (Z)
No stress (0)2.23 < Z1.37 < Z1.16 < Z
Mild stress (1)−0.02 < Z ≤ 2.230.33< Z ≤ 1.370.63 < Z ≤ 1.16
Moderate stress (2) −2.26 <Z ≤ −0.02−0.56 < Z ≤ 0.330.11 < Z ≤ 0.63
Heavy stress (3) Z ≤ −2.26Z ≤ −0.56Z ≤ 0.11
Table 5. Comprehensive scores and low-temperature disaster levels of different wheat varieties under various low-temperature stress treatments.
TemperaturesCKT5T4T3T2T1
Cultivated SpeciesStress DaysZStress LevelZStress LevelZStress LevelZStress LevelZStress LevelZStress Level
C1D12.2801.7111.5211.011−0.152−2.293
D22.3101.3710.9610.671−0.962−3.473
D32.4401.0910.501−0.372−3.533−5.303
C2D11.7701.4601.0310.6510.172−0.403
D21.6301.1500.861−0.042−0.252−0.613
D31.5601.0310.551−0.312−0.542−1.163
C3D11.2301.2001.1600.7210.5320.152
D21.2401.1900.8210.5520.2620.122
D31.2201.1700.7010.5120.132−0.793
Disclaimer/Publisher’s Note: The statements, opinions and data contained in all publications are solely those of the individual author(s) and contributor(s) and not of MDPI and/or the editor(s). MDPI and/or the editor(s) disclaim responsibility for any injury to people or property resulting from any ideas, methods, instructions or products referred to in the content.

