Article

Screening and Evaluation of Biomechanical Properties and Morphological Characteristics of Peduncles in Foxtail Millet

by
Lili Zhang
1,2,3,
Guofang Xing
4,
Zhenyu Liu
2,3,
Yanqing Zhang
2,3,
Hongbo Li
2,3,
Yuanmeng Wang
2,
Jiaxin Lu
2,
Nan An
2,
Zhihong Zhao
2,
Zeyu Wang
2,
Yuanhuai Han
4 and
Qingliang Cui
2,3,*
1
Department of Basic Sciences, Shanxi Agricultural University, Jinzhong 030801, China
2
College of Agricultural Engineering, Shanxi Agricultural University, Jinzhong 030801, China
3
Dryland Farm Machinery Key Technology and Equipment Key Laboratory of Shanxi Province, Jinzhong 030801, China
4
College of Agricultural, Shanxi Agricultural University, Jinzhong 030801, China
*
Author to whom correspondence should be addressed.
Agriculture 2024, 14(9), 1437; https://doi.org/10.3390/agriculture14091437
Submission received: 31 July 2024 / Revised: 15 August 2024 / Accepted: 20 August 2024 / Published: 23 August 2024
(This article belongs to the Section Agricultural Technology)

Abstract

:
Mechanized harvesting is a crucial step in the agricultural production of foxtail millet (Setaria italica), as its peduncles are susceptible to bending and breaking during the harvesting process, leading to yield losses and deterioration in grain quality. To evaluate the suitability of foxtail millet for mechanical harvesting, this study comprehensively analyzed the biomechanical properties of the peduncles and related biological morphological characteristics of 116 foxtail millet accessions, establishing a system for indicator screening and comprehensive evaluation. Using partial correlation analysis and R-type cluster analysis, four biomechanical and seven related morphological indices of the peduncle were screened from 22 candidate indicators, with their coefficient of variation ranging from 6% to 80%. The entropy method was used to assign weights to the selected indices, with biomechanical factors contributing 47.4%, peduncle morphology 20.2%, spike morphology 27.6%, and plant height 4.8%. The Technique for Order Preference by Similarity to Ideal Solution (TOPSIS) and Rank-Sum Ratio (RSR) methods were applied to rank and grade the classification of the 116 foxtail millet varieties into four performance groups: Excellent (8 varieties), Good (50 varieties), Moderate (51 varieties), and Poor (7 varieties). This study provides a scientific basis for the selection and evaluation of foxtail millet varieties.

1. Introduction

Foxtail millet (Setaria italica) is an important cereal crop with a long history of cultivation in China [1]. It is not only a food source but also used for animal feed and various other agricultural purposes [2]. This crop has significant economic and nutritional value, making it an important component of China’s agricultural industry [3]. The peduncle of foxtail millet is an essential part of the stem, located between the base of the spike and the main stem. During the growth and development process, it not only serves as the main channel for the transportation of water, nutrients, and other substances to the spike but is also a sensitive area of the stem that responds to lodging stress [4]. Due to mutual friction between the spikes or external forces such as wind and rain, the peduncle is prone to bending or even breaking.
The skills of agricultural machinery and agronomy have gradually improved and developed in harmony, leading to the extensive development of mechanized farming and planting for foxtail millet. However, progress in mechanized harvesting of foxtail millet has been relatively slow [5,6]. The harvesting process is a major bottleneck in achieving full mechanization for foxtail millet [7]. During the harvest period, the weight of the spikes increases with the maturation of the grains, causing the peduncles to be prone to bending or breaking, which can lead to the spikes falling off, resulting in harvest loss and decreased efficiency. Due to the high planting density of foxtail millet, the spikes and leaves may intertwine, making it difficult for machines to accurately identify and harvest the millet, thereby increasing the challenges of mechanical harvesting and impacting the efficiency and quality of the harvest. To address these issues, many scholars have dedicated efforts to studying the harvestability and lodging resistance of foxtail millet from various perspectives [8,9,10,11,12].
The accessions of foxtail millet are abundant, but precise identification and evaluation of these resources have not been comprehensively carried out, resulting in a severe lack of germplasm resources with significant application value [13]. To screen germplasm with excellent comprehensive performance in quality, yield, and stress resistance from numerous resources, it is necessary to adopt systematic evaluation methods that consider multiple aspects. Some studies have used different methods to comprehensively evaluate the yield and quality of foxtail millet, such as principal component analysis and clustering analysis [14,15,16], grey relational analysis [17,18,19], membership function methods [20,21,22], the technique for order preference by similarity to ideal solution (TOPSIS) method [23,24,25], and the rank-sum ratio (RSR) method [26,27,28]. Research on the evaluation of the biomechanical properties of foxtail millet stalks mainly focuses on the establishment and screening of indicators for lodging resistance. For instance, Yuan et al. [29] proposed biomechanical indicators related to stalk lodging resistance and suggested using critical force and stalk coefficient as evaluation indicators for crop lodging resistance. Guo et al. [30] studied the correlation between biomechanical indicators related to stalk bending performance and lodging resistance, pointing out that strength indicators are the main factors to consider when evaluating stalk lodging resistance. Gao et al. [31] evaluated the lodging resistance of foxtail millet using the lodging coefficient, and their results showed that the lodging coefficient is significantly correlated with mechanical strength and root dry weight. These results are based on single indicators for evaluating lodging resistance in foxtail millet. However, few studies have combined these biomechanical indicators with the agronomic traits of foxtail millet for comprehensive evaluation. Jia et al. [32] conducted a comparative analysis of the growth traits, agronomic traits, and lodging resistance of 42 different foxtail millet varieties but did not perform comprehensive evaluation research. Research on the relationship between the biomechanical properties and morphological characteristics of foxtail millet has primarily focused on the anti-lodging indicators of millet stalks. However, there has been limited reporting on the biomechanical properties of the peduncle and their relationship with the morphological characteristics of foxtail millet. Therefore, conducting research on the relationship and comprehensive evaluation of the biomechanical properties and related morphological characteristics of the peduncle is of significant importance.
This study aims to construct a multi-index evaluation system for the biomechanical properties and related morphological characteristics of peduncles in foxtail millet. The research primarily focuses on the peduncle, conducting biomechanical experiments and related biological morphological analyses to identify the key indicators that influence the performance of mechanical harvesting. By applying statistical methods, the study ranks and classifies 116 foxtail millet samples, intending to provide theoretical support for the selection of foxtail millet varieties suitable for mechanical harvesting and offering scientific guidance for the design of foxtail millet harvesting machinery.

2. Materials and Methods

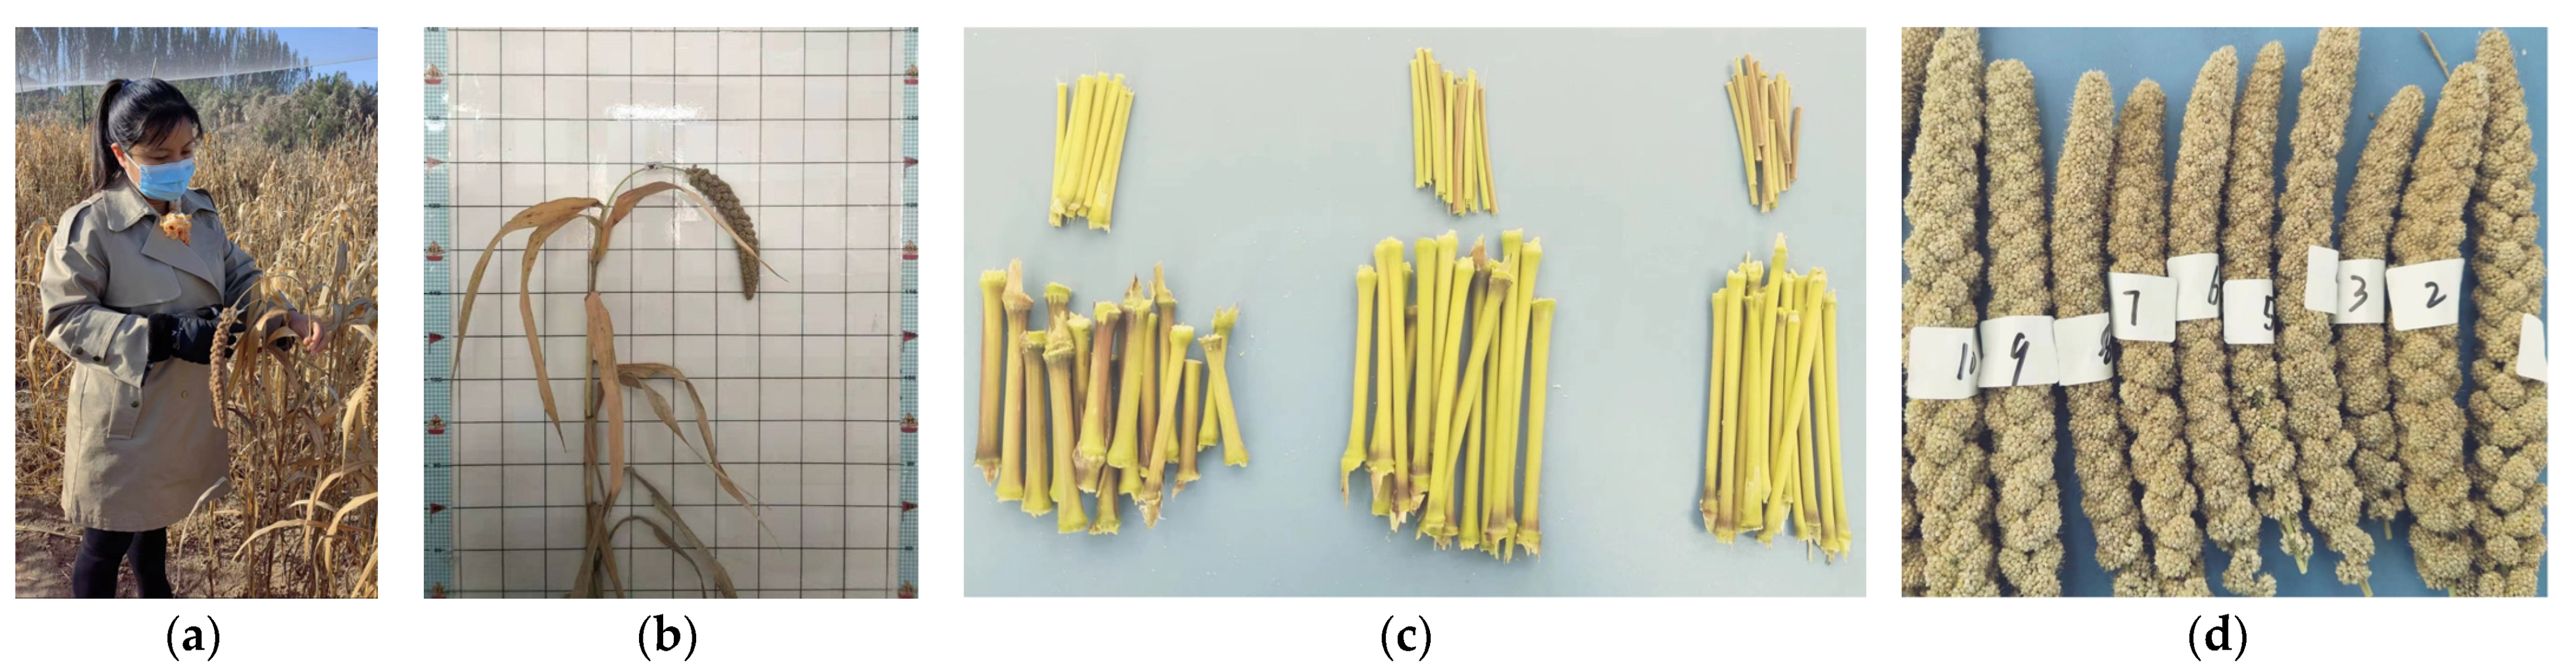
2.1. Experimental Materials

A total of 116 foxtail millet accessions from the Institute of Agricultural Bioengineering, Shanxi Agricultural University (Taigu, Jinzhong, China), were used for this study. All accessions were sown in the fields of Shanxi Agricultural University (37°25′ N, 112°35′ E) in early May and harvested in early October 2019. The planting density was 10 cm between plants in a row, with 30 cm between rows. Planting was done by acupoint seeding with 3–5 grains per well. During the harvest period, 10 different plants were randomly sampled from the field, and the mean value was used to represent the trait level of the tested varieties.

2.2. Index Determination

2.2.1. Morphological Characteristics

During the maturity stage of millet, different varieties of millet samples were randomly selected from the field, with 10 selections for each variety. After sampling, the plant height and natural plant height were immediately measured, followed by cutting the stem at the node to separate the peduncle and the spike. The field sampling site and test samples are shown in Figure 1. These samples were used to measure the morphological characteristics of different parts, with the average values representing the measured indicators.
Plant Height (full length of the plant): The height from the base of the stem to the highest point of the plant without bending. Natural Plant Height: The height from the base of the stem to the highest point in the natural state.
Spike Length: The length of the grain spike. Spike Diameter: The diameter of the thickest part of the grain spike. Spike Fresh Weight: The weight of the grain spike in its natural state. Spike Dry Weight: The weight of the grain spike after drying to a constant weight at 105 °C.
Peduncle Length: The length of the peduncle. Peduncle Diameter: The external diameter of the peduncle. Thickness of the Peduncle Wall: The thickness of the cell wall in the cross-section of the peduncle. Fresh Weight of Peduncle: The weight of the peduncle in its natural state. Dry Weight of Peduncle: The weight of the peduncle after drying to a constant weight at 105 °C.
A ruler (with a range of 100 cm and a precision of ±0.1 cm) was used to measure plant height, natural plant height, spike length, the diameter of the spike, and peduncle length. An electronic digital display caliper (with a range of 150 mm and a precision of ±0.01 mm) was used to measure the external diameter and wall thickness of the peduncle. An electronic analytical balance (with a range of 60 g and a precision of ±0.1 mg) was used to weigh the spikes and peduncles. A 3KFG-01 DHG series heating and drying oven (with a temperature adjustment range of 50–200 °C) was used to dry the peduncles and spikes.
According to the above indicators, the flexural index ρ of the foxtail millet plant, moisture content p, and thickness-diameter ratio r of the peduncle can be calculated using Formulas (1)–(3).
ρ = 1 h l × 100 % ,
p = M m M × 100 % ,
r = d D .
where h is the natural plant height, l is the plant height, M and m represent the fresh weight and dry weight, respectively, and d and D represent the wall thickness and external diameter of the peduncle, respectively.

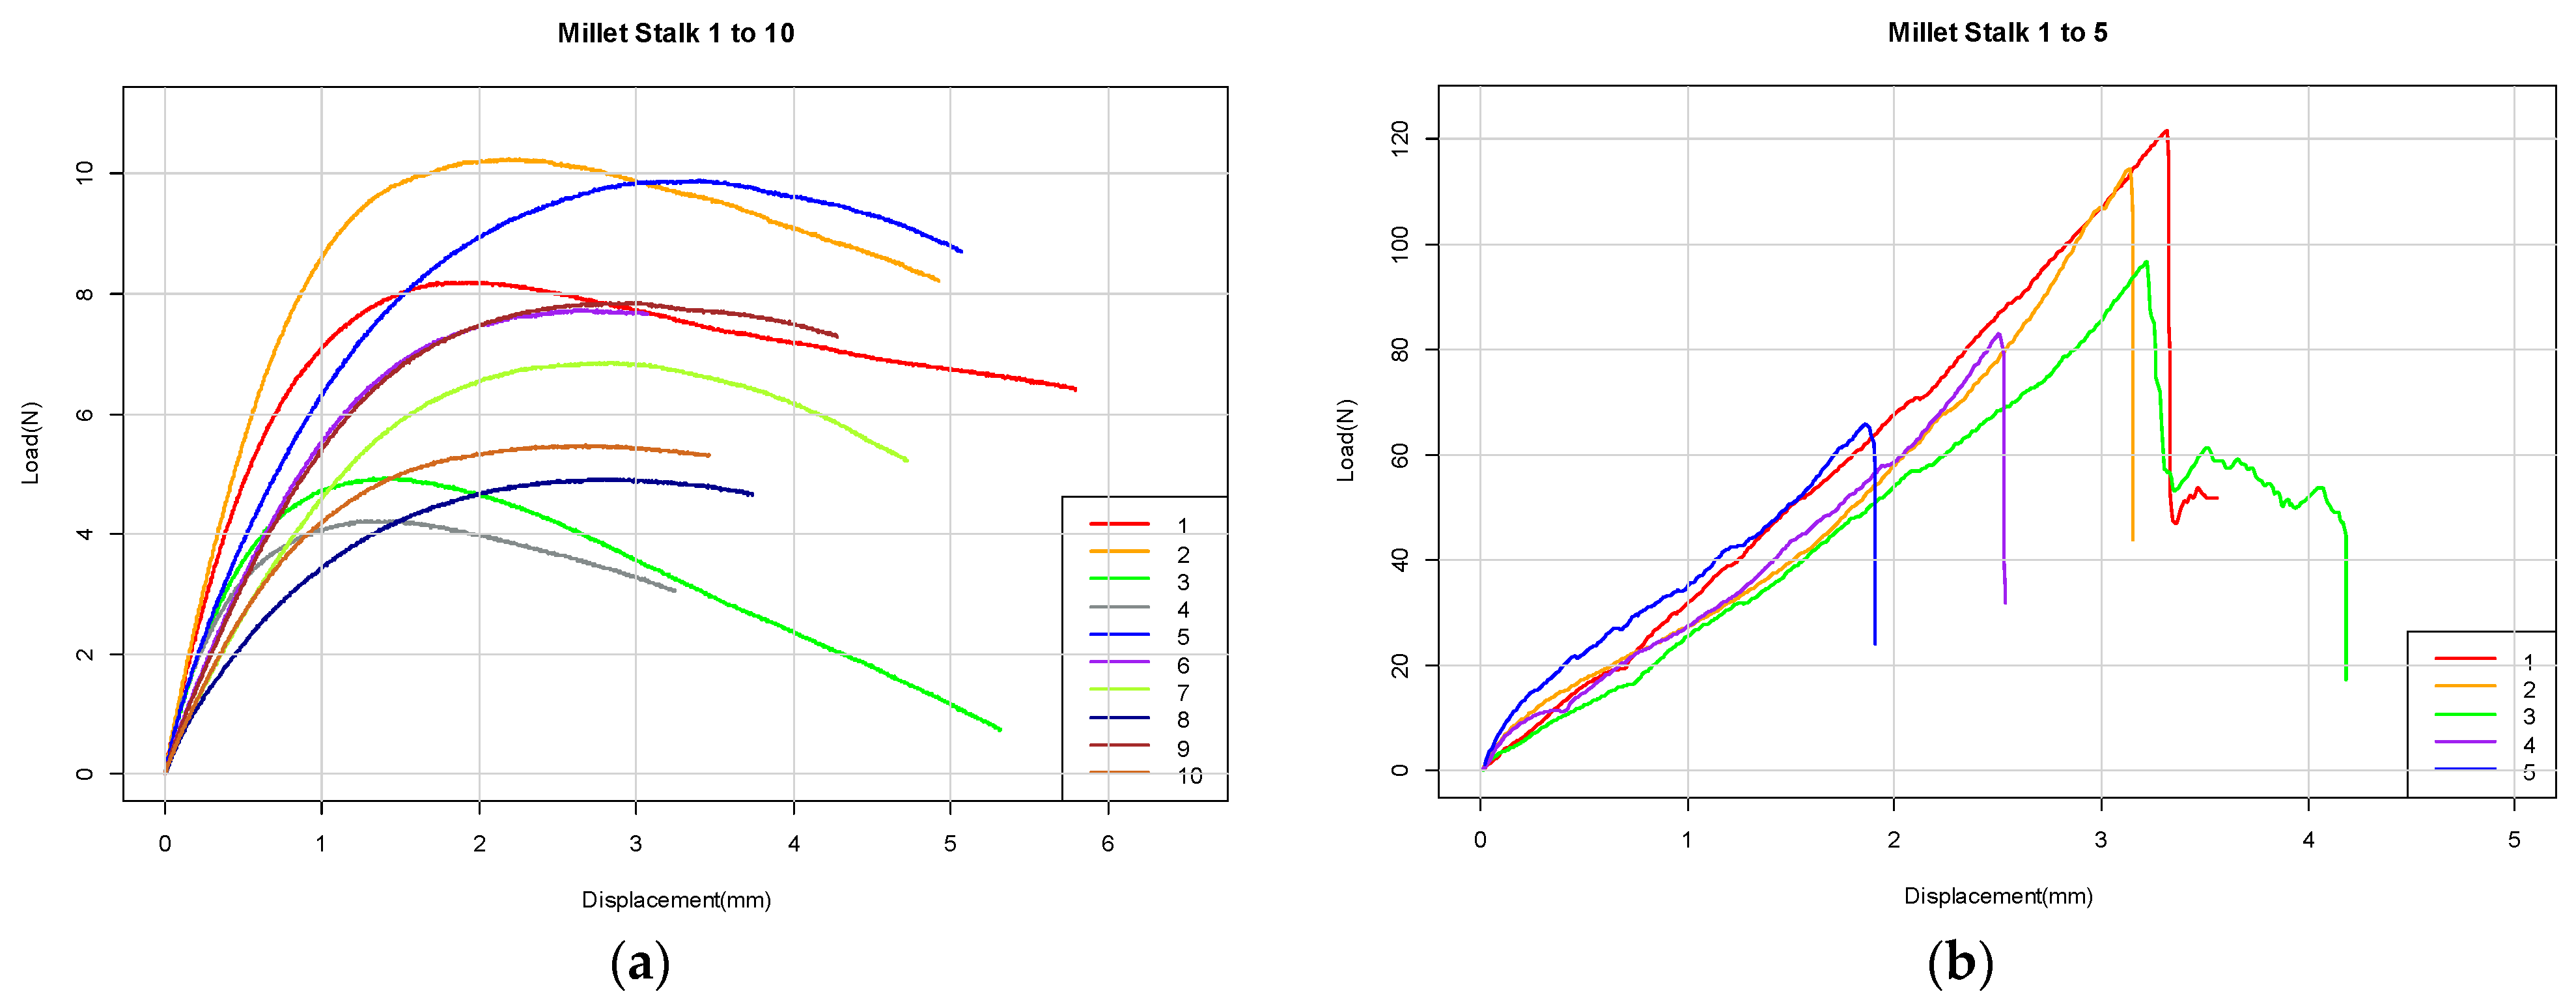
2.2.2. Biomechanical Properties

After measuring the morphological indices, the peduncle was cut along the nodes and divided into three equal parts. A section that was more straight at the connection with the stem was chosen as the specimen for the bending and shearing tests. The determination of the biomechanical traits of the peduncle was performed concurrently with the measurement of morphological characteristics, and the test methods adhered to the standards for solid material mechanical property testing.
The bending and shear tests (Figure 2) were performed using a 5544 universal material testing machine produced by INSTRON Corporation of the United States (Boston, MA, USA), with a maximum load capacity of 2 kN and an accuracy of approximately 0.5% within the standard measuring range.
The bending test (Figure 2a,b) was conducted using a built-in clamp, where the peduncle samples were placed horizontally between two supporting clamps, ensuring that the axial direction of the specimen was perpendicular to the loading direction. The test began at the instant of contact between the indenter and the peduncle. At this time, the peduncle was fixed by the supporting fixtures and the indenter, preventing it from rolling or flipping. The loading rate was set at 10 mm/min [33]. The shear test (Figure 2c,d) utilized a custom-made clamp [34], where the peduncle samples were placed in the through-hole of the upper fixture. Then, the upper fixture was pressed into the lower circular passage to initiate the shear test. The loading rate was set at 5 mm/min. The tests on the peduncles of each millet variety were repeated five times.
The universal material testing machine recorded in real-time the load-displacement curves (Figure 3) of the peduncle specimens during the bending and shear tests, as well as related data such as bending force and shear force. The cross-sectional moment of inertia, elastic modulus, bending strength, flexural rigidity, and shear strength of the peduncle specimens were calculated according to the method described in reference [33].
From Figure 3, it can be observed that in the bending test, the specimen exhibits elastic behavior in the initial stage, meaning it can recover to its original shape after deformation. As the test progresses, it gradually enters the yielding stage, at which point the plastic deformation of the material begins to increase, and the bending force reaches its maximum value. When the load is continued to be applied, the bending force gradually decreases due to the plastic deformation of the material, leading to a decrease in its stiffness. Ultimately, the test stops. In the shear test, the specimen also exhibits elastic behavior in the initial stage. As the test continues, the shear force uniformly increases until the specimen reaches the yielding stage. After the yield point, the shear force rapidly increases to its maximum value, indicating that the material starts to undergo faster plastic deformation. When the shear force reaches its maximum value, the material is completely sheared off, showing that the material cannot continue to withstand the shear force. If the shear force continues to be applied, the shear force will gradually decrease and eventually tend to zero, and the test stops.

2.3. Data Processing and Analysis Methods

Data analysis in this study was conducted using R language (version 4.2.3), employing the ppcor package’s pcor() function for calculating partial correlation coefficients among variables, the corrplot package’s corrplot() function for generating heatmaps and hierarchical clustering diagrams, and the stars() function for producing star plots.

2.3.1. Data Preprocessing

In comprehensive evaluations, indicators can be divided into three categories based on their impact direction on the evaluated object: positive indicators, reverse indicators, and moderate indicators. Before conducting a comprehensive evaluation, it is necessary to ensure the consistency and dimensionlessness of the indicators [35]. The method of achieving consistent treatment of indicators involves converting reverse and moderate indicators into positive indicators uniformly. Moderate indicators are transformed into reverse indicators using Formula (4), and reverse indicators are transformed into positive indicators using Formula (5). The Min-Max normalization method (Equation (6)) is performed for dimensionless treatment of indicators.
x i j = x i j M j m j 2 , i = 1 , 2 , , n ;   j = 1 , 2 , , p ,
x i j = M j x i j , i = 1 , 2 , , n ;   j = 1 , 2 , , p ,
x i j * = x i j m j M j m j i = 1 , 2 , , n ;   j = 1 , 2 , , p ,
where xij is the jth index of the ith individual, Mj is the maximum value of the jth index, mj is the minimum value of the jth index, x i j is the indicator obtained through the consistent treatment of indicator xij, and x i j * is a variable obtained through the normalization of indicator x i j . n and p are the numbers of samples and indicators, respectively.

2.3.2. Multi-Index Screening Method

To eliminate the influence of redundant variables, partial correlation analysis [36] was conducted on the measured indicators. Partial correlation coefficients (Equation (7)) were used to describe the net correlation between two variables.
r 12 ( j ) = r 12 r 1 j r 2 j 1 r 1 j 2 1 r 2 j 2 j = 3 , 4 , , n
where the Pearson correlation coefficient r12 is the correlation between standardized variables x1 and x2.
According to the partial correlation coefficients, R-type clustering analysis [37] can be performed on these indicators. The principle for clustering is to have the highest possible partial correlation coefficients within the same cluster and the lowest possible partial correlation coefficients between different clusters. Subsequently, representative indicators are selected within each group to establish a comprehensive evaluation index system.

2.3.3. The Entropy Weighting Method

The entropy value method [23,24] was used to assign weights to the various evaluation indicators. The contribution of the i-th individual for the j-th indicator is determined by Formula (8). For the j-th indicator, the information entropy value (ej), the information utility value (gj), and the weight (wj) are computed using Formulas (9)–(11), respectively.
p i j = x i j * i = 1 n x i j * , i = 1 , 2 , , n ;   j = 1 , 2 , , p ,
e j = 1 ln n i = 1 n p i j ln p i j , j = 1 , 2 , , p ,
g j = 1 e j , j = 1 , 2 , , p ,
w j = g j j = 1 p g j , j = 1 , 2 , , p .

2.3.4. The TOPSIS Comprehensive Evaluation Method

The TOPSIS method [23] was used to score and rank 116 foxtail millet accessions. For each individual i i = 1 , 2 , , n , the standardized weighted indicator value (zij) was calculated using Formula (12). The maximum (Zj+) and minimum (Zj) values (Equation (13)) for each indicator were determined from the dataset to identify the optimal and worst solutions, respectively. The distance of each individual from the optimal (Di+) or worst (Di) solution was then calculated using Formula (14). Finally, the comprehensive score index for each individual was calculated according to Formula (15).
z i j = w j p i j , j = 1 , 2 , , p ,
Z j + = max 1 i n z i j , Z j = min 1 i n z i j , j = 1 , 2 , , p ,
D i + = j = 1 p Z j + z i j 2 , D i = j = 1 p Z j z i j 2 , i = 1 , 2 , , n ,
S i = D i D i + + D i , i = 1 , 2 , , n .
The comprehensive score will always fall between 0 and 1. A score closer to 1 indicates that the alternative is more similar to the positive ideal solution and thus considered to have a higher comprehensive capability. Conversely, a score closer to 0 indicates that the alternative is more similar to the negative ideal solution and thus considered to have lower capability.

2.3.5. The RSR Comprehensive Evaluation Method

Based on the TOPSIS ranking results, the Rank Sum Ratio (RSR) method [26,27] can be chosen to classify the outcomes. The comprehensive score index Si is used as a positive indicator, while the sorting result obtained from the TOPSIS method is considered a negative indicator (i.e., the reverse order of the sorting results). Additionally, the ranking process is carried out using a non-integer sorting method (Formula (16)). According to Formula (17), the rank sum ratio RSRi for the i-th individual is calculated. The values of RSRi are sorted from smallest to largest, and the cumulative frequency pi is calculated, with the last item pn being adjusted using Formula (18). The cumulative frequency is then converted into probability units Probiti using Formula (19). Regression analysis is conducted with the probability value Probiti as the independent variable and the rank sum ratio RSRi as the dependent variable, resulting in the regression Equation (20).
R i j = 1 + n 1 x i j m M m ,   w h e n   x i j   i s   a   p o s i t i v   e i n d i c a t o r , 1 + n 1 M x i j M m ,   w h e n   x i j   i s   a   n e g a t i v e   i n d i c a t o r ,
R S R i = 1 n p j = 1 p w i j R i j , i = 1 , 2 , , n
p n = 1 1 4 n × 100 %
P r o b i t i = z p i + 5
R S R i = a + b P r o b i t i
where Rij is the rank of the i-th individual for the j-th indicator, n is the number of individuals, p is the number of indicators, xij represents the indicator value of the i-th individual for the j-th indicator, m is the smallest and M is the largest value among them, z p i is the percentile of the standard normal distribution pi, and a and b are the regression coefficients.
Each individual is sorted based on the RSR fitted values obtained from regression Equation (20), and then binned according to the best binning principle, which aims to ensure that the data within the same bin are as similar as possible, while the data between bins are as different as possible. After binning, a test for homogeneity of variances is conducted on the binning results. If the results do not meet the requirements, it may be necessary to adjust the number of bins appropriately. The higher the category, the better the performance of the evaluated object.

3. Results

3.1. Descriptive Statistical Analysis

Descriptive statistical analysis was performed on fifteen biological morphological characteristics and seven biomechanical properties for 116 foxtail millet accessions. The statistical data, including mean values, standard deviations, and coefficients of variation for each indicator, are presented in Table 1. It can be observed that among the 15 morphological traits, the coefficients of variation (CVs) for the fresh weight and dry weight of the peduncle are relatively high, at 48% and 45%, respectively. The CV for the moisture content of the peduncle is lower, at 6%. The remaining indicators all have CVs exceeding 10%. The seven biomechanical properties shave CVs ranging from 27% to 80%. These results indicate that the selected foxtail millet materials possess rich genetic diversity.

3.2. Screening Indicators

The various biological morphological and biomechanical indicators of foxtail millet usually have inherent connections. To understand the relationships between these traits, it is important to perform correlation analysis. The Pearson correlation coefficient measures the linear association between two variables but does not account for the influence of other factors. To obtain a measure of the net correlation between two variables after removing the effects of other variables, partial correlation analysis is required. This allows for the examination of the specific relationship between two traits while holding constant the values of other traits that may influence the relationship.
Figure 4 is a heatmap and hierarchical clustering diagram of the partial correlation coefficients for the 15 morphological characteristics in 116 foxtail millet materials. Positive correlations are displayed in blue, while negative correlations are shown in red, with the intensity of the color and the size of the circles proportional to the magnitude of the partial correlation coefficients. In Figure 4a, the numbers in the lower triangle represent the partial correlation coefficients between each pair of traits, and the upper triangle indicates the degree of correlation between each pair of traits. In Figure 4b, the annotated numbers represent the p-values for correlation between indicators that are not significant at the 0.01 level. The larger the p-value, the weaker the correlation. Indicators without annotated numbers indicate that their p-values are all less than 0.01. The diagonal represents the degree of correlation and the clustering situation between variables, with indicators boxed together indicating a stronger correlation and belonging to the same cluster.
From Figure 4, it can be observed that the 15 morphological indicators of foxtail millet plants, based on their partial correlation coefficients, are divided into seven categories. Among them, plant height, natural plant height, and flexural index primarily describe the external characteristics of foxtail millet plants. The dry and wet weight, as well as the moisture content of the spike, serve as weight indicators for the millet spike and can be used to assess the size and potential yield of the spike. The external diameter, wall thickness, and thickness-to-diameter ratio of the peduncle are indicators of the cross-sectional parameters of the peduncle, which affect whether the peduncle can withstand its own weight and external pressure, crucial for the stability and lodging resistance of the spike. The dry and wet weights, as well as the moisture content of the peduncle, represent the weight indicators of the peduncle and can be used to evaluate its supporting capacity. The peduncle length, spike length, and spike diameter belong to their own categories, and in significance tests with other indicators, they have larger p-values, indicating a weaker net correlation with the other traits and may operate independently of other characteristics.
For the seven biomechanical indicators of the peduncle, the heatmap and hierarchical clustering diagram of the partial correlation coefficients are shown in Figure 5.
From Figure 5, it can be suggested that the biomechanical property indicators can be categorized into four groups: bending strength and maximum bending force are grouped together, indicating that they collectively reflect the material’s ability to resist fracturing under bending or breaking forces; flexural rigidity and the cross-sectional moment of inertia are grouped together, suggesting that they are related to the material’s capacity to resist bending deformation; elastic modulus forms an independent category, reflecting the material’s resistance to elastic deformation; and shear strength and maximum shear force are grouped together, jointly describing the material’s shear resistance under the action of shear forces.
Based on the results of partial correlation and clustering analyses, seven morphological traits, including plant height, spike length, spike diameter, spike weight, and the length, diameter, and moisture content of the peduncle were selected to describe the biological morphological characteristics of foxtail millet plants. The indicators of elastic modulus, bending strength, flexural rigidity, and shear strength were chosen to describe the biomechanical properties of the peduncle. These indicators provide key parameters for constructing an evaluation index system for the morphological characteristics and biomechanical properties of foxtail millet plants and also serve as a basis for the screening and evaluation of foxtail millet varieties suitable for mechanical harvesting.

3.3. Index Weighting Based on the Entropy Value Method

First, the 11 evaluation indicators were classified based on their direction of influence on the evaluation object. Plant height is a crucial morphological trait in foxtail millet plants, closely associated with yield and lodging resistance. Short-stemmed plants are beneficial for photosynthesis and can enhance lodging resistance, making them more suitable for dense planting. Therefore, plant height is considered a negative indicator for comprehensive evaluation. The length, diameter, and weight of the spike are all positively correlated with yield and are considered positive traits. Plants with longer peduncles exhibit a larger amplitude of movement under wind and rain loads, which provides a certain buffering effect and aids in crop lodging resistance. Plants with a larger external diameter (thicker) peduncle have higher filling characteristics and yield; thus, the length and external diameter of the peduncle are positive traits. The moisture content of the peduncle, when maintained within a suitable range, is beneficial for normal physiological activities, photosynthesis, and ultimately, the yield of the crop. However, an excessively high moisture content is not necessarily better; it could lead to plant diseases or crop lodging. Therefore, the moisture content of the peduncle is considered a moderate indicator. For the bending and shear characteristics of the peduncle in foxtail millet, the elastic modulus, bending strength, flexural rigidity, and shear strength are all positively correlated with suitability for mechanical harvesting. In breeding and cultivation management, varieties that exhibit excellent performance in these parameters are given priority consideration. Therefore, they are all considered positive indicators. The 11 selected evaluation indicators, after treatment for data consistency and dimensionlessness, were weighted using the entropy method, and the results are presented in Table 2.
From Table 2, it can be observed that the order of weights for the 11 evaluation indicators is as follows: flexural rigidity of the peduncle > bending strength of the peduncle > spike length > peduncle length > spike diameter > elastic modulus of the peduncle > external diameter of the peduncle > spike weight > shear strength of the peduncle > plant height > moisture content of the peduncle. The weights of the biomechanical property indicators of the peduncle (bending rigidity, bending strength, elastic modulus, shear strength) are 47.4%, the morphological indicators of the peduncle (peduncle length, external diameter, moisture content) are 20.2%, the morphological indicators of the spike (spike length, diameter, weight) are 27.6%, and the weight of plant height is 4.8%.

3.4. TOPSIS-RSR Comprehensive Evaluation

Using the weights of various indicators and following the calculation steps of the TOPSIS method (Equations (12)–(15)), the positive ideal solution distance (PISD), negative ideal solution distance (NISD), comprehensive score index, and ranking results for each variety of foxtail millet were obtained. According to the RSR method, with the comprehensive score index as a positive indicator and the ranking result as a negative, the weights of these two indicators were calculated using the entropy method, with results of 35.4% and 64.6%, respectively. According to Formula (16), the rank values (R) of each indicator for each variety of foxtail millet were calculated. According to Formulas (17)–(19), the rank sum ratio (RSR), cumulative frequency (p), and probability unit (Probit) for each variety were calculated in sequence. The results are presented in Table 3.
With the Probit as the independent variable and the RSR as the dependent variable, regression analysis was performed. The results of the regression analysis are shown in Table 4.
The results indicate that the regression coefficients and the regression equation passed the significance test. The VIF values are all less than 10, indicating that there is no multicollinearity problem in the model. The model has a goodness of fit of 0.98, indicating that the regression model performs well. The obtained regression equation is as follows:
fitted R S R = 0.767 + 0.245 P r o b i t
Using the fitted RSR values obtained from the RSR method, the sorting results were categorized into different levels using the optimal grading principle. The corresponding sorting and grading summary results are shown in Table 3.
From Table 3, it can be seen that the 116 foxtail millet accessions selected in this study can be divided into four tiers, with higher tiers indicating better overall characteristics of the foxtail millet plants. The evaluation levels, from high to low, are recorded as excellent, good, medium, and poor. The fourth tier represents varieties with the highest overall characteristics, with a Probit critical value greater than 6.5, including 8 materials such as B336, B324, and B186; the third tier consists of varieties with good overall characteristics, with a Probit critical value ranging from 5 to 6.5, containing 50 materials; the second tier is composed of varieties with medium overall characteristics, with a Probit critical value ranging from 3.5 to 5, encompassing 51 materials; and the first tier comprises varieties with poor overall characteristics, with a Probit critical value less than 3.5, including seven materials such as B330, B405, and B239.
To verify the reasonableness of the grading results, a variance analysis was conducted with the grading level as a factor (Table 5), and descriptive statistical analyses were performed on the fitted RSR values of foxtail millet germplasm within each grading category (Table 6). The results reveal significant differences in the fitted RSR values among the different grades of millet germplasm, with the highest fitting value in the 4th grade, and a decrease in order from there. This indicates that the grading process is effective in differentiating the performance levels of foxtail millet accessions and that the grading results are reasonable.
To intuitively display the characteristics of each indicator for foxtail millet germplasm, Figure 6 provides a radar chart of 116 foxtail millet varieties, showcasing seven morphological traits of the plant, and four biomechanical properties of the peduncle. The radar chart allows for a clear visualization of multivariate data, enabling observers to quickly grasp the relative positions and distributions of different samples across various indicators [38,39].
From Figure 6, it can be observed that cultivars performing well, such as B336, have higher values for positive indicators such as spike length, peduncle length, peduncle external diameter, peduncle weight, and bending stiffness, while they have lower values for negative indicators like plant height. This indicates that these foxtail millet varieties exhibit excellent performance in both the morphological characteristics and biomechanical properties of the peduncle.

4. Discussion

4.1. Screening of the Measured Indicators

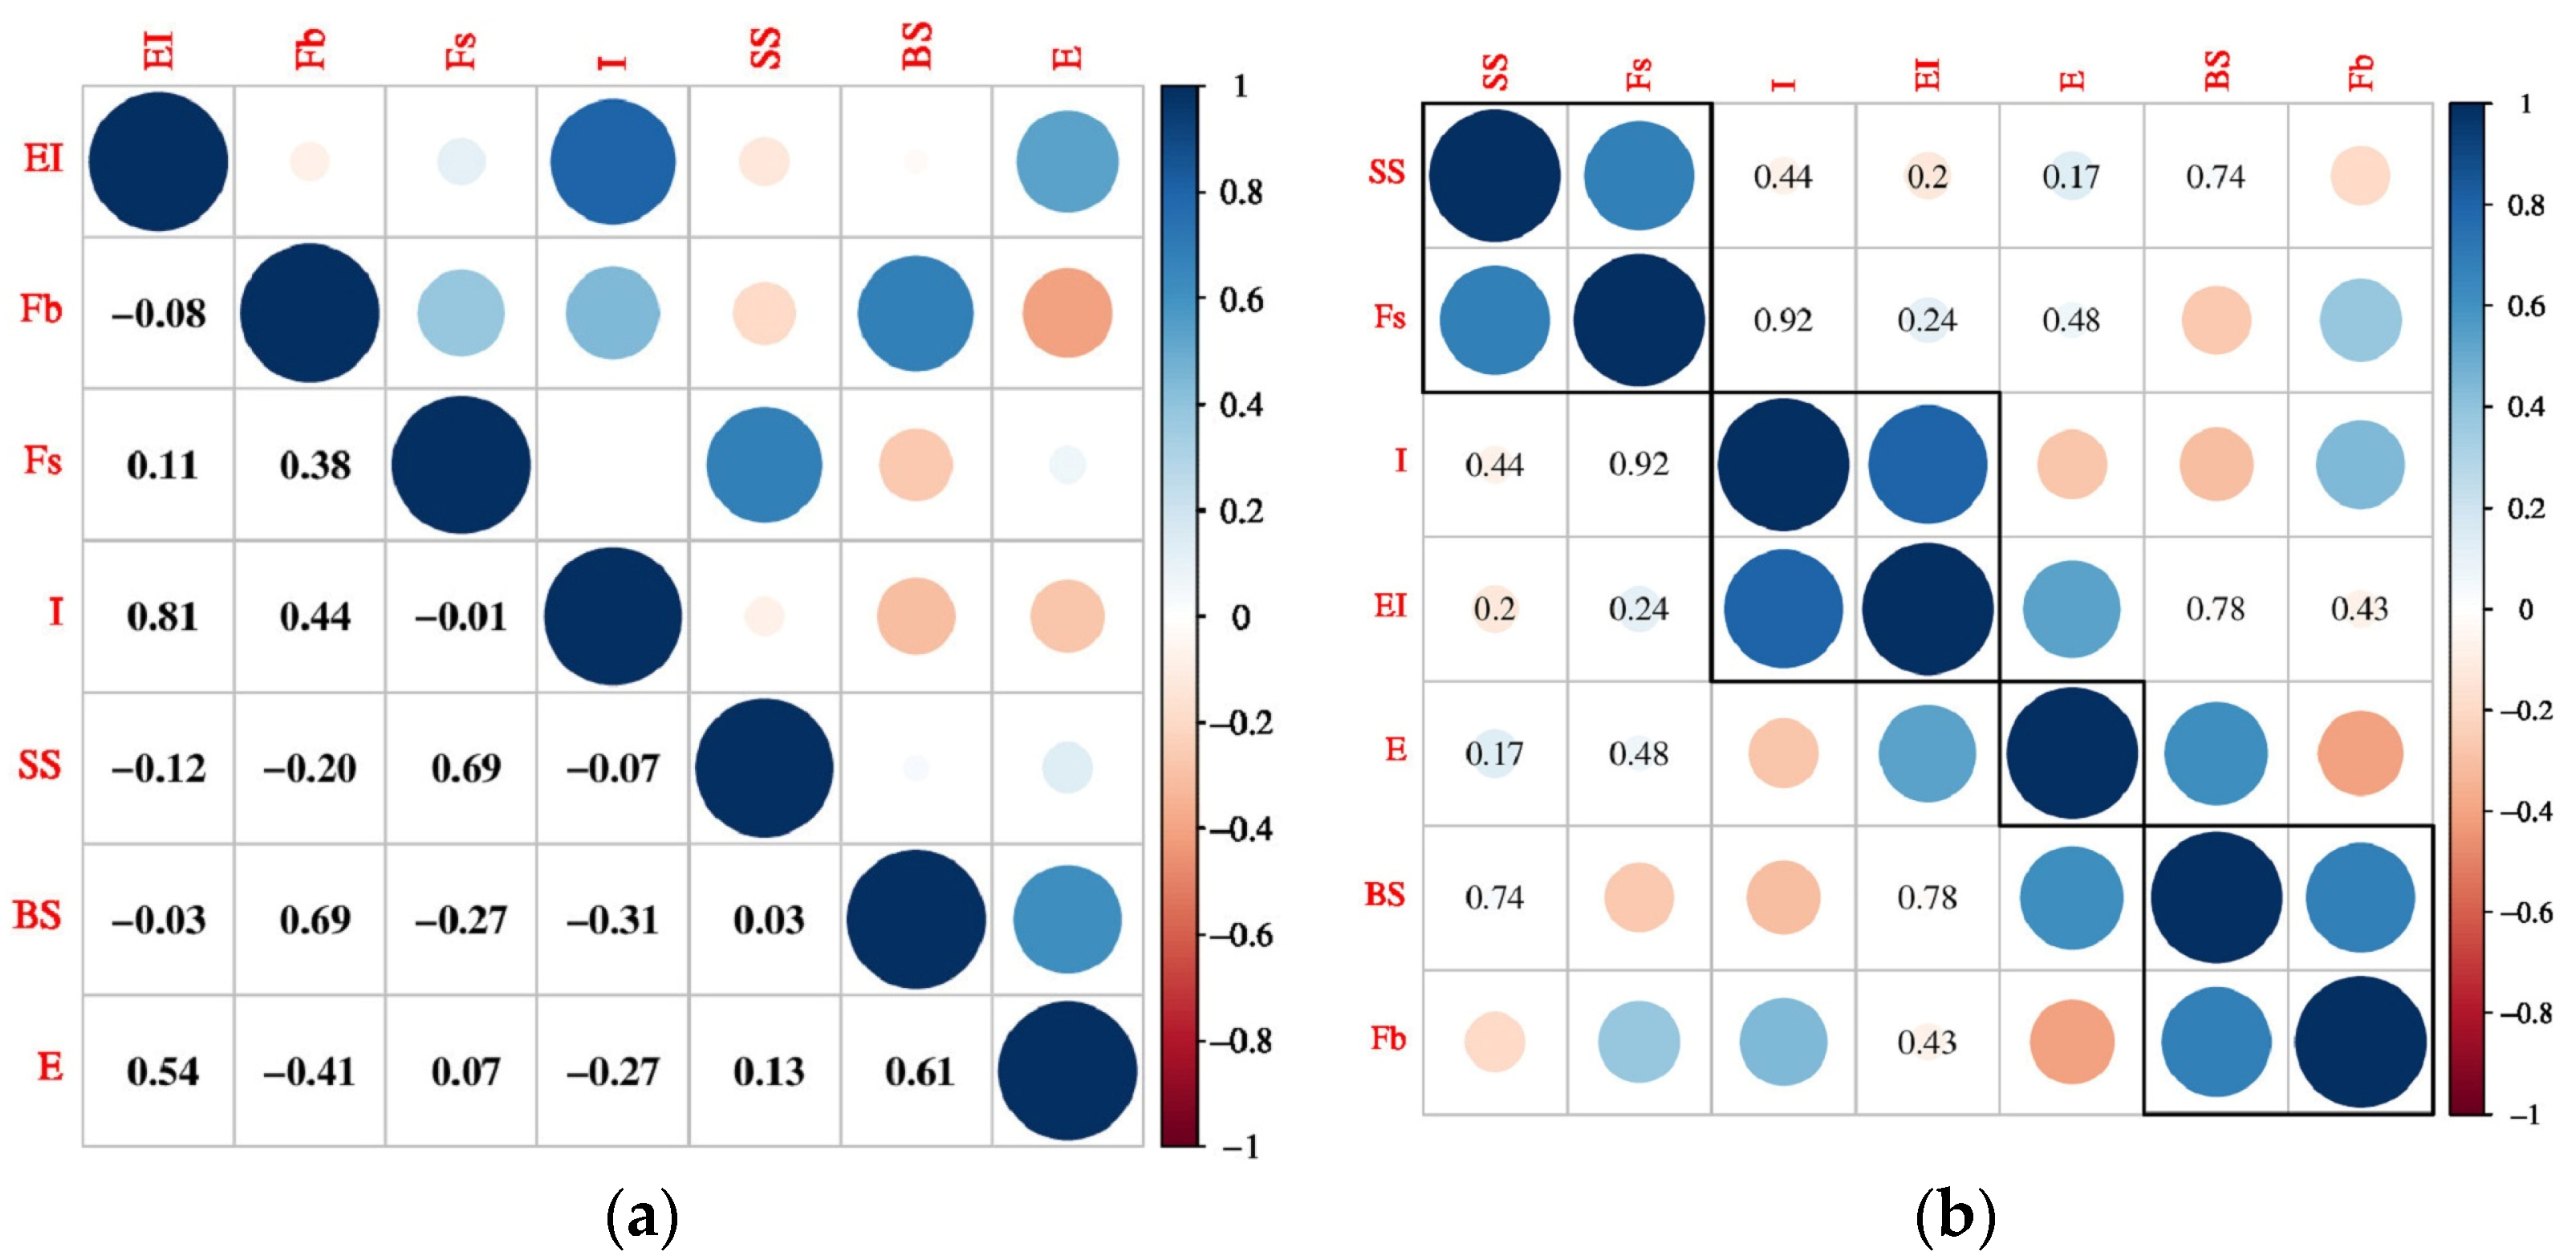
4.1.1. Partial Correlation Analysis of the Indicators

Correlation analysis is a crucial statistical method for examining relationships between different traits [40]. Partial correlation coefficients allow for the examination of the net relationship between two variables without considering the influence of other variables, and they can identify non-linear correlations between variables, providing more accurate results than simple correlation coefficients [36]. Utilizing partial correlation analysis, this study identified relationships among fifteen morphological and seven biomechanical traits in 116 foxtail millet samples, revealing significantly positive associations between the flexural index and plant height, thickness-diameter ratio and wall thickness, moisture content and fresh weights, as well as between bending strength and maximum bending force, shear strength and maximum shearing force, and flexural rigidity and cross-sectional moment of inertia, with significantly negative correlations observed between the flexural index and natural height, thickness-diameter ratio and external diameter, and moisture content and dry weights. The obtained results are consistent with the actual situation. However, the conclusions of this study indicate no significant correlation between plant height and spike thickness, spike length and spike thickness, as well as between spike thickness and spike weight, which is inconsistent with results reported in the literature [41,42]. Possible reasons for these discrepancies may include differences in the types and quantities of experimental materials, as well as variations in experimental environments. To gain a deeper understanding of the relationships between these traits, future research should focus on enhancing the joint evaluation and identification of different populations under various environmental conditions.

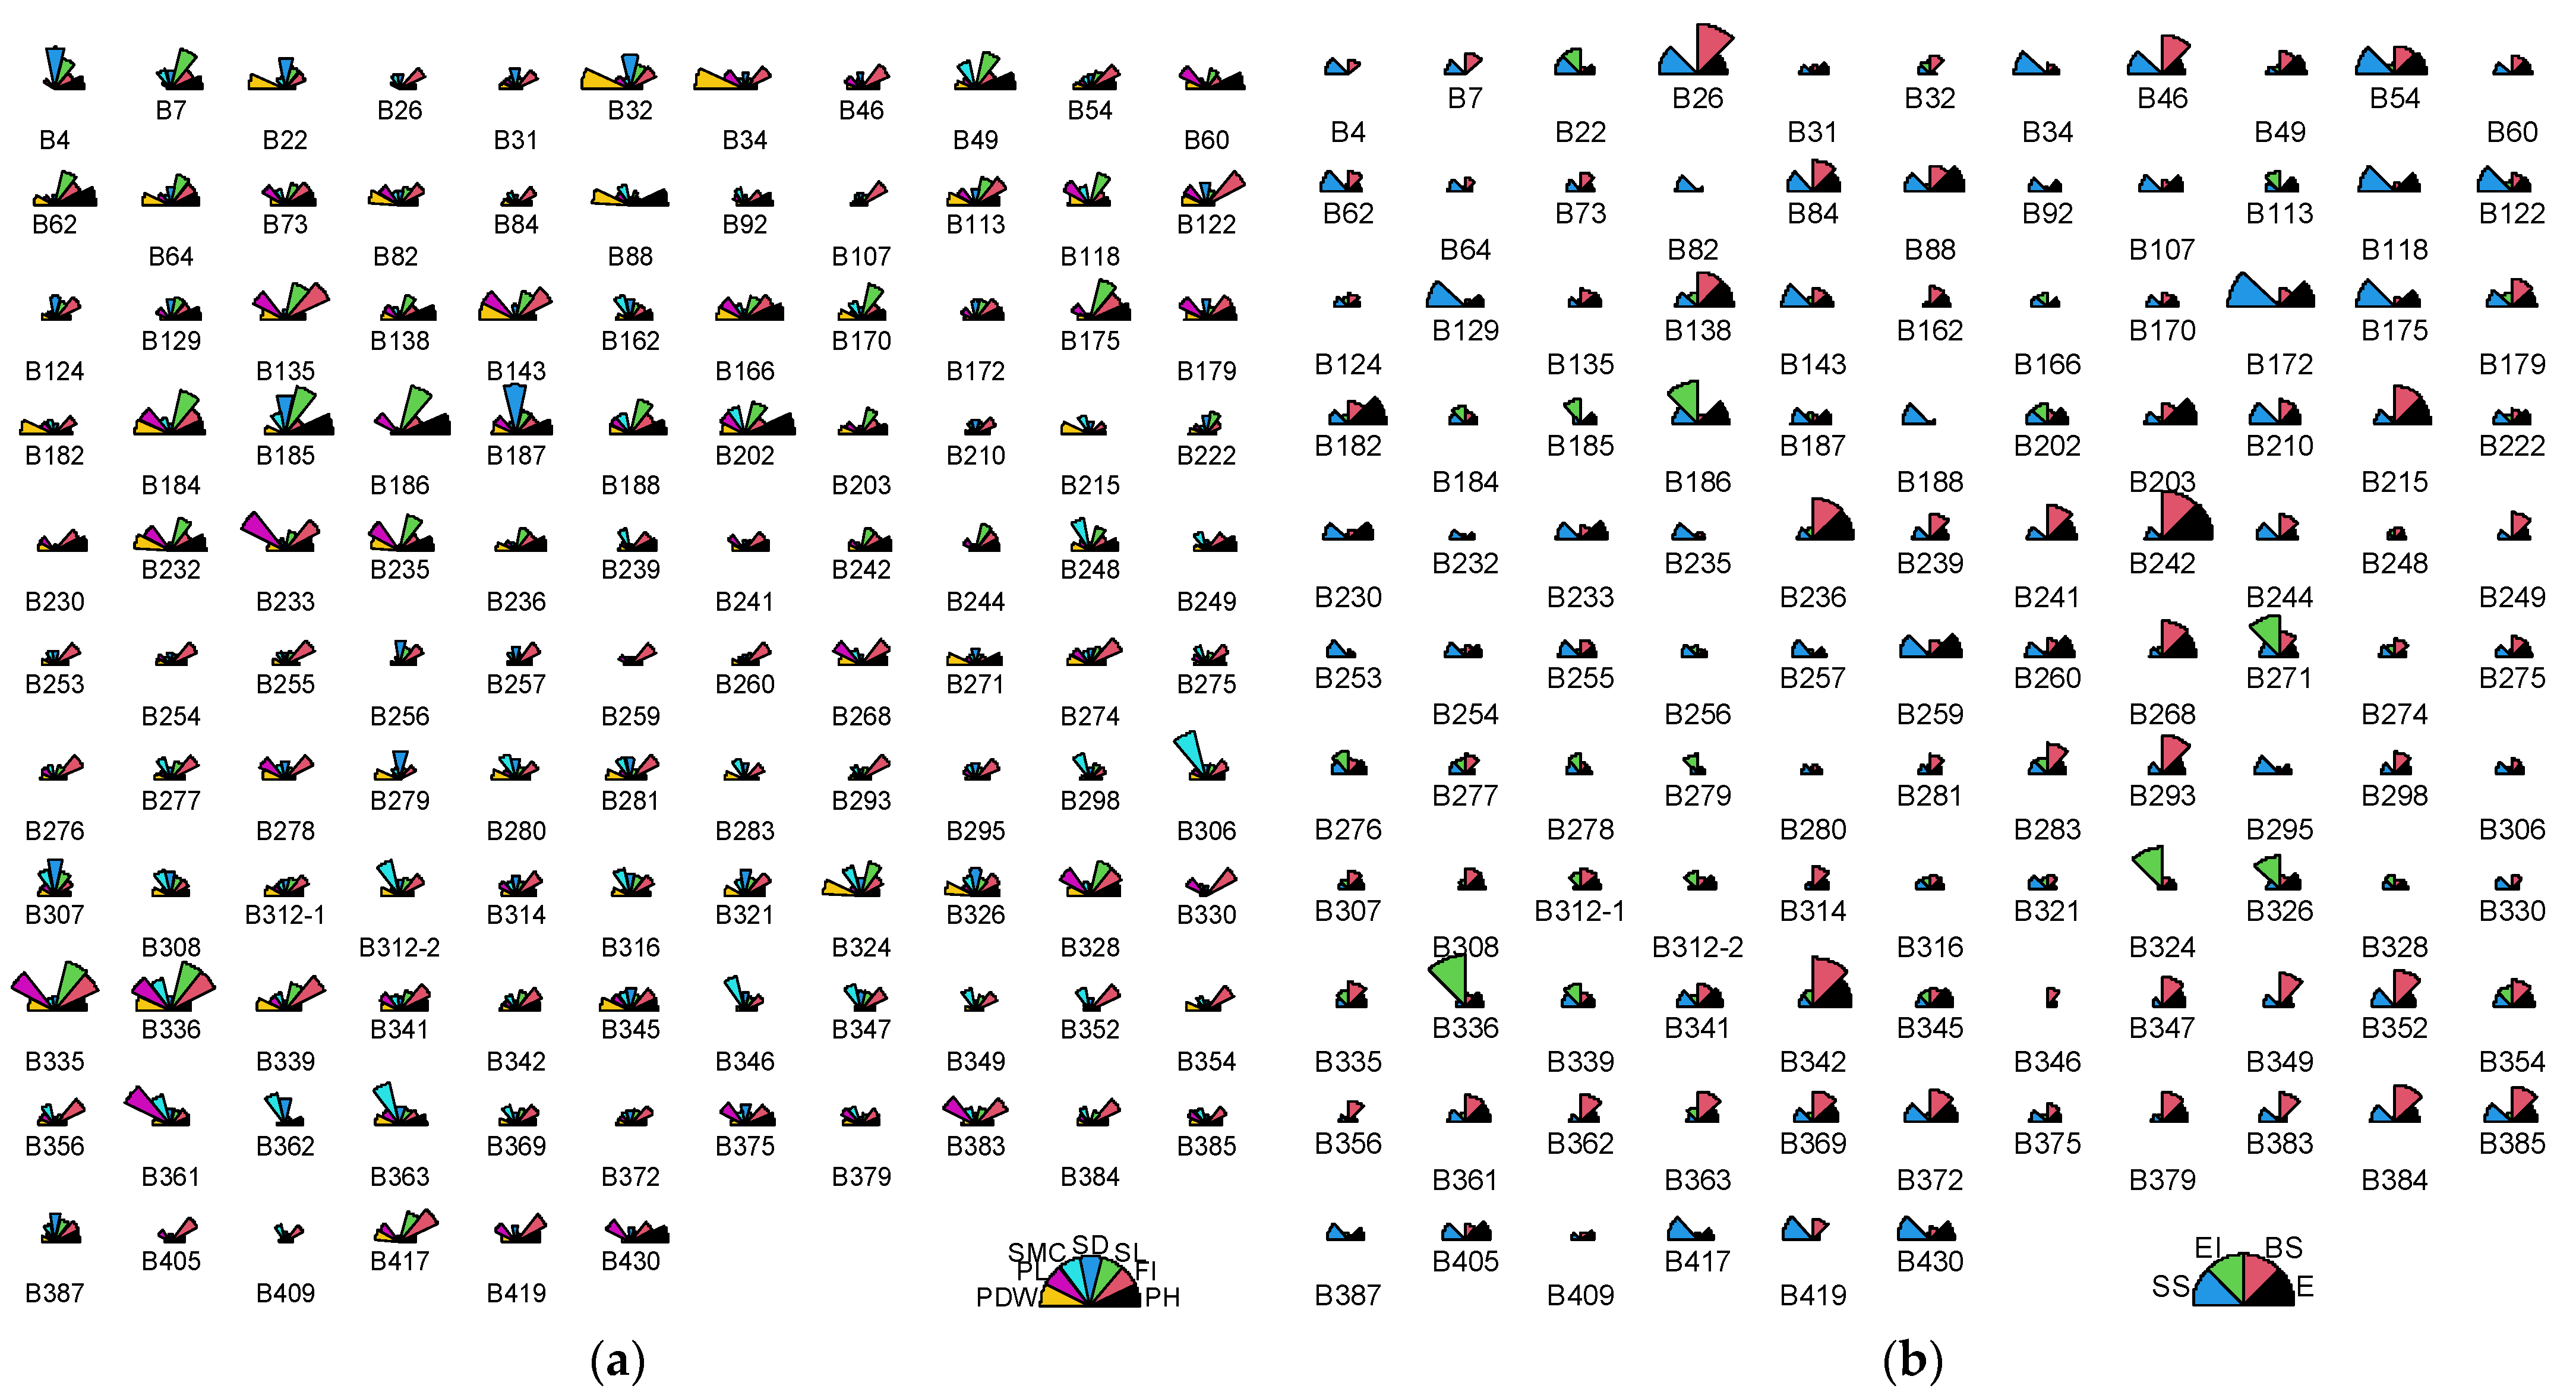
4.1.2. Cluster Analysis of the Indicators

R-type cluster analysis categorizes indicators into different groups based on their similarities, which helps to reveal the intrinsic relationships among the indicators. Compared to Principal Component Analysis (PCA) [43,44], the results of R-type cluster analysis are more explicit and can identify and eliminate highly correlated redundant indicators, thereby simplifying the dataset and making it easier to analyze and understand. Based on partial correlation coefficients, this study employed R-type cluster analysis to analyze the traits of foxtail millet. The fifteen morphological characteristic indicators were grouped into seven categories, and the seven biomechanical performance indicators were categorized into four groups, providing a basis for further screening of key indicators. Based on this, seven key morphological indicators (plant height, spike length, spike diameter, spike weight, peduncle length, peduncle external diameter, and peduncle moisture content) and four biomechanical indicators (elastic modulus, bending strength, flexural rigidity, and shear strength) were selected, providing data support for constructing an evaluation system for foxtail millet.

4.2. Assigning Weights for the Selected Indicators

In multi-index comprehensive evaluation, the impact of different indicators on the evaluation results is different, and it is necessary to assign weights to indicators reasonably. Entropy weighting is an objective weighting method that effectively reduces the impact of subjective judgments on evaluation results [35,45]. This study employed the entropy method to assign weights to the selected indicators, with the results indicating that the biomechanical properties of the peduncle have a relatively large weight, while the morphological indicators of the spike and peduncle have a smaller weight. This is consistent with the actual emphasis on high yield and stability characteristics of foxtail millet in production. It indicates that the weight setting in this study is reasonable, and a scientific and reasonable evaluation of the tested foxtail millet varieties can be conducted based on this. For the biomaterial mechanical properties of millet stalks, Guo et al. [30] employed the grey correlation method to assess the lodging resistance characteristics of stem crops. Their findings suggested that the elastic modulus, bending strength, and moment of inertia have approximately equivalent effects on lodging, whereas bending stiffness has a relatively minor influence. Contrarily, the results presented in this paper indicate that bending stiffness is the most significant factor among the four biomechanical indicators studied, which is inconsistent with the findings of Guo et al. This discrepancy may be due to differences in research methods, as well as variations in the parts and quantities of the experimental materials studied. Consequently, it is imperative to compare and evaluate different methods in future research to better understand these variations.

4.3. Comprehensive Evaluation of Participating Foxtail Millet Accessions

TOPSIS is a commonly used multi-attribute decision analysis method, with no strict requirements on data distribution or the number of indicators, and it is suitable for both small samples and large systems with multiple indicators [46,47,48]. The RSR method is a non-parametric statistical method used for the comprehensive evaluation of multiple indicators [28]. Combining TOPSIS with RSR exploits the advantages of both methods and improves the accuracy and reliability of evaluation results [49]. This study introduces a combination of the TOPSIS and Rank Sum Ratio (RSR) methods for comprehensive evaluation, successfully categorizing 116 foxtail millet accessions into four grades, with radar charts visually confirming the consistency between evaluation results and actual traits. This evaluation method provides a theoretical foundation for selecting foxtail millet varieties suitable for mechanical harvesting and paves the way for further genetic studies. This study focused on the biomechanical properties and related morphological characteristics of the peduncle in foxtail millet, but did not address the corresponding indicators of the stalk. Future research needs to be further refined to include assessment indices of the stalk, thereby conducting a more comprehensive variety evaluation.

5. Conclusions

This study focused on 116 millet materials and used partial correlation analysis and R-type cluster analysis to screen out four biomechanical and seven morphological indices of the peduncle from 22 indicators, laying the foundation for constructing an evaluation system for millet. Using the TOPSIS and RSR comprehensive evaluation methods, the materials were classified into four grades: excellent, good, moderate, and poor, providing theoretical support for selecting varieties suitable for mechanical harvesting and scientific guidance for designing foxtail millet harvesting machinery.

Author Contributions

Conceptualization, L.Z.; Data curation, L.Z.; Formal analysis, L.Z.; Funding acquisition, L.Z. and Q.C.; Investigation, Y.W., J.L., N.A. and Z.Z.; Methodology, L.Z., Z.L., Y.Z., H.L. and Q.C.; Project administration, L.Z. and Q.C.; Resources, G.X. and Y.H.; Software, L.Z., Y.Z. and Z.W.; Supervision, L.Z., Z.L., Y.H. and Q.C.; Validation, L.Z., Y.Z. and Z.W.; Visualization, L.Z.; Writing—original draft, L.Z.; Writing—review and editing, L.Z., Z.L., Y.H. and Q.C. All authors have read and agreed to the published version of the manuscript.

Funding

This research was funded by the National Key R&D Program of China, grant number 2016YFD0701801 and the Education Innovation Project of Shanxi Postgraduate, grant number 2019BY062.

Institutional Review Board Statement

Not applicable.

Data Availability Statement

The data presented in this study are available on request from the corresponding author. The data are not publicly available due to concerns that disclosure may adversely affect future research projects.

Acknowledgments

The authors express their gratitude to Xueyin Li and Jianhua Gao, from the College of Life Sciences, Shanxi Agricultural University, for their generous support of this study. The experimental materials provided by them have provided essential assistance to our research, allowing us to conduct the experiments smoothly and obtain valuable data. The authors would like to thank the editors and anonymous reviewers for their constructive comments and suggestions.

Conflicts of Interest

The authors declare no conflicts of interest.

References

  1. Li, S.G.; Liu, F.; Liu, M.; Cheng, R.H.; Xia, E.J.; Diao, X.M. Current status and future prospective of foxtail millet production and seed industry in China. Sci. Agric. Sin. 2021, 54, 459–470. [Google Scholar] [CrossRef]
  2. Sharma, N.; Niranjan, K. Foxtail millet: Properties, processing, health benefits, and uses. Food Rev. Int. 2018, 34, 329–363. [Google Scholar] [CrossRef]
  3. Jia, G.Q.; Diao, X.M. Current status and perspectives of innovation studies related to foxtail millet seed industry in China. Sci. Agric. Sin. 2022, 55, 653–665. [Google Scholar] [CrossRef]
  4. Yu, B.X.; Wang, H.; Yang, J.; Duan, H.; Wang, Y.Y.; Li, Z. Effects of Paclobutrazol and Ethephon on the Panicle Neck, Panicle Traits and Grain Filling of Foxtail Millet. J. Nuclear Agric. Sci. 2019, 33, 1199–1207. [Google Scholar] [CrossRef]
  5. Xu, H.F. Current status and development trends of mechanized production of foxtail millet. Agric. Technol. Eq. 2014, 17, 38–39. [Google Scholar]
  6. Yang, Z.J.; Liu, H.X.; Wu, H.Y.; Chen, J.Z. Developing direction of millet harvesting mechanization and the associated machines. J. Hebei Agric. Sci. 2013, 17, 6–8. [Google Scholar] [CrossRef]
  7. Yang, Y.; Lei, J.S.; Wang, J.; Wang, S. Development status and countermeasures of millet production mechanization in shanxi. Agric. Technol. Eq. 2017, 333, 61–63. [Google Scholar] [CrossRef]
  8. Yu, Z.J. Experimental and analytical study on the mechanization harvesting technology of foxtail millet. Farm. Mach. 2017, 60, 103–105. [Google Scholar] [CrossRef]
  9. Du, Y.W.; Zhao, J.F.; Wang, G.H.; Li, Y.F.; Zhao, G.Y.; Yan, X.G. Study of Lodging Resistance of Spring-Sowing Foxtail Millet in Maturity Stages. Crops 2019, 35, 141–145. [Google Scholar] [CrossRef]
  10. Xia, X.; Yang, Z.; Cheng, R.; Shi, Z.; Wu, H.; Liu, H.; Liu, M.; Zhao, Y.; Li, X.; Jiao, H.; et al. Technical Regulation of Foxtail Millet Production by Combining Machinery and Agronomy. Agric. Sci. Technol. 2016, 17, 1106–1109. [Google Scholar] [CrossRef]
  11. Zhang, N.; Li, H.B.; Zhang, Y.Q.; Cui, Q.L.; Sun, Q.F. Experimental Study on the Friction Characteristics of Millet Leaves at Harvest Time. J. Agric. Mech. Res. 2019, 41, 154–161. [Google Scholar] [CrossRef]
  12. Tian, B.H.; Luan, S.R.; Zhang, L.X.; Liu, Y.L.; Zhang, L.; Li, H.J. Penalties in yield and yield associated traits caused by stem lodging at different developmental stages in summer and spring foxtail millet cultivars. Field Crops Res. 2018, 217, 104–112. [Google Scholar] [CrossRef]
  13. Diao, X.M. Breeding innovation creates new development in millet seed industry. China Seed Ind. 2022, 325, 4–7. [Google Scholar] [CrossRef]
  14. Song, X.E.; Wang, H.; Dong, Q.; Qiu, T.; Shi, C.; Li, X.; Dong, S.; Zhao, J.; Guo, P.; Yuan, X.Y. Comprehensive Evaluation and Main Identification Indexes of Herbicide Resistance of High-Quality Foxtail Millet (Setaria italica L.). Agronomy 2023, 13, 3033. [Google Scholar] [CrossRef]
  15. Zhang, L.; Ma, K.; Zhao, X.; Li, Z.; Zhang, X.; Li, W.; Meng, R.; Lu, B.; Yuan, X.Y. Development of a comprehensive quality evaluation system for foxtail millet from different ecological regions. Foods 2023, 12, 2545. [Google Scholar] [CrossRef] [PubMed]
  16. Feng, G.J.; Hu, X.W.; Zhao, Y.; Yu, M.; Zhang, S.G.; Zhou, D.L. Research progress, problems and development prospect of foxtail millet industry in Xinjiang. Xinjiang Agric. Sci. 2023, 60, 1887–1893. [Google Scholar] [CrossRef]
  17. Zhang, N.; Wu, W.; Li, S.; Wang, Y.; Ma, Y.; Meng, X.; Zhang, Y. Comprehensive Evaluation of Paddy Quality by Different Drying Methods, Based on Gray Relational Analysis. Agriculture 2022, 12, 1857. [Google Scholar] [CrossRef]
  18. Zhou, H.; Dai, L.J.; Li, Y.P.; Huang, X.L.; Ma, Y.P. Grey Correlation Analysis and Evaluation of Main Agronomic Characters of 11 New Millet Cultivars. Gansu Agric. Sci. Technol. 2020, 12, 25–30. [Google Scholar] [CrossRef]
  19. Zhang, X.S.; Han, Y.L.; Fan, Y.Q.; Wang, Y.H.; Liu, J.Z.; Cao, H.; Zuo, H.J.; Miao, Z.F. Comprehensive Evaluation of Millet of Regional Test by Grey Relational Degree Analysis and DTOPSIS Method. Seed 2022, 41, 121–126+133. [Google Scholar] [CrossRef]
  20. Xing, G.F.; Hou, Y.; Wang, H.; Ren, C.; Ma, J.W.; Lu, C.D. Screening and Evaluation of Efficient Utilization of Selenium in Foxtail Millet at the Seedling Stage. J. Plant Genet. Resour. 2023, 24, 158–171. [Google Scholar] [CrossRef]
  21. Zhao, M.Q.; Wang, Z.J.; Bao, J.; Sun, L.; Zhang, Y.H.; Wen, R.; Jia, Y.S.; Ge, G.T. Analysis and evaluation of forage millet quality under different fertility and storage times using the membership function method. Pratacultural Sci. 2023, 40, 200–207. [Google Scholar] [CrossRef]
  22. Fan, Y.; Dong, S.Q.; Yuan, X.Y.; Yang, X.P.; Yao, X.; Guo, P.Y.; Yang, X.F. Comprehensive Evaluation of Foxtail Millet Germplasm Resources During germination Period and Drought Resistance Index Screening. J. China Agric. Univ. 2022, 27, 42–54. [Google Scholar] [CrossRef]
  23. Gao, Q.; Zhang, Y.; Lu, Z.F.; Yan, Q.; Li, K.K.; Chen, R.F.; Yang, Y.; Xu, L.; Zhou, W. Summer Millet Varieties for Planting in Kashgar of Xinjiang: Comprehensive Evaluation by DTOPSIS Method Based on Entropy Weight. Chin. Agric. Sci. Bull. 2024, 40, 42–47. [Google Scholar]
  24. Song, Z.Q.; Zhang, W.C.; Wang, S.; Zhang, Y.; Li, L.; Yang, Y.Y.; Liu, J.R. Comprehensive Evaluation of Foxtail Millet Test Varieties Based on the Integration of DTOPSIS Method and Fuzzy Evaluation Method with Entropy Weighting. Jiangsu Agric. Sci. 2023, 51, 49–54. [Google Scholar] [CrossRef]
  25. Song, H.; Guo, Y.; Xing, L.; Li, L.; Zang, H.Z.; Li, G.Q.; Wang, S.Y.; Zheng, G.Q. Comprehensive evaluation of foxtail millet varieties based on grey correlation degree, DTOPSIS and situational decision-making method. J. China Agric. Univ. 2023, 28, 42–56. [Google Scholar] [CrossRef]
  26. Tian, F.T. The Method of Ranks and Their Applications; China Statistics Press: Beijing, China, 1993. [Google Scholar]
  27. Fu, X.Q.; Chen, H.Y. Comprehensive power quality evaluation based on weighted rank sum ration method. Elect. Power Auto Equip. 2015, 35, 128–132. [Google Scholar] [CrossRef]
  28. Wang, Z.; Dang, S.; Xing, Y.; Li, Q.; Yan, H. Applying rank sum ratio (RSR) to the evaluation of feeding practices behaviors, and its associations with infant health risk in Rural Lhasa, Tibet. Int. J. Environ. Res. Public Health 2015, 12, 15173–15181. [Google Scholar] [CrossRef]
  29. Yuan, Z.H.; Feng, B.P.; Zhao, A.Q.; Liang, A.Q. Dynamic Analysis and Comprehensive Evaluation of Crop-Stem Lodging Resistance. Trans. CSAE 2002, 18, 30–31. [Google Scholar]
  30. Guo, Y.M.; Yuan, H.M.; Yin, Y.; Liang, L.; Li, H.B. Biomechanical evaluation and grey relational analysis of lodging resistance of stalk crops. Trans. CSAE 2007, 23, 14–18. [Google Scholar]
  31. Gao, M.; Xu, Y.; Qu, X.C.; Ma, Y.M.; Gao, Z.; Zhou, B.H.; Zhang, W.L. Identification and Evaluation on Lodging Resistance of Millet Varieties (Lines). J. Northeast Agric. Sci. 2024, 49, 50–53. [Google Scholar] [CrossRef]
  32. Jia, X.P.; Dong, P.H.; Zhang, H.X.; Kong, X.S. Analysis of growth and development characteristics and lodging resistance of different foxtail millet Cultivars (Strains). J. Henan Agric. Sci. 2015, 44, 27–31. [Google Scholar] [CrossRef]
  33. Liang, L.; Guo, Y.M. Correlation study of biomechanical properties and morphological characteristics of crop stalks. Trans. CSAE 2008, 24, 1–6. [Google Scholar]
  34. Zhang, Y.Q. Experimental Study on Cutting Mechanical Properties of Coarse Cereals Stem Related to Mechanical Harvest. Ph.D. Thesis, Shanxi Agricultural University, Taigu, China, 2019. [Google Scholar] [CrossRef]
  35. Zhu, X.; Wei, G. A Discussion on the Evaluation Criteria of Dimensionless Methods in Entropy Value Method. Stat. Decis. 2015, 422, 12–15. [Google Scholar] [CrossRef]
  36. Yan, L.K. Application of Correlation Coefficient and Biased Correlation Coefficient in Related Analysis. J. Yunnan Univ. Fin. Econ. 2003, 19, 78–80. [Google Scholar] [CrossRef]
  37. Xue, Y.; Chen, L.P. Statistical Modeling and R Software, 1st ed.; Tsinghua University Press: Beijing, China, 2007; pp. 397–420. [Google Scholar]
  38. Peng, W.; Li, Y.; Fang, Y.; Wu, Y.; Li, Q. Radar chart for estimation performance evaluation. IEEE Access 2019, 7, 113880–113888. [Google Scholar] [CrossRef]
  39. Kaczynski, D.; Wood, L.; Harding, A. Using radar charts with qualitative evaluation: Techniques to assess change in blended learning. Act. Learn. Higher Educ. 2008, 9, 23–41. [Google Scholar] [CrossRef]
  40. Nikitina, M.A.; Chernukha, I.M. Nonparametric statistics. Part 3. Correlation coefficients. Theory Pract. Meat Process. 2023, 8, 237–251. [Google Scholar] [CrossRef]
  41. He, M.L.; Wang, Z.L.; Du, X.F.; Han, K.N.; Lian, S.C.; Li, Y.X.; Cheng, K.; Li, Y.F.; Wang, J. Analysis of Plant Architecture and Yield Traits of Recombination Inbred Lines in Foxtail Millet. Acta Agric. Boreali-Sin. 2023, 38, 91–100. [Google Scholar] [CrossRef]
  42. Liu, S.C.; Cao, X.N.; Wen, Q.F.; Wang, H.G.; Tian, X.; Wang, J.J.; Chen, L.; Qin, H.B.; Wang, L.; Qiao, Z.J. Comprehensive Evaluation of Agronomic Traits and Quality Traits of Foxtail Millet Landrace in Shanxi. Sci. Agric. Sin. 2020, 53, 2137–2148. [Google Scholar] [CrossRef]
  43. Zhao, Q. A Review of Principal Component Analysis. Softw. Eng. 2016, 19, 1–3. [Google Scholar]
  44. Lin, H.M.; Du, Z.F. Some Problems in Comprehensive Evaluation in the Principal Component Analysis. Stat. Res. 2013, 30, 25–31. [Google Scholar] [CrossRef]
  45. Chen, H. Entropy method and application to determine weights of combination forecasting. J. Anhui Univ. Nat. Sci. 2003, 27, 1–4. [Google Scholar]
  46. Li, X.M. A Review of Multi-Index Comprehensive Evaluation Methods. Stat. Manag. 2022, 37, 45–48. [Google Scholar] [CrossRef]
  47. Çelikbilek, Y.; Tüysüz, F. An in-depth review of theory of the TOPSIS method: An experimental analysis. J. Manag. Anal. 2020, 7, 281–300. [Google Scholar] [CrossRef]
  48. Chakraborty, S. TOPSIS and Modified TOPSIS: A comparative analysis. Decis. Anal. J. 2022, 2, 100021. [Google Scholar] [CrossRef]
  49. Chen, F.; Wang, J.; Deng, Y. Road safety risk evaluation by means of improved entropy TOPSIS–RSR. Saf. Sci. 2015, 79, 39–54. [Google Scholar] [CrossRef]
Figure 1. The field sampling site and test samples: (a) The field sampling site; (b) Samples of foxtail millet plants used for measuring plant height; (c) Samples of stem and peduncle in foxtail millet; (d) Samples of spike in foxtail millet.
Agriculture 14 01437 g001
Figure 2. Tests for the biomechanical properties of the peduncle in foxtail millet: (a) Physical diagram of the bending test; (b) Schematic diagram of the bending test; (c) Physical diagram of the shear test; (d) Schematic diagram of the shear test. Component 1 is a sensor, Component 2 is the clamp for the bending test, Component 3 is the peduncle, Component 4 is the base, and Component 5 is the clamp for the shear test.
Agriculture 14 01437 g002
Figure 3. Load-displacement curves for the bending and shear tests of the peduncle in foxtail millet: (a) Load-displacement curves for the bending test; (b) Load-displacement curves for the shear test.
Agriculture 14 01437 g003
Figure 4. Heatmap and hierarchical clustering diagram of the partial correlation coefficients for the 15 morphological characteristics in 116 foxtail millet accessions. The variables on the axes are abbreviations of each indicator. (a) Partial correlation and matrix heatmap; (b) Partial correlation plot highlighting significant correlations with rectangles and indicating the hierarchical clustering order.
Agriculture 14 01437 g004
Figure 5. Heatmap and hierarchical clustering diagram of the partial correlation coefficients for the seven biomechanical properties in 116 foxtail millet accessions. The variables on the axes are abbreviations of each indicator. (a) Partial correlation and matrix heatmap; (b) Partial correlation plot highlighting significant correlations with rectangles and indicating the hierarchical clustering order.
Agriculture 14 01437 g005
Figure 6. Radar chart for seven morphological characteristics of the plant and four biomechanical properties of the peduncle in 116 foxtail millet accessions. (a) Radar chart for seven morphological characteristics; (b) Radar chart for four biomechanical properties.
Agriculture 14 01437 g006
Table 1. Descriptive statistics of morphological characteristics and biomechanical properties for 116 foxtail millet accessions.
DimensionTrait 1MinMaxMeanSDCV (%)
Biological Morphological CharacteristicsPlantPlant Height/PH (cm)84.94202.50136.4423.3517.11
Natural Height/NH (cm)59.64155.32102.1819.2918.88
Flexural Index/FI (%)9.2838.9625.204.4217.54
SpikeLength/SL (mm)141.36327.24213.4441.8519.61
Diameter/SD (mm)16.3045.4024.804.9219.84
Weight/SW (g)5.2846.0921.517.4434.59
Dry Weight/SDW (g)3.7535.5915.995.4634.15
Moisture Content/SMC (%)13.1450.4325.146.5225.93
PeduncleLength/PL (cm)19.2867.4935.599.7127.28
External Diameter/PED (mm)2.044.833.280.5717.38
Wall Thickness/PWT (mm)0.421.250.770.1722.08
Thickness-diameter Ratio/PTDR (%)0.170.360.230.0313.04
Weight/PW (g)0.5713.705.692.7147.63
Dry Weight/PDW (g)0.245.001.970.8844.67
Moisture Content/PMC (%)45.7872.6664.613.966.13
Biomechanical Properties BendingCross-Sectional Moment of Inertia/I (mm4)0.9031.227.355.8179.05
Elastic Modulus/E (MPa)668.785698.662523.35890.3735.29
Bending Strength/BS (MPa)13.7047.3226.237.2127.49
Flexural Rigidity/EI (N·mm2)2817.7972,497.1116,165.4912,437.2376.94
Maximum Bending Force/Fb (N)2.9928.99.104.1946.04
ShearingShear Strength/SS (MPa)5.3830.8114.884.2528.56
Maximum Shearing Force/Fs (N)15.38204.2888.6735.840.37
1 The abbreviations for each trait are provided after their name, separated by a slash.
Table 2. Weights of 11 evaluation indicators for 116 foxtail millet accessions.
IndicatorEntropy ValueInformation Utility ValueWeight (%)
Flexural Rigidity0.9270.07322.386
Bending Strength0.9640.03611.037
Spike Length0.9640.03610.870
Peduncle Length0.9650.03510.834
Spike Diameter0.9670.0339.952
Elastic Modulus0.9750.0257.615
Diameter of the Peduncle 0.9750.0257.578
Spike Weight0.9780.0226.761
Shear Strength0.9790.0216.360
Plant Height0.9840.0164.795
Moisture Content of the Peduncle0.9940.0061.812
Table 3. Calculation results of the TOPSIS and RSR methods.
VarietyNamePISD (D+)NISD (D)Composite ScoreSortingRSRProbitFitted RSRThreshold *Grading
B336Longgu60.4920.7330.59811.000 7.8551.160>6.54
B324Jigu110.5020.6500.56420.963 7.3821.044
B186Rangu0.5560.6580.54230.937 7.1140.979
B271Fenggu120.5150.5760.52840.918 6.9450.937
B326Jigu130.5100.5500.51950.904 6.8190.906
B185Xiaohuanggu0.5740.6180.51860.898 6.7160.881
B022Damaomaogu0.5230.5520.51370.888 6.6280.860
B032Jiangu0.5800.5480.48680.856 6.5520.841
B335Longgu50.5800.5330.47990.845 6.4840.8245~6.53
B342Gonggu680.5880.5160.467100.828 6.4210.809
B307Yugu110.5950.5140.464110.819 6.3640.795
B279Jigu240.6390.5180.448120.799 6.3120.782
B187Zhouliwei0.6220.5030.447130.793 6.2620.770
B339Longgu90.5950.4670.440140.781 6.2160.758
B054Xiaozigen0.5970.4610.436150.771 6.1720.747
B184Huangjiugenqi0.6320.4770.430160.760 6.1300.737
B138Tie83960.6110.4530.426170.751 6.0900.727
B242Zhongmou-baogu0.7010.5160.424180.743 6.0510.718
B172Bachagu0.6380.4690.424190.738 6.0140.709
B179Huangdanzigu0.5990.4300.418200.727 5.9790.700
B345Chaogu130.6060.4310.416210.719 5.9450.692
B2360.6530.4640.416220.713 5.9110.684
B308Yugu90.6400.4360.405230.698 5.8790.676
B277Jigu210.6320.4300.405240.693 5.8480.668
B363Chenggu 120.6150.4160.403250.685 5.8170.660
B278Jigu220.6390.4310.403260.679 5.7870.653
B283K3250.6450.4310.401270.672 5.7580.646
B007Hongniangu0.6900.4550.398280.663 5.7300.639
B222Gouweisu0.6340.4180.397290.658 5.7020.632
B143Hongniangu0.6300.4150.397300.652 5.6740.625
B372Gonggu660.6400.4210.397310.646 5.6480.619
B274Jigu180.6390.4180.396320.639 5.6210.612
B113Xiaohonggu0.6390.4180.396330.634 5.5950.606
B122Xiaohonggu0.6480.4240.395340.628 5.5700.600
B026Jingu50.7510.4890.395350.622 5.5440.593
B312-1Yugu70.6280.4060.392360.614 5.5190.587
B202Jinshu0.6480.4170.392370.608 5.4950.581
B256Maosu0.6610.4250.391380.602 5.4710.575
B004Caopi-daobaqi0.7050.4490.389390.594 5.4470.569
B312-2Yugu70.6380.4050.388400.588 5.4230.564
B049Jiugu130.6690.4230.387410.581 5.3990.558
B276Jigu200.6520.4090.386420.574 5.3760.552
B385Baigu90.6630.4150.385430.568 5.3530.546
B354Jigu280.6450.4000.383440.561 5.3300.541
B316Ji076070.6410.3960.382450.554 5.3070.535
B328Honggaigu0.6640.4060.380460.546 5.2850.530
B369Gonggu610.6490.3970.379470.541 5.2620.524
B321Lugu80.6520.3980.379480.535 5.2400.519
B215Zheng4480.7050.4260.377490.527 5.2180.513
B124Daqingjie0.6590.3980.376500.521 5.1960.508
B341Gonggu650.6410.3860.376510.515 5.1740.503
B268Chigu80.6920.4130.374520.508 5.1520.497
B13578-06250.6780.4040.373530.502 5.1300.492
B361Cang1560.6540.3840.370540.493 5.1080.486
B384Baigu70.6960.4070.369550.486 5.0870.481
B175Guang370.7260.4220.368560.480 5.0650.476
B046Maotigu0.7240.4140.364570.470 5.0430.470
B182Heguzi0.6870.3900.362580.463 5.0220.465
B170Maomaogu0.6930.3870.358590.454 5.0000.4603.5~52
B203Xiaolibaibuyuxi0.6850.3800.357600.448 4.9780.455
B387Chaogu150.6910.3820.356610.441 4.9570.449
B062Huangniangu0.6960.3840.356620.435 4.9350.444
B255Huangsu0.6830.3770.356630.430 4.9130.439
B293Nei7010.7270.3960.353640.421 4.8920.433
B383Baigu60.6970.3770.351650.414 4.8700.428
B347Jigu250.7230.3910.351660.408 4.8480.423
B379Gonggu740.6960.3750.350670.402 4.8260.417
B06460tianhuangtang0.7060.3790.349680.396 4.8040.412
B0880.7010.3730.347690.388 4.7820.406
B031Baiyousha0.7040.3720.346700.382 4.7600.401
B281Jigu290.6980.3620.342710.372 4.7380.396
B241Damaosui0.7300.3760.340720.365 4.7150.390
B349Fenggu10.7320.3740.338730.358 4.6930.384
B314Yugu140.6910.3520.337740.351 4.6700.379
B259Datounuo0.7300.3710.337750.345 4.6470.373
B235Yangmaonuo0.7390.3730.336760.339 4.6240.368
B162Leshanbainuo0.6970.3510.335770.332 4.6010.362
B352Jingu10.7610.3830.335780.327 4.5770.356
B210Nianxiaomi0.7230.3640.335790.321 4.5530.350
B280Jigu260.7200.3620.335800.316 4.5290.344
B118Xiaohonggu0.7640.3820.333810.309 4.5050.338
B257Zhimasu0.7220.3570.331820.301 4.4810.332
B260Huangnanuo0.7200.3550.330830.295 4.4560.326
B129Guzi0.7260.3560.329840.288 4.4300.320
B417Jingu390.7370.3610.329850.282 4.4050.314
B166Chaqinggu0.7120.3450.326860.275 4.3790.307
B3620.7480.3600.325870.268 4.3520.301
B375Gonggu700.6930.3340.325880.262 4.3260.294
B248longzhaonuo0.7110.3410.324890.256 4.2980.288
B275Jigu380.7170.3410.323900.249 4.2700.281
B084Ise-4550.7660.3610.320910.241 4.2420.274
B034Esiniugu0.7420.3480.319920.235 4.2130.267
B3562060580.7490.3430.314930.224 4.1830.259
B254Nuosu0.7230.3270.311940.216 4.1520.252
B306An06h-80230.7190.3240.311950.210 4.1210.244
B107Jinxiangyu0.7570.3400.310960.204 4.0890.236
B233Geqing10.7340.3240.306970.194 4.0550.228
B244Jizhaohuanggu0.7800.3400.303980.186 4.0210.220
B188Bailiaojiang0.8010.3480.303990.180 3.9860.211
B29509dong-chuang1400.7490.3250.3031000.174 3.9490.202
B232Guang370.7740.3350.3021010.168 3.9100.192
B430Changnong350.7360.3180.3021020.163 3.8700.183
B29803-9920.7560.3260.3011030.157 3.8280.172
B082Zhaohenuo0.7750.3330.3011040.150 3.7840.162
B419Changnong350.7650.3130.2901050.135 3.7380.150
B249Wuzhaonuoxiaogu0.7650.3110.2891060.129 3.6880.138
B253Xiannuo0.7820.3140.2871070.121 3.6360.125
B073Qianchuanzi0.7540.2970.2821080.111 3.5790.111
B346Jixiang10.7990.3070.2781090.101 3.5160.096
B330Jinsuigu10.8310.3130.2741100.092 3.4480.079<3.51
B405200108-20.8000.2890.2651110.079 3.3720.060
B239Jingu350.8110.2840.2591120.067 3.2840.039
B060Qinggu0.8040.2800.2581130.061 3.1810.014
B230Honggu0.8100.2610.2431140.042 3.055−0.018
B409Jiugu130.8570.2480.2251150.019 2.886−0.059
B092Zhushanuo0.8330.2350.2201160.009 2.618−0.125
* The threshold is determined by the Probit critical value.
Table 4. Results of linear regression analysis.
Independent VariableNon-Standardized CoefficientStandardized Coefficientt-Valuep-ValueVIFR2Adjusted R2F
CoefficientStandard Error
Intercept−0.7670.016-−48.8440.000 ***-0.9830.982F = 6405.277 p = 0.000 ***
Probit0.2450.0030.99180.0330.000 ***1
*** indicates a significance level of 0.01.
Table 5. Analysis of variance of the fitted RSRs for different grades.
SourceSum of SquaresDegrees of FreedomMean SquareF-Statisticp-Value (Significance)
Between-group5.80131.934191.3540.000 ***
Within-group1.1321120.01
Total 6.933115
*** indicates a significance level of 0.01.
Table 6. Descriptive statistical analysis of the fitted RSRs within different grades.
VariableGrading NumberMeanSDMinMax
Fitted RSR480.951 0.108 0.841 1.160
3500.615 0.101 0.465 0.824
2510.308 0.102 0.096 0.460
17−0.001 0.072 −0.125 0.079
Disclaimer/Publisher’s Note: The statements, opinions and data contained in all publications are solely those of the individual author(s) and contributor(s) and not of MDPI and/or the editor(s). MDPI and/or the editor(s) disclaim responsibility for any injury to people or property resulting from any ideas, methods, instructions or products referred to in the content.

