Article

Spatiotemporal Dynamics and Evolution of Grain Cropping Patterns in Northeast China: Insights from Remote Sensing and Spatial Overlay Analysis

1
School of Public Administration and Law, Northeast Agricultural University, Harbin 150030, China
2
Ministry of Education Key Laboratory for Biodiversity Science and Ecological Engineering, National Observations and Research Station for Wetland Ecosystems of the Yangtze Estuary, School of Life Sciences, Fudan University, 2005 Songhu Road, Shanghai 200438, China
*
Author to whom correspondence should be addressed.
These authors contributed equally to this work.
Agriculture 2024, 14(9), 1443; https://doi.org/10.3390/agriculture14091443
Submission received: 24 July 2024 / Revised: 20 August 2024 / Accepted: 22 August 2024 / Published: 24 August 2024

Abstract

:
Understanding the spatiotemporal patterns and driving mechanisms of cropping patterns’ evolution tailored to local conditions is crucial for the effective allocation of black soil in northeast China and the advancement of agricultural development. This study utilized the Google Earth Engine platform to extract the spatial distribution data of major grain crops in northeast China for the year 2022. Using crop classification data from 2000 to 2022, the spatial overlay analysis method identified cropping pattern types based on spatial and temporal changes. The primary cropping patterns identified were continuous maize cropping, maize–soybean rotation, mixed cropping, and continuous soybean cropping. Simultaneously, this research constructed three distinct crop periods: Period I (2000–2002), Period II (2010–2012), and Period III (2020–2022). Over three periods, these patterns covered 94.73%, 88.76%, and 86.39% of the area, respectively. The evolution of the dominant cropping pattern from Period I to Period II involved the transition from continuous soybean cropping to continuous maize cropping, while from Period II to Period III, the main shift was from continuous maize cropping to maize–soybean mixed cropping. From a spatial perspective, since Period I, maize has increasingly replaced soybean as the dominant crop, with continuous maize cropping expanding northward and continuous soybean cropping contracting. The maize–soybean rotation area also migrated northward, particularly in the core area of the Songnen Plain, evolving mostly into continuous maize cropping. Maize cropping areas exhibited significant regional characteristics, being densely distributed in the Sanjiang Plain and Liaohe Plain, and along major tributaries in northeast China. Consequently, the interplay of the natural environment, economic policies, and agricultural technologies drove these changes. The findings offer valuable insights for optimizing cropping patterns and developing rotation systems in northeast China.

1. Introduction

Black soil is renowned globally for its high fertility, earning the nickname the “Panda of Arable Land” due to its scarcity. In the Northern Hemisphere, northeast China had a concentrated distribution of 18.53 million hectares of black soil [1]. This region accounts for one-quarter of China’s total grain production, serving as a stabilizer and “ballast” for national food security. However, the black soil resources in northeast China are under significant threat due to a combination of factors, including global warming, changes in water and heat resources, intensified natural disasters, high-intensity land use, and imbalanced planting structures driven by socioeconomic development [2,3,4,5]. These threats are causing a reduction in the soil’s fertility and organic matter content [6,7].
The cropping pattern refers to a standardized cultivation form used on the same plot of land within a specific region, under the given natural resources and socioeconomic conditions, aimed at achieving high crop yields, efficiency, and sustainable utilization [8]. This pattern involves a particular crop structure and spatiotemporal arrangement across years, mainly including continuous cropping and crop rotation [9]. Consequently, adjusting grain cropping patterns would hold profound significance for restoring the soil’s fertility, optimizing the agricultural structure and layout, and protecting the black soil resources [10]. In essence, crop rotation patterns dominated by maize–soybean rotations are more beneficial compared with traditional continuous monoculture cropping in improving the physical and chemical properties of arable soil and reducing the impact of pests and diseases [11,12,13]. Therefore, within a few decades, the Chinese government has successively introduced several policies, including adjustments to the planting structure, fallow rotations, and black soil protection policies [10,14,15]. These policies have led to the development of exemplary cropping patterns, including the “one main and four auxiliaries” [16], “three-zone rotation” [17], and the “Lishu model” [18].
Moreover, identifying the types and evolutionary trends of cropping patterns in northeast China remains of paramount importance for optimizing crop rotation models and achieving the sustainable use of black soil.
Cropping patterns are complex and diverse, requiring remote sensing data and monitoring techniques to analyze their spatial layout. For instance, Qiu [19] utilized MODIS imagery combined with a phenological mapping algorithm and pixel purity thresholds to provide information on planting intensity and identify cropping patterns. This process led to the classification of cropping patterns in China, including corn, rice, and wheat, between 2015 and 2021. Additionally, Martínez-Casasnovas [20] utilized the maximum likelihood classification method to delineate cropping patterns across extended temporal spans, specifically during the spring and summer seasons. Similarly, to investigate the changes in cropping patterns in the Bardhaman region of West Bengal, India, Panigrahy [21] utilized multi-temporal remote sensing images obtained from the LISS-I sensor of the Indian IRS series satellites. Subsequently, they combined these images with field survey data and used the maximum likelihood method for supervised classification. Consequently, they generated a distribution map of the cropping patterns in the region and analyzed the crop planting status across different seasons and years.
In terms of identifying cropping patterns using a vegetation index, Gan [22] and Zheng [23], with Sentinel-1/2 data, used the two-band enhanced vegetation index (EVI2) and the annual normalized difference vegetation index (NDVI) to determine the crop planting intensity and monitor phenological phases, thereby extracting the patterns of rice cropping in Jiangxi Province and Hebei Plain. Notably, they found a substantial transition from double-cropping rice to single-cropping rice. By composing an optimal temporal feature combination based on the key time nodes of crops, they created a large-scale field-level classification map of single and double cropping patterns. Furthermore, Fida Ullah [24] combined Landsat images from 1990 to 2018 to calculate the NDVI index and extracted the phenological characteristics of four crops: sugarcane, rice, wheat, and potatoes. By overlaying the phenological profiles of NDVI images with crop survey data, they successfully identified different cropping patterns. Currently, research on cropping patterns predominantly focuses on their identification via remote sensing and spatial configuration, with limited investigations into the evolution of these patterns.
In contrast, the field of research into land use change has developed advanced methodologies for analyzing the evolution of land types, which can provide valuable insights for studying the evolution of cropping patterns. For example, Du et al. [25,26], leveraging the theory and methods of geoinformatics, constructed cropping pattern maps and utilized a land use transition matrix to measure the spatiotemporal evolution characteristics of cropping patterns in typical counties within the black soil region of northeast China. In a similar vein, Yang [27] used geoinformatics theory to extract the typical cropping patterns in northeast China and applied geographical detectors to elucidate the driving mechanisms behind the spatial heterogeneity of these patterns. Given that crop planting constitutes the most direct form of cultivated land use, characterized by a unique relationship between crops and agricultural fields [28], the spatiotemporal variation in crop patterns during the production cycle can, to some extent, reflect the characteristics of the transformation of cultivated land use. Cropping patterns, being the temporal and spatial configurations of different crops [29], therefore, lend themselves to the application of theories and methodologies of land use change to evaluate their spatial and temporal dynamics.
This investigation focused on northeast China, utilizing the advanced Google Earth Engine platform. A multi-feature random forest classification method was used to extract and analyze data on the distribution of major grain crops in 2022. The study also integrated the spatial overlay analysis method with existing crop classification data to conduct spatial overlay and statistical categorization for the periods 2000–2002, 2010–2012, and 2020–2022. This approach identified the primary types of cropping patterns and assessed the land use dynamics using a transition matrix to quantify the spatiotemporal evolution of cropping patterns. The aim was to provide a solid foundation for refining planting structures and developing adaptive crop rotation systems, particularly for black soil regions.

2. Materials and Methods
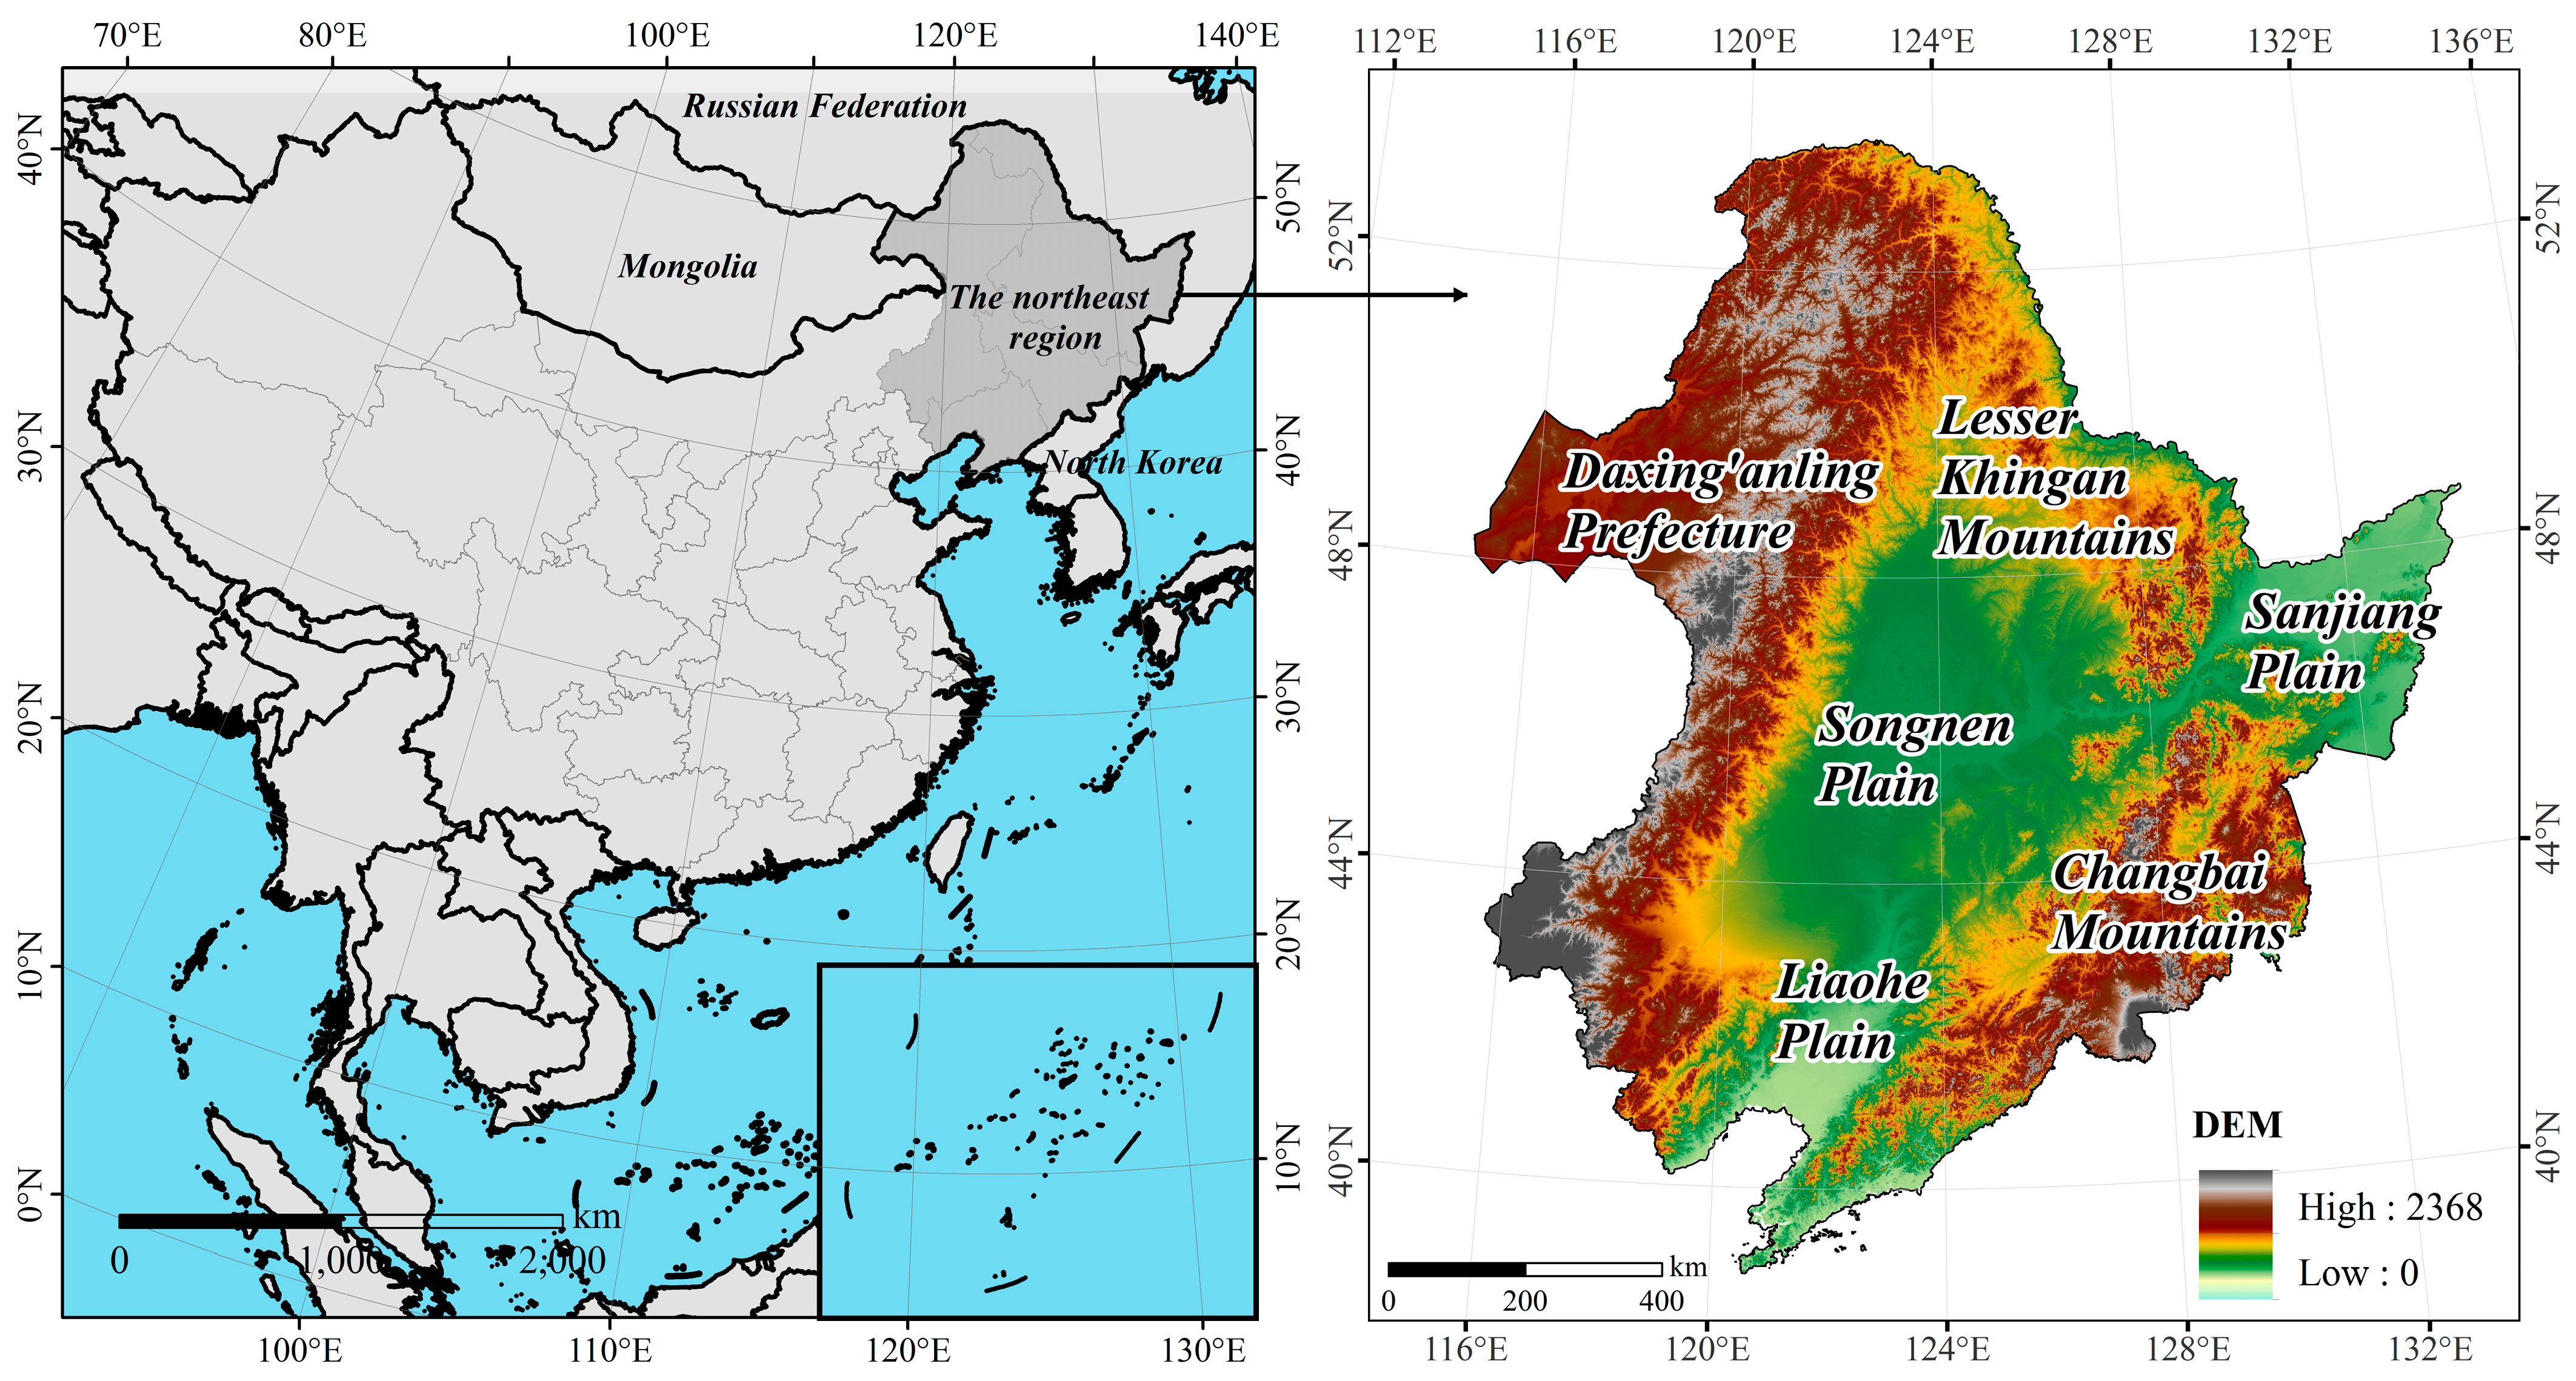
2.1. Study Area

Northeast China, located at 38°43′–53°33′N and 115°53′–135°5′ E, is a rich black soil region in the Northern Hemisphere. It covers Heilongjiang, Jilin, and Liaoning provinces, as well as parts of Inner Mongolia, including Chifeng, Tongliao, Hulunbuir, and Xing’an League. This area spans 1.09 million km2, accounting for 12% of the global black soil area [1]. The region, characterized by mountainous terrain to the east, west, and north, features undulating hills, gentle slopes, and low-lying plains, with elevations from sea level to 2368 m (Figure 1). It experiences a temperate continental monsoon climate with distinct seasons: warm, humid summers and cold, dry winters. The mean annual temperature is around 3 °C, with the accumulated temperature units ranging between 1500 and 3800 °C [30]. Rainfall, mainly occurring from July to September, ranges from 300 to 1000 mm annually, transitioning from semi-arid to semi-humid regions from west to east [31]. The region is renowned for its rich black soil resources, with 18.533 million hectares of prime arable land [1]. The dominant soil types include black soil, dark brown soil, brown soil, black calcareous soil, chernozem, and meadow soil [32]. The main crops are maize, soybeans, and rice. Since 2000, northeast China has contributed 50.71% of the national increase in grain production [33], cementing its role as a key strategic and commercial grain production hub for the country.

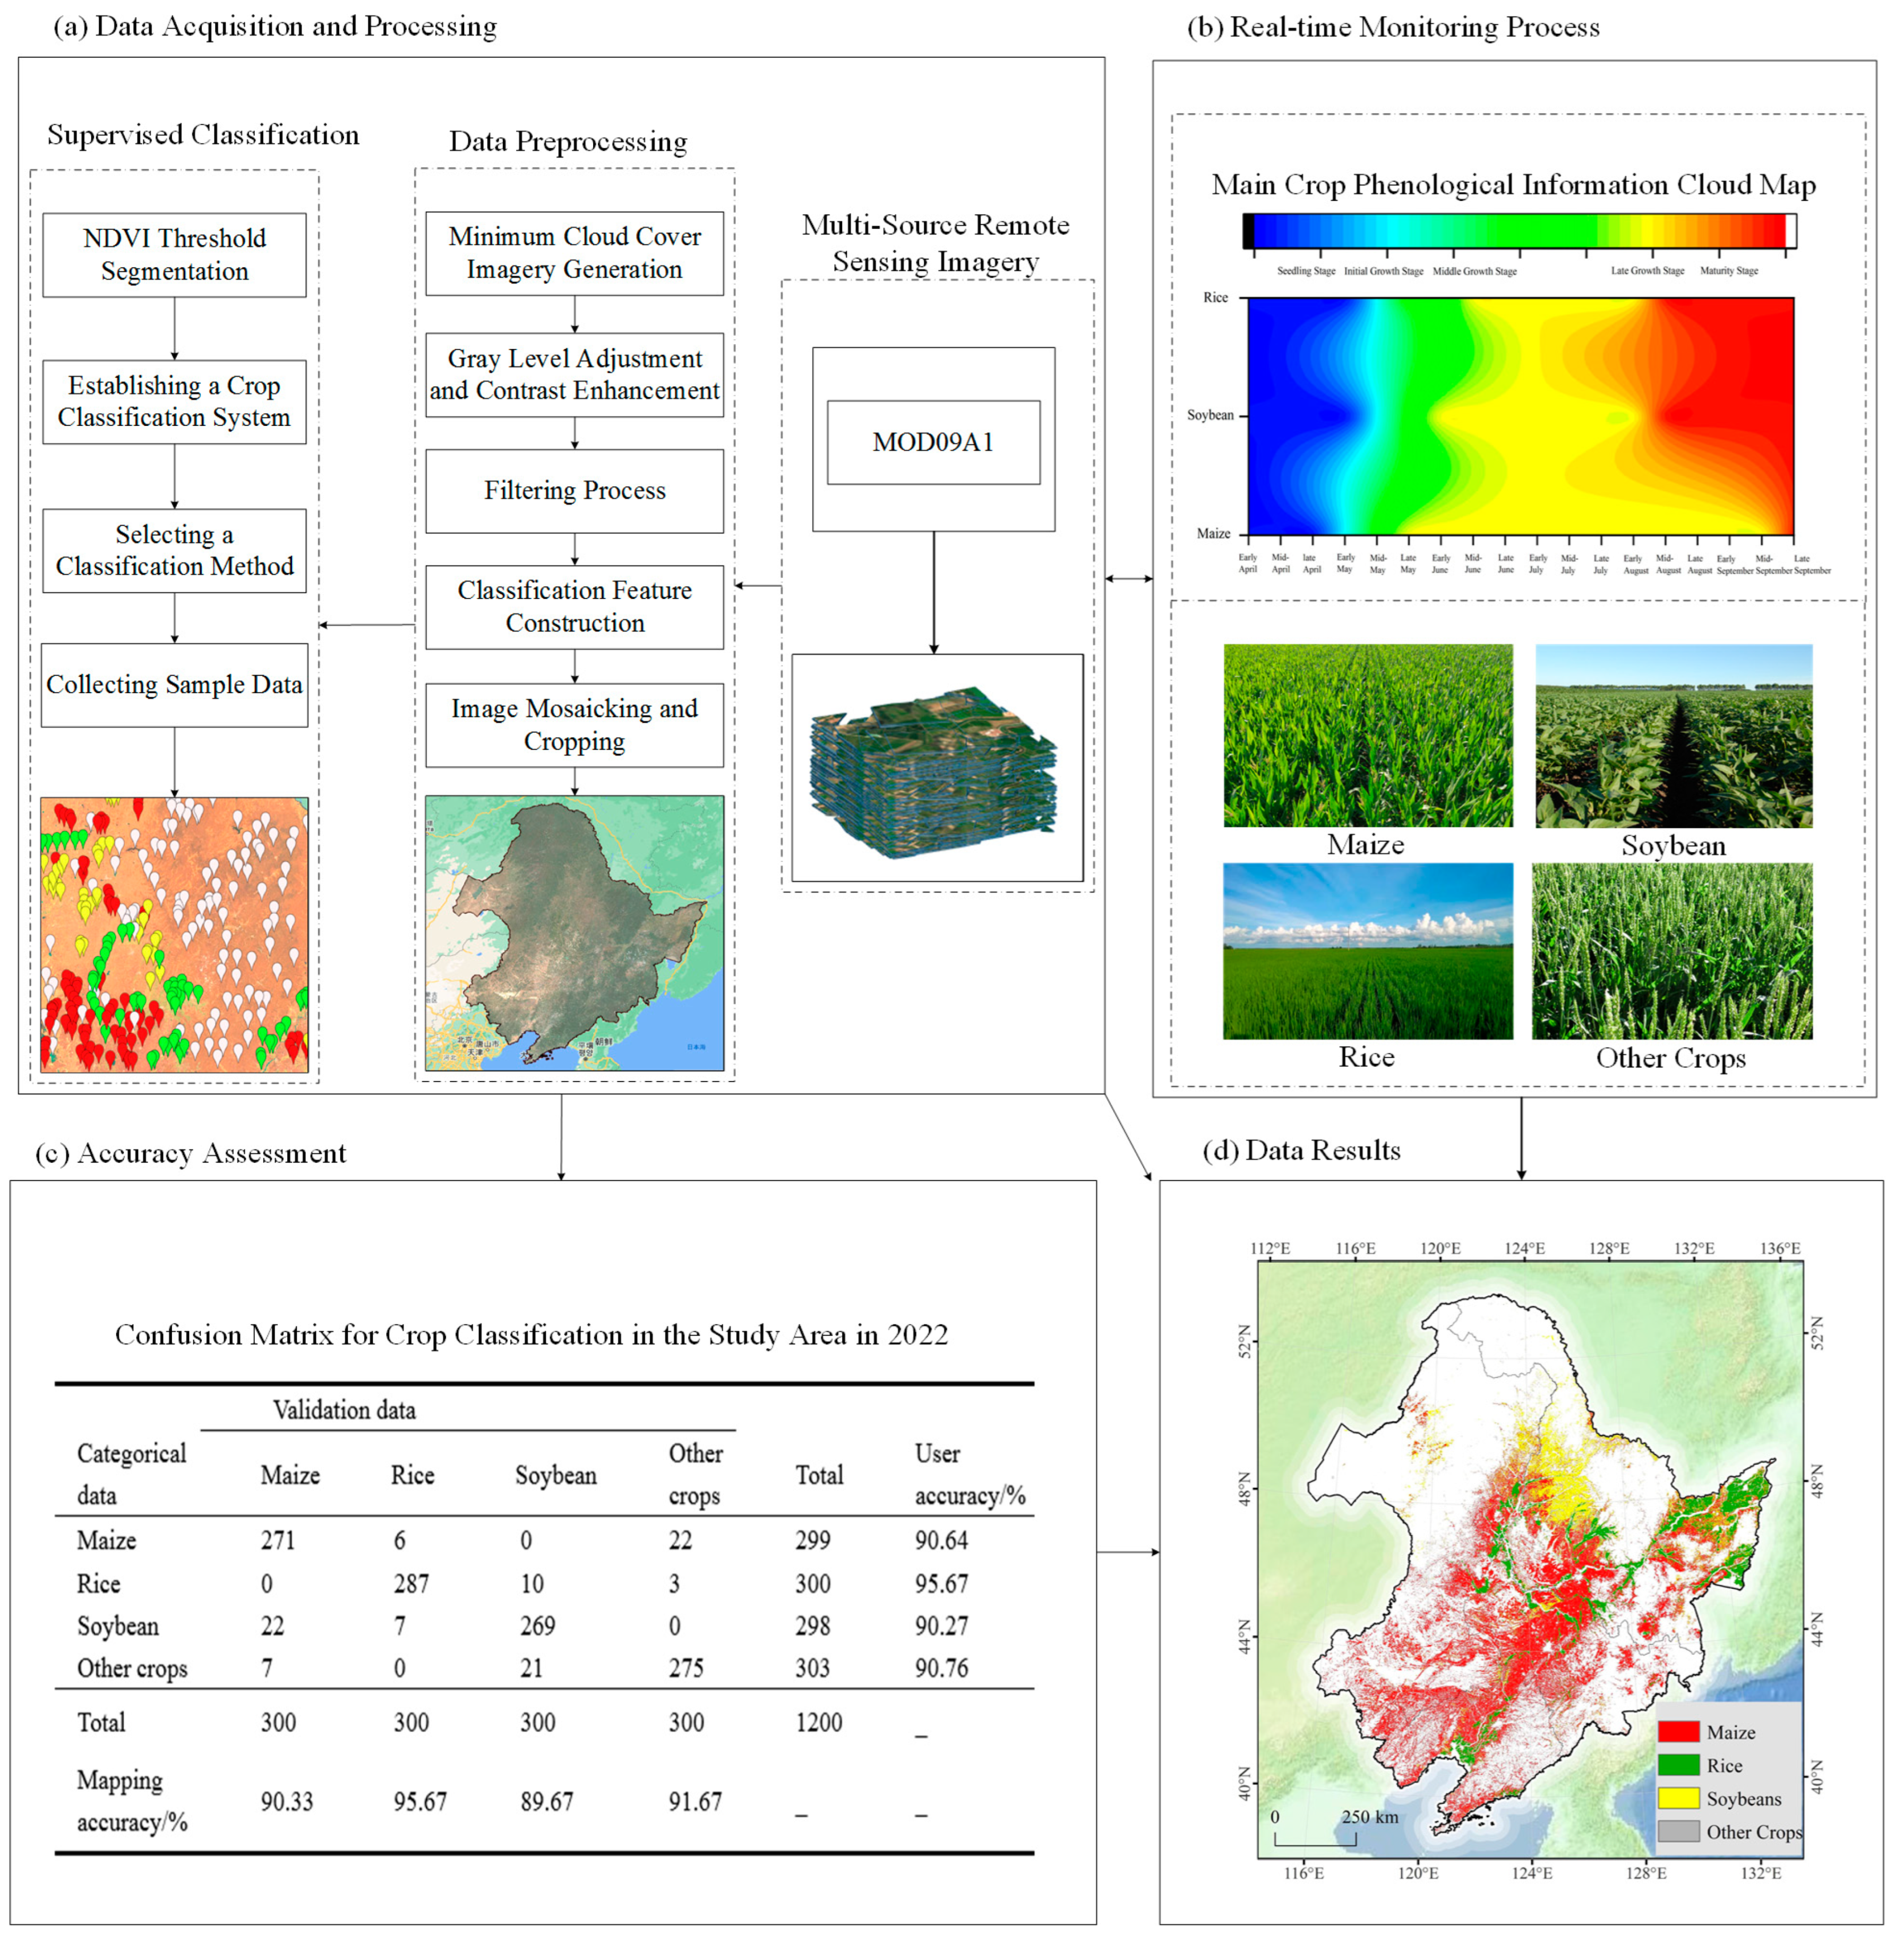
2.2. Data Sources and Processing
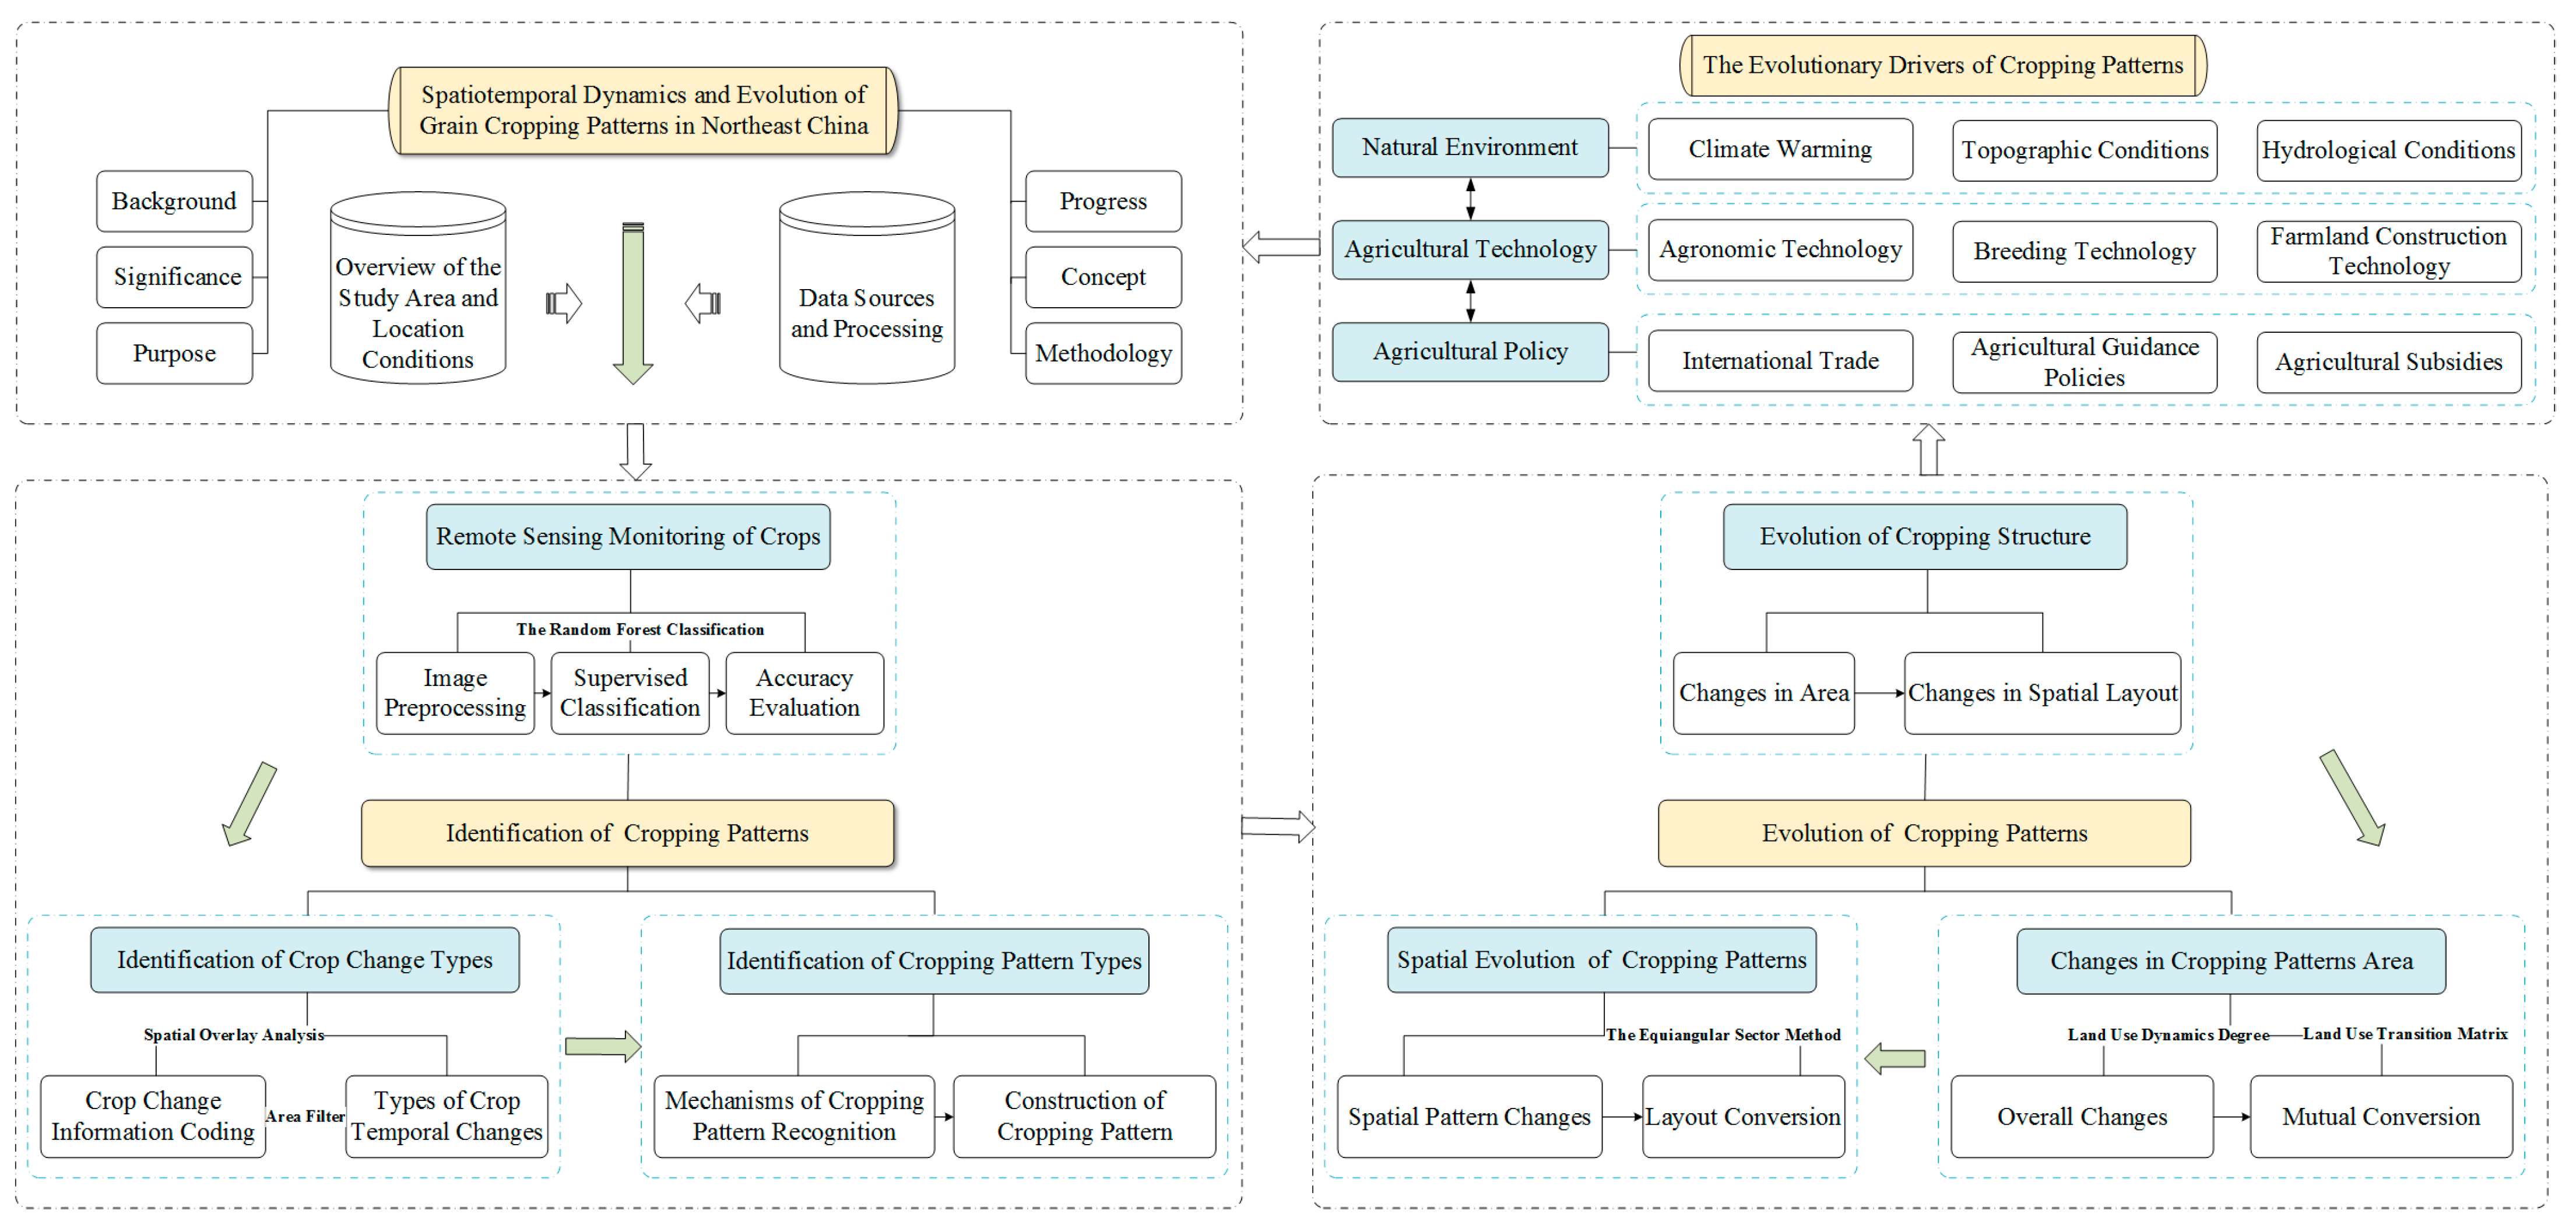
The remote sensing images used in this study came from various sources. From 2000 to 2021, the primary grain crop classification data relied on northeast China’s 500 m crop type dataset. This dataset demonstrated high precision, evidenced by an overall accuracy ranging from 84.73% to 86.93%. Additionally, the consistency with the areas reported in the statistical yearbooks, as reflected by the R2 values, ranged between 0.81 and 0.95 [34]. Moreover, in 2022, the interpretative process for the main grain crops’ coverage data in northeast China adhered to the established methodology used for crop data products from 2000 to 2021. To ensure the accuracy of classification, this study initially extracted data on crop coverage in the northeast China for the year 2021, using a supervised classification method modeled after the procedures used for crop data products from 2000 to 2021. Due to the absence of field survey samples in 2021, 4000 samples were randomly selected, with 70% utilized for training and classification, and 30% designated for an assessment of the accuracy. The results revealed an overall accuracy of 87.2% for the classification of the three main crops, with a Kappa coefficient of 0.83 and an R2 value of 82.3%, indicating that the precision met the research requirements. Subsequently, the random forest (RF) classifier from 2021 was applied to extract information on crop coverage for northeast China in 2022. Unlike in 2021, the validation samples for 2022 were not derived from classification products but were instead based on field survey samples. The specific data processing workflow is detailed in Figure 2.
In northeast China, crops are typically cultivated in a single growing season per year, with significant variation in the growth phases of different grain crops, as illustrated in Figure 2b. Rice planting generally occurs from late April to mid-May, with the heading stage from late July to mid-August. During this period, rice displays distinctive imaging characteristics, making the images from July and August optimal for the extraction of rice. The planting of soybeans in the northeast China is closely tied to the regional climatic conditions, with the most suitable period being the spring months of April and May. From late July to late August, soybeans transition from the pod-setting to the maturation phase, during which the plants gradually yellow. Concurrently, maize remains in the latter stages of growth, displaying a vibrant green hue. Thus, this period is ideal for distinguishing between maize and soybean using remote sensing imagery, based on their distinct phenological markers.
The process began with acquiring MOD09A1 satellite imagery for July, August, and September from the Google Earth Engine platform, featuring a spatial resolution of 500 m. Cloud removal processing was applied to the MOD09A1 imagery using the QC band. The data were then filtered, and conventional linear stretching techniques were used to adjust and enhance the grayscale. By leveraging the distinct growth and phenological characteristics of different crops at various stages, a specific band arrangement highlighting significant crop features was selected. This involved integrating multi-band remote sensing imagery and constructing a crop classification framework for the study area using an NDVI threshold segmentation process [35], categorizing crops into four main types: maize, soybeans, rice, and other crops.
Using boundary data and land use data for northeast China (both sourced from the Chinese Academy of Sciences Resource and Environment Science Data Center), the remote sensing images were mosaicked and clipped. The random forest classification method was used, integrating multiple classification features to interpret the images. Each classification subject was represented by over 1000 monitoring sample points, encompassing 70% of the actual survey locations, with the remaining 30% of the field survey points dedicated to an assessment of the accuracy. To prevent overfitting of the sample data, the quantity of decision trees was established at 150.
Ultimately, by combining the sample points with land survey data, the overall accuracy of the crop classification data for northeast China in 2022 was measured at 91.83%, with a Kappa coefficient of 0.89. Furthermore, the value of R2 was 80.3%, thereby fulfilling the precision criteria established for this study.

2.3. Methods

The research framework of this study was structured into four distinct phases: initial preparation (data collection and development of the research concepts and frameworks), extraction of the cropping patterns (including remote sensing monitoring of crops, identification of the types of change in crops, and recognition of types of cropping patterns), the evolution of cropping patterns (transformation of cropping structures, and analyses of the area and spatial changes in cropping patterns), and exploration of the drivers behind cropping patterns’ dynamics. Key techniques used included the random forest classification method, which was used to monitor crop coverage in northeast China in 2022; spatial overlay analysis, applied to identify the types of changes in crops and extract cropping patterns; the land use dynamic degree, utilized to quantify changes in cropping patterns; the land use transition matrix, used to analyze the interconversion patterns among different cropping patterns; and the equiangular sector method, used to assess the spatial transitions and transformations of cropping patterns over different periods. Each of these methodologies was rigorously applied to ensure a robust, systematic approach to understanding the complexities of agricultural land use. A comprehensive flowchart is depicted in Figure 3.

2.3.1. Spatial Overlay Analysis

The application of spatial overlay analysis served as the principal method for analyzing land use change. Utilizing atlas units, it elucidated the evolution of elements in terms of their quantity, area, and spatial structure during land use changes, thereby addressing the limitations of extracting the attributes of non-spatial data in terms of visual thinking and spatial orientation [36,37]. Consequently, this study utilized the method of spatial overlay analysis to investigate the spatiotemporal evolution of cropping patterns. Specifically, it involved rasterizing nine crop classification datasets across three periods. Notably, values of 1, 2, and 3 were assigned to maize, rice, and soybeans, respectively, while other crops and fallow land were consistently assigned a value of 4. Subsequently, leveraging the “map algebra—raster calculator” tool in ArcGIS 10.7, the crop classification data were overlaid and categorized, thereby yielding the raster data of the primary cropping pattern for the three crop rotation periods. Based on prior research, the formula for calculating the changes in the types of element within the spatial overlay analysis was as follows
C = A 1 × 10 n 1 + A 2 × 10 n 2 + + A i × 10 n i + + A n
where C represents the map coding for the changes in element types during the study period, Ai represents the map coding for the element at the i-th time node, and n denotes the number of time nodes considered in the study (n > 1).
In northeast China, characterized by a single annual harvest, typical crop rotations span 2 or 3 years, encompassing systems such as ‘maize–soybean’ and ‘soybean–maize’ for biennial rotations, and ‘maize–maize–soybean’ and ‘soybean–soybean–maize’ for triennial rotations. This study, which spanned nearly two decades of the 21st century, used a 3-year rotational framework to comprehensively include these predominant dry farming practices, ensuring each plot underwent one to two rotations within each period. Utilizing spatial overlay analysis, the research constructed three distinct crop periods: Period I (2000–2002), Period II (2010–2012), and Period III (2020–2022). Through this method, data on the crop cover classifications across these periods were integrated and categorized, culminating in 64 unique types of patterns of change in crop cover. The methodology for identifying cropping patterns was rigorously developed, informed by the conceptual framework of farmland cropping patterns, regional phenological characteristics, and specific attributes of the data of crop change in cultivated lands, as detailed in Figure 4.

2.3.2. Land Use Dynamic Degree

The land use dynamics degree could be categorized into the single land use dynamic degree and the comprehensive land use dynamic degree. Specifically, the former represents the changes in scale of a single land use type within a specified period in the study area. In contrast, the latter depicts the changes in scale of all land use types within the same period [38]. Moreover, both metrics are used to measure the magnitude and rate of the quantitative evolution of land use types over a given timeframe [39]. Consequently, this study incorporated these metrics to evaluate the dynamic changes in cropping patterns. The formulas for their calculation are as follows
L K = U a U b U a × 1 T × 100 %
L C = a = 1 n Δ L U a b 2 a = 1 n L U a × 1 T × 100 %
where LK represents the dynamic degree of a single cropping pattern, whereas LC denotes the comprehensive dynamic degree across multiple cropping patterns. Specifically, Ua and Ub correspond to the area (km2) of a particular cropping pattern at the beginning and end of the study period, respectively. Additionally, T signifies the interval of the period. Moreover, LUa indicates the area (km2) of the a-th type of cropping pattern at the outset of the study. Furthermore, ΔLUa−b represents the absolute value (km2) of the area of the a-th type of cropping pattern that was converted to other cropping pattern types during the study period. Lastly, n represents the number of types of cropping pattern during the study area.

2.3.3. Land Use Transition Matrix

The land use transition matrix can intuitively reflect the characteristics of spatial variation and transfer directions of multiple land use types during the study period. Consequently, this study introduced it, with a focus on exploring the evolutionary patterns of agricultural cropping patterns in terms of the scale structure and spatiotemporal differentiation in the process of cultivated land use. The calculation formula was as follows [40,41]
S x y = S 11 S 1 n S n 1 S n n
where Sxy denotes the area of a certain cropping pattern at the beginning and end of the study period, while n represents the number of types of cropping pattern.

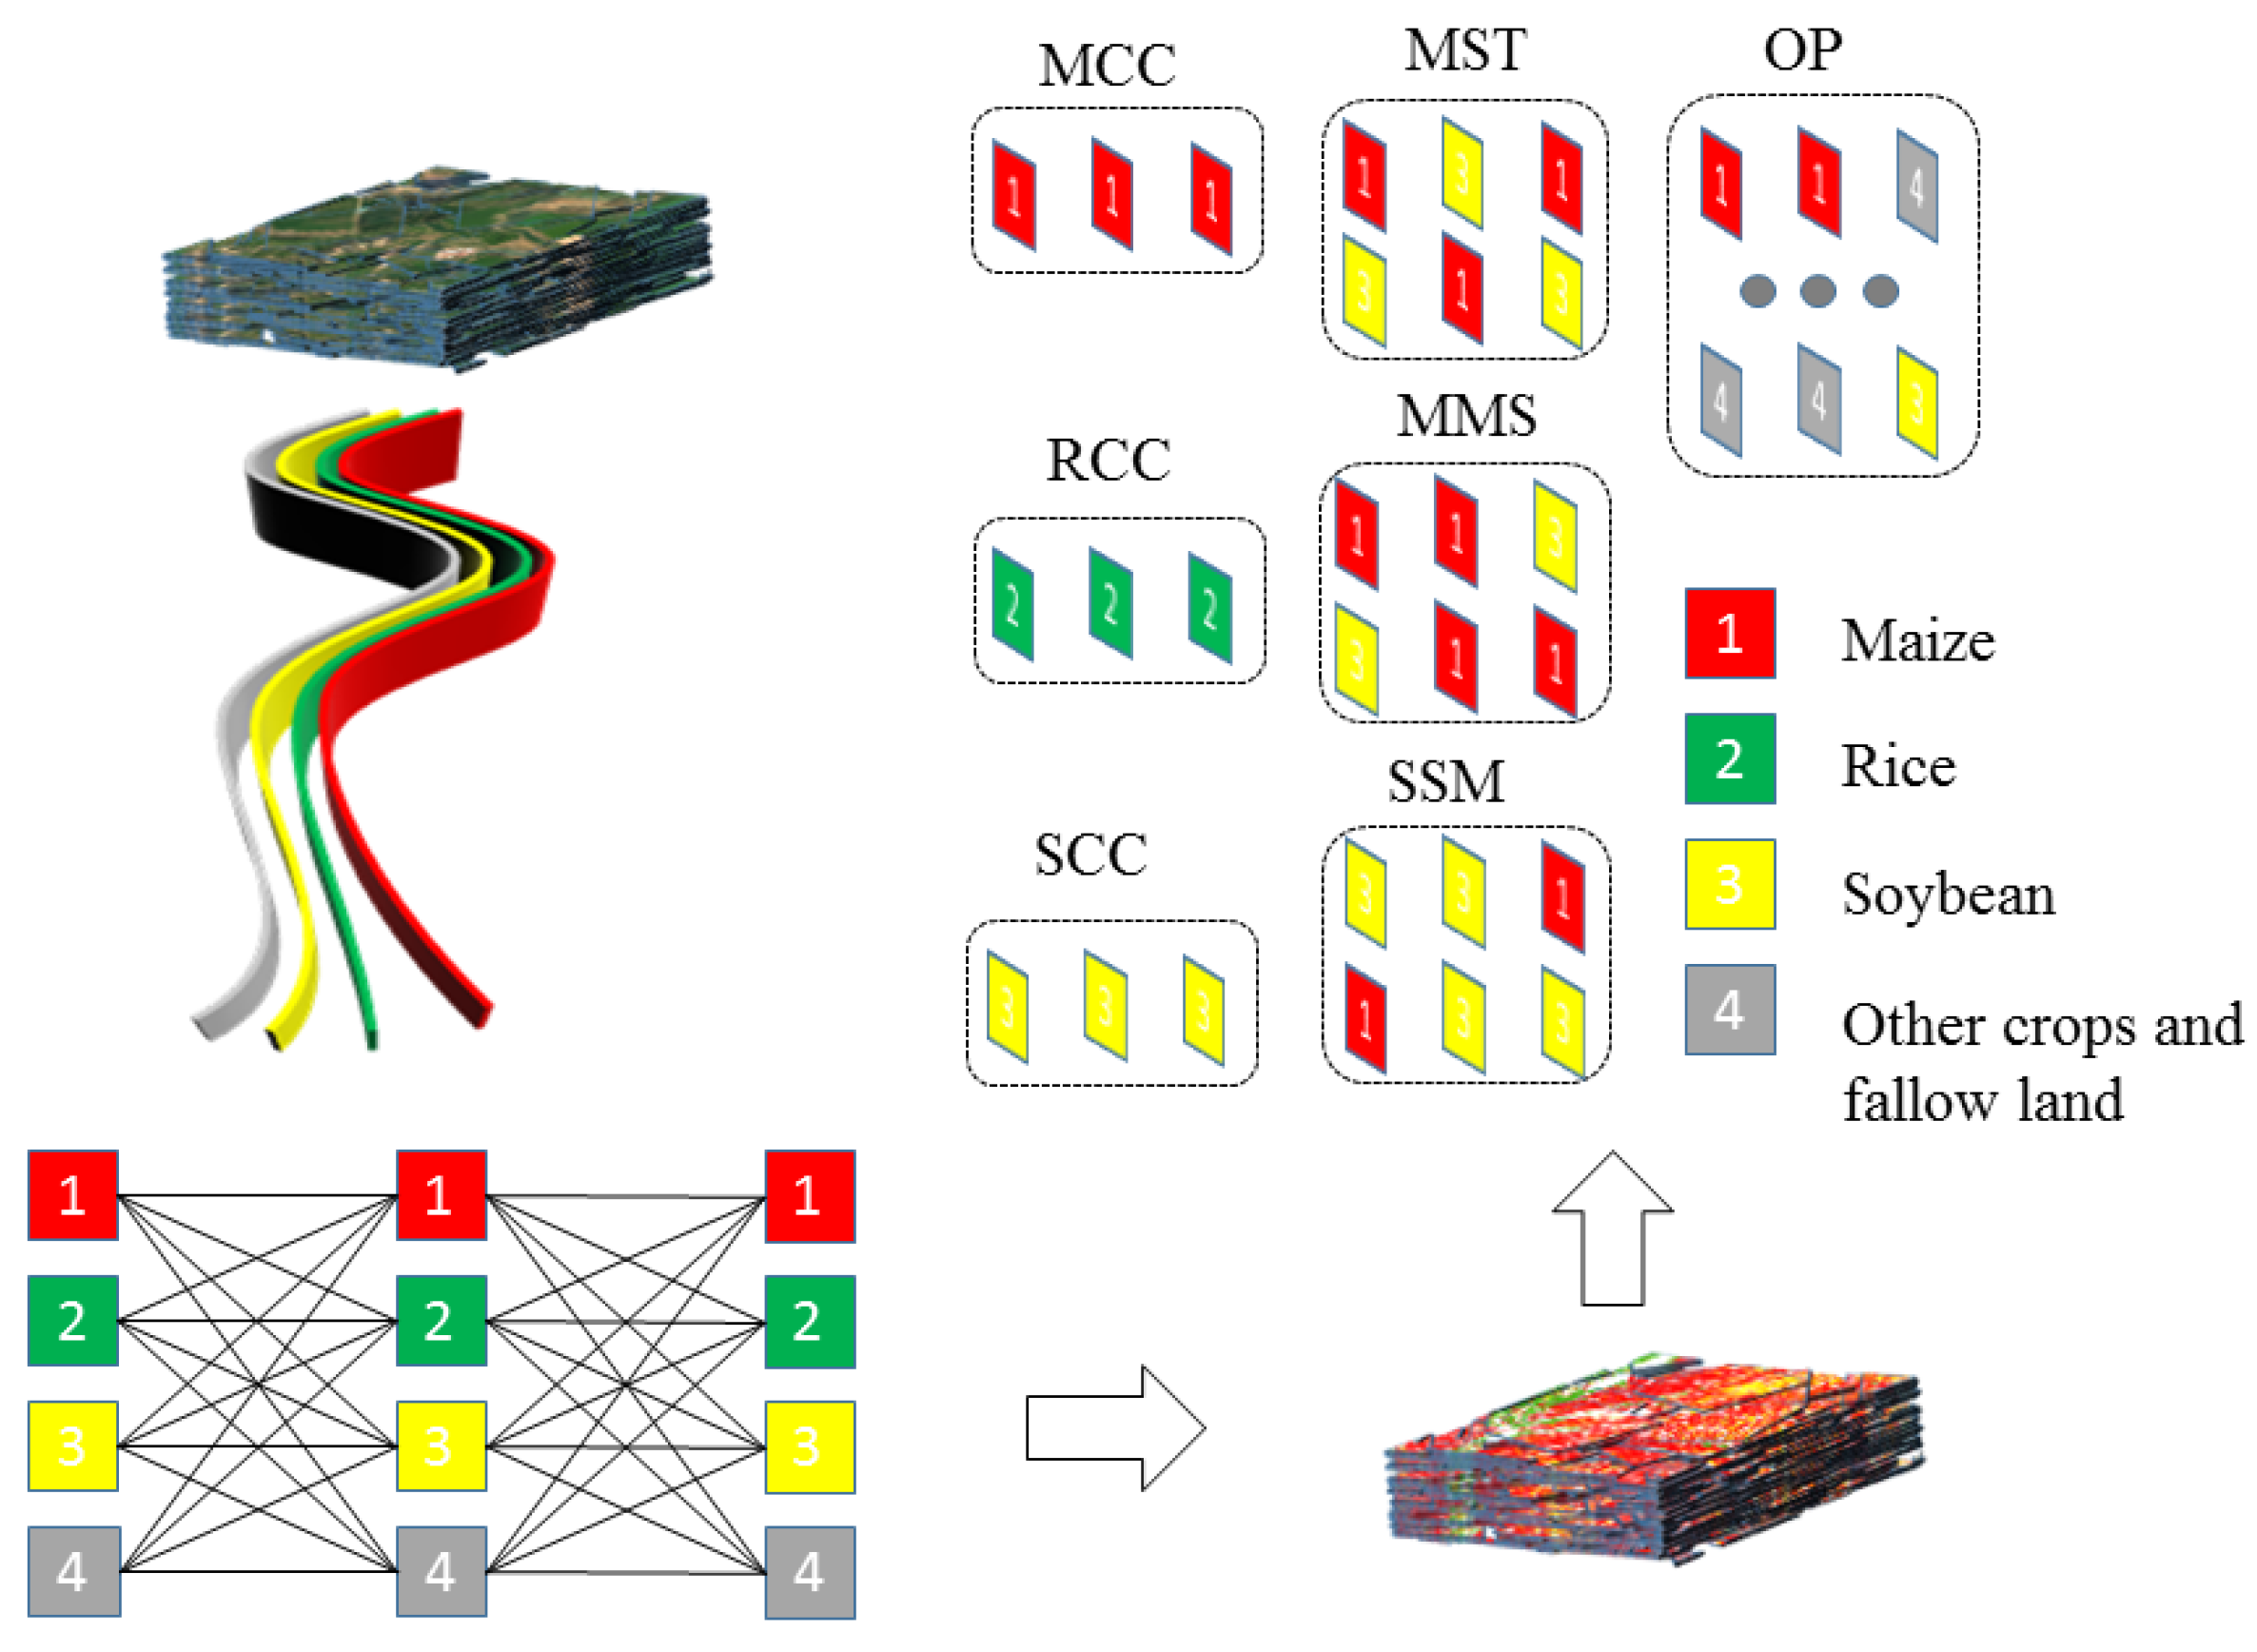
2.3.4. The Equiangular Sector Method for Cropping Patterns

The equiangular sector method for cropping patterns takes the geometric center of the study area as the circle’s center. It draws a circle with a radius equal to the distance from the center to the farthest point on the study area’s boundary, meaning that the distance from the center to any point on the boundary must be less than or equal to the radius. Subsequently, the geometric circle is equally divided into several congruent sector areas at specific angles [42]. By comparing the number of transfer trajectories of cropping patterns’ evolution and the raster layout in each equiangular sector area over multiple time phases, one can quantitatively analyze the expansion of cropping patterns in different directions and the characteristics of spatiotemporal differentiation [43].
To thoroughly investigate the spatial evolution of cropping patterns in northeast China, this study used the “equiangular sector method.” Using the centroid of the area where Qian’an County and Qianguo’erluosi Mongolian Autonomous County in Jilin Province intersect as the center point, a circle with a radius of 950.95 km was drawn. This circle was oriented starting from northwest by 5.65 degrees and was divided into 16 equal sectors, each with identical areas and angles. The excess regions outside the drawn circle were trimmed to focus on the study area. This setup facilitated the visualization of the types of transitions in cropping pattern within these sectors, enabling the generation of a detailed diagram that illustrates the spatial transition trajectories of cropping patterns across 16 directions in northeast China.

3. Results

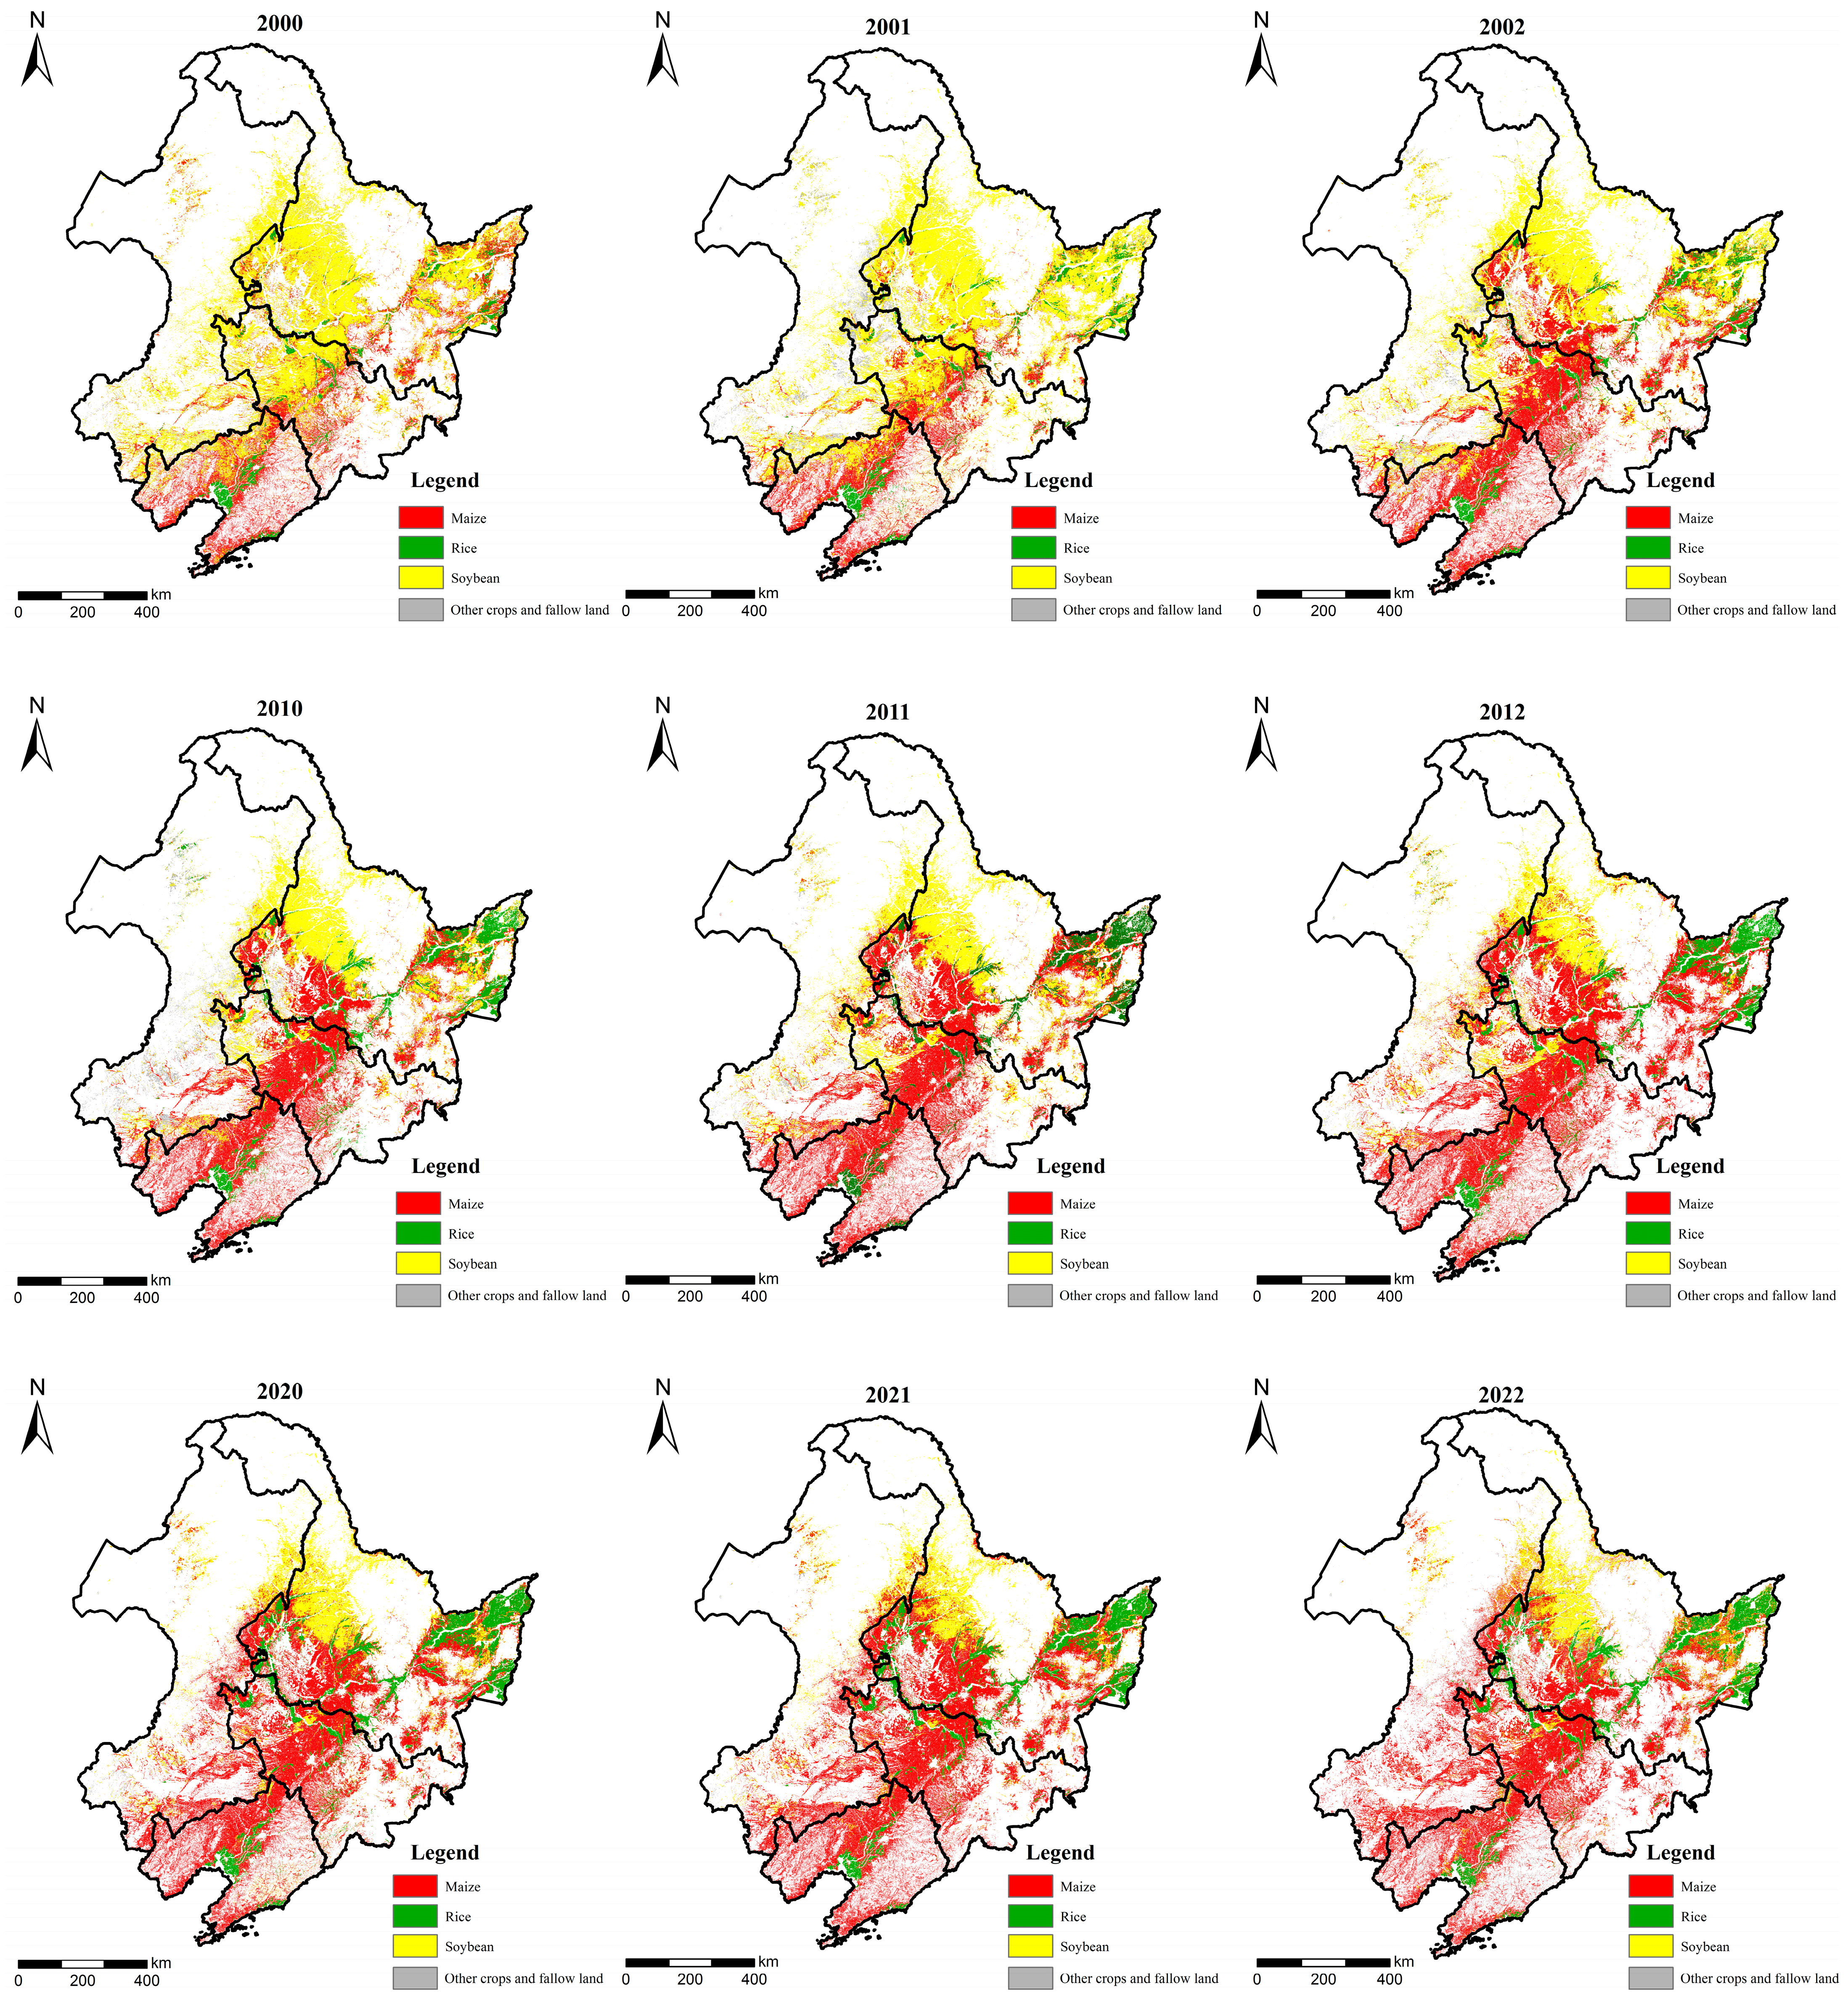
3.1. The Characteristics of Interannual Variation in the Structure of Grain Cropping

In northeast China, maize, soybeans, and rice were the primary dominant grain crops, both spatially and temporally. Moreover, there were some economic crops such as potatoes, sugar beets, and miscellaneous grains, which, although diverse, accounted for a smaller proportion and were therefore categorized as “other crops”. As shown in Figure 5, since 2000, the characteristics of the evolution of the scale of various crops exhibited differentiation. Specifically, the proportion of the sown area of maize showed a significant increasing trend, which gradually stabilized by 2012. Conversely, the proportion of the sown area of soybeans exhibited a complementary relationship with that of maize, showing a significant decrease initially and then stabilizing after 2012. Furthermore, the proportion of rice planting areas generally showed an increasing trend, peaking and stabilizing in 2011. In contrast, the proportions of the area of other crops and fallow land were relatively disorderly, indicating that natural, social, and other factors greatly influenced the sowing of these crop types.
The spatiotemporal differentiation in the patterns of crop planting structures in northeast China was significantly distinct. As shown in Figure 6, the dominant type in the initial spatial layout was soybeans, characterized by a distribution of dense in the north and sparse in the south. However, this dominant spatial pattern was gradually replaced by maize over the years. Consequently, the abundant planting areas of soybeans, mainly in the northern Liaohe Plain and the central Songnen Plain, gradually decreased. Since 2002, the spatial layout has been dominated by maize and has remained stable. Furthermore, in terms of spatiotemporal differentiation, the area planted to maize expanded from south to north, while planting to soybean contracted in the south and concentrated in the north, with their distribution areas constantly changing in a relationship of mutual advance and retreat over the past 20 years. Moreover, the patches of rice planting were predominantly focused on the Liaohe Plain and the Sanjiang Plain. Over the years, its spatial distribution changed from scattered to aggregated patches, and from 2012 onwards, it remained basically stable.

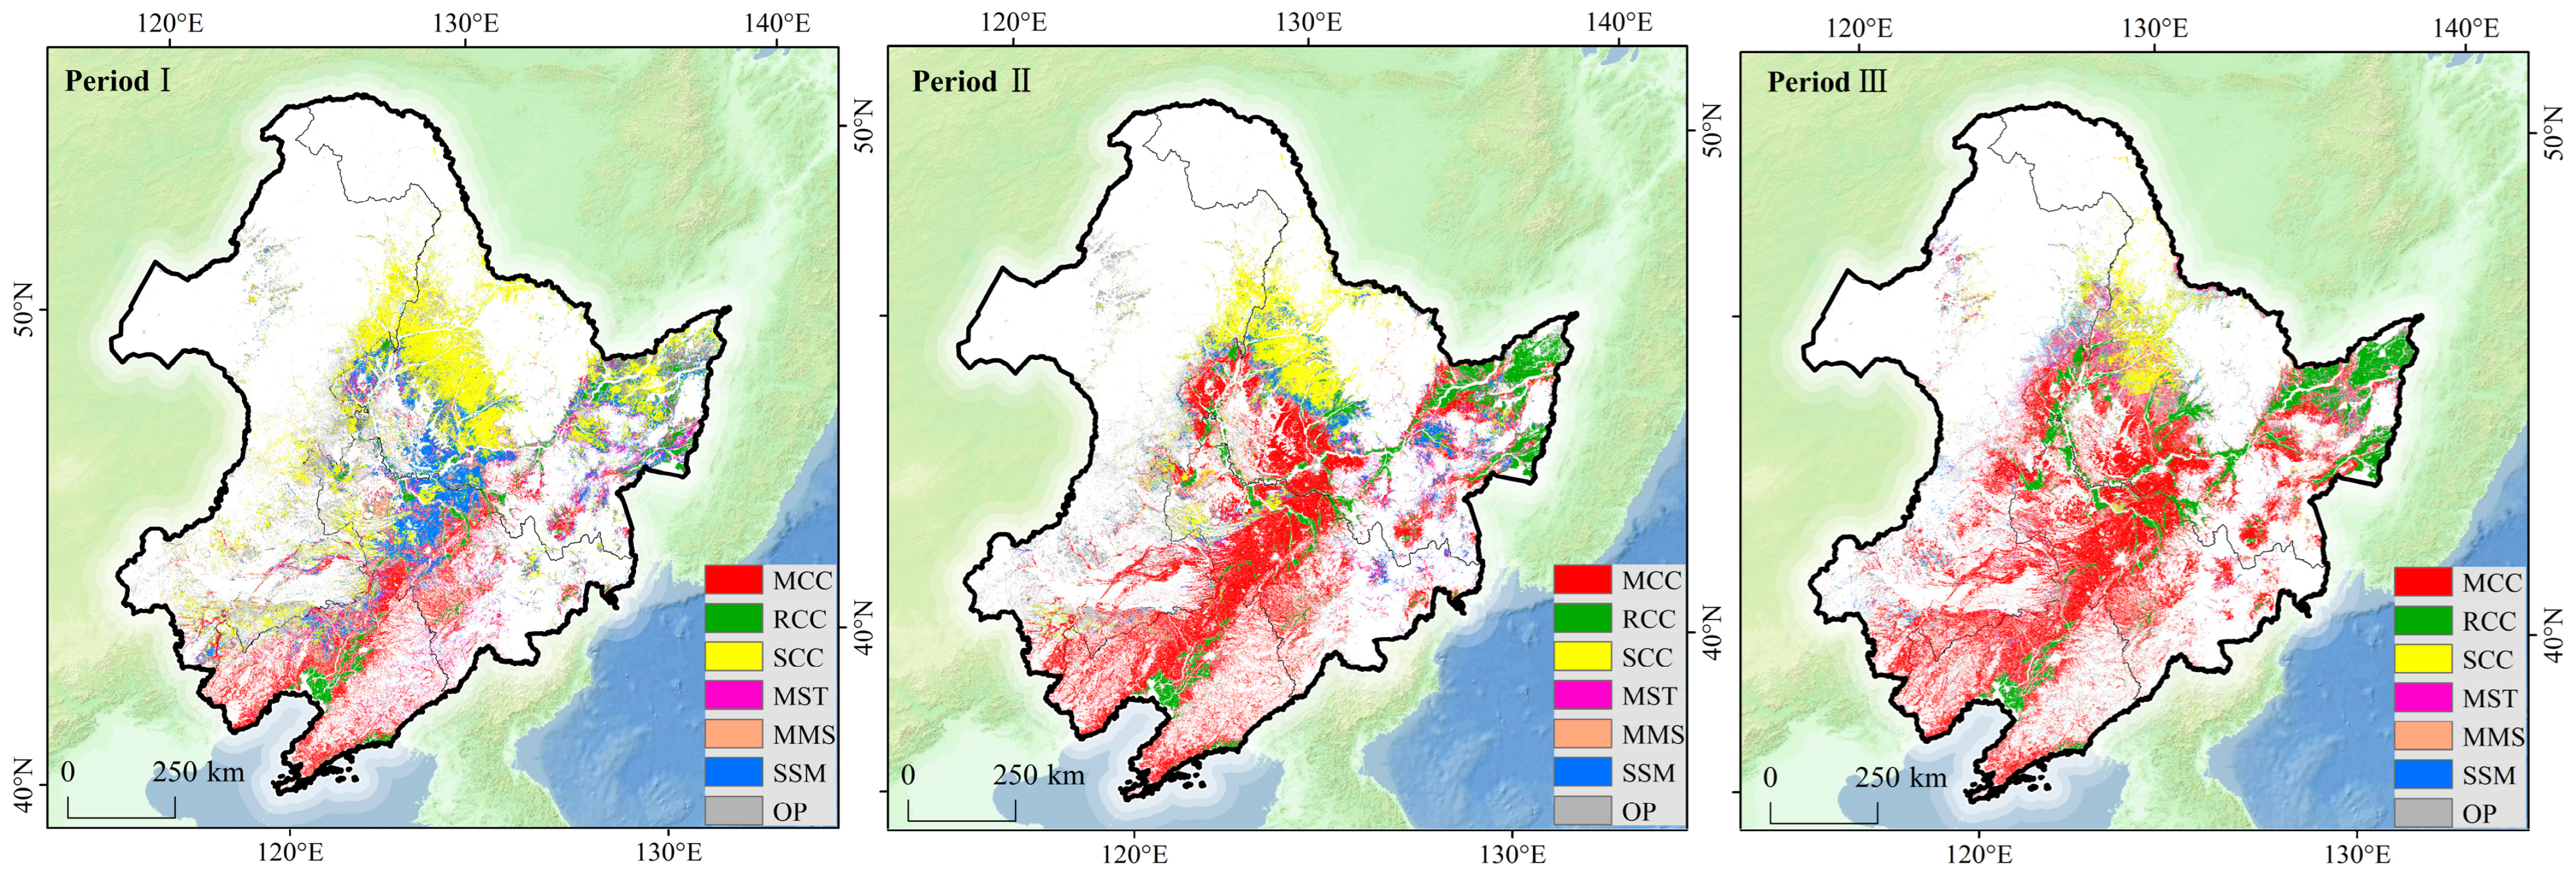
3.2. Identification of Grain Cropping Patterns

In this study, by systematically sorting and classifying the encoded data of cultivated grain cropping patterns, we identified seven primary categories of agricultural cropping patterns, as detailed in Figure 7. Specifically, the crop information code “111” represented the continuous maize cropping pattern, with a spatial layout characterized by more in the south and less in the north, and was concentrated in contiguous areas in Liaoning Province, Jilin Province, and southern Heilongjiang Province. Furthermore, the continuous rice cropping pattern was represented by code “222,” which was mainly distributed in the Liaohe Plain, the Sanjiang Plain, and the hinterland of the Songnen Plain. These areas exhibited a strip-shaped contiguous pattern, with significant regional characteristics of continuous rice planting in the Liaohe and Sanjiang Plains. Additionally, the code “333” represented the continuous soybean cropping pattern, which was predominantly distributed in the central area of Heilongjiang Province, showing a pattern of more in the north and less in the south across each period. The code representing alternating maize and soybeans over 3 years indicated the maize–soybean rotation cropping pattern. Consequently, this pattern was further subdivided based on the cropping patterns’ identification mechanism into three submodes: “maize–soybean 2-year rotation” (codes “131, 313”), “maize–maize–soybean 3-year rotation” (codes “113, 311”), and “soybean–soybean–maize 3-year rotation” (codes “331, 133”). Moreover, other cropping patterns included 54 codes, accounting for 84.38% of all coding categories, indicating a significant presence of disordered crop planting. This category included various cropping patterns such as maize–soybean mixed planting, miscellaneous grain rotation, and continuous hemp planting. An analysis of the spectral codes for other cropping patterns over various periods revealed that intercropping predominantly featured maize and soybean combined with other crops in a non-sequential arrangement, such as ‘maize–soybean–other crops’ and ‘maize–other crops–soybean’. Throughout the cropping periods, the proportion of maize–soybean intercropping relative to other cropping patterns was 79.81%, 83.63%, and 85.38%.

3.3. Evolution of Grain Cropping Patterns

3.3.1. Overall Changes in Crain Cropping Patterns

The statistical data in Table 1 illustrated the changes in the total amount of cropping patterns in northeast China across three different periods. Simultaneously, the analysis of cropping patterns across the three periods revealed four main patterns: MCC, MSR (including MST, MMS, and SSM), OP, and SCC. These patterns accounted for 94.73%, 88.76%, and 86.39% of the total area in each period. Initially, SCC was dominant, covering 29.31% of the area. However, from Period II onwards, MCC took over as the dominant type, increasing to 42.21% and 45.83% in Periods II and III. SSM was the primary maize–soybean rotation in Periods I and II. Still, MMS became the dominant rotation pattern in Period III, comprising 44.24% of MSR.
When we integrated the land use dynamic degree, it was evident that the total area under MCC experienced substantial growth during the initial phase (Period I to Period II), with a rate of 17.82% in LK. However, in the latter phase (Period II to Period III), the value significantly decreased to 1.06%. Similarly, RCC experienced significant growth initially, followed by a decline in growth rate. MMS remained the most stable, with only a 1.32% change in total area from Period I to Period III.
Conversely, SCC and SSM showed a decreasing trend, with a significant decline in the earlier period and a slower reduction later. MST and OP initially decreased significantly but then saw a slight increase. Overall, the LC of cropping patterns increased from 0.02% in Periods I to II to 0.09% in Periods II to III, indicating an accelerated rate of change and intensified use of cultivated land in the latter stage.

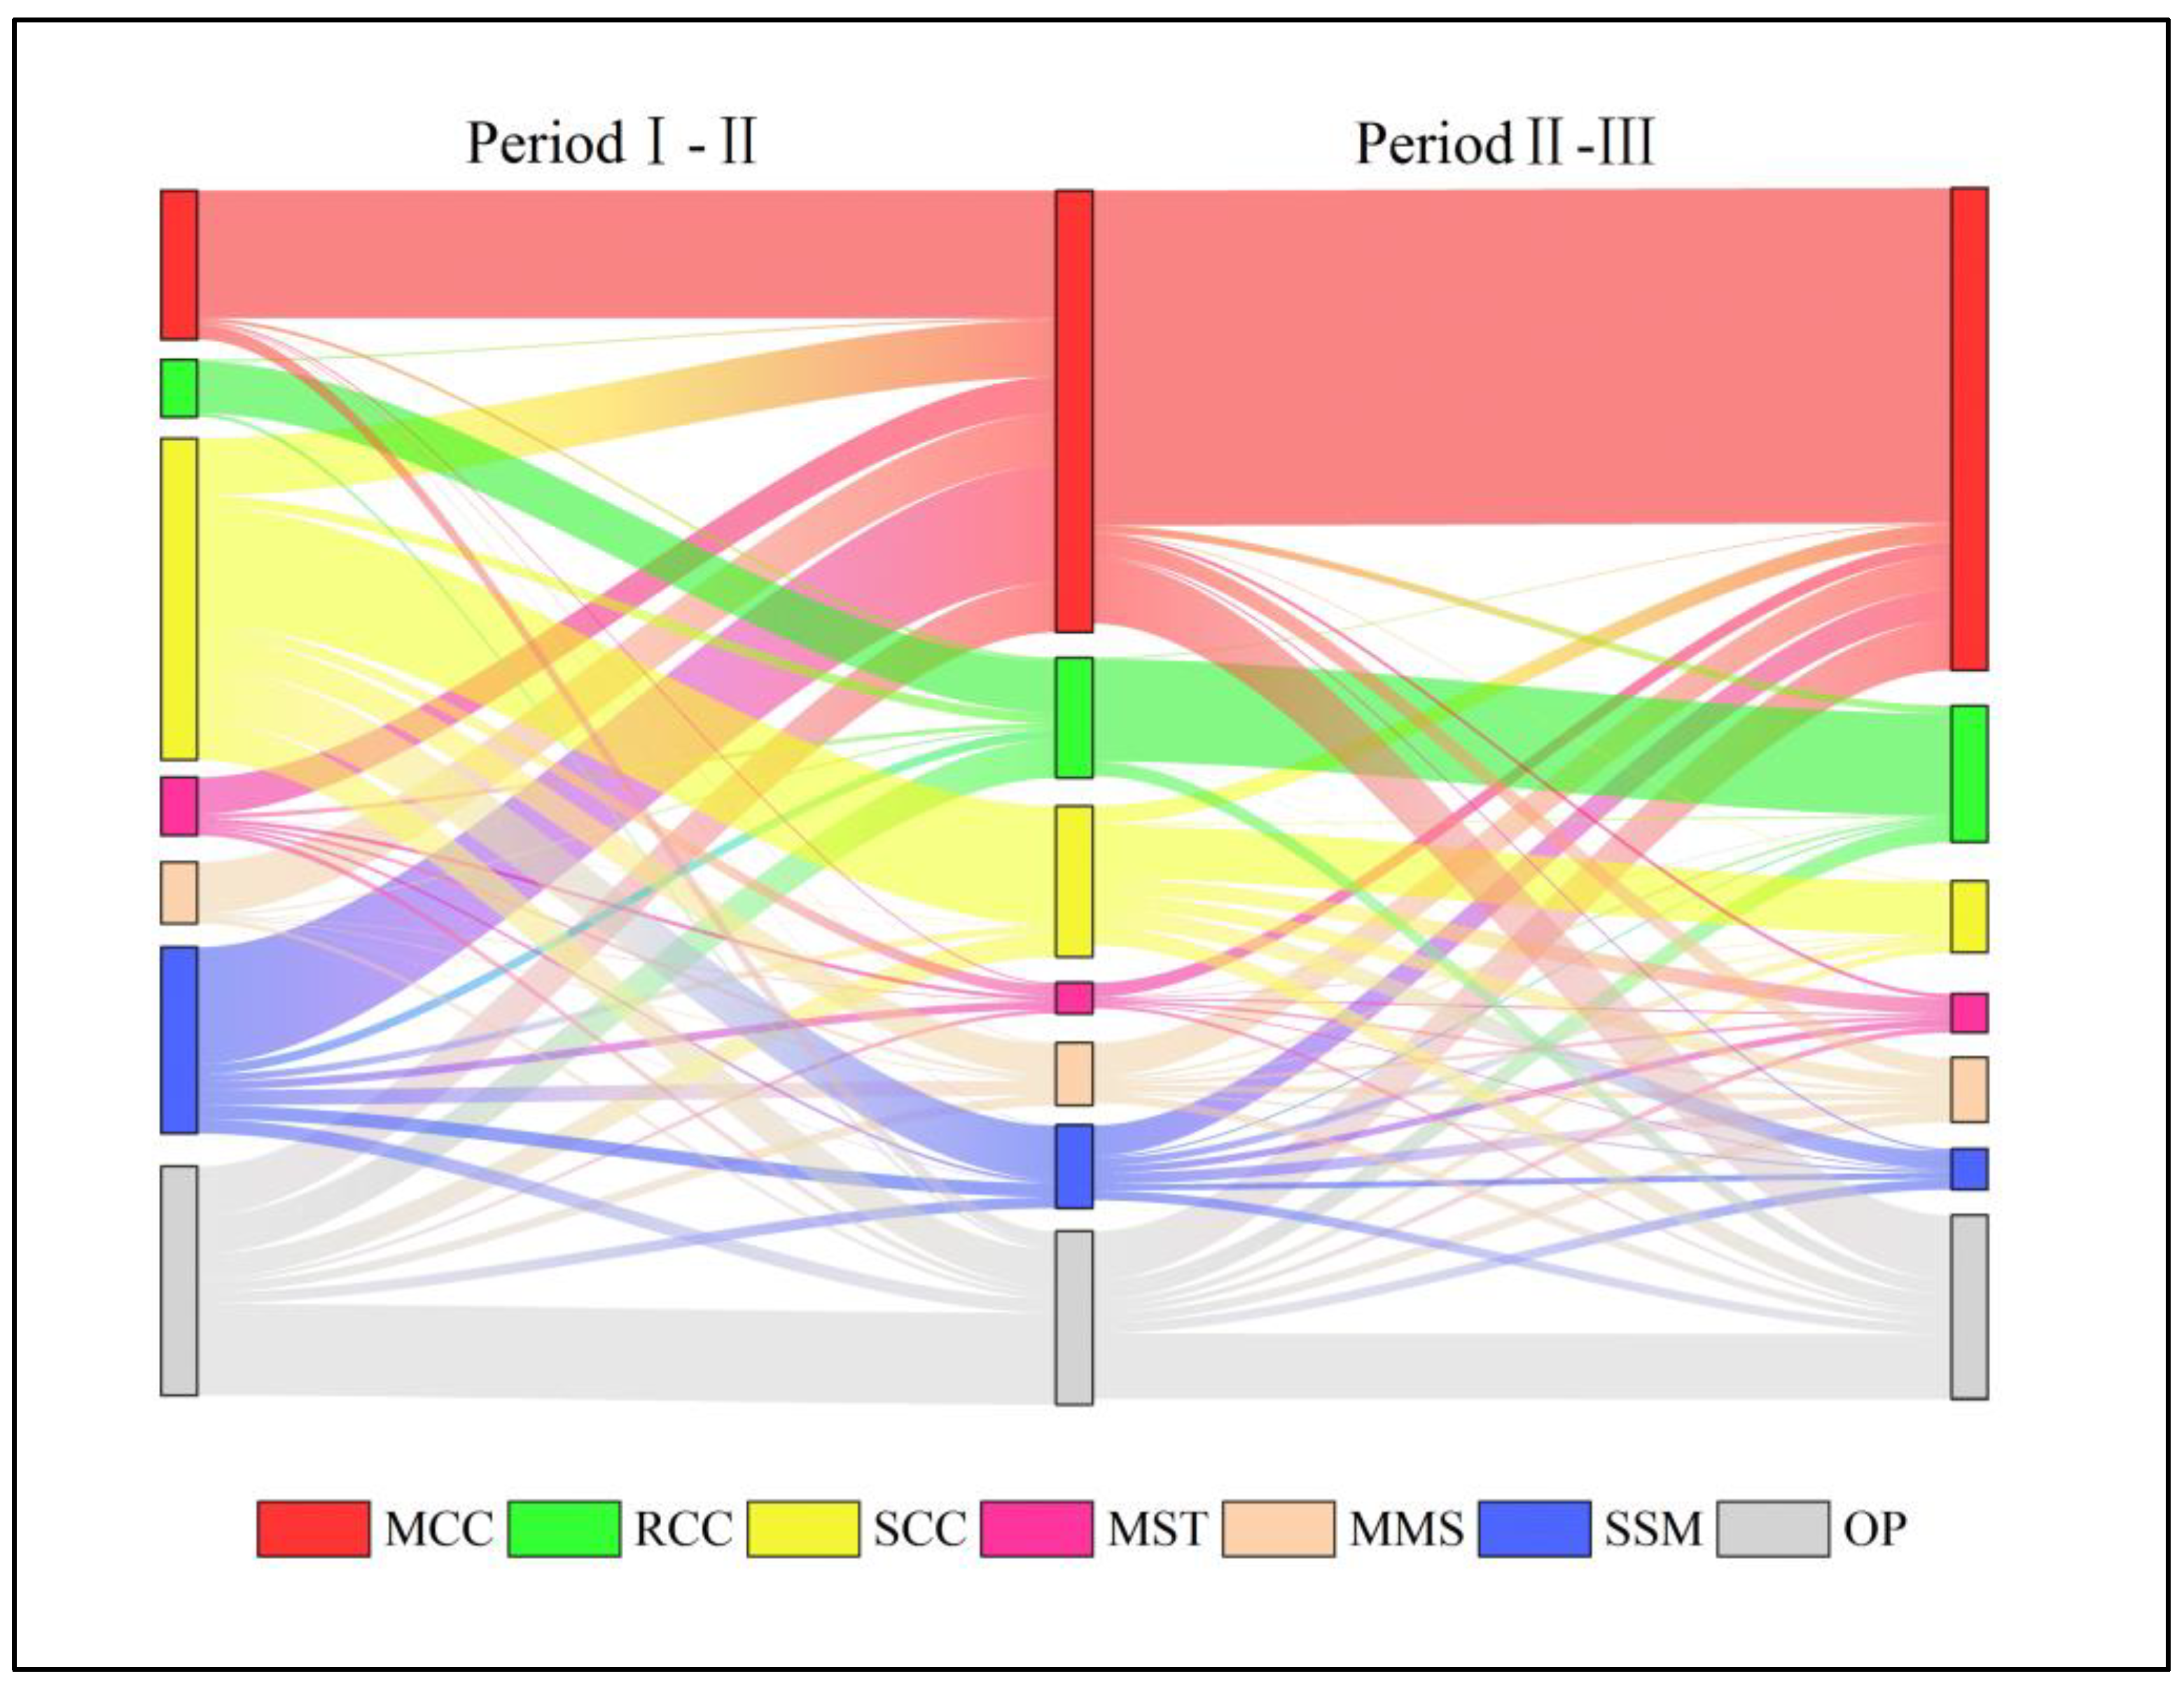
3.3.2. Conversion of Grain Cropping Patterns

The application of Land Use Transition Matrix to analyze the shifts in cropping patterns across various periods reveals distinct differences in the spatial evolution of cropping patterns throughout the northeast China, as depicted in Figure 8. From Period I to Period II, SCC had the highest transfer-out rate, with 67,498.00 km2 being transferred. Notably, 28.18% of this area shifted to MCC, the largest proportion of the transferred area. During this period, MCC received the most transferred area, totaling 104,611.25 km2, with 37.34% coming from SSM.
In the shift from Period II to Period III, MCC experienced the most transfers out, primarily shifting to OP, totaling 21,467.00 km2. Simultaneously, MCC again received the most transferred area, amounting to 48,995.50 km2, with 33.49% coming from OP, the largest share of the transfers.
Overall, the transfer processes of MCC and RCC at each stage largely remained unchanged. Nevertheless, a significant portion of MST, MMS, and SSM converted to MCC during the transfer process. Moreover, the primary transfer sources of OP in both stages were the dominant SCC and MCC. This finding indicated that while the dominant cropping patterns largely maintained their original characteristics, a considerable portion evolved into a mixed form of planting maize and soybeans.

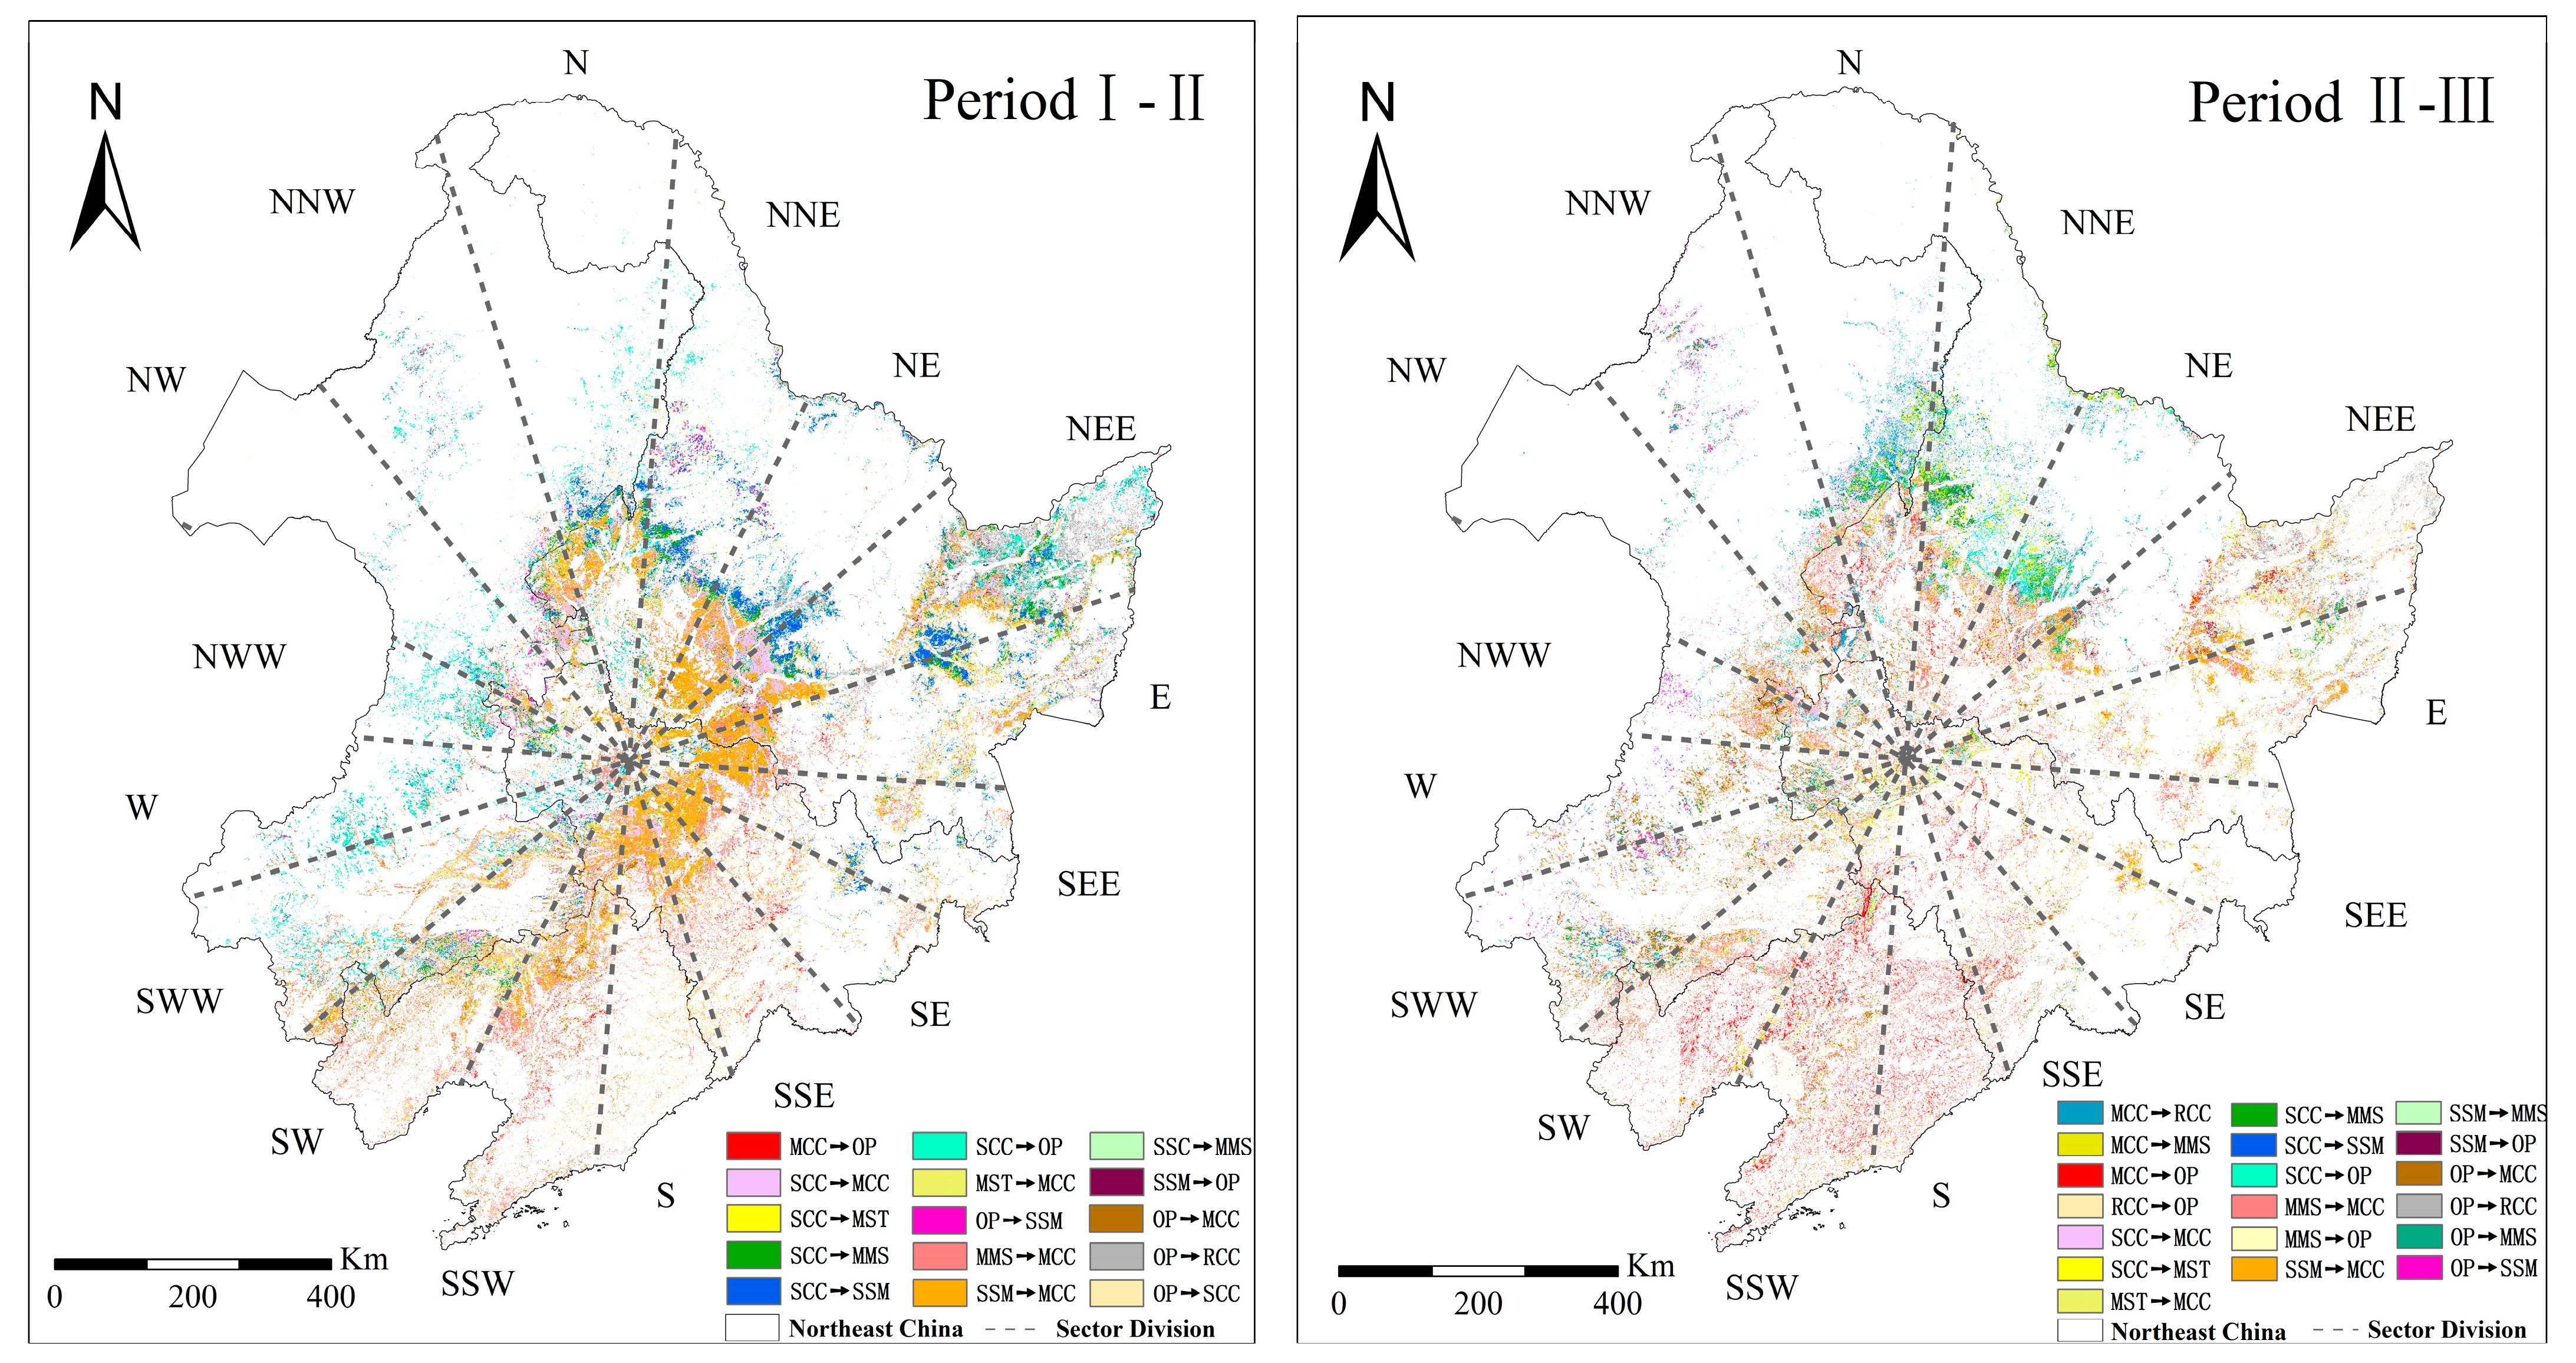
3.3.3. Analysis of the Spatial Evolution of Grain Cropping Patterns

The conversion trajectories of cropping patterns revealed significant differences in their spatial evolution at different stages (Figure 9). During Period I to Period II, SSM to MCC showed the highest proportion of transfers, mainly concentrated in the central part of the study area, forming a crescent shape from NNW to SSW in a clockwise direction. However, from Period II to Period III, this transfer significantly declined and was only sporadically distributed from the Sanjiang Plain to the Songnen Plain. Moreover, SCC to MCC encircled the core of the study area’s sectors during the first stage (Period I to Period II). It showed a declining trend towards the center in the second stage (Period II to Period III). Furthermore, in the first stage, the transfer from SCC to SSM was distributed in a belt from NNW to ENE in a clockwise direction. In the second stage, it concentrated in the NNW, N, and NNE directions, showing a trend towards evolving into SSM in the northern area. During the study period, a significant proportion of SCC also converted to MMS (NNE) and MST (NNW, N, and NNE) in the northern direction. Similarly, the change from MMS to MCC was mainly concentrated in the southeastern part of the study area’s central area (east to south direction). It showed an expanding trend towards the northwest direction of the Songnen Plain (NNW, NW, and WNW).
Moreover, the change from MST to MCC was distributed in the NE to SW clockwise range of northeast China, showing a declining trend from the southern to the central part of northeast China during the study period. Additionally, the changes in MCC primarily converted to maize–soybean mixed planting, which was scattered in the eastern to southern parts of northeast China (NE to S clockwise direction) in the first stage and showed an evolving trend towards the northern Songnen Plain, Sanjiang Plain, and Liaohe Plain (NNW to NE and SSE to SSW in a clockwise direction). On the other hand, the characteristics of the spatial evolution of RCC were not evident, exhibiting strong stability against external disturbances and environmental changes. Overall, compared with the change from Period I to Period II, the Period II to Period III transition experienced more intense conversions of cropping patterns.

4. Discussion

4.1. Natural Factors in the Evolution of Grain Cropping Patterns

The spatiotemporal evolution in the patterns of cropping patterns were largely driven and constrained by natural factors [44]. In northeast China, which was primarily located in the temperate zone, the selection of crop types and suitable planting areas were heavily influenced by the temperature conditions. Against the backdrop of a warming climate, the suitable planting ranges for maize and rice expanded, continually pushing northward. Consequently, the area of MCC significantly expanded and shifted northward. In contrast, the area of SCC significantly decreased, leading to the formation of MSR in the intercropping zones of soybeans and maize.
Moreover, in the Sanjiang Plain and along other major river basins, where water resources were abundant, large-scale paddy fields were developed, resulting in a significant increase in the area of RCC. Additionally, in dry farming areas with similar hydrothermal conditions, the flat plains were more suitable for maize cultivation, leading to the formation of MCC zones. Conversely, the slightly undulating mountainous and hilly areas were more suitable for soybean cultivation, resulting in the formation of SCC zones or MSR zones.

4.2. Technological Factors in the Evolution of Grain Cropping Patterns

Agricultural technology and engineering construction are crucial driving forces behind the evolution of cropping patterns. In northeast China, the development level of agronomic techniques has progressively advanced [45], and the management of agricultural fields has gradually moved towards a more scaled, integrated, and specialized approach [46]. Furthermore, the upgrading of agricultural machinery and the introduction of new fertilizers significantly boosted the production capacity of major grain crops in the cold regions of northeast China. Moreover, advancements in crop breeding technology overcame regional planting limitations in the selection of seed and varieties of grain crops. Notably, the rapid development of maize and rice breeding technology has expanded their suitable planting ranges and continuously increased their yields. In addition, farmland construction technology, such as filling low-lying areas and merging small plots, made the terrain flatter, thus creating conditions for large-scale, mechanized planting of maize, soybeans, and rice. Since the 21st century, northeast China has undertaken significant water conservation projects, such as the “River and Lake Connectivity” project in Jilin Province, and the “Songhua River Connectivity” and “Ussuri River Management” projects in Heilongjiang Province. Consequently, the construction of irrigation areas and the supporting facilities, along with intelligent seedling-raising technology, promoted the increase in rice yield and the expansion of RCC areas. These developments directly influenced the spatiotemporal layout and regional evolution of cropping patterns.

4.3. Policy Factors in the Evolution of Grain Cropping Patterns

Agricultural policies played a significant role in driving changes in the planting structure, layout adjustments, and transformation of farmers’ planting decisions in northeast China. Since the implementation of the low-tariff trade policy for soybeans in 1996, soybean production levels depended on the scale of cultivation [47]. Consequently, to ensure economic benefits, farmers began large-scale soybean planting, leading to soybeans becoming the dominant crop in northeast China. However, after China officially joined the World Trade Organization in December 2001, the volume of imported soybeans increased annually. As a result, the soybean planting area in northeast China declined, leading to drastic adjustments in the planting structure. Since 2002, maize has gradually replaced soybeans as the dominant crop. Concurrently, since the implementation of a temporary maize stockpiling policy by the government in 2009, maize prices increased, leading to a substantial expansion of the maize cultivation areas in agricultural reclamation zones. This shift resulted in an increase in maize-dominated cropping patterns (MCC, MMS) and a decrease in soybean-dominated cropping patterns (SCC, SSM). During this period, a significant portion of SCC and SSM converted to MCC.
Moreover, in 2015, the Ministry of Agriculture and Rural Affairs issued the “Guiding Opinions on Mazie Structure Adjustment in the “Sickle Bend” Area,” which proposed reducing the acreage of maize and expanding the scale of grain–legume rotations [17]. Consequently, this policy slowed the decrease in SCC and SSM while moderating the increase in MCC. Thus, a significant portion was converted to maize–soybean mixed cropping.
In 2019, the Ministry of Agriculture issued the “Implementation Plan for the Soybean Revitalization Plan” [48]. Field research conducted by the project team in rural areas of northeast China revealed that during the implementation of the rotation policy, local governments refined the subsidies for maize–soybean rotations by providing incentives for switching from maize to soybeans. In contrast, no subsidies were given for switching from soybeans to maize. This policy indirectly promoted an increase in MMS and a sharp decrease in SSM.
In a nutshell, agricultural cropping patterns were essentially economic behaviors. The evolution of cropping patterns tended to align with adjustments in the layout of agricultural productivity. Under the pressure of external factors such as international trade policies, the country countered by adjusting internal factors such as agricultural guidance policies and subsidy policies to maintain an overall balance in domestic agricultural productivity and the planting structure.

4.4. Driving Mechanisms of the Evolution of Grain Cropping Patterns

The evolution of cropping patterns in northeast China was a concentrated manifestation of the spatiotemporal evolution of the agricultural system in the region. This evolution was driven by the interplay of the natural environment, agricultural policies, and agricultural technologies (Figure 10).
The natural environment within the regional agricultural system shaped the regional differentiation of the evolution of cropping patterns. In contrast, the development of agricultural technologies created favorable conditions for the production of grain crops. Additionally, agricultural policies and other social factors influenced the transformation of farmers’ planting-related decision-making behaviors. Simultaneously, the external environment, including the environment of the agricultural industry and the international trade environment, constantly changed. Moreover, the region faced severe issues such as population loss, leading to labor shortages and changes in the population structure, and hindering economic development for the primary producers within the system. Under the combined influence of internal and external driving forces, the various elements within the regional agricultural system were continuously reorganized and restructured. Consequently, this led to spatiotemporal differentiation in agricultural productivity and, therefore, regular changes in cropping patterns through continuous temporal evolution.
Currently, the spatial patterns and differentiation characteristics of grain crops in northeast China have become increasingly prominent under the influence of agricultural policies and adjustments to the market economy. The region’s levels of specialization and industrialization have become more significant, leading to a more uniform planting structure. The most typical issue was the predominance of continuous cropping over crop rotation. Extensive research has indicated that long-term monoculture significantly compromises the physicochemical properties of the soil, consequently diminishing agricultural productivity [49,50,51]. In contrast, crop rotation, particularly maize–soybean rotation, effectively reinforces the soil’s physicochemical attributes and enhances the soil’s fertility, thereby facilitating increased and sustainable crop yields [11,12].
In traditional areas of continuous maize planting, soybean planting was a regulatory behavior adopted by farmers as a risk-avoidance rotation to prevent crop disasters, with little consideration for ecological significance. In September 2023, during an inspection in Heilongjiang Province, General Secretary Xi Jinping emphasized the need to transform the advantages of the resources, ecology, scientific research, industry, and location into new drivers and advantages for the development of northeast China. Simultaneously, in addressing global warming and ensuring economic benefits, future optimization of the mechanisms should build upon the “Implementation Plan for the Soybean Revitalization Plan.” It is imperative to further refine the subsidy structures for maize–soybean rotations, enhancing farmers’ enthusiasm for this practice. By integrating measures such as ecological compensation, the transformation and improvement of rotation patterns can be promoted, thereby facilitating the sustainable utilization of black soil.

4.5. Comparisons and Contrasts with Similar Studies, and Prospects

Compared with the study by Yang [27], this research also used the method of spatial overlay analysis to identify cropping patterns and also identified factors of the natural environment, agricultural economics, and policy as the primary drivers behind the evolution of crop cover types in northeast China. However, significant differences existed between this study and that of Yang et al. They focused on the spatial evolution of crop planting structures (such as maize–soybean–rice) and utilized a 5-year period to define cropping patterns, whereas this study used a 3-year period for its configurations of cropping patterns and explored the spatial changes in cropping patterns such as MCC, MST, and SCC.
Furthermore, this study delved into the intricate relationships among the various driving mechanisms and their impact on the evolution of cropping patterns. It also examined the scale of transitions and rates of evolution between different cropping patterns. While Yang et al. investigated changes within a single year, this research adopted a decadal perspective to analyze long-term changes in crop planting, providing a broader temporal context to understand agricultural transformations. In terms of spatial transitions, this study further investigated the migration of spatial patterns and the interconversion among different crop cover types and cropping patterns over various temporal sequences.
The crop classification data for northeast China from 2000 to 2021 used in this study were extracted using classified products as substitutes for actual field sampling points. Although these classifications achieved considerable consistency with statistical data (R2) even in years without samples, the early years exhibited lower R2 values, as indicated by Liu [34]. This discrepancy may stem from limitations such as the sensors’ resolution, the atmospheric conditions, and the algorithms used, which may not perfectly capture the ground truths.
To minimize these errors, a cross-validation approach was adopted, leveraging actual field data wherever possible, coupled with statistical yearbooks to assess and adjust the accuracy of the classified products. In extracting the crop coverage information for 2022, this study attempted to extract remote sensing images corresponding to specific years for which crop classification products were available. These extracted crop classification data were then validated for accuracy against existing products. If the accuracy was high, the classifier was applied to the study years lacking classification products. Throughout the classification process, field sampling data were integrated, and upon completion, accuracy checks were conducted in conjunction with statistical yearbooks to enhance the precision of the classifications as much as possible.

5. Conclusions

Based on MOD09A1 imagery and crop classification data from 2000–2021, and utilizing the application of spatial overlay analysis, seven types of cropping patterns were identified to measure the characteristics of the spatiotemporal differentiation of the planting structure and cropping patterns. The primary cropping patterns in northeast China included MCC, MSR, OP, and SCC. Although changes in each cropping pattern were active, the overall trend remained stable. The total area proportions of the main cropping patterns in each period were 94.73%, 88.76%, and 86.39%. In terms of the scale of transfer, the conversion of SCC to MCC was the dominant form of evolution in the cropping patterns from Period I to Period II. However, the dominant trend from Period II to Period III was the conversion of MCC to maize–soybean mixed cropping.
Over the past two decades, the planting structure in northeast China has undergone significant changes. Soybean-dominated planting has gradually been replaced by maize planting. There has been a shift from MCC and SCC to MSR, particularly in the northern regions. Additionally, MST, MMS, and SSM have increasingly been converted to MCC, especially in the hinterland of the Songnen Plain, creating an internal circulation pattern. The regionalization of rice planting has also become more prominent, with large contiguous areas concentrated in the Sanjiang Plain and Liaohe Plain, and along the major tributaries in northeast China.
Since 2000, the agricultural structure and layout in northeast China have undergone significant adjustments due to the interplay of natural environmental factors, agricultural policies, and technological advancements, thereby profoundly influencing the evolution of regional cropping patterns. The natural environment directly impacts the evolution of cropping patterns, shaping the spatiotemporal differentiation of these patterns at a macro-level. Social factors such as international trade policies, agricultural guidance policies, and subsidies drive transformative shifts in farming decisions, indirectly influencing changes in the types of cropping pattern. Furthermore, the advancement of agricultural technologies has provided vital support for large-scale crop cultivation, directly affecting the scale of transformations of cropping patterns.

Author Contributions

Conceptualization, G.D. and L.H.; methodology, G.D. and L.H.; validation, G.D., L.H., L.Y. and B.F.; formal analysis, L.H., L.Y. and B.F.; resources, L.H. and G.D.; data curation, L.H.; writing—original draft preparation, L.H.; writing—review and editing, G.D. and L.H.; visualization, L.H., L.Y. and B.F.; supervision, G.D.; project administration, G.D.; acquisition of funding, G.D. All authors have read and agreed to the published version of the manuscript.

Funding

We extend our gratitude to the National Social Science Foundation of China (21BJY209).

Institutional Review Board Statement

Not applicable.

Informed Consent Statement

Informed consent was obtained from all subjects involved in the study.

Data Availability Statement

The data presented in this study are available on request from the corresponding author. The data are not publicly available due to privacy or other restrictions.

Acknowledgments

We thank our colleagues for their insightful comments on an earlier version of this manuscript.

Conflicts of Interest

The authors declare no conflicts of interest.

References

  1. Chinese Academy of Sciences. White Paper on Black Land in Northeast China. 2020. Available online: https://www.cas.cn/yw/202107/t20210709_4797892.shtml (accessed on 11 July 2024).
  2. Metze, D.; Schnecker, J.; de Carlan, C.L.N.; Bhattarai, B.; Verbruggen, E.; Ostonen, I.; Janssens, I.A.; Sigurdsson, B.D.; Hausmann, B.; Kaiser, C.; et al. Soil Warming Increases the Number of Growing Bacterial Taxa but Not Their Growth Rates. Sci. Adv. 2024, 10, eadk6295. [Google Scholar] [CrossRef]
  3. Kazemi Garajeh, M.; Haji, F.; Tohidfar, M.; Sadeqi, A.; Ahmadi, R.; Kariminejad, N. Spatiotemporal Monitoring of Climate Change Impacts on Water Resources Using an Integrated Approach of Remote Sensing and Google Earth Engine. Sci. Rep. 2024, 14, 5469. [Google Scholar] [CrossRef]
  4. Abbass, K.; Qasim, M.Z.; Song, H.; Murshed, M.; Mahmood, H.; Younis, I. A Review of the Global Climate Change Impacts, Adaptation, and Sustainable Mitigation Measures. Environ. Sci. Pollut. Res. 2022, 29, 42539–42559. [Google Scholar] [CrossRef] [PubMed]
  5. Wang, Y.; Jiang, Y.; Zhu, G.; Wang, Y.; Jiang, Y.; Zhu, G. Spatio-Temporal Evaluation of Multi-Scale Cultivated Land System Resilience in Black Soil Region from 2000 to 2019: A Case Study of Liaoning Province, Northeast China. Chin. Geogr. Sci. 2024, 34, 168–180. [Google Scholar] [CrossRef]
  6. Kong, D.; Chu, N.; Luo, C.; Liu, H. Analyzing Spatial Distribution and Influencing Factors of Soil Organic Matter in Cultivated Land of Northeast China: Implications for Black Soil Protection. Land 2024, 13, 1028. [Google Scholar] [CrossRef]
  7. Yanxing, H.; Fengbao, Z.; Mingyi, Y.; Yanxing, H.; Fengbao, Z.; Mingyi, Y. Effects of Soil Erosion on Organic Carbon Fractions in Black Soils in Sloping Farmland of Northeast China by Using137 Cs Tracer Measurements. Trans. Chin. Soc. Agric. Eng. 2021, 37, 60–68. [Google Scholar] [CrossRef]
  8. Xu, W.; Wan, S.; Liu, J. Introduction to Agriculture; China Agriculture University Press: Beijing, China, 2018. [Google Scholar]
  9. Du, G.; Zhang, R.; Liang, C.; Hu, M. Remote Sensing Extraction and Spatial Pattern Analysis of Cropping Patterns in Black Soil Region of Northeast China at County Level. Trans. Chin. Soc. Agric. Eng. 2021, 37, 133–141. [Google Scholar]
  10. The Ministry of Agriculture of the People’s Republic of China. National Planting Industry Structure Adjustment Plan. Gaz. Minist. Agric. Rural Aff. People’s Repub. China 2016, 05, 47–55. [Google Scholar]
  11. Huang, X.; Yuan, J.; Chen, Y.; Yang, X.; Lu, W.; Ding, S.; Jiang, Y.; Zhou, X.; Mi, G.; Xu, J.; et al. Long-Term Cropping Rotation with Soybean Enhances Soil Health as Evidenced by Improved Nutrient Cycles through Keystone Phylotypes Interaction. Soil Ecol. Lett. 2024, 6, 240251. [Google Scholar] [CrossRef]
  12. Yuan, M.; Bi, Y.; Han, D.; Wang, L.; Wang, L.; Fan, C.; Zhang, D.; Wang, Z.; Liang, W.; Zhu, Z.; et al. Long-Term Corn–Soybean Rotation and Soil Fertilization: Impacts on Yield and Agronomic Traits. Agronomy 2022, 12, 2554. [Google Scholar] [CrossRef]
  13. Acharya, J.; Moorman, T.B.; Kaspar, T.C.; Lenssen, A.W.; Robertson, A.E. Cover Crop Rotation Effects on Growth and Development, Seedling Disease, and Yield of Corn and Soybean. Plant Dis. 2020, 104, 677–687. [Google Scholar] [CrossRef]
  14. The Ministry of Agriculture of the People’s Republic of China. National Agricultural Modernization Plan. China Agric. Informat. 2016, 15–25. [Google Scholar]
  15. Ministry of Ecology and Environment the People’s Republic of China. Law of the People’s Republic of China on the Protection of Black Soil. Agric. Compr. Dev. China 2022, 299, 4–7. [Google Scholar]
  16. State Council of the People’s Republic of China. Exploring the Implementation of a Pilot Program for Arable Land Rotation Fallow System; People’s Daily: Beijing, China, 2016.
  17. Ministry of Agriculture and Rural Affairs of the People’s Republic of China. Guidance of the Ministry of Agriculture on the Structural Adjustment of Maize in the “Sickle Bend” Area. Bull. Minist. Agric. People’s Repub. China 2015, 8–12. [Google Scholar]
  18. Gao, L.; Teng, K.; Chen, H. Analysis of “Lishu Model” of Black Land Protection in Jilin Province. Shanxi Agric. Econ. 2021, 20, 104–106. [Google Scholar]
  19. Qiu, B.; Hu, X.; Chen, C.; Tang, Z.; Yang, P.; Zhu, X.; Yan, C.; Jian, Z. Maps of Cropping Patterns in China during 2015–2021. Sci. Data 2022, 9, 479. [Google Scholar] [CrossRef]
  20. Almudena Martín Montero, M.A.C.S. Mapping Multi-Year Cropping Patterns in Small Irrigation Districts from Time-Series Analysis of Landsat TM Images—Dialnet. Eur. J. Agron. 2005, 23, 159–169. [Google Scholar]
  21. Panigrahy, S.; Chakraborty, M.; Sharma, S.A.; Kundu, N.; Ghose, S.C.; Pal, M. Early Estimation of Rice Area Using Temporal ERS-1 Synthetic Aperture Radar Data a Case Study for the Howrah and Hughly Districts of West Bengal, India. Int. J. Remote Sens. 1997, 18, 1827–1833. [Google Scholar] [CrossRef]
  22. Gan, C.; Qiu, B.; Zhang, J. Mapping Paddy Rice Planting Patterns Based on Sentinel-1/2. J. Geo-Inf. Sci. 2023, 25, 153–162. [Google Scholar]
  23. Guo, X.; Li, C.; Liu, Y.; Al, E. Remote Sensing Monitoring of Single and Double Cropping in Groundwater Funnel Area of Hebei Province Based on Sentinel-2 Time Series. Jiangsu Agric. Sci. 2023, 51, 182–190. [Google Scholar]
  24. Ullah, F.; Liu, J.; Shafique, M.; Ullah, S.; Rajpar, M.N.; Ahmad, A.; Shahzad, M. Quantifying the Influence of Chashma Right Bank Canal on Land-Use/Land-Cover and Cropping Pattern Using Remote Sensing. Ecol. Indic. 2022, 143, 109341. [Google Scholar] [CrossRef]
  25. Du, G.; Yao, L.; Hou, D. The Spatio-Temporal Changes of Cropping Patterns in the Black Soil Area of China: Lessons from Wangkui County. Front. Environ. Sci. 2022, 10, 981721. [Google Scholar] [CrossRef]
  26. Du, G.; Yao, L.; Han, L.; Bonoua, F. What Should Be Learned from the Dynamic Evolution of Cropping Patterns in the Black Soil Region of Northeast China? A Case Study of Wangkui County, Heilongjiang Province. Land 2023, 12, 1574. [Google Scholar] [CrossRef]
  27. Yang, Z.; Chu, L.; Wang, C.; Pan, Y.; Su, W.; Qin, Y.; Cai, C. What Drives the Spatial Heterogeneity of Cropping Patterns in the Northeast China: The Natural Environment, the Agricultural Economy, or Policy? Sci. Total Environ. 2023, 905, 167810. [Google Scholar] [CrossRef] [PubMed]
  28. Song, G.; Zhang, H. Spatial Reconstruction of Farmland Rotation and Fallow in the Typical Black Soil Region of Northeast China. J. Nat. Resour. 2022, 37, 2231–2246. [Google Scholar] [CrossRef]
  29. Dong, S.; Wang, X.; Chen, Y. Plant Production; Higher Education Press: Beijing, China, 2003. [Google Scholar]
  30. Wang, H.; Liu, D.; Chen, P.; Al, E. Distribution of Maturity Types of Maize Based on Accumulated Temperature Rezone in Northeast China. Chin. J. Agric. Resour. Reg. Plan. 2022, 43, 102–112. [Google Scholar]
  31. Shi, S.; Li, W.; Ding, Y.; Al, E. Spatiotemporal Evolution and Influencing Factors of Vegetation in Northeast China. China Environ. Sci. 2023, 43, 276–289. [Google Scholar]
  32. Zhang, T.; Han, Y. Spatial Distribution of Sloping Croplands in Northeast China and Its Implication on Soil and Water Conservation. Res. Soil Water Conserv. 2018, 25, 190–194, 389. [Google Scholar]
  33. Feng, L.; Lei, G. Study on Spatial-Temporal Evolution Characteristics and Functional Zoning of Ecosystem Services and Trade-Offs/Synergies Relationships in Northeastern China. China Land Sci. 2023, 37, 100–113. [Google Scholar]
  34. Liu, Y.; Wang, J. Revealing Annual Crop Type Distribution and Spatiotemporal Changes in Northeast China Based on Google Earth Engine. Remote Sens. 2022, 14, 4056. [Google Scholar] [CrossRef]
  35. Hong, Y.; Wang, D.; Wang, Z.; Chen, Q.; Huang, Y.; Liu, D.; Zhu, Q.; Yan, D.; Lv, H. Identification of Key Indicators of Water Ecological Health and Establishment of Comprehensive Evaluation System of the Sunan Cana. Acta Sci. Circumstantiae 2023, 43, 407–417. [Google Scholar]
  36. Zhang, C.; Yang, G.; Sun, X.; Qin, Y.; Chen, D.; Luo, L. Stages Division and Characteristics Measurement of Land Use Change in the Middle Reaches of The Yangtze River. J. Soil Water Conserv. 2024, 38, 231–241. [Google Scholar]
  37. Jia, Q.; Yin, Z.; Liu, Y.; Zhang, C.; Yan, H. Function Identification and Spatiotemporal Evolution of “Ecological-Production-Living”in Central Plains Urban Agglomeration from 1980 to 2020. Adm. Tech. Environ. Monit. 2023, 35, 12–17. [Google Scholar]
  38. Nautiyal, S.; Kaechele, H.; Tikhile, P.; Subbanna, S.; Baksi, S. Study on Land Use Dynamics: Appropriate Methods for Change Estimation in Social Science Research. Earth Syst. Environ. 2017, 1, 27. [Google Scholar] [CrossRef]
  39. Liping, C.; Yujun, S.; Saeed, S. Monitoring and Predicting Land Use and Land Cover Changes Using Remote Sensing and GIS Techniques—A Case Study of a Hilly Area, Jiangle, China. PLoS ONE 2018, 13, e0200493. [Google Scholar] [CrossRef] [PubMed]
  40. Du, W.; Zhao, X.; Zhao, Z.; Chen, C.; Qian, D. Assessment and Dynamic Mechanisms of the Land-Use Dominant Morphology Transition: A Case Study of Hainan Province, China. Environ. Monit. Assess. 2022, 194, 419. [Google Scholar] [CrossRef] [PubMed]
  41. Berdimbetov, T.; Shelton, S.; Pushpawela, B.; Rathnayake, U.; Koshim, A.G.; Yegizbayeva, A.; Nietullaeva, S. Use of Intensity Analysis and Transfer Matrix to Characterize Land Conversion in the Aral Sea Basin under Changing Climate. Model. Earth Syst. Environ. 2024, 10, 4717–4729. [Google Scholar] [CrossRef]
  42. Li, Y.; Yang, S.; Hong, W.; Su, H.; Luo, Y. Research on the Spatial and Temporal Distribution of Industrial Park in Xining City from the Perspective of Color Steel Plate Building Complex. Remote Sens. Nat. Resour. 2024, 36, 239–247. [Google Scholar]
  43. Shen, F.; Yuan, J.; Huang, W.; Cha, F. Analysis on Spatiotemporal Characteristics and Driving Forces of Hefei Urban Expansion Based on Geo-Informatic Map. Resour. Environ. Yangtze Basin 2015, 24, 202–211. [Google Scholar]
  44. Yang, Z.; Chu, L.; Xiao, Y.; Wang, C.; Tan, W.; Wang, T.; Cai, C. Spatiotemporal Changes and Driving Forces of Main Grain Crop Planting Types in Northeast China from 2017 to 2021. Resour. Sci. 2023, 45, 966–979. [Google Scholar] [CrossRef]
  45. Qin, Y. The Center of Gravity of China’s Agricultural Machinery Manufacturing Industry Has Shifted to the Northeast China. Agric. Mach. Mark. 2011, 07, 30–32. [Google Scholar]
  46. Guo, B.; Fang, X. Analysis on the Development Situation of Agricultural Mechanization in Northeast China. J. Chin. Agric. Mech. 2015, 36, 324–327. [Google Scholar]
  47. dos Santos Canalli, L.B.; da Costa, G.V.; Volsi, B.; Leocádio, A.L.M.; Neves, C.S.V.J.; Telles, T.S. Production and Profitability of Crop Rotation Systems in Southern Brazil. Semin. Ciências Agrárias 2020, 41, 2541–2554. [Google Scholar] [CrossRef]
  48. Ministry of Ecology and Environment the People’s Republic of China. Plan to Rejuvenate Soybean Farming. Bull. Minist. Agric. People’s Repub. China 2019, 3, 51–53. [Google Scholar]
  49. Gikonyo, F.N.; Dong, X.; Mosongo, P.S.; Guo, K.; Liu, X. Long-Term Impacts of Different Cropping Patterns on Soil Physico-Chemical Properties and Enzyme Activities in the Low Land Plain of North China. Agronomy 2022, 12, 471. [Google Scholar] [CrossRef]
  50. Li, Y.; Shi, C.; Wei, D.; Gu, X.; Wang, Y.; Sun, L.; Cai, S.; Hu, Y.; Jin, L.; Wang, W. Soybean Continuous Cropping Affects Yield by Changing Soil Chemical Properties and Microbial Community Richness. Front. Microbiol. 2022, 13, 1083736. [Google Scholar] [CrossRef]
  51. Wei, Z.; Wang, H.; Ma, C.; Li, S.; Wu, H.; Yuan, K.; Meng, X.; Song, Z.; Fang, X.; Zhao, Z. Unraveling the Impact of Long-Term Rice Monoculture Practice on Soil Fertility in a Rice-Planting Meadow Soil: A Perspective from Microbial Biomass and Carbon Metabolic Rate. Microorganisms 2022, 10, 2153. [Google Scholar] [CrossRef]
Figure 1. An overview of the study area.
Agriculture 14 01443 g001
Figure 2. The technological path of data acquisition and processing.
Agriculture 14 01443 g002
Figure 3. Research framework for the spatiotemporal dynamics and evolution of grain cropping patterns in northeast China.
Agriculture 14 01443 g003
Figure 4. Mechanisms of recognizing cropping patterns. MCC, continuous maize cropping; RCC, continuous rice cropping; SCC, continuous soybean cropping; MSR, maize–soybean rotation; MST, maize–soybean 2-year rotation; MMS, maize–maize–soybean 3-year rotation; SSM, soybean–soybean–maize 3-year rotation; OP, other cropping patterns.
Agriculture 14 01443 g004
Figure 5. Evolution of the structure of grain cropping in northeast China, 2000–2002, 2010–2012, and 2020–2022.
Agriculture 14 01443 g005
Figure 6. Spatial layout of the cropping structure for 2000–2002, 2010–2012, and 2020–2022.
Agriculture 14 01443 g006
Figure 7. Distribution map of cropping patterns in northeast China from Period I to Period III.
Agriculture 14 01443 g007
Figure 8. Schematic diagram of cropping patterns’ transitions during Periods I to III.
Agriculture 14 01443 g008
Figure 9. Spatial trajectories of changes in cropping patterns between Periods I and III.
Agriculture 14 01443 g009
Figure 10. The evolutionary drivers of cropping patterns in northeast China.
Agriculture 14 01443 g010
Table 1. The change in cropping patterns between Periods I and III.
Type of Cropping PatternPeriod IPeriod IIPeriod IIILand Use Dynamic Degree (%)
Area (km2)Ratio (%)Area (km2)Ratio (%)Area (km2)Ratio (%)Period I–IIPeriod II–IIIPeriod I–III
MCC56,231.5015.22156,449.2542.21173,083.5045.8317.821.0620.78
RCC19,460.505.2741,645.7511.2451,371.2513.6011.402.3416.40
SCC108,296.0029.3151,106.2513.7929,342.507.77−5.28−4.26−7.29
MST20,486.755.5410,719.752.8914,417.003.82−4.773.45−2.96
MMS21,331.505.7721,503.255.8024,149.256.390.081.231.32
SSM63,169.5017.1028,253.757.6216,021.754.24−5.53−4.33−7.46
OP80,519.0021.7960,959.7516.4569,250.5018.34−2.431.36−1.40
Total369,494.75100.00370,637.75100.00377,635.75100.000.020.090.11
Disclaimer/Publisher’s Note: The statements, opinions and data contained in all publications are solely those of the individual author(s) and contributor(s) and not of MDPI and/or the editor(s). MDPI and/or the editor(s) disclaim responsibility for any injury to people or property resulting from any ideas, methods, instructions or products referred to in the content.

