Article

Inversion of Cotton Soil and Plant Analytical Development Based on Unmanned Aerial Vehicle Multispectral Imagery and Mixed Pixel Decomposition

by
Bingquan Tian
1,2,
Hailin Yu
1,2,
Shuailing Zhang
1,2,
Xiaoli Wang
1,2,
Lei Yang
1,2,
Jingqian Li
1,2,
Wenhao Cui
1,2,
Zesheng Wang
2,3,
Liqun Lu
2,4,
Yubin Lan
1 and
Jing Zhao
1,2,*
1
School of Agricultural Engineering and Food Science, Shandong University of Technology, Zibo 255000, China
2
Shandong-Binzhou Cotton Technology Backyard, Binzhou 256600, China
3
Nongxi Cotton Cooperative, Binzhou 256600, China
4
School of Transportation and Vehicle Engineering, Shandong University of Technology, Zibo 255000, China
*
Author to whom correspondence should be addressed.
Agriculture 2024, 14(9), 1452; https://doi.org/10.3390/agriculture14091452
Submission received: 26 June 2024 / Revised: 20 July 2024 / Accepted: 8 August 2024 / Published: 25 August 2024
(This article belongs to the Special Issue Application of UAVs in Precision Agriculture—2nd Edition)

Abstract

:
In order to improve the accuracy of multispectral image inversion of soil and plant analytical development (SPAD) of the cotton canopy, image segmentation methods were utilized to remove the background interference, such as soil and shadow in UAV multispectral images. UAV multispectral images of cotton bud stage canopies at three different heights (30 m, 50 m, and 80 m) were acquired. Four methods, namely vegetation index thresholding (VIT), supervised classification by support vector machine (SVM), spectral mixture analysis (SMA), and multiple endmember spectral mixture analysis (MESMA), were used to segment cotton, soil, and shadows in the multispectral images of cotton. The segmented UAV multispectral images were used to extract the spectral information of the cotton canopy, and eight vegetation indices were calculated to construct the dataset. Partial least squares regression (PLSR), Random forest (FR), and support vector regression (SVR) algorithms were used to construct the inversion model of cotton SPAD. This study analyzed the effects of different image segmentation methods on the extraction accuracy of spectral information and the accuracy of SPAD modeling in the cotton canopy. The results showed that (1) The accuracy of spectral information extraction can be improved by removing background interference such as soil and shadows using four image segmentation methods. The correlation between the vegetation indices calculated from MESMA segmented images and the SPAD of the cotton canopy was improved the most; (2) At three different flight altitudes, the vegetation indices calculated by the MESMA segmentation method were used as the input variable, and the SVR model had the best accuracy in the inversion of cotton SPAD, with R2 of 0.810, 0.778, and 0.697, respectively; (3) At a flight altitude of 80 m, the R2 of the SVR models constructed using vegetation indices calculated from images segmented by VIT, SVM, SMA, and MESMA methods were improved by 2.2%, 5.8%, 13.7%, and 17.9%, respectively, compared to the original images. Therefore, the MESMA mixed pixel decomposition method can effectively remove soil and shadows in multispectral images, especially to provide a reference for improving the inversion accuracy of crop physiological parameters in low-resolution images with more mixed pixels.

1. Introduction

Cotton is one of the main cash crops in the world, and it is an important strategic material related to the national economy and people’s livelihood [1,2]. Chlorophyll is the main pigment of cotton photosynthesis, which is closely related to cotton growth conditions and yield [3,4]. In agricultural and plant science research, the soil and plant analytical development (SPAD) value is often used to assess the relative chlorophyll content of plants. Accurate monitoring of chlorophyll content during cotton growth provides scientific guidance for cotton field management and yield estimation [5].
Data acquired by UAVs that can enable accurate inversion of crop physiochemical parameters are widely used in precision agriculture research [6,7,8]. Qu et al. [9] constructed a neural network model using five vegetation indices to realize the inversion of soil and plant analytical development (SPAD) of moso bamboo. Wang et al. [10] conducted SPAD inversion for cotton using a UAV-mounted multispectral camera and input the optimal combination of vegetation indices into a multiple linear regression model for inversion, with a model R2 of 0.753. Ji et al. [11] screened six vegetation indices by inverting the cotton SPAD through multispectral images and established different machine-learning models to realize an accurate estimation of cotton SPAD with an R2 of 0.758. The vegetation index strengthens the signal of vegetation to a certain extent and attenuates the interference of the background on the spectral characteristics of the crop, which makes the inversion of crop parameters more accurate [12].
UAV imagery is affected by crop planting density and canopy structure, and there are interfering factors such as soil and shadows. Therefore, removing the effect of these backgrounds on the spectral reflectance of crops is particularly important for accurate inversion of crop parameters [13,14]. Deng et al. [15] utilized the excess green minus excess red (ExG-ExR) vegetation index to threshold segment multispectral images to remove background noise such as soil and shadows, thus improving the R2 of the inversion model of winter wheat chlorophyll content from 0.79 to 0.85. Li et al. [16] used the normalized difference canopy shadow index (NDCSI) combined with threshold segmentation to mask the canopy shadow of apple trees, which improved the R2 of the SVM model for nitrogen content inversion results from 0.607 to 0.774. Meng et al. [17] used SVM-supervised classification to mask the soil background and constructed a partial least squares regression model to realize a high-precision inversion of SPAD for maize canopies with an R2 of 0.806. Zhang et al. [18] found that when using supervised classification methods for feature recognition in cotton fields at different resolutions, the classification accuracy showed a significant decrease due to the increase in the probability of the occurrence of mixed pixels.
With an increase in the UAV flight altitude, the image resolution decreases. The presence of numerous mixed pixels between the crop and background, such as shadow and soil, significantly impacts the accuracy of crop parameter inversion [19,20,21]. The mixed pixel decomposition model subdivides the mixed pixels into different components and analyzes their area proportions, i.e., the abundance of each component, to achieve accurate feature segmentation, thereby improving the accuracy of crop parameter inversion [22,23]. Yu et al. [24] acquired hyperspectral images of rice during the tillering stage from a flight altitude of 100 m. The images were unmixed using a linear decomposition model, which minimized the influence of mixed water column portions on rice spectra, and accurate spectral reflectance of rice was obtained after unmixing. Li et al. [25] used different models for mixed pixel decomposition of ETM+ multispectral images, and the results showed that the BP neural network mixed pixel decomposition model outperformed the linear mixed pixel decomposition model, with a classification accuracy error of 1.8%. Su et al. [26] acquired multispectral images from a UAV flying at an altitude of 100 m and used MESMA to obtain leaf and spike abundance maps of rice, which were combined with the normalized difference red edge (NDRE) vegetation index to estimate the optimal accuracy of rice yield with an R2 of 0.72. Gong et al. [27] acquired multispectral images of rapeseed at a UAV flight altitude of 100 m, unmixed the images using a linear mixed pixels model, and improved the accuracy of rapeseed yield estimation by combining vegetation indices and leaf abundance. Duan et al. [28] acquired rice multispectral images at a UAV flight altitude of 60 m, used a linear mixed pixel decomposition model to obtain abundance maps, and combined the green chlorophyll index (CIgreen) with the abundance maps of rice spikes to estimate rice yields, which increased the R2 of the inversion model compared to that based on the use of vegetation index alone from 0.315 to 0.615.
Currently, inversion studies for crop SPAD use the vegetation index threshold (VIT) and support vector machine (SVM) supervised classification to remove the background [29]. In high-resolution images, SVM and VIT can effectively remove the interference of the background. However, in low-resolution images, it is not possible to accurately distinguish crop leaves from backgrounds such as soil and shadows, which may affect the inversion accuracy of crop parameters. Cotton multispectral images contain background pixels, which affect the spectral reflectance of the extracted sample points. Resolving the mixed pixels can improve the accuracy of the inversion of cotton SPAD. In this paper, mixed pixel decomposition methods are proposed to remove backgrounds from cotton images, and the vegetation indices of the original image and the image after removing the backgrounds are calculated as input variables, respectively, and the inversion model of cotton SPAD is constructed based on various machine learning algorithms. In this study, the mixed pixel decomposition method was used to remove the background of soil and shadow from multi-spectral images with different resolutions, which provided a basis for improving the accuracy of crop physiological parameter inversion from low-resolution UAV images. The main contributions of this paper are as follows:
(1) This study addresses the impact of numerous mixed pixels in low-resolution UAV remote sensing images on the accuracy of crop SPAD inversion. Methods of mixed pixel decomposition are proposed to segment the low-resolution images and extract features, thereby enhancing the accuracy of SPAD inversion;
(2) The enhanced SMA method was used to segment cotton from soil, shadows, and other backgrounds in multispectral UAV remote sensing images. MESMA was compared with traditional segmentation methods, revealing that it achieved the highest accuracy in segmenting multispectral images;
(3) At different flight altitudes, multiple machine-learning models were used to estimate cotton SPAD, analyzing the impact of image segmentation accuracy on SPAD inversion. The results indicate that the lower the resolution of UAV images, the greater the improvement in cotton SPAD inversion accuracy achieved by the MESMA method.

2. Materials and Methods

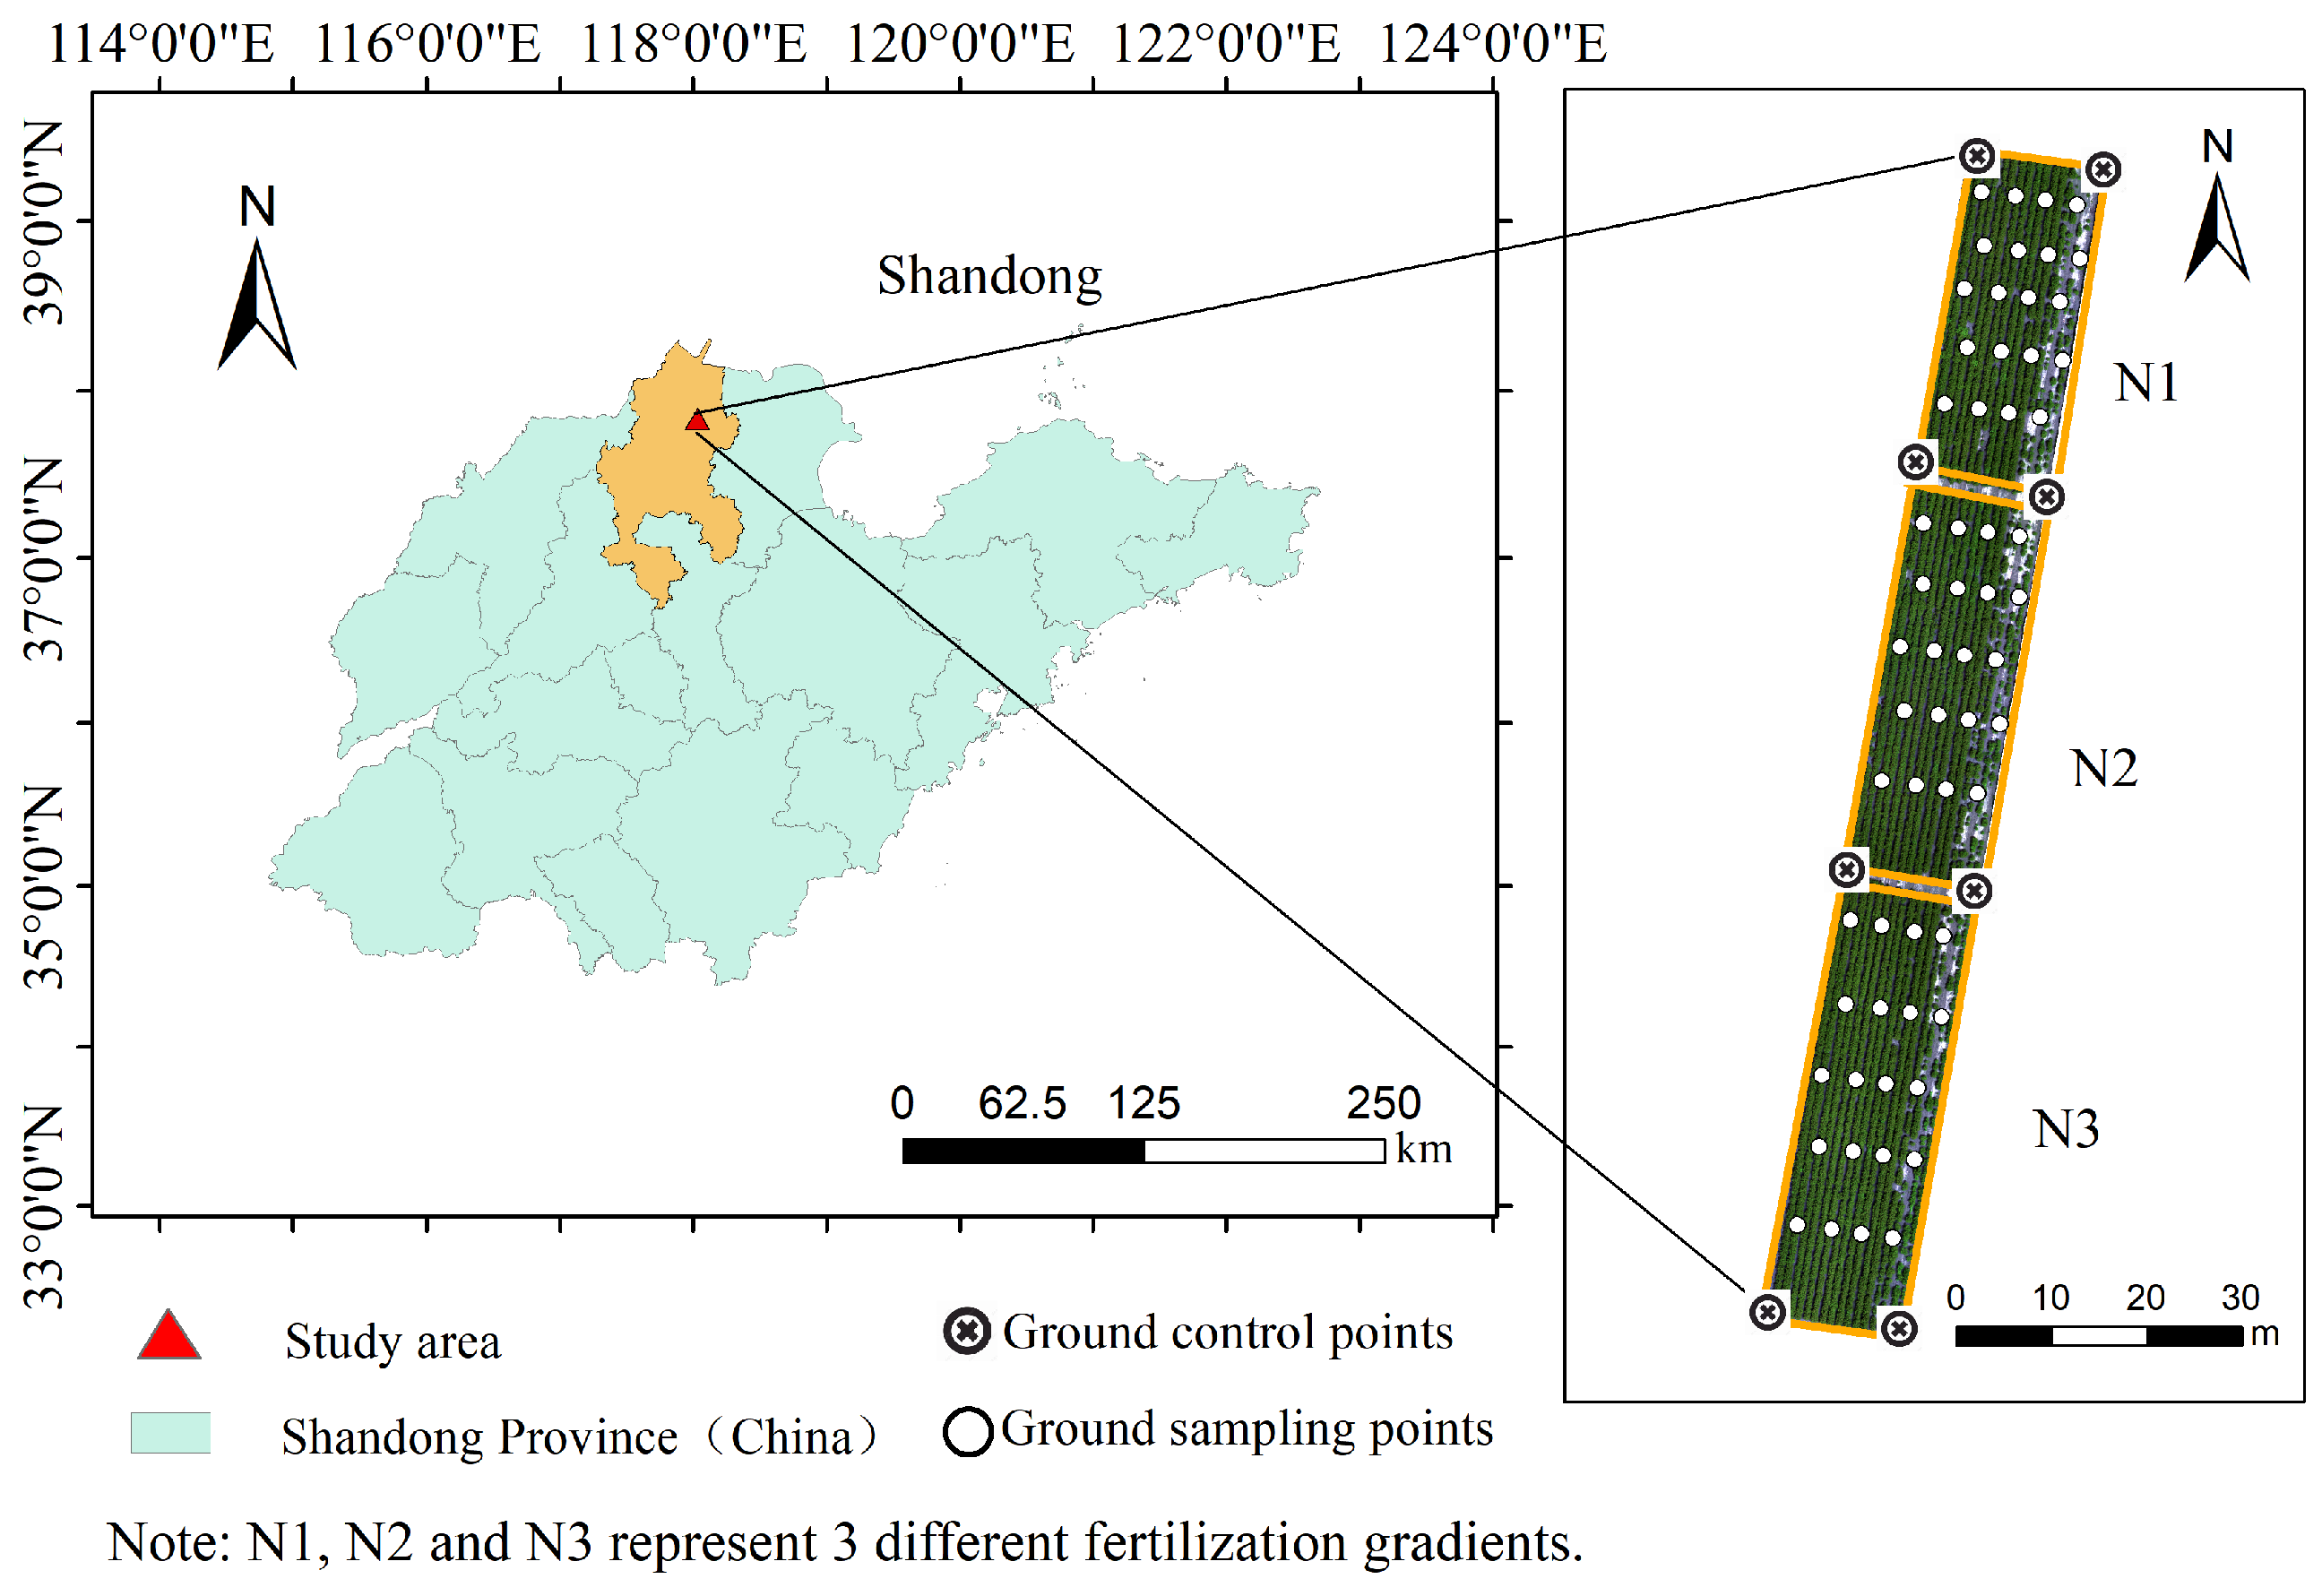
2.1. Experimental Design

The study area was located in the National Agricultural Science and Technology Park of Binzhou, Shandong Province (37°34′ N, 118°30′ E), which has a temperate continental monsoon climate. The average annual temperature is 14–15 °C, and the average annual rainfall is 600–800 mm. The water and heat conditions are moderate, and the sunshine is sufficient, which is suitable for growing cotton. In order to analyze the effects of different fertilizer rates on the chlorophyll content of cotton, three different nitrogen application gradients were set up: 120 kg/hm2 in the N1 region, 240 kg/hm2 in the N2 region, and 320 kg/hm2 in the N3 region. The fertilization program was 30% base fertilizer and 70% topdressing fertilizer, and field management followed the local best practices and included timely weeding, pest control, and disease prevention measures. Nitrogen, as an important nutrient element, has a great influence on the growth and development of leaves and the content of chlorophyll. In order to obtain rich data gradients and have universality to various application amounts, different nitrogen fertilizer treatments were applied to cotton test areas. Twenty sample sites were set up for each fertilization gradient, for a total of 60 sample sites. The location of the study area and the experimental setup are shown in Figure 1.

2.2. UAV Image Acquisition and Preprocessing

The DJI M210-RTK UAV equipped with an MS600Pro multispectral camera (Yusense, Inc., Qingdao, China) was used to acquire multispectral images of the cotton canopy. The multispectral camera contains six band channels: blue (450 nm), green (550 nm), red (660 nm), red edge (710 nm), nir1 (840 nm), and nir2 band (940 nm). The DJI M300 UAV equipped with a Zenmuse P1 was used to acquire the visible image of cotton, which was used as the reference image to align the geographic information of the multispectral image. Experimental instruments are shown in Figure 2.
Cotton canopy data collection was conducted during a clear, cloudless midday (10:00–14:00) with stable solar radiation on 10 July 2023 at the cotton bud stage. The UAV acquired multispectral images at heights of 30 m, 50 m, and 80 m, with a consistent flight speed of 2 m/s and 80% overlap in both heading and side directions. The ground resolutions were 1.8 cm/pixel, 3.4 cm/pixel, and 5.2 cm/pixel, respectively. The gray plate was photographed before and after the flight to correct the image reflectivity. The UAV acquired visible images at a flight altitude of 30 m, a flight speed of 3 m/s, a ground resolution of 0.4 cm/pixel, and other flight parameters were the same as for multispectral images. Eight ground control points were set up in the test area, and the RTK surveyor was utilized to obtain the latitude and longitude information of the study area, which was applied to the Pix4Dmapper (Version 4.5.6) to carry out the UAV image splicing, geometric correction, and spectral correction to improve the quality of the image data.

2.3. Cotton Ground Data Collection

Sixty sampling points were evenly selected in the study area. The SPAD of the cotton canopy was determined using the SPAD-502Plus instrument (Konica Minolta Holdings, Inc., Tokyo, Japan). One cotton plant was selected for each sampling point, and five positions were randomly selected on the canopy leaves, avoiding the leaf veins for measurement, and the mean value was calculated as the SPAD of the sample point. The RTK surveyor was utilized to record the coordinate information of each sample point and determine the exact location of the sampling point in the UAV multispectral image. As shown in Table 1, the highest mean SPAD value for cotton in the N2 region was 50.86, and the lowest mean SPAD value for cotton in the N1 region was 46.94. The CV value of cotton in the whole region was 6.43%, which was higher than that in each subregion.

2.4. UAV Multi-Source Remote Sensing Image Alignment

Multispectral images contain abundant spectral information, and multispectral vegetation indices can be constructed from the reflectance across various spectral bands to effectively distinguish between different features. The relatively low ground resolution of UAV multispectral imagery and the high ground resolution of visible imagery provide significant advantages in recognizing different feature classes and contours. In this paper, visible images were utilized as the reference images. The feature points were extracted by a manual visual interpretation method, and the root-mean-square error of feature points between images was calculated. The geographic information of multispectral images was aligned using the polynomial method and nearest neighbor resampling so that the alignment error was less than 1 image element.

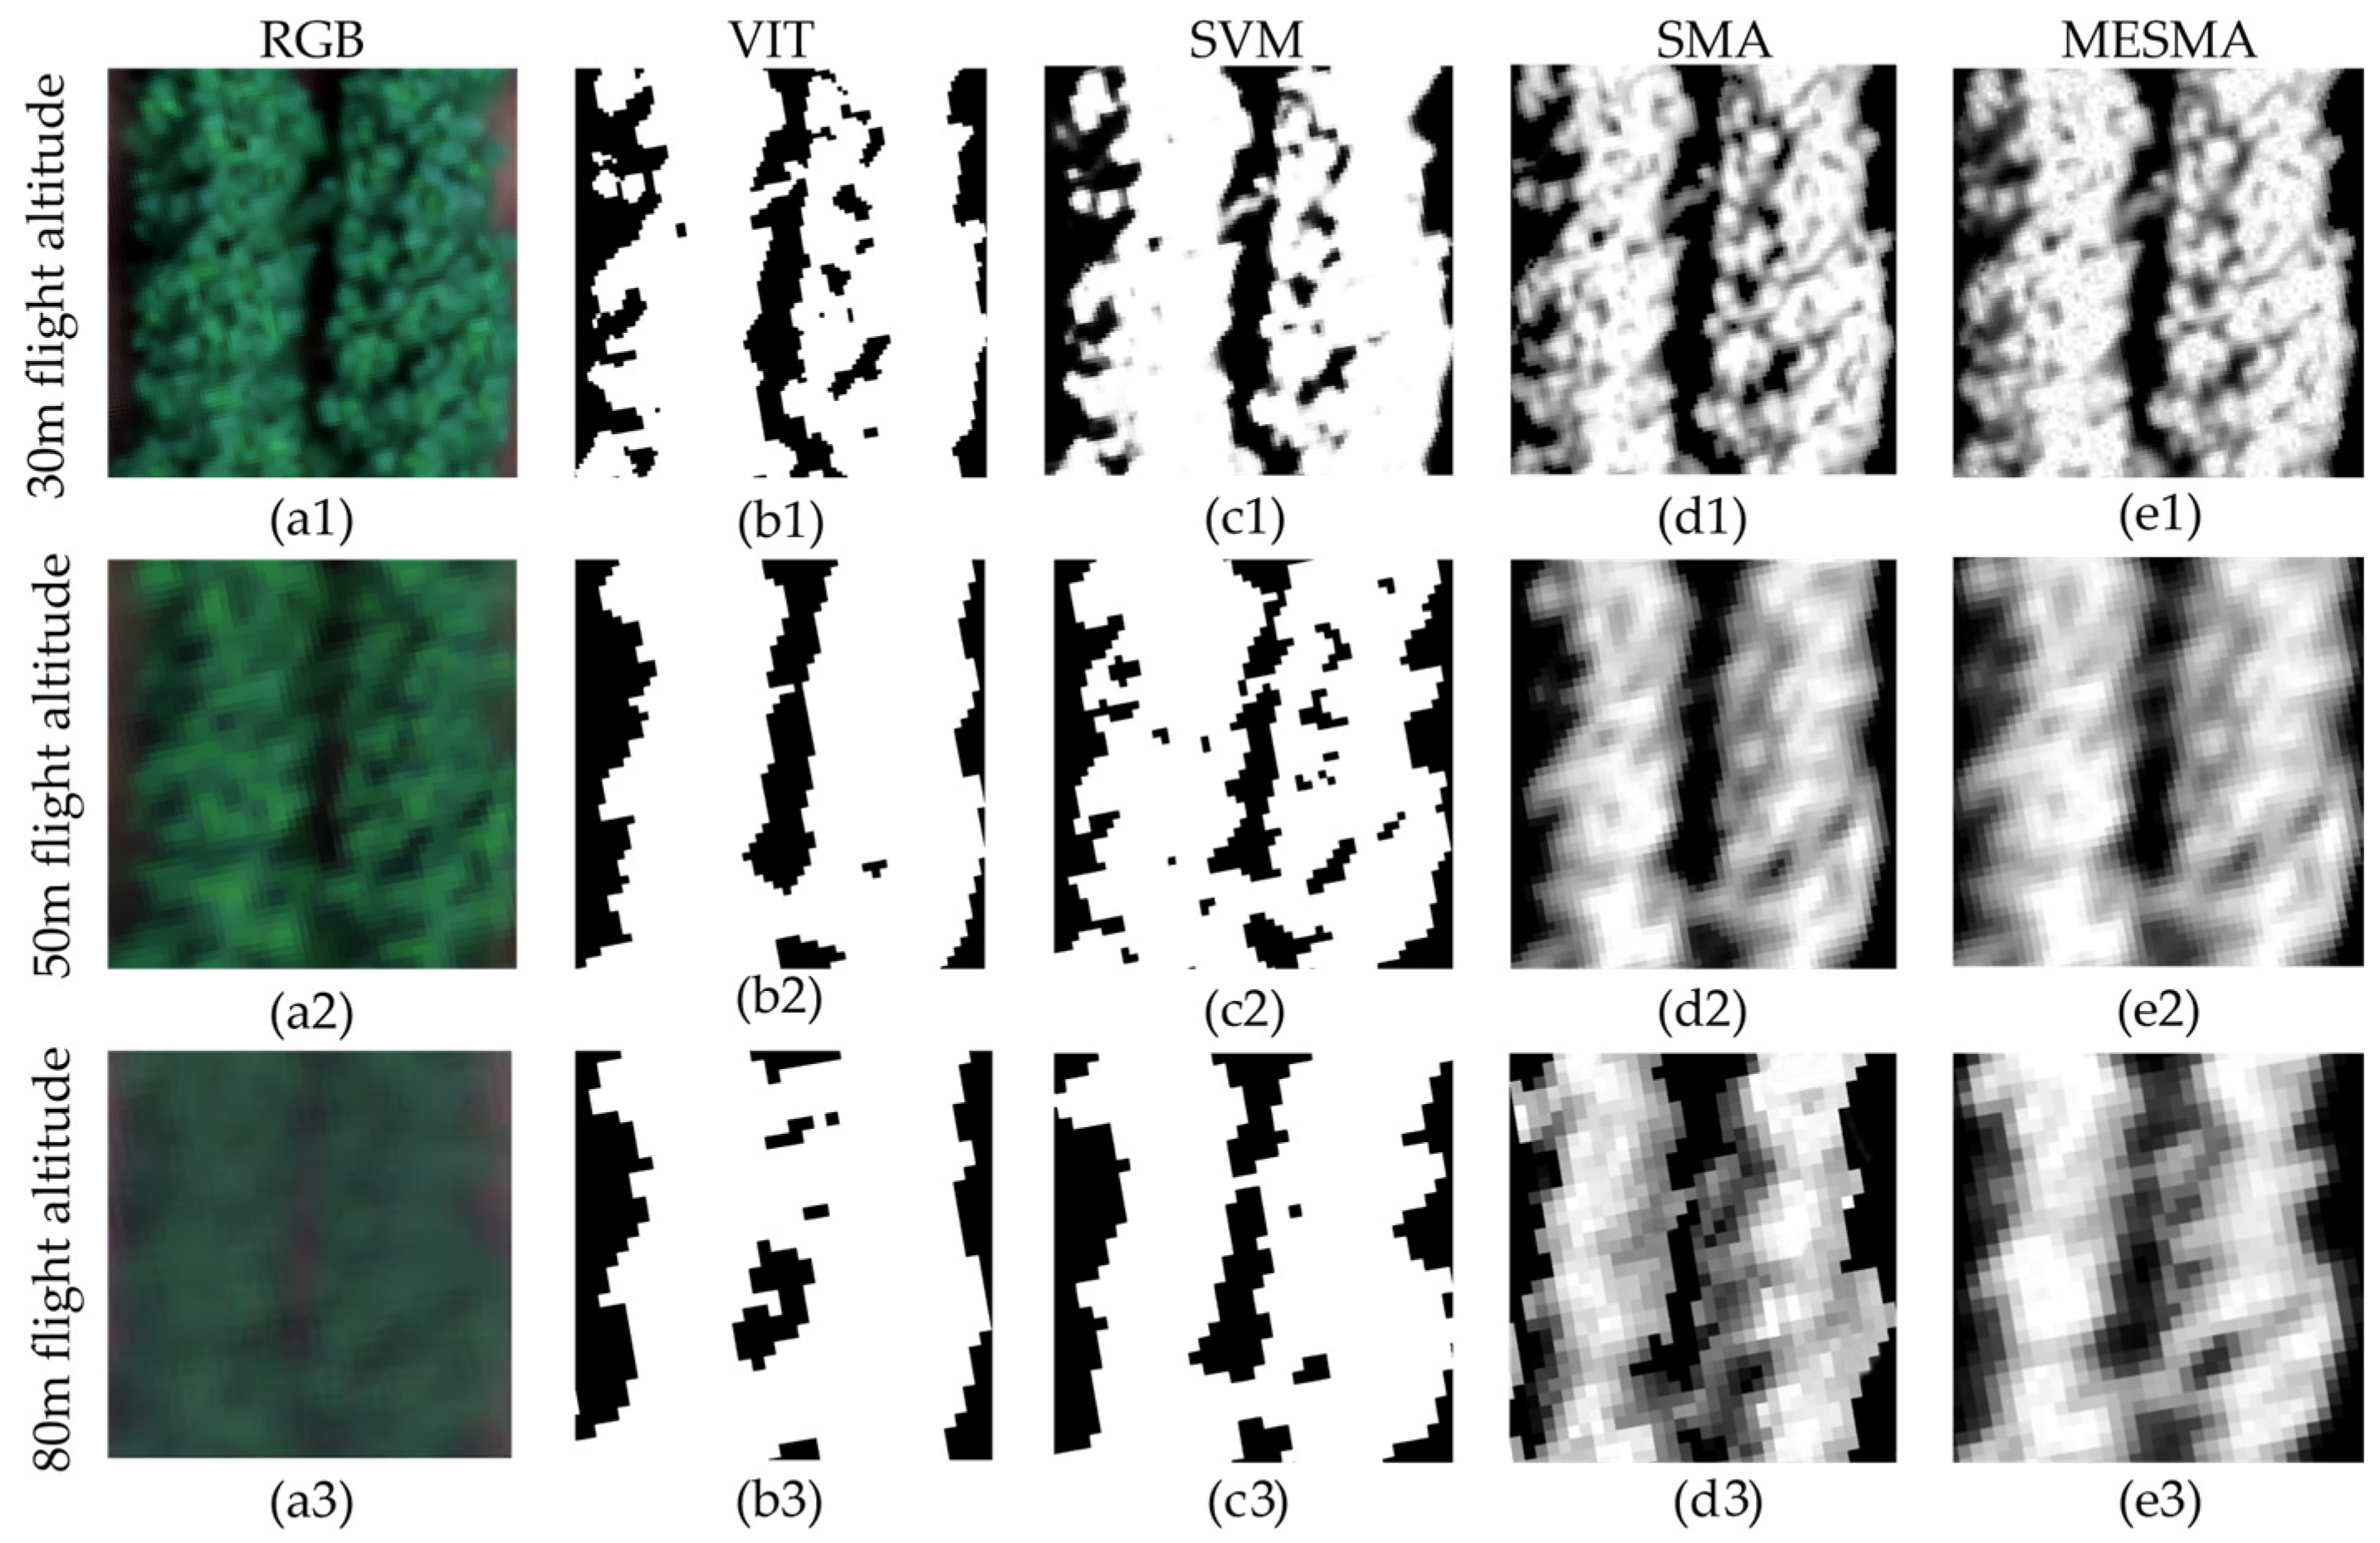
2.5. UAV Multispectral Image Segmentation Methods

2.5.1. Vegetation Index Threshold Segmentation Method

Spectral images contain backgrounds such as soil and canopy shadows, which affect the extraction accuracy of cotton spectral reflectance. The rejection of the background image elements can improve the correlation between spectral features and the SPAD of the cotton canopy. The construction of the normalized difference canopy shadow index (NDCSI) using ENVI 5.3 can effectively exclude soil background from the canopy. The histogram thresholds of NDCSI for the three flight altitudes were determined by visual interpretation as 0.12, 0.28, and 0.34. Background pixels smaller than the thresholds were excluded, and cotton pixels were retained. The NDCSI was calculated as shown in Equation (1) as follows:
N D C S I = N I R R E D N I R + R E D   R E G R E G M I N R E G M A X R E G M I N
where:
RED—Red band reflectance
REG—Red edge band reflectance
NIR—Near infrared 1 band reflectance
REGMAX—Red edge band reflectance maximum value
REGMIN—Red edge band reflectance minimum value

2.5.2. Image Segmentation Based on SVM Supervised Classification

In order to differentiate between cotton leaves, shadows, and soil, 80 typical samples of each were selected on an RGB image using ENVI 5.3 software, and support vector machine-supervised classification was used to segment different ground objects. The model was modeled using the radial basis function (RBF) with a penalty factor of 100 and other parameters were kept as default values. Cotton leaves were transformed into a high-precision mask file, which was applied to multispectral images to reject backgrounds such as shadows and soil.

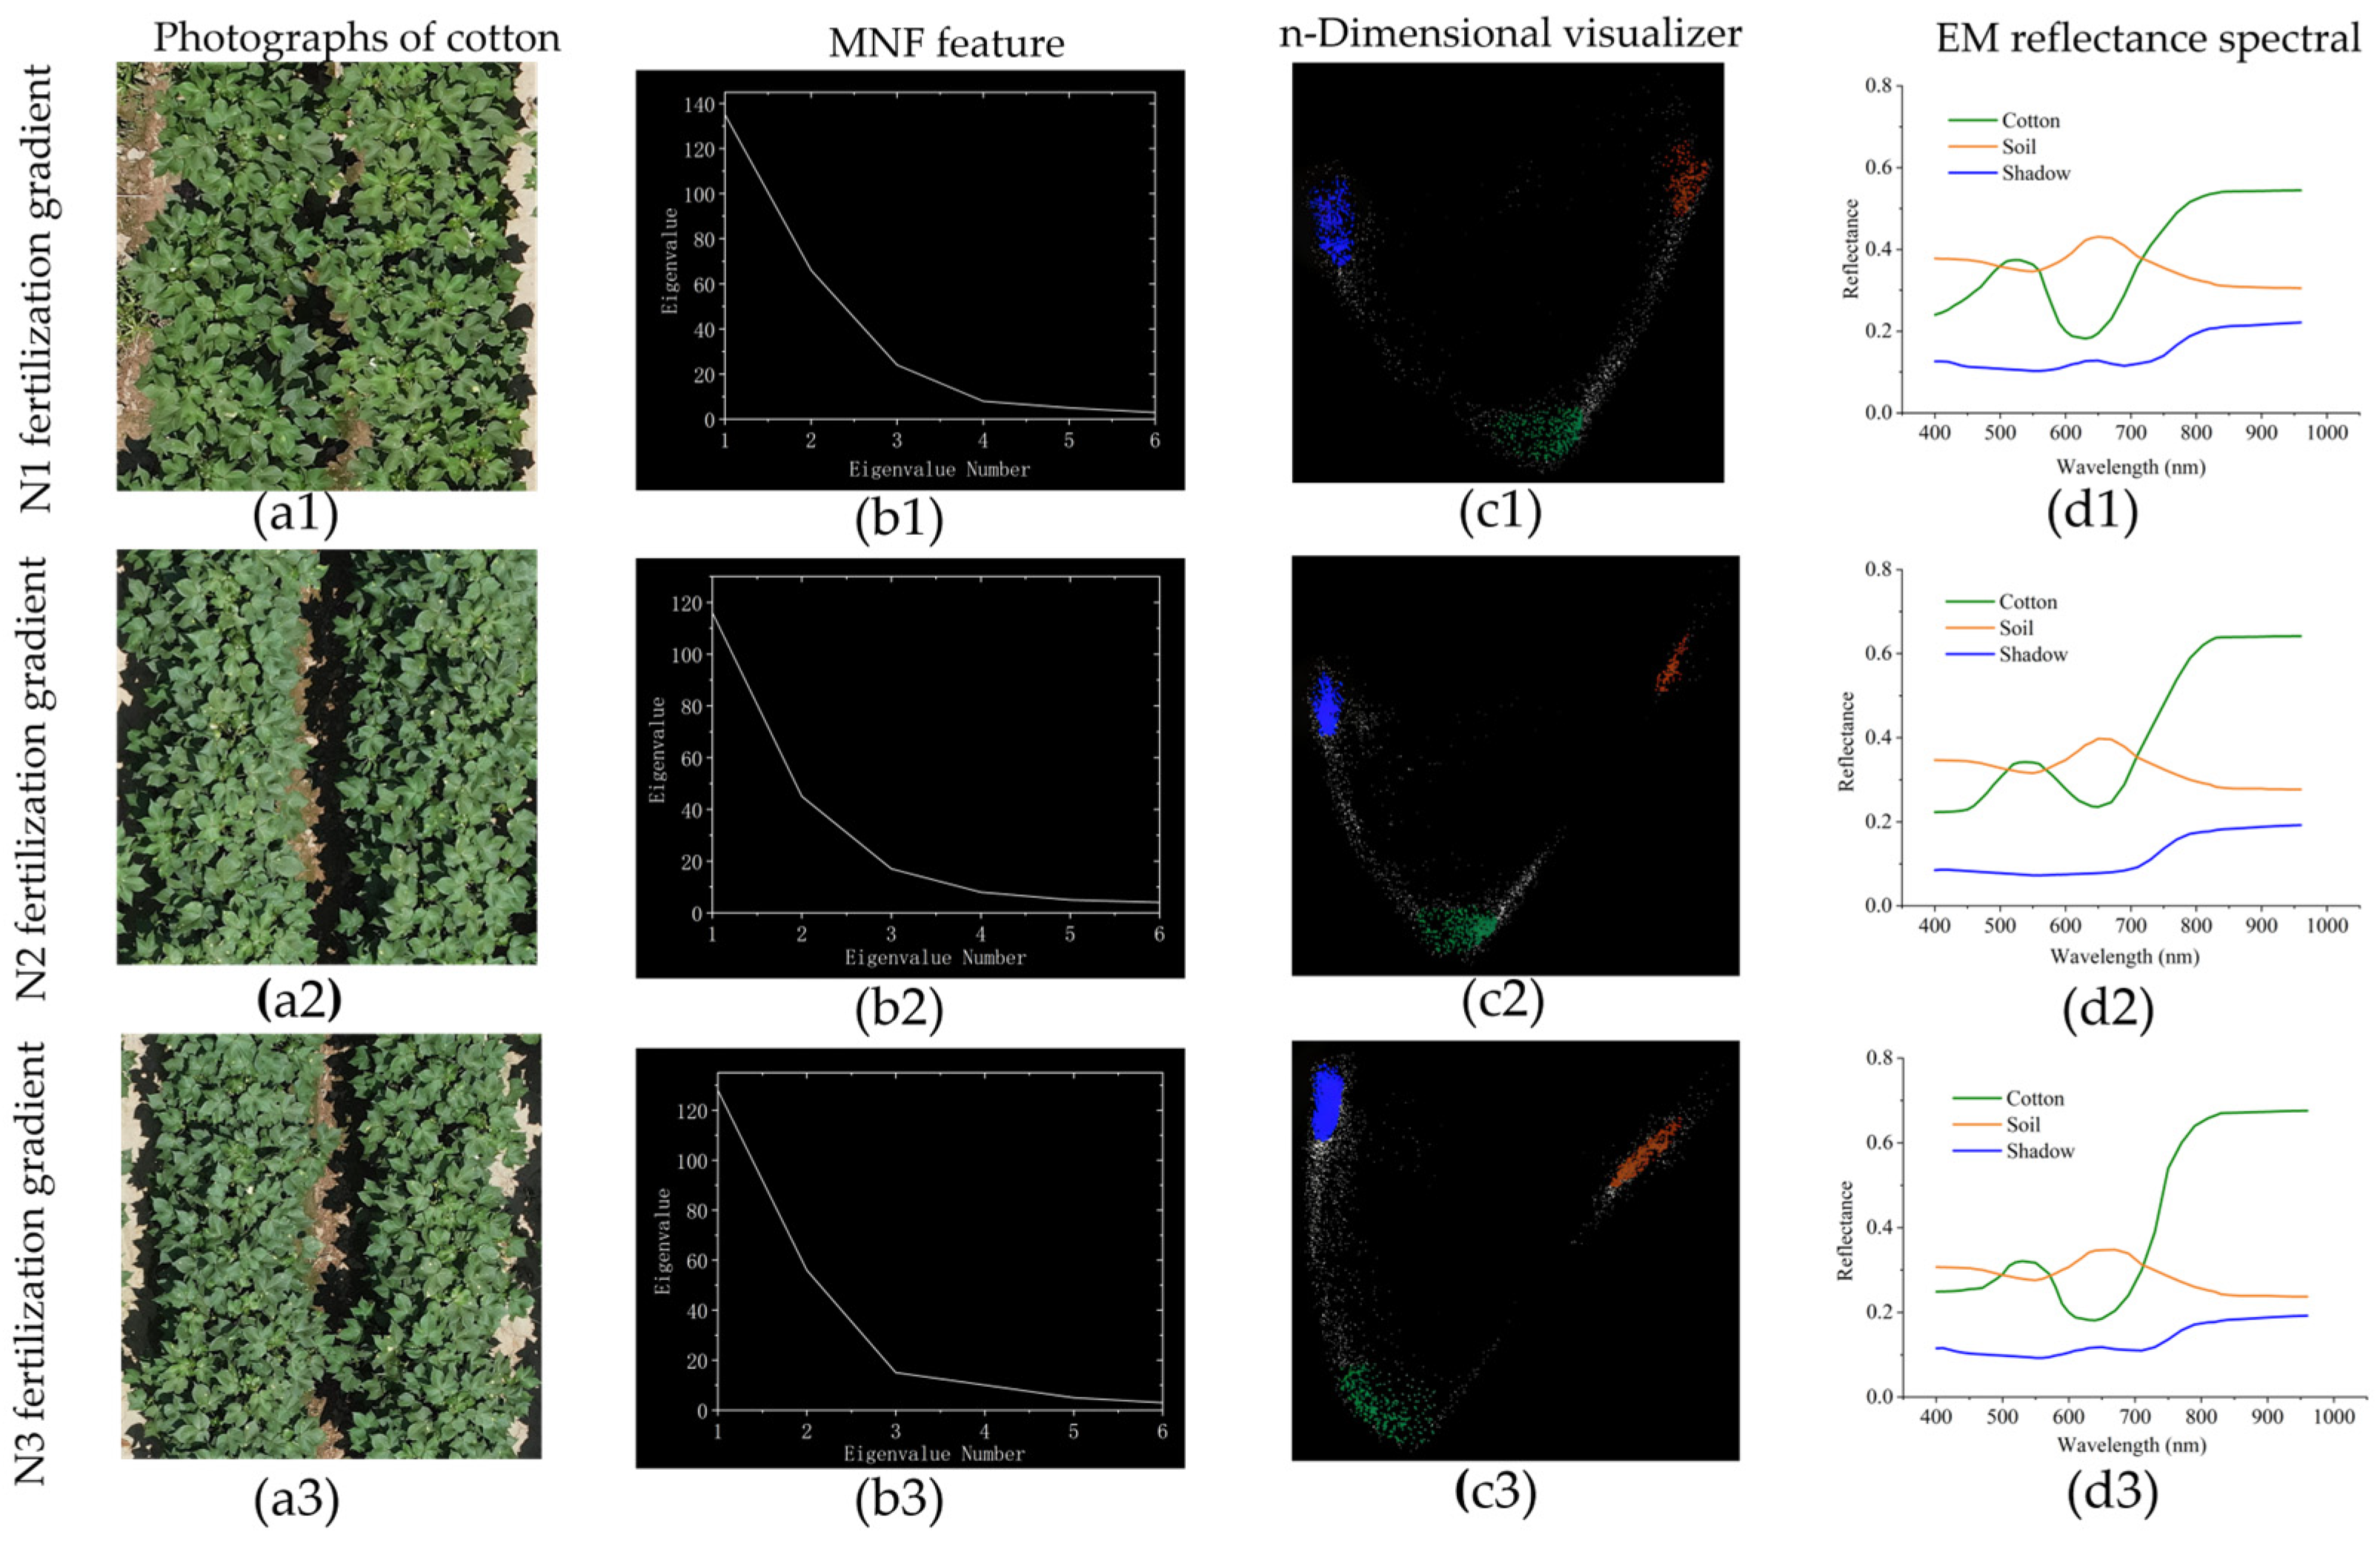
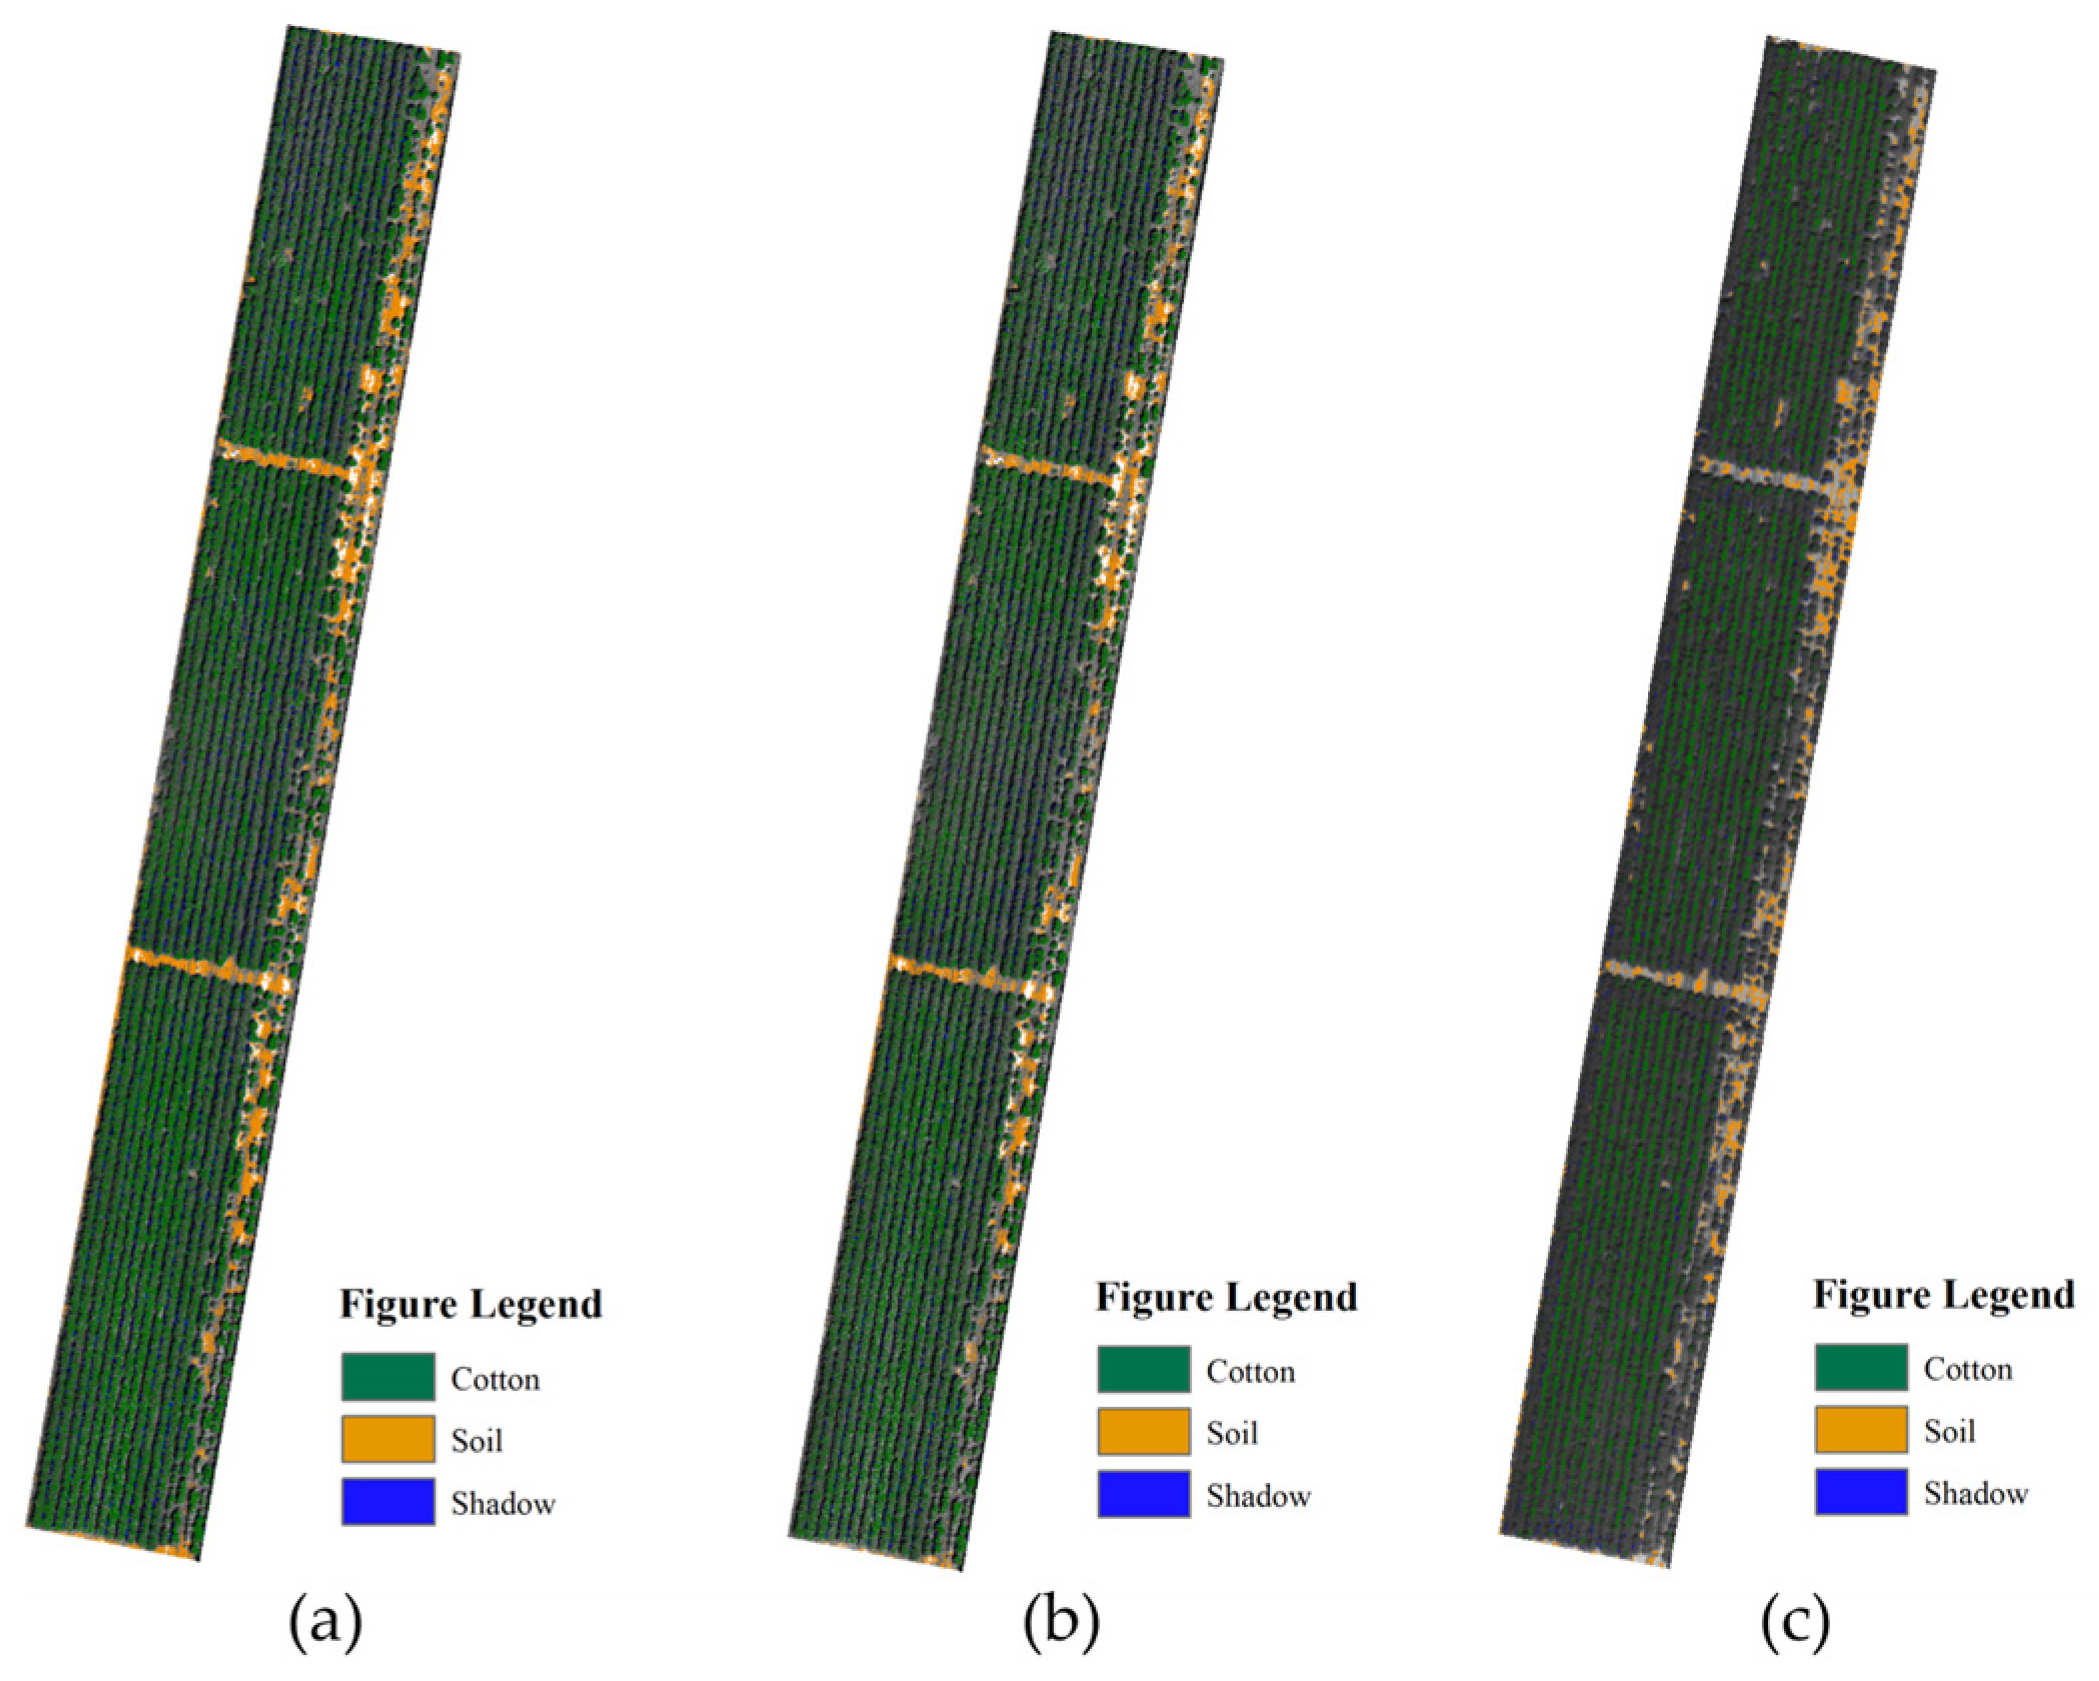
2.5.3. Cotton Abundance Information Extraction Based on Mixed Pixel Decomposition

The minimum noise fraction (MNF) and pixel purity index (PPI) are the key tools used to extract endmembers in remote sensing image analysis. In this paper, MNF was used to reduce noise and data dimensions, and the main characteristics of a high signal-to-noise ratio (SNR) were retained. The specific process included noise estimation, covariance matrix calculation, image decorrelation, and eigenvector decomposition, and the first three MNF components (with a cumulative variance contribution rate of more than 90%) were finally selected for the extraction of endmembers. PPI projected the spectral data to a random vector (1000 times), made statistics on the results of each projection, recorded the pixels closest to the edge in each projection dimension, screened the pixels exceeding the given threshold (200 times) as endmembers, and enumerated them in the N-dimensional visualization window. By manually determining the sample aggregation area, the spectral average of the pixels in the sample area was used as the endmember spectra for spectral mixture analysis (SMA) to obtain three endmembers, namely, cotton leaf, soil, and shadow.
As shown in Figure 3, cotton leaves showed a lighter green color under the N1 fertilization gradient, indicating a lower leaf chlorophyll content. Under N2 and N3 fertilization gradients, cotton leaves showed a darker color, indicating a higher leaf chlorophyll content. In addition, cotton endmembers had higher reflectance values in the near-infrared band, indicating higher chlorophyll content of cotton leaves. Differences in cotton growth status, as well as leaf color and morphology, due to differences in fertilizer gradients differentiated the telomere spectra of cotton, shadows, and soil. Multiple endmember spectral mixture analysis (MESMA) selected three endmembers for each type of feature to perform the mixture image decomposition for different cotton fertilization gradients.
As the flight altitude increased, the resolution of the multispectral image decreased, and the number of mixed pixels increased. As shown in Table 2, when the flight altitude was 30 m, the proportion of mixed pixels was 58.2%, the proportion of cotton leaves was 23.5%, the proportion of soil was 14.2%, and the proportion of shadow was 4.1%. The mixed pixels increased significantly with increasing flight altitude. Compared with the flight altitude of 30 m, the mixed pixels increased by 8.5% and 18.2%, respectively. The percentage of pure pixels in each category decreased, with the most significant decreases in cotton pure pixels by 6.1% and 12.4%, soil pure pixels by 2.1% and 4.6%, and shadow pure pixels by 0.3% and 1.2%, respectively. The distribution of pure pixels in the UAV multispectral image after processing using the PPI method is shown in Figure 4.
The fully constrained least squares linear spectral unmixing (FCLSU) method in SMA was utilized to linearly decompose the mixed pixels, which can effectively estimate the proportion of different components in the pixels. The two constraints included were non-negativity constraint and sum-to-one constraint, which can ensure the physical interpretability and accuracy of the analysis results, as shown in Equations (2)–(4).
ρ λ = i = 1 N A b d i ρ i λ + ε λ
0   A b d i 1
i = 1 N A b d i = 1
where ρ(λ) is the λ-band reflectance of a given pixel; Abdi is the abundance value occupied by the i-th endmember; ρi(λ) is the reflectance of the i-th endmember in the λ-band; ελ is the error value of the reflectance at the wavelength λ; and N is the number of endmember species within the mixed pixels. The constraints were that the abundance value was non-negative, the maximum value was constrained to be 1, and the sum of the endmember abundances of each mixed pixel was equal to 1.
Traditional linear spectral mixture analysis (SMA) assumes that each image element consists of fixed endmembers. Due to the obvious differences in cotton endmembers spectra in different fertilizer gradients, SMA used a fixed combination of endmembers for mixed pixel decomposition with large errors. MESMA is an improvement on the SMA method [30]. Different from the traditional spectral mixture analysis, the MESMA method selects 3 endmembers for each type of ground object to construct an endmembers library according to different fertilization gradients of cotton. In the process of analysis, MESMA selects the combination with the least error as the final result according to the linear mixed analysis of the multi-terminal element combination for each pixel. In the complex land cover type environment, MESMA can significantly improve the accuracy and flexibility of pixel decomposition. The MESMA parameters were set to a maximum RMSE of 2.5%, a threshold RMSE of 0.7%, an abundance constraint between 0 and 1, and minimum and maximum shade fractions of 0 and 0.8, respectively. Abundance inversion maps of cotton leaves, soil, and shadows were obtained by mixed pixel decomposition.

2.6. Vegetation Indices Calculation from UAV Multispectral Imagery

Vegetation indices provide a simple and effective measure of surface vegetation condition. In this paper, eight vegetation indices were selected for the inversion of cotton SPAD. ARVI and NDVI are widely used for SPAD inversion. RENDVI and GNDVI constructed from green light and red edge bands have a high correlation with crop SPAD. Four vegetation indices, CVI, MTCI, MCARI, and LCI, are sensitive to crop SPAD. The formulas for calculating the vegetation indices are shown in Table 3.

2.7. Cotton SPAD Inversion Model Selection

The dataset consisted of sixty samples. Forty-eight samples were selected as training samples to construct the SPAD inversion model. Twelve samples were selected as validation samples to test the accuracy of the model inversion. The cotton SPAD inversion model was constructed in the Python editor of VS code using three machine learning algorithms: PLSR, RF, and SVR.
Compared to traditional multiple linear regression, partial least squares regression (PLSR) combines statistical methods such as principal component analysis, linear correlation analysis, and linear regression. PLSR retains the maximum difference between the feature variables, solves the feature variable multicollinearity problem, and selects features as input parameters based on the cumulative contribution of the independent variables.
Random forest (RF) is an integrated learning algorithm based on multiple decision trees and the Bagging technique. The decision trees in the model were independent of each other, and the training subset of each decision tree was different, which can effectively reduce the model variance. Thus, the RF model fitting ability was strong. In the RF model, important parameters, such as the number of trees, depth, etc., were utilized to determine the optimal parameters using the grid search method.
Support vector regression (SVR) is a machine learning algorithm, using statistical theory. Its core idea is to map the original data from low- to higher-dimensional feature space so as to linearly separate the nonlinear problem. In this study, a radial basis function was chosen to determine the optimal values of the kernel parameter gamma and the penalty coefficient c using the grid search method, and the number of iterations was set to 1000.

2.8. Cotton SPAD Inversion Model Accuracy Evaluation Indexes

In order to evaluate the estimation accuracy of the model, the measured and predicted values were compared and analyzed using the regression model. The coefficient of determination (R2), root-mean-square error (RMSE), and mean absolute error (MAE) were chosen as the evaluation indexes of inversion accuracy. The larger the coefficient of determination R2, the smaller RMSE and MAE, the better the fit of the model, and the higher the estimation accuracy.

3. Results and Analysis

3.1. Accuracy Analysis of Different Segmentation Methods for UAV Multispectral Images

Three sample regions of the visible image were chosen, with each region sized at 500 × 500 pixels. Segmentation of the visible image by supervised classification showed that the sample region cotton percentage was 68.32%, 67.84%, and 69.43%, respectively. Visible imagery has a high resolution and can accurately segment feature classes such as cotton, shadows, and soils, and, therefore, can be used as a multispectral image segmentation standard. Segmentation of multispectral images in the same sample region was accomplished by aligning visible images with multispectral images and evaluating the accuracy of different segmentation methods.
As shown in Table 4 and Figure 5, the image resolution decreased as the flight altitude increased, leading to an increase in the average error and a decrease in segmentation accuracy. The MESMA method had the highest segmentation accuracy for the images at different flight altitudes, with average errors of 1.74%, 2.55%, and 3.61%, respectively. The SVM segmentation accuracy was higher than the SMA method when the image resolution was high. At reduced image resolution, where mixed pixels occurred in large numbers, the SMA segmentation error was smaller than the SVM method. The VIT method had relatively large segmentation errors of 2.95%, 1.97%, and 7.05%, respectively. At a flight altitude of 50 m, the VIT method segmentation was biased, resulting in a small mean error. When the UAV was flying at an altitude of 80 m, MESMA still segmented the image effectively. Cotton leaf, shadows, and soil abundance inversions are shown in Figure 6.

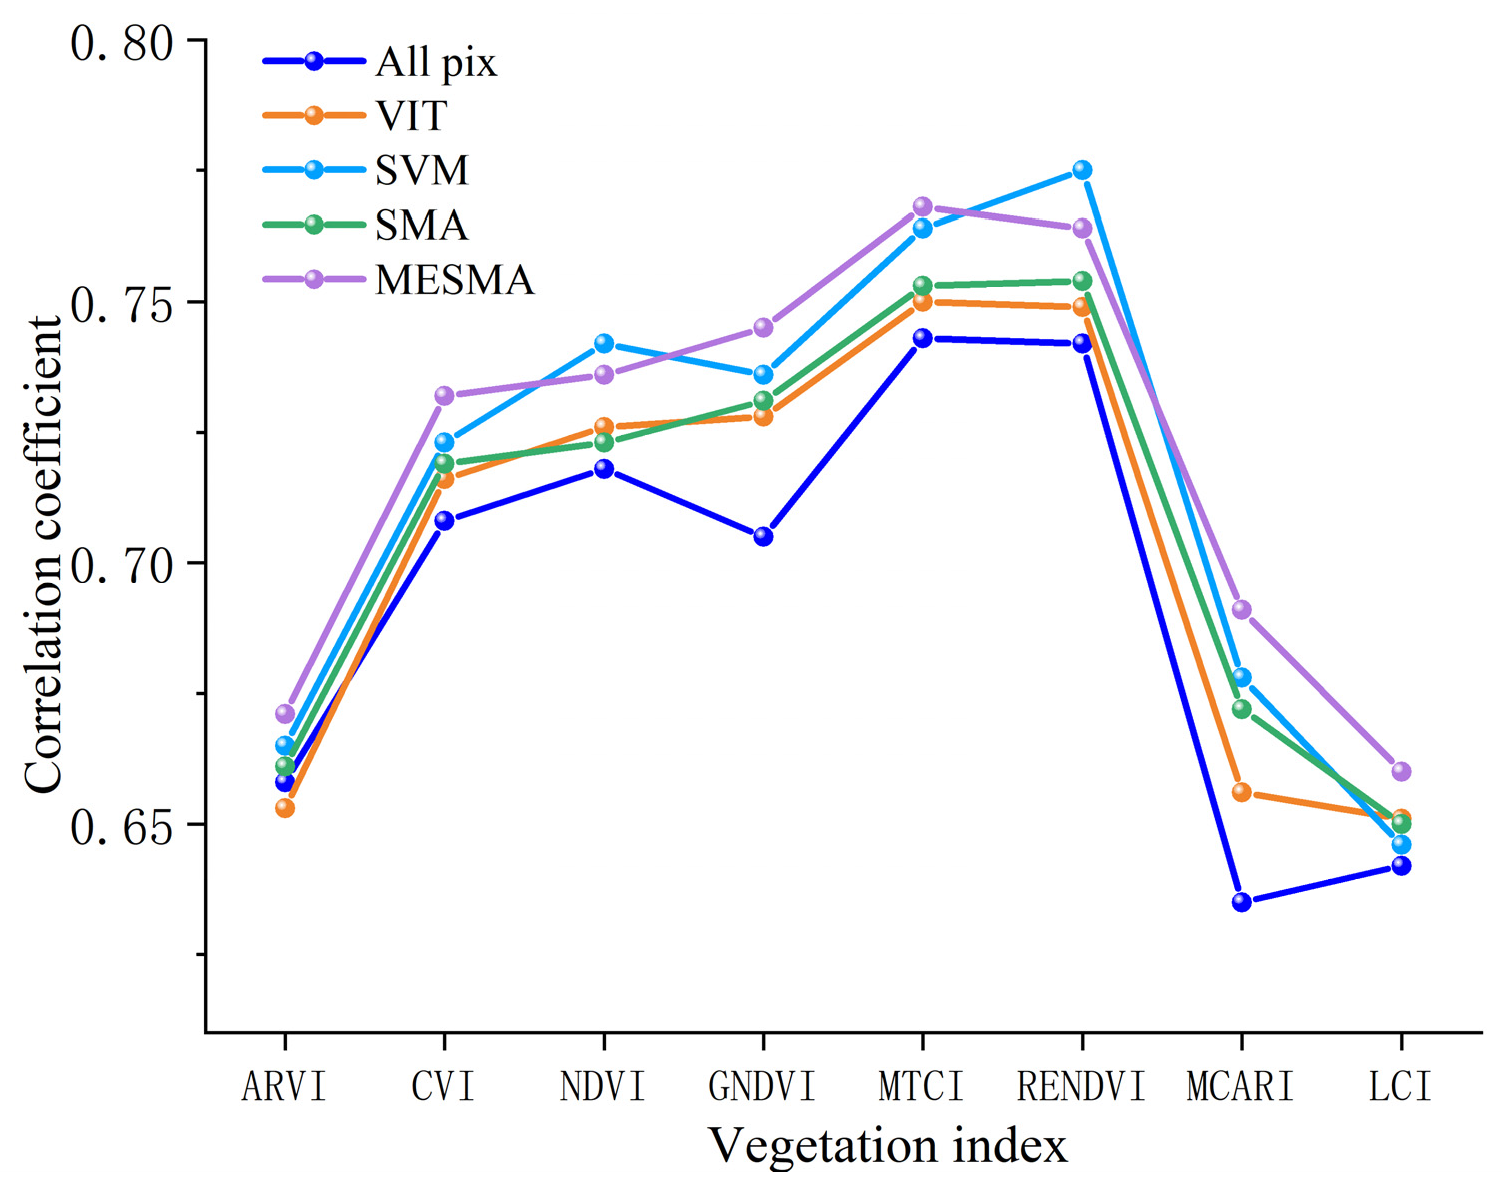
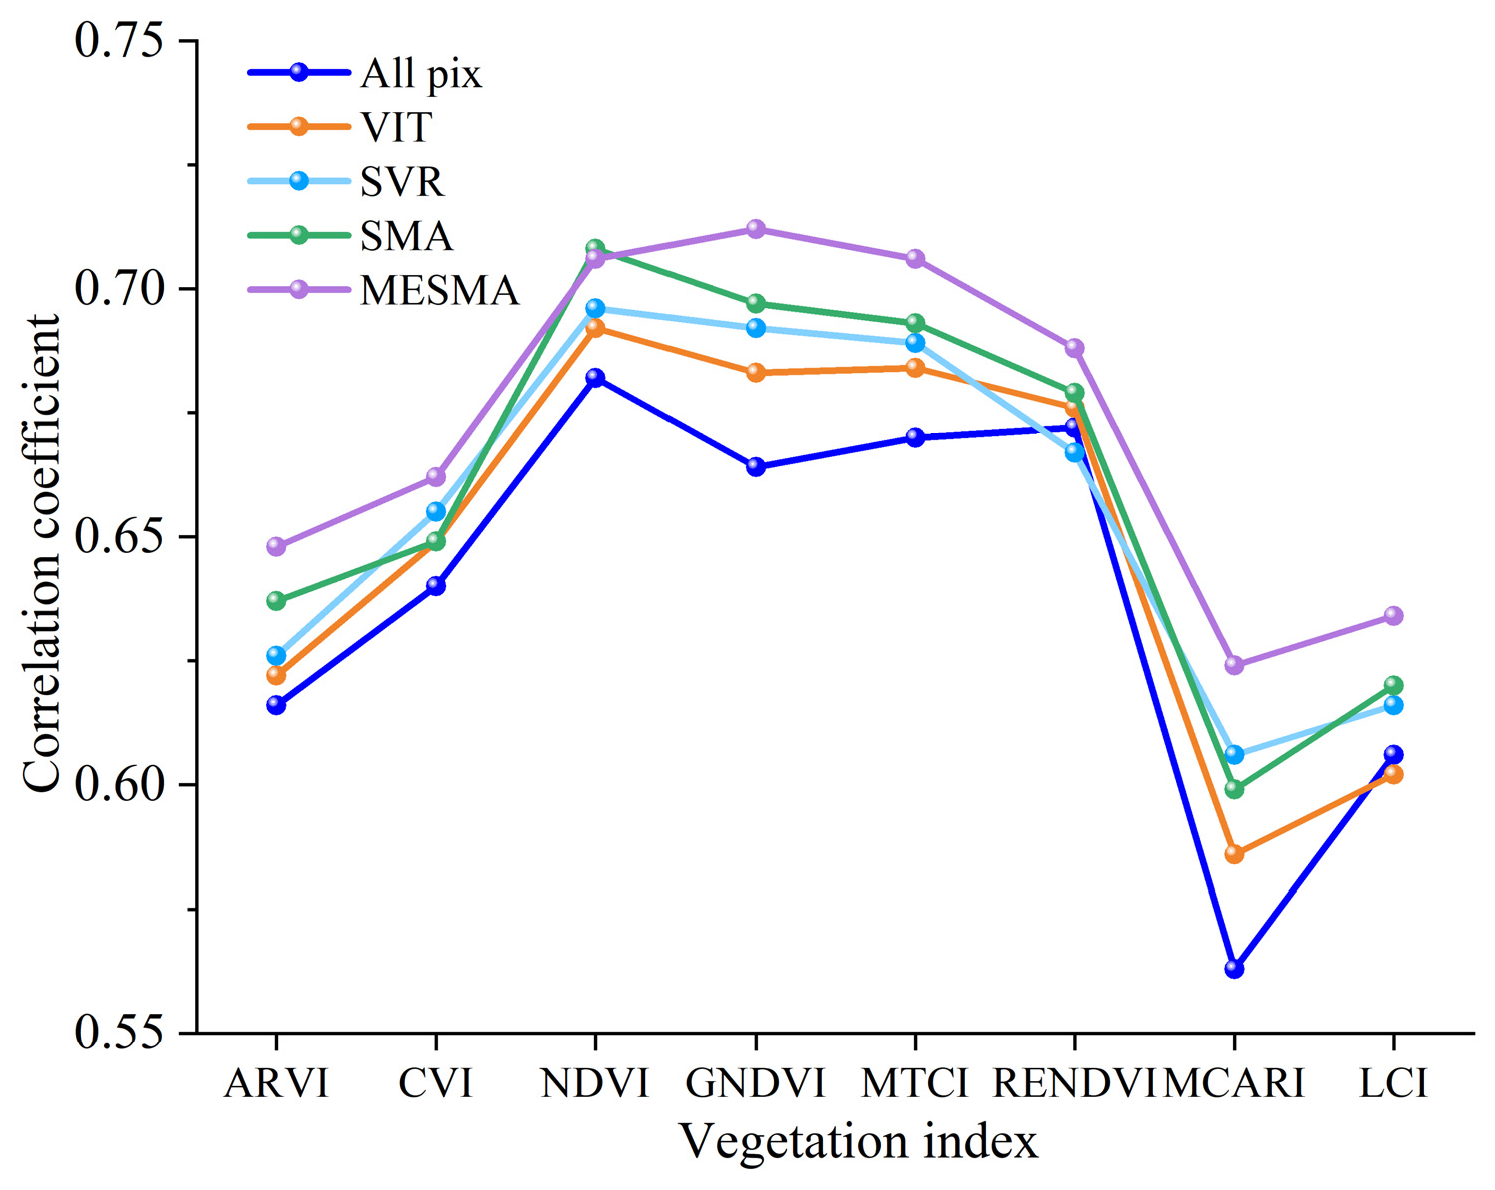
3.2. Correlation Analysis between Vegetation Indices and Cotton SPAD

The VIT and SVM methods involve masking the soil and shaded areas of the UAV multispectral imagery and then extracting the spectral information directly to compute the vegetation index. The SMA and MESMA methods utilized UAV multispectral imagery to generate cotton leaf abundance maps, which were then multiplied with the original vegetation indices to obtain a new vegetation index. Pearson correlation analysis of vegetation indices calculated after image segmentation with SPAD of cotton canopy was performed using the four methods. As shown in Figure 7, the correlation coefficients between SPAD and vegetation indices of the cotton canopy in the original images at a 30 m flight altitude were all greater than 0.6. Among them, CVI, NDVI, MTCI, and RENDVI had strong positive correlations, with correlation coefficients ranging from 0.705 to 0.743, and the highest positive correlation coefficient was found in MTCI. After segmenting the multispectral images using four methods, namely, VIT, SVM, SMA, and MESMA, the average correlation coefficients of cotton canopy SPAD and vegetation indices were improved by 2.1%, 3.1%, 2.2%, and 3.9%, respectively. The MESMA method of removing the background improved the overall mean correlation coefficients of the vegetation indices the most, and VIT improved the correlation coefficients the least. After unmixing the mixed pixels by the MESMA method, the GNDVI and MCARI correlation coefficients were significantly improved by 5.7% and 8.8%, respectively, and the improved correlation coefficients were 0.745 and 0.691, respectively.
In the original image, captured at a flight height of 80 m, cotton canopy SPAD had a strong positive correlation with the four vegetation indices of NDVI, GNDVI, MTCI, and RENDVI, and the correlation coefficients were all greater than 0.65, as shown in Figure 8. The correlation coefficient of NDVI was the highest, with a value of 0.682, and the correlation coefficient of MCARI was the lowest, with a value of 0.563. At a flight altitude of 50 m, the MESMA method improved most significantly, and the VIT method improved the correlation coefficient to a lesser extent. The hybrid image decomposition method was superior to other image segmentation methods due to the decrease in image resolution and increase in mixed pixels. After image segmentation using the MESMA method, the calculated correlation coefficients of GNDVI, MTCI, and MCARI with SPAD were significantly improved by 7.2%, 5.4%, and 10.8%, respectively, and the improved correlation coefficients were 0.712, 0.706, and 0.624, respectively.
In the original image, captured at a flight height of 80 m, the correlation coefficient between cotton canopy SPAD and vegetation index decreased somewhat, ranging from 0.483 to 0.595, as shown in Figure 9. The lowest correlation coefficient was for CVI, and the highest was for GNDVI. The correlation coefficients between SPAD and vegetation indices of the cotton canopy were improved by 1%, 2.4%, 5.7%, and 8.2% on average after segmenting the multispectral images using four methods: VIT, SVM, SMA, and MESMA, respectively. At a flight altitude of 80 m, the vegetation indices correlation coefficients improved most significantly due to the ability of SMA and MESMA to unmix the mixed pixels accurately, and the VIT method was the least effective. After image segmentation using the MESMA method, the calculated correlation coefficients of ARVI, GNDVI, and MCARI with SPAD were significantly elevated to 7.7%, 7.8%, and 14.8%, with elevated correlation coefficients of 0.541, 0.632, and 0.556, respectively.
The correlation between the vegetation indices calculated from the VIT segmented images and the SPAD of the cotton canopy improved less as the image resolution decreased. The average correlation coefficient enhancement of vegetation indices in low-resolution images was only 1%. However, SVM-supervised classification was still effective in segmenting images and could improve the correlation coefficient between the SPAD of cotton canopy and vegetation index. With an increase in the number of hybrid pixels in the image, the correlation between the calculated vegetation indices and SPAD improved more after the segmentation of the image by the hybrid pixel unmixing method.

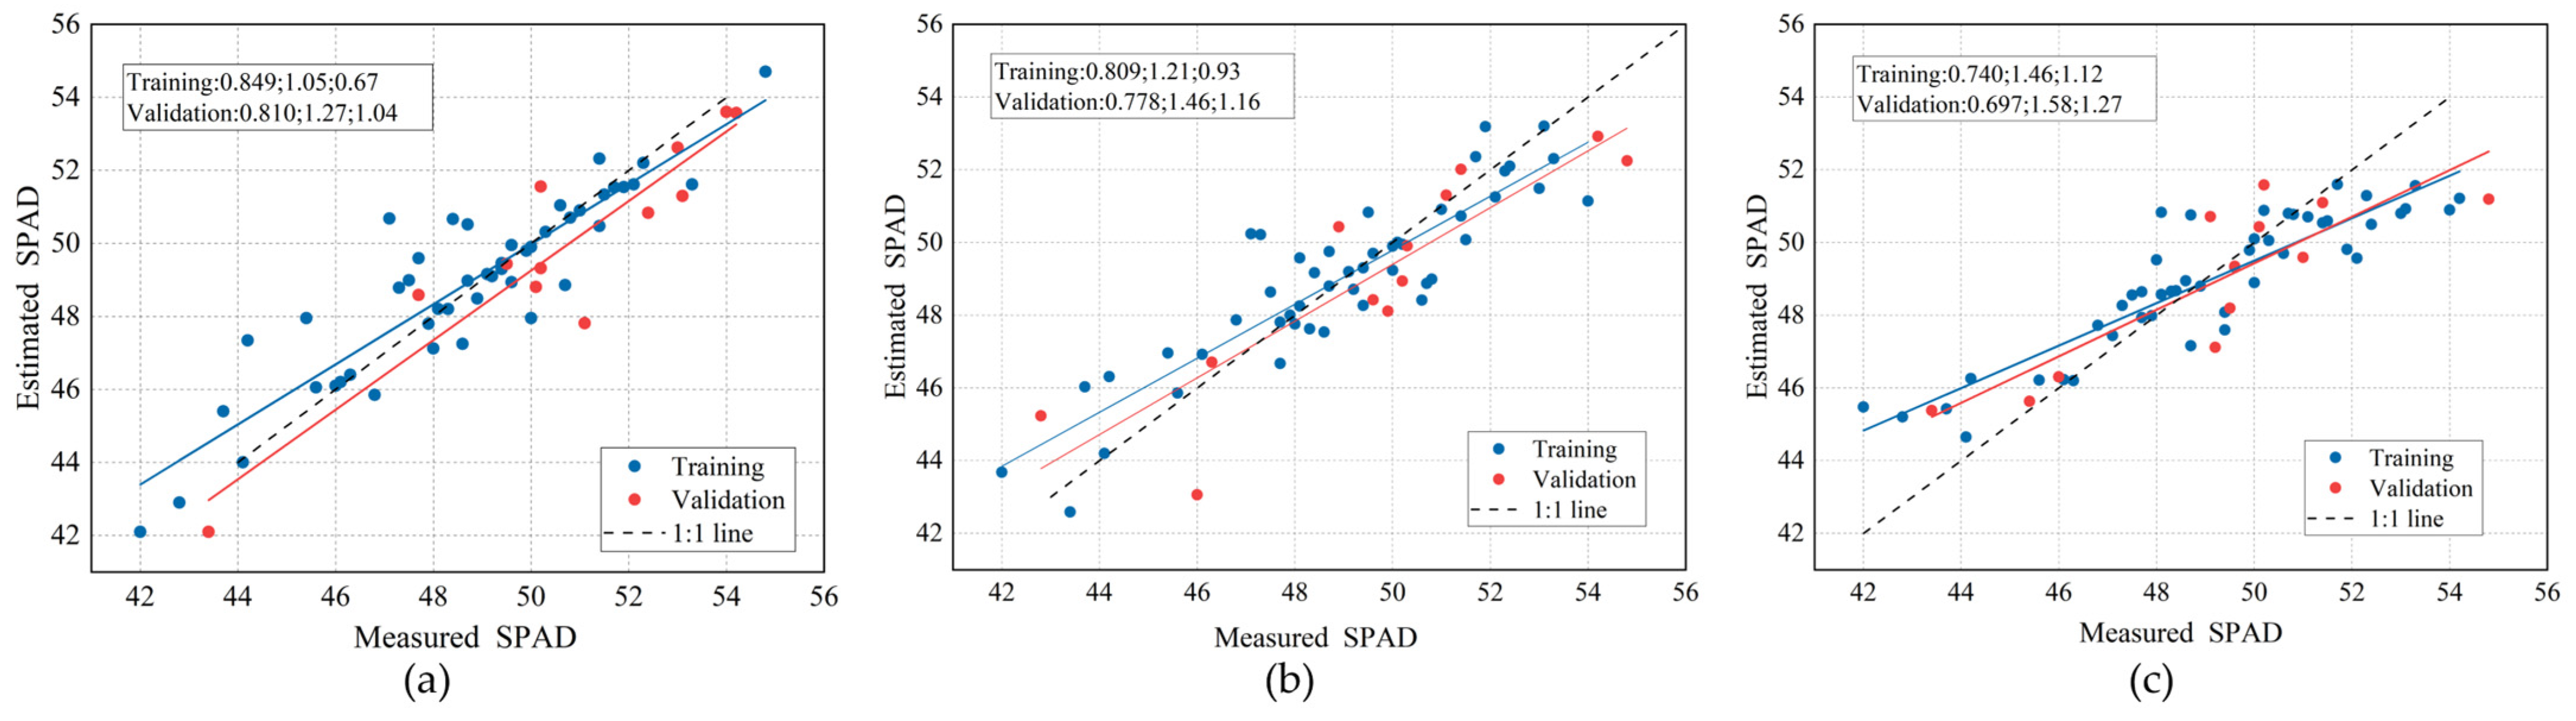
3.3. Cotton SPAD Inversion Model Construction

After the cotton multispectral images were segmented using different methods, PLSR, FR, and SVR inversion models were constructed using the vegetation indices and cotton SPAD calculated from the spectral information of the extracted images. The accuracy of the cotton SPAD inversion model at a flight altitude of 30 m is shown in Table 5. The effects of different image segmentation methods on the inversion of SPAD were compared, and the training set R2 of all inversion models was improved by 0.032–0.081, the RMSE was reduced by 0.10–0.26, and the MAE was reduced by 0.12–0.38 after image segmentation. The validation set R2 improved by 0.038–0.076, RMSE decreased by 0.08–0.19, and MAE was reduced by 0.09–0.25. The accuracy of the SVR model inversion was better than that of the PLSR and FR models with the same input features. The highest inversion accuracy of SPAD for cotton was obtained by segmenting the image and calculating vegetation indices using the MESMA method in combination with the SVR model, with a 10.4% improvement in R2 compared with the use of the original image. The model R2, RMSE, and MAE were 0.810, 1.27, and 1.04, respectively.
The accuracy of the cotton SPAD inversion model for a UAV flight altitude of 50 m is shown in Table 6. Compared with the original image, the R2 of the training set after segmenting the multispectral image using the four methods was improved by 0.022–0.023, 0.039–0.065, 0.044–0.055, and 0.06–0.091, respectively, and the R2 of the validation set was improved by 0.013–0.022, 0.011–0.052, 0.024–0.062, and 0.037–0.096. The MESMA image segmentation method based on mixed pixel decomposition was the most effective in improving the inversion accuracy of the model. The VIT segmentation was the least effective, resulting in the lowest inversion accuracy of the model. The SVR model inversion accuracy was better than the PLSR and FR models, which had the same input features. Segmentation of the image and calculation of vegetation indices using the MESMA method in combination with the SVR model obtained the highest inversion accuracy of SPAD for cotton, with a 14.1% improvement in R2, and model R2, RMSE, and MAE of 0.778, 1.46, and 1.16, respectively, as compared to the use of the original image.
The accuracy of the cotton SPAD inversion model for a UAV flight altitude of 80 m is shown in Table 7. VIT did not improve the accuracy of the SPAD inversion model significantly, with an improvement of 0.007–0.008 in R2 for the training set and −0.031–0.014 for the validation set after segmenting the images. The accuracy improvement in SVM for the SPAD inversion model was reduced, with an improvement in R2 of 0.032–0.048 for the training set and 0.034–0.043 for the validation set after segmenting the images. After segmenting the image by the mixed pixel decomposition method, the training set R2 was improved by 0.058–0.113, and the validation set R2 was improved by 0.051–0.106, which solved the problem of mixed pixels appearing in low resolution of the image and had a large improvement in the accuracy of the inversion of SPAD. The SVR model inversion accuracy was better than that of the PLSR and FR models with the same input features. The cotton SPAD inversion accuracies obtained by combining the SVR model and the four segmentation methods improved R2 by 2.2%, 5.8%, 13.7%, and 17.9%, respectively, compared with the original images. The highest model accuracy was achieved after segmenting the image using MESMA, with R2, RMSE, and MAE of 0.697, 1.58, and 1.27, respectively. The scatter plots of the optimal results of the three flight altitude estimation models are shown in Figure 10.

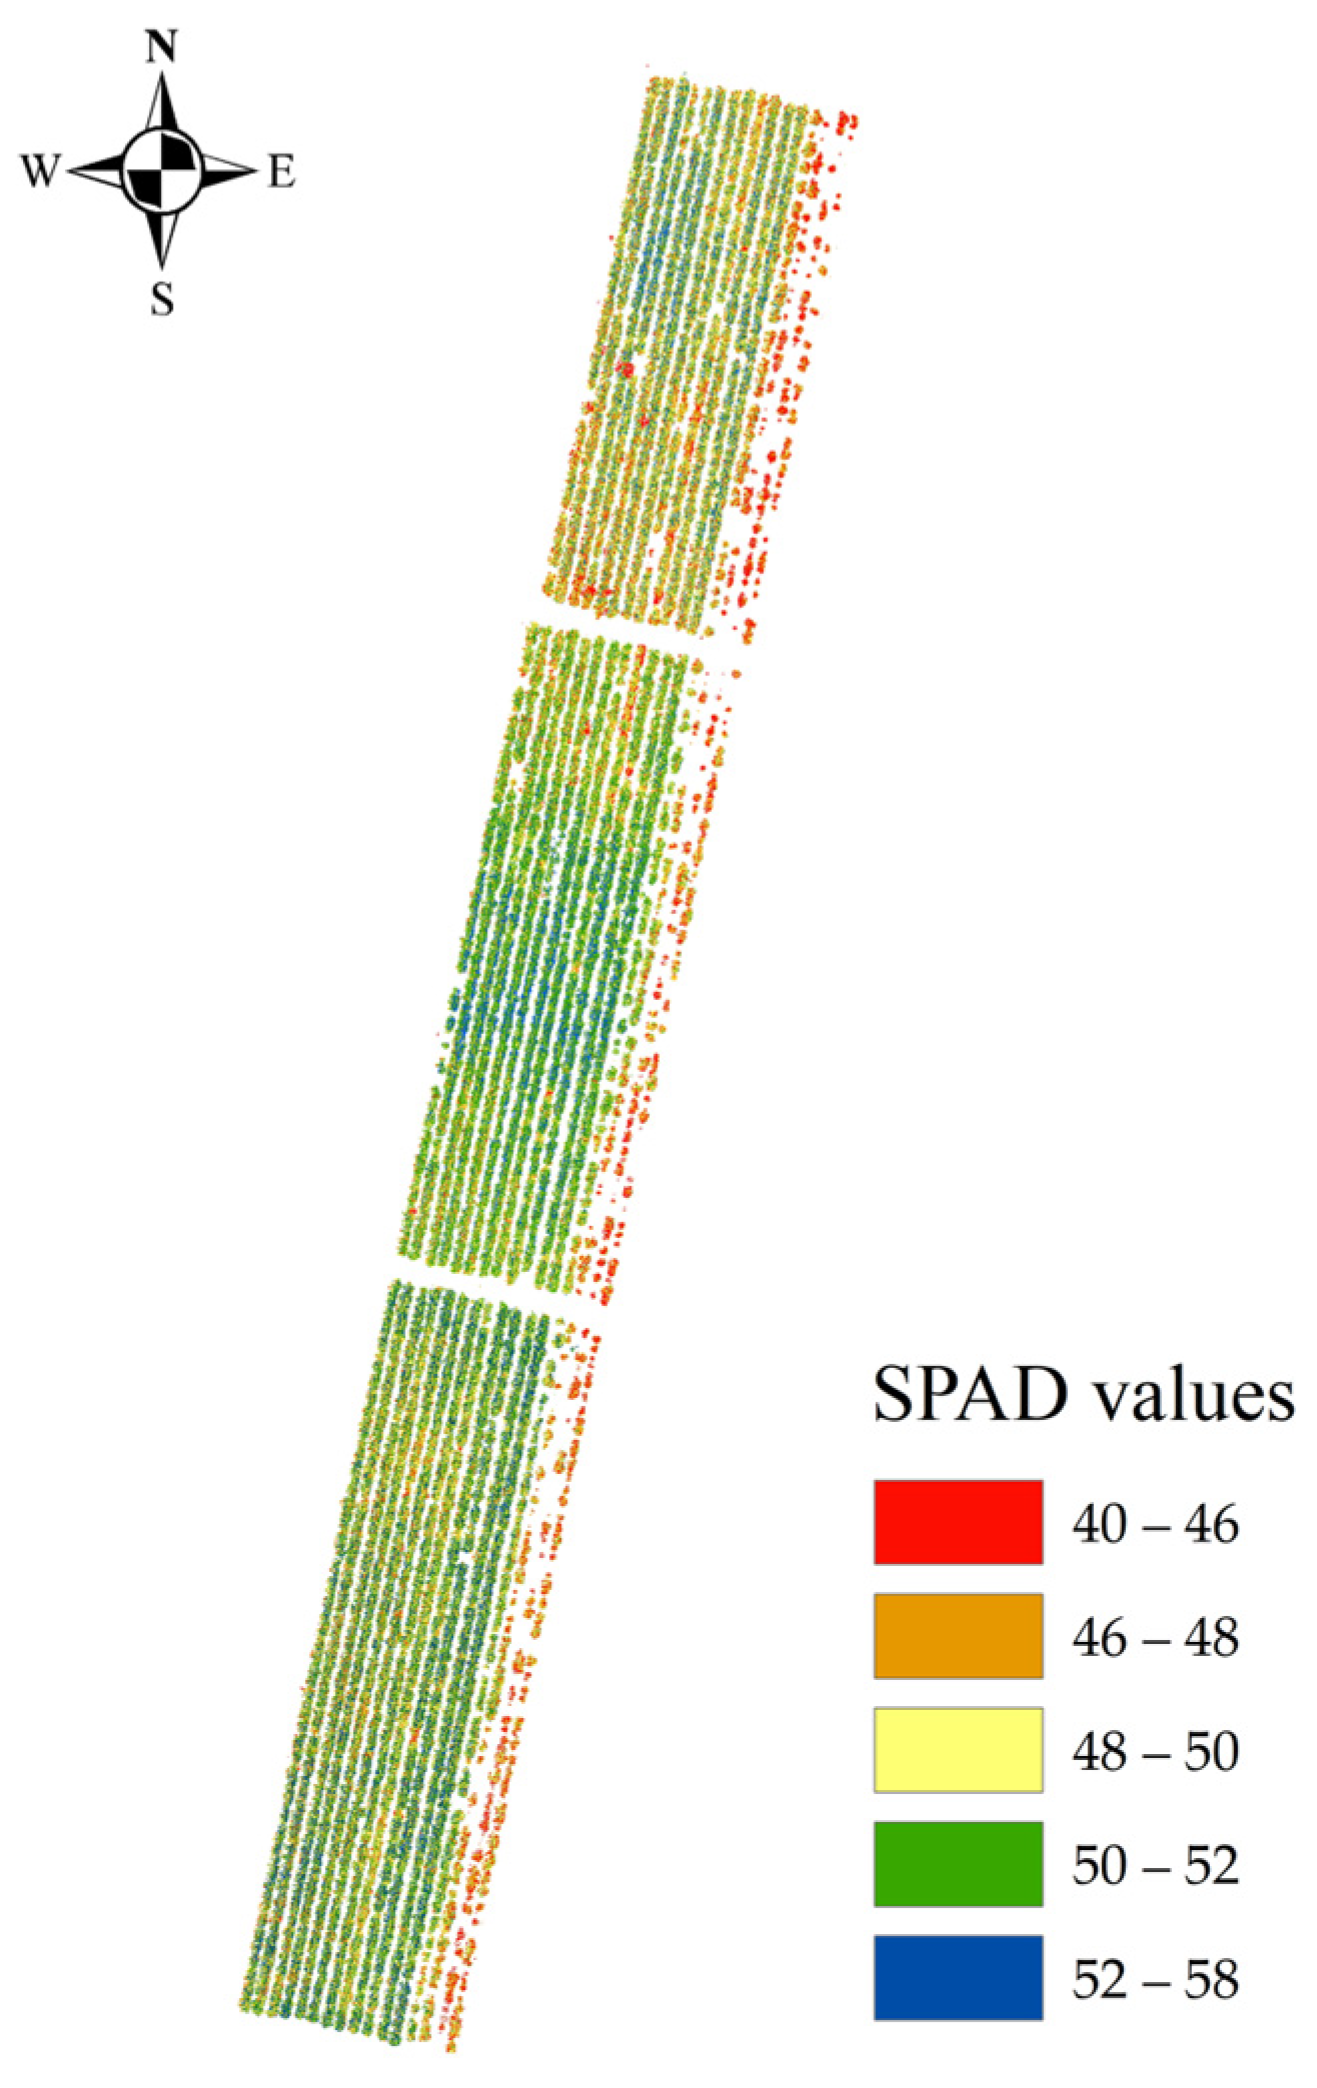
3.4. SPAD Spatiotemporal Mapping Based on Optimal Inversion Modeling

The inversion of cotton canopy SPAD using the constructed SVR model allowed for a visual comparison of the distribution of cotton SPAD under different fertilization gradients. As shown in Figure 11, the overall SPAD of cotton in the N2 region was the highest, followed by that in the N3 region and the lowest in the N1 region. It can be seen that 240 kg/hm2 nitrogen fertilizer was the most suitable for cotton growth and was basically consistent with the actual measurement results. At the first bud stage, the cotton on the right side suffered from pesticide overdose due to overlapping spraying, resulting in scorched spots on the cotton leaves and affecting the growth of the cotton. In the SPAD distribution map of cotton at the bud stage, it can be observed that the distribution of cotton plants on the right side was scattered, and the SPAD of cotton was generally low, consistent with the actual investigation.

4. Discussions

Backgrounds such as soil and shadows in UAV multispectral imagery reduce the accuracy of inverting the cotton SPAD. Noh et al. [39] demonstrated that backgrounds such as shadows and soil attenuate the spectral information of cotton, particularly in the red-edge and near-infrared bands. Chen et al. [40] extracted the spectral information of the cotton canopy and constructed an inversion model of nitrogen concentration based on UAV images with the soil background removed. The results showed that the accuracy of the model constructed after removing the soil background was higher than that of the model without removing the background.
In this paper, several image segmentation methods were utilized to remove the background, such as soil and shadow. The correlation coefficient between the constructed vegetation index and chlorophyll content was not significantly improved compared to the non-excluded background, and the correlation coefficient of NDVI, RENDVI, and LCI only increased by 0.03–0.039, which may be because the correlation coefficient mainly measures the linear relationship between the two variables. The correlation coefficient did not increase significantly, indicating that the linear relationship between the vegetation index and chlorophyll content did not change much after removing background interference. The vegetation index calculated from the image with the background removed was used to establish the chlorophyll content inversion model, which improved significantly compared with the model without the background removed. This may be because the model fits the data better after removing the background interference, and even if the linear relationship changes little, the capture of the nonlinear relationship and the reduction in noise can significantly improve the overall performance of the model. The research results of Zhou [13] and Li [16] also confirmed that background pixels affect the results of crop parameter inversion with image spectral information. The correlation between the vegetation index and chlorophyll content of cotton can be effectively improved by unmixing mixed pixels in the 80 m UAV multispectral images. After segmenting the images using the MESMA method, the average correlation coefficient improved by 8.2%.
In remote sensing images taken at a UAV flight altitude of 80 m, the segmentation accuracy of the NDCSI thresholding method and SVM-supervised classification method was lower than that of the spectral unmixing method. This is because each image element contains an increased surface area, leading to the inclusion of multiple feature types within a single image element. Both methods simplify complex image elements into a single species, which makes it difficult to accurately deal with the complexity of image elements and leads to a high misclassification rate. Segmentation of the images and calculation of vegetation indices using the SMA and MESMA methods resulted in an improvement in inversion accuracy (R2) by 13.7% and 17.9% for cotton SPAD obtained using the SVR model, compared to the original images, respectively. The MESMA image segmentation accuracy was better than the SMA method, which is because MESMA is able to find endmember spectra closer to the real situation by searching all possible endmember combinations, making it more suitable for extracting the abundance of cotton spectral pixels under complex background conditions.
In this paper, only the effect of the linear spectral unmixing model on the inversion of cotton SPAD was investigated. In the next step of the study, the images will be segmented using a nonlinear spectral unmixing model, and data on cotton SPAD in the field and UAV images from different years and regions will be collected for modeling in order to improve the migration generalization ability of the model.

5. Conclusions

Four methods, VIT, SVM, SMA, and MESMA, were used to segment cotton, soil, and shadows in multispectral images, with the MESMA segmentation accuracy being the best. At the UAV flight altitude of 80 m, the image segmentation accuracy of MESMA was significantly better than other methods, with an average error of only 3.61%.
After segmenting the images using the MESMA method and calculating the eight vegetation indices, the correlation coefficient between the SPAD of the cotton canopy and the vegetation index increased the most. The correlation coefficients increased on average by 3.9%, 5.3%, and 8.2% at UAV flight altitudes of 30 m, 50 m, and 80 m, respectively.
The SPAD inversion accuracy of the SVR model with the vegetation index calculated after MESMA segmentation was the most accurate at different flight altitudes, with an R2 of 0.810, 0.778, and 0.697, RMSE of 1.27, 1.46, and 1.58, and MAE of 1.04, 1.16, and 1.27, respectively. Compared with the original image, 30 m was improved by 10.4%, 50 m by 14.1%, and 80 m by 17.9%.

Author Contributions

Writing—original draft, methodology, investigation, conceptualization, B.T.; validation, data curation, H.Y.; investigation, data curation, S.Z.; data curation, X.W.; data curation, L.Y.; software, J.L.; software, W.C.; resources, Z.W.; supervision, L.L.; supervision, resources, Y.L.; writing—review and editing, resources, funding acquisition, J.Z. All authors have read and agreed to the published version of the manuscript.

Funding

This research was supported by the Taishan Industrial Experts Program, the Qingdao Industrial Experts Program, the Natural Science Foundation Project of Shandong Province (ZR2021MD091), the National Key R&D Program of China (2023YFD2000200), and the Development of Intelligent Seedling Release Machine for Cotton Plant under Membrane with Electrothermal Melt Film.

Institutional Review Board Statement

Not applicable.

Data Availability Statement

The data presented in this study are available on request from the corresponding author due to privacy or ethical restrictions.

Conflicts of Interest

The authors declare that the research was conducted in the absence of any commercial or financial relationships that could be construed as a potential conflict of interest.

References

  1. Zhang, L.; Sun, B.; Zhao, D.; Shan, C.; Wang, G.; Song, C.; Chen, P.; Lan, Y. Prediction of Cotton FPAR and Construction of Defoliation Spraying Prescription Map Based on Multi-source UAV Images. Comput. Electron. Agric. 2024, 220, 108897. [Google Scholar] [CrossRef]
  2. Xu, W.; Chen, P.; Zhan, Y.; Chen, S.; Zhang, L.; Lan, Y. Cotton Yield Estimation Model Based on Machine Learning Using Time Series UAV Remote Sensing Data. Int. J. Appl. Earth Obs. Geoinf. 2021, 104, 102511. [Google Scholar] [CrossRef]
  3. Zhang, S.; Zhao, G.; Lang, K.; Su, B.; Chen, X.; Xi, X.; Zhang, H. Integrated Satellite, Unmanned Aerial Vehicle (UAV) and Ground Inversion of the SPAD of Winter Wheat in the Reviving Stage. Sensors 2019, 19, 1485. [Google Scholar] [CrossRef] [PubMed]
  4. Zhuo, W.; Wu, N.; Shi, R.; Wang, Z. UAV Mapping of the Chlorophyll Content in a Tidal Flat Wetland Using a Combination of Spectral and Frequency Indices. Remote Sens. 2022, 14, 827. [Google Scholar] [CrossRef]
  5. Zhao, X.; Li, Z.; Wang, H.; Liu, J.; Jiang, W.; Zhao, Z.; Wang, X.; Gao, Y. Estimation of Chlorophyll Content in Cotton Canopy Using UAV Multispectral Imagery and Machine Learning Algorithms. Cotton Sci. 2024, 36, 1–13. [Google Scholar]
  6. Delavarpour, N.; Koparan, C.; Nowatzki, J.; Bajwa, S.; Sun, X. A Technical Study on UAV Characteristics for Precision Agriculture Applications and Associated Practical Challenges. Remote Sens. 2021, 13, 1204. [Google Scholar] [CrossRef]
  7. Tsouros, D.C.; Bibi, S.; Sarigiannidis, P.G. A Review on UAV-Based Applications for Precision Agriculture. Information 2019, 10, 349. [Google Scholar] [CrossRef]
  8. Liu, Z.; Wan, W.; Huang, J.; Han, Y.; Wang, J. Progress on Key Parameters Inversion of Crop Growth Based on Unmanned Aerial Vehicle Remote Sensing. Trans. Chin. Soc. Agric. Eng. 2018, 34, 60–71. [Google Scholar]
  9. Qu, Y.; Tang, Y.; Zhou, Z.; Yan, F.; Wang, J.; Xu, H.; Hu, L.; Xu, X. Study on Model Simulation of Relative Chlorophyll Content of Moso Bamboo Based on UAV Visible Light Image. Acta Agric. Univ. Jiangxiensis 2022, 44, 139–150. [Google Scholar]
  10. Wang, S.; Kong, Y.; Zhang, Z.; Chen, H.; Liu, P. SPAD Value Inversion of Cotton Leaves Based on Satellite-UAV Spectral Fusion. Sci. Agric. Sin. 2022, 55, 4823–4839. [Google Scholar]
  11. Ji, W.; Chen, H.; Wang, S.; Zhang, Y. Modeling Method of Cotton Leaves SPAD at Flowering and Boll Stage in North China Plain Based on UAV Multi-Spectrum. Chin. Agric. Sci. Bull. 2021, 37, 143–150. [Google Scholar]
  12. Ao, D.; Yang, J.; Ding, W.; An, S.; He, L. Review of 54 vegetation indices. J. Anhui Agric. Sci. 2023, 51, 13–21, 28. [Google Scholar]
  13. Zhou, Z.; Gu, X.; Cheng, Z.; Chang, T.; Zhao, T.; Wang, Y.; Du, Y. Inversion of Chlorophyll Content of Film-Mulched Maize Based on Image Segmentation. Sci. Agric. Sin. 2024, 57, 1066–1079. [Google Scholar]
  14. Wei, C.; Du, Y.; Cheng, Z.; Zhou, Z.; Gu, X. Yield Estimation of Mulched Winter Wheat Based on UAV Remote Sensing Optimized by Vegetation Index. Trans. Chin. Soc. Agric. Mach. 2024, 55, 146–154, 175. [Google Scholar]
  15. Deng, S.; Zhao, Y.; Bai, X.; Li, X.; Sun, Z.; Liang, J.; Li, Z.; Cheng, S. Inversion of Chlorophyll and Leaf Area Index for Winter Wheat Based on UAV Image Segmentation. Trans. Chin. Soc. Agric. Eng. 2022, 38, 136–145. [Google Scholar]
  16. Li, M.; Zhu, X.; Bai, X.; Peng, Y.; Tian, Z.; Jiang, Y. Remote Sensing Inversion of Nitrogen Content in Apple Canopy Based on Shadow Removal in UAV Multi-Spectral Remote Sensing Images. Sci. Agric. Sin. 2021, 54, 2084–2094. [Google Scholar]
  17. Meng, D.; Zhao, J.; Lan, Y.; Yang, C.; Yang, D.; Wen, Y. Study on SPAD Inversion Model of Maize Canopy Based on UAV Visible Light Images. Trans. Chin. Soc. Agric. Mach. 2020, 51 (Suppl. S2), 366–374. [Google Scholar]
  18. Zhang, N.; Zhang, X.; Bai, T.; Yuan, X.; Ma, R.; Li, L. Field Scale Cotton Land Feature Recognition Based on UAV Visible Light Images in Xinjiang. Trans. Chin. Soc. Agric. Mach. 2023, 54 (Suppl. S2), 199–205. [Google Scholar]
  19. Han, J.; Feng, C.; Peng, J.; Wang, Y.; Shi, D. Estimation of Leaf Area Index of Cotton from Unmanned Aerial Vehicle Multispectral Images with Different Resolutions. Cotton Sci. 2022, 34, 338–349. [Google Scholar]
  20. Jia, D.; Chen, P. Effect of Low-Altitude UAV Image Effect of Low—Altitude UAV Image Resolution on Inversion of Winter Wheat Nitrogen Concentration. Trans. Chin. Soc. Agric. Mach. 2020, 51, 164–169. [Google Scholar]
  21. Liu, Y.; Feng, H.; Sun, Q.; Yang, F.; Yang, G. Estimation Study of Above Ground Biomass in Potato Based on UAV Digital Images With Different Resolutions. Spectrosc. Spectr. Anal. 2021, 41, 1470–1476. [Google Scholar]
  22. Yuan, N.; Gong, Y.; Fang, S.; Liu, Y.; Duan, B.; Yang, K.; Wu, X.; Zhu, R. UAV Remote Sensing Estimation of Rice Yield Based on Adaptive Spectral Endmembers and Bilinear Mixing Model. Remote Sens. 2021, 13, 2190. [Google Scholar] [CrossRef]
  23. Lyngdoh, R.B.; Dave, R.; Anand, S.S.; Ahmad, T.; Misra, A. Hyperspectral Unmixing With Spectral Variability Using Endmember Guided Probabilistic Generative Deep Learning. In Proceedings of the GARSS 2022–2022 IEEE International Geoscience and Remote Sensing Symposium, Kuala Lumpur, Malaysia, 17–22 July 2022; IEEE: New York, NY, USA, 2022; pp. 1768–1771. [Google Scholar]
  24. Yu, F.; Zhao, D.; Guo, Z.; Jin, Z.; Guo, S.; Chen, C.; Xu, T. Characteristic Analysis and Decomposition of Mixed Pixels From UAV Hyperspectral Images in Rice Tillering Stage. Spectrosc. Spectr. Anal. 2022, 42, 947–953. [Google Scholar]
  25. Li, D.; Sun, Z.; Jia, G. Remote Sensing Image Analysis of Forest Land in Lushan Mountain and Its Surrounding Area Based on Mixed Pixel Decomposition. For. Inventory Plan. 2023, 48, 127. [Google Scholar]
  26. Su, X.; Wang, J.; Din, L.; Lu, J.; Zhang, J.; Yao, X.; Cheng, T.; Zhu, Y.; Cao, W.; Tian, Y. Grain Yield Prediction Using Multi-Temporal UAV-Based Multispectral Vegetation Indices and Endmember Abundance in Rice. Field Crops Res. 2023, 299, 108992. [Google Scholar] [CrossRef]
  27. Gong, Y.; Duan, B.; Fang, S.; Zhu, R.; Wu, X.; Ma, Y.; Peng, Y. Remote Estimation of Rapeseed Yield with Unmanned Aerial Vehicle (UAV) Imaging and Spectral Mixture Analysis. Plant Methods 2018, 14, 1–14. [Google Scholar] [CrossRef]
  28. Duan, B.; Fang, S.; Zhu, R.; Wu, X.; Wang, S.; Gong, Y.; Peng, Y. Remote Estimation of Rice Yield with Unmanned Aerial Vehicle (UAV) Data and Spectral Mixture Analysis. Front. Plant Sci. 2019, 10, 204. [Google Scholar] [CrossRef]
  29. Xu, H.; Lan, Y.; Zhang, S.; Tian, B.; Yu, H.; Wang, X.; Zhao, S.; Wang, Z.; Yang, D.; Zhao, J. Research on Vegetation Cover Extraction Method of Summer Maize Based on UAV Visible Light Image. Int. J. Precis. Agric. Aviat. 2018, 1, 44–51. [Google Scholar] [CrossRef]
  30. Liao, C.; Zhang, X.; Liu, Y. Remote Sensing Retrieval of Vegetation Coverage in Arid Areas Based on Multiple Endmember Spectral Unmixing. Chin. J. Appl. Ecol. 2012, 23, 3243–3249. [Google Scholar]
  31. Wang, Y.; Tan, S.; Jia, X.; Qi, L.; Liu, S.; Lu, H.; Wang, C.; Liu, W.; Zhao, X.; He, L.; et al. Estimating Relative Chlorophyll Content in Rice Leaves Using Unmanned Aerial Vehicle Multi-Spectral Images and Spectral–Textural Analysis. Agronomy 2023, 13, 1541. [Google Scholar] [CrossRef]
  32. Tian, J.; Yang, Z.; Feng, K.; Ding, X. Prediction of Tomato Canopy SPAD Based on UAV Multispectral Image. Trans. Chin. Soc. Agric. Mach. 2020, 51, 178–188. [Google Scholar]
  33. Tahir, M.; Naqvi, S.; Lan, Y.; Zhang, Y.; Wang, Y.; Afzal, M.; Cheema, M.; Amir, S. Real Time Estimation of Chlorophyll Content Based on Vegetation Indices Derived from Multispectral UAV in the Kinnow Orchard. Int. J. Precis. Agric. Aviat. 2018, 1, 24–31. [Google Scholar]
  34. Pan, F.; Li, W.; Lan, Y.; Liu, X.; Miao, J.; Xiao, X.; Xu, H.; Lu, L.; Zhao, J. SPAD Inversion of Summer Maize Combined with Multi-source Remote Sensing Data. Int. J. Precis. Agric. Aviat. 2018, 1, 45–52. [Google Scholar] [CrossRef]
  35. Dash, J.; Curran, P.J. The MERIS Terrestrial Chlorophyll Index. Int. J. Remote Sens. 2004, 25, 5403–5413. [Google Scholar] [CrossRef]
  36. Cao, Q.; Miao, Y.; Shen, J.; Yu, W.; Yuan, F.; Cheng, S.; Huang, S.; Wang, H.; Yang, W.; Liu, F. Improving in-season Estimation of Rice Yield Potential and Responsiveness to Topdressing Nitrogen Application with Crop Circle Active Crop Canopy Sensor. Precis. Agric. 2015, 17, 136–154. [Google Scholar] [CrossRef]
  37. Daughtry, C.T.; Walthall, C.L.; Kim, M.S.; Colstoun, E.B.D.; McMurtrey, J.E. Estimating Corn Leaf Chlorophyll Concentration from Leaf and Canopy Reflectance. Remote Sens. Environ. 2000, 74, 229–239. [Google Scholar] [CrossRef]
  38. Qi, H.; Wu, Z.; Zhang, L.; Li, J.; Zhou, J.; Jun, Z.; Zhu, B. Monitoring of Peanut Leaves Chlorophyll Content Based on Drone-based Multispectral Image Feature Extraction. Comput. Electron. Agric. 2021, 187, 106292. [Google Scholar] [CrossRef]
  39. Noh, H.; Zhang, Q. Shadow Effect on Multi-spectral Image for Detection of Nitrogen Deficiency in Corn. Comput. Electron. Agric. 2012, 83, 52–57. [Google Scholar] [CrossRef]
  40. Chen, P.; Liang, F. Cotton Nitrogen Nutrition Diagnosis Based on Spectrum and Texture Feature of lmages from Low Altitude Unmanned Aerial Vehicle. Sci. Agric. Sin. 2019, 52, 2220–2229. [Google Scholar]
Figure 1. Overview of the study area.
Agriculture 14 01452 g001
Figure 2. Experimental instruments. (a) DJI M300 with a Zenmuse Pl camera, (b) DJI M210 with MS600Pro multispectral camera. Note: The green box in (a) is the Zenmuse P1 camera (DJI, Shenzhen, China), and the red box in (b) is the MS600Pro multispectral camera (Yusense, Inc., Qingdao, China).
Agriculture 14 01452 g002
Figure 3. MESMA under different fertilization gradients. (a1a3) RGB images, (b1b3) MNF eigenvalue, (c1c3) enumerating pixels in an n-dimensional visualizer, (d1d3) outputting EM spectral.
Agriculture 14 01452 g003
Figure 4. Distribution of pure pixels at different flight altitudes. (a) 30 m; (b) 50 m; (c) 80 m.
Agriculture 14 01452 g004
Figure 5. Segmentation results at different flight altitudes. (a1a3) RGB images, (b1b3) NDCSI vegetation index threshold segmentation, (c1c3) SVM segmentation, (d1d3) SMA segmentation, (e1e3) MESMA segmentation.
Agriculture 14 01452 g005
Figure 6. MESMA abundance inversion result map (flight altitude 80 m). (a) cotton; (b) shadow; (c) soil.
Agriculture 14 01452 g006
Figure 7. Correlation between cotton SPAD and vegetation indices at 30 m.
Agriculture 14 01452 g007
Figure 8. Correlation between cotton SPAD and vegetation indices at 50 m.
Agriculture 14 01452 g008
Figure 9. Correlation between cotton SPAD and vegetation indices at 80 m.
Agriculture 14 01452 g009
Figure 10. Inversion results of the optimal cotton SPAD model at different flight altitudes: (a) 30 m; (b) 50 m; (c) 80 m.
Agriculture 14 01452 g010
Figure 11. SPAD distribution map of cotton.
Agriculture 14 01452 g011
Table 1. Descriptive statistics of cotton SPAD under different nitrogen application gradients.
Nitrogen Fertilizer
Gradient
Number of Cotton SPAD
Observed
MeanMaxMinSDCV (%)
N1 region2046.9451.142.02.585.49
N2 region2050.8654.846.32.404.71
N3 region2049.6253.344.22.444.91
whole region6049.1354.8423.166.43
Table 2. Percentage of mixed and pure pixels at different flight altitudes.
AltitudeMixed Pixels %Cotton Pixels %Soil Pixels %Shadow Pixels %
30 m58.2%23.5%14.2%4.1%
50 m66.7%17.4%12.1%3.8%
80 m76.4%11.1%9.6%2.9%
Table 3. Vegetation indices calculation formula.
Vegetation IndexCalculation FormulaReference
Atmospheric resistant vegetation index (ARVI) A R V I = [ N I R 2 R B / [ N I R + 2 R B ] [31]
Chlorophyll vegetation index (CVI) C V I = ( N I R / G ) ( R / G )   [32]
Normalized difference vegetation index (NDVI) N D V I = ( N I R R ) / ( N I R + R ) [33]
Green normalized difference vegetation index (GNDVI) G N D V I = ( N I R G )/( N I R + G )[34]
Meris terrestrial chlorophyll index (MTCI) M T C I = ( N I R R E G )/( R E G R )[35]
Rededge normalized difference vegetation index (RENDVI) R E N D V I = ( N I R R E G )/( N I R + REG)[36]
Modified chlorophyll absorption reflectance index (MCARI) M C A R I = [ ( R E G R ) 0.2 ( R E G G ) ] ( R E G / R ) [37]
Leaf chlorophyll index (LCI) L C I = ( N I R R E G ) / ( N I R + R ) [38]
Note: B, G, R, REG, and NIR are the reflectance of the blue band, green band, red band, red-edge band, and near-infrared 1 band, respectively.
Table 4. The accuracy of multispectral image segmentation using different methods.
Segmentation Method30 m50 m80 m
Cotton Proportion%Average Error%Cotton Proportion%Average Error%Cotton Proportion%Average Error%
VIT64.342.95%66.741.97%72.517.05%
65.5770.2676.83
66.8471.3477.39
SVM69.722.14%70.753.83%63.625.61%
70.7572.9462.22
71.5373.3862.91
SMA65.832.85%66.253.62%64.314.82%
64.6863.9761.69
66.5264.5265.14
MESMA67.141.74%66.362.55%65.823.61%
65.5265.1463.31
67.7066.4365.63
Table 5. Influence of image segmentation methods on the accuracy of SPAD inversion models for cotton (Flight altitude 30 m).
ModelSegmentation MethodTrainingValidation
R2RMSEMAER2RMSEMAE
PLSRAll pix0.6821.651.360.6371.591.43
VIT0.7251.531.240.6791.511.30
SVM0.7481.451.130.7061.431.15
SMA0.7381.471.180.6881.561.42
MESMA0.7531.431.170.7011.461.18
FRAll pix0.7251.521.270.6621.621.36
VIT0.7571.421.110.7031.511.22
SVM0.7741.371.160.7221.451.17
SMA0.7671.391.160.6961.531.31
MESMA0.7791.351.120.7281.431.16
SVRAll pix0.7681.311.050.7341.451.22
VIT0.8231.130.910.7721.351.13
SVM0.8411.070.760.7941.311.08
SMA0.8371.100.850.7861.321.11
MESMA0.8491.050.670.8101.271.04
Table 6. Influence of image segmentation methods on the accuracy of SPAD inversion models for cotton (Flight altitude 50 m).
ModelSegmentation MethodTrainingValidation
R2RMSEMAER2RMSEMAE
PLSRAll pix0.6681.741.380.6351.691.50
VIT0.6911.541.250.6481.651.44
SVM0.7071.501.260.6461.671.41
SMA0.7121.491.260.6591.561.34
MESMA0.7281.521.240.6721.521.32
FRAll pix0.6891.581.290.6331.761.55
VIT0.7121.511.190.6551.671.38
SVM0.7541.451.160.6851.551.42
SMA0.7401.461.140.6961.571.31
MESMA0.7691.321.010.7181.531.26
SVRAll pix0.7181.531.160.6821.621.33
VIT0.741.461.120.6991.571.25
SVM0.7681.310.950.7271.511.22
SMA0.7731.250.960.7441.481.21
MESMA0.8091.210.930.7781.461.16
Table 7. Influence of image segmentation methods on the accuracy of SPAD inversion models for cotton (Flight altitude 80 m).
ModelSegmentation MethodTrainingValidation
R2RMSEMAER2RMSEMAE
PLSRAll pix0.6061.801.410.5651.861.62
VIT0.6141.871.430.5341.941.67
SVM0.6511.681.350.6081.771.65
SMA0.6951.621.340.6411.651.58
MESMA0.7141.571.220.6631.541.48
FRAll pix0.6191.821.410.5541.821.68
VIT0.6261.751.450.5681.781.53
SVM0.6671.661.400.5911.751.51
SMA0.6871.601.250.6051.721.49
MESMA0.7321.481.160.6141.721.45
SVRAll pix0.6631.631.320.5911.881.61
VIT0.6711.641.370.6041.781.48
SVM0.6951.551.280.6251.741.50
SMA0.7211.521.230.6721.631.45
MESMA0.7401.461.120.6971.581.27
Disclaimer/Publisher’s Note: The statements, opinions and data contained in all publications are solely those of the individual author(s) and contributor(s) and not of MDPI and/or the editor(s). MDPI and/or the editor(s) disclaim responsibility for any injury to people or property resulting from any ideas, methods, instructions or products referred to in the content.

