Article

Characteristics of the Soil Organic Carbon Pool in Paddy Fields in Guangdong Province, South China

1
Key Laboratory of Plant Nutrition and Fertilizer in South Region, Ministry of Agriculture and Rural Affairs, Guangdong Key Laboratory of Nutrient Cycling and Farmland Conservation, Institute of Agricultural Resources and Environment, Guangdong Academy of Agricultural Sciences, Guangzhou 510640, China
2
College of Resources and Environment, Yangtze University, Wuhan 430100, China
3
Center of Agricultural Environment and Cultivated Land Quality Protection of Guangdong Province (Center of Agricultural and Rural Investment Project of Guangdong Province), Guangzhou 510599, China
*
Author to whom correspondence should be addressed.
Agriculture 2024, 14(9), 1457; https://doi.org/10.3390/agriculture14091457
Submission received: 2 July 2024 / Revised: 15 August 2024 / Accepted: 19 August 2024 / Published: 26 August 2024
(This article belongs to the Section Agricultural Soils)

Abstract

:
To understand the role of paddy soils in the global carbon cycle, it is necessary to analyze the characteristics of the organic carbon pool at different soil depths. It was hypothesized that soil organic carbon fractions including labile organic carbon fraction I (LOCF-I), labile organic carbon fraction II (LOCF-II), and recalcitrant organic carbon (ROC) distributed differently within the soil profile. In this study, soil was collected from 27 typical rice fields in Guangdong Province, south China. The carbon fractions of the paddy field soils were analyzed and compared over a 0–60 cm depth profile. The relationship between carbon content and the physical and chemical properties of the soils was further analyzed using correlation analysis and structural equation modeling. The results showed that soil total organic carbon concentration in paddy fields was increased by 22.1% during the last four decades. In the soil organic carbon pool of 0–60 cm profile, the proportion of 67.31 to 70.31% in ROC, 21.75 to 22.06% in LOCF-I, and 7.7 to 10.63% was recorded, respectively, indicating that ROC was the dominating fraction. Storage of soil total organic carbon and fractions all decreased with the increase in soil depth. Correlation and path analysis showed that total nitrogen was the main driving factor affecting the soil carbon fractions, whereas pH and soil bulk density indirectly affected the content of carbon fractions by influencing total nitrogen. The results imply the importance of soil total nitrogen in paddy carbon management of rice cultivation.

1. Introduction

Soil organic carbon (SOC) is a potentially large and uncertain source of carbon dioxide (CO2) emissions as well as a natural carbon sink that can reduce CO2 in the atmosphere. Thus, in the context of global warming, it has attracted increasing attention from researchers [1,2]. On the one hand, SOC is the most active fraction of the soil carbon pool, and even small changes can greatly affect the concentration of atmospheric CO2, which in turn impacts global climate. On the other hand, SOC is the core of soil nutrient conversion and the material basis of soil fertility, which is very important for improving soil conditions [3].
Soil organic carbon is the largest source of carbon storage in terrestrial ecosystems [4]. The theoretical potential for carbon sequestration in farmland soils is enormous [5]. The SOC content of paddy fields is much higher than that of dryland systems [6]. At the same time, the particulate organic carbon and mineral-associated organic carbon in the soil of paddy fields are significantly higher than those of dryland [7]. Soil organic carbon sequestration is conducive to reducing greenhouse gas emissions and improving soil fertility [8,9]. According to Zomer et al. (2017) [10], farmlands worldwide can absorb 0.90–1.85 Pg C annually. However, in China, Tang et al. (2022) [11] found that the annual carbon sequestration rate of rice was lower than that of carbon emissions from 2002 to 2017, during which the annual net emissions of rice were 195.49 Tg CO2 eq yr−1. This led us to consider the main role of paddy soil as a carbon source or sink. In this regard, Arachchige et al. (2018) [12] reported that soil acts as a carbon source or sink depending on the initial level of SOC, soil characteristics, and soil management capacity. In addition, the stability of SOC can act as a constraint on soil carbon emissions [13]. Therefore, understanding the levels of soil carbon fractions in SOC and the characteristics of soil carbon storage is crucial for mitigating global carbon emissions.
To make a deep insight into the speciation and dynamics of organic carbon in ecosystems, a number of studies have been conducted to evaluate the fractions of the soil organic carbon pool [14,15,16]. An acid hydrolysis method developed by Rovira and Vallejo (2022) [17] has been used extensively to identify the soil organic carbon pool. In this method, labile organic carbon fraction I (LOCF-I) and LOCF-II and the stable fraction recalcitrant organic carbon (ROC) is distinguished. Within the SOC pool, LOCF-I is the most important fraction, which is featured with a short turnover period, instability, easy decomposition, oxidation, and mineralization, as well as high mobility. Although LOCF-I accounts for a small proportion of the total SOC, it is often a sensitive indicator of changes in soil quality and land use [18]. Most studies have reported that the level of carbon emissions is mainly related to the labile organic carbon content in SOC pools [19,20,21]. The study of Blazier et al. (2016) [22] showed that the amount of labile organic carbon in the soil is directly related to the growth of microorganisms, which in turn affects the emission of greenhouse gases. Yagi et al. (1990) [23] noted that CH4 emissions and carbon susceptibility to mineralization are linear. In contrast, ROC generally refers to the fractions of soil organic matter (SOM) that are resistant to microbial decomposition or are protected by mineral soil particles [24,25]. ROC decomposes slowly, which determines the reserve and long-term stability of SOC [17]. Zhang and Zhou (2018) [26] reported that ROC controls the magnitude of SOM mineralization in temperate forests and proposed that the quantity of carbon stored in terrestrial soil largely depends on the magnitude of SOC mineralization. Therefore, it is important to understand the distribution characteristics of SOC fractions and the carbon storage of each carbon fraction in the soil.
Guangdong Province is a major rice production region in south China with a long history of rice cultivation and high annual carbon emissions from the double-cropping rice system. In recent years, most scholars have studied the differences in the carbon composition of different land-use types [27,28]; however, few researchers have systematically investigated the content and carbon storage of each carbon fraction in different soil profiles, especially for a wide range of soils at different scales and depths. In the future, soil organic carbon fractions should be considered as one of the important parameters in estimating the potential emissions of soil methane (CH4) from paddy fields [29].
The purpose of this study was to (1) clarify the content and carbon storage of LOCF-I, LOCF-II, and ROC at different soil depths and (2) determine the effects of different soil properties (pH, total nitrogen [TN], available phosphorus [AP], available potassium [AK], soil bulk density [SBD], and texture) on each organic carbon fraction in paddy soils. The findings in this study may provide basis data for the evaluation of spatiotemporal variations of the soil carbon pool in paddy fields under regional cultivation measures.

2. Materials and Methods
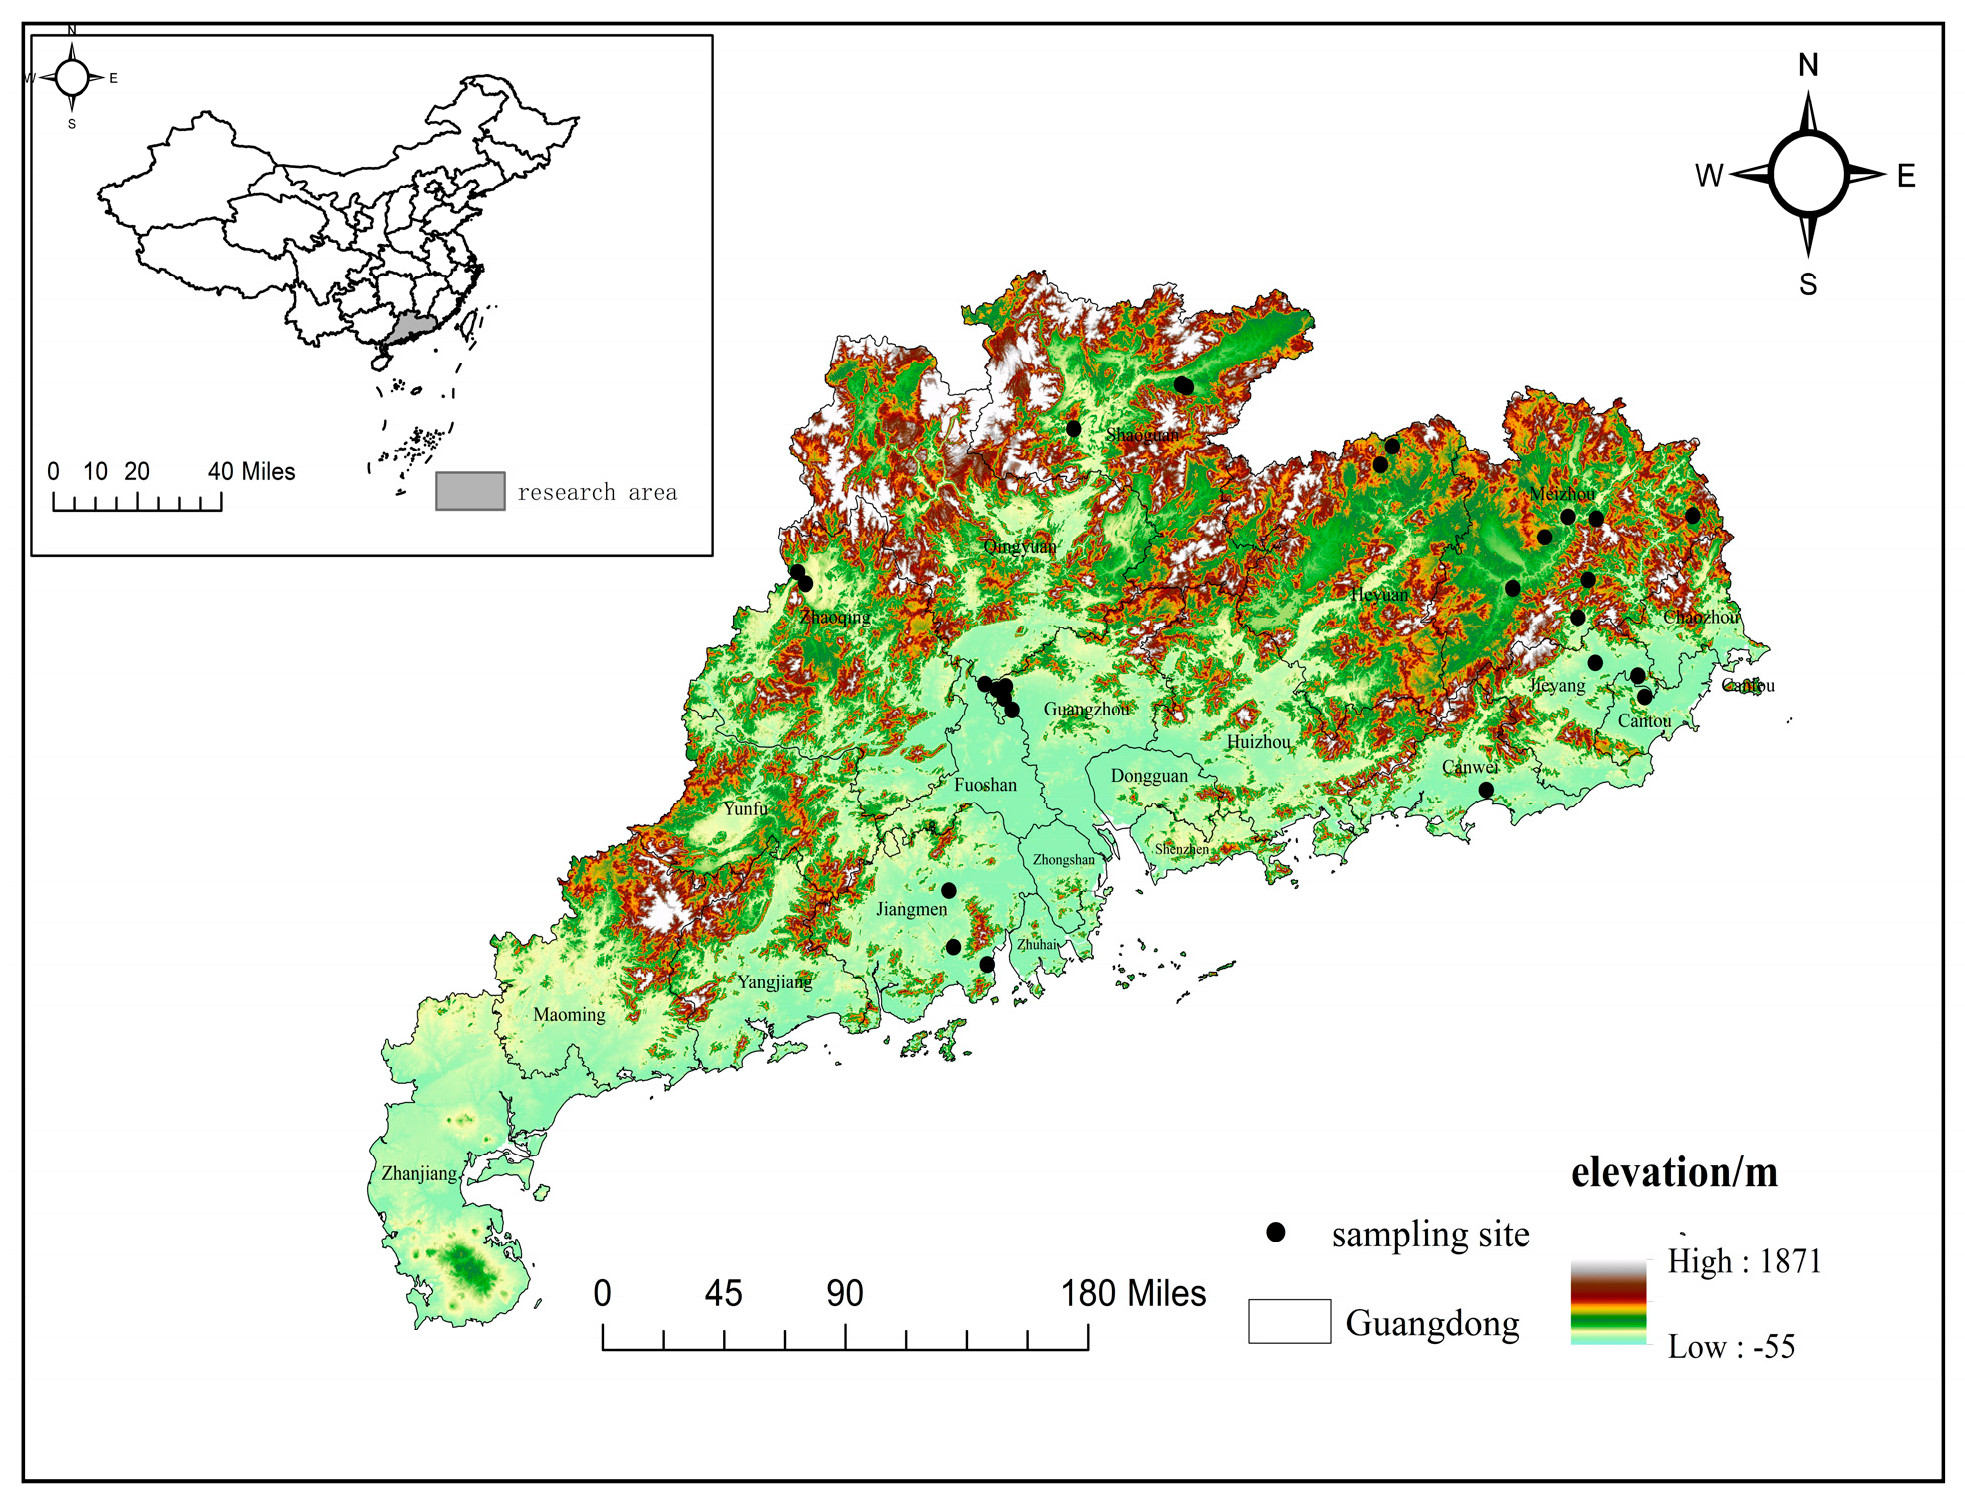
2.1. Study Area

This study was conducted in the Guangdong Province (20°09′~25°31′ N, 109°45′~117°20′ E), a large southern rice province in China (Figure 1). This area is located in the subtropics and has a typical subtropical monsoon climate characterized by hot, rainy summers and mild, humid winters. It is located on the southern coast of China with high terrain in the north and low terrain in the south. Guangdong Province has a high ambient temperature averaging 23 °C and abundant annual precipitation reaching 1899 mm.

2.2. Sample Collection

According to the principles of typicality and representativeness, 27 rice-field sampling sites in nine cities in Guangdong Province were excavated for cross-sectional soil sampling during November to December, 2021 (Figure 1). Samples were collected at three soil depths (0–20, 20–40, and 40–60 cm) from each plot (except for Guangzhou). In Guangzhou area, only 5 surface soil (0–20 cm) samples were collected from paddy fields, soil samples at deep soil layer (i.e., 20–40 cm and 40–60 cm) were omitted due to negligence. The collected soil samples were air-dried, crushed, and then filtered through a 2-mm sieve to remove plant residues and stone particles, and stored at room temperature (25 ± 2 °C).

2.3. Soil Analysis

2.3.1. Basic Physicochemical Properties

Soil pH was determined using a 1:2.5 soil:water suspension and a pH meter (FE28-FiveEasyTM Ph, Mettler Toledo, Zurich, Switzerland). Soil texture was determined using the hydrometer method and SBD using the ring knife method. SOC was determined following the wet digestion method described by Walkley and Black (1934) [30]; the percentage of organic matter in the soil was determined by multiplying the percentage of SOC by 1.724. The TN was analyzed using the Kjeldahl digestion and distillation procedure, AP using the Olsen method, and AK using flame photometry. A detailed description of the soil property analyses employed is provided by Lu (2000) [31].

2.3.2. Soil Organic Carbon Fractions

Soil labile organic carbon fractions (LOCF-I and LOCF-II) and ROC were isolated from SOC pool using sulfuric acid hydrolysis. LOCF-I was extracted by hydrolyzing the sample with 2.5 mol∙L−1 H2SO4 at 105 °C for 30 min. The liquid supernatant was collected and passed through a 0.45 μm filter. LOCF-II was extracted using 13 mol∙L−1 H2SO4 to hydrolyze residual soil samples at room temperature for 12 h, and then hydrolyzed with 1 mol∙L−1 H2SO4 for 3 h at 105 °C. The unhydrolyzed residue constituted the ROC [17]. The carbon fractions extracted from paddy soil mentioned above were analyzed by a carbon and nitrogen elemental analyzer (CN802,Velp, Usmate, Italy).

2.4. Soil Carbon Stocks

The storage of SOC and each carbon fraction was calculated using the following formula [32,33].
S O C s t o c k = S O C c o n t e n t × D × B / 10
S O C ( i F ) s t o c k = S O C ( i F ) c o n t e n t × D × B / 10
where S O C s t o c k is the reserves of SOC (t hm−2), S O C c o n t e n t is soil organic C content (g kg−1), S O C ( i F ) s t o c k is the soil i organic carbon fraction stock (t hm−2), S O C ( i F ) c o n t e n t is the soil i organic carbon fraction content (g kg−1), B is the soil bulk density (g cm−3), and D is the thickness of the soil layer (cm).

2.5. Statistical Analysis

Correlation analysis was performed with IBM SPSS statistics version 22.0. All figures were plotted using OriginPro 2024 (OriginLab Corporation, Northampton, MA, USA).
Kendall’s correlation was used to examine the correlation between organic carbon fractions and soil properties using the Origin 2024 software. Models affecting soil carbon fractions were assessed using Mplus version 7.4 to assess the influence of soil chemistry indicators on soil carbon fractions. To assess the goodness of fit of the model-fitted data, we used the following model-fitting metrics: root mean square error of approximation (RMSEA), comparative fit index (CFI), Tucker–Lewis index (TLI), and standardized root mean square residual difference (SRMR). The model “fits well” when RMSEA < 0.06, CFI > 0.95, TLI > 0.95, and/or SRMR < 0.05. Specified parameters were estimated using the maximum likelihood (ML) estimation procedure in MPlus.

3. Results

3.1. Soil Properties

Soil fertility is an important indicator of soil property and measures the ability of the soil to provide the various nutrients required for crop growth. Measurements of pH, SOM, TN, AP, and AK are basic indicators of the fertility level of farmland soil.
The parameter of pH describes the acidity and alkalinity of the soil; overly acidic and alkaline soils reduce the effectiveness of soil nutrients to varying degrees. In addition, soil pH affects greenhouse gas emissions, and dryland acidic soils (pH < 7.0) emit significantly more N2O than dryland alkaline soils (pH > 7.0) (Ren et al., 2017) [34]. Among the 27 paddy soils analyzed, the pH values of the typical paddy fields in Guangdong Province ranged from 4.66 to 7.77 (Table 1). According to the Standard for Nutrient Classification of soil census in China [35], 85.19% of the topsoil (0–20 cm) samples at all 27 sampling sites were acidic, and the rest were alkaline, reflecting obvious characteristics of zonal soil. TN represents the ability of the soil to supply nitrogen, which is used as a nutrient for crop growth and development. The TN content of the typical paddy topsoil in Guangdong Province ranged from 0.55 to 3.12 g kg−1 (mean 1.68 g kg−1) (Table 1). Based on the soil nutrient classification standards [35], the average concentration of TN was at the secondary level, and the soil TN was abundant. The surface soil AP concentration in the survey area ranged from 4.83 to 120.85 mg kg−1 (mean 36.65 mg kg−1) (Table 1). According to the soil nutrient classification standard [35], 70% of the soil AP belonged to richer categories. The surface soil AK concentration in the survey area ranged from 35.54 to 220.632 mg kg−1 (mean 83.50 mg kg−1) (Table 1). According to the soil nutrient classification standard, 66.67% of the soil AK belonged to the medium and above categories. The average SBD in the topsoil (1.31 g cm−3) was lower than that in the 20–40 cm and 40–60 cm layers, peaking in the 20–40 cm layer. At depths greater than 40 cm, the soil bulk density decreased, and the variation was small.

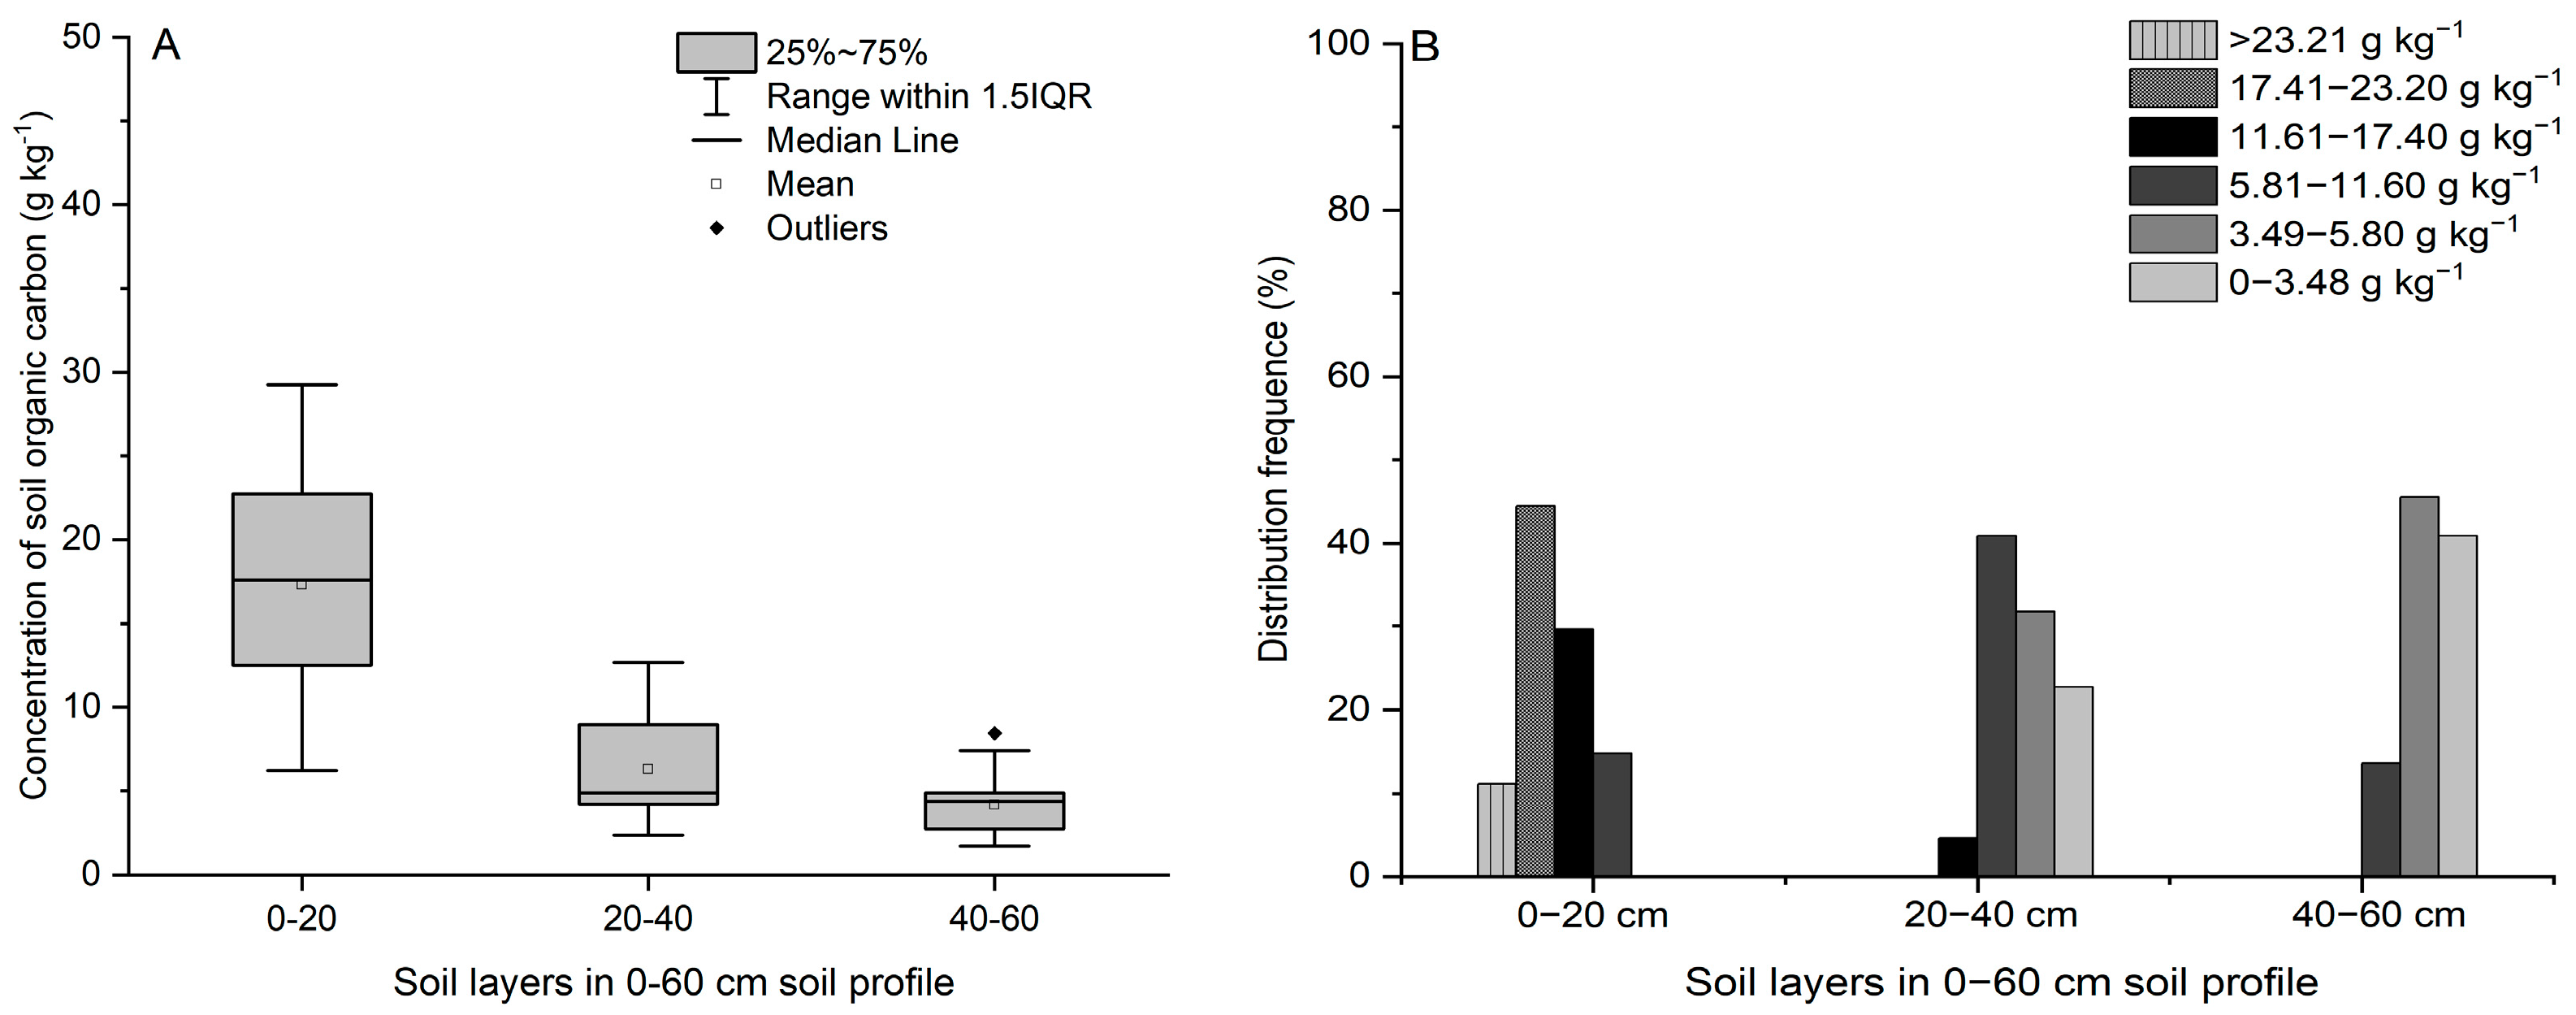
3.2. Soil Total Organic Carbon (SOC)

The soil total organic carbon content in the 0–60 cm soil layers decreased with increasing soil depth (Figure 2A). Soil total organic carbon content of the 0–20 cm soil layer ranged from 6.23 to 29.26 g kg−1 (mean 17.35 g kg−1). Comparatively, soil total organic carbon content in the 20–40 cm layer ranged from 2.36 to 12.66 g kg−1(mean 6.06 g kg−1), which was significantly lower than that in the 0–20 cm soil layer. The soil total organic carbon content of the 40–60 cm soil layer ranged from 1.14 to 10.31 g kg−1 (mean 3.97 g kg−1), which was lower than that in the surface layer (0–20 cm) and the subsurface layer (20–40) (Figure 2A).
For the paddy soil in Guangdong Province surveyed in the year of 1980, the concentration of 14.21 g kg−1 in total organic carbon of the surface soil (0–20 cm) was recorded [36]. It was indicated that the soil total organic carbon concentration increased by 22.1% during the past forty years. Soil fertility is evaluated by the classification criteria for soil nutrients in China [35], i.e., for soil total organic carbon concentration (SOC): SOC > 23.21 g kg−1 means extremely rich, 17.41 g kg−1 < SOC < 23.20 g kg−1 means rich, 117.61 g kg−1 < SOC < 17.40 g kg−1 means medium, 5.81 g kg−1 < SOC < 11.60 g kg−1 means medium low, 3.49 g kg−1 < SOC < 5.80 g kg−1 means insufficient, SOC < 3.48 g kg−1 means extremely insufficient. In this study, the surface soil total carbon concentration was mainly 17.41–23.20 g kg−1 (Figure 2B). In the soil layer of 20–40 cm, soil total organic carbon was concentrated between 3.49 and 11.60 g kg−1, and in the 40–60 cm soil layer, the soil total organic carbon concentration was less than 5.80 g kg−1 in most samples (Figure 2B).
In the research area, 27 samples from the surface soil layer (0–20 cm) and 22 samples each for the soil layers of 20–40 cm and 40–60 cm were collected (see details in Section 2.2). The data in Figure 2A represent the means and ranges of the soil total organic carbon concentration. The data in Figure 2B represent the frequency distribution of the soil total organic carbon concentration at different grade levels (six grade levels (g kg−1): 0–3.48, 3.49-5.80, 5.81–11.6, 11.61–17.40, 17.41–23.20, >23.21).
To further evaluate the change in carbon storage between soil layers in different paddy fields, the total SOC storage in the 0–60 cm layers were calculated according to formula (1) as described in the Materials and Methods. In Table 2, the main organic carbon stocks in the soil were concentrated in the 0–20 cm surface soil with a maximum organic carbon storage of 44.58 t hm−2. This was approximately two and four times that in the 20–40 cm and 40–60 cm layer, respectively.

3.3. Soil Organic C Fractions

3.3.1. Labile Organic Carbon Fraction I (LOCF-I)

In the analysis of all samples, the content of LOCF-I in the surface soil (0–20 cm) was higher than that in the 20–40 and 40–60 cm layers (Figure 3). The LOCF-I content in the 0–20 cm soil layer ranged from 1.06 to 7.58 g kg−1 (mean 3.74 g kg−1). The LOCF-I content in the 20–40 cm soil layer ranged from 0.4 to 2.99 g kg−1 (mean 1.28 g kg−1), and that in the 40–60 cm soil layer ranged from 0.29 to 1.59 g kg−1 (mean 0.87 g kg−1). The peak LOCF-I content in the surface soil was 2.54-fold higher than that in the 20–40 cm soil layer and nearly 5-fold higher than that in the 40–60 cm layer.
The labile organic carbon storage was calculated using Equation (2). The topsoil LOCF-I storage was 9.54 t hm−2, accounting for 59.03% of the total LOCF-I storage across the 0–60 cm layers. The 20–40 cm LOCF-I storage was less than half of the surface layer LOCF-I storage (Table 3).

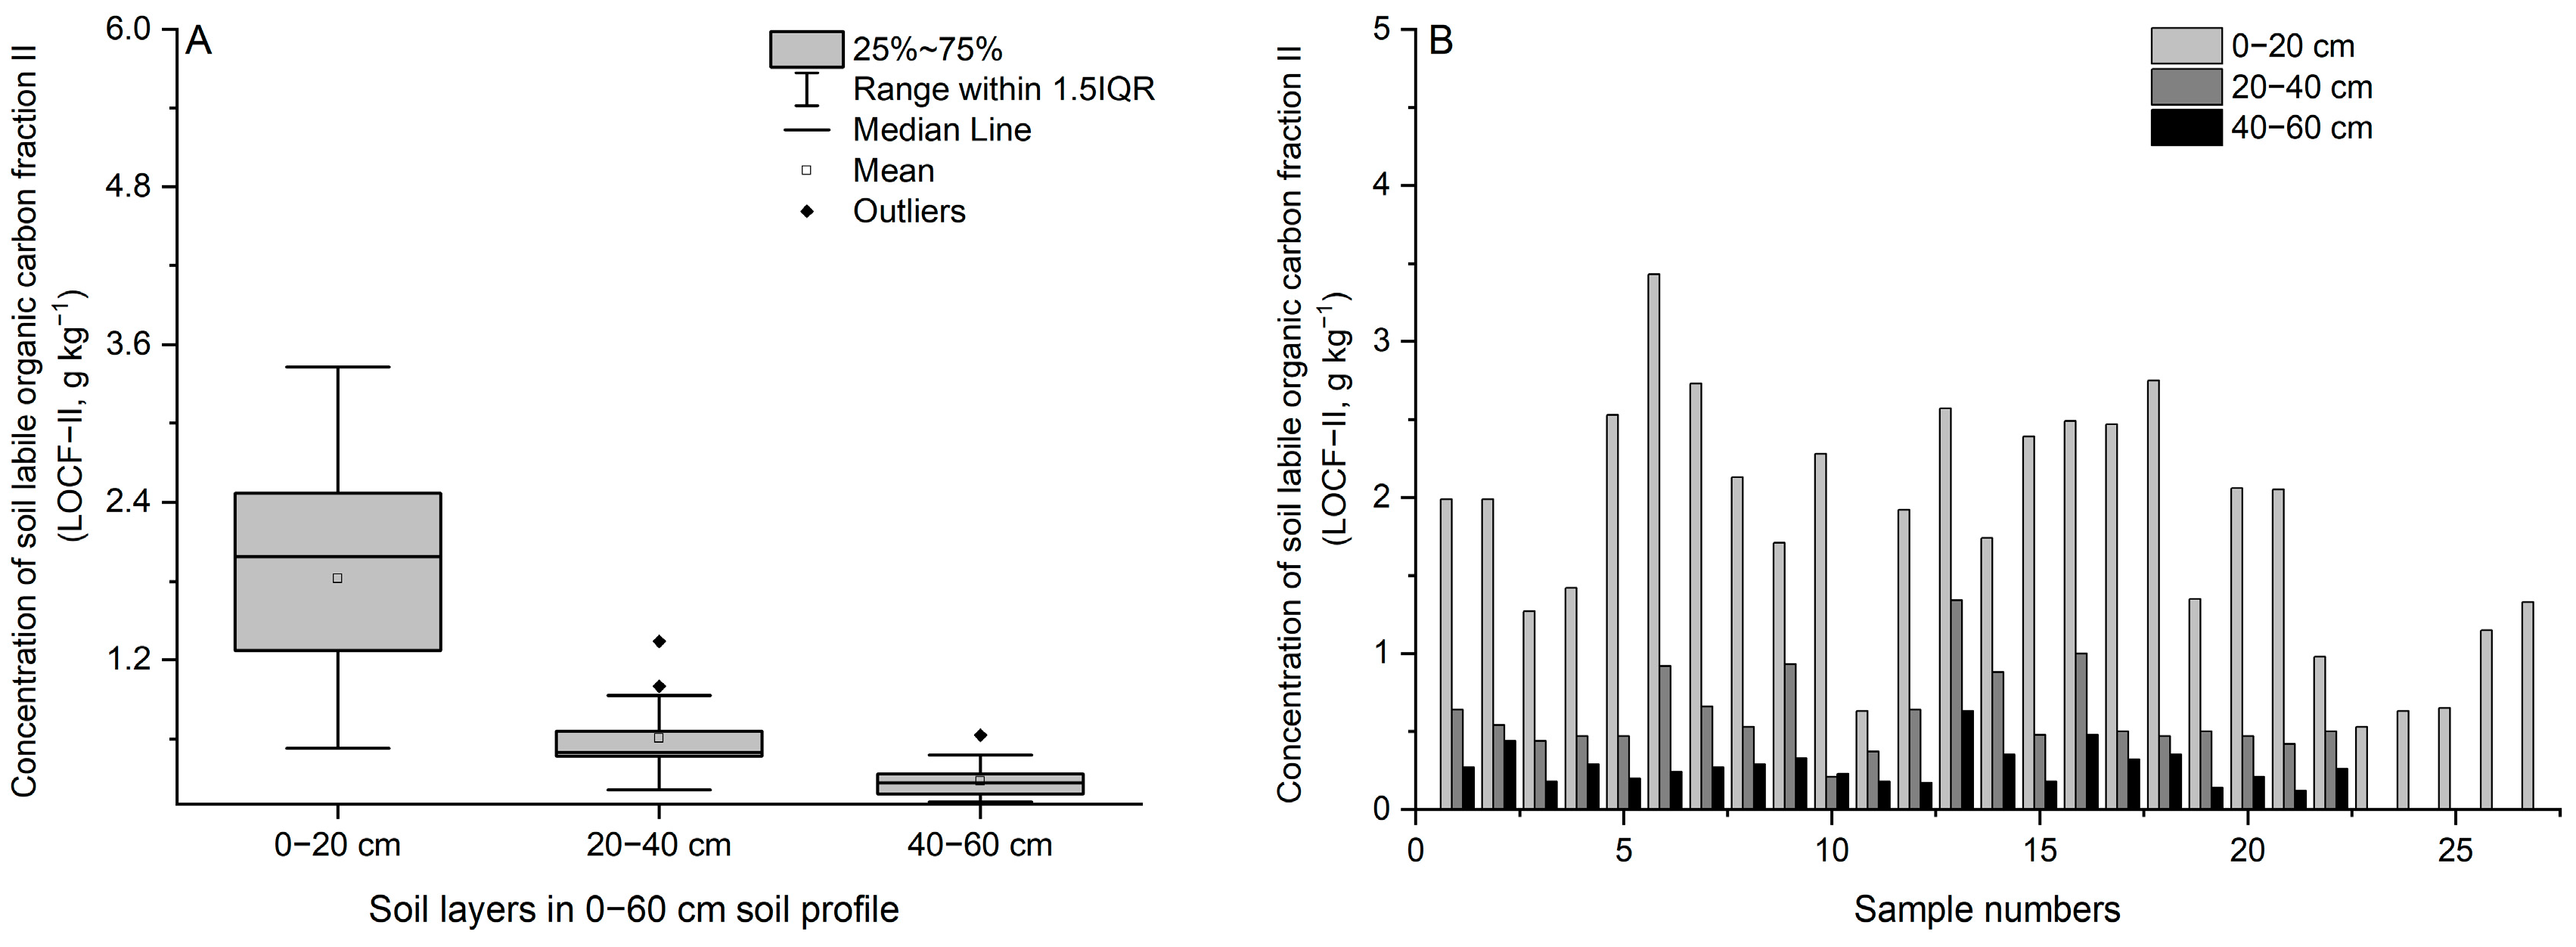
3.3.2. Soil Labile Organic Carbon Fraction II

The LOCF-II content of the 0–20 cm soil layer ranged from 0.53 to 3.43 g kg−1 (mean 1.82 g kg−1), that of the 20–40 cm soil layer ranged from 0.21 to 1.34 g kg−1 (mean 0.61 g kg−1), and that of the 40–60 cm soil layer ranged from 0.12 to 0.63 g kg−1 (mean 0.28 g kg−1) (Figure 4A,B).
In soil profile (0–60 cm), the LOCF-II storage was primarily concentrated in the topsoil (63.12% of the total LOCF-II storage). In soil layer of 20–40 cm and 40–60 cm, the proportion of LOCF-II in soil profile (0–60 cm) was 25.98 and 10.90%, respectively (Table 4).

3.3.3. Soil Recalcitrant Organic Carbon (ROC)

ROC usually has a turnover time of 50–3000 years, which reflects its relative stability, determining the reserve and long-term stability of SOC. The ROC content ranged from 4.39 to 18.24 g kg−1 (mean 11.78 g kg−1) in the 0–20 cm soil layer, 1.11 to 8.33 g kg−1 (mean 4.17 g kg−1) in the 20–40 cm soil layer, and 0.15 to 8.65 g kg−1 (mean 2.83 g kg−1) in the 40–60 cm soil layer, respectively (Figure 5 and Table 5).
The ROC storage in the 0–20 cm layer was 2.32 times and 3.79 times that in the 20–40 cm and 40–60 cm layer, respectively (Table 5). It is worth noting that whether it was labile carbon or recalcitrant carbon, the carbon storage of the topsoil was always higher than that of the deeper soil.

3.4. Composition of Soil Organic Carbon Pool

The concentration of soil carbon fractions, i.e., LOCF-I, LOCF-II, and ROC, decreased with the increase in soil depth (Table 6). In 0–60 cm, the proportion of ROC in the soil total carbon pool varied between 67.31 and 70.31%, indicating that ROC is the predominant fraction of soil organic carbon. It was observed that the proportion of LOCF-I in the soil total carbon pool (21.75 to 22.06%) was higher than that of LOCF-II (7.7 to 10.63%), suggesting that LOCF-II dominated a minor part of soil organic carbon (Table 6). The three carbon fractions in the soil total carbon pool showed the following order: ROC > LOCF-I > LOCF-II.

3.5. Correlations between Soil Organic C Concentrations and Soil Properties

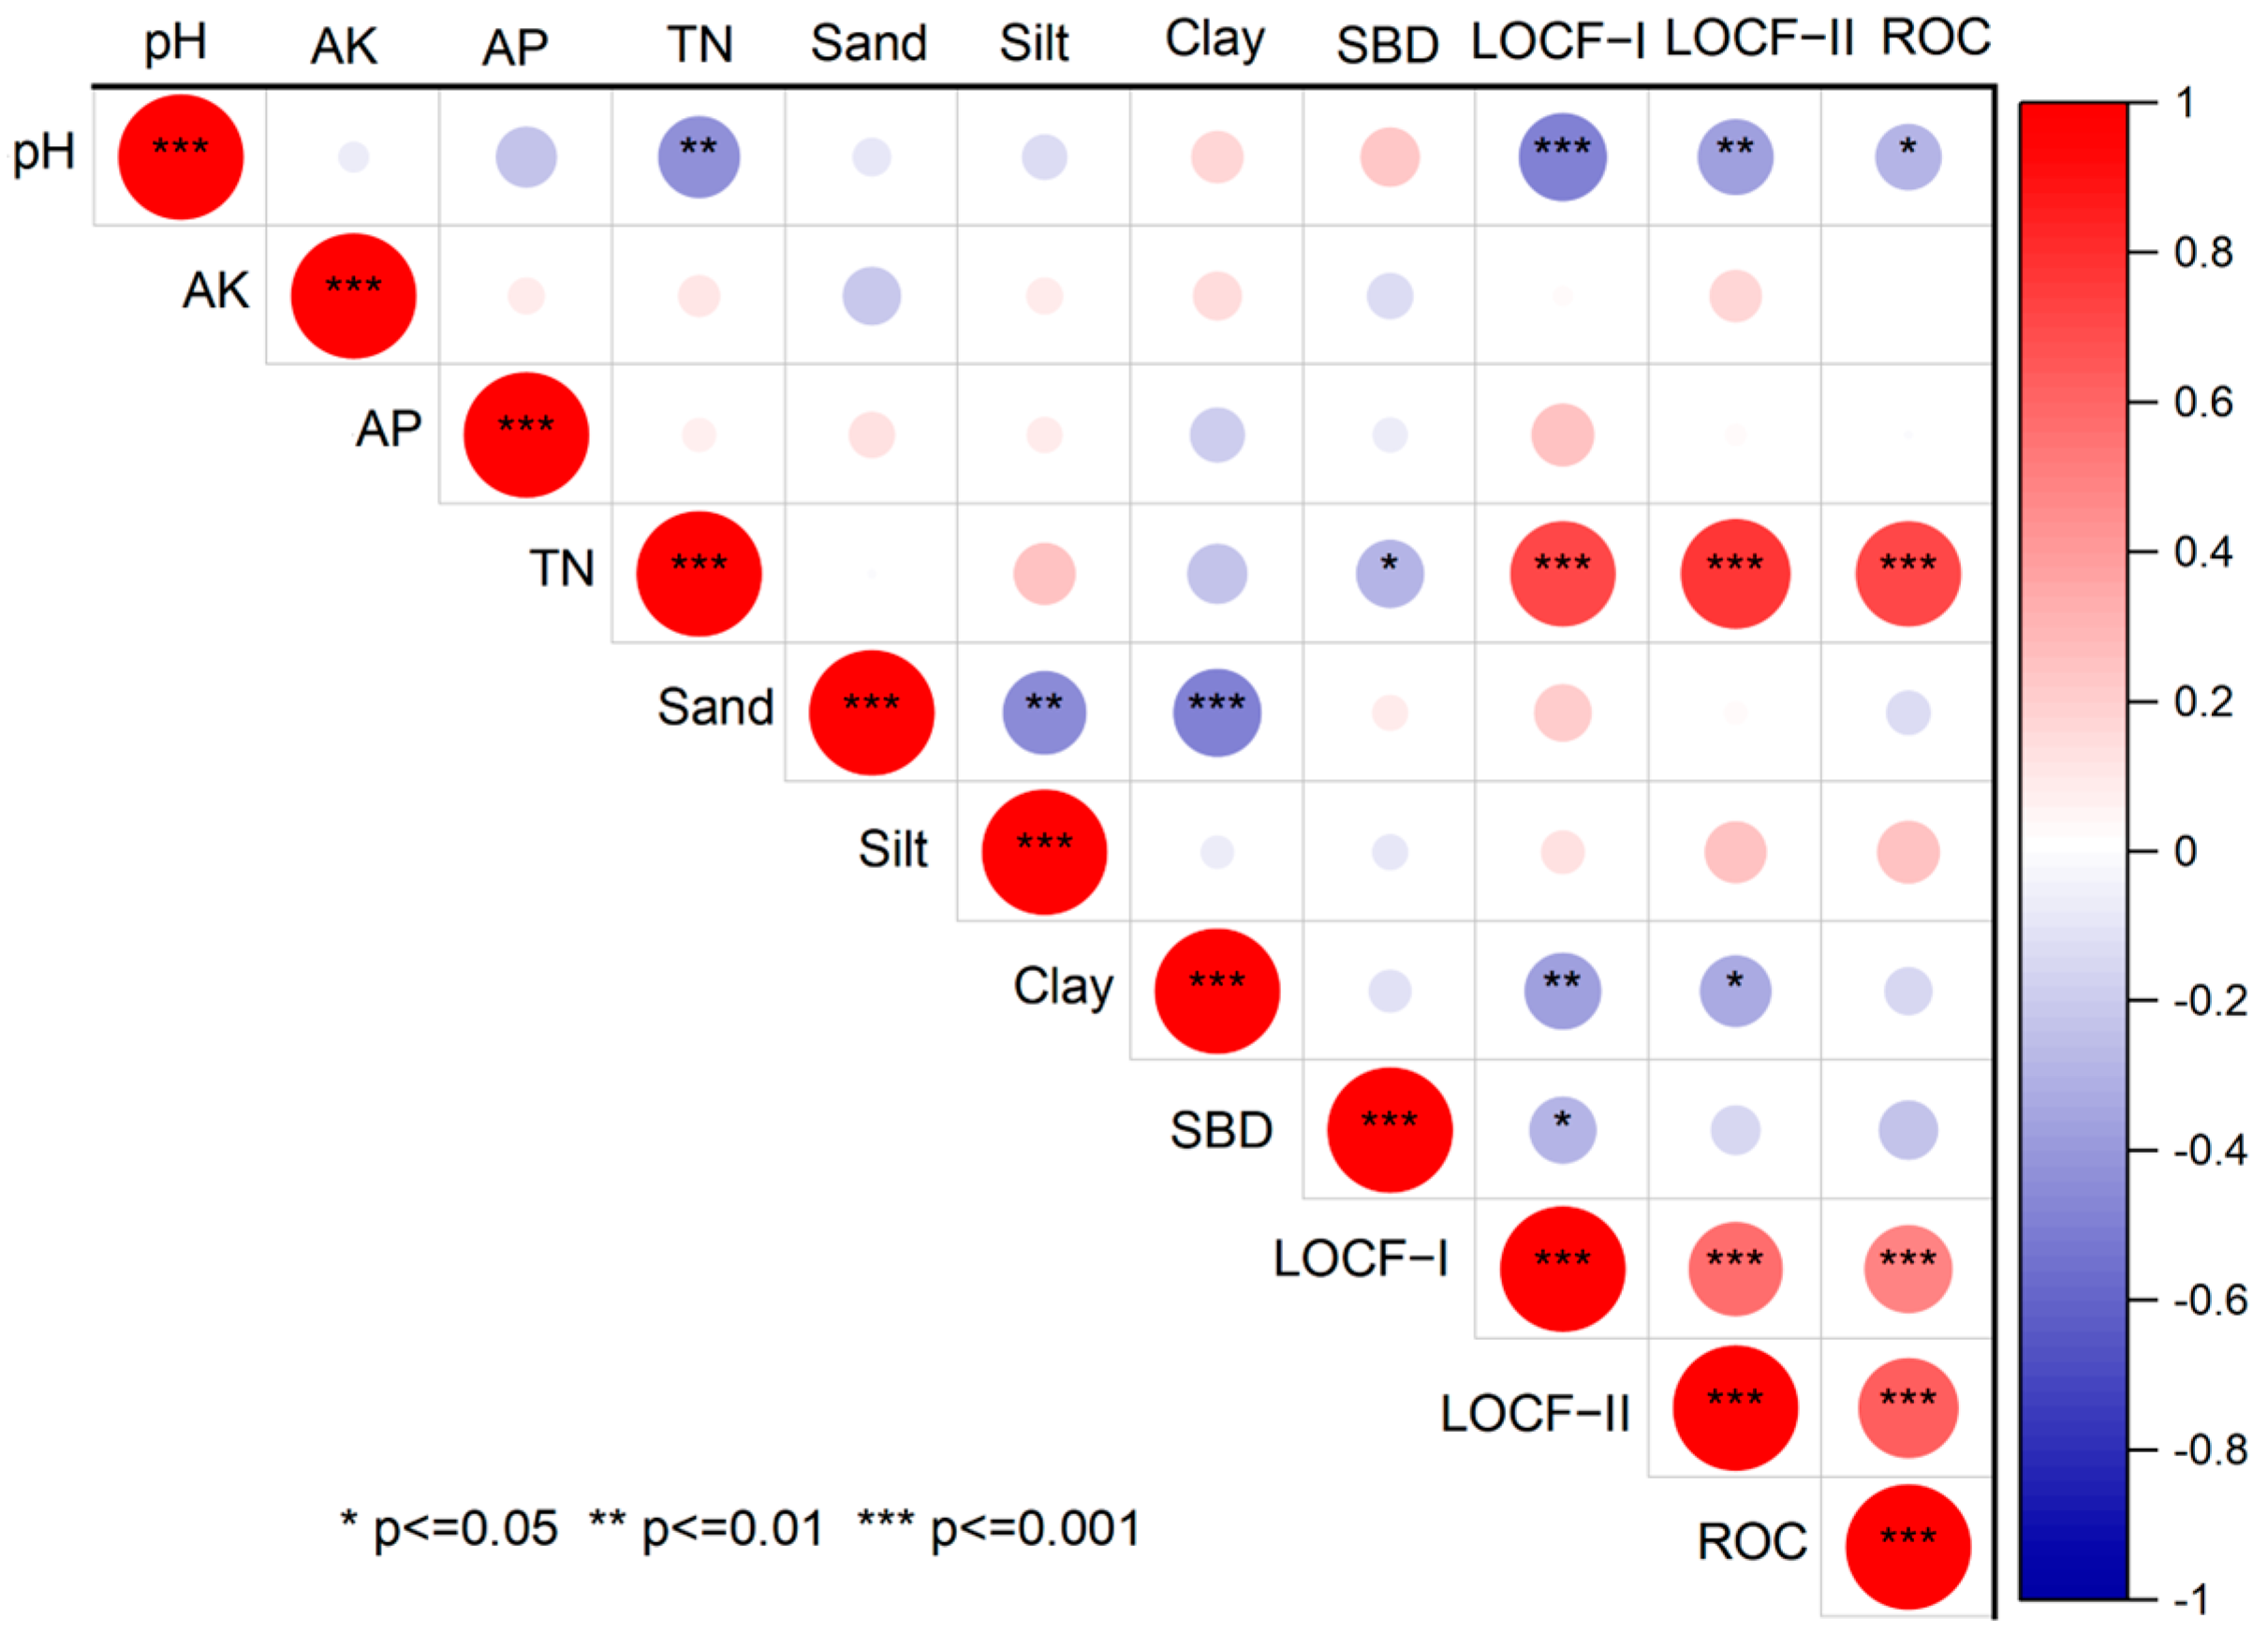
3.5.1. Correlation Analysis

The relationships between soil properties and organic carbon fractions are displayed in Figure 6. Kendall’s correlation analysis showed that the content of LOCF-I was significantly correlated with pH and TN, clay, and SBD content. The content of both LOCF-II and ROC was significantly associated with pH and TN. However, no significant correlations were detected between the AK, AP, and the carbon fractions of the soil (Figure 6).
TN was found to be an important factor influencing the soil carbon composition. The TN was positively correlated with the content of each carbon fraction (p < 0.001). In addition, a negative correlation was observed between pH and TN (p < 0.01), and SBD was significantly negatively correlated with TN (p < 0.01).

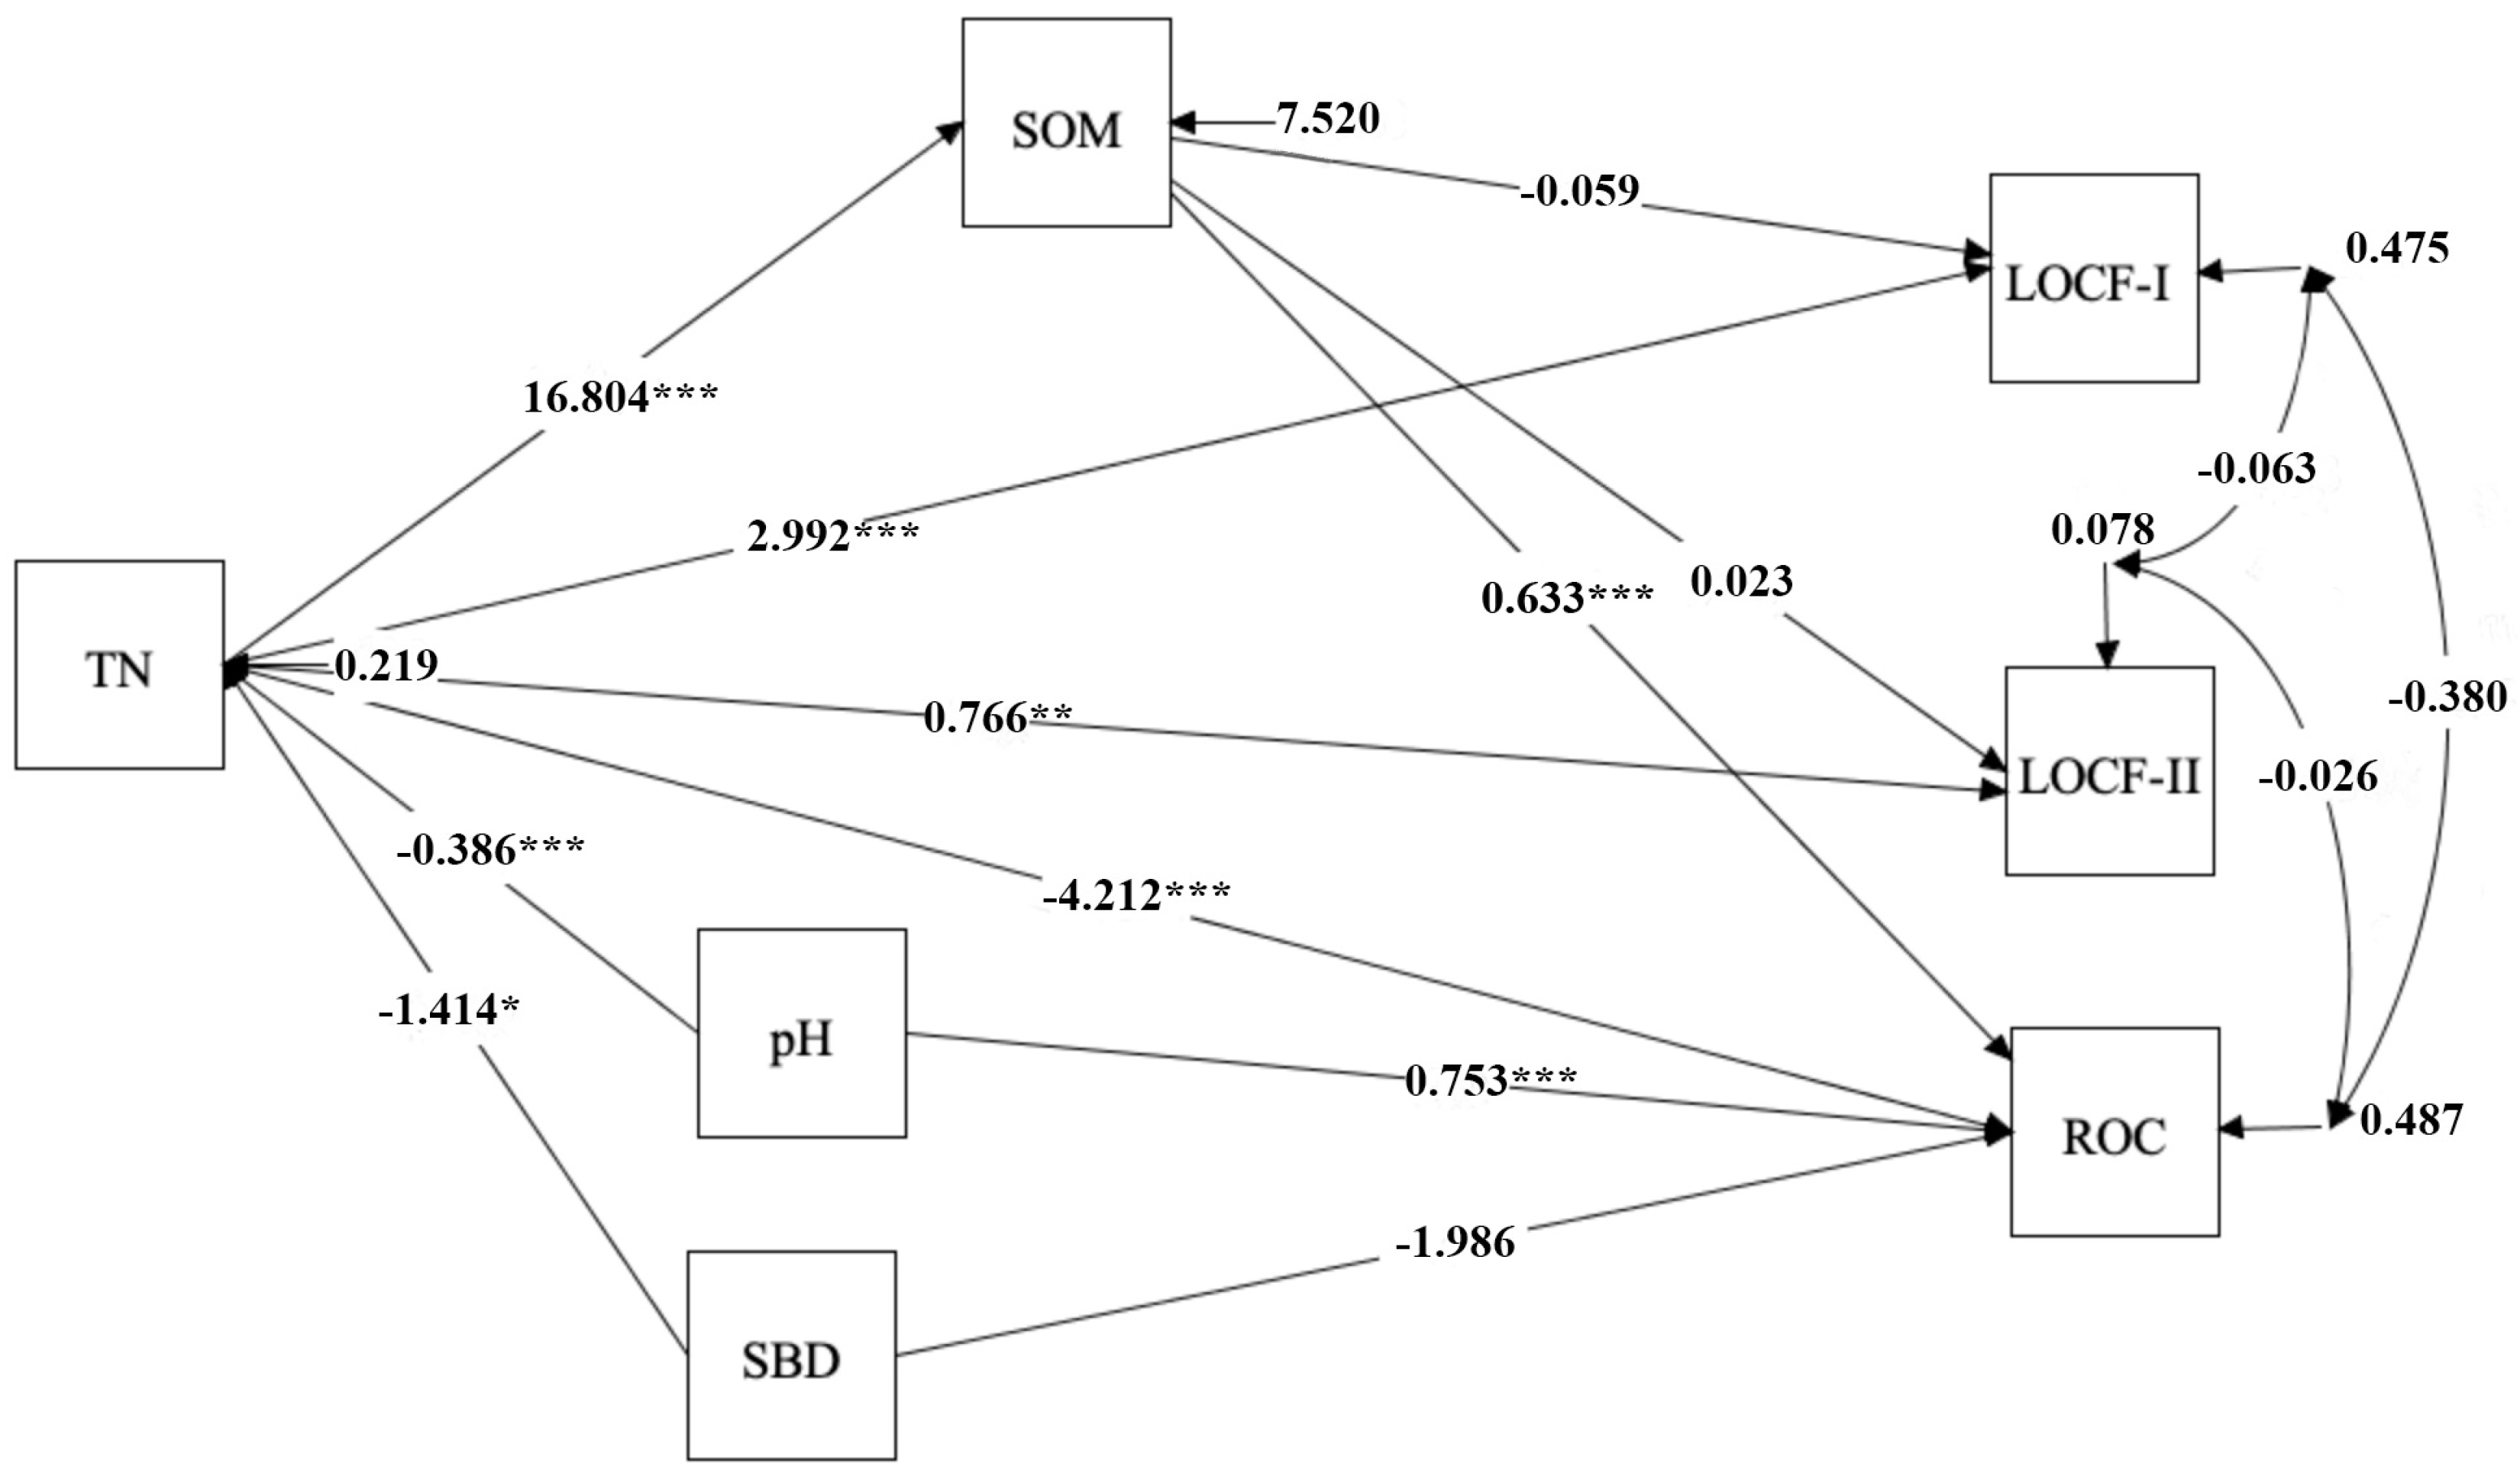
3.5.2. Path Analysis

Path analysis is a useful tool to identify the relative importance of the dependent variables by using the correlation decomposition method between the independent and dependent variables. There were direct effects of TN on SOM (b = 16.804, p < 0.001), LOCF-I (b = 2.992, p < 0.001), LOCF-II (b = 0.766, p < 0.01), and ROC (b = −4.212, p < 0.001) (Figure 7). The direct effects of pH on ROC were also significant (b = 0.753, p < 0.001). Although direct effects of pH on LOCF-I and LOCF-II were not significant, the indirect effects were significant (b = 1.15, p < −0.001 and b = 0.30, p < −0.001, respectively). At the same time, SBD (b = −1.404, p < 0.05) had an impact on TN and because TN is a mediating variable, there was an indirect impact on LOCF-I, LOCF-II, and ROC. Path analyses revealed that TN was directly related to soil carbon content.

4. Discussion

Guangdong Province is located in the subtropical monsoon climate zone, facilitating the year-round production of rice due to the sufficient water and light resources. Generally, in this region, there are two crops for rice cultivation in a year, i.e., early rice season between March and July and late rice season between August and November. Farmers usually return the rice straw to paddy fields after rice harvest in order to use the rice straw as nutrient resources for the later season crop. A number of studies have identified that returning rice straw contributes to the buildup of the soil organic carbon pool in paddy fields [37,38]. Currently, the percentage of seasonal rice straw returned to paddy fields is 80.57% in Guangdong Province [39]. The increase of rice yields during the last four decades due to chemical fertilizer application enhanced the rice straw returning to fields in this area [39]. At the provincial scale, the rice yield of 4084.8 kg hm−2 in the year of 1980 was increased to 6038.6 kg hm−2 in the year of 2022 [40], indicating that rice yields, namely, rice straw yields were approximately enhanced by 47.8% over the past 40 years. In addition, some farmers in the research area are accustomed to applying farmyard manure to paddy fields before the rice transplanting. The cultivation practices involved in the regional rice production favored carbon sequestration in paddy soils in Guangdong Province during the past 40 years. Zhang et al. (2024) [41] found that organic carbon content in the topsoil increased by 17.85% under cultivated measures with more than 5 years. The soil organic carbon concentration in the paddy fields of this study showed a similar changing trend as observed on the national scale.
In the terrestrial ecosystems, soil organic carbon was generally found to be richer in natural systems (i.e., forest land, grassland, wetland, and so on) than that in cultivated croplands [42,43,44,45]. Paddy field is a special cultivated wetland. The tested soil in this study is latosolic red soil, the soil organic carbon concentration is lower than that in black soil [46], but similar to that in purple soil [47], red soil [48], laterite soil [49], and dark brown soil [50]. In soil systems, organic carbon fractions are deemed to be more important and effective indicators than total organic carbon in evaluating soil carbon cycling under different tillage management [51]. The soil organic carbon pool was divided into different fractions based on carbon turnover and sensibility to ambient factors, i.e., labile organic carbon fractions (fraction I and II) and recalcitrant organic carbon [52]. The labile organic carbon fraction I indicates soil fertility and reflects the carbon dynamics and nutrient supplying potential. Both labile organic carbon fractions I and II control the loss of soil nutrients. For recalcitrant organic carbon, it maintains the soil carbon storage and stability [53]. In the total organic carbon pool of soils in this study, recalcitrant organic carbon was found to be the major fraction, and the labile organic carbon fraction was in a minor proportion, similar findings were also reported in paddy fields [54], grassland [55], orchards [56], and upland [57].
Storage of organic carbon in the soil profile usually displays a decreasing trend with the increase in soil depth because organic carbon accumulation largely depends on vegetation and its productivity [58]. In addition, soil properties are the important factors affecting organic carbon accumulation, decomposition, and other biochemical processes. Several studies revealed that soil pH and total nitrogen correlated significantly with the organic carbon fraction [57,59] as observed in the current study. Previous studies indicated that the absorption of nutrients by plants was unfavorably affected by elevation of soil pH, impeding the accumulation of soil organic carbon. Soil total nitrogen directly contributes to the buildup of the organic carbon pool as the increase in total nitrogen enhances the plant biomass, shoot nitrogen accumulation, and decreases the carbon to nitrogen ratio, boosting the decay of litter and increasing the organic carbon content [60]. Soil bulk density correlated negatively with soil organic carbon in a mangrove forest land [61], which exhibited a similarity with our findings. It was observed that soil porosity decreased with the increase in bulk density, restricting the infiltration of soil water and input of organic matter, which led to a decrease in soil organic carbon [62]. The inverse correlation between soil clay proportion and labile carbon fractions observed in the current study could be because the clay promoted microbial turnover and decomposition of litter carbon inputs, enhancing microbial carbon (the labile carbon fraction) inclusion into the stabilized organic carbon pool as reported by Mao et al. (2024) [63].

5. Conclusions

It was found that the concentration of total organic carbon in the topsoil of paddy fields in Guangdong Province, south China, has increased by 22.1% over the last four decades. Soil organic carbon including labile organic carbon fraction I, labile organic carbon fraction II, and recalcitrant organic carbon mainly accumulated in the surface soil layer (0–20 cm) and decreased with the increase in soil depth. In the soil profile, recalcitrant organic carbon is the dominating fraction, followed by the labile organic carbon fraction I and the labile organic carbon fraction II. Soil pH, content of total nitrogen, clay as well as bulk density are key factors affecting the soil organic carbon pool. Particularly, soil total nitrogen exhibited positive effects on all organic carbon fractions. Results indicated that rational application of nitrogen fertilizer should be considered as important measures to control soil methane emissions during rice cultivation in Guangdong Province.

Author Contributions

Conceptualization, L.H. and J.N.; methodology, J.N. and Y.C.; software, L.H. and Z.L.; formal analysis, W.L. and Y.C.; resources, J.Y., R.Z. and Z.Z.; data curation, X.S. and R.W.; writing—original draft preparation, L.H.; writing—review and editing, J.N. and Z.L. All authors have read and agreed to the published version of the manuscript.

Funding

This research was jointly funded by the Low Carbon Agriculture and Carbon Neutralization Research Center, GDAA (XTXM202204), the National Natural Science Foundation of China (31701996), the Science and Technology Planning Project of Guangdong Province, China (2021B1212050019), and the Soil Profile Excavation and Cultivation Records Collection for the Monitored Cultivated Land of Guangdong Province (ZHS-KY 2021HX064).

Institutional Review Board Statement

Not applicable.

Data Availability Statement

Lijiang Hu and Jiangfeng Ning are responsible for data keeping, and data are available upon request.

Conflicts of Interest

The authors declare no conflicts of interest.

References

  1. Crowther, T.W.; Todd-Brown, K.E.; Rowe, C.W.; Wieder, W.R.; Carey, J.C.; Machmuller, M.B.; Snoek, B.L.; Fang, S.; Zhou, G.; Allison, S.D.; et al. Quantifying global soil carbon losses in response to warming. Nature 2016, 540, 104–108. [Google Scholar] [CrossRef]
  2. Hicks Pries, C.E.; Castanha, C.; Porras, R.C.; Torn, M.S. The whole-soil carbon flux in response to warming. Science 2017, 355, 1420–1423. [Google Scholar] [CrossRef] [PubMed]
  3. Zhou, Z.; Zeng, X.; Chen, K.; Li, Z.; Guo, S.; Shangguan, Y.; Yu, H.; Tu, S.; Qin, Y. Long-term straw mulch effects on crop yields and soil organic carbon fractions at different depths under a no-till system on the Chengdu Plain, China. J. Soils Sediments 2019, 19, 2143–2152. [Google Scholar] [CrossRef]
  4. Lee, X.; Huang, Y.; Huang, D.; Hu, L.; Feng, Z.; Cheng, J.; Wang, B.; Ni, J.; Shurkhuu, T. Variation of Soil Organic Carbon and Its Major Constraints in East Central Asia. PLoS ONE 2016, 11, e0150709. [Google Scholar] [CrossRef]
  5. Smith, P.; Trines, E. Commentary: Agricultural measures for mitigating climate change: Will the barriers prevent any benefits to developing countries? Int. J. Agric. Sustain. 2011, 4, 173–175. [Google Scholar] [CrossRef]
  6. Feng, S.; Tan, S.; Zhang, A.; Zhang, Q.; Pan, G.; Qu, F.; Smith, P.; Li, L.; Zhang, X. Effect of household land management on cropland topsoil organic carbon storage at plot scale in a red earth soil area of South China. J. Agric. Sci. 2011, 149, 557–566. [Google Scholar] [CrossRef] [PubMed]
  7. Zhao, Z.; Zhao, Z.; Fu, B.; Wang, J.; Tang, W. Characteristics of soil organic carbon fractions under different land use patterns in a tropical area. J. Soils Sediments 2020, 21, 689–697. [Google Scholar] [CrossRef]
  8. Hua, K.; Wang, D.; Guo, X.; Guo, Z. Carbon sequestration efficiency of organic amendments in a long-term experiment on a vertisol in Huang-Huai-Hai Plain, China. PLoS ONE 2014, 9, e108594. [Google Scholar] [CrossRef]
  9. Lal, R. Offsetting China’s CO2 Emissions by Soil Carbon Sequestration. Clim. Chang. 2004, 65, 263–275. [Google Scholar] [CrossRef]
  10. Zomer, R.J.; Bossio, D.A.; Sommer, R.; Verchot, L.V. Global sequestration potential of increased organic carbon in cropland soils. Sci. Rep. 2017, 7, 15554. [Google Scholar] [CrossRef]
  11. Tang, J.; Liu, T.; Yang, J.; Nie, J.; Xing, J.; Zhang, L.; Zhang, W.; Tang, W.; Cao, C. Current status of carbon neutrality in Chinese rice fields (2002-2017) and strategies for its achievement. Sci Total Environ. 2022, 842, 156713. [Google Scholar] [CrossRef]
  12. Arachchige, P.S.P.; Hettiarachchi, G.M.; Rice, C.W.; Dynes, J.J.; Maurmann, L.; Wang, J.; Karunakaran, C.; Kilcoyne, A.L.D.; Attanayake, C.P.; Amado, T.J.C.; et al. Sub-micron level investigation reveals the inaccessibility of stabilized carbon in soil microaggregates. Sci. Rep. 2018, 8, 16810. [Google Scholar] [CrossRef]
  13. Di, J.; Xu, M.; Zhang, W.; Tong, X.; He, X.; Gao, H.; Liu, H.; Wang, B. Combinations of soil properties, carbon inputs and climate control the saturation deficit dynamics of stable soil carbon over 17-year fertilizaiton. Sci. Rep. 2018, 8, 12653. [Google Scholar] [CrossRef]
  14. Sahoo, U.K.; Singh, S.L.; Gogoi, A.; Kenye, A.; Sahoo, S.S. Active and passive soil organic carbon pools as affected by different land use types in Mizoram, Northeast India. PLoS ONE 2019, 14, 0219969. [Google Scholar] [CrossRef]
  15. Pan, S.; Shi, J.; Peng, Y.; Wang, Z.; Wang, X. Soil organic carbon pool distribution and stability with grazing and topography in a Mongolian grassland. Agric. Ecosyst. Environ. 2023, 348, 108431. [Google Scholar] [CrossRef]
  16. Ji, H.; Han, J.; Xue, J.; Hatten, J.A.; Wang, M.; Guo, Y.; Li, P. Soil organic carbon pool and chemical composition under different types of land use in wetland: Implication for carbon sequestration in wetlands. Sci. Total Environ. 2020, 716, 136996. [Google Scholar] [CrossRef]
  17. Rovira, P.; Vallejo, V.R. Labile and recalcitrant pools of carbon and nitrogen in organic matter decomposing at different depths in soil: An acid hydrolysis approach. Geoderma 2002, 107, 109–141. [Google Scholar] [CrossRef]
  18. Purakayastha, T.J.; Rudrappa, L.; Singh, D.; Swarup, A.; Bhadraray, S. Long-term impact of fertilizers on soil organic carbon pools and sequestration rates in maize–wheat–cowpea cropping system. Geoderma 2008, 144, 370–378. [Google Scholar] [CrossRef]
  19. Hassan, W.; Bashir, S.; Ahmed, N.; Tanveer, M.; Shah, A.N.; Bano, R.; David, J. Labile Organic Carbon Fractions, Regulator of CO2 Emission: Effect of Plant Residues and Water Regimes. CLEAN-Soil Air Water 2016, 44, 1358–1367. [Google Scholar] [CrossRef]
  20. Wang, Y.; Gu, J.; Ni, J. Influence of biochar on air permeability and greenhouse gas emission in a vegetated soil: A review. Biogeotechnics 2023, 1, 100040. [Google Scholar] [CrossRef]
  21. Ni, J.; Zhou, J.; Wang, Y. Gas permeability and emission in unsaturated vegetated landfill cover with biochar addition. Biochar 2023, 5, 47. [Google Scholar] [CrossRef]
  22. Blazier, M.A.; Liechty, H.O. Assessment of Labile Organic Carbon in Soil Using Sequential Fumigation Incubation Procedures. J. Vis. Exp. 2016, 116, 54614. [Google Scholar] [CrossRef]
  23. Yagi, K.; Minami, K. Effect of organic matter application on methane emission from some Japanese paddy fields. Soil Sci. Plant Nutr. 1990, 36, 599–610. [Google Scholar] [CrossRef]
  24. Coxall, H.K.; Wilson, P.A.; Palike, H.; Lear, C.H.; Backman, J. Rapid stepwise onset of Antarctic glaciation and deeper calcite compensation in the Pacific Ocean. Nature 2005, 433, 53–57. [Google Scholar] [CrossRef]
  25. von Lützow, M.; Kögel-Knabner, I.; Ekschmitt, K.; Flessa, H.; Guggenberger, G.; Matzner, E.; Marschner, B. SOM fractionation methods:Relevance to functional pools and to stabilization mechanisms. Soil Biol. Biochem. 2007, 39, 2183–2207. [Google Scholar] [CrossRef]
  26. Zhang, H.; Zhou, Z. Recalcitrant carbon controls the magnitude of soil organic matter mineralization in temperate forests of northern China. For. Ecosyst. 2018, 5, 17. [Google Scholar] [CrossRef]
  27. Li, S.; Zhang, S.; Pu, Y.; Li, T.; Xu, X.; Jia, Y.; Deng, O.; Gong, G. Dynamics of soil labile organic carbon fractions and C-cycle enzyme activities under straw mulch in Chengdu Plain. Soil Tillage Res. 2016, 155, 289–297. [Google Scholar] [CrossRef]
  28. Wang, H.; Guan, D.; Zhang, R.; Chen, Y.; Hu, Y.; Xiao, L. Soil aggregates and organic carbon affected by the land use change from rice paddy to vegetable field. Ecol. Eng. 2014, 70, 206–211. [Google Scholar] [CrossRef]
  29. Zhou, J.; Tang, C.; Kuzyakov, Y.; Vancov, T.; Fang, Y.; Song, X.; Zhou, X.; Jiang, Z.; Ge, T.; Xu, L.; et al. Biochar-based urea increases soil methane uptake in a subtropical forest. Geoderma 2024, 449, 116994. [Google Scholar] [CrossRef]
  30. Walkley, A.; Black, I.A. An Examination of the Degtjareff Method for Determining Soil Organic Matter, and a Proposed Modification of the Chromic Acid Titration Method. Soil Sci. 1934, 37, 29–38. [Google Scholar] [CrossRef]
  31. Lu, R.K. Analysis Methods of Agricultural Chemistry of Soil; China Agricultural Science and Technology Press: Beijing, China, 2000. [Google Scholar]
  32. Novara, A.; Poma, I.; Sarno, M.; Venezia, G.; Gristina, L. Long-Term Durum Wheat-Based Cropping Systems Result in the Rapid Saturation of Soil Carbon in the Mediterranean Semi-arid Environment. Land Degrad. Dev. 2016, 27, 612–619. [Google Scholar] [CrossRef]
  33. Wu, X.; Liu, P.; Wegner, C.E.; Luo, Y.; Xiao, K.Q.; Cui, Z.; Zhang, F.; Liesack, W.; Peng, J. Deciphering microbial mechanisms underlying soil organic carbon storage in a wheat-maize rotation system. Sci. Total Environ. 2021, 788, 147798. [Google Scholar] [CrossRef]
  34. Ren, F.; Zhang, X.; Liu, J.; Sun, N.; Wu, L.; Li, Z.; Xu, M. A synthetic analysis of greenhouse gas emissions from manure amended agricultural soils in China. Sci. Rep. 2017, 7, 8123. [Google Scholar] [CrossRef]
  35. National Soil Census Office. China Soil Census Technology; Agriculture Press: Beijing, China, 1990. [Google Scholar]
  36. Soil Census Office of Guangdong Province. Guangdong Soil; Science Press: Beijing, China, 1993. [Google Scholar]
  37. Zhu, L.; Hu, N.; Zhang, Z.; Xu, J.; Tao, B.; Meng, Y. Short-term responses of soil organic carbon and carbon pool management index to different annual straw return rates in a rice-wheat cropping system. Catena 2015, 135, 283–289. [Google Scholar] [CrossRef]
  38. Chen, S.; Xia, X.; Ding, Y.; Feng, X.; Lin, Q.; Li, T.; Bian, R.; Li, L.; Cheng, K.; Zheng, J.; et al. Changes in aggregate-associated carbon pools and chemical composition of topsoil organic matter following crop residue amendment in forms of straw, manure and biochar in a paddy soil. Geoderma 2024, 448, 116967. [Google Scholar] [CrossRef]
  39. Huang, Q.Y.; Yu, J.H.; Huang, J.F.; Huang, X.; Li, P.; Fu, H.; Tang, S.; Liu, Y.; Xu, P. Nutrient Resources of Main Crop Straw and Its Potential of Substituting for Chemical Fertilizer in Guangdong Province. Ecol. Environ. Sci. 2022, 31, 297–306. [Google Scholar]
  40. National Bureau of Statistics of China. Guangdong Statistical Yearbook of Agriculture 2021; China Statistics Press: Beijing, China, 2021. [Google Scholar]
  41. Zhang, Y.; Wang, P.; Liu, Y.; Wang, J. Effects of Long-term Crop Cultivation on Soil Organic Carbon in China’s Farmland: A Meta-Analysis. Acta Pedol. Sin. 2024, 61. [Google Scholar] [CrossRef]
  42. Yin, S.; Wang, J.; Yu, T.; Wang, M.; Wu, Y.; Zeng, H. Constraints on the spatial variations of soil carbon fractions in a mangrove forest in Southeast China. Catena 2023, 222, 106889. [Google Scholar] [CrossRef]
  43. Li, M.; Bai, L.; Yang, L.; Wang, Q.; Zhu, J. Amount, distribution and controls of the soil organic carbon storage loss in the degraded China’s grasslands. Sci. Total Environ. 2024, 944, 173848. [Google Scholar] [CrossRef]
  44. Li, Q.-W.; Zhang, X.-Y.; Gao, J.-Q.; Rinnan, R.; Jiao, Y.; Liang, J.-F.; Yu, F.-H. Precipitation patterns impact soil aggregates and organic carbon of an alpine wetland on the Qinghai-Tibetan Plateau. Catena 2024, 244, 108249. [Google Scholar] [CrossRef]
  45. Li, G.; Sun, S.; Lu, N.; Huang, R.; Yan, J.; Song, F.; Han, J.; Wang, Y. Changes in soil organic carbon stocks of forestlands and grasslands on the Loess Plateau, 1980–2015. J. Clean. Prod. 2023, 428, 139463. [Google Scholar] [CrossRef]
  46. Wang, H.F.; Wu, Y.H.; Zhang, R.; An, J.; Zhang, Y.; Yu, N.; Zou, T. Effect of Rice Straw Addition on CH4 Emission in BlackSoil with Different Rice Planting Years. Chin. J. Soil Sci. 2022, 53, 1421–1429. [Google Scholar] [CrossRef]
  47. Li, X.-Z.; Han, B.-S.; Yang, F.; Hu, C.-Y.; Han, G.-Z.; Huang, L.-M. Effects of land use change on soil carbon and nitrogen in purple paddy soil. J. Environ. Manag. 2022, 314, 115122. [Google Scholar] [CrossRef]
  48. Shen, Z.; Han, T.; Huang, J.; Li, J.; Daba, N.A.; Gilbert, N.; Khan, M.N.; Shah, A.; Zhang, H. Soil organic carbon regulation by pH in acidic red soil subjected to long-term liming and straw incorporation. J. Environ. Manag. 2024, 367, 122063. [Google Scholar] [CrossRef]
  49. Li, Y. Distribution of Soil Organic Carbon and Its Affecting Factors under Different Land Utilization Patterns—Taking East of Hainan Island as an Example. Master’s Dissertation, Hainan Normal University, Haikou, China, 2018. [Google Scholar]
  50. Ci, E.; Yang, L.; Ma, L.; Gao, M. Characteristics of organic matters in paddy soils derived from dark brown soil and red soil. Acta Pedol. Sin. 2009, 46, 1162–1167. [Google Scholar] [CrossRef]
  51. Heckman, K.; Pries, C.E.H.; Lawrence, C.R.; Rasmussen, C.; Crow, S.E.; Hoyt, A.M.; von Fromm, S.F.; Shi, Z.; Stoner, S.; McGrath, C.; et al. Beyond bulk: Density fractions explain heterogeneity in global soil carbon abundance and persistence. Global Chang. Biol. 2021, 28, 1178–1196. [Google Scholar] [CrossRef] [PubMed]
  52. Parton, W.J.; Schimel, D.S.; Cole, C.V.; Ojima, D.S. Analysis of factors controlling soil organic matter levels in great plains grasslands. Soil Sci. Soc. Am. J. 1987, 51, 1173–1179. [Google Scholar] [CrossRef]
  53. Paul, E.; Collins, H.; Leavitt, S. Dynamics of resistant soil carbon of midwestern agricultural soils measured by naturally occurring 14C abundance. Geoderma 2001, 104, 239–256. [Google Scholar] [CrossRef]
  54. Liao, D.; Yu, D.; Zhao, Y.; Wang, N.; Zhang, H.; Pan, J.; Shi, X. Composition of organic carbon in paddy soil in typical area of Chengdu and its influencing factors. Acta Pedol. Sin. 2015, 52, 517–527. [Google Scholar] [CrossRef]
  55. Wu, Z.; Ma, S.; Lu, J.; Yang, D.; Hong, M. Responses of Soil Organic Carbon Components to Long-term Nitrogen Addition in the Stipa baicalensis Meadow Steppe. Acta Pedol. Sin. 2023, 60, 1520–1530. [Google Scholar] [CrossRef]
  56. Zhang, A.; Zheng, Z.-X.; Zhao, Z.-Y.; Feng, T.-Y.; Zheng, W.; Zhai, B.-N. Effects of long-term combined application of organic and inorganic fertilizers on soil carbon pool and greenhouse gas emissions in orchards. Environ. Sci. 2023, 44, 5823–5831. [Google Scholar]
  57. Du, X.; Xu, Z.; Lv, Q.; Meng, Y.; Wang, Z.; Feng, H.; Ren, X.; Hu, S.; Gao, Z. Fractions, stability, and influencing factors of soil organic carbon under different land-use in sodic soils. Geoderma Reg. 2022, 31, e00590. [Google Scholar] [CrossRef]
  58. Jobbágy, E.G.; Jackson, R.B. The vertical distribution of soil organic carbon and its relation to climate and vegetation. Ecol. Appl. 2000, 10, 423–436. [Google Scholar] [CrossRef]
  59. Fu, Y.; Hu, Z.; Zhu, Q.; Rong, Y. Characteristics of labile organic carbon fractions under different types of subsidence waterlogging areas in a coal mining area: A case study in Xinglongzhuang Coal Mine, China. Catena 2023, 232, 107398. [Google Scholar] [CrossRef]
  60. Yang, L.; Song, X.; Lyu, S.; Shen, W.; Gao, Y. Dynamics and fractions of soil organic carbon in response to 35 years of aforestation in subtropical China. Plant Soil 2024, 500, 481–494. [Google Scholar] [CrossRef]
  61. Kida, M.; Watanabe, I.; Kinjo, K.; Kondo, M.; Yoshitake, S.; Tomotsune, M.; Iimura, Y.; Umnouysin, S.; Suchewaboripont, V.; Poungparn, S.; et al. Organic carbon stock and composition in 3.5-m core mangrove soils (Trat, Thailand). Sci. Total Environ. 2021, 801, 149682. [Google Scholar] [CrossRef]
  62. Zhang, H.; Lin, C.; Cheng, H.; Jin, C.; Xu, Z.; Wei, Z.; Ma, Z. Variation of soil organic carbon content of Moso bamboo forest along altitudinal gradient in Wuyi Mountain in China. Soils 2019, 51, 821–828. [Google Scholar] [CrossRef]
  63. Mao, H.R.; Francesca Cotrufo, M.; Hart, S.C.; Sullivan, B.W.; Zhu, X.; Zhang, J.; Liang, C.; Zhu, M. Dual role of silt and clay in the formation and accrual of stabilized soil organic carbon. Soil Biol. Biochem. 2024, 192, 109390. [Google Scholar] [CrossRef]
Figure 1. Location of the study area and soil sampling sites.
Agriculture 14 01457 g001
Figure 2. Concentrations (A) and frequency distribution (B) of soil total organic carbon.
Agriculture 14 01457 g002
Figure 3. Characteristics of soil labile organic carbon fraction I at soil profile of 0–60 cm. In the research area, 27 samples in the surface soil layer (0–20 cm) and 22 samples each for the soil layers of 20–40 cm and 40–60 cm were collected (see details in Materials and Methods). The data in (A) represent the means and ranges of soil LOCF-I concentration at different soil layers. The data in (B) represent the concentration of LOCF-I for each sample at different soil layers.
Agriculture 14 01457 g003
Figure 4. Characteristics of the soil labile organic carbon fraction II at the soil profile of 0–60 cm. In the research area, 27 samples in the surface soil layer (0–20 cm) and 22 samples each for the soil layers of 20–40 cm and 40–60 cm were collected (see details in Materials and Methods). The data in (A) represent the means and ranges of soil LOCF-II concentration at different soil layers. The data in (B) represent the concentration of LOCF-II for each sample at different soil layers.
Agriculture 14 01457 g004
Figure 5. Characteristics of the soil recalcitrant organic carbon fraction at the soil profile of 0–60 cm. In the research area, 27 samples in the surface soil layer (0–20 cm) and 22 samples each for the soil layers of 20–40 cm and 40–60 cm were collected (see details in Materials and Methods). The data in (A) represent the means and ranges of the soil recalcitrant organic carbon concentration at different soil layers. The data in (B) represent the concentration of soil recalcitrant organic carbon for each sample at different soil layers.
Agriculture 14 01457 g005
Figure 6. Correlations between soil properties and organic carbon fractions (n = 27). Note: TN, total N; AK, available K; AP, available phosphorus; SBD, soil bulk density; LOCF-I, labile organic carbon fraction I; LOCF-II, labile organic carbon fraction II; ROC, soil recalcitrant organic carbon.
Agriculture 14 01457 g006
Figure 7. Path analysis between soil organic carbon concentrations and soil properties. Note: *** p < 0.001, ** means p < 0.01, and * means p < 0.05.
Agriculture 14 01457 g007
Table 1. The basic physicochemical properties in soil of paddy field *.
ParameterspHTotal NAvailable PAvailable KSand Silt ClaySBD (g cm−3)
(g kg−1)(mg kg−1)(mg kg−1)(%)(%)(%)0–20 cm20–40 cm40–60 cm
Mean5.6829.7036.65 83.5043.0739.6417.291.311.581.50
Median5.481.6429.3666.6646.242.016.01.331.591.53
Range4.66~7.7710.74–50.454.83–120.8535.54–220.6317.2–70.415.6–534.0–49.20.99–1.761.24–1.881.11–1.85
** C.V. (%)5.6834.9668.7458.8130.8925.8317.2912.3711.9114.18
* Data in Table 1 indicated the soil properties in surface layer (0–20 cm), excepting SBD. ** C.V.—coefficient variation.
Table 2. Total organic carbon storage between different soil layers.
Soil LayerMin
(t hm−2)
Max
(t hm−2)
Mean
(t hm−2)
SD *
0–20 cm16.4766.7144.5813.91
20–40 cm7.4745.0619.089.56
40–60 cm3.1323.1111.345.00
* SD, standard deviations.
Table 3. Summary of the content, storage, and proportion of LOCF-I in the soil profile of 0–60 cm.
Soil LayerLabile Organic Carbon Fraction I (LOCF-I)
Concentration (g kg−1)Stock (t hm−2)Proportion (%)
0–20 cm3.789.5459.03
20–40 cm1.284.0925.31
40–60 cm0.872.5315.66
Table 4. Summary of the content, storage, and proportion of LOCF-II in the soil profile of 0–60 cm.
LayerLabile Organic Carbon Fraction II (LOCF-II)
Concentration (g kg−1)Stock (t hm−2)Proportion (%)
0–20 cm1.824.6963.12
20–40 cm0.611.9325.98
40–60 cm0.280.8110.90
Table 5. Soil recalcitrant carbon storage at different soil layers and its proportion of soil at 0–60 cm.
Soil LayerRecalcitrant Organic Carbon (ROC)
Concentration (g kg−1)Stock (t hm−2)Proportion (%)
0–20 cm11.7830.3659.03
20–40 cm4.1713.0625.40
40–60 cm2.838.0115.57
Table 6. Analysis of the differences in the content of organic carbon fractions in each soil layer of the paddy soil profile.
Soil LayerLOCF-ILOCF-IIROC
ContentsProportion (%)ContentsProportion (%)ContentsProportion (%)
0–20 cm3.74 ± 1.6521.75 ± 6.131.82 ± 0.7610.35 ± 2.0911.78 ± 4.1067.89 ± 6.85
20–40 cm1.28 ± 0.7422.06 ± 11.260.61 ± 0.2610.63 ± 2.414.17 ± 2.2167.31 ± 6.85
40–60 cm0.87 ± 0.3521.98 ± 12.220.28 ± 0.127.70 ± 2.342.83 ± 1.8770.31 ± 7.38
Note: in Table 6, the sum of the proportion of LOCF-I, LOCF-II, and ROC at the same soil layer is 100%.
Disclaimer/Publisher’s Note: The statements, opinions and data contained in all publications are solely those of the individual author(s) and contributor(s) and not of MDPI and/or the editor(s). MDPI and/or the editor(s) disclaim responsibility for any injury to people or property resulting from any ideas, methods, instructions or products referred to in the content.

