Article

Migration of Microplastics in the Rice–Duckweed System under Different Irrigation Modes

1
College of Agricultural Science and Engineering, Hohai University, Nanjing 210098, China
2
Key Laboratory of Crop Water Use and Regulation, Farmland Irrigation Research Institute, Chinese Academy of Agricultural Science, Ministry of Agriculture and Rural Affairs, Xinxiang 453003, China
*
Author to whom correspondence should be addressed.
Agriculture 2024, 14(9), 1460; https://doi.org/10.3390/agriculture14091460
Submission received: 7 July 2024 / Revised: 5 August 2024 / Accepted: 20 August 2024 / Published: 26 August 2024
(This article belongs to the Section Agricultural Water Management)

Abstract

:
Microplastic (MP) pollution in agriculture is garnering growing concern due to its potential detrimental impact on soil properties and crop growth, particularly affecting staple food crops such as rice. Irrigation plays a crucial role in the migration of MPs. However, limited research has focused on how different irrigation modes affect the migration of MPs in paddy fields. To simulate real-world conditions, in this experiment, two different irrigation modes were set: shallow–frequent irrigation (FWI, I0) and controlled irrigation (CI, I1). The experiment also included treatments with and without duckweed (D0 and D1, respectively), as well as treatments with and without MPs (M0 and M1). This resulted in a total of eight treatments: I0M0D0, I0M0D1, I1M0D0, I1M0D1, I0M1D0, I0M1D1, I1M1D0, and I1M1D1. Our findings indicated that compared to CI, FWI significantly increased the MP concentration in the leakage but reduced the numbers of MPs in the first soil layer and adhered by duckweed. Notably, dry–wet cycles under CI induced soil cracking, and the MP concentrations in cracked areas were significantly higher than those of crack-free soil. Moreover, compared with the MP-free treatment, MP treatments significantly influenced rice root growth, such as enhancing the average root diameter by 13.44%, root volume by 46.87%, root surface area by 30.81%, and biomass aboveground by 26.13%, respectively. The abundance of some microorganisms was also significantly influenced by the relative mobility (RM) of MPs. Furthermore, the root length was positively correlated with Planctomycetota. Meanwhile, Actinobacteriota was negatively correlated with the root surface area, root volume, and branch number, and Bacteroidota was negatively correlated with the number of root tips. However, further research is needed to elucidate how MPs influence microorganisms and, in turn, affect rice root growth.

1. Introduction

Plastic products are widely used in our daily lives due to their versatility, durability, waterproof properties, lightweight nature, and cost effectiveness [1]. It is projected that global plastic production will reach 33 billion tons by 2050 [2]. Among various types of plastics, microplastics (MPs), defined as particles smaller than 5 mm, have emerged as a significant environmental threat, attracting attention from the public, scientists, and government agencies [3]. Recent research indicates that agricultural soils are increasingly contaminated with MPs, primarily originating from plastic products used in traditional farming practices. These materials gradually degrade on-site and transform into MPs [4,5,6,7].
Rice, as an essential staple food crop, occupies a global area of 170 million hectares and serves as the primary food source for over half of the world’s population, with its consumption continually rising [8,9]. MPs have been found in paddy fields [10,11], with contamination levels ranging from 103 to 104 items kg−1, indicating significant pollution [12]. Research indicates that MPs can impact the rice lifecycle, causing delayed growth, nutrient imbalances, and yield losses [13]. Furthermore, MPs can alter the abundance and community structure of microorganisms in rice fields, thereby affecting rice growth [14].
Notably, studies have shown that MPs primarily enter plant tissues through roots and can accumulate in the food chain, posing toxic risks to humans [15,16,17]. Previous research has demonstrated that nanoscale (≤100 nm) and sub-micrometer (<1 µm) MPs can be absorbed by plant roots and translocated to aerial tissues, whereas larger MPs tend to adhere to root surfaces [18]. These MPs can inhibit the absorption of water and nutrients by the plant root [18,19,20,21], and the degree of inhibition likely varies with the root properties, such as surface morphology [22,23]. Additionally, research has shown that microorganisms could significantly influence rice root growth [24], and MPs significantly affect the abundance and metabolic processes of microorganisms [25]. However, there is a lack of research on the impact of MPs on rice root properties, particularly concerning the effects of micrometer-sized MPs. Irrigation is crucial for agricultural production, which is especially true for rice [26]. In the context of population growth and climate change, water scarcity has emerged as a critical global issue. Consequently, water-saving irrigation methods in rice paddies have been researched and promoted, leading to improved water use efficiency and rice yields [27,28,29,30]. However, irrigation with water contaminated with MPs can harm both rice and soil health [14]. MPs can move horizontally and vertically with leakage [31,32], and previous studies showed that irrigation regimes affected water movement in paddy fields and consequently influenced the MP distributions in water and soil [15,33]. The soil water content, as the main controlling factor for soil shrinkage, swelling, and crack development, could be changed by using different irrigation methods [34]. Cracks can prolong water permeability, allowing for faster and deeper water infiltration [35,36]. Currently, there is still a lack of research on the effect of cracks on MP migration under different irrigation modes. Moreover, the characteristics of MP migration in practical soil have not been well elaborated until now [31]. Therefore, understanding the migration of MPs in rice fields under different irrigation methods is of practical significance. Nevertheless, there are currently no relevant studies reported.
Weeds are also part of the paddy field ecosystem. Duckweed (Lemna minor L.) is a common aquatic plant in paddy fields that is prone to extensive growth in the floodwaters of subtropical regions [37,38]. Recent studies have shown that employing duckweed has become an important way of purifying the paddy field environment. Researchers have utilized duckweed to control nitrogen loss, absorb heavy metals, suppress weed growth, degrade agrochemicals, and even reduce greenhouse gas emissions [39,40,41]. Additionally, it has been demonstrated that duckweed can effectively adhere to large amounts of MPs from floodwater due to its strong adherence properties. But there are no reports on its application specifically in the rice–duckweed system.
Therefore, we hypothesize that (1) MPs can be adhered to by duckweed in a paddy field; (2) soil, floodwater, and groundwater leakages can serve as sinks for MPs; and (3) the migration paths of MPs may vary under different irrigation modes. To test these hypotheses, we creatively designed an experiment with two different irrigation modes and treatments including MPs and duckweed to explore the migration of MPs in paddy fields. This is the first simulation of the MP migration process in a rice–duckweed system under different irrigation modes.

2. Materials and Methods

2.1. Experimental Site
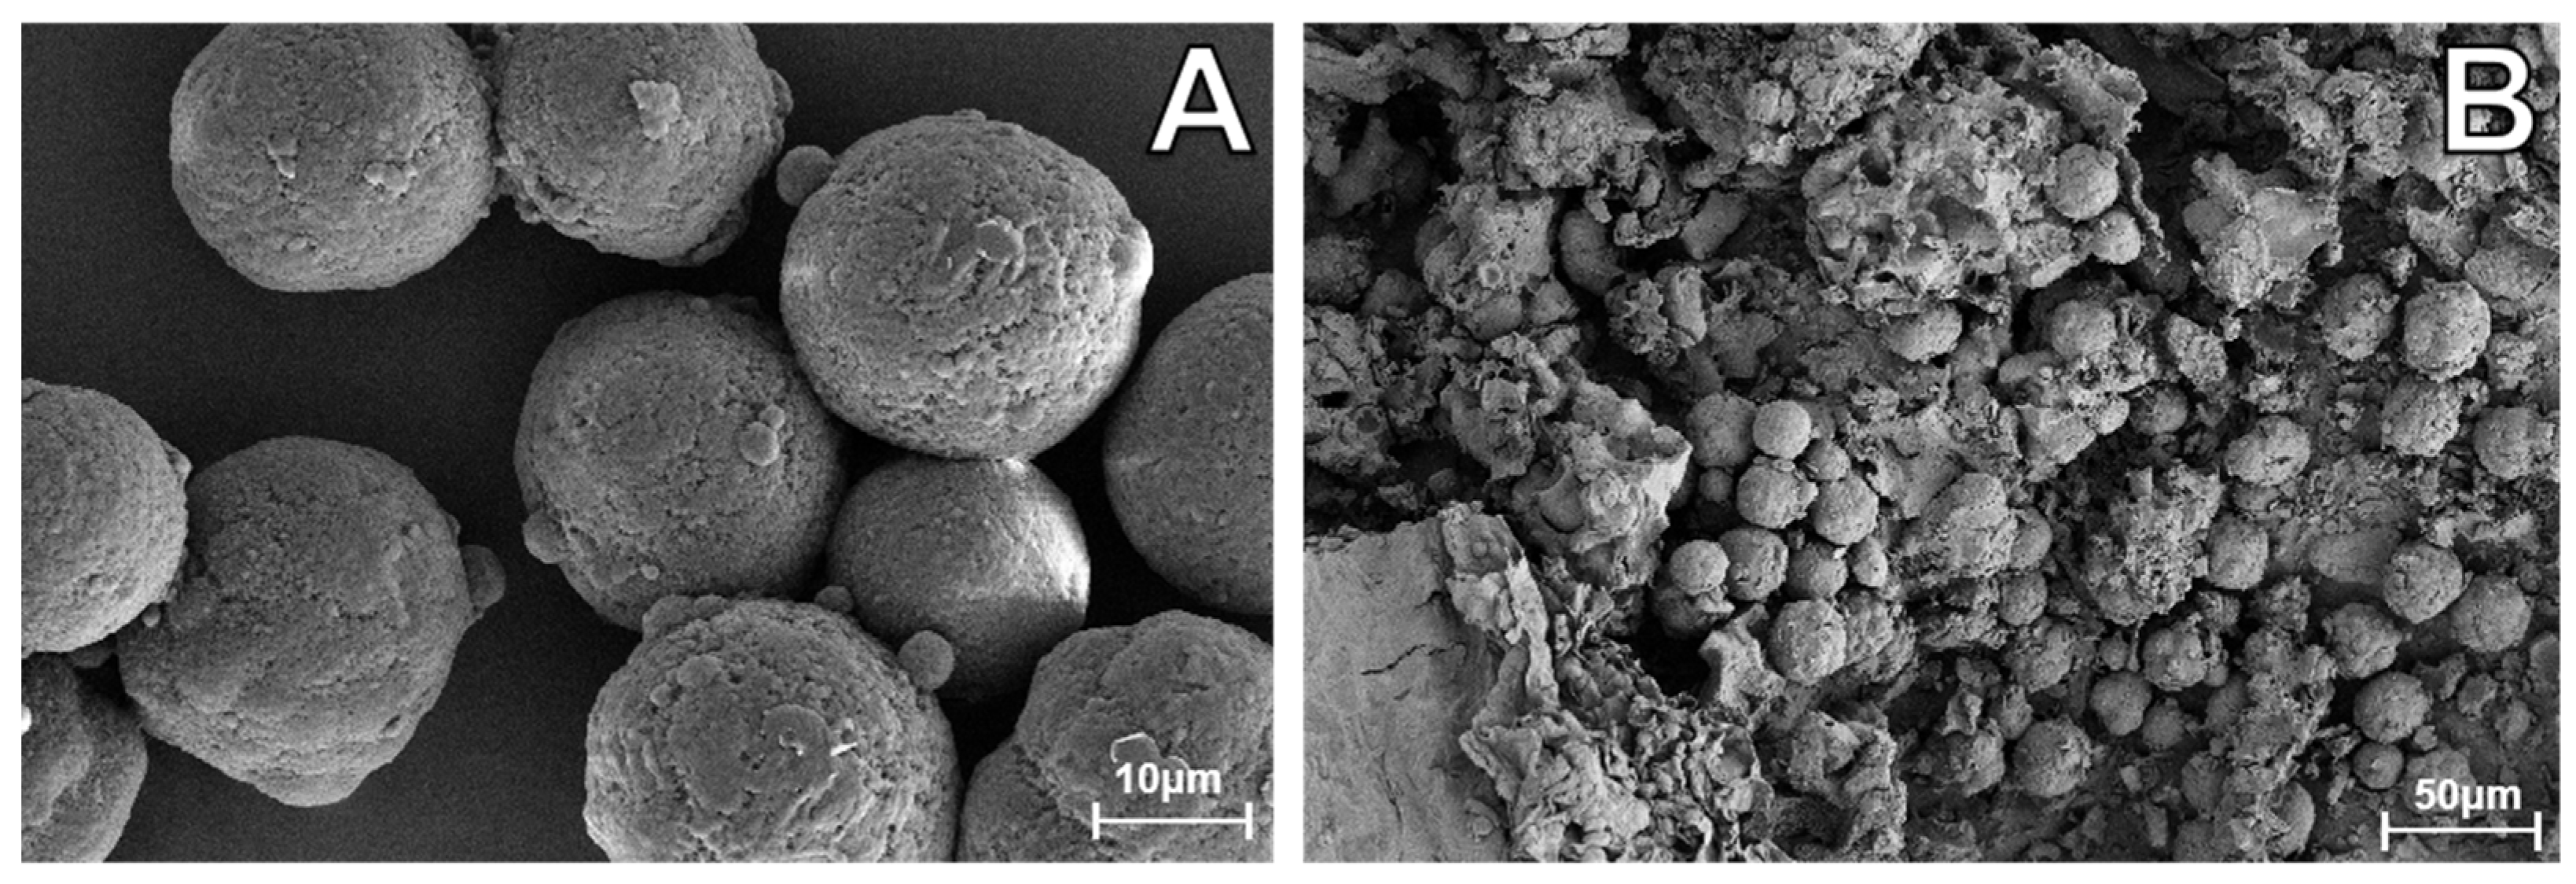
The experiment was conducted indoors between July and September 2023 at Hohai University (31°86′ N, 118°60′ E). To simulate real paddy field soil, the experimental soil consisted of both the cultivated horizon and plow pan layer from a paddy field. A total of 450 g of plow pan layer soil was used as the lower layer, and 650 g of cultivated horizon soil was spread on the upper surface. The plow pan layer soil contained 45.53% clay, 36.67% silt, and 17.80% sand, with a saturated soil water content of 43.7% and a bulk density of 1.34 g/cm3. The soil had a pH of 8.3, with soil organic carbon (SOC) at 8.90 g/kg, soil organic matter (SOM) at 15.34 g/kg, and total nitrogen (TN) at 0.9 g/kg. The cultivated horizon soil consisted of 7.79% clay, 56.91% silt, and 35.31% sand. It had a saturated soil water content of 45.4% and a bulk density of 1.16 g/cm3. The SOC was 10.48 g/kg, the SOM was 18.07 g/kg, and the TN was 4.5 g/kg.

2.2. MPs

To accurately observe MPs, this experiment uniformly selected polyethylene (PE) particles, with a molecular formula of (C2H4)ₙ. The PE MPs were provided as a dry hydrophobic powder, obtained from Science & Technology Polymer Co., Ltd. (Foshan, China). These MPs had a density of 0.98 g/cm3. The scanning electron microscope (SEM) images are shown in Figure 1. The size distribution of MPs is provided in Table 1, which was measured with the particle counter LWB-6 (LUWATECH, Shanghai, China) using light-scattering technology and a laser diode optical sensor with 1 g of MPs as the test subject. The MPs had diameters ranging from 1 to 100 µm, with an average diameter of 24.51 µm estimated using a normal distribution method (Table 1). The FTIR spectra of MPs show asymmetric and symmetric stretching vibrations at 718, 1470, 2850, and 2920 cm−1. For the treatments with MPs, 1 g of MPs was uniformly added to each treatment during the first irrigation.

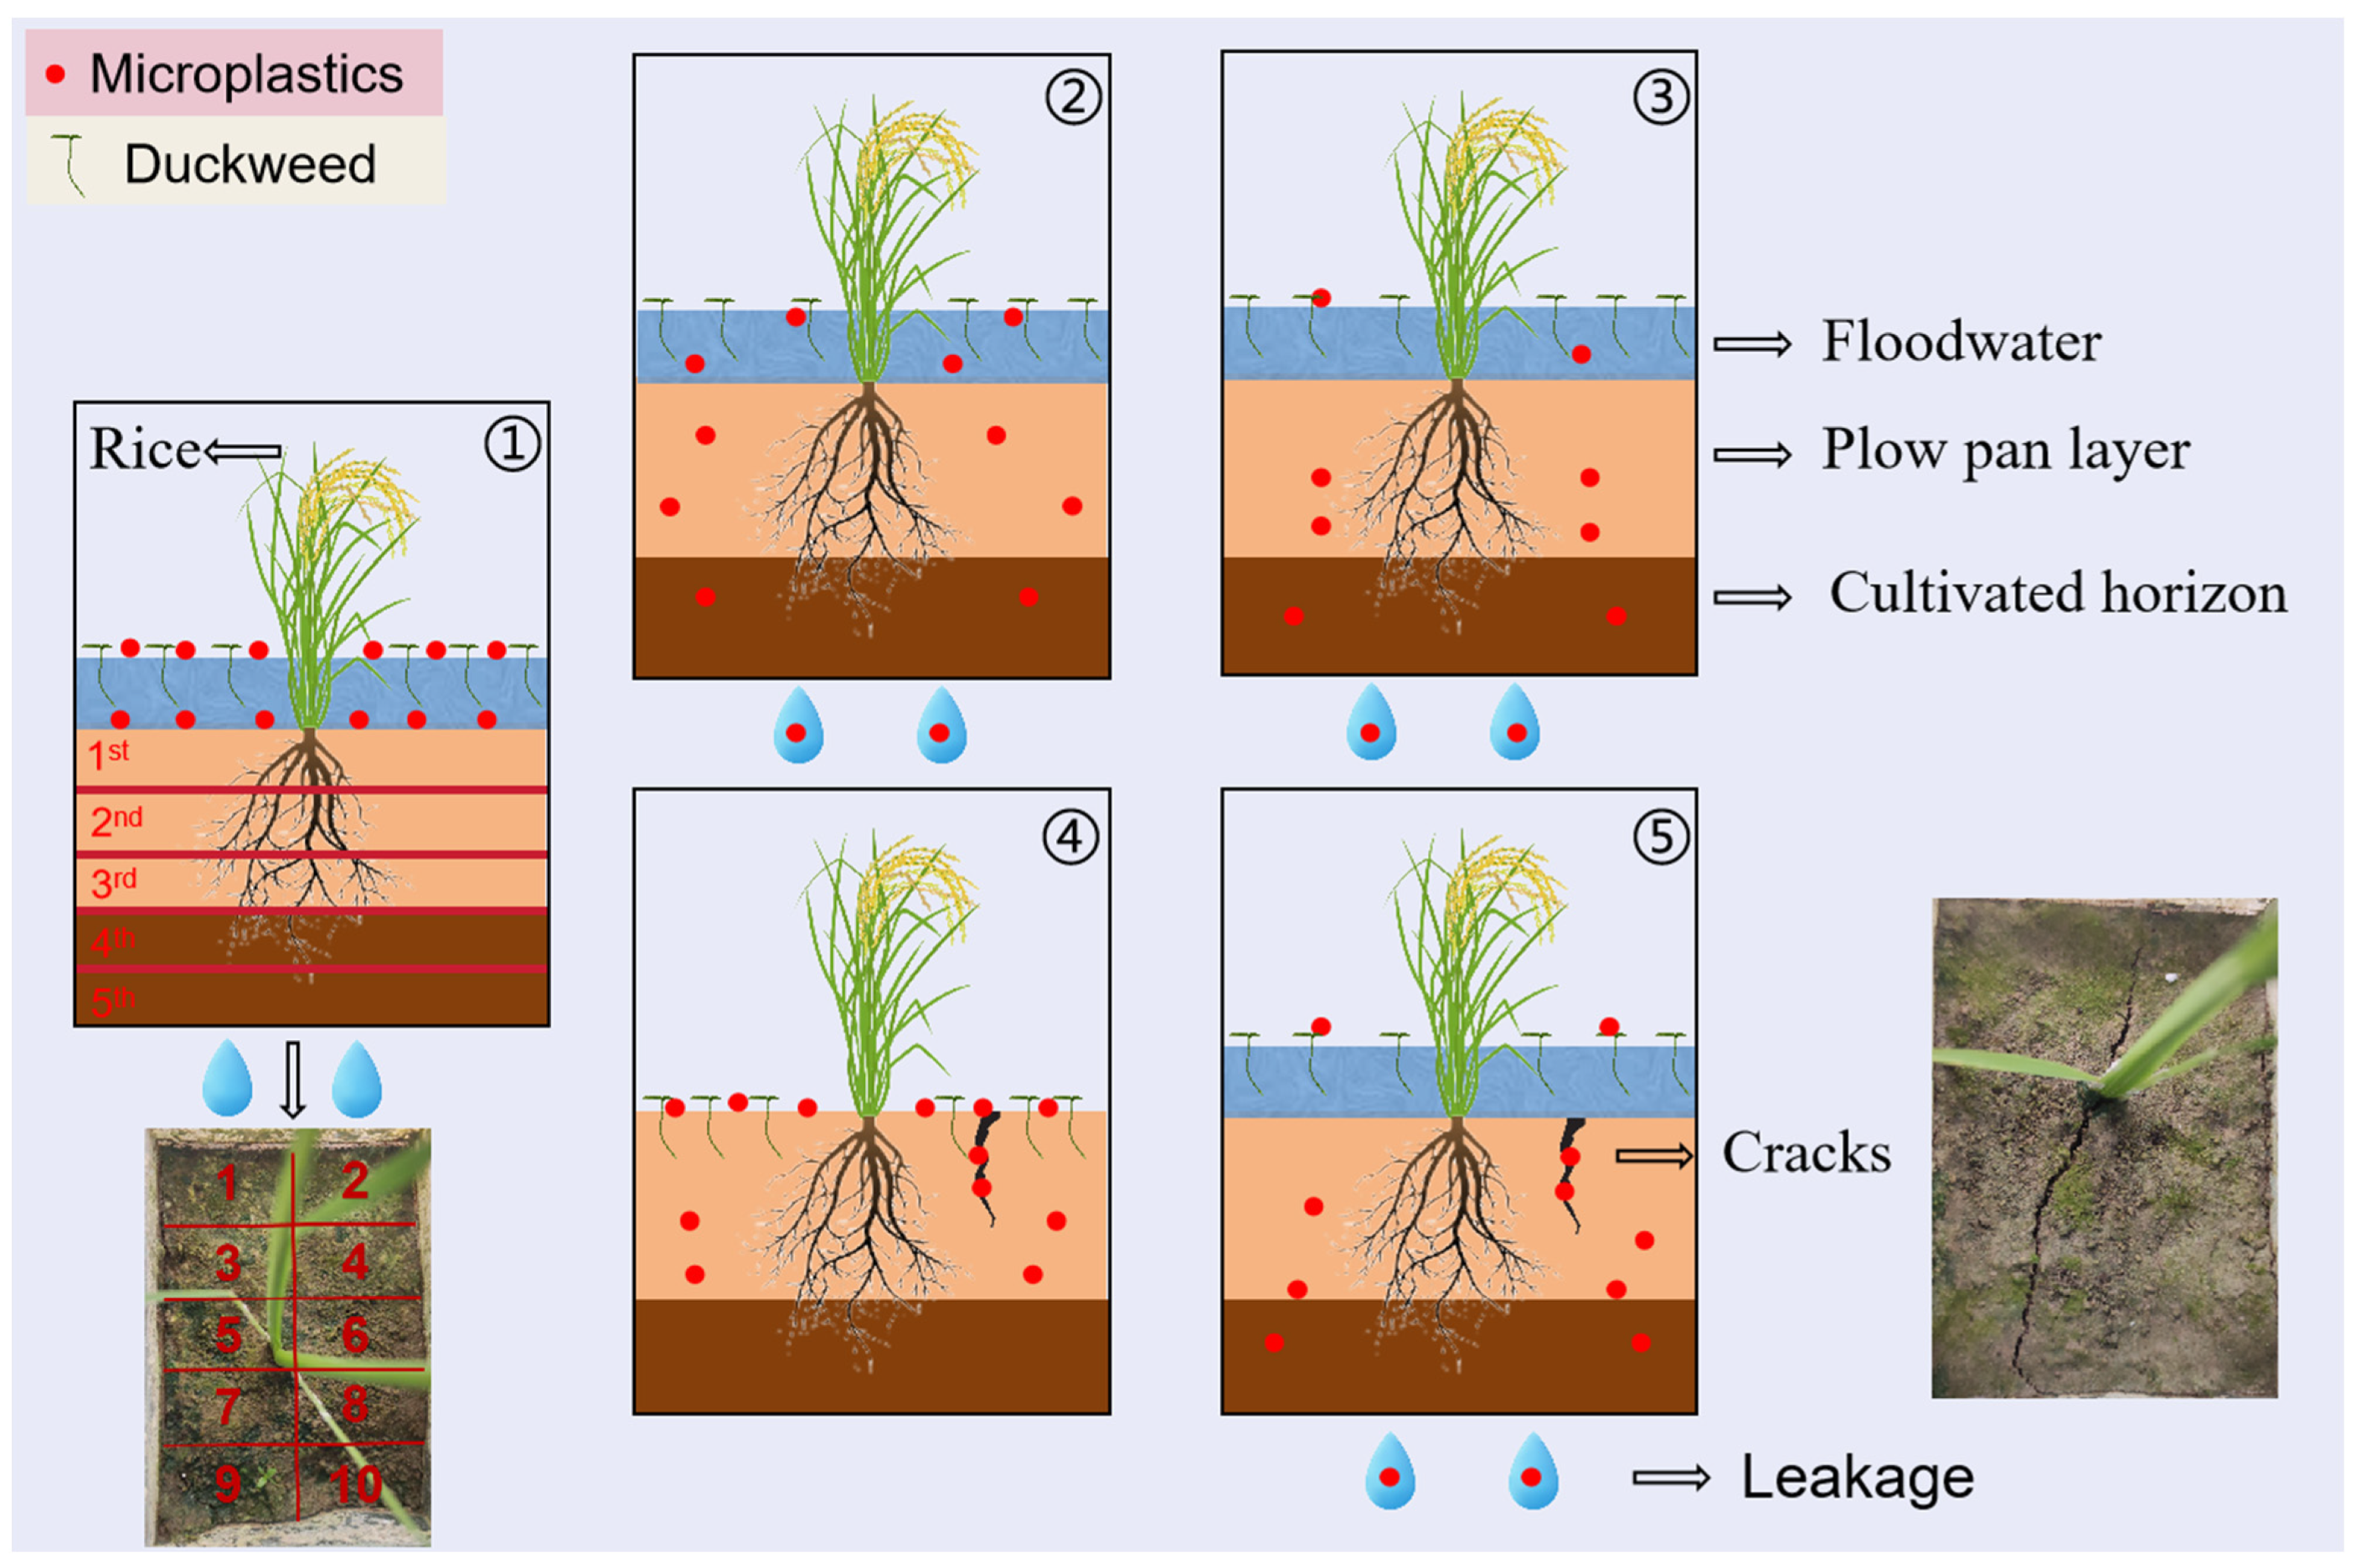
2.3. Experiment Setup

In this experiment, two different irrigation modes were set: shallow–frequent irrigation (FWI) and controlled irrigation (CI), both of which are widely applied and extensively researched [28,42,43]. Simultaneously, the experiment also included treatments with and without duckweed (D0 and D1, respectively), as well as treatments with and without MPs (M0 and M1). This resulted in a total of eight treatments: I0M0D0, I0M0D1, I1M0D0, I1M0D1, I0M1D0, I0M1D1, I1M1D0, and I1M1D1.
Each treatment was conducted in a glass tank measuring 12.5 cm in length, 15.5 cm in height, and 8.5 cm in width. Four glass tanks were placed in one indoor cultivation chamber (Haier, Qingdao, China) with dimensions of 500 mm × 270 mm × 340 mm, a voltage of 12 V, a rated power of 20 W, and a power consumption of 0.2 kW·h·d−1. The lighting schedule was set from 7:00 to 19:00 with a photoperiod of 12 h, using a full-spectrum lighting system.
At the beginning of the experiment, fertilizers were thoroughly mixed with the experimental soil as required. Pure urea was applied at a rate of 0.45 g·kg−1, analytical-grade K2SO4 was administered at 0.045 g·kg−1, and analytical-grade KH2PO4 was used at 0.18 g·kg−1. All fertilizers were uniformly applied during soil filling, with no additional fertilization performed later. Rice seedlings were transplanted into the soil on 20 July (0 days after transplanting (0 DAT)), and the experiment concluded on 10 September (52 DAT). From 0 DAT to 16 DAT, the upper limit for irrigation in both the CI and FWI groups was 30 mm, with a lower limit of 10 mm. After 16 DAT, the upper limit for CI was the saturated moisture content, with a lower limit ranging from 60% to 70% of the saturated water content. For FWI, the upper and lower limits were set as 30 mm and 0 mm, respectively.

2.4. Measurement and Calculations

2.4.1. Water Depth

The water depth was monitored using a scale in the central region of the tank. The soil water content was determined using the gravimetric method during periods without floodwater. These measurements were then converted to an equivalent negative water depth, representing the depth of irrigation water (in mm) required to achieve the soil saturation water content [28]. Measurements were taken once daily between 18:00 and 19:00, starting from 1 DAT to 45 DAT.

2.4.2. Rice Growth Parameters

Rice plants were uniformly collected, washed with tap water, and dried. Subsequently, the rice was blanched in an oven at 105 °C for 0.5 h and then dried to a constant weight at 75 °C to determine the biomass of both the root and aboveground part. The root surface area was scanned and imaged using an EPSON P4490 scanner (Epson Expression P4490, Tokyo, Japan) and analyzed with WinRHIZO V3.3 (Regent Instrument Inc., Quebec City, QC, Canada). This analysis provided parameters such as the total root length, root surface area, root volume, number of root tips, and average root diameter for each treatment.

2.4.3. DNA Extraction, Amplicon Sequencing, and Data Analysis in Microorganisms

To assess the microbial community diversity, the V4–V5 region of the bacterial 16S rRNA gene was amplified using a two-step PCR with the primer pair 515F-Y and 926R [44]. The amplicons were extracted from 2% agarose gel electrophoresis, purified with the AxyPrep DNA Gel Extraction Kit (Axygen Biosciences, Union City, CA, USA), and quantified using Qubit® 3.0 (Life Technologies, Invitrogen, Carlsbad, CA, USA). Paired-end sequencing of the amplicons was performed on the Illumina MiSeq platform using the PE300 chemistry at Majorbio Bio-Pharm Technology Co., Ltd. (Shanghai, China).

2.4.4. Quantity and Characterization of MPs

After collecting the duckweed, MPs were quantified using a handheld microscope, DinoCapture2.0 (AnMo, Taiwan, China), and randomly verified with the Thermo Scientific Apireo SEM (Thermo Fisher, Waltham, MA, USA) [22]. Prior to SEM analysis, all samples were coated with a thin layer of Au/Pd (approximately 10 nm). The MPs on both sides of the duckweed were quantified within a 1 mm2 unit, while the MPs adhered to the root system were calculated within a 1 mm unit. The total adhesion amount was estimated based on data regarding duckweed coverage, the root length, root number, and other related parameters.
Q T = R D S Q d + R D S Q b + N r L r Q r
QT represents the total quantity of adhered MPs on duckweed, RD is the duckweed coverage rate, S is the cross-sectional area of the glass tank, Nr is the number of root systems, Lr is the average length of the duckweed roots, Qd is the quantity of MPs adhered per unit area on the front side, Qb is the quantity of MPs adhered per unit area on the back side, and Qr is the quantity of MPs adhered per unit length of the root system (Equation (1)). Duckweed coverage was captured using a camera positioned above the tanks [45]. The images were then analyzed with Photoshop (Adobe Systems Incorporated, San Jose, CA, USA) to calculate the cover percentage [46]. Each colony in the treatments was individually photographed, and the root lengths were calculated through image analysis using ImageJ software 1.8.0 [47]. Additionally, the root system counts for duckweed were performed visually. All measurements were taken at 44 DAT.
According to a previously described method [48], a concentrated NaCl solution (1.2 g/mL) was used to extract MPs from soil samples based on density separation [49]. Initially, the soil sample was mixed with a saturated sodium chloride solution. This was followed by manual agitation for 5 min and then centrifugation at 500 rpm for another 5 min; subsequent processing was conducted following the common procedure [50]. The resulting solutions were filtered through 20 µm net filters using a vacuum pump. The filters, with adhered MPs, were stored in glass culture dishes and dried at room temperature for further observation. Additionally, water samples were directly filtered through 20 µm filter membranes to collect MPs. Considering the large quantity of microplastics, we adopted an estimation method. The soil was divided into 50 blocks by volume. One block was thoroughly mixed, and a 1.5 cm3 sample was taken from it for testing (Figure 2). The total number of MPs in soil (QS) was calculated using Equation (2). Here, Q f represents the number of MPs on 1 mm2 of filter paper, S is the area of the filter paper, and V is the volume of each block.
Q S = S Q f 1.5 V
In the experiments, the number of MPs in each sample was used to indicate MP distribution after migration. To demonstrate the differences in migration among the various experimental groups, the relative mobility (RM) of MPs was calculated using Equation (3). Here, RM represents the relative mobility of MPs, n represents the number of added MPs recovered from a specific sample after migration, and N represents the total number of MPs recovered from soil, leakage, and duckweed [31].
R M = n N 100 %

2.4.5. Soil Cracks

For each soil surface area in every tank, the length (cm), depth (cm), and width (cm) of each crack were documented when the soil moisture content reached its lower limit prior to irrigation under each irrigation regime throughout the growing season. The measurements were conducted following the common procedure [51]. The volume (V, cm3) of each crack was then calculated using the following equation, assuming the cracks have a triangular shape [52]:
V = 0.5 × d w l

2.5. Statistical Analysis

A three-way analysis of variance (ANOVA) was performed to analyze the independent variables (I, M, and D) and their interactions using SPSS software (version 23.0; IBM SPSS Statistics, Chicago, IL, USA). If significant interactions were detected, the mean values between treatments were compared using one-way ANOVA and Duncan’s multiple range test. A two-way analysis of variance was used to analyze the variables related to cracks and depth. The data were expressed as the mean ± standard deviation. Pearson’s correlation analysis was performed using Origin 9.0 software (Lab, Northampton, MA, USA) to test the variables. Effects were considered significant at the level of p < 0.05.

3. Results

3.1. The Change in Water Depth

In the FWI treatments, the water depth remained stable at 1–3 cm from 0 to 13 DAT. Similarly, in the CI treatments, the water depth fluctuated within the range of 1–3 cm, following a comparable trend to the FWI treatments until 13 DAT. Subsequently, adjustments to the upper and lower irrigation limits kept the water depth fluctuations in FWI treatments between 0 and 3 cm until the experiment’s conclusion. In contrast, the soil moisture content in CI treatments continued decreasing after 13 DAT until reaching 60–70% of the saturation moisture content. On 37 DAT, after re-watering, the water depth in CI treatments recovered to 3 cm but subsequently decreased again (Figure 3).

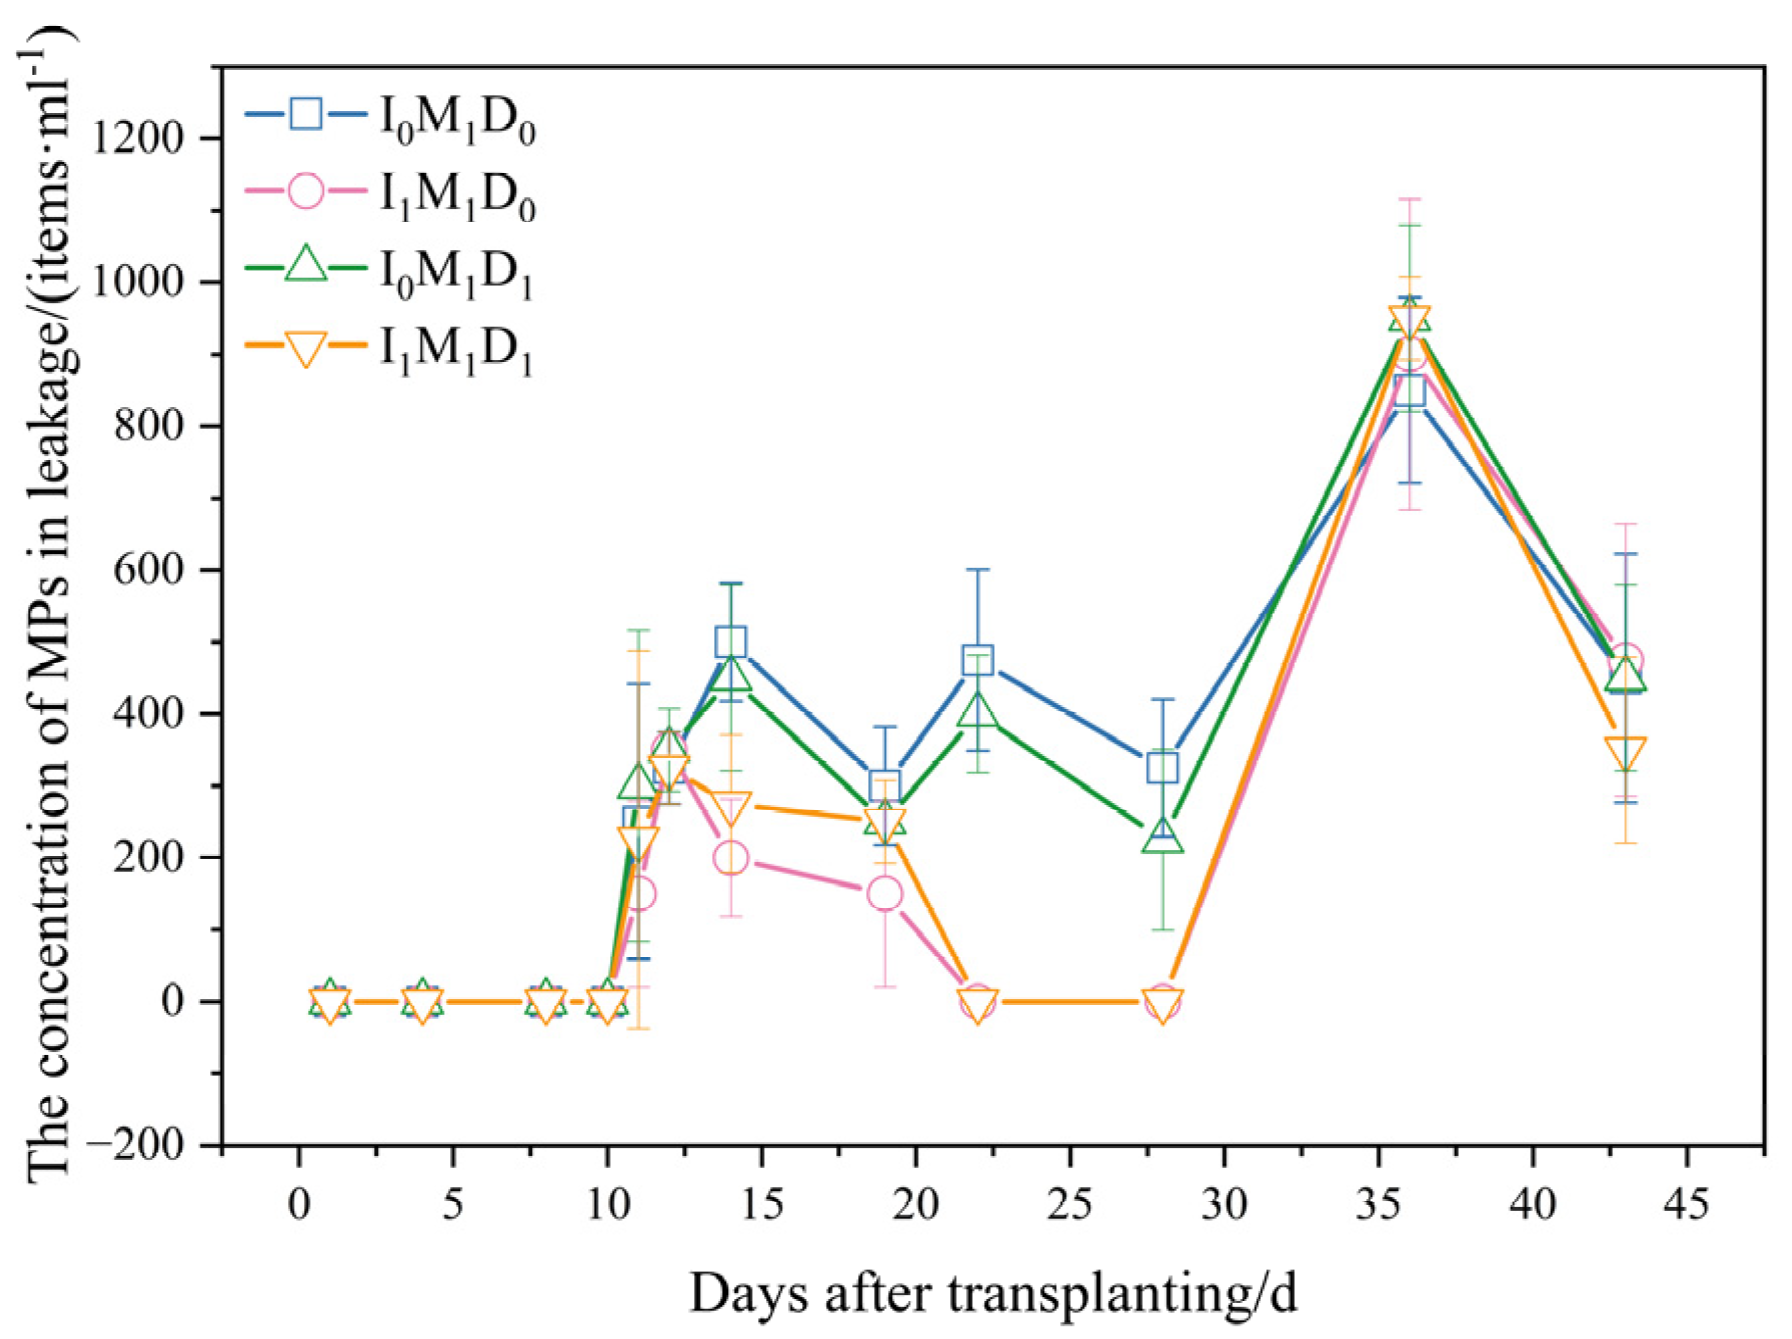
3.2. Numbers of MPs in Leakage

The graph illustrates the concentration of MPs in groundwater leakage from 1 DAT to 43 DAT. Initially, the MP count remained stable at 0 before 10 DAT. Subsequently, there was an upward trend observed from 11 DAT to 12 DAT. Notably, between 22 DAT and 28 DAT, the MP count in the CI treatments decreased to its lowest point. However, from 28 DAT to 36 DAT, there was a significant increase in MPs, reaching a peak of 950 items mL−1 in I0M1D1 and I1M1D1, 900 items mL−1 in I1M1D0, and 850 items mL−1 in I0M1D0. Thereafter, a decline in the MP concentration was observed after 36 DAT (Figure 4).

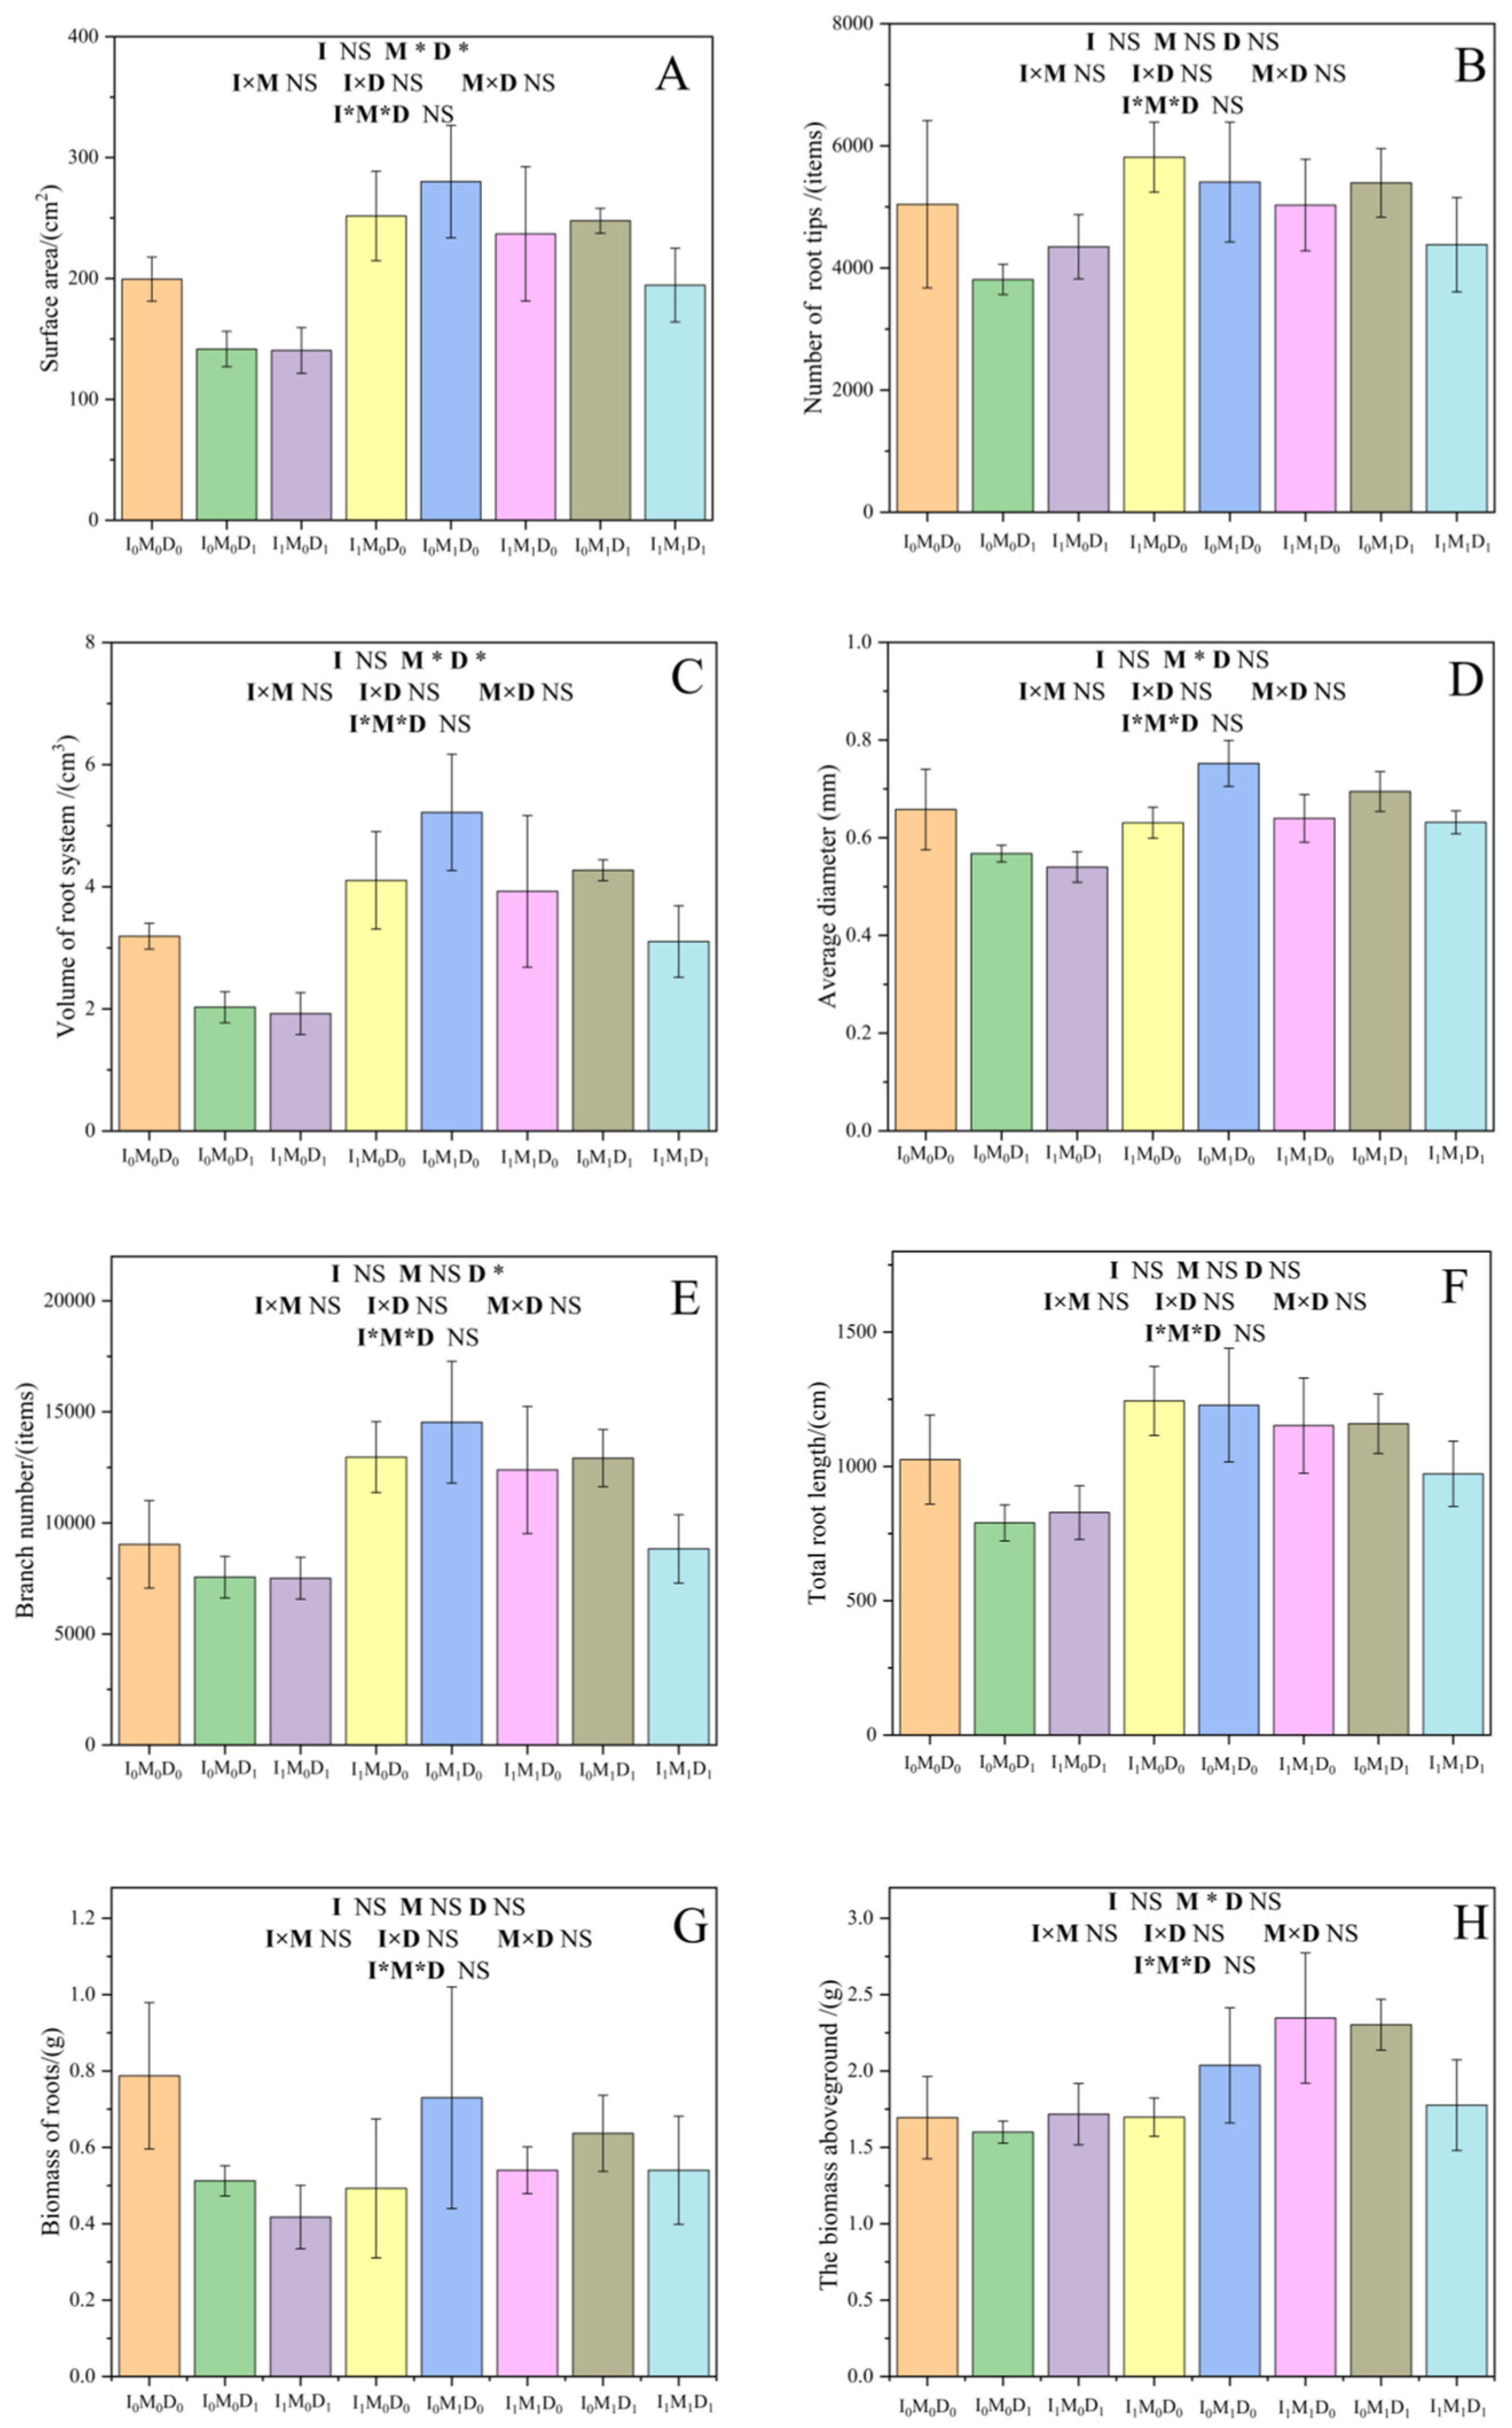
3.3. Rice Growth Indicators

The bar chart illustrates various root indicators of rice. Firstly, the surface area, volume, and average diameter were significantly influenced by MPs. Additionally, the surface area and volume were significantly affected by duckweed. The chart shows higher values in treatments with MPs for the surface area, volume, and average diameter. For instance, MPs increased the average diameter by 13.44%, volume by 46.87%, and surface area by 30.81%. Notably, these indicators and the branch number increased in the absence of duckweed. Moreover, there was no interaction effect between MPs and duckweed on root indicators. Furthermore, MPs significantly increased the biomass of the rice portion aboveground by 26.13%, while there was no significant effect on the root biomass under different treatments (Figure 5).

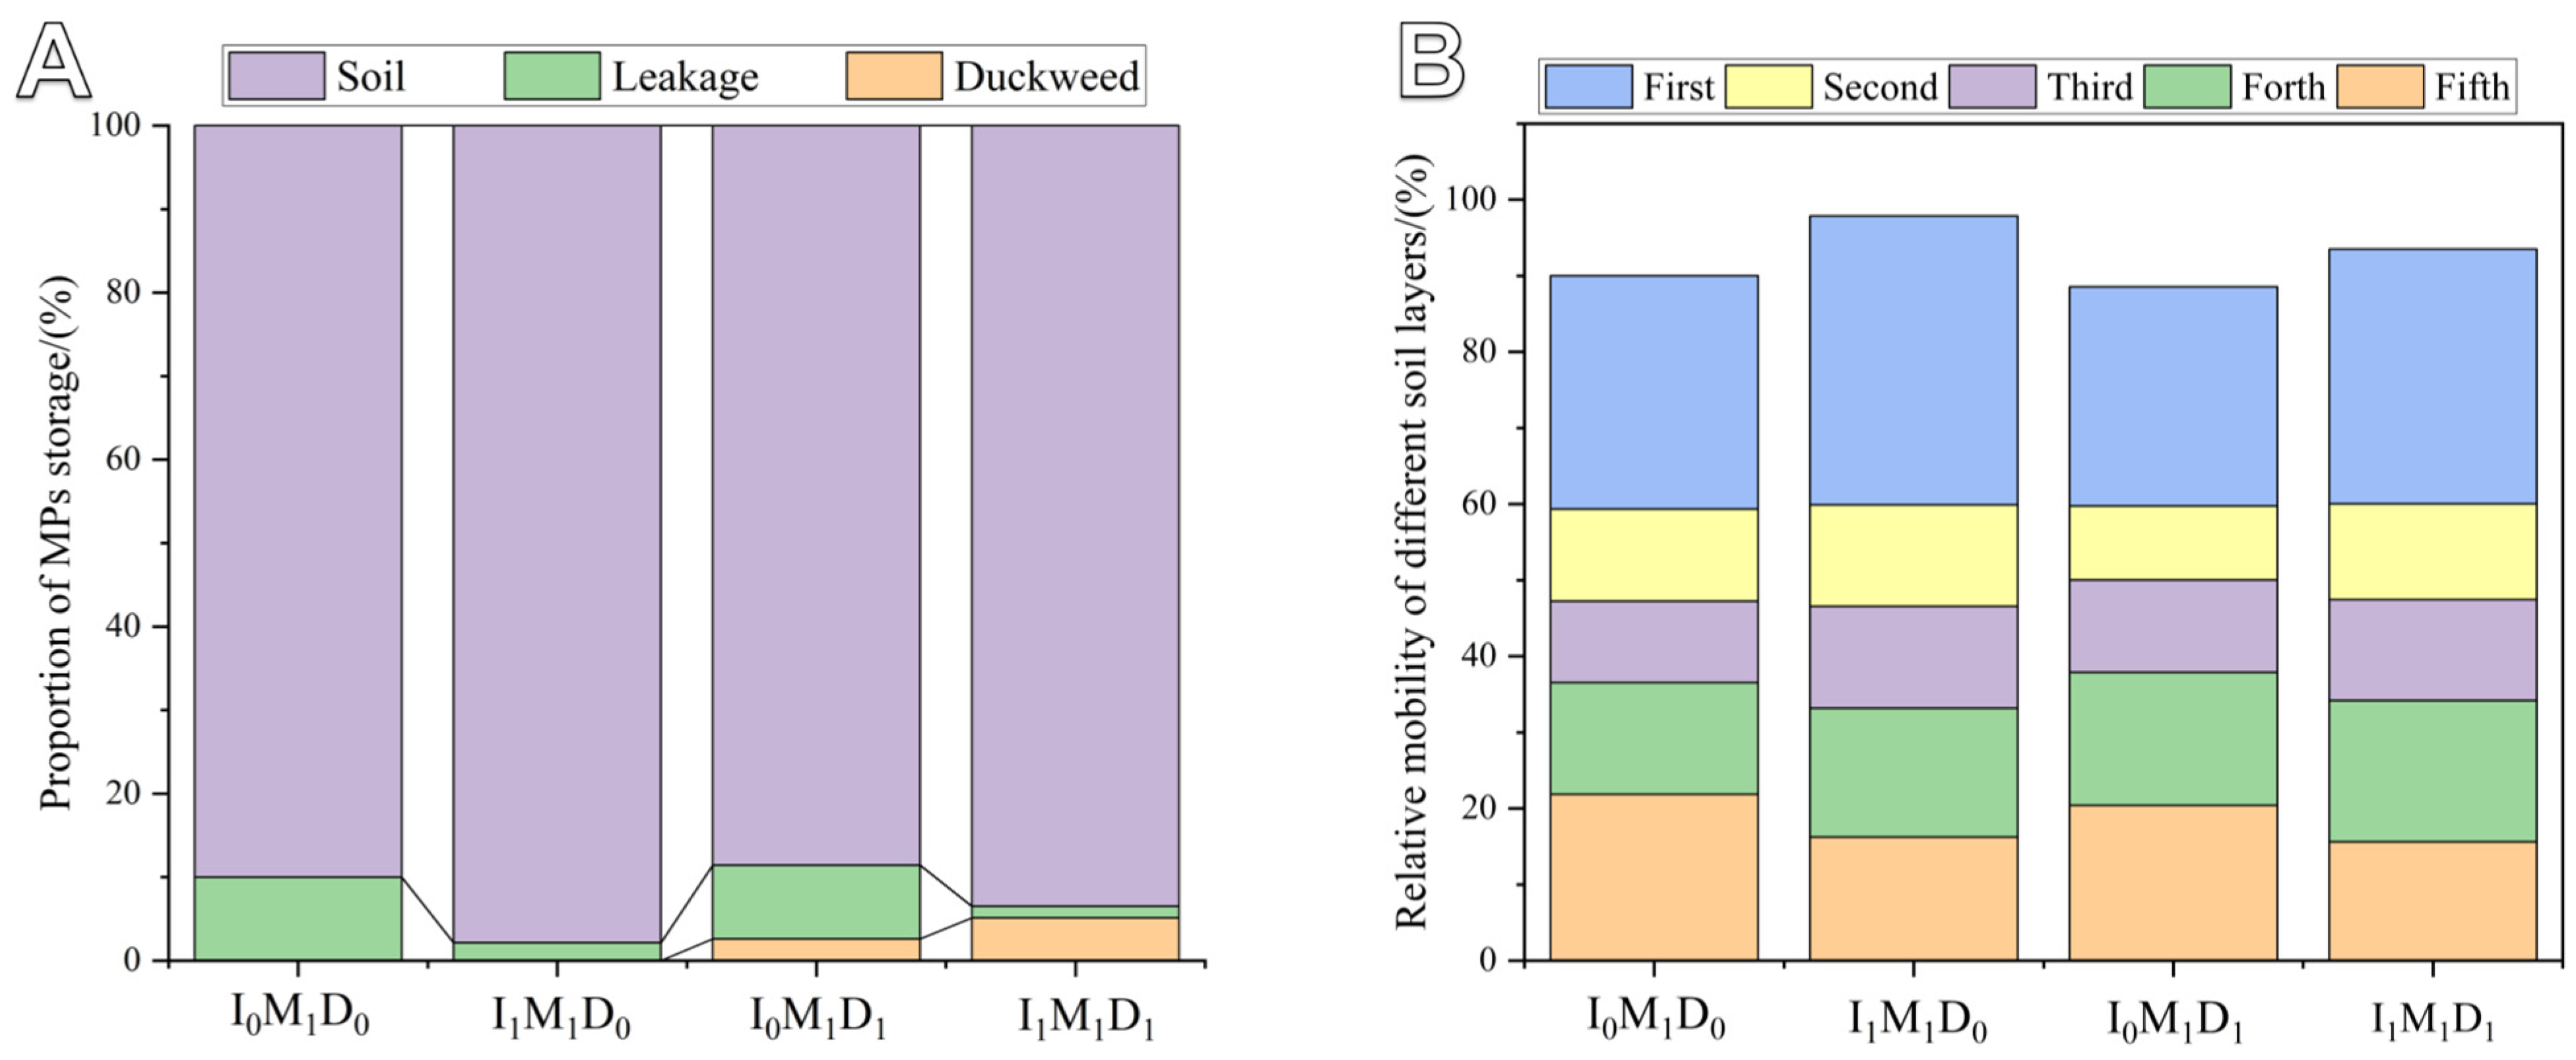
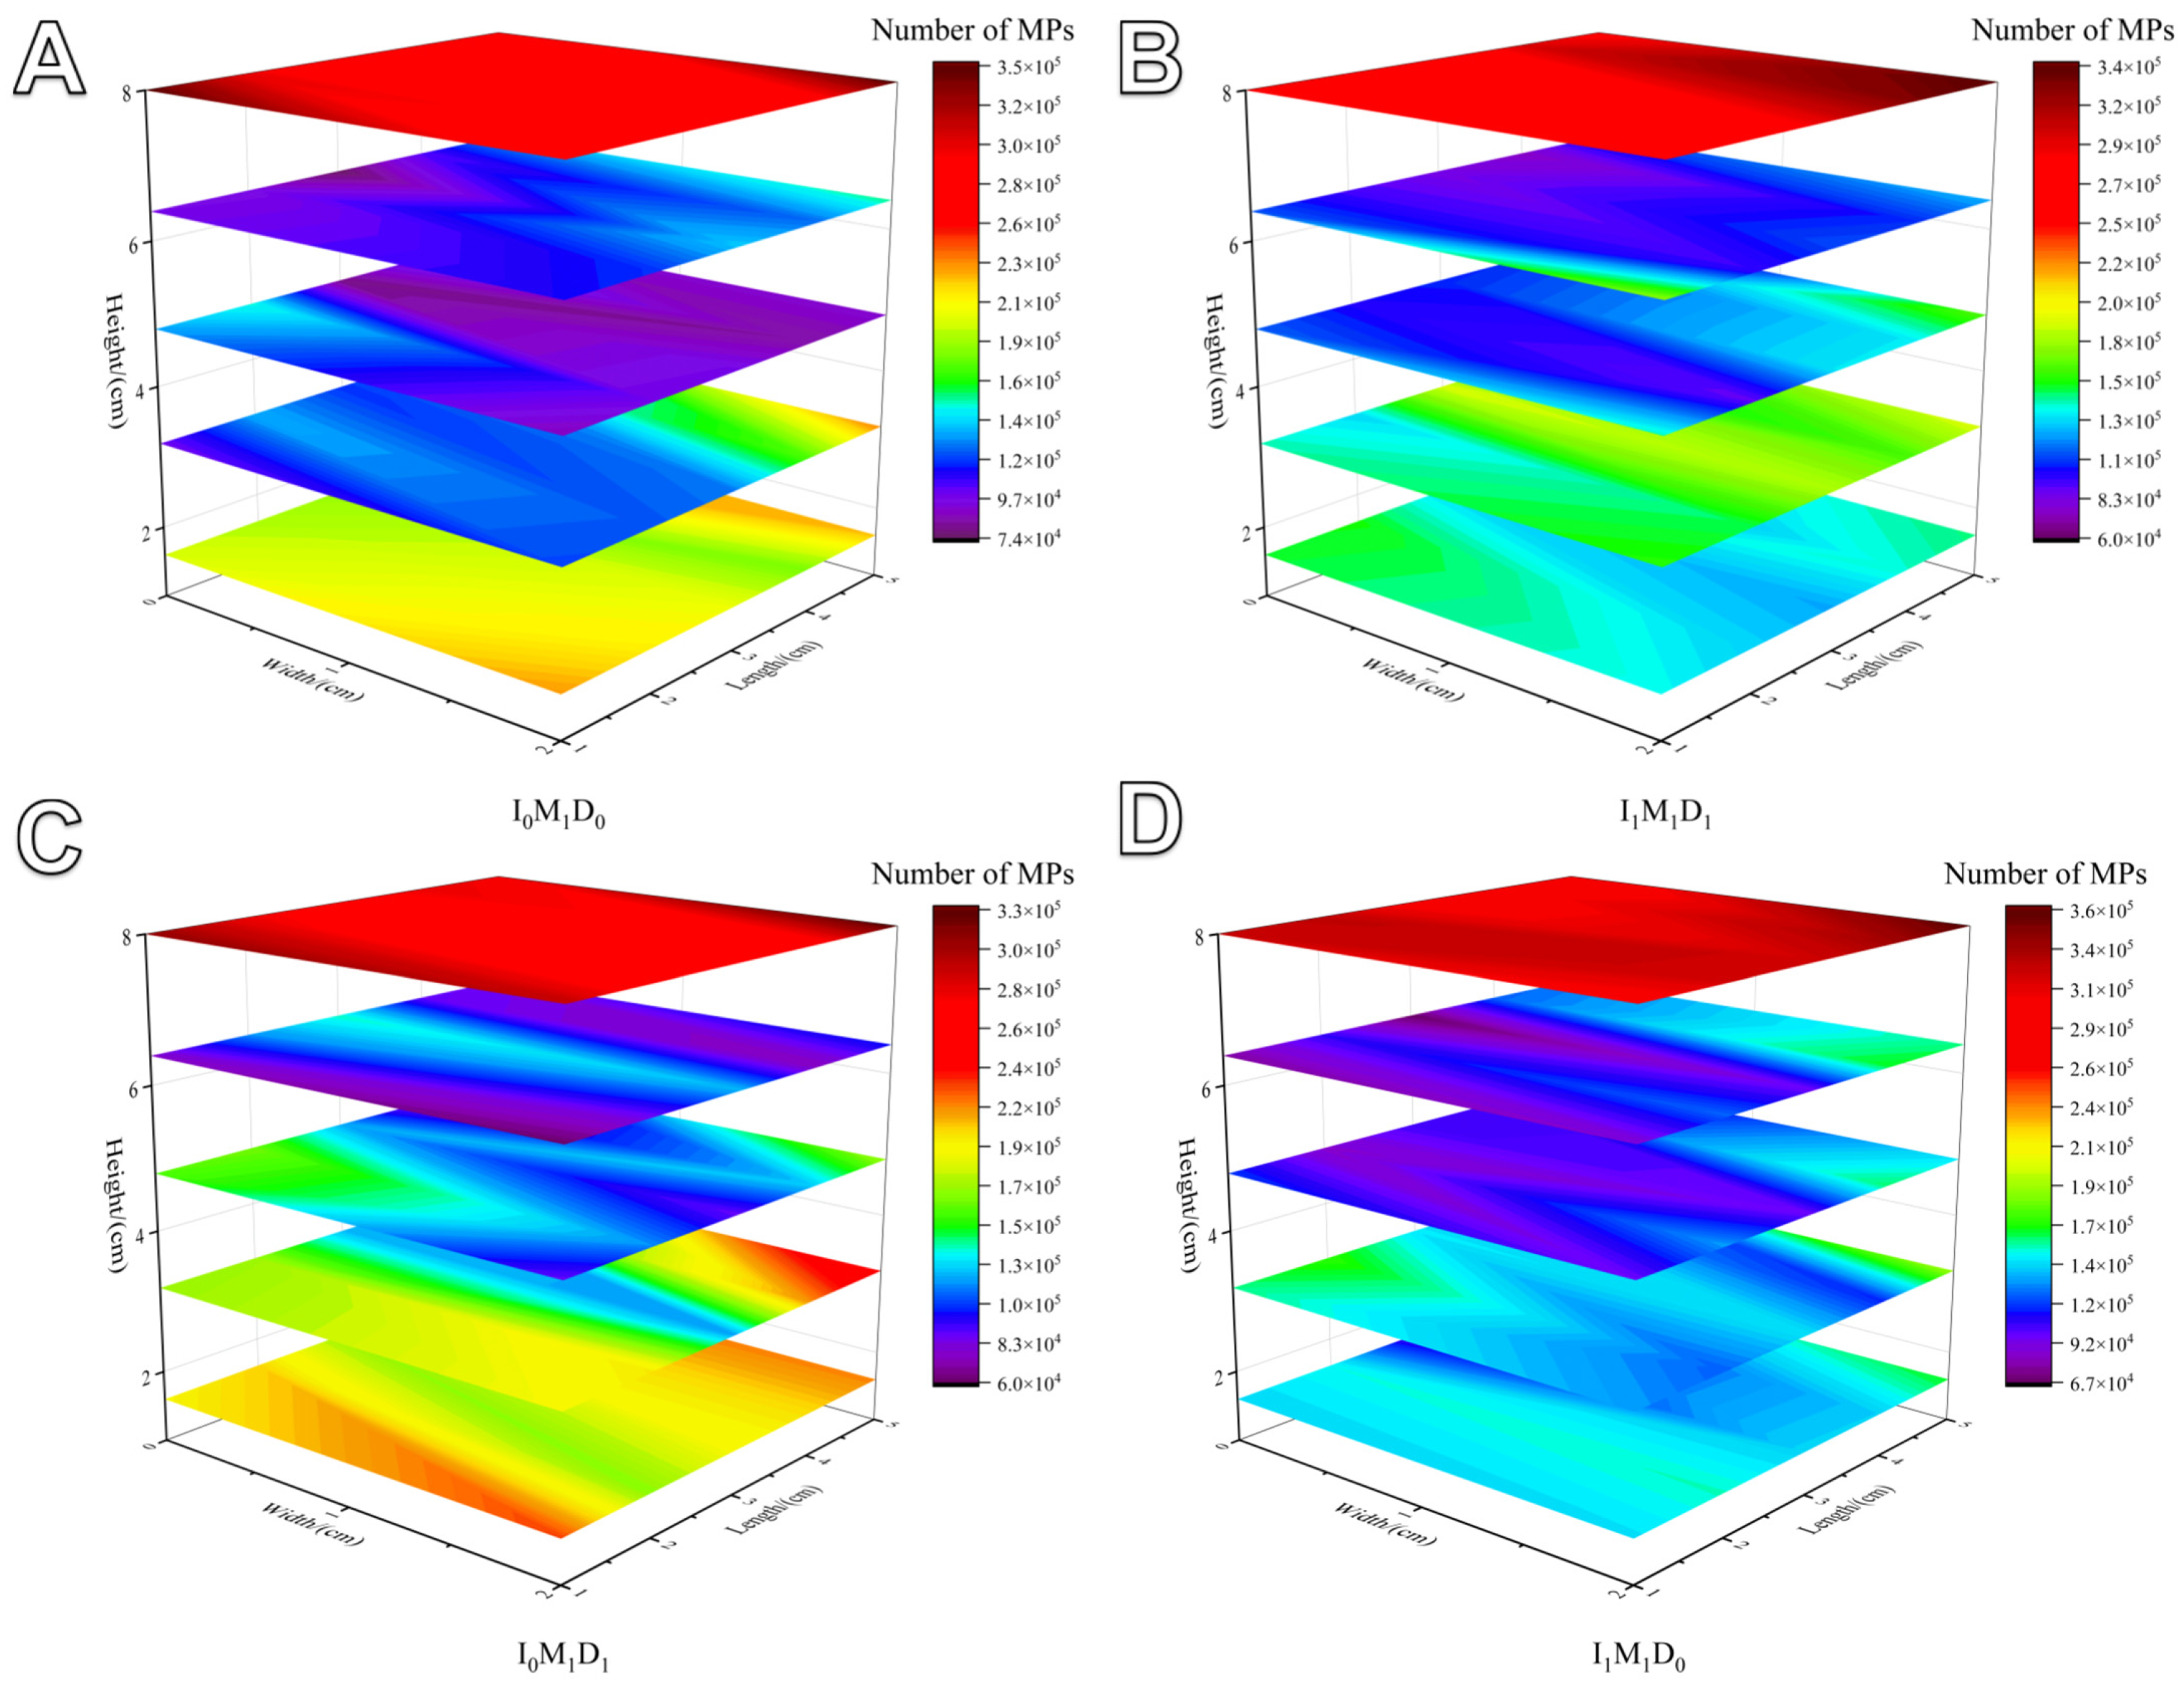
3.4. MP Distribution and Relative Mobility in Paddy Field Systems

As shown in Figure 6, the proportion of MPs stored in the soil is the highest, particularly in I1M1D0. In I0M1D1 and I1M1D1, 2.59% and 5.14% of MPs, respectively, were stored on the duckweed. Notably, the concentration of MPs stored in leakage were 2.69 times higher with FWI than in CI. Within the soil, the RM of MPs was highest in the first soil layer, averaging 32.72% of all MPs (Figure 7). The RM of MPs in the first soil layer was significantly influenced by both irrigation modes and duckweed (Table 2). Controlled irrigation increased the RM by 20.06% in the first soil layer, while duckweed decreased it by 9.20% (Figure 6). Additionally, the RM of MPs in the fourth soil layer was significantly influenced by duckweed. The RM of MPs in the fifth soil layer was significantly affected by the irrigation modes, with controlled irrigation decreasing the RM by 24.65%. Furthermore, the RM of MPs in the soil was significantly influenced by cracks and depth, with the concentration of MPs in deeper soil being 72.2% higher in areas with cracks than without. Notably, there was a C× De interaction on the RM of MPs, with shallow soil containing more MPs when cracks were present (Table 3).

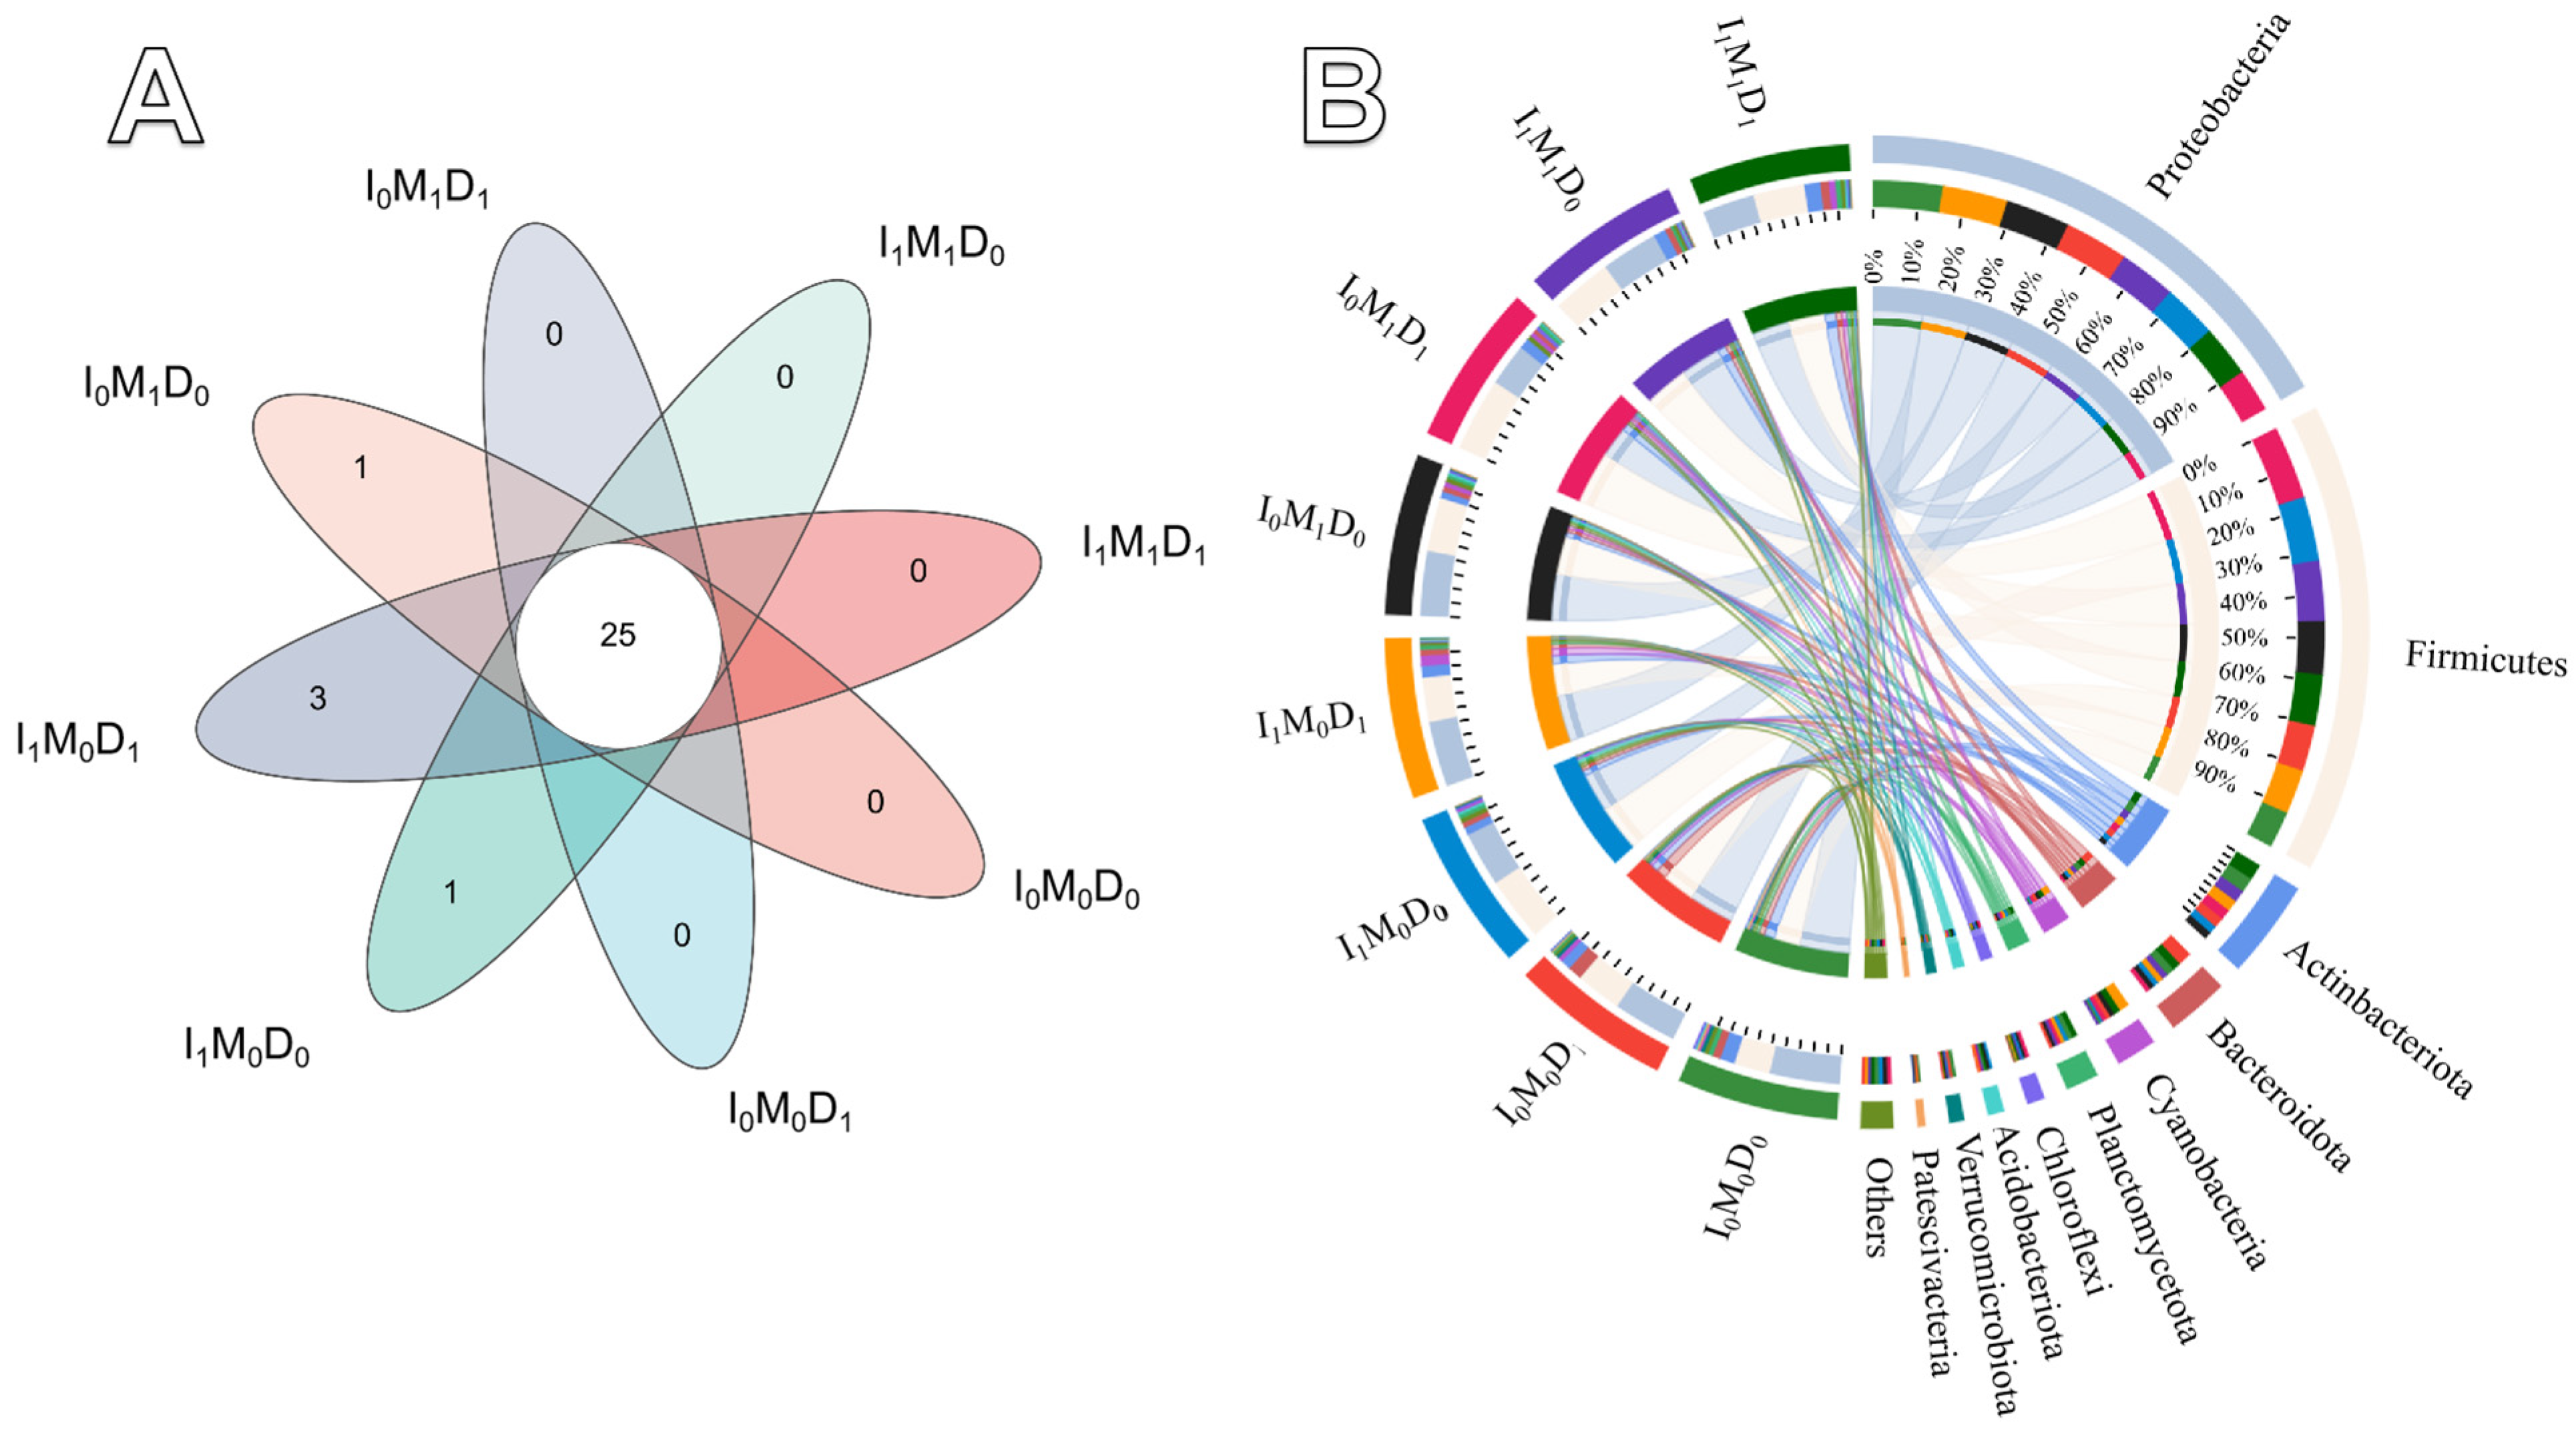
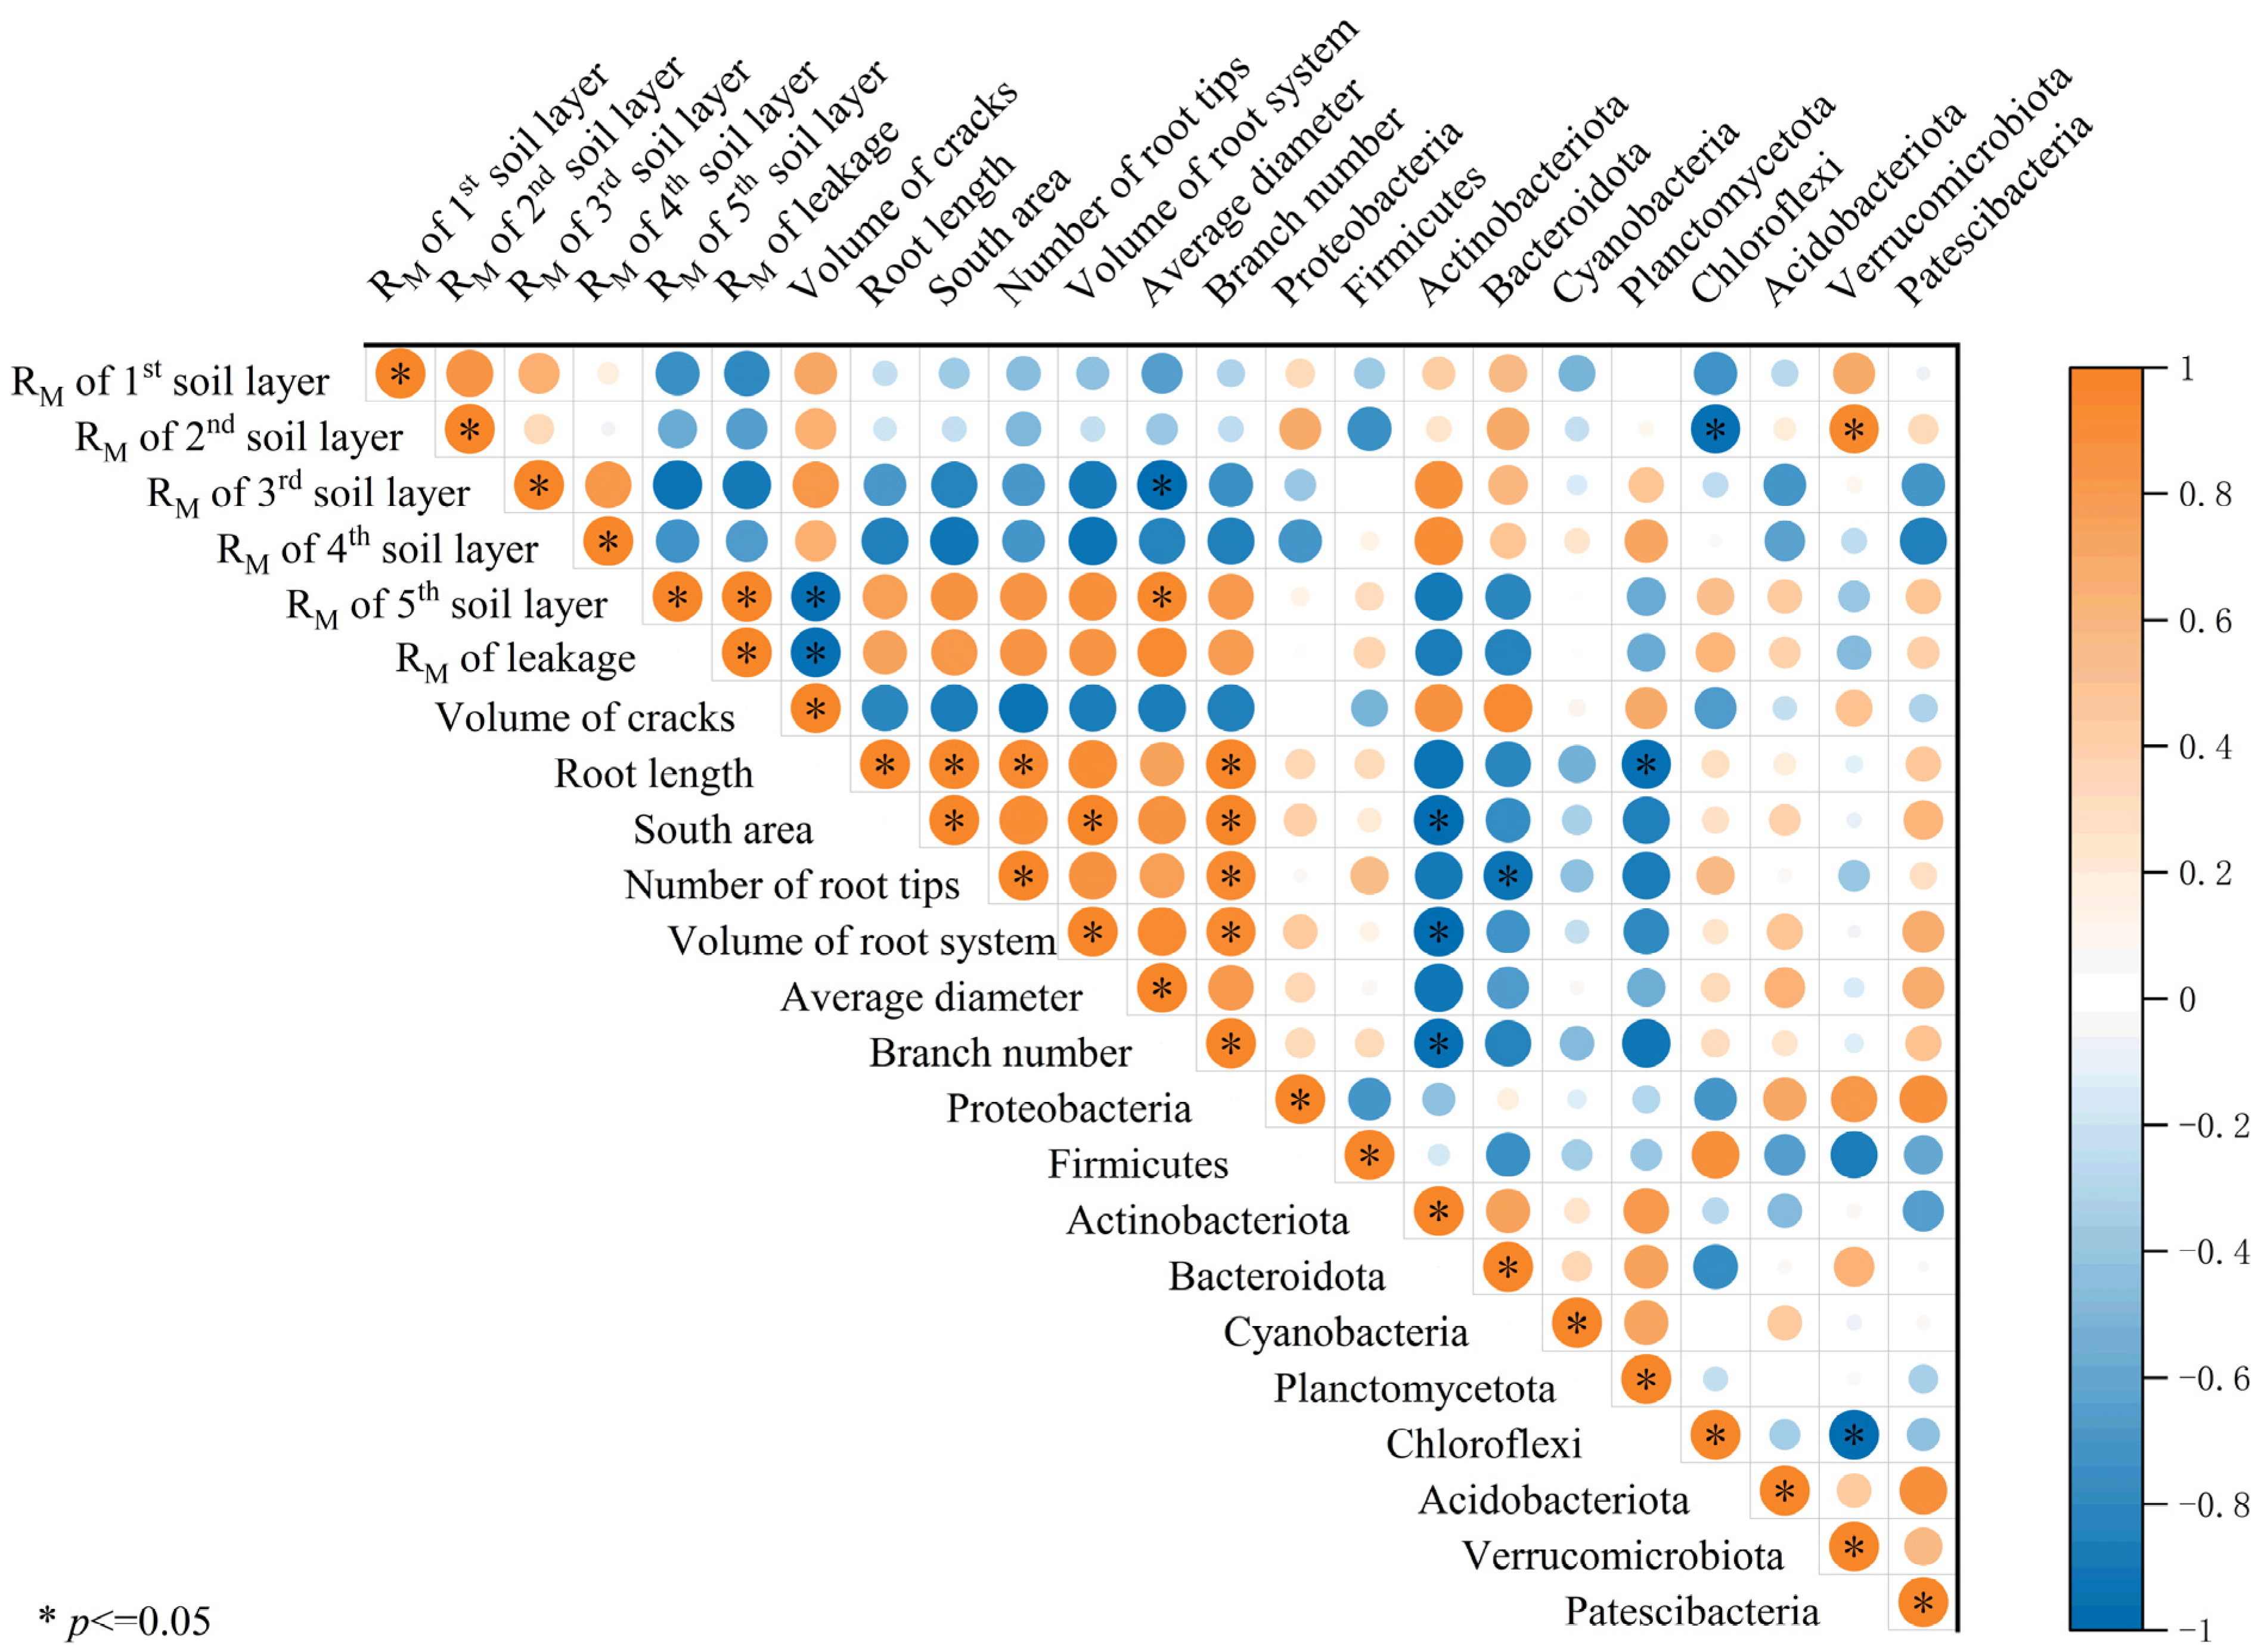
3.5. Microbial Community Diversity and Abundance and Pearson Correlation Analysis

The number of microbial species shared by each treatment was 25. Additionally, there were three unique microbial species in I1M0D1, while I0M1D0 and I1M0D0 each had one unique species. The dominant bacterial phyla identified across the treatments include Proteobacteria (28.56–47.11%), Firmicutes (24.19–49.46%), Actinobacteria (4.51–10.75%), Bacteroidota (2.59–9.43%), Cyanobacteria (1.09–6.96%), and Planctomycetota (1.51–3.56%) (Figure 8). The Pearson correlation analysis between rice root system indicators, the RM of MPs, and microbial abundance is shown in Figure 9. The RM of the second soil layer was positively correlated with Chloroflexi (p < 0.05) and Verrucomicrobiota (p < 0.05). As the RM values increase, the abundance of Chloroflexi and Verrucomicrobiota also increases. The RM of the third soil layer was negatively correlated with the average root diameter (p < 0.05). This indicates that as the RM value of the third soil layer increases, the root diameter significantly decreases (Figure 9). Moreover, the RM of the fifth soil layer was positively correlated with the average root diameter (p < 0.05) while being negatively correlated with the crack volume (p < 0.05). The root length was positively correlated with Planctomycetota (p < 0.05). Notably, Actinobacteriota was negatively correlated with the root surface area, root volume, and branch number (p < 0.05). Bacteroidota was negatively correlated with the number of root tips (p < 0.05). This indicates that the increased abundance of Actinobacteriota and Bacteroidota is associated with reduced rice root system indicators (Figure 9).

4. Discussion

4.1. Influence of MPs on Microorganism and Rice Growth Parameters

MPs could be adhered to the root’s surface, which is consistent with the findings in previous studies [18,22,53]. Similar micron-sized MPs in our experiment, which cannot be absorbed by root tissues, tend to accumulate on the root surface [18]. It has been shown that MPs can clog cell wall pores, inhibit the absorption of water and nutrients, and induce oxidative damage and phytotoxicity (cytotoxicity, genotoxicity, and ecotoxicity) in plants [18,19,20,54]. The accumulation MPs on the root surface can also lead to changes in the rice root’s morphological parameters [13]. Morphological parameters of plant roots, such as the root length, average diameter, biomass, and volume, are affected by MPs/NPs [13]. For example, it was revealed that MPs significantly increased the root length [55]. In contrast, our study found that MPs increased the average diameter by 13.44%, volume by 46.87%, and surface area by 30.81% without affecting the root length. Moreover, it was observed that PE inhibited the root biomass before the flowering stage but significantly increased it to normal levels at harvest [56]. Oppositely, in our experiment, MPs did not affect the root biomass, probably due to the specific growth stage of rice in this experiment. Additionally, MPs significantly increased the aboveground biomass of rice, which might be related to the disturbed nutrient absorption of the rice plant [57].
Accumulated evidence has shown that MPs can affect the abundance of microorganism in paddy field systems [25]. A recent study demonstrated that MPs increased the abundance of arbuscular fungi while suppressing the general fungal community in soil [58], indicating that MPs can alter interactions between plants and symbiotic microorganisms. These alterations in the abundance and activity of microorganisms may result from the effects of MPs on the aboveground biomass and root size indirectly. Meanwhile, they may also be from MP-induced decreases in the soil bulk density, which alter the pore structure and water transport directly [59,60]. In our experiment, the root length was positively correlated with Planctomycetota (Figure 9). Notably, Actinobacteriota was negatively correlated with the root surface area, volume, and branch number (Figure 9). However, there was no evidence to suggest that MPs influence the abundance of these microorganisms in our experiment. Notably, it has been reported that MPs can influence the activity of microorganisms [61]. We speculate that MPs affect the metabolic processes of microorganisms, thereby impacting root growth.

4.2. Migration of MPs in Paddy Field Systems

It has been reported that the vertical migration of MPs poses a risk of groundwater contamination [62,63,64,65]. In our experiment, MPs were detected in leakage after 10 DAT. Research indicates that MPs can migrate to depths of 4–7 cm after 21 days of water supply [31]. In contrast, our experiment showed that MPs reached depths greater than 7 cm within 10 days of irrigation (Figure 4). This difference is likely due to the size of MPs and the type of soil. For instance, smaller MPs exhibit higher mobility within the soil profile [31]. It was suggested that soil porosity significantly affects MP migration, which is supported by previous studies in sandy soils [66,67]. Interestingly, our experiment revealed that more MPs were stored in the third and fourth soil layers than in the second soil layer. This is because the plow pan layer is located in the fourth soil layer. MP migration can be affected by the changes in soil density [66,67]. Additionally, the highest concentration of MPs was found in the first soil layer. On the one hand, MPs are deposited onto the soil surface with irrigation water, and this requires time for migration [31]. On the other hand, this suggests that soil pores are critical pathways for MP migration. Once pore spaces become saturated, they may provide a reverse pathway, allowing MPs to migrate upward due to their relatively low specific density [67].
It has been reported that irrigation can cause secondary MP pollution in the soil environment and accelerate MP contamination in deeper soil layers [33]. In this study, we found that the RM of MPs was significantly influenced by the irrigation mode. Previous research suggests that rainfall events following dry spells are likely to impact the mobility or penetration of MPs into subsurface layers [67]. This indicates that in soil vadose zones, wet–dry cycles promote migration through pore space pathways. [68], This is due to flushing mobilization mechanisms like water film expansion–release [69,70]. In our experiment, CI created wet–dry cycles (Figure 3), but it limited the migration of MPs. For example, CI decreased the RM of MPs in the fifth soil layer by 24.65% and the RM of MPs in the leakage by 62.9% compared to FWI. The reason for this is that the water amount in CI is lower, and water acts as a carrier for the transport of MPs (Figure 7). Notably, we have innovatively discovered the significant impact of cracks on the migration of MPs under different irrigation modes. It was reported that water regimes are key indicators for the formation of cracks [34]. Soil moisture is the main controlling factor for soil shrinkage, swelling, and crack development; thus, changes in the soil structure and porosity under different irrigation modes might influence the occurrence and degree of cracks. In our experiment, crack development was only found under CI. It is well known that cracks can prolong water permeability, allowing for faster and deeper water infiltration [35,36]. In this study, it was shown that cracks can serve as both pathways and sinks for MPs (Figure 2).
Notably, the glass tank experiments allowed for precise control over the temperature, humidity, and water supply. However, real paddy fields are subject to variable climatic conditions, rainfall, and soil types, which can significantly influence MP migration [31,71]. These uncontrolled environmental factors in actual fields may affect the results differently than in controlled experiments, which need further research.

4.3. Joint Regulation of MPs Migration by Irrigating-Duckweed

Rice (Oryza sativa L.), a staple food for over half of the global population [72], is extensively cultivated. Plastic mulching is widely adopted in agriculture [73], and the degradation of plastic mulch can potentially release numerous MPs. As mentioned earlier, MPs could impact rice growth. Therefore, it is crucial to find ways to remove MPs from rice fields [74]. CI was found to slow down the migration of MPs, resulting in higher MP concentrations in the 1st soil layer and lower concentrations in the 5th soil layer under CI compared to FWI. It is suggested that MPs entering deep soil can pose greater risks, potentially contaminating groundwater [63,64,65]. Thus, CI may reduce MP toxicity in rice fields. Nitrogen loss is a significant environmental concern in farmland [75,76]. Interestingly, CI in paddy fields has been reported to decrease leakage and mitigate nitrogen and other fertilizer leaching [28]. In our experiment, MPs in leakage were significantly higher under FWI compared to CI, indicating that CI could slow migration of MPs and reduce pollution from groundwater. Moreover, higher number of MPs were adhered by duckweed under CI compared to FWI. Generally, CI appears to mitigate the toxicity and environmental hazards in paddy fields compared to FWI. However, the cracks caused by CI cannot be ignored. In conclusion, irrigation methods are potentially overlooked strategies to mitigate MP hazards in farmland and warrant further investigation.

5. Conclusions

Our study demonstrates that the irrigation mode significantly affects MP migration. Under FWI, the MP concentrations were higher in the leakage compared to CI. MPs were present in leakage at 10 DAT for both irrigation methods. Duckweed in CI adhered to more MPs than in FWI. The irrigation mode and duckweed presence also influenced MP redistribution in the soil: CI increased MP retention in the first soil layer while decreasing it in deeper layers, indicating that CI-induced cracks facilitate deeper MP migration and potential groundwater contamination. MPs impacted the rice root growth, increasing the diameter by 13.44%, volume by 46.87%, and surface area by 30.81%, although the root length and biomass were not significantly affected. The significant impact on the aboveground biomass and microbial metabolic processes suggests that MPs influence root growth indirectly. These results highlight the need for further research into how irrigation practices, soil structures, and MP behaviors interact to develop more sustainable agricultural practices. Despite valuable insights from small-scale glass tank experiments, there remains a crucial gap in understanding MP behaviors in real paddy field conditions.

Author Contributions

All authors contributed to the study conception and design. Conceptualization: C.H., Z.W. and U.M.; methodology: C.H., Z.W., Y.W., M.T. and J.L.; formal analysis and investigation: M.T., X.Q., J.L., Y.W., K.C. and C.H.; writing—original draft preparation: C.H. and Z.W; writing—review and editing: Z.W. and M.T.; supervision: Z.W. and X.Q. All authors have read and agreed to the published version of the manuscript.

Funding

This research was funded by the Postgraduate Research & Practice Innovation Program of Jiangsu Province (KYCX24_0893) and the National Natural Science Foundation of China (52079041).

Institutional Review Board Statement

Not applicable.

Data Availability Statement

The data used to support the findings of this study are available from the corresponding author upon request.

Conflicts of Interest

The authors declare no conflicts of interest.

References

  1. Wong, J.K.H.; Lee, K.K.; Tang, K.H.D.; Yap, P.-S. Microplastics in the Freshwater and Terrestrial Environments: Prevalence, Fates, Impacts and Sustainable Solutions. Sci. Total Environ. 2020, 719, 137512. [Google Scholar] [CrossRef]
  2. Ray, S.S.; Lee, H.K.; Huyen, D.T.T.; Chen, S.-S.; Kwon, Y.-N. Microplastics Waste in Environment: A Perspective on Recycling Issues from PPE Kits and Face Masks during the COVID-19 Pandemic. Environ. Technol. Innov. 2022, 26, 102290. [Google Scholar] [CrossRef] [PubMed]
  3. Wang, F.; Feng, X.; Liu, Y.; Adams, C.A.; Sun, Y.; Zhang, S. Micro(Nano)Plastics and Terrestrial Plants: Up-to-Date Knowledge on Uptake, Translocation, and Phytotoxicity. Resour. Conserv. Recycl. 2022, 185, 106503. [Google Scholar] [CrossRef]
  4. Zhang, Z.; Wu, X.; Zhang, J.; Huang, X. Distribution and Migration Characteristics of Microplastics in Farmland Soils, Surface Water and Sediments in Caohai Lake, Southwestern Plateau of China. J. Clean. Prod. 2022, 366, 132912. [Google Scholar] [CrossRef]
  5. Yuan, Y.; Qin, Y.; Wang, M.; Xu, W.; Chen, Y.; Zheng, L.; Chen, W.; Luo, T. Microplastics from Agricultural Plastic Mulch Films: A Mini-Review of Their Impacts on the Animal Reproductive System. Ecotoxicol. Environ. Saf. 2022, 244, 114030. [Google Scholar] [CrossRef]
  6. Tian, L.; Jinjin, C.; Ji, R.; Ma, Y.; Yu, X. Microplastics in Agricultural Soils: Sources, Effects, and Their Fate. Curr. Opin. Environ. Sci. Health 2022, 25, 100311. [Google Scholar] [CrossRef]
  7. Lian, J.; Liu, W.; Meng, L.; Wu, J.; Zeb, A.; Cheng, L.; Lian, Y.; Sun, H. Effects of Microplastics Derived from Polymer-Coated Fertilizer on Maize Growth, Rhizosphere, and Soil Properties. J. Clean. Prod. 2021, 318, 128571. [Google Scholar] [CrossRef]
  8. Liu, Y.; Ge, T.; van Groenigen, K.J.; Yang, Y.; Wang, P.; Cheng, K.; Zhu, Z.; Wang, J.; Li, Y.; Guggenberger, G.; et al. Rice Paddy Soils Are a Quantitatively Important Carbon Store According to a Global Synthesis. Commun. Earth Environ. 2021, 2, 154. [Google Scholar] [CrossRef]
  9. Yang, Y.; Jin, Z.; Mueller, N.D.; Driscoll, A.W.; Hernandez, R.R.; Grodsky, S.M.; Sloat, L.L.; Chester, M.V.; Zhu, Y.G.; Lobell, D.B. Sustainable Irrigation and Climate Feedbacks. Nat. Food 2023, 4, 654–663. [Google Scholar] [CrossRef]
  10. Katsumi, N.; Kusube, T.; Nagao, S.; Okochi, H. Accumulation of Microcapsules Derived from Coated Fertilizer in Paddy Fields. Chemosphere 2021, 267, 129185. [Google Scholar] [CrossRef]
  11. Lv, W.; Zhou, W.; Lu, S.; Huang, W.; Yuan, Q.; Tian, M.; Lv, W.; He, D. Microplastic Pollution in Rice-Fish Co-Culture System: A Report of Three Farmland Stations in Shanghai, China. Sci. Total Environ. 2019, 652, 1209–1218. [Google Scholar] [CrossRef] [PubMed]
  12. Yao, Y.; Wang, L.; Gong, L.; Li, G.; Xiu, W.; Yang, X.; Tan, B.; Zhao, J.; Zhang, G. Differences, Links, and Roles of Microbial and Stoichiometric Factors in Microplastic Distribution: A Case Study of Five Typical Rice Cropping Regions in China. Front. Microbiol. 2022, 13, 985239. [Google Scholar] [CrossRef]
  13. Zhou, C.Q.; Lu, C.H.; Mai, L.; Bao, L.J.; Liu, L.Y.; Zeng, E.Y. Response of Rice (Oryza sativa L.) Roots to Nanoplastic Treatment at Seedling Stage. J. Hazard. Mater. 2021, 401, 123412. [Google Scholar] [CrossRef]
  14. Ma, J.; Aqeel, M.; Khalid, N.; Nazir, A.; Alzuaibr, F.M.; Al-Mushhin, A.A.M.; Hakami, O.; Iqbal, M.F.; Chen, F.; Alamri, S.; et al. Effects of Microplastics on Growth and Metabolism of Rice (Oryza sativa L.). Chemosphere 2022, 307, 135749. [Google Scholar] [CrossRef]
  15. Leslie, H.A.; van Velzen, M.J.M.; Brandsma, S.H.; Vethaak, A.D.; Garcia-Vallejo, J.J.; Lamoree, M.H. Discovery and Quantification of Plastic Particle Pollution in Human Blood. Environ. Int. 2022, 163, 107199. [Google Scholar] [CrossRef]
  16. Liu, Y.; Guo, R.; Zhang, S.; Sun, Y.; Wang, F. Uptake and Translocation of Nano/Microplastics by Rice Seedlings: Evidence from a Hydroponic Experiment. J. Hazard. Mater. 2022, 421, 126700. [Google Scholar] [CrossRef] [PubMed]
  17. Zhang, N.; Li, Y.B.; He, H.R.; Zhang, J.F.; Ma, G.S. You Are What You Eat: Microplastics in the Feces of Young Men Living in Beijing. Sci. Total Environ. 2021, 767, 144345. [Google Scholar] [CrossRef]
  18. Jiang, X.; Chen, H.; Liao, Y.; Ye, Z.; Li, M.; Klobučar, G. Ecotoxicity and Genotoxicity of Polystyrene Microplastics on Higher Plant Vicia Faba. Environ. Pollut. 2019, 250, 831–838. [Google Scholar] [CrossRef] [PubMed]
  19. Bosker, T.; Bouwman, L.J.; Brun, N.R.; Behrens, P.; Vijver, M.G. Microplastics Accumulate on Pores in Seed Capsule and Delay Germination and Root Growth of the Terrestrial Vascular Plant Lepidium Sativum. Chemosphere 2019, 226, 774–781. [Google Scholar] [CrossRef]
  20. Dong, Y.; Gao, M.; Song, Z.; Qiu, W. Microplastic Particles Increase Arsenic Toxicity to Rice Seedlings. Environ. Pollut. 2020, 259, 113892. [Google Scholar] [CrossRef]
  21. Sun, M.; Wang, Y.; Wang, Y.; Chen, G.; Zhao, L.; Zhang, Y. Photosynthetic Characteristics of Japonica Rice Cultivar Nanjing 5055 and Its Parents. Jiangsu J. Agric. Sci. 2020, 36, 1–9. [Google Scholar] [CrossRef]
  22. Mateos-Cárdenas, A.; Scott, D.T.; Seitmaganbetova, G.; van, P.; John, O.H.; Marcel, A.K.J. Polyethylene Microplastics Adhere to Lemna minor (L.), yet Have No Effects on Plant Growth or Feeding by Gammarus duebeni (Lillj.). Sci. Total Environ. 2019, 689, 413–421. [Google Scholar] [CrossRef]
  23. Taylor, S.E.; Pearce, C.I.; Sanguinet, K.A.; Hu, D.; Chrisler, W.B.; Kim, Y.-M.; Wang, Z.; Flury, M. Polystyrene Nano- and Microplastic Accumulation at Arabidopsis and Wheat Root Cap Cells, but No Evidence for Uptake into Roots. Environ. Sci. Nano 2020, 7, 1942–1953. [Google Scholar] [CrossRef]
  24. Verma, P.K.; Verma, S.; Pandey, N. Root System Architecture in Rice: Impacts of Genes, Phytohormones and Root Microbiota. 3 Biotech 2022, 12, 239. [Google Scholar] [CrossRef]
  25. Yu, Y.; Li, X.; Feng, Z.; Xiao, M.; Ge, T.; Li, Y.; Yao, H. Polyethylene Microplastics Alter the Microbial Functional Gene Abundances and Increase Nitrous Oxide Emissions from Paddy Soils. J. Hazard. Mater. 2022, 432, 128721. [Google Scholar] [CrossRef] [PubMed]
  26. Lampayan, R.M.; Rejesus, R.M.; Singleton, G.R.; Bouman, B.A.M. Adoption and Economics of Alternate Wetting and Drying Water Management for Irrigated Lowland Rice. Field Crops Res. 2015, 170, 95–108. [Google Scholar] [CrossRef]
  27. Bo, Y.; Jägermeyr, J.; Yin, Z.; Jiang, Y.; Xu, J.; Liang, H.; Zhou, F. Global Benefits of Non-Continuous Flooding to Reduce Greenhouse Gases and Irrigation Water Use without Rice Yield Penalty. Glob. Change Biol. 2022, 28, 3636–3650. [Google Scholar] [CrossRef]
  28. Hong, C.; Wang, Z.; Wang, Y.; Zong, X.; Qiang, X.; Li, Q.; Shaghaleh, H.; Alhaj Hamoud, Y.; Guo, X. Response of Duckweed to Different Irrigation Modes under Different Fertilizer Types and Rice Varieties: Unlocking the Potential of Duckweed (Lemna minor L.) in Rice Cultivation as “Fertilizer Capacitors”. Agric. Water Manag. 2024, 292, 108681. [Google Scholar] [CrossRef]
  29. Peng, S.; Buresh, R.J.; Huang, J.; Yang, J.; Zou, Y.; Zhong, X.; Wang, G.; Zhang, F. Strategies for Overcoming Low Agronomic Nitrogen Use Efficiency in Irrigated Rice Systems in China. Field Crops Res. 2006, 96, 37–47. [Google Scholar] [CrossRef]
  30. Xu, Z.; Chen, X.; Liu, J.; Zhang, Y.; Chau, S.; Bhattarai, N.; Wang, Y.; Li, Y.; Connor, T.; Li, Y. Impacts of Irrigated Agriculture on Food–Energy–Water–CO2 Nexus across Metacoupled Systems. Nat. Commun. 2020, 11, 5837. [Google Scholar] [CrossRef]
  31. Zhang, X.; Chen, Y.; Li, X.; Zhang, Y.; Gao, W.; Jiang, J.; Mo, A.; He, D. Size/Shape-Dependent Migration of Microplastics in Agricultural Soil under Simulative and Natural Rainfall. Sci. Total Environ. 2022, 815, 152507. [Google Scholar] [CrossRef] [PubMed]
  32. Bigalke, M.; Fieber, M.; Foetisch, A.; Reynes, J.; Tollan, P. Microplastics in Agricultural Drainage Water: A Link between Terrestrial and Aquatic Microplastic Pollution. Sci. Total Environ. 2022, 806, 150709. [Google Scholar] [CrossRef]
  33. Liu, Y.; Liu, Y.; Li, Y.; Bian, P.; Hu, Y.; Zhang, J.; Shen, W. Effects of Irrigation on the Fate of Microplastics in Typical Agricultural Soil and Freshwater Environments in the Upper Irrigation Area of the Yellow River. J. Hazard. Mater. 2023, 447, 130766. [Google Scholar] [CrossRef]
  34. Alhaj Hamoud, Y.; Guo, X.; Wang, Z.; Shaghaleh, H.; Chen, S.; Hassan, A.; Bakour, A. Effects of Irrigation Regime and Soil Clay Content and Their Interaction on the Biological Yield, Nitrogen Uptake and Nitrogen-Use Efficiency of Rice Grown in Southern China. Agric. Water Manag. 2019, 213, 934–946. [Google Scholar] [CrossRef]
  35. Greve, A.; Andersen, M.S.; Acworth, R.I. Investigations of Soil Cracking and Preferential Flow in a Weighing Lysimeter Filled with Cracking Clay Soil. J. Hydrol. 2010, 393, 105–113. [Google Scholar] [CrossRef]
  36. Stewart, R.D.; Abou Najm, M.R.; Rupp, D.E.; Lane, J.W.; Uribe, H.C.; Arumí, J.L.; Selker, J.S. Hillslope Run-off Thresholds with Shrink-Swell Clay Soils. Hydrol. Process. 2015, 29, 557–571. [Google Scholar] [CrossRef]
  37. Huang, L.; Lu, Y.; Gao, X.; Du, G.; Ma, X.; Liu, M.; Guo, J.; Chen, Y. Ammonium-Induced Oxidative Stress on Plant Growth and Antioxidative Response of Duckweed (Lemna minor L.). Ecol. Eng. 2013, 58, 355–362. [Google Scholar] [CrossRef]
  38. Chen, S.; Xu, J.; Peng, L.; Cheng, Z.; Kuang, X.; Li, D.; Peng, C.; Song, H. Cadmium Accumulation in Rice Grains Is Mitigated by Duckweed-like Hydrophyte through Adsorption and Increased Ammonia Nitrogen. Sci. Total Environ. 2023, 890, 164510. [Google Scholar] [CrossRef]
  39. Chen, G.; Yu, Y.; Li, W.; Yan, B.; Zhao, K.; Dong, X.; Cheng, Z.; Lin, F.; Li, L.; Zhao, H.; et al. Effects of Reaction Conditions on Products and Elements Distribution via Hydrothermal Liquefaction of Duckweed for Wastewater Treatment. Bioresour. Technol. 2020, 317, 124033. [Google Scholar] [CrossRef]
  40. Liu, Y.; Wang, L.; Bao, S.; Liu, H.; Yu, J.; Wang, Y.; Shao, H.; Ouyang, Y.; An, S. Effects of Different Vegetation Zones on CH4 and N2O Emissions in Coastal Wetlands: A Model Case Study. Sci. World J. 2014, 2014, 412183. [Google Scholar] [CrossRef]
  41. Sun, H.; A, D.; Feng, Y.; Vithanage, M.; Mandal, S.; Shaheen, S.M.; Rinklebe, J.; Shi, W.; Wang, H. Floating Duckweed Mitigated Ammonia Volatilization and Increased Grain Yield and Nitrogen Use Efficiency of Rice in Biochar Amended Paddy Soils. Chemosphere 2019, 237, 124532. [Google Scholar] [CrossRef]
  42. Zhuang, Y.; Zhang, L.; Li, S.; Liu, H.; Zhai, L.; Zhou, F.; Ye, Y.; Ruan, S.; Wen, W. Effects and Potential of Water-Saving Irrigation for Rice Production in China. Agric. Water Manag. 2019, 217, 374–382. [Google Scholar] [CrossRef]
  43. Xie, Y.; Wang, Z.; Guo, X.; Lakthan, S.; Chen, S.; Xiao, Z.; Alhaj Hamoud, Y. Effects of Different Irrigation Treatments on Aquaculture Purification and Soil Desalination of Paddy Fields. Water 2019, 11, 1424. [Google Scholar] [CrossRef]
  44. Parada, A.E.; Needham, D.M.; Fuhrman, J.A. Every Base Matters: Assessing Small Subunit rRNA Primers for Marine Microbiomes with Mock Communities, Time Series and Global Field Samples. Environ. Microbiol. 2016, 18, 1403–1414. [Google Scholar] [CrossRef] [PubMed]
  45. Mohedano, R.A.; Tonon, G.; Costa, R.H.R.; Pelissari, C.; Belli Filho, P. Does Duckweed Ponds Used for Wastewater Treatment Emit or Sequester Greenhouse Gases? Sci. Total Environ. 2019, 691, 1043–1050. [Google Scholar] [CrossRef] [PubMed]
  46. Guevara-Escobar, A.; Tellez, J.; Gonzalez-Sosa, E. Use of Digital Photography for Analysis of Canopy Closure. Agrofor. Syst. 2005, 65, 175–185. [Google Scholar] [CrossRef]
  47. Schroeder, A.B.; Dobson, E.T.A.; Rueden, C.T.; Tomancak, P.; Jug, F.; Eliceiri, K.W. The ImageJ Ecosystem: Open-source Software for Image Visualization, Processing, and Analysis. Protein Sci. 2021, 30, 234–249. [Google Scholar] [CrossRef] [PubMed]
  48. Constant, M.; Billon, G.; Breton, N.; Alary, C. Extraction of Microplastics from Sediment Matrices: Experimental Comparative Analysis. J. Hazard. Mater. 2021, 420, 126571. [Google Scholar] [CrossRef]
  49. Thompson, R.C.; Olsen, Y.; Mitchell, R.P.; Davis, A.; Rowland, S.J.; John, A.W.G.; McGonigle, D.; Russell, A.E. Lost at Sea: Where Is All the Plastic? Science 2004, 304, 838. [Google Scholar] [CrossRef]
  50. Phuong, N.N.; Poirier, L.; Lagarde, F.; Kamari, A.; Zalouk-Vergnoux, A. Microplastic Abundance and Characteristics in French Atlantic Coastal Sediments Using a New Extraction Method. Environ. Pollut. 2018, 243, 228–237. [Google Scholar] [CrossRef]
  51. Bandyopadhyay, K.K.; Mohanty, M.; Painuli, D.K.; Misra, A.K.; Hati, K.M.; Mandal, K.G.; Ghosh, P.K.; Chaudhary, R.S.; Acharya, C.L. Influence of Tillage Practices and Nutrient Management on Crack Parameters in a Vertisol of Central India. Soil. Tillage Res. 2003, 71, 133–142. [Google Scholar] [CrossRef]
  52. Sharma, P.K.; Verma, T.S.; Bhagat, R.M. Soil Structural Improvements with the Addition of Lantana Camara Biomass in Rice-wheat Cropping. Soil. Use Manag. 1995, 11, 199–203. [Google Scholar] [CrossRef]
  53. Kalčíková, G.; Žgajnar Gotvajn, A.; Kladnik, A.; Jemec, A. Impact of Polyethylene Microbeads on the Floating Freshwater Plant Duckweed Lemna Minor. Environ. Pollut. 2017, 230, 1108–1115. [Google Scholar] [CrossRef]
  54. Sun, X.-D.; Yuan, X.-Z.; Jia, Y.; Feng, L.-J.; Zhu, F.-P.; Dong, S.-S.; Liu, J.; Kong, X.; Tian, H.; Duan, J.-L.; et al. Differentially Charged Nanoplastics Demonstrate Distinct Accumulation in Arabidopsis Thaliana. Nat. Nanotechnol. 2020, 15, 755–760. [Google Scholar] [CrossRef] [PubMed]
  55. Lian, J.; Wu, J.; Xiong, H.; Zeb, A.; Yang, T.; Su, X.; Su, L.; Liu, W. Impact of Polystyrene Nanoplastics (PSNPs) on Seed Germination and Seedling Growth of Wheat (Triticum aestivum L.). J. Hazard. Mater. 2020, 385, 121620. [Google Scholar] [CrossRef]
  56. Li, B.; Huang, S.; Wang, H.; Liu, M.; Xue, S.; Tang, D.; Cheng, W.; Fan, T.; Yang, X. Effects of Plastic Particles on Germination and Growth of Soybean (Glycine Max): A Pot Experiment under Field Condition. Environ. Pollut. 2021, 272, 116418. [Google Scholar] [CrossRef] [PubMed]
  57. Xing, L.; Zhang, Y.; Chang, S.; Tao, L.; Su, G. Uptake, Accumulation and Translocation of Traditional and Novel Organophosphate Esters by Rice Seedlings in the Presence of Micro(Nano)-Polystyrene Plastics: Effects of Concentration and Size of Particles. Sci. Total Environ. 2023, 898, 165534. [Google Scholar] [CrossRef]
  58. Zang, H.; Zhou, J.; Marshall, M.R.; Chadwick, D.R.; Wen, Y.; Jones, D.L. Microplastics in the Agroecosystem: Are They an Emerging Threat to the Plant-Soil System? Soil. Biol. Biochem. 2020, 148, 107926. [Google Scholar] [CrossRef]
  59. Lozano, Y.M.; Lehnert, T.; Linck, L.T.; Lehmann, A.; Rillig, M.C. Frontiers Production Office Erratum: Microplastic Shape, Polymer Type, and Concentration Affect Soil Properties and Plant Biomass. Front. Plant Sci. 2021, 12, 714541. [Google Scholar] [CrossRef]
  60. Leifheit, E.F.; Lehmann, A.; Rillig, M.C. Potential Effects of Microplastic on Arbuscular Mycorrhizal Fungi. Front. Plant Sci. 2021, 12, 626709. [Google Scholar] [CrossRef]
  61. Xiao, M.; Ding, J.; Luo, Y.; Zhang, H.; Yu, Y.; Yao, H.; Zhu, Z.; Chadwick, D.R.; Jones, D.; Chen, J.; et al. Microplastics Shape Microbial Communities Affecting Soil Organic Matter Decomposition in Paddy Soil. J. Hazard. Mater. 2022, 431, 128589. [Google Scholar] [CrossRef] [PubMed]
  62. Selvam, S.; Jesuraja, K.; Venkatramanan, S.; Roy, P.D.; Jeyanthi Kumari, V. Hazardous Microplastic Characteristics and Its Role as a Vector of Heavy Metal in Groundwater and Surface Water of Coastal South India. J. Hazard. Mater. 2021, 402, 123786. [Google Scholar] [CrossRef]
  63. Samandra, S.; Johnston, J.M.; Jaeger, J.E.; Symons, B.; Xie, S.; Currell, M.; Ellis, A.V.; Clarke, B.O. Microplastic Contamination of an Unconfined Groundwater Aquifer in Victoria, Australia. Sci. Total Environ. 2022, 802, 149727. [Google Scholar] [CrossRef] [PubMed]
  64. Ren, Z.; Gui, X.; Xu, X.; Zhao, L.; Qiu, H.; Cao, X. Microplastics in the Soil-Groundwater Environment: Aging, Migration, and Co-Transport of Contaminants—A Critical Review. J. Hazard. Mater. 2021, 419, 126455. [Google Scholar] [CrossRef]
  65. Luo, Z.; Zhu, J.; Yu, L.; Yin, K. Heavy Metal Remediation by Nano Zero-Valent Iron in the Presence of Microplastics in Groundwater: Inhibition and Induced Promotion on Aging Effects. Environ. Pollut. 2021, 287, 117628. [Google Scholar] [CrossRef]
  66. Gao, J.; Pan, S.; Li, P.; Wang, L.; Hou, R.; Wu, W.-M.; Luo, J.; Hou, D. Vertical Migration of Microplastics in Porous Media: Multiple Controlling Factors under Wet-Dry Cycling. J. Hazard. Mater. 2021, 419, 126413. [Google Scholar] [CrossRef] [PubMed]
  67. O’Connor, D.; Pan, S.; Shen, Z.; Song, Y.; Jin, Y.; Wu, W.-M.; Hou, D. Microplastics Undergo Accelerated Vertical Migration in Sand Soil Due to Small Size and Wet-Dry Cycles. Environ. Pollut. 2019, 249, 527–534. [Google Scholar] [CrossRef] [PubMed]
  68. McCarthy, J.F.; McKay, L.D. Colloid Transport in the Subsurface: Past, Present, and Future Challenges. Vadose Zone J. 2004, 3, 326–337. [Google Scholar] [CrossRef]
  69. DeNovio, N.M.; Saiers, J.E.; Ryan, J.N. Colloid Movement in Unsaturated Porous Media: Recent Advances and Future Directions. Vadose Zone J. 2004, 3, 338–351. [Google Scholar] [CrossRef]
  70. Chu, Y.; Jin, Y.; Flury, M.; Yates, M.V. Mechanisms of Virus Removal during Transport in Unsaturated Porous Media. Water Resour. Res. 2001, 37, 253–263. [Google Scholar] [CrossRef]
  71. Nicole, W. An Ill Wind? Growing Recognition of Airborne Nano- and Microplastic Exposures. Environ. Health Perspect 2023, 131, 042001. [Google Scholar] [CrossRef] [PubMed]
  72. Paliwal, A.; Laborte, A.; Nelson, A.; Singh, R.K. Salinity Stress Detection in Rice Crops Using Time Series MODIS VI Data. Int. J. Remote Sens. 2019, 40, 8186–8202. [Google Scholar] [CrossRef]
  73. Steinmetz, Z.; Wollmann, C.; Schaefer, M.; Buchmann, C.; David, J.; Tröger, J.; Muñoz, K.; Frör, O.; Schaumann, G.E. Plastic Mulching in Agriculture. Trading Short-Term Agronomic Benefits for Long-Term Soil Degradation? Sci. Total Environ. 2016, 550, 690–705. [Google Scholar] [CrossRef]
  74. Liuyue He, Z.L.J.X. Soil Microplastics Pollution in Agriculture. Science 2023, 379, 547. [Google Scholar] [CrossRef]
  75. Wei, Q.; Wei, Q.; Xu, J.; Liu, Y.; Wang, D.; Chen, S.; Qian, W.; He, M.; Chen, P.; Zhou, X.; et al. Nitrogen Losses from Soil as Affected by Water and Fertilizer Management under Drip Irrigation: Development, Hotspots and Future Perspectives. Agric. Water Manag. 2024, 296, 108791. [Google Scholar] [CrossRef]
  76. Qi, D.; Yan, J.; Zhu, J. Effect of a Reduced Fertilizer Rate on the Water Quality of Paddy Fields and Rice Yields under Fishpond Effluent Irrigation. Agric. Water Manag. 2020, 231, 105999. [Google Scholar] [CrossRef]
Figure 1. SEM images of MPs. (A) represents MPs themselves, while (B) represents MPs on the surface of the soil.
Agriculture 14 01460 g001
Figure 2. Schematic diagram of the experiment design and migration of MPs. ① represents the method of dividing soil into blocks, ② and ③ represent FWI, and ④ and ⑤ represent CI at different stages of rice growth.
Agriculture 14 01460 g002
Figure 3. Water depth changes continuously with DAT in different treatments. I, M, and D indicate irrigation mode, MPs, and duckweed, respectively. (A) represents treatments for I1M0D0 and I1M0D0; (B) represents treatments for I0M0D1 and I1M0D1; (C) represents treatments for I0M1D0 and I1M1D0; (D) represents treatments for I0M1D1 and I1M1D1.
Agriculture 14 01460 g003
Figure 4. The concentration of MPs in leakage changes continuously with DAT under different treatments. I, M, and D indicate irrigation mode, MPs, and duckweed, respectively.
Agriculture 14 01460 g004
Figure 5. Root system indicators and organ biomass of rice. This includes the surface area (A), number of root tips (B), volume (C), average diameter (D), branch number (E), total length (F), and biomass of the root system (G), as well as the biomass of the aboveground portion (H). NS, *, represent no significant difference, p < 0.05, under three-way ANOVA, respectively. I, M, and D indicate irrigation mode, MPs, and duckweed, respectively.
Agriculture 14 01460 g005
Figure 6. The proportion of microplastic storage in soil, seepage, and duckweed (A), as well as the RM of MPs in different layers of soil (B). I, M, and D indicate irrigation mode, MPs, and duckweed, respectively.
Agriculture 14 01460 g006
Figure 7. Multiple 3D surfaces in same layer to represent the distribution of MPs in the soil under different treatments. (A) represents treatment for I0M1D0; (B) represents treatment for I1M1D1; (C) represents treatment for I0M1D1; (D) represents treatment for I1M1D0.
Agriculture 14 01460 g007
Figure 8. Venn diagrams illustrating the number of shared and unique species across different treatments (A). The central area represents the number of microbial species common to all treatments, while the surrounding areas indicate the number of species unique to each treatment. To visually represent and compare the compositions of dominant bacterial phyla across different treatments, we use Circos diagrams (B). These Circos diagrams depict the relative abundances of dominant bacterial phyla under various experimental conditions, offering a clear and intuitive visualization of the differences in bacterial communities across treatments.
Agriculture 14 01460 g008
Figure 9. Correlation plot between RM, indicators of roots system, and microbial data. The filled circular areas are directly proportional to the Pearson correlation coefficient, where a complete circle represents a correlation coefficient of 1 or −1. The orange and blue hues serve as visual indicators of positive and negative correlations, respectively. * represents p < 0.05 under the Pearson correlation.
Agriculture 14 01460 g009
Table 1. Size distribution of MPs.
Types of MicroplasticsSize (µm)Relative Frequency
PE1~20.16%
2~54.80%
5~1018.30%
10~2540.57%
25~5025.24%
50~10010.94%
Table 2. Output of two-way ANOVA for the RM by I and D.
The RM of MPsIDI × D
First soil layer***NS
Second soil layerNSNSNS
Third soil layerNSNSNS
Fourth soil layerNS*NS
Fifth soil layer***NSNS
I and D indicate irrigation mode and duckweed, respectively. NS, *, **, and *** represent no significant difference; p < 0.05, p < 0.01, and p < 0.001 under two-way ANOVA, respectively.
Table 3. Output of two-way ANOVA for the RM by C and De.
The RM of MPsCDeC × De
All of soil block*****
C and De indicate crack and depth, respectively. *, and *** represent p < 0.05, and p < 0.001 under two-way ANOVA, respectively.
Disclaimer/Publisher’s Note: The statements, opinions and data contained in all publications are solely those of the individual author(s) and contributor(s) and not of MDPI and/or the editor(s). MDPI and/or the editor(s) disclaim responsibility for any injury to people or property resulting from any ideas, methods, instructions or products referred to in the content.

