
Evaluation of the Effectiveness of a Humic Substances-Based Product for Lettuce Growth and Nitrogen Use Efficiency under Low Nitrogen Conditions
 , ,
, ,
Abstract
:1. Introduction
2. Materials and Methods
2.1. Growth Conditions and Vegetal Material
2.2. Nitrogen Treatments, Biostimulant Application, and Experimental Design
2.3. Plant Sampling and Growth Measurements
2.4. Chlorophyll (Chl) and Carotenoid Concentration
2.5. Analysis of Leaf Gas Exchange Parameters
2.6. Estimation of Chlorophyll a Fluorescence
2.7. Nitrate (NO3−), Organic Nitrogen, and Total Nitrogen Concentration
2.8. Enzyme Extraction and Activity Determination
2.9. Concentration of Soluble Amino Acids and Proteins
2.10. Nitrogen Use Efficiency (NUE) Parameters
2.11. Statistical Procedures
3. Results
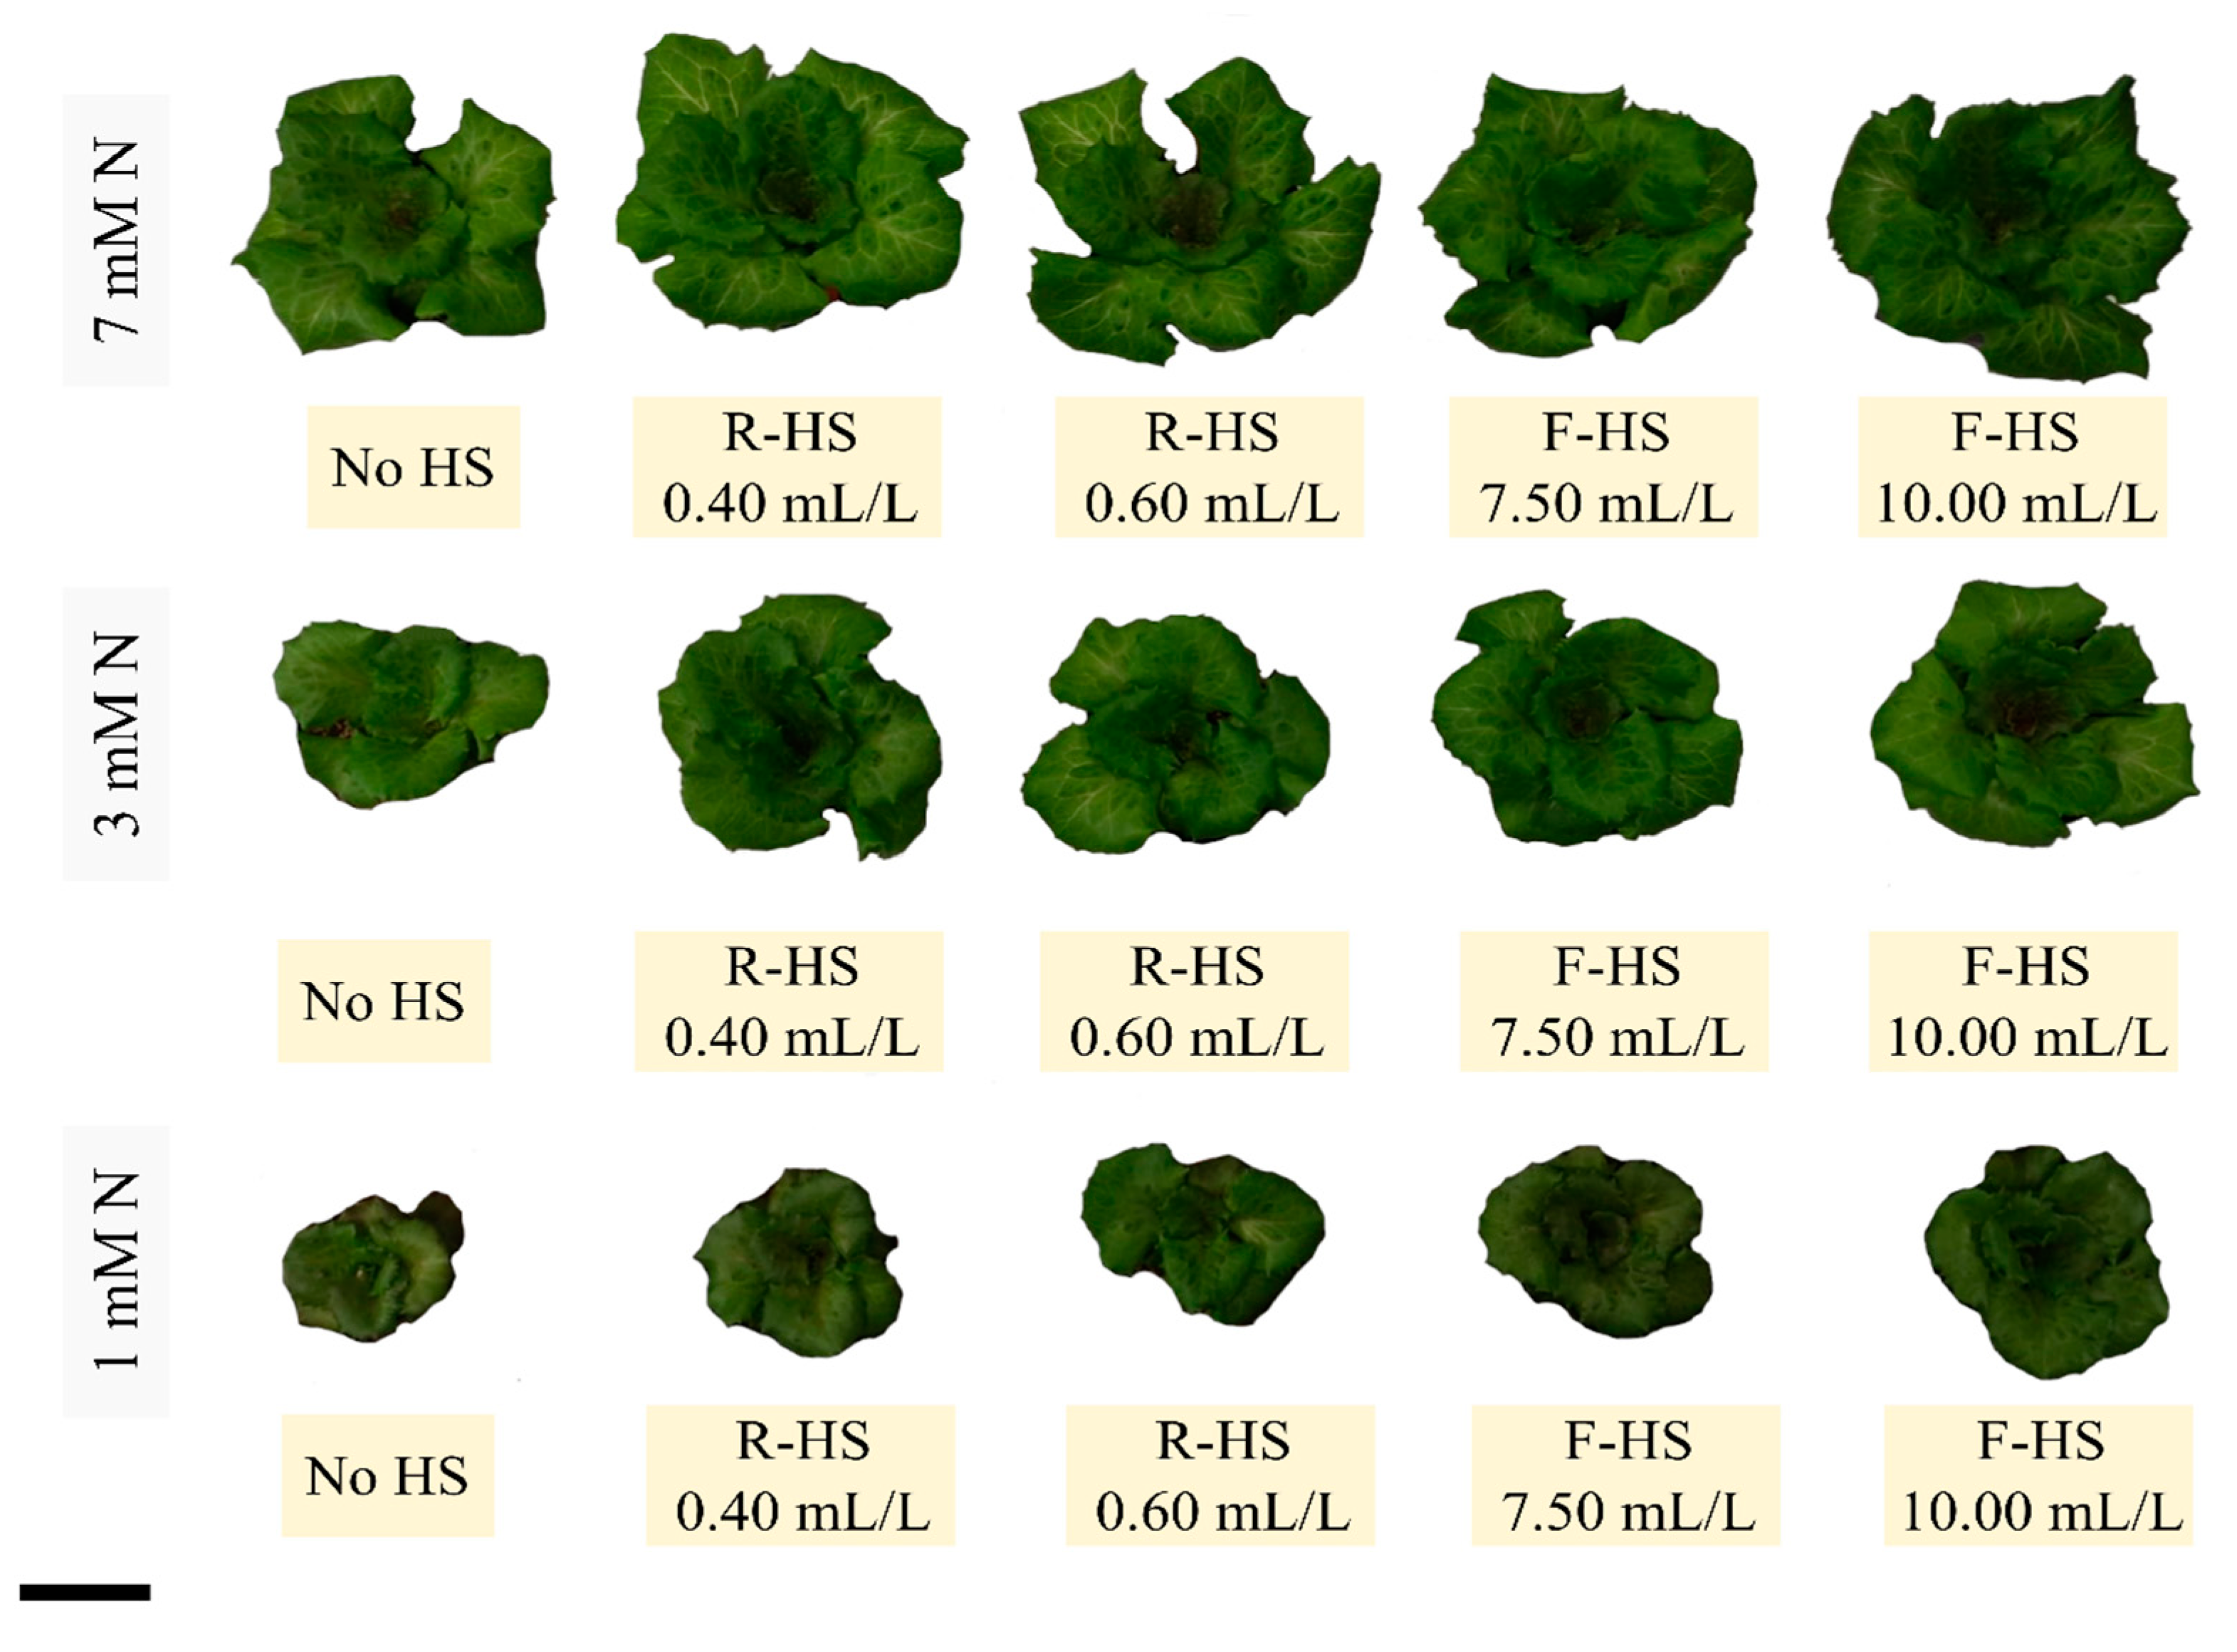
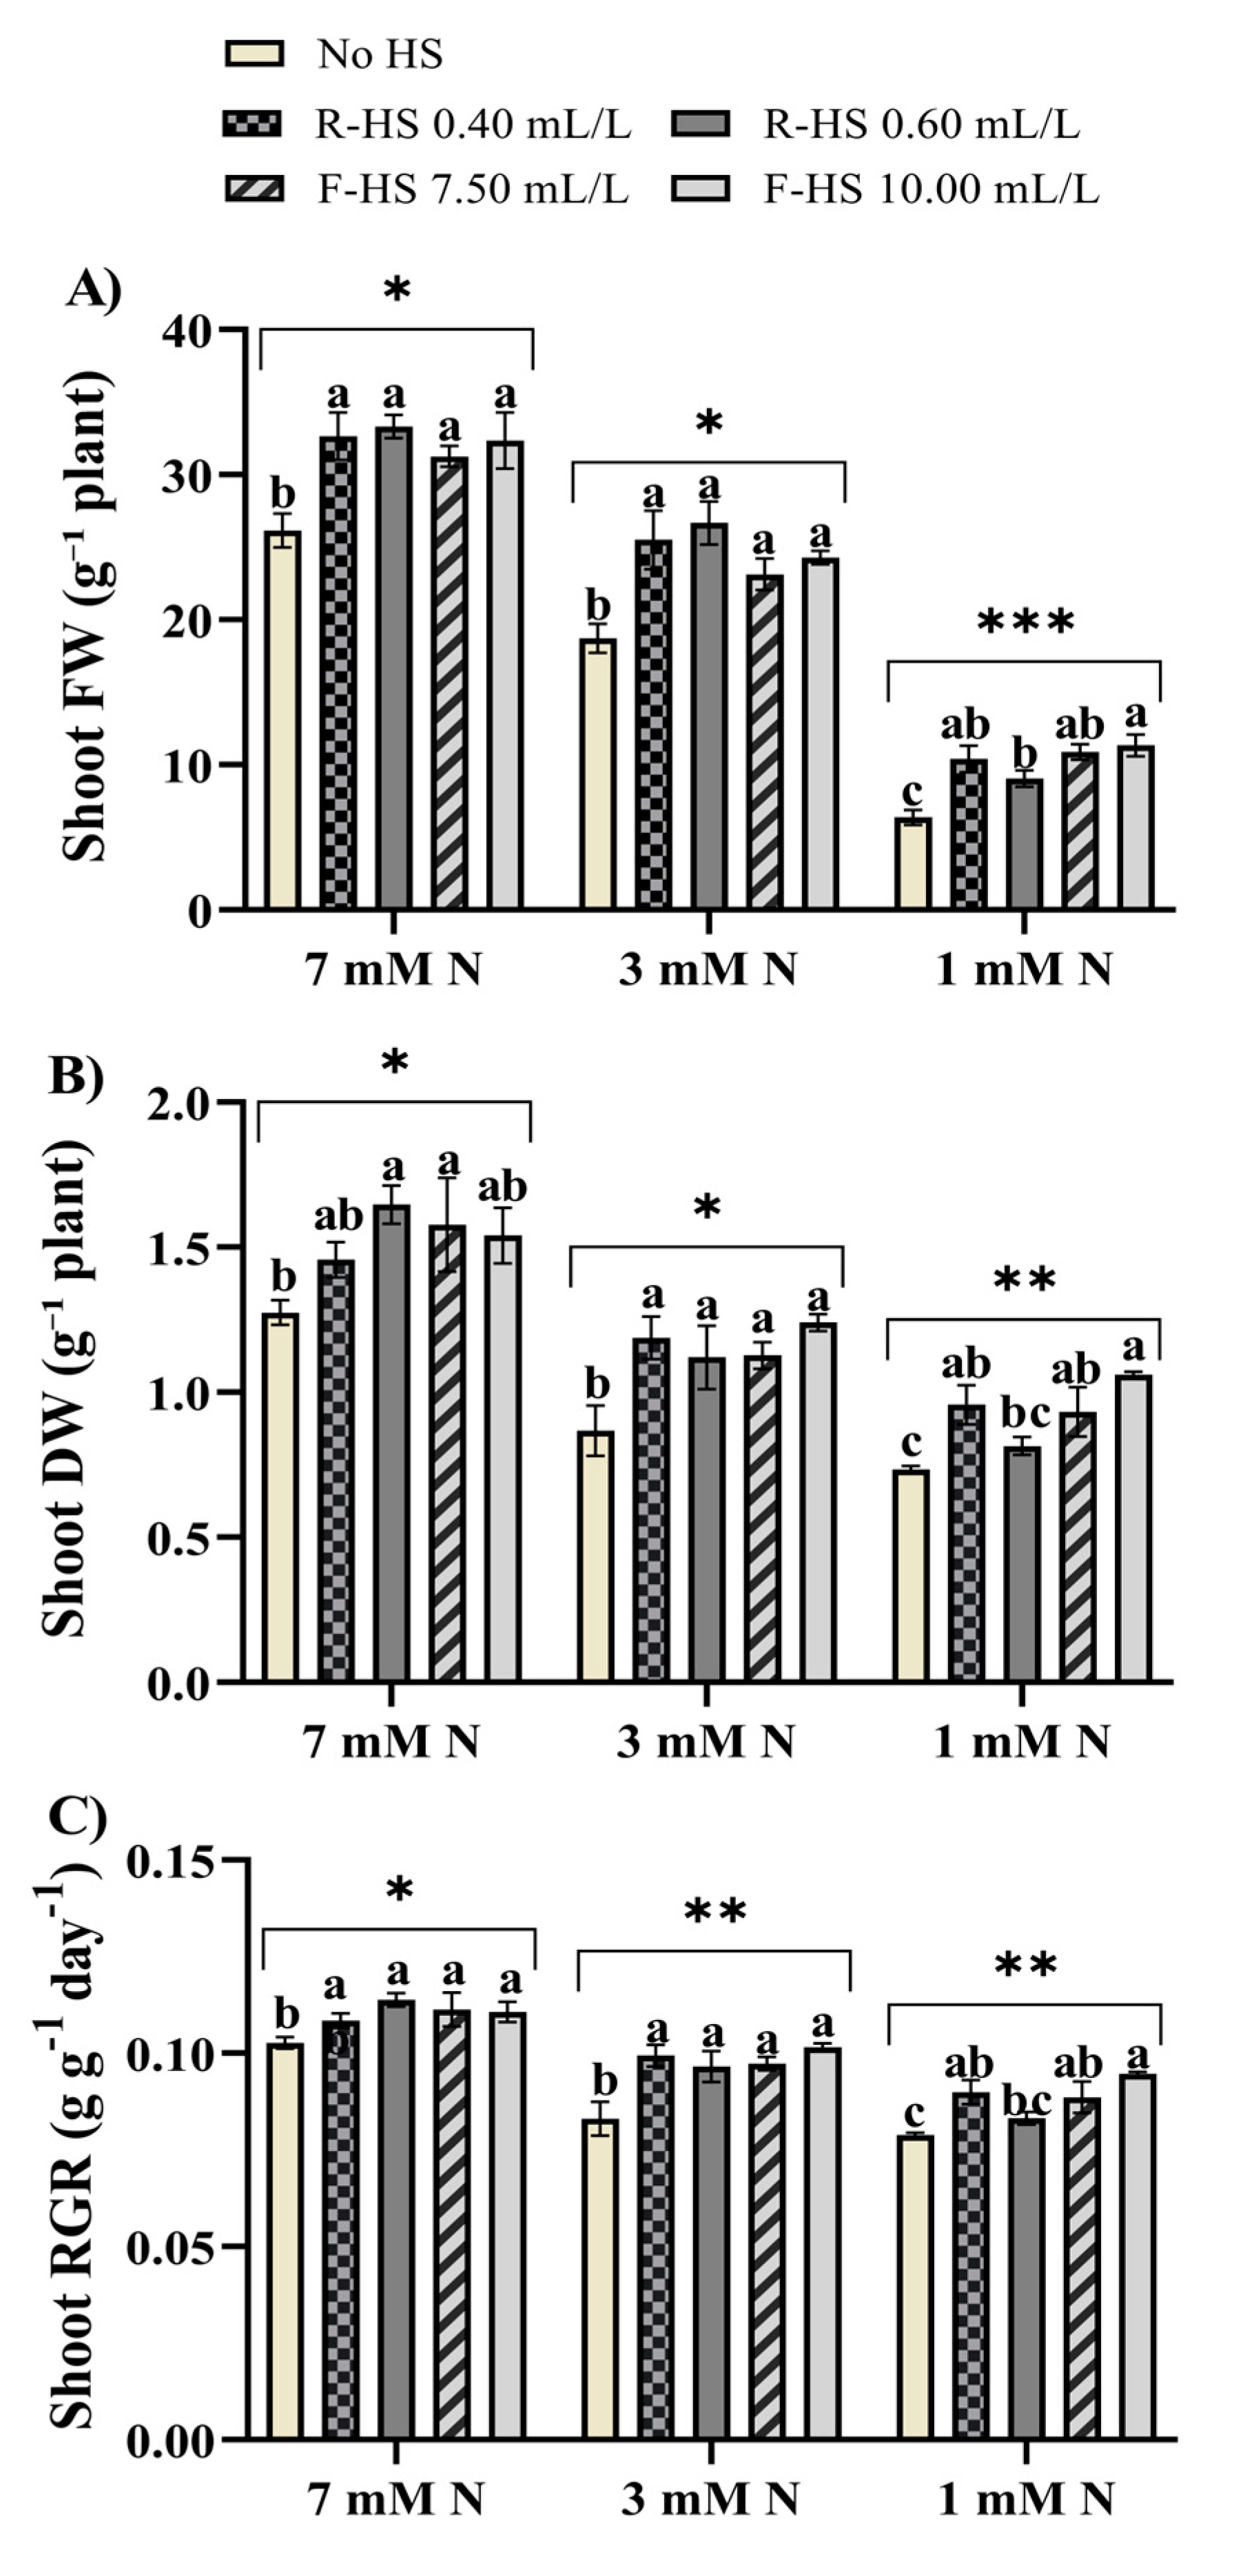
3.1. Lettuce Growth
3.2. Photosynthetic Pigments, Leaf Gas Exchange, and Chl a Fluorescence
3.3. Accumulation of Nitrogen Forms
3.4. Nitrogen Assimilation in Lettuce Plants
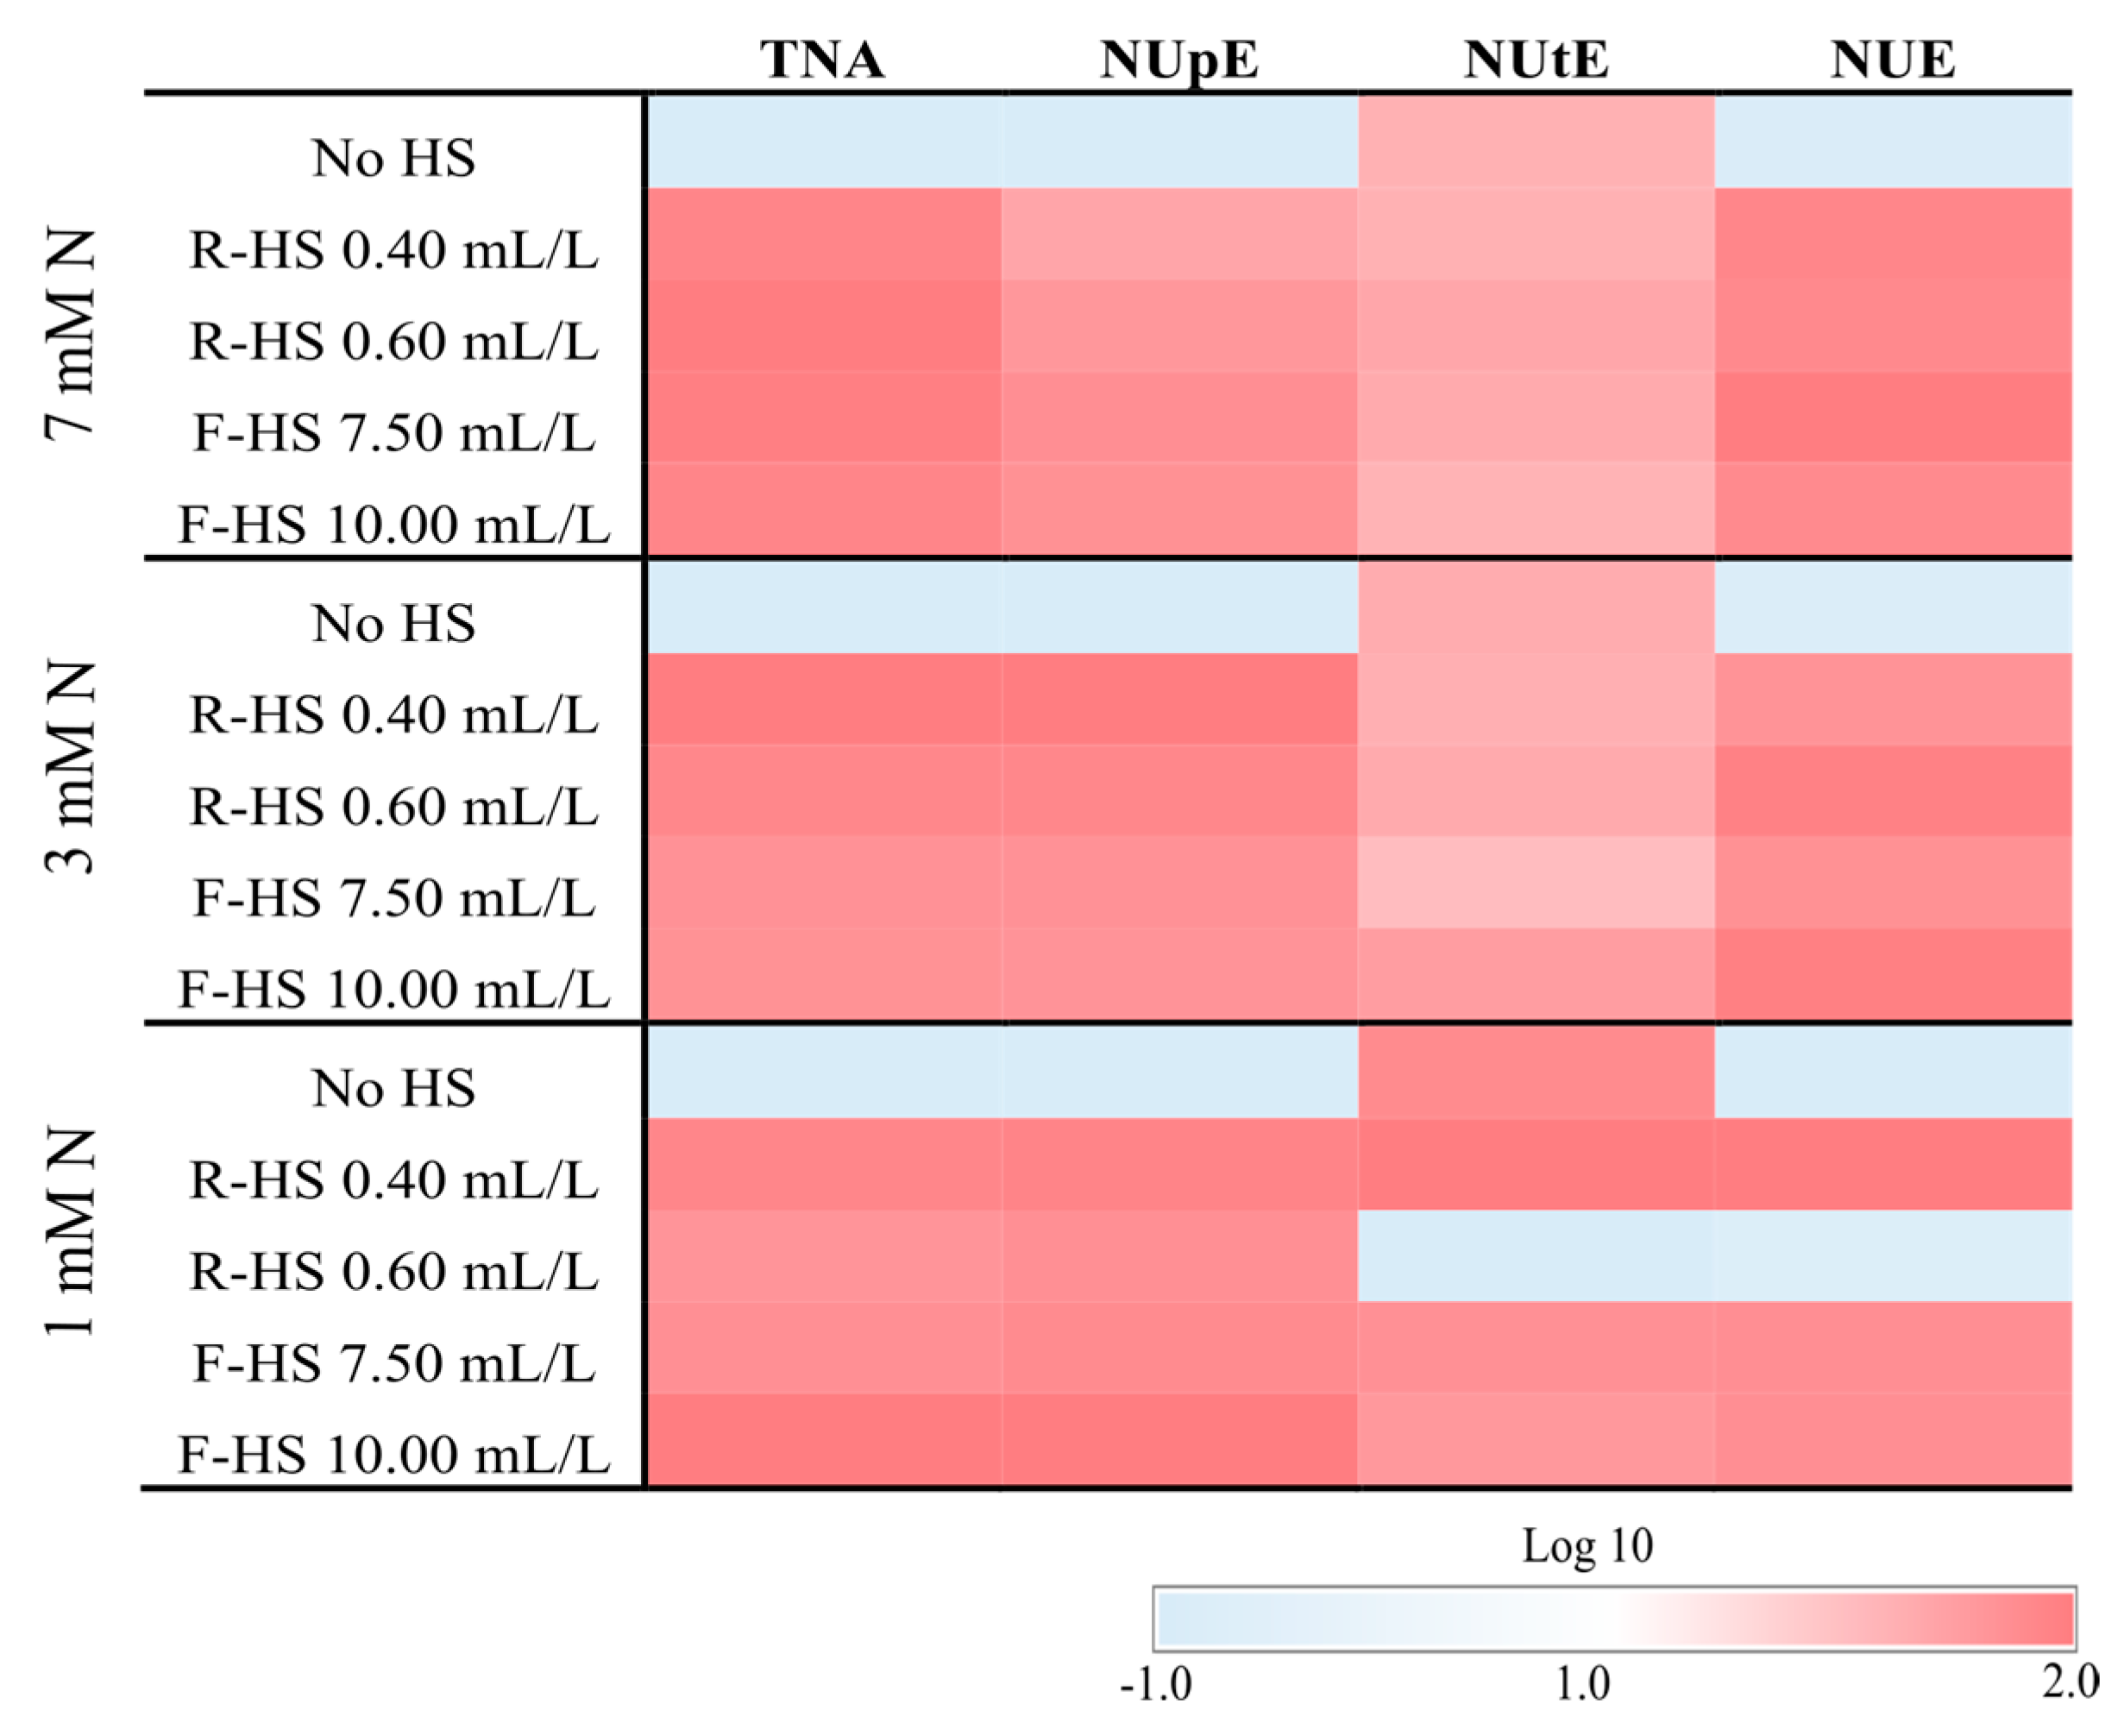
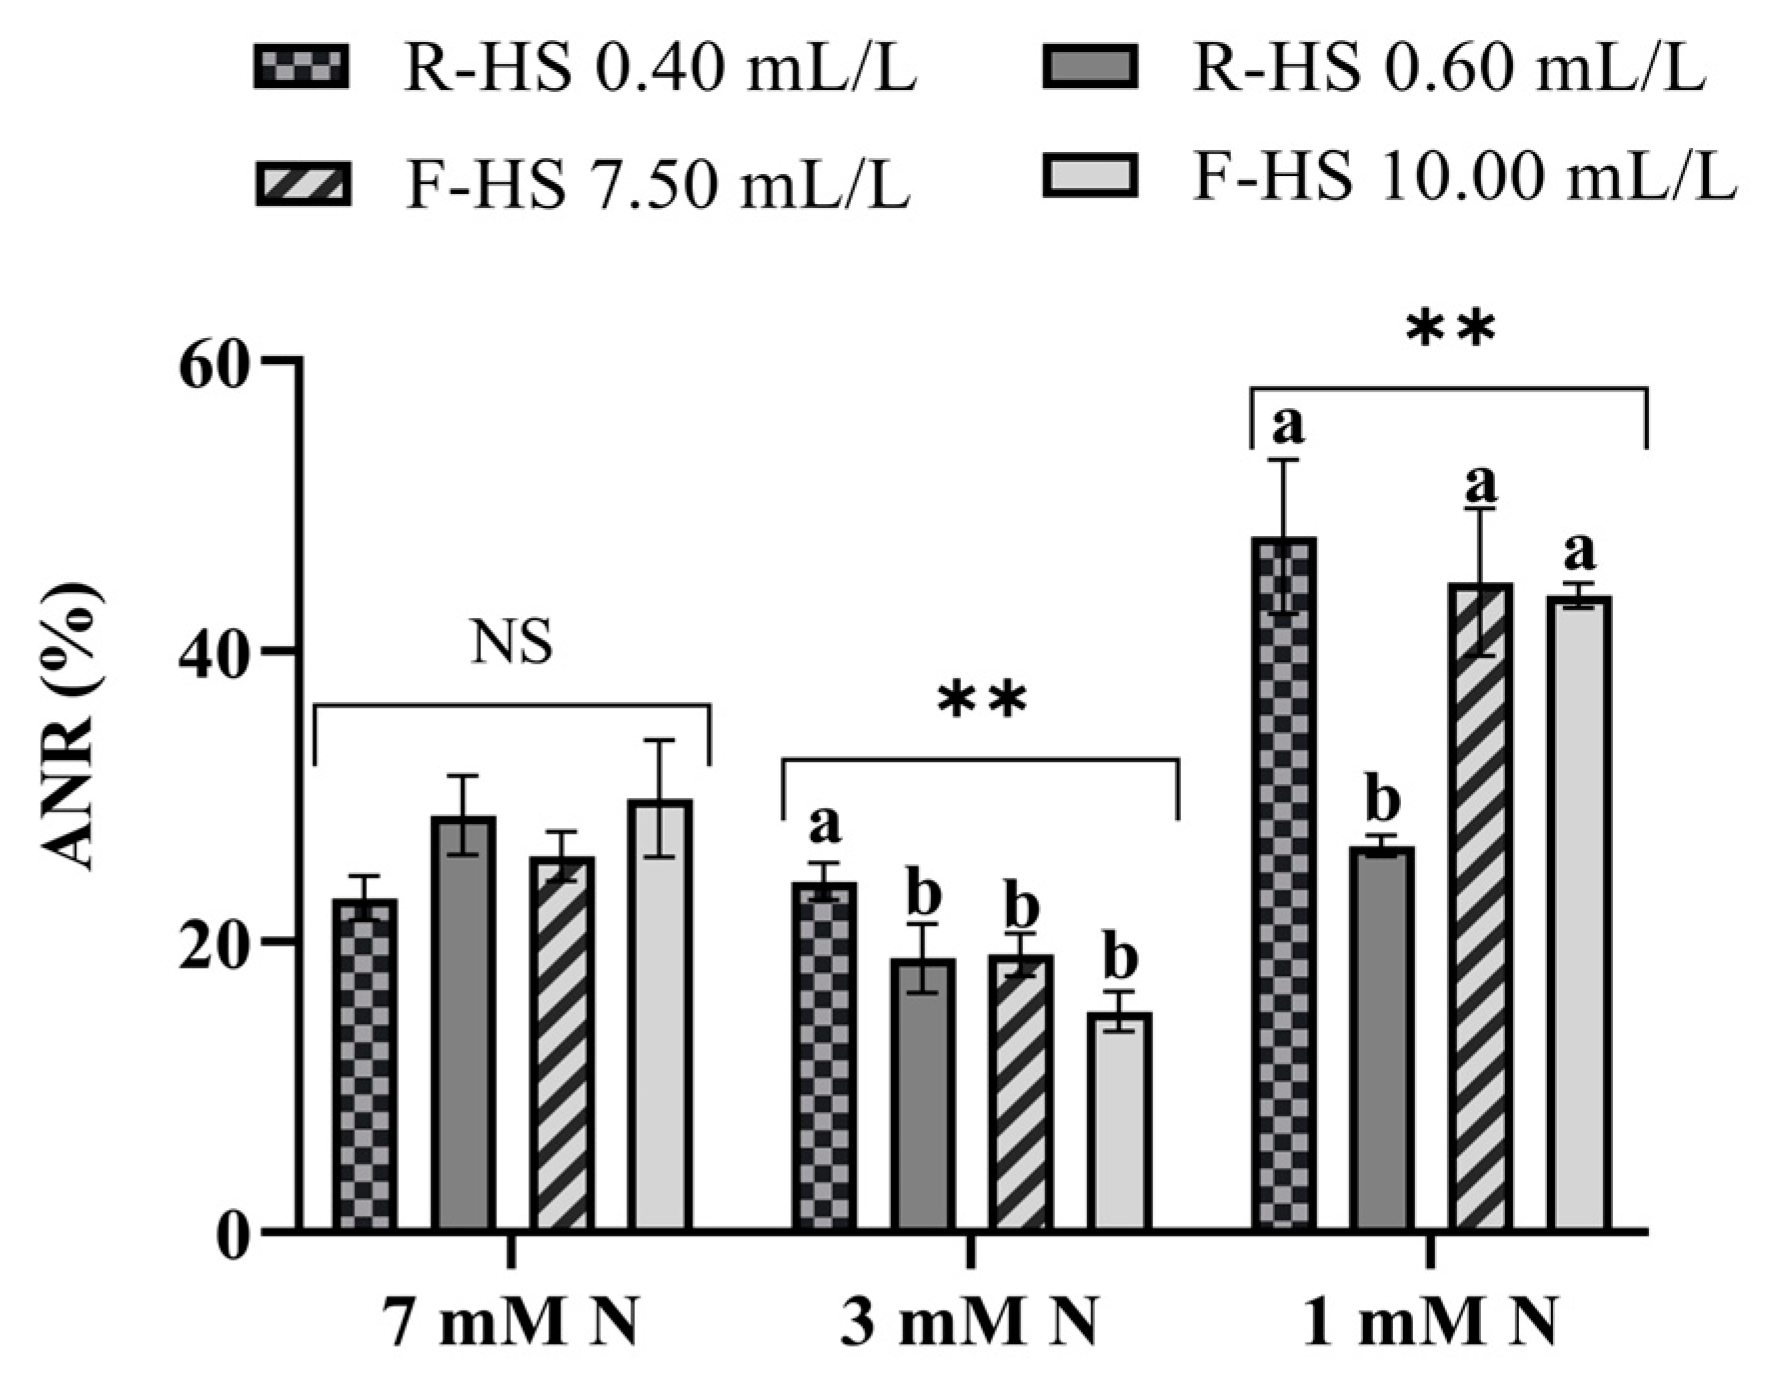
3.5. Nitrogen Use Efficiency
4. Discussion
5. Conclusions
Supplementary Materials
Author Contributions
Funding
Institutional Review Board Statement
Data Availability Statement
Acknowledgments
Conflicts of Interest
References
- Weber, K.; Burow, M. Nitrogen—Essential macronutrient and signal controlling flowering time. Physiol. Plant. 2018, 162, 251–260. [Google Scholar] [CrossRef] [PubMed]
- Navarro-León, E.; López-Moreno, F.J.; Borda, E.; Marín, C.; Sierras, N.; Blasco, B.; Ruiz, J.M. Effect of L-amino acid-based biostimulants on nitrogen use efficiency (NUE) in lettuce plants. J. Sci. Food Agric. 2022, 102, 7098–7106. [Google Scholar] [CrossRef]
- Zhao, B.; Jia, X.; Yu, N.; Murray, J.D.; Yi, K.; Wang, E. Microbe-dependent and independent nitrogen and phosphate acquisition and regulation in plants. New Phytol. 2024, 242, 1507–1522. [Google Scholar] [CrossRef]
- Yokamo, S.; Irfan, M.; Huan, W.; Wang, B.; Wang, Y.; Ishfaq, M.; Lu, D.; Chen, X.; Cai, Q.; Wang, H. Global evaluation of key factors influencing nitrogen fertilization efficiency in wheat: A recent meta-analysis (2000–2022). Front. Plant Sci. 2023, 14, 1272098. [Google Scholar] [CrossRef] [PubMed]
- Sun, J.; Li, W.; Li, C.; Chang, W.; Zhang, S.; Zeng, Y.; Zeng, C.; Peng, M. Effect of different rates of nitrogen fertilization on crop yield, soil properties and leaf physiological attributes in banana under subtropical regions of China. Front. Plant Sci. 2020, 11, 613760. [Google Scholar] [CrossRef] [PubMed]
- Navarro-Morillo, I.; Blasco, B.; Cámara-Zapata, J.M.; Muñoz-Acero, J.; Simón-Grao, S.; Alfosea-Simón, M.; Plasencia, F.; García-Sanchez, F. Corn steep liquor application on pepper plants (Capsicum annum L.) stimulates growth under nitrogen-deficient growing conditions. Sci. Hortic. 2024, 328, 112955. [Google Scholar] [CrossRef]
- Qiao, Y.; Yin, L.; Wang, B.; Ke, Q.; Deng, X.; Wang, S. Melatonin promotes plant growth by increasing nitrogen uptake and assimilation under nitrogen deficient condition in winter wheat. Plant Physiol. Biochem. 2019, 139, 342–349. [Google Scholar] [CrossRef]
- Tegeder, M.; Masclaux-Daubresse, C. Source and sink mechanisms of nitrogen transport and use. New Phytol. 2018, 217, 35–53. [Google Scholar] [CrossRef] [PubMed]
- Liu, Y.; Hu, B.; Chu, C. Toward improving nitrogen use efficiency in rice: Utilization, coordination, and availability. Curr. Opin. Plant Biol. 2023, 71, 102327. [Google Scholar] [CrossRef]
- Congreves, K.A.; Otchere, O.; Ferland, D.; Farzadfar, S.; Williams, S.; Arcand, M.M. Nitrogen use efficiency definitions of today and tomorrow. Front. Plant Sci. 2021, 12, 637108. [Google Scholar] [CrossRef]
- Chen, K.E.; Chen, H.Y.; Tseng, C.S.; Tsay, Y.F. Improving nitrogen use efficiency by manipulating nitrate remobilization in plants. Nat. Plants 2020, 6, 1126–1135. [Google Scholar] [CrossRef] [PubMed]
- European Union. Regulation (EU) 2019/1009 of the European Parliament and of the Council of 5 June 2019 Laying Down Rules on the Making Available on the Market of EU Fertilising Products and Amending Regulations (EC) No 1069/2009 and (EC) No 1107/2009 and repealing Regulation (EC) No 2003/2003. Off. J. Eur. Union 2019, 170, 1–114. [Google Scholar]
- Ruzzi, M.; Colla, G.; Rouphael, Y. Editorial: Biostimulants in agriculture II: Towards a sustainable future. Front. Plant Sci. 2024, 15, 1427283. [Google Scholar] [CrossRef] [PubMed]
- Ganugi, P.; Fiorini, A.; Ardenti, F.; Caffi, T.; Bonini, P.; Taskin, E.; Puglisi, E.; Tabaglio, V.; Trevisan, M.; Lucini, L. Nitrogen use efficiency, rhizosphere bacterial community, and root metabolome reprogramming due to maize seed treatment with microbial biostimulants. Physiol. Plant 2022, 174, 13679. [Google Scholar] [CrossRef]
- La Bella, S.; Consentino, B.B.; Rouphael, Y.; Ntatsi, G.; De Pasquale, C.; Iapichino, G.; Sabatino, L. Impact of Ecklonia maxima seaweed extract and Mo foliar treatments on biofortification, spinach yield, quality and NUE. Plants 2021, 10, 1139. [Google Scholar] [CrossRef] [PubMed]
- Canellas, L.P.; Olivares, F.L.; Aguiar, N.O.; Jones, D.L.; Nebbioso, A.; Mazzei, P.; Piccolo, A. Humic and fulvic acids as biostimulants in horticulture. Sci. Hortic. 2015, 196, 15–27. [Google Scholar] [CrossRef]
- Atero-Calvo, S.; Navarro-León, E.; Rios, J.J.; Blasco, B.; Ruiz, J.M. Humic substances-based products for plants growth and abiotic stress tolerance. In Biostimulants in Plant Protection and Performance; Elsevier: Amsterdam, The Netherlands, 2024; pp. 89–106. ISBN 9780443158841. [Google Scholar]
- Yang, F.; Tang, C.; Antonietti, M. Natural and artificial humic substances to manage minerals, ions, water, and soil microorganisms. Chem. Soc. Rev. 2021, 50, 6221–6239. [Google Scholar] [CrossRef]
- Nardi, S.; Schiavon, M.; Francioso, O. Chemical structure and biological activity of humic substances define their role as plant growth promoters. Molecules 2021, 26, 2256. [Google Scholar] [CrossRef] [PubMed]
- Jindo, K.; Olivares, F.L.; Malcher, D.J.D.P.; Sánchez-Monedero, M.A.; Kempenaar, C.; Canellas, L.P. From lab to field: Role of humic substances under open-field and greenhouse conditions as biostimulant and biocontrol agent. Front. Plant Sci. 2020, 11, 426. [Google Scholar] [CrossRef]
- Leite, J.M.; Pitumpe Arachchige, P.S.; Ciampitti, I.A.; Hettiarachchi, G.M.; Maurmann, L.; Trivelin, P.C.O.; Prasad, P.V.V.; Sunoj, S.V.J. Co-addition of humic substances and humic acids with urea enhances foliar nitrogen use efficiency in sugarcane (Saccharum officinarum L.). Heliyon 2020, 6, e05100. [Google Scholar] [CrossRef]
- Atero-Calvo, S.; Magro, F.; Masetti, G.; Navarro-León, E.; Rios, J.J.; Ruiz, J.M. Assaying the use of a leonardite-suspension concentrate-based product as a potential biostimulant to enhance growth, NPK use efficiency, and antioxidant capacity in Lactuca sativa L. Agronomy 2023, 14, 64. [Google Scholar] [CrossRef]
- Barone, V.; Bertoldo, G.; Magro, F.; Broccanello, C.; Puglisi, I.; Baglieri, A.; Cagnin, M.; Concheri, G.; Squartini, A.; Pizzeghello, D.; et al. Molecular and morphological changes induced by leonardite-based biostimulant in Beta vulgaris L. Plants 2019, 8, 181. [Google Scholar] [CrossRef]
- Wellburn, A.R. The spectral determination of chlorophylls a and b, as well as total carotenoids, using various solvents with spectrophotometers of different resolution. J. Plant Physiol. 1994, 144, 307–313. [Google Scholar] [CrossRef]
- Zhou, W.; Liu, W.; Yang, Q. Reducing nitrate content in lettuce by pre-harvest continuous light delivered by red and blue light-emitting diodes. J. Plant Nutr. 2013, 36, 481–490. [Google Scholar] [CrossRef]
- Krorn, M.D. The Analyst Spectrophotometric A Study of a Determination of Ammonia: Modified Berthelot Reaction Using Salicylate and Dichloroisocyanurate. Analyst 1980, 105, 305–316. [Google Scholar]
- Rubio-Wilhelmi, M.M.; Sanchez-Rodriguez, E.; Rosales, M.A.; Blasco, B.; Rios, J.J.; Romero, L.; Blumwald, E.; Ruiz, J.M. Ammonium formation and assimilation in PSARK-IPT tobacco transgenic plants under low N. J. Plant Physiol. 2012, 169, 157–162. [Google Scholar] [CrossRef] [PubMed]
- Kaiser, J.J.; Lewis, O.A.M. Nitrate reductase and glutamine synthetase activity in leaves and roots of nitrate-fed Helianthus annuus L. Plant Soil 1984, 77, 127–130. [Google Scholar] [CrossRef]
- Groat, R.G.; Vance, C.P. Root nodule enzymes of ammonia assimilation in alfalfa (Medicago sativa L.) developmental patterns and response to applied nitrogen. Plant Physiol. 1981, 67, 1198–1203. [Google Scholar] [CrossRef]
- Bradford, M.M. A rapid and sensitive method for the quantitation of microgram quantities of protein utilizing the principle of protein-dye binding. Anal. Biochem. 1976, 72, 248–254. [Google Scholar] [CrossRef]
- Sun, S.W.; Lin, Y.C.; Weng, Y.M.; Chen, M.J. Efficiency improvements on ninhydrin method for amino acid quantification. J. Food Comp. Anal. 2006, 19, 112–117. [Google Scholar] [CrossRef]
- Iqbal, A.; Dong, Q.; Wang, Z.; Wang, X.; Gui, H.; Zhang, H.; Pang, N.; Zhang, X.; Song, M. Growth and nitrogen metabolism are associated with nitrogen-use efficiency in cotton genotypes. Plant Physiol. Biochem. 2020, 149, 61–74. [Google Scholar] [CrossRef] [PubMed]
- Govindasamy, P.; Muthusamy, S.K.; Bagavathiannan, M.; Mowrer, J.; Jagannadham, P.T.K.; Maity, A.; Halli, H.M.; GK, S.; Vadivel, R.; TK, D.; et al. Nitrogen use efficiency—A key to enhance crop productivity under a changing climate. Front. Plant Sci. 2023, 14, 1121073. [Google Scholar] [CrossRef] [PubMed]
- Canellas, L.P.; da Silva, R.M.; Busato, J.G.; Olivares, F.L. Humic substances and plant abiotic stress adaptation. Chem. Biol. Technol. Agric. 2024, 11, 66. [Google Scholar] [CrossRef]
- Francis, B.; Aravindakumar, C.T.; Brewer, P.B.; Simon, S. Plant nutrient stress adaptation: A prospect for fertilizer limited agriculture. Environ. Exp. Bot. 2023, 213, 105431. [Google Scholar] [CrossRef]
- Peng, Y.; Lou, H.; Tan, Z.; Ouyang, Z.; Zhang, Y.; Lu, S.; Guo, L.; Yang, B. Lipidomic and metabolomic analyses reveal changes of lipid and metabolite profiles in rapeseed during nitrogen deficiency. Plant Cell Physiol. 2023, 65, 904–915. [Google Scholar] [CrossRef]
- Qin, K.; Dong, X.; Leskovar, D.I. Improving tomato nitrogen use efficiency with lignite-derived humic substances. Sci. Hortic. 2023, 321, 112243. [Google Scholar] [CrossRef]
- Mu, X.; Chen, Y. The physiological response of photosynthesis to nitrogen deficiency. Plant Physiol. Biochem. 2021, 158, 76–82. [Google Scholar] [CrossRef]
- Franzoni, G.; Cocetta, G.; Ferrante, A. Effect of glutamic acid foliar applications on lettuce under water stress. Physiol. Mol. Biol. Plants 2021, 27, 1059–1072. [Google Scholar] [CrossRef]
- Wang, N.; Fu, F.; Wang, H.; Wang, P.; He, S.; Shao, H.; Ni, Z.; Zhang, X. Effects of irrigation and nitrogen on chlorophyll content, dry matter and nitrogen accumulation in sugar beet (Beta vulgaris L.). Sci. Rep. 2021, 11, 16651. [Google Scholar] [CrossRef]
- Luo, J.; Zhou, J.J.; Masclaux-Daubresse, C.; Wang, N.; Wang, H.; Zheng, B. Morphological and physiological responses to contrasting nitrogen regimes in Populus cathayana is linked to resources allocation and carbon/nitrogen partition. Environ. Exp. Bot. 2019, 162, 247–255. [Google Scholar] [CrossRef]
- Vaccaro, S.; Ertani, A.; Nebbioso, A.; Muscolo, A.; Quaggiotti, S.; Piccolo, A.; Nardi, S. Humic substances stimulate maize nitrogen assimilation and amino acid metabolism at physiological and molecular level. Chem. Biol. Technol. Agric. 2015, 2, 5. [Google Scholar] [CrossRef]
- de Castro, T.A.V.T.; Berbara, R.L.L.; Tavares, O.C.H.; da Graca Mello, D.F.; Pereira, E.G.; de Souza, C.D.C.B.; Espinosa, L.M.; García, A.C. Humic acids induce a eustress state via photosynthesis and nitrogen metabolism leading to a root growth improvement in rice plants. Plant Physiol. Biochem. 2021, 162, 171–184. [Google Scholar] [CrossRef]
- Turan, M.; Ekinci, M.; Kul, R.; Kocaman, A.; Argin, S.; Zhirkova, A.M.; Perminova, I.V.; Yildirim, E. Foliar applications of humic substances together with fe/nano fe to increase the iron content and growth parameters of spinach (Spinacia oleracea L.). Agronomy 2022, 12, 2044. [Google Scholar] [CrossRef]
- Nikoogoftar-Sedghi, M.; Rabiei, V.; Razavi, F.; Molaei, S.; Khadivi, A. Fulvic acid foliar application: A novel approach enhancing antioxidant capacity and nutritional quality of pistachio (Pistacia vera L.). BMC Plant Biol. 2024, 24, 241. [Google Scholar] [CrossRef]
- Chen, Q.; Qu, Z.; Ma, G.; Wang, W.; Dai, J.; Zhang, M.; Wei, Z.; Liu, Z. Humic acid modulates growth, photosyn- thesis, hormone and osmolytes system of maize under drought conditions. Agric. Water Manag. 2022, 263, 107447. [Google Scholar] [CrossRef]
- Halpern, M.; Bar-Tal, A.; Lugassi, N.; Egbaria, A.; Granot, D.; Yermiyahu, U. The role of nitrogen in photosynthetic acclimation to elevated [CO2] in tomatoes. Plant Soil 2019, 434, 397–411. [Google Scholar] [CrossRef]
- Shao, C.H.; Qiu, C.F.; Qian, Y.F.; Liu, G.R. Nitrate deficiency decreased photosynthesis and oxidation-reduction processes, but increased cellular transport, lignin biosynthesis and flavonoid metabolism revealed by RNA-Seq in Oryza sativa leaves. PLoS ONE 2020, 15, e0235975. [Google Scholar] [CrossRef] [PubMed]
- Gong, X.; Li, J.; Ma, H.; Chen, G.; Dang, K.; Yang, P.; Wang, M.; Feng, B. Nitrogen deficiency induced a decrease in grain yield related to photosynthetic characteristics, carbon–nitrogen balance and nitrogen use efficiency in proso millet (Panicum miliaceum L.). Arch. Agron. Soil. Sci. 2020, 66, 398–413. [Google Scholar] [CrossRef]
- Wu, A.; Hammer, G.L.; Doherty, A.; von Caemmerer, S.; Farquhar, G.D. quantifying impacts of enhancing photosynthesis on crop yield. Nat. Plants 2019, 5, 380–388. [Google Scholar] [CrossRef]
- Zhang, L.X.; Lai, J.H.; Gao, M.; Ashraf, M. Exogenous glycinebetaine and humic acid improve growth, nitrogen status, photosynthesis, and antioxidant defense system and confer tolerance to nitrogen stress in maize seedlings. J. Plant Interact. 2014, 9, 159–166. [Google Scholar] [CrossRef]
- Lucas, M.; Diaz-Espejo, A.; Romero-Jimenez, D.; Peinado-Torrubia, P.; Delgado-Vaquero, A.; Álvarez, R.; Colmenero-Flores, J.M.; Rosales, M.A. Chloride reduces plant nitrate requirement and alleviates low nitrogen stress symptoms. Plant Physiol. Biochem. 2024, 212, 108717. [Google Scholar] [CrossRef] [PubMed]
- Vadez, V.; Pilloni, R.; Grondin, A.; Hajjarpoor, A.; Belhouchette, H.; Brouziyne, Y.; Chehbouni, G.; Kharrou, M.H.; Zitouna-Chebbi, R.; Mekki, I.; et al. Water use efficiency across scales: From genes to landscapes. J. Exp. Bot. 2023, 74, 4770–4788. [Google Scholar] [CrossRef] [PubMed]
- Rubio-Wilhelmi, M.M.; Sanchez-Rodriguez, E.; Rosales, M.A.; Begoña, B.; Rios, J.J.; Romero, L.; Blumwald, E.; Ruiz, J.M. Effect of cytokinins on oxidative stress in tobacco plants under nitrogen deficiency. Environ. Exp. Bot. 2011, 72, 167–173. [Google Scholar] [CrossRef]
- Mora, V.; Bacaicoa, E.; Zamarreño, A.M.; Aguirre, E.; Garnica, M.; Fuentes, M.; García-Mina, J.M. Action of humic acid on promotion of cucumber shoot growth involves nitrate-related changes associated with the root-to-shoot distribution of cytokinins, polyamines and mineral nutrients. J. Plant Physiol. 2010, 167, 633–642. [Google Scholar] [CrossRef]
- Vujinović, T.; Zanin, L.; Venuti, S.; Contin, M.; Ceccon, P.; Tomasi, N.; Pinton, R.; Cesco, S.; De Nobili, M. Biostimulant action of dissolved humic substances from a conventionally and an organically managed soil on nitrate acquisition in maize plants. Front. Plant Sci. 2020, 10, 01652. [Google Scholar] [CrossRef]
- de Azevedo, I.G.; Olivares, F.L.; Ramos, A.C.; Bertolazi, A.A.; Canellas, L.P. Humic acids and Herbaspirillum seropedicae change the extracellular H+ flux and gene expression in maize roots seedlings. Chem. Biol. Technol. Agric. 2019, 6, 8. [Google Scholar] [CrossRef]
- Zanin, L.; Tomasi, N.; Zamboni, A.; Sega, D.; Varanini, Z.; Pinton, R. Water-extractable humic substances speed up transcriptional response of maize roots to nitrate. Environ. Exp. Bot. 2018, 147, 167–178. [Google Scholar] [CrossRef]
- Jannin, L.; Arkoun, M.; Ourry, A.; Laîné, P.; Goux, D.; Garnica, M.; Fuentes, M.; Francisco, S.S.; Baigorri, R.; Cruz, F.; et al. Microarray analysis of humic acid effects on Brassica napus growth: Involvement of n, c and s metabolisms. Plant Soil 2012, 359, 297–319. [Google Scholar] [CrossRef]
- Tang, D.; Jiao, Z.; Zhang, Q.; Liu, M.Y.; Ruan, J. Glutamate dehydrogenase isogenes CsGDHs cooperate with glutamine synthetase isogenes CsGSs to assimilate ammonium in tea plant (Camellia sinensis L.). Plant Sci 2021, 312, 111031. [Google Scholar] [CrossRef] [PubMed]
- Lei, K.; Hu, H.; Chang, M.; Sun, C.; Ullah, A.; Yu, J.; Dong, C.; Gao, Q.; Jiang, D.; Cao, W.; et al. A low red/far-red ratio restricts nitrogen assimilation by inhibiting nitrate reductase associated with downregulated TaNR1.2 and upregulated TaPIL5 in wheat (Triticum aestivum L.). Plant Physiol. Biochem. 2024, 206, 107850. [Google Scholar] [CrossRef]
- Hernandez, O.L.; Calderín, A.; Huelva, R.; Martínez-Balmori, D.; Guridi, F.; Aguiar, N.O.; Olivares, F.L.; Canellas, L.P. Humic substances from vermicompost enhance urban lettuce production. Agron. Sustain. Dev. 2015, 35, 225–232. [Google Scholar] [CrossRef]
- Ertani, A.; Francioso, O.; Tugnoli, V.; Righi, V.; Nardi, S. Effect of commercial lignosulfonate-humate on Zea mays L. metabolism. J. Agric. Food Chem. 2011, 59, 11940–11948. [Google Scholar] [CrossRef] [PubMed]
- Canellas, L.P.; Balmori, D.M.; Médici, L.O.; Aguiar, N.O.; Campostrini, E.; Rosa, R.C.C.; Façanha, A.R.; Olivares, F.L. A Combination of humic substances and Herbaspirillum seropedicae inoculation enhances the growth of maize (Zea mays L.). Plant Soil 2013, 366, 119–132. [Google Scholar] [CrossRef]
- Sieling, K.; Kage, H. Apparent fertilizer n recovery and the relationship between grain yield and grain protein concentration of different winter wheat varieties in a long-term field trial. Eur. J. Agron. 2021, 124, 126246. [Google Scholar] [CrossRef]
- Guo, Y.; Ma, Z.; Ren, B.; Zhao, B.; Liu, P.; Zhang, J. Effects of humic acid added to controlled-release fertilizer on summer maize yield, nitrogen use efficiency and greenhouse gas emission. Agriculture 2022, 12, 448. [Google Scholar] [CrossRef]


| Chl a (mg g−1 FW) | Chl b (mg g−1 FW) | Total Chls (mg g−1 FW) | Carotenoids (µg g−1 FW) | ||
|---|---|---|---|---|---|
| 7 mM N | No HS | 0.172 ± 0.002 d | 0.111 ± 0.001c | 0.283 ± 0.004 d | 20.24 ± 0.29 d |
| R-HS 0.40 mL/L | 0.216 ± 0.006 b | 0.123 ± 0.002 b | 0.334 ± 0.008 b | 24.44 ± 0.47 b | |
| R-HS 0.60 mL/L | 0.248 ± 0.006 a | 0.131 ± 0.002 a | 0.379 ± 0.008 a | 27.08 ± 0.51 a | |
| F-HS 7.50 mL/L | 0.202 ± 0.004 c | 0.115 ± 0.001 c | 0.318 ± 0.004 c | 23.02 ± 0.35 c | |
| F-HS 10.00 mL/L | 0.200 ± 0.001 c | 0.113 ± 0.001 c | 0.313 ± 0.001 c | 22.58 ± 0.21 c | |
| p-value | *** | *** | *** | *** | |
| LSD0.05 | 0.012 | 0.004 | 0.015 | 1.09 | |
| 3 mM N | No HS | 0.180 ± 0.002 d | 0.113 ± 0.001 c | 0.291 ± 0.002 d | 21.59 ± 0.30 c |
| R-HS 0.40 mL/L | 0.222 ± 0.004 ab | 0.139 ± 0.002 a | 0.360 ± 0.006 a | 25.00 ± 0.40 a | |
| R-HS 0.60 mL/L | 0.208 ±0.002 c | 0.126 ± 0.001 b | 0.334 ± 0.003 c | 23.77 ± 0.16 b | |
| F-HS 7.50 mL/L | 0.215 ± 0.001 bc | 0.129 ± 0.001 b | 0.344 ± 0.001 c | 24.04 ± 0.10 b | |
| F-HS 10.00 mL/L | 0.229 ± 0.005 a | 0.135 ± 0.003 a | 0.364 ± 0.007 b | 25.47 ± 0.45 a | |
| p-value | *** | *** | *** | *** | |
| LSD0.05 | 0.009 | 0.005 | 0.013 | 0.89 | |
| 1 mM N | No HS | 0.159 ± 0.002 c | 0.105 ± 0.002 d | 0.261 ± 0.003 d | 19.07 ± 0.21 d |
| R-HS 0.40 mL/L | 0.219 ± 0.012 ab | 0.128 ± 0.006 bc | 0.324 ± 0.009 c | 22.49 ± 0.25 c | |
| R-HS 0.60 mL/L | 0.202 ± 0.004 b | 0.126 ± 0.002 c | 0.329 ± 0.006 c | 23.15 ± 0.36 c | |
| F-HS 7.50 mL/L | 0.212 ± 0.004 ab | 0.136 ± 0.002 ab | 0.348 ± 0.005 b | 24.54 ± 0.34 b | |
| F-HS 10.00 mL/L | 0.230 ± 0.005 a | 0.139 ± 0.002 a | 0.369 ± 0.006 a | 25.57 ± 0.37 a | |
| p-value | *** | *** | *** | *** | |
| LSD0.05 | 0.018 | 0.009 | 0.002 | 0.90 |
| A | E | Ci | WUE | RC/ABS | PIABS | ||
|---|---|---|---|---|---|---|---|
| 7 mM N | No HS | 7.03 ± 0.45 b | 2.63 ± 0.01 | 273.5 ± 4.3 b | 2.53 ± 0.10 c | 0.308 ± 0.001 b | 1.96 ± 0.05 |
| R-HS 0.40 mL/L | 8.36 ± 0.14 a | 2.94 ± 0.14 | 301.4 ± 5.4 a | 2.88 ± 0.18 bc | 0.334 ± 0.004 a | 2.00 ± 0.04 | |
| R-HS 0.60 mL/L | 9.27 ± 0.47 a | 2.79 ± 0.24 | 292.1 ± 0.5 a | 3.38 ± 0.15 a | 0.309 ± 0.003 b | 1.96 ± 0.04 | |
| F-HS 7.50 mL/L | 8.53 ± 0.22 a | 2.80 ± 0.20 | 292.0 ± 5.4 a | 3.11 ± 0.17 ab | 0.305 ± 0.003 b | 1.91 ± 0.06 | |
| F-HS 10.00 mL/L | 8.55 ± 0.52 a | 3.12 ± 0.49 | 297.4 ± 8.2 a | 3.33 ± 0.07 a | 0.314 ± 0.005 b | 1.98 ± 0.05 | |
| p-value | ** | NS | * | * | *** | NS | |
| LSD0.05 | 1.14 | 0.78 | 15.6 | 0.40 | 0.010 | 0.14 | |
| 3 mM N | No HS | 5.59 ± 0.12 b | 2.53 ± 0.08 b | 320.3 ± 2.7 a | 2.25 ± 0.05 b | 0.297 ± 0.001 c | 1.78 ± 0.04 |
| R-HS 0.40 mL/L | 7.55 ± 0.50 a | 3.24 ± 0.48 a | 309.8 ± 9.1 ab | 2.79 ± 0.24 a | 0.311 ± 0.006 ab | 1.86 ± 0.03 | |
| R-HS 0.60 mL/L | 7.59 ± 0.27 a | 2.94 ± 0.14 ab | 308.8 ± 1.1 ab | 2.59 ± 0.03 ab | 0.305 ± 0.003 bc | 1.82 ± 0.02 | |
| F-HS 7.50 mL/L | 7.45 ± 0.39 a | 2.62 ± 0.13 ab | 298.6 ± 1.2 b | 2.85 ± 0.08 a | 0.303 ± 0.005 bc | 1.82 ± 0.05 | |
| F-HS 10.00 mL/L | 7.22 ± 0.18 a | 2.86 ± 0.09 ab | 310.9 ± 0.5 ab | 2.53 ± 0.03 ab | 0.323 ± 0.006 a | 1.78 ± 0.08 | |
| p-value | ** | * | * | ** | ** | NS | |
| LSD0.05 | 0.94 | 0.69 | 12.6 | 0.34 | 0.013 | 0.14 | |
| 1 mM N | No HS | 2.69 ± 0.49 c | 1.71 ± 0.30 ab | 335.7 ± 1.2 a | 1.55 ± 0.03 c | 0.293 ± 0.002 c | 1.53 ± 0.03 b |
| R-HS 0.40 mL/L | 5.06 ± 0.41 ab | 2.07 ± 0.25 a | 307.6 ± 5.2 bc | 2.51 ± 0.14 b | 0.312 ± 0.005 b | 1.74 ± 0.04 a | |
| R-HS 0.60 mL/L | 5.74 ± 0.28 a | 1.91 ± 0.13 ab | 290.6 ± 3.1 d | 3.02 ± 0.09 a | 0.310 ± 0.003 b | 1.86 ± 0.06 a | |
| F-HS 7.50 mL/L | 4.38 ± 0.06 b | 1.43 ± 0.14 b | 300.8 ± 2.5 c | 2.66 ± 0.04 b | 0.318 ± 0.003 ab | 1.84 ± 0.05 a | |
| F-HS 10.00 mL/L | 4.31 ± 0.01 b | 1.71 ± 0.08 ab | 311.1 ± 3.2 b | 2.54 ± 0.12 b | 0.329 ± 0.009 a | 1.79 ± 0.04 a | |
| p-value | *** | * | *** | *** | *** | *** | |
| LSD0.05 | 0.92 | 0.57 | 9.6 | 0.27 | 0.014 | 0.14 |
| NR | GS | GDH | Soluble AAs | Soluble Proteins | ||
|---|---|---|---|---|---|---|
| 7 mM N | No HS | 102.8 ± 4.6 | 1.20 ± 0.02 bc | 1.16 ± 0.20 | 0.43 ± 0.02 b | 8.20 ± 0.53 |
| R-HS 0.40 mL/L | 111.1 ± 10.7 | 1.15 ± 0.02 c | 1.23 ± 0.12 | 0.44 ± 0.02 b | 7.61 ± 0.58 | |
| R-HS 0.60 mL/L | 115.3 ± 10.0 | 1.19 ± 0.02 bc | 1.32 ± 0.16 | 0.48 ± 0.03 ab | 8.08 ± 0.50 | |
| F-HS 7.50 mL/L | 111.7 ± 7.6 | 1.21 ± 0.02 b | 1.34 ± 0.20 | 0.44 ± 0.01 b | 8.11 ± 0.14 | |
| F-HS 10.00 mL/L | 119.6 ± 5.6 | 1.33 ± 0.02 a | 1.43 ± 0.22 | 0.52 ± 0.01 a | 8.99 ±0.42 | |
| p-value | NS | *** | NS | * | NS | |
| LSD0.05 | 23.0 | 0.06 | 0.53 | 0.07 | 1.42 | |
| 3 mM N | No HS | 83.4 ± 2.5 b | 0.97 ± 0.03 b | 0.51 ± 0.06 b | 0.40 ± 0.02 b | 5.71 ± 0.22 b |
| R-HS 0.40 mL/L | 120.2 ± 5.2 a | 1.14 ± 0.03 a | 1.63 ± 0.30 a | 0.52 ± 0.01 a | 6.71 ± 0.17 a | |
| R-HS 0.60 mL/L | 127.3 ± 14.4 a | 1.23 ± 0.07 a | 1.52 ± 0.06 a | 0.53 ± 0.02 a | 7.08 ± 0.22 a | |
| F-HS 7.50 mL/L | 121.5 ± 6.6 a | 1.13 ± 0.06 a | 1.37 ± 0.17 a | 0.53 ± 0.04 a | 6.72 ± 0.35 a | |
| F-HS 10.00 mL/L | 126.7 ± 16.0 a | 1.23 ± 0.07 a | 1.21 ± 0.05 a | 0.50 ± 0.01 a | 6.75 ± 0.41 a | |
| p-value | * | ** | *** | *** | * | |
| LSD0.05 | 29.7 | 0.16 | 0.46 | 0.01 | 0.82 | |
| 1 mM N | No HS | 113.2 ± 1.8 b | 4.66 ± 0.04 b | 0.60 ± 0.06 b | 0.31 ± 0.03 b | 2.12 ± 0.16 b |
| R-HS 0.40 mL/L | 149.3 ± 1.8 a | 5.78 ± 0.38 a | 0.83 ± 0.07 a | 0.44 ± 0.02 a | 4.68 ± 0.15 a | |
| R-HS 0.60 mL/L | 142.4 ± 6.3 a | 5.31 ± 0.36 ab | 0.92 ± 0.09 a | 0.49 ± 0.04 a | 4.87 ± 0.16 a | |
| F-HS 7.50 mL/L | 152.7 ± 9.7 a | 5.58 ± 0.14 a | 1.01 ± 0.08 a | 0.43 ± 0.03 a | 4.55 ± 0.18 a | |
| F-HS 10.00 mL/L | 147.8 ± 13.1 a | 5.30 ± 0.38 ab | 0.99 ± 0.07 a | 0.43 ± 0.02 a | 4.28 ± 0.25 a | |
| p-value | * | * | ** | *** | *** | |
| LSD0.05 | 26.4 | 0.85 | 0.22 | 0.08 | 0.63 |
Disclaimer/Publisher’s Note: The statements, opinions and data contained in all publications are solely those of the individual author(s) and contributor(s) and not of MDPI and/or the editor(s). MDPI and/or the editor(s) disclaim responsibility for any injury to people or property resulting from any ideas, methods, instructions or products referred to in the content. |
© 2024 by the authors. Licensee MDPI, Basel, Switzerland. This article is an open access article distributed under the terms and conditions of the Creative Commons Attribution (CC BY) license (https://creativecommons.org/licenses/by/4.0/).
Share and Cite
Atero-Calvo, S.; Magro, F.; Masetti, G.; Navarro-León, E.; Rios, J.J.; Ruiz, J.M. Evaluation of the Effectiveness of a Humic Substances-Based Product for Lettuce Growth and Nitrogen Use Efficiency under Low Nitrogen Conditions. Agriculture 2024, 14, 1492. https://doi.org/10.3390/agriculture14091492
Atero-Calvo S, Magro F, Masetti G, Navarro-León E, Rios JJ, Ruiz JM. Evaluation of the Effectiveness of a Humic Substances-Based Product for Lettuce Growth and Nitrogen Use Efficiency under Low Nitrogen Conditions. Agriculture. 2024; 14(9):1492. https://doi.org/10.3390/agriculture14091492
Chicago/Turabian StyleAtero-Calvo, Santiago, Francesco Magro, Giacomo Masetti, Eloy Navarro-León, Juan Jose Rios, and Juan Manuel Ruiz. 2024. "Evaluation of the Effectiveness of a Humic Substances-Based Product for Lettuce Growth and Nitrogen Use Efficiency under Low Nitrogen Conditions" Agriculture 14, no. 9: 1492. https://doi.org/10.3390/agriculture14091492