Abstract
Carbon reduction in livestock is a necessary path for the green transformation of the livestock industry. Has the digital economy as an emerging productive force in recent years driven carbon reduction in the livestock sector? This paper employs dynamic panel regression models, mediation effect models, and spatial econometric models to investigate the impact mechanisms of the digital economy on carbon emission reduction in livestock husbandry. The results indicate the following: (1) The digital economy has a positive impact on carbon reduction in livestock farming by fostering technical innovation, enhancing the level of human capital, and transforming the mode of production. (2) From 2013 to 2021, the digital economy did not show a significant carbon reduction effect until 2018. It has had a substantial impact on carbon reduction in livestock husbandry in the northeastern and western regions, while its influence in the eastern and central regions has not been significant. The digital economy positively affects carbon emission reduction in non-dairy cows and pigs, negatively affects poultry, and shows no significant effect on dairy cows and sheep. (3) In terms of spatial effects, the digital economy is not only driving carbon emission reductions from livestock farming in the local region but is also significantly driving carbon emission reductions from livestock farming in the surrounding provinces. The findings of this article provide some insights into future policy formulation for low-carbon development in the livestock sector.
1. Introduction
Livestock husbandry forms an important and integral part of agricultural economic development. While it meets the increasing human demand for livestock products, it also generates substantial greenhouse gas emissions, thereby exerting severe negative externalities on the social environment. Historically, China’s livestock industry has prioritized economic gains, predominantly driven by resource consumption. This approach has led to significant soil and air pollution, exacerbating its negative impact on the human environment [1]. According to the FAO database, livestock sector emissions constitute approximately 15% of global carbon emissions [2]. As of 2019, livestock emissions in China represent the largest source of agricultural carbon, accounting for 42.80% of the total [3]. In light of limited resources and environmental capacities, transforming traditional crude production methods, enhancing productivity and resource utilization of livestock and poultry manure, and reducing industry carbon emissions are essential for promoting the sector’s green transformation.
In recent years, the steady growth of information and communications technology (ICT) has spawned the emergence of the digital economy. The digital economy takes data and knowledge as production factors, and the Internet of Things, big data, artificial intelligence, and blockchain as carriers and platforms [4,5], which has set off a new round of social change and has also provided a new impetus and a historic opportunity to reduce carbon emissions in the livestock sector. The digital economy transcends the physical boundaries of space and time [6], enhances the flow of urban and rural factors [7], and transforms traditional labor methods through digitalization, intelligence, and informatization. This transformation drives the rapid evolution and upgrading of traditional productive forces with scientific and technological innovations [8], fundamentally altering human lifestyles and production methods [9]. General Secretary Xi has emphasized that strengthening and optimizing the digital economy is a strategic decision to capitalize on the new opportunities presented by the latest scientific and technological revolution [10]. He emphasized the need for fostering the fusion of the digital economy alongside the physical economy, by advancing the digitization of the industrial, service, and agriculture sectors. The Digital Agriculture and Rural Development Plan (2019–2025) and the Digital Rural Construction Guidelines 1.0 emphasize the importance of the digital economy in advancing agriculture development and provide strategic direction for the digital transformation of China’s agricultural sector [11,12]. For the animal husbandry sector, smart farms leveraging digital technology enable real-time monitoring of environmental conditions, feed ratios, and animal growth. This capability supports achieving economies of scale and reducing emissions of methane, nitrous oxide, and other wastes [13]. Furthermore, e-commerce, digital logistics, and digital finance promote the development of the supply chain for animal husbandry industry, helps to improve the added value of the industry and the economic benefits of enterprises, and then provides financial support for the green transformation of the livestock sector [14]. Additionally, a new wave of environmentally friendly technology advancements has been spurred by the digital economy, which has accelerated the creation and adoption of manure treatment systems and enhanced the recycling and resource utilization of manure [15]. Given these developments, it is pertinent to ask the following: Is the digital economy truly effective in lowering carbon emissions in the livestock sector? If such is the case, what are the specific mechanisms at play? Does a spatial impact exist? Addressing these concerns from a scientific perspective is important to achieve digital transformation and reduce carbon emissions to the greatest extent in animal husbandry in China.
Currently, most scholars primarily concentrate on carbon emission accounting, as well as the spatio-temporal characteristics and influencing factors of the livestock industry. Two methods are predominantly used to estimate carbon emissions from this sector: the emission factor method recommended by the IPCC and the full life-cycle method. Additionally, the temporal and spatial differences and dynamic evolution characteristics of carbon emissions from the livestock industry are analyzed further by applying the Terre index, Gini coefficient, and kernel density estimation [16,17,18,19,20,21,22]. In terms of influencing factors, some studies have found that economic growth and population size growth promote carbon emissions from livestock, while technological progress and the upgrading of agricultural and national industrial structures suppress these emissions [23,24,25,26,27]. Although there are relatively few studies specifically dedicated to exploring the impact of the digital economy on carbon emissions from livestock farming, related research is abundant. Many scholars in Europe have deeply discussed precision livestock with digital technology as the core. These studies mainly focus on the impact of various digital technologies on animal husbandry productivity, animal welfare, and sustainable development under different breeding methods, as well as the opportunities and challenges faced by precision animal husbandry, and find that the application of digital technologies is indeed conducive to reducing carbon emissions [28,29,30,31,32,33,34,35]. Some scholars have identified that Internet infrastructure influences livestock carbon emissions by affecting the scale of livestock operations, technological innovation, and factor allocation [36]. Precision feeding digital technology also impacts the low-carbon transition of dairy farms by influencing the allocation of resources such as land, labor, and capital [37]. Vlaicu P. A. (2024) and Zakirova. A. (2022) suggest that a digital management model for livestock production, based on geo-information technologies like drones, robotic systems, and sensors, could improve animal welfare, optimize feeding efficiency, and minimize carbon emissions from livestock [38,39]. The majority of scholars examine the influence of the digital economy on agricultural carbon emissions from a broader agricultural perspective. They have discovered that the digital economy can indirectly reduce agricultural carbon emissions by improving the efficiency of factor allocation, agricultural technology inputs, human capital, urbanization, and agricultural socialization services [40,41,42,43,44,45]. David Zilberman suggests lowering agricultural carbon emissions through the application of biotechnology, particularly fermentation technology [46,47]. Robert E. Evenson highlights the significance of technical capital, which is critical to the sustainable growth of agriculture and the environment [48,49]. The digital transformation of rural areas has the potential to reduce agricultural carbon emissions by accelerating the development of green technology, strengthening agricultural social services, expanding the scale of agricultural production, and optimizing the structure of the agricultural industry. Furthermore, the impact of digital rural construction on agricultural carbon emissions is non-linear and characterized by an “inverted U-shaped” pattern [46,47,48,49,50,51,52,53].
A review of the literature reveals that the majority of academicians have examined the micro-level effects of digital technology on the environment, animal welfare, and livestock production efficiency, as well as the integration of digital technology into precision animal husbandry. The digital development of China’s livestock industry began relatively late in comparison to developed countries in Europe and America. The impact of digital technology on carbon reduction in China’s livestock industry is not the subject of systematic research. As a result, this article will investigate the impact of the digital economy on carbon emissions reduction in China’s livestock industry from a macroeconomic standpoint, focusing on three primary areas: Firstly, based on a scientific evaluation of the level of China’s digital economy and the intensity of carbon emissions from livestock farming, this paper empirically evaluates the impact of the digital economy on reducing carbon emissions from livestock farming and examines how this impact varies across different times, spaces, and livestock species. Secondly, it explores the mechanisms through which the digital economy influences carbon emissions from animal husbandry, focusing on technological innovation, human capital, and changes in production modes, to clarify the intrinsic relationship between the digital economy and carbon emissions from this sector at a deeper level. Thirdly, this study investigates the existence of a spatial interaction effect, specifically a spatial spillover effect, on the impact of the digital economy on the carbon emission intensity of livestock farming. This paper will provide recommendations for enhancing the thorough integration of the digital economy with livestock farming and maximizing the carbon emission reduction potential of the digital economy in China’s livestock sector, as a result of the findings. It also offers methodological and content references for researchers studying the connection between animal husbandry’s carbon emissions and the digital economy from all around the world. This article consists of five parts: the introduction, theoretical basis and research hypothesis, research design, results and discussion, and conclusion.
2. Theoretical Basis and Research Assumptions
2.1. The Effects of the Digital Economy on Carbon Emission Reduction in Livestock Husbandry
Paul M. Romer proposed the endogenous economic growth theory in 1986. This theory’s central idea is that, in addition to the accumulation of productive resources, the development of technical innovation and human capital are endogenous variables that also serve as key drivers of economic growth. A nation must prioritize the development of talent, bolster the protection of patents and intellectual property rights, encourage R&D staff to carry out technological innovation and develop core technologies, and set up effective institutional mechanisms for the advancement of human capital and technological innovation if it hopes to foster rapid economic development [54,55,56]. The digital economy is the result of the ongoing advancement of ICT in the era of information with strong innovation and permeability. It has penetrated into all aspects of human life and social production, such as scientific and technological advancements, personnel training, service systems, and financial innovation. It theoretically supports the low-carbon transformation of livestock husbandry by promoting technical innovation, raising human capital, and changing the production mode, thereby promoting carbon emission reduction in animal husbandry.
Technical innovation effect: the digital economy has provided further momentum to technical innovation. The digital economy represents an economic development model that leverages new technological means such as big data, the Internet, artificial intelligence, and the Internet of Things. These technologies inherently represent advancement and novelty. Firstly, the digital economy fosters an innovation synergy among research institutes, higher education institutions, and agriculture-related business units [57]. This synergy facilitates the integration of industry, academia, and research, enhancing enthusiasm for research among innovators. Secondly, the digital economy introduces data as a critical component in the factors of production. The unique, accurate, complete, and timely nature of digital data captures environmental characteristics effectively, facilitating the development of digital and precision farming technologies [58]. Thirdly, it accelerates the efficient allocation of human capital, labor, and innovation factors within the science and technology sector, promoting regional green technological innovation [59]. Fourthly, the digital economy enhances the rate of conversion of scientific and technological achievements, creating a conducive environment for technology transfer [60]. Advances in technology favor carbon reduction in the livestock sector. In livestock production, digital technologies enable real-time monitoring and automatic adjustment of factors like diet, health, and the rearing environment of livestock and poultry. This capability reduces environmental pollution and aids in carbon emission reduction. Additionally, integrating digital technology with the use of professional fermentation agents and intelligent compost fermentation processors allows for the resource-efficient utilization of livestock and poultry manure, further reducing environmental pollution. In theory, the digital economy stimulates a fresh surge of technical innovation that facilitates the adoption of environmentally friendly and low-carbon practices in livestock farming.
Human capital effects: the digital economy can accelerate the rate of human capital accumulation. As Nobel Prize winner Schultz noted, “human skills and knowledge have a more significant impact on agricultural economic growth than traditional economic factors such as land and capital”. As the digital economy has emerged, there has been a drastic change in how people acquire knowledge and information. Access to extensive resources at lower costs and increased speeds has significantly accelerated the accumulation and enhancement of human capital [61]. The integration of online and offline learning, alongside the sharing effect of information networks and the matching capabilities of big data and algorithms, has further enhanced the exchange and learning of human capital. This enhancement stimulates higher levels of human capital innovation [62]. Additionally, the internet-based economy broadens the avenues via which information is transmitted and lowers the expenses associated with obtaining information, and reducing losses caused by information asymmetry [63]. Human capital enhancement favors carbon reduction in the livestock sector. In the livestock industry, a higher level of human capital implies that operators not only possess strong learning capabilities and environmental awareness but also mastery of advanced production technologies. They can flexibly utilize digital marketing methods such as live broadcasting and e-commerce, which minimizes resource loss in production and marketing and enhances the efficiency of livestock production, facilitating the green transformation of the industry.
Mode of production transformation effects: historically, traditional animal husbandry primarily relied on family farms, with family labor as the main productive force. These operations were characterized by smaller production scales, lower efficiency, higher farming costs, and simpler waste treatment methods. However, with advancement from the industrial and technological revolutions, traditional animal husbandry has evolved into modern practices, which are predominantly mechanized. This shift has significantly liberated manpower, enhancing the productivity and scale of animal husbandry in China. The digital economy has sparked a new era of technological and industrial revolutions, enabling the livestock industry to be deeply integrated with digital technologies. This integration has ushered in an era of precision farming. Digital technology empowers livestock workers, enabling those who master it to create significantly more value than traditional laborers within the same period. Digital technologies can upgrade the means of labor in the livestock sector and digitally adapted means of labor include drones, artificial intelligence, driverless transport, etc. Digital means of labor can enable workers to accurately control farms without having to go to the farms, using intelligent equipment and data mining techniques. Furthermore, digital technology can be integrated directly into the objects of animal husbandry labor, such as embedding microchips in the ears of cows. This integration enables practitioners to acquire a more comprehensive, accurate, and profound comprehension of livestock and their environments, thereby facilitating the precise regulation of production processes [64,65]. Hence, Hypotheses 1 and 2 are proposed:
H1:
The digital economy can promote carbon emission reduction in livestock husbandry.
H2:
The digital economy can promote carbon emission reduction in livestock husbandry through the effects of technical innovation, human capital, and mode of production transformation.
2.2. The Spatial Effects of Carbon Emission Reduction in Livestock Farming Empowered by the Digital Economy
According to the “first law of geography”, all geographical entities exhibit a degree of spatial correlation. The emergence of digital technology allows for the exchange of knowledge, technology, and skill to surpass the constraints of time and distance, resulting in a substantial decrease in the cost of these exchanges and an improvement in regional linkages within the animal husbandry business. The geographical impact of the digital economy on reducing carbon emissions in the livestock sector manifests in three main aspects: Firstly, the regions that have advanced digital economies and successful carbon emission reduction strategies in the livestock sector might be designated as development demonstration zones. These areas generate technology and knowledge spillovers to neighboring regions, spreading advanced management experiences and low-carbon production technologies to other areas. This dissemination promotes the growth of the digital economy and its beneficial effect on reducing carbon emissions in the livestock sector of the nearby areas [66]. Secondly, to achieve satisfactory outcomes in economic and environmental assessments, every province actively incorporates cutting-edge technology and management strategies from neighboring areas with strong digital economies, resulting in substantial reductions in carbon emissions in the livestock sector. This adoption helps address the challenges encountered during the low-carbon transformation of the animal husbandry industry [67]. Thirdly, the digital economy promotes inter-regional cooperation and resource sharing. The advent of the Internet has enabled cooperation on projects and the exchange of information between different places, strengthening connectivity and closeness. The improved inter-regional connection fosters an advantageous setting for the digital economy to facilitate the reduction in carbon emissions in the livestock sector [68]. Hence, Hypothesis 3 is proposed:
H3:
The digital economy has a positive spatial spillover effect on the carbon reduction effect of livestock farming.
3. Materials and Methods
3.1. Econometric Model
3.1.1. Benchmark Regression Model
Considering the possible lag effect in the carbon intensity of livestock farming—that is, the carbon intensity from previous periods may impact the current period’s carbon intensity—a dynamic panel model is utilized. The model includes a one-period lag of the explained variable, making it more susceptible to endogeneity issues than a static panel model. Therefore, this paper employs the System Generalized Method of Moments (SYS-GMM) for regression analysis, which effectively mitigates this problem [69,70,71]. The specific baseline model is set as follows:
where represents the carbon intensity of livestock husbandry in province i in year t; denotes that of province i in year t − 1; is the level of the digital economy; indicates a series of control variables; represent the coefficient of the lagged terms of the explained variable; and expresses the coefficient of the core explanatory variable.
3.1.2. Mediating Effect Regression Model
To explore how the digital economy influences the carbon emission intensity of livestock husbandry [72,73], this paper establishes a mediation model structured as follows:
where represents the total effect of the digital economy on the carbon emission intensity of livestock husbandry; is the direct effect of the digital economy on carbon emission intensity. The ab denotes the mediating effect of the digital economy on livestock carbon emission intensity. Due to the limitations of the stepwise regression coefficient method, this paper further utilizes the Sobel and Bootstrap tests under the condition that the above regression results are significant [74].
3.1.3. Spatial Measurement Model
To further test whether there are spatial spillovers effect, this paper proposes the following spatial measurement model:
where indicates the core explanatory variable, reflects the spatial interaction effects of the core explanatory and control variables; refers to the spatial interaction effect of the explained variable; is the coefficient of the spatial interaction term of the core explanatory and control variables; and denotes the spatial autocorrelation coefficient [75,76].
The Moran Index is an indicator used to measure spatial correlation and consists of the global Moran Index and the local Moran Index. The global Moran Index provides an overall measure of whether an indicator is positively or negatively correlated in terms of its geographical distribution characteristics. A significant positive Moran Index indicates a positive correlation in the geographical distribution of the indicator, i.e., provinces with high levels are clustered together and provinces with low levels are clustered together. If the Moran Index is significantly negative it implies that the indicator is negatively correlated geographically, i.e., provinces with high levels are surrounded by provinces with low levels, and provinces with low levels are surrounded by provinces with high levels. The local Moran’s Index is generally represented by a scatter plot, which gives a clear picture of the specific aggregation characteristics of the explored individuals.
3.2. Variable Selection
3.2.1. Explained Variable: Carbon Emission Intensity of Livestock Sector
This study selects a ratio between carbon emissions and gross value of livestock production as the measure of carbon emission intensity in livestock farming. The emission factor method recommended by the IPCC is used for accounting. The following table lists the livestock species that are involved as well as the carbon sources that animal husbandry produces. The specific calculation formula is as follows:
where and represent the equivalent produced by and , respectively; and represent the conversion factor of and , which are 21 and 310, respectively; and represent the emission factors of and for livestock and poultry breeds of category i, respectively (Table 1); and is the average annual stocking level of livestock and poultry breeds of category i. For livestock and poultry breeds with feeding cycles longer than one year (365 days), the end-of-year stock represents the average annual feeding capacity. For livestock and poultry breeds with shorter feeding cycles, adjustments are made based on annual slaughtering capacity and feeding cycle length, and the specific adjustment method formula is as follows: /365, where N represents the annual slaughtering capacity and represents the feeding cycle of livestock and poultry species of category i [21,22]:

Table 1.
Greenhouse gas emission factors for livestock (unit: Kg/head/year).
3.2.2. Core Explanatory Variables: Digital Economy
There is no standardized evaluation index for the digital economy. Considering the indicator’s scientific rigor, comprehensiveness, and data accessibility, this study adopts the framework proposed by Wang et al. (2021) [77]. We selected 20 indicators across four dimensions: digital infrastructure, digital industrialization, industrial digitization, and the digital economy development environment to assess the level of the digital economy (Table 2). The entropy method is used to evaluate the digital economy development across 30 provinces in China (excluding Tibet) from 2013 to 2021. The results reflect a general increasing trend in China’s digital economy, with the average provincial level increasing from 0.22 in 2013 to 0.49 in 2021. The most developed provinces include Beijing, Shanghai, Jiangsu, and Zhejiang in Eastern China, where the digital economy indices rose from 0.47, 0.37, 0.36, and 0.39 in 2013 to 0.61, 0.66, 0.70, and 0.78 in 2021, respectively. Following these are Shandong, Sichuan, and Fujian. Overall, the digital economy in East China and Beijing is at the leading level in China. This is mostly because these provinces are the concentration of China’s talent resources and have the strongest economic and technological strength. The level of the digital economy in other provinces remains at a lower level, presenting great potential for future growth.
Table 2.
Indicators for the evaluation of the digital economy.
3.2.3. Control Variables
The livestock sector’s carbon intensity may be impacted by variables other than the digital economy. In order to strengthen the validity of the findings, this study uses the following control variables in the empirical analysis, referencing pertinent research by other academics on the variables influencing livestock or agricultural development: Economic development level, as determined via GDP per capita [78]. Agricultural industrial structure, as determined with the ratio of the gross value of livestock production to the gross value of agricultural production. Referring to Chen’s (2023) research, the degree of livestock sector industry agglomeration is also included in the control variable. It is quantified using the location entropy, which is determined by dividing the ratio of the provincial livestock husbandry output value to the national livestock husbandry output value by the ratio of the provincial GDP to the national GDP [79]. Environmental regulation, as quantified via the quantity of local environmental regulations referring to Chen’s (2023) research [80]. Referring to Wang’s (2024) research on the influence of the digital economy on agricultural high-quality development, foreign direct investment is introduced into the control variables, which is determined using the ratio of regional GDP to foreign direct investment [81]; the Fan Gang Marketization Index was employed to evaluate the marketization level in each province in order to determine the extent of market development [82].
3.2.4. Mediating Variables
(1) Technical innovation effect: technical innovation is often presented in the form of patents. The number of agricultural patent inventions that have been authorized is utilized to gauge the technical advancement in each province referring to Zhang Liao’s (2024) study. Due to the lack in the number of authorized patent inventions specifically for the livestock industry, this paper can only replace the livestock husbandry technological progress with the generalized agricultural technology progress that includes agriculture, forestry, livestock, and fisheries [83]. (2) Human capital effect: the level of human capital in each province is measured as the average years of schooling of the rural labor force [84,85]. (3) Mode of production transformation effects: in this paper, the original value of productive fixed assets of pastoralism owned by rural residents is used to represent the mode of production. The productive fixed assets of the pastoral industry owned by rural residents represent the material of production of China’s animal husbandry and can also represent the mode of production of China’s animal husbandry industry. Additionally, they can serve as a representation of the mode of production in the industry in a way. Theoretically, so far, the production mode of China’s livestock industry is still a decentralized mode of operation based on small family farmers, and the means of production is mainly mechanized with a low-level of digitalization. The development of the digital economy can promote the transition of the animal husbandry production methods towards scale and digitalization and reduce the proportion of small family farmers in the main body of animal husbandry operations. Therefore, it is expected that this indicator is negatively correlated with the level of digital economy development and has a positive relationship with the carbon emission intensity of the livestock sector.
3.3. Data Sources
The research sample of this work consists of 30 provinces in China (excluding Tibet), and the period interval spans from 2013 to 2021, based on the availability of variable data. The provincial digital inclusive finance index is sourced from the Digital Inclusive Finance Research Center of Peking University. Other indicators related to the digital economy and control and mediating variables are obtained from the National Bureau of Statistics, the China Statistical Yearbook, and the China Information Industry Yearbook. Data concerning the carbon emission intensity of livestock husbandry primarily come from the China Statistical Yearbook, the China Animal Husbandry and Veterinary Yearbook, and the respective provincial yearbooks. The data on the number of authorized agricultural patent inventions come from the State Intellectual Property Office and are collated using the patent classification number A01 search.
4. Results and Discussion
4.1. Carbon Intensity of Livestock Husbandry
The carbon emission intensity of livestock husbandry is categorized into four levels. Regions with carbon emission intensities greater than 20,000 metric tons per hundred million yuan are classified as high intensity, those between 10,000 and 20,000 metric tons are classified as medium-high intensity, those between 5000 and 10,000 metric tons are classified as medium-low intensity, and those under 5000 metric tons are classified as low intensity (see Figure 1). The average provincial carbon emission intensity decreased from 14,396.49 metric tons per hundred million yuan in 2013 to 8883.80 metric tons in 2021, demonstrating the effectiveness of efforts by the government, farmers, and other societal sectors to reduce carbon emissions in China’s livestock husbandry. Provinces such as Qinghai, Gansu, Ningxia, Inner Mongolia, and Xinjiang had the highest emission intensities in 2013, with respective values of 66,476.51, 64,003.36, 23,306.14, 20,395.77, and 16,062.11 metric tons per hundred million yuan, which declined by 2021 to 43,332.00, 22,726.90, 18,216.30, 15,128.80, and 12,146.20 metric tons, respectively, in 2021. The provinces of Yunnan and Guizhou also exhibited high carbon emission intensities, whereas the eastern region of China recorded the lowest levels. Figure 2 illustrates the trend in the proportion of carbon emissions from six major livestock and poultry species in total carbon emissions in China from 2013 to 2021. Non-dairy cows and pigs have always been the main source of carbon emissions from livestock, with the share remaining at around 70%. In 2021, carbon emissions from non-dairy cows and pigs accounted for 39.50% and 29.80%, respectively. The carbon emissions of goats, sheep, and dairy cows basically remain at the same level, accounting for between 8.00% and 9.00%. Poultry has the lowest carbon emissions, and its share remains at about 4%.
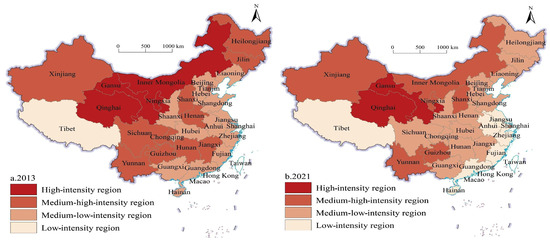
Figure 1.
Distribution of carbon intensity in livestock husbandry. Note: The data of administrative divisions used for making the base map come from the standard map with the approval number of GS(2020)4619 downloaded from the standard map service website of the Ministry of Natural Resources of China, and the base map has not been modified.
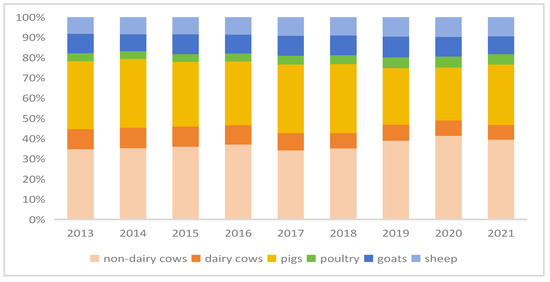
Figure 2.
Proportion of carbon emissions from six major livestock and poultry species in total carbon emissions in China, 2016–2021.
4.2. Benchmark Regression Results
The Column (1) features the OLS regression model, while column (2) employs a bidirectional fixed effects model with fixed effects for both provinces and years in Table 3. The coefficients of the digital economy are negative at the 5% level in both columns. This indicates that since 2013, the digital economy has significantly reduced carbon emissions from livestock husbandry. To alleviate the endogeneity problem arising from bidirectional causality, omitted variables, and to enhance accuracy of the results, a one-period lag of the explained variable is used as an explanatory variable to perform the SYS-GMM method for dynamic panel data. For valid SYS-GMM regression, two conditions must be satisfied [86]: first, the estimation residuals should exhibit first-order autocorrelation but not second-order autocorrelation. This is usually tested using the Arellano-Bond method, where a p-value less than 0.1 for the AR (1) test and bigger than 0.1 for the AR (2) test are required. Second, the instrumental variables must be valid, which is assessed using the Hansen J test; a p-value greater than 0.1 indicates that the instruments are valid. As shown in column (3), the constructed models passed conditions 1 and 2, confirming that the SYS-GMM model is suitable for this paper. Furthermore, the coefficients for the digital economy are still negative at the 1% level. Hence, Hypothesis 1 is confirmed. The coefficient on the one-period lag of livestock carbon intensity is negative, suggesting that there is a certain inertia and time-accumulation effect of the impact of the digital economy on carbon emission reduction in animal husbandry.
Table 3.
Benchmark regression results.
4.3. Robustness Testing and Endogeneity Processing
4.3.1. Robustness Testing
The benchmark regression results confirm Hypothesis 1. However, these results might be influenced by factors related to data and research methodology. To address this, regression tests were conducted using five methods in this paper (see Table 4).
Table 4.
Robustness test results.
First, we excluded Beijing, Shanghai, Tianjin, and Chongqing from the sample due to their distinct socioeconomic development levels in comparison to other provinces and their unique economic structure as municipalities directly under the central government in China, where livestock husbandry plays a negligible role in both the economy and employment [87,88]. The findings, which are displayed in Table 3’s Column (1), demonstrate that, at the 10% level, the digital economy has a negative influence. Second, we used a trimming approach by excluding samples that were above the 99th percentile and below the first percentile in order to lessen the influence of outliers [89]. The digital economy’s coefficient is still strongly negative at the 10% level, as indicated by Column (2) of Table 3, and there has been no discernible shift in its importance or influence. Thirdly, the method of calculating the core explanatory variables was revised. The level of digital economy was recalculated using the hierarchical analysis method, as detailed in Model (3) of Table 3. The coefficients of the digital economy did not significantly change following this adjustment. Fourthly, the explained variable was changed. Each province’s annual carbon emissions are used in Model (4) in Table 3. The findings show that, at the 5% level, the digital economy’s coefficient is notably negative. Fifthly, we examined the lag effect by replacing the core explanatory variables with their values lagged by one period. This reflects the delayed impact of the digital economy with regard to carbon emissions from livestock husbandry. The findings, once again, illustrate a significant negative impact at the 1% level. The hypothesis that the digital economy will lower the carbon emissions from the livestock sector between 2013 and 2021 is further supported by these five regression results.
4.3.2. Endogeneity Processing
Many scholars utilize the SYS-GMM model to address the issue of endogeneity. However, while the SYS-GMM model mitigates endogeneity related to the dependent variable and its lags, it does not fully address the endogeneity concerns stemming from the core explanatory variables. Consequently, we employed the instrumental variables method to further validate the robustness of results.
Drawing on the study by Huang et al. (2019) [90], the number of fixed-line telephones per 100 people in 1984 across 30 provinces in China was chosen as an instrumental variable. This choice is grounded in two main rationales: firstly, the evolution of digital technology from traditional communication tools like fixed-line telephones suggests a likely correlation between historical fixed-line telephony penetration rates and current Internet penetration rates. This correlation implies that higher historical penetration rates might predict higher current levels of digital economy development, thus satisfying the requirement for a “strong correlation” with the core explanatory variables. Secondly, since 1984 is significantly distant from the commencement of this paper in 2013, and the usage rate of fixed-line telephones has substantially declined, the 1984 metric likely has minimal direct impact on current carbon emission intensity from livestock husbandry, fulfilling the “strict exogeneity” requirement for the instrumental variable.
To adapt the cross-sectional data from 1984 for panel data analysis, inspired by research from Gao (2023) [91], we used the interaction terms between the number of fixed-line telephones per 100 people in 1984 and the previous year’s national revenue from information technology services as the final instrumental variable, as shown in Table 5. The instrumental variables have a substantial impact on the digital economy, as evidenced by the first-stage estimation results, which suggest that they possess a strong explanatory power. The results of the second stage indicate that the carbon emission intensity of livestock husbandry is considerably reduced via the digital economy. The Kleibergen–Paap rk LM statistic provides strong evidence to reject the null hypothesis of under- identification. Furthermore, the Kleibergen–Paap rk Wald F-statistic and the Cragg–Donald Wald F-statistic surpass the crucial threshold of 16.38 established by Stock–Yogo. This suggests that the instrumental variables are not weak and reinforces the reliability of the benchmark regression results.
Table 5.
Endogeneity test results.
4.4. Heterogeneity Analysis
Temporal heterogeneity. The livestock husbandry industry in China considers 2018 to be the official opening year of intelligent animal husbandry, and the intelligent development of animal husbandry is being progressively promoted by various provinces and cities. Consequently, this paper divides the time period into two stages, 2013–2017 and 2018–2021, in order to investigate the heterogeneity of time. Table 6 illustrates that, with a positive coefficient, the digital economy had no discernible effect on the decrease in carbon emissions from livestock husbandry between 2013 and 2017. However, from 2018 to 2021, the digital economy passed the significance test at the 5% level with a negative coefficient. The possible reason is that during 2013–2017, the digital carbon reduction technology has not yet matured and been extensively used in the field of livestock husbandry, and the fusion of the digital economy and the livestock industry is still in the exploratory stage. The digital economy started to play a major role in the livestock industry’s green transformation between 2018 and 2021, which began to have a progressive effect on carbon reduction.
Table 6.
Results of tests for temporal and regional heterogeneity.
Regional heterogeneity. The impact of the digital economy on the intensity of carbon emissions from livestock husbandry varies across Chinese provinces because of significant disparities in natural resource endowments, livestock and poultry farming patterns, agricultural industry structures, and levels of scientific and technological development. Four regions comprise the sample: northeast, central, west, and east (see Table 6). The digital economy has a significant negative effect on the carbon emission intensity of livestock husbandry in the northeast and west regions at the 10% level, but it is not significant in the east and central regions. This is probably because of the fact that livestock husbandry is a vital industry in the northeast and west, where the green revolution is highly prioritized. Although the level of development of the digital economy is relatively high in the eastern and central regions, digital resources are more frequently used in secondary and tertiary businesses, which leads to a less pronounced carbon reduction effect on the livestock industry.
Livestock species heterogeneity: given the substantial differences in breeding methods and physiological functions among various livestock and poultry, this analysis explores the heterogeneity effect of the digital economy on carbon emissions from five types of livestock and poultry, as detailed in Table 7. The results suggest that the digital economy significantly promotes carbon reduction in non-dairy cows and pigs, which are among the highest carbon emitters. The carbon reduction impact is greatest for non-dairy cows, followed by pigs. The digital economy does not significantly affect carbon reduction in dairy cows and sheep. However, it promotes increased carbon emissions from poultry, possibly due to an inverted U-shaped effect. In the early stages of digital economy development, the construction of new digital infrastructure consumes considerable resources and itself produces a certain amount of carbon emissions, which initially mitigates the carbon reduction potential in poultry. The digital impact of dairy cows’ lower carbon emissions is less evident than that of non-dairy cows. It is probable that higher technology and management are needed for dairy farming’s digital revolution than for non-dairy cows. Dairy farming requires continuous monitoring of breast health, milk quality, animal comfort, and automatic milking equipment in addition to attention to the breeding environment and health state. The investment return rate of dairy cows is low, and the cycle is long in terms of economic benefits, which are influenced by the international milk price. Conversely, the economic risk of non-dairy cows is relatively low, and the cycle is brief, allowing them to adapt to market fluctuations.
Table 7.
Results of tests for livestock species heterogeneity.
4.5. Mechanism Analysis
This paper further explores the mechanisms behind this effect (see Table 8).
Table 8.
Results of the mediation effect test.
The digital economy indirectly reduces carbon emissions from livestock husbandry by increasing the level of technical innovation. The digital economy has an overall impact of 2.950 on the reduction in carbon emissions in livestock husbandry. This implies that for every 1% increase in the digital economy, there is a 2.950% reduction in carbon emissions from livestock husbandry. Technological innovation plays a mediating role, contributing 27.60% to this reduction. Additionally, the digital economy boosts human capital levels, which facilitate carbon emissions reduction in livestock husbandry, with human capital effects accounting for a 6.80% intermediary role. The development of the digital economy also diminishes the original value of productive fixed assets owned by rural residents in the pastoral industry, reflecting the fact that the digital economy has decreased herders’ demand for traditional fixed assets. Herders may pay more attention to the effective use of resources and the improvement of production efficiency, shifting to new industries such as digital agriculture, which in turn facilitates changes in production methods. The reduction in the original value of productive fixed assets owned by rural residents in animal husbandry can also directly promote carbon emission reduction in animal husbandry, reflecting the fact that the original means of production limits carbon emission reduction in animal husbandry, and upgrading the means of production and changing the original mode of production have become necessary methods for the green transformation of the animal husbandry industry. Here, the total effect of the digital economy on reducing carbon emissions from livestock husbandry is 2.750, with the decrease in the original value of productive fixed assets playing an intermediary role of 15.20%.
The digital economy primarily promotes carbon emission reduction in livestock husbandry by promoting technical innovation, altering the production mode and improving human capital. The Sobel’s Z-value validated the significance of the results. The Bootstrap model, involving 1000 repeated samples, showed that the indirect effect, direct effect, and total effect’s corrected confidence intervals do not contain zero, confirming that the effects of technical innovation human capital and production mode change are robust mediators of the digital economy’s influence on carbon emission reduction in livestock husbandry. Thus, Hypothesis 2 is supported.
4.6. Further Study: Spatial Spillover Effect
The emergence of the digital economy transcends traditional geographical limitations, allowing various production factors to flow freely. This paper employs a spatial econometric method to examine the spatial impacts of the digital economy on carbon emissions from livestock farming. We assess the spatial autocorrelation of the two indicators. The test findings are presented in Table 9. The global Moran Indices for the two indicators between 2013 and 2021 are positive and statistically significant, indicating a positive geographical association in the digital economy and the carbon emission intensity of livestock husbandry. Additionally, we conducted a local spatial analysis using a Moran scatter plot, with the 2021 index scatter plots for the two indicators presented in Figure 3 and Figure 4. These plots reveal that most cities fall into “high-high” and “low-low” agglomeration areas, i.e., provinces with higher levels of digital economy development are clustered together, and provinces with lower levels of digital economy development are clustered together; meanwhile, regions with a high carbon intensity of livestock farming also have a high carbon intensity of livestock farming in their neighborhood, and regions with a low carbon intensity of livestock farming also have a low carbon intensity of livestock farming in their neighborhood.
Table 9.
Global Moran’s Index test results.
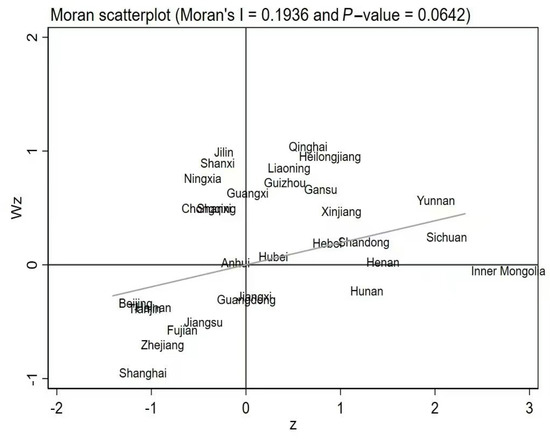
Figure 3.
The carbon intensity of livestock husbandry.
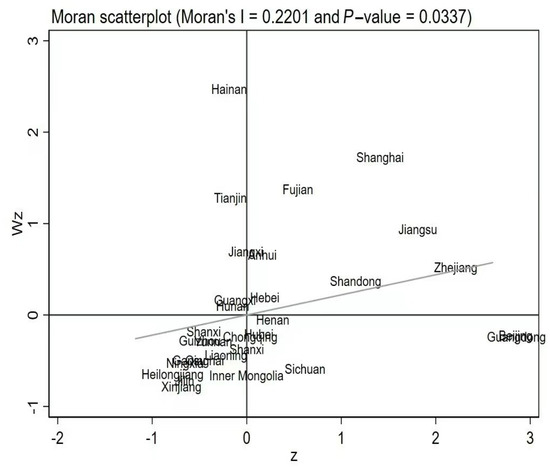
Figure 4.
The digital economy.
Before setting up the spatial measurement model, we need to determine which spatial measurement model is most appropriate for this study. We performed several tests, such as LM, Robust-LM, LR, Wald, and Hausman test, using three different weight matrices: adjacency, economic, and economic–geographical nested. The LM, Robust-LM, LR, and Wald tests generally rejected the null hypothesis under all three matrices, resulting in the preliminary choice of the Spatial Durbin Model (SDM). The null hypothesis was also denied via the Hausman test, which was employed to determine the choice between fixed effects and random effects. This suggests that the fixed effects model is the more suitable option. In addition, the coefficient for individual fixed effects is the largest. Therefore, the individual fixed effects model of the Spatial Durbin Model (SDM) was chosen as the most appropriate for this study. Table 10 presents the findings.
Table 10.
Model selection test results.
The regression outcomes using the SDM with three different weighting matrices are listed in Table 11. The spatial autoregressive coefficients are positive at the 1% level, demonstrating that carbon emission reductions in local livestock husbandry have a notable positive spillover effect on neighboring areas. The coefficient of digital economy is still significantly negative. The coefficient of the spatial interaction of the digital economy is also significantly negative at the 1% level, suggesting that it not only reduces carbon emissions locally but also helps to reduce emissions in neighboring areas. Lesage et al. (2011) [92] noted that using the SDM model to evaluate spatial spillovers can introduce bias and recommended interpreting the results through partial differentiation of variable changes. Consequently, the regression findings of the direct and indirect impacts estimated are presented in Table 12. Further examining the coefficients from the regression models using the three different weighting matrices, the coefficients for the adjacency matrix and the economic–geographical nested weighting matrix are notably higher. Consequently, this study concentrates on decomposing the spatial spillover effect using these two matrices. At the 1% level, the estimation findings for the digital economy under both weight types are notably negative. Additionally, compared to the direct impacts, the indirect effects’ coefficients are significantly bigger. This suggests that the level of digital economy development in a local area can have a substantial positive influence on the reduction in carbon emissions in livestock husbandry in neighboring regions. The indirect effect from the economic–geographical nested weight matrix is larger than that from the adjacency matrix. The economic–geographical nested matrix places greater emphasis on the economic dimension, suggesting that the spillover effect of economic proximity is more substantial than that of geographic proximity. This difference may stem from the fact that economically proximate provinces tend to have more extensive interactions, easier and more frequent information exchanges, and lower transaction costs. These factors are more conducive to fostering a “learning effect” compared to mere geographic proximity.
Table 11.
Spatial econometric regression results.
Table 12.
Regression results for direct and indirect effects.
5. Conclusions
5.1. Research Conclusions
This work empirically examines the influence of the digital economy on the carbon emission intensity of livestock husbandry by employing a SYS-GMM model, a mediation model, and a spatial econometric model. The following are the findings of the research: First, the digital economy significantly mitigates the carbon emissions caused by livestock farming. Secondly, the digital economy has a substantial impact on carbon emissions from livestock husbandry in the northeast and western regions of China, but it has no effect on the east and center. It substantially reduces carbon emissions from non-dairy cows and pigs, but it does not have a significant impact on dairy cows and sheep. Additionally, it has a negative impact on the reduction in carbon emissions in poultry. Third, the digital economy has the potential to encourage carbon reduction in livestock husbandry by promoting technological innovation, enhancing human capital, and changing the mode of production. Fourth, the spatial spillover effect of the digital economy on the reduction in carbon emissions in animal husbandry is significant.
5.2. Recommendations
- (1)
- Establish digital strategic thinking and encourage the digital transformation of livestock farming. It is necessary to accelerate the promotion of the deep integration of the digital economy and the traditional livestock farming industry. The government should accelerate the coverage and application of big data, artificial intelligence, the Internet of Things, blockchain, and other digital technologies in the whole industry chain of animal husbandry, enhance the coverage of intelligent farm bases, and ultimately promote the development of precision animal husbandry. The digital economy should be applied to improve the level of scale in livestock farming, reduce the proportion of small farmers in the livestock industry, and build up a “scale, specialization, standardization, intensification, and greening” model of livestock development;
- (2)
- Tailor policies based on local conditions to achieve synergistic development of a low-carbon transition in the livestock sector. The focus of the carbon emission reduction task for livestock farming is in the western and northeastern regions, which are the main livestock farming provinces in China and also the areas with the most serious carbon emissions. The government should give the western and northeastern regions of livestock farming carbon emission reduction more fiscal support and policy inclination, but also accelerate the improvement of western and northeastern regions’ digital economy development level. The construction of smart farms should be laid out according to the resource advantages of the western and northeastern regions and modern manure resource treatment equipment should be constructed to improve the efficiency of resource utilization and production efficiency. The government should make a concerted effort to stimulate the growth of the western region and revitalize the northeast. Effective talent introduction policies should be developed to attract the inflow of talent in light of the significant brain leakage in the northeast and western regions. In terms of livestock species heterogeneity, the government should focus on laying out digital carbon reduction programs for non-dairy cattle and pigs to accelerate the greening development of non-dairy cattle and pig farming;
- (3)
- Improve the level of digital skills and the digital literacy of farmers and provide human capital support for the livestock sector. The local governments should coordinate the formulation of action programs to enhance farmers’ digital literacy and skills, attach importance to online training methods, introduce various types of smart farming machinery to farmers, and make farmers pay attention to the production methods of smart farming. It is also important to provide live training on e-commerce, teach farmers to use new media tools to capture market information in time, and use mobile phone applications to carry out digital marketing, so as to cultivate new types of farmers with digital awareness and skills. It is also necessary to vigorously publicize and explain to farmers the knowledge of digital security and raise their awareness of digital security;
- (4)
- Strengthening regional linkages and leveraging spillover and learning effects between regions. The government should use the interconnectivity, interactivity, and high permeability of digital technology to build an effective knowledge-sharing platform and technology transfer mechanism to promote the flow and sharing of knowledge and information between regions and to promote the synergistic regional development of the low-carbon transformation of the livestock sector. Academic seminars, commercial forums, and cooperative forums on the digital revolution of animal husbandry should be actively organized by local governments. The government should accelerate the establishment of a model in which a digital animal husbandry low-carbon development demonstration base leads other regions to realize a low-carbon transformation of the animal husbandry industry.
5.3. Research Limitations and Areas for Future Studies
There are three main limitations in this paper.
Firstly, there are errors in the data calculation. In this paper, the reference standard for measuring carbon emissions from animal husbandry is the carbon emission factor recommended by the IPCC department, which demonstrates poor timeliness and there is a certain level of error in the measured carbon emissions from animal husbandry.
Secondly, there are limitations in the research content. This paper is mainly based on macro-data research, with a lack of field visits to Chinese livestock and poultry farmers. If this study was based on field research data from Chinese livestock and poultry farmers, the conclusion may be more convincing. In this work, animal husbandry management entities with different scales and breeding modes are integrated as a whole. As a matter of fact, the effects of the digital economy on the carbon emissions associated with animal husbandry will vary depending on the breeding modes and scales involved.
Thirdly, there are limitations in the research methodology. The GMM-SYS model, the mediated effects model, and the spatial econometric model all require a large sample size. The sample size of this paper is 30 provinces, which is small and may affect the robustness of the results.
In the future, we will investigate the animal husbandry systems in European countries and investigate the diverse animal husbandry models in Europe, drawing on the extensive research of global academicians in the field of animal husbandry. Furthermore, we will intensify field visits to livestock ranches in China to investigate the influence of a variety of digital technologies on the economic and environmental advantages of the Chinese livestock industry at different breeding scales and modes. This will enable us to offer practical guidance on the digital transformation of China’s livestock industry.
Author Contributions
Conceptualization, C.L.; methodology, T.S.; software, T.S.; validation, T.S.; formal analysis, T.S.; investigation, T.S.; resources, C.L.; data curation, T.S.; writing—original draft preparation, T.S. and C.L.; writing—review and editing, C.L.; visualization, T.S.; supervision, C.L.; project administration, C.L.; funding acquisition, C.L. All authors have read and agreed to the published version of the manuscript.
Funding
This work was funded by the National Natural Science Foundation of China (the effect of infant milk powder safety trust index on product competitiveness—Index measurement, Correlation model construction and market simulation, grant number 71673042).
Institutional Review Board Statement
Not applicable.
Data Availability Statement
The data presented in this study are available on request from the corresponding author. The data are not publicly available due to the fact that the data were independently compiled and calculated from the original data.
Conflicts of Interest
The authors declare no conflicts of interest.
References
- Li, J.; Pan, L.S. Main Contradictions and Solutions to the High—Quality Development of Animal Husbandry under the Background of Rural Revitalization. Econ. Rev. 2022, 8, 58–64. (In Chinese) [Google Scholar] [CrossRef]
- Persson, U.M.; Johansson, D.J.A.; Cederberg, C. Climate metrics and the carbon footprint of livestock products: Where’s the beef? Environ. Res. Lett. 2015, 10, 034005. [Google Scholar] [CrossRef]
- Shang, L.Y.; Cui, C.; Zhan, H.F. Spatial-tempoal evolution characteristics and influencing factors of carbon emission efficiency of animal husbandry in Beijing-Tianjin-Hebei region. Chin. J. Agric. Resour. Reg. Plann. 2023, 44, 190–199. [Google Scholar] [CrossRef]
- Jan, Z.; Ahamed, F.; Mayer, W.; Patel, N.; Grossmann, G.; Stumptner, M.; Kuusk, A. Artificial intelligence for industry 4.0: Systematic review of applications, challenges, and opportunities. Expert Syst. Appl. 2023, 216, 119456. [Google Scholar] [CrossRef]
- Sawangwong, A.; Chaopaisarn, P. The impact of applying knowledge in the technological pillars of Industry 4.0 on supply chain performance. Kybernetes 2023, 52, 1094–1126. [Google Scholar] [CrossRef]
- Tang, Y.; Wang, Y. Impact of digital economy on ecological resilience of resource-based cities: Spatial spillover and mechanism. Environ. Sci. Pollut. Res. 2023, 30, 41299–41318. [Google Scholar] [CrossRef]
- Jiang, Q.; Li, Y.; Si, H. Digital economy development and the urban–rural income gap: Intensifying or reducing. Land 2022, 11, 1980. [Google Scholar] [CrossRef]
- Yang, C. Digital economy drives regional industrial structure upgrading: Empirical evidence from China’s comprehensive big data pilot zone policy. PLoS ONE 2023, 18, e0295609. [Google Scholar] [CrossRef]
- Wu, X.L.; Qin, Y.Y.; Xie, Q.Z.; Zhang, Y.Y. The mediating and moderating effects of the digital economy on PM2.5: Evidence from China. Sustainability 2022, 14, 16032. [Google Scholar] [CrossRef]
- Yang, F.; Zhang, H.; Liu, X.R. Digital economy driving household consumption: Mechanism and spatial effects. Prog. Geogr. 2023, 42, 837–851. [Google Scholar] [CrossRef]
- Sun, H.; Li, D. An empirical study on fiscal science and technology expenditure and agricultural economic growth under digital economy. Sci. J. Econ. Manag. Res. 2020, 2, 9–17. [Google Scholar]
- Zambon, I.; Cecchini, M.; Egidi, G.; Saporito, M.G.; Colantoni, A. Revolution 4.0: Industry vs. agriculture in a future development for SMEs. Processes 2019, 7, 36. [Google Scholar] [CrossRef]
- Wang, T.; Xu, X.B.; Wang, C.; Li, Z.; Li, D.L. From smart farming towards unmanned farms: A new mode of agricultural production. Agriculture 2021, 11, 145. [Google Scholar] [CrossRef]
- Deichmann, U.; Goyal, A.; Mishra, D. Will digital technologies transform agriculture in developing countries? Agric. Econ. 2016, 47, 21–33. [Google Scholar] [CrossRef]
- Chadwick, D.; Jia, W.; Tong, Y.A.; Yu, G.H.; Shen, Q.R.; Chen, Q. Improving manure nutrient management towards sustainable agricultural intensification in China. Agric. Ecosyst. Environ. 2015, 209, 34–46. [Google Scholar] [CrossRef]
- Yan, J.; Zhang, Y. Quantitative assessment, spatial and temporal characteristics, and dynamic evolution of carbon emissions from animal husbandry in China: 2001–2020. Environ. Sci. Pollut. Res. 2023, 30, 116186–116201. [Google Scholar] [CrossRef] [PubMed]
- Caro, D.; Davis, S.J.; Bastianoni, S.; Caldeira, K. Global and regional trends in greenhouse gas emissions from livestock. Clim. Chang. 2014, 126, 203–216. [Google Scholar] [CrossRef]
- He, D.W.; Deng, X.Z.; Wang, X.S.; Zhang, F. Livestock greenhouse gas emission and mitigation potential in China. J. Environ. Manag. 2023, 348, 119494. [Google Scholar] [CrossRef]
- Du, R.R.; He, T.; Khan, A.; Zhao, M.J. Carbon emissions changes of animal husbandry in China: Trends, attributions, and solutions: A spatial shift-share analysis. Sci. Total Environ. 2024, 929, 172490. [Google Scholar] [CrossRef]
- Peng, C.; Wang, X.A.; Xiong, X.; Wang, Y.X. Assessing Carbon Emissions from Animal Husbandry in China: Trends, Regional Variations and Mitigation Strategies. Sustainability 2024, 16, 2283. [Google Scholar] [CrossRef]
- Wu, Q.; Zhang, Y.Y.; Zhang, M.Y. Quantitative assessment, temporal and spatial characteristics and dynamic evolution of China’s animal husbandry carbon emissions. J. Arid. Land Resour. Environ. 2022, 36, 65–71. (In Chinese) [Google Scholar] [CrossRef]
- Zhang, J.X.; Wang, H.L. Analysis of Regional Differences, Dynamic Evolution and Convergence of Carbon Emissions in China’s Animal Husbandry Industry-Based on Animal Husbandry Data of 31 Provinces (Municipalities) in China from 1997 to 2017. Jianghan Trib. 2020, 9, 41–48. (In Chinese) [Google Scholar]
- Hao, D.Q.; Wang, R.; Gao, C.J.; Song, X.Y.; Liu, W.X.; Hu, G.Y. Spatial-temporal characteristics and influence factors of carbon emission from livestock industry in China. Int. J. Environ. Res. Public Health 2022, 19, 14837. [Google Scholar] [CrossRef]
- Hao, G.M.; Zhu, H.H.; Cui, Y.C. Measurement and influencing factors of carbon emissions of China’s livestock husbandry in the post-COVID-19 era—Based on the supply-side perspective. Sustainability 2023, 15, 913. [Google Scholar] [CrossRef]
- Yao, C.S.; Qian, S.S.; Mao, Y.H.; Li, Z.T. Decomposition of impacting factors of animal husbandry carbon emissions change and its spatial differences in China. Trans. Chin. Soc. Agric. Eng. 2017, 33, 10–19. (In Chinese) [Google Scholar] [CrossRef]
- Bai, X.B.; Hu, H.; Zhou, Y.H.; Zhang, Y. Study on space-time evolution and influence factors of carbon emissions in China’s animal husbandry. J. China Agric. Univ. 2023, 28, 260–274. (In Chinese) [Google Scholar] [CrossRef]
- Dai, X.W.; Wu, X.; Chen, Y.; He, Y.Q.; Wang, F.; Liu, Y.Y. Real drivers and spatial characteristics of CO2 emissions from animal husbandry: A regional empirical study of China. Agriculture 2022, 12, 510. [Google Scholar] [CrossRef]
- Groher, T.; Heitkämper, K.; Umstätter, C. Digital technology adoption in livestock production with a special focus on ruminant farming. Animal 2020, 14, 2404–2413. [Google Scholar] [CrossRef]
- Tullo, E.; Finzi, A.; Guarino, M. Environmental impact of livestock farming and Precision Livestock Farming as a mitigation strategy. Sci. Total Environ. 2019, 650, 2751–2760. [Google Scholar] [CrossRef]
- Papakonstantinou, G.I.; Voulgarakis, N.; Terzidou, G. Precision Livestock Farming Technology: Applications and Challenges of Animal Welfare and Climate Change. Agriculture 2024, 14, 620. [Google Scholar] [CrossRef]
- Kumar, I. Digitalisation of Dutch Agriculture: Implications of reducing Nitrogen pollution from livestock cultivation. Sci. Sustain. J. 2021, 4. [Google Scholar] [CrossRef]
- Synyavina, Y.; Butenko, T. Prospects for the development of the livestock industry in terms of digitalization. Ekon. Anal. 2021, 31, 178–185. [Google Scholar] [CrossRef]
- Rosa, G.J.M. Grand challenge in precision livestock farming. Front. Anim. Sci. 2021, 2, 650324. [Google Scholar] [CrossRef]
- Lovarelli, D.; Bacenetti, J.; Guarino, M. A review on dairy cattle farming: Is precision livestock farming the compromise for an environmental, economic and social sustainable production? J. Clean. Prod. 2020, 262, 121409. [Google Scholar] [CrossRef]
- McNicol, L.C.; Bowen, J.M.; Ferguson, H.J. Adoption of precision livestock farming technologies has the potential to mitigate greenhouse gas emissions from beef production. Front. Sustain. Food Syst. 2024, 8, 1414858. [Google Scholar] [CrossRef]
- Yin, M.L.; Song, P.; Yan, W.F. How Does Network Infrastructure Construction Affect Livestock Carbon Emissions? Agriculture 2023, 13, 2244. [Google Scholar] [CrossRef]
- Liu, C.Y.; Wang, X.Y.; Bai, Z.M.; Wang, H.Y.; Li, C.X. Does digital technology application promote carbon emission efficiency in dairy farms? Evidence from China. Agriculture 2023, 13, 904. [Google Scholar] [CrossRef]
- Vlaicu, P.A.; Gras, M.A.; Untea, A.E.; Lefter, N.A.; Rotar, M.C. Advancing Livestock Technology: Intelligent Systemization for Enhanced Productivity, Welfare, and Sustainability. AgriEngineering 2024, 6, 1479–1496. [Google Scholar] [CrossRef]
- Zakirova, A.; Klychova, G.; Bukharbayeva, A.; Yusupova, A.; Gallyamov, E.; Mironova, M. Using digital technology to reduce the carbon footprint in livestock production. In International Scientific Conference on Agricultural Machinery Industry “Interagromash”; Springer International Publishing: Cham, Switzerland, 2022; pp. 2740–2749. [Google Scholar]
- Zhao, L.P.; Rao, X.; Lin, Q.W. Study of the impact of digitization on the carbon emission intensity of agricultural production in China. Sci. Total Environ. 2023, 903, 166544. [Google Scholar] [CrossRef]
- Liu, C.Y.; Shi, X.Y.; Li, C.X. Digital technology, factor allocation and environmental efficiency of dairy farms in China: Based on carbon emission constraint perspective. Sustainability 2023, 15, 15455. [Google Scholar] [CrossRef]
- Wang, W.; Mei, T.T. Research on the Effect of Digital Economy Development on the Carbon Emission Intensity of Agriculture. Sustainability 2024, 16, 1457. [Google Scholar] [CrossRef]
- Jiang, Q.; Li, J.Z.; Si, H.Y.; Su, Y.Y. The impact of the digital economy on agricultural green development: Evidence from China. Agriculture 2022, 12, 1107. [Google Scholar] [CrossRef]
- Chen, Z.W.; Tang, C. Impact of Digital Economy Development on Agricultural Carbon Emissions and Its Temporal and Spatial Effects. Sci. Tochnol. Manag. Res. 2023, 43, 137–146. [Google Scholar] [CrossRef]
- Xu, Y.B.; Li, C.X.; Wang, X.Y.; Wang, J.J. Digitalization, resource misallocation and low-carbon agricultural production: Evidence from China. Front. Environ. Sci. 2023, 11, 1117086. [Google Scholar] [CrossRef]
- Zilberman, D.; Wesseler, J. Building the Bioeconomy through Innovation, Monitoring and Science-based Policies. EuroChoices 2023, 22, 21–25. [Google Scholar] [CrossRef]
- Trigo, E.; Chavarria, H.; Pray, C.; Smyth, S.J.; Torroba, A.; Wesseler, J.; Zilberman, D.; Martinez, J.F. The Bioeconomy and Food System Transformation. Sci. Innov. Food Syst. Transform. 2023, 850, 849–868. [Google Scholar] [CrossRef]
- Avila, A.F.D.; Evenson, R.E. Total factor productivity growth in agriculture: The role of technological capital. Handb. Agric. Econ. 2010, 4, 3769–3822. [Google Scholar]
- Evenson, R.; Swanson, T. Technological Change and Technological Diffusion in Agricultural Development: How have Proprietary Rights Contributed. 2010, pp. 1–36. Available online: https://policydialogue.org/files/events/background-materials/Evenson_Swanson_Tech_Change_and_Diffusion_in_Ag_Dev.pdf (accessed on 3 July 2021).
- Zhang, H.S.; Guo, K.; Liu, Z.; Ji, Z.Y.; Yu, J.N. How has the rural digital economy influenced agricultural carbon emissions? Agricultural green technology change as a mediated variable. Front. Environ. Sci. 2024, 12, 1372500. [Google Scholar] [CrossRef]
- Jin, M.M.; Feng, Y.; Wang, S.K.; Chen, N.; Cao, F.P. Can the development of the rural digital economy reduce agricultural carbon emissions? A spatiotemporal empirical study based on China’s provinces. Sci. Total Environ. 2024, 939, 173437. [Google Scholar] [CrossRef] [PubMed]
- Chen, Y.H.; Li, M.J. How does the digital transformation of agriculture affect carbon emissions? Evidence from China’s provincial panel data. Humanit. Soc. Sci. Commun. 2024, 11, 713. [Google Scholar] [CrossRef]
- Guo, H.H. The agricultural carbon reduction effect of digital rural construction under the dual carbon target. PLoS ONE 2024, 19, e0299233. [Google Scholar] [CrossRef]
- Romer, P.M. Endogenous technological change. J. Political Econ. 1990, 98 Pt 2, S71–S102. [Google Scholar] [CrossRef]
- Romer, P.M. The origins of endogenous growth. J. Econ. Perspect. 1994, 8, 3–22. [Google Scholar] [CrossRef]
- Romer, P.M. Human capital and growth: Theory and evidence. Natl. Bur. Econ. Res. 1989. [Google Scholar] [CrossRef]
- Zhang, J.N.; Lyu, Y.W.; Li, Y.T.; Geng, Y. Digital economy: An innovation driving factor for low-carbon development. Environ. Impact Assess. Rev. 2022, 96, 106821. [Google Scholar] [CrossRef]
- Xu, L.; Wang, K.F. Research Review of Digital Economy Connotation and Measurement Index System. Stat. Decis. 2024, 40, 5–11. (In Chinese) [Google Scholar] [CrossRef]
- Li, Q.J.; Zhao, S.L.; Morley, B. The impact of digital economy development on industrial restructuring: Evidence from China. Sustainability 2023, 15, 10847. [Google Scholar] [CrossRef]
- Liu, F.; Yu, Z.C.; Deng, M.L. An Empirical Study on the Impact of Digital Economy Development on the Quality of Rural Revitalization. Sci. Technol. Prog. Policy 2024, 41, 47–57. (In Chinese) [Google Scholar] [CrossRef]
- Sun, Q.S. Three Models of Empowering Enterprises with Green Technology Innovation Efficiency through Digital Economy. Sci. Manag. Res. 2024, 42, 96–105. (In Chinese) [Google Scholar] [CrossRef]
- Wang, Q. Digital Economy, New Urbanization and Upgrading of Industrial Structure. J. Ind. Technol. Econ. 2023, 42, 73–81. (In Chinese) [Google Scholar] [CrossRef]
- Li, Z.G.; Wang, J. The dynamic impact of digital economy on carbon emission reduction: Evidence city-level empirical data in China. J. Clean. Prod. 2022, 351, 131570. [Google Scholar] [CrossRef]
- Wang, Q.M.; Yang, J.G. Research on digital new quality productivity and high-quality development of Chinese agriculture. J. Shanxi. Norm. Univ. (Philos. Soc. Sci. Ed.) 2023, 52, 62–71. (In Chinese) [Google Scholar] [CrossRef]
- Zhang, Y.Y. Challenges and solutions of high-quality development of Chinese animal husbandry—Based on the perspective of digital economy. Heilongjiang Anim. Sci. Vet. Med. 2023, 10, 6–11. (In Chinese) [Google Scholar] [CrossRef]
- Luo, S.Y.; Yimamu, N.; Li, Y.R.; Wu, H.T.; Irfan, M.; Hao, Y. Digitalization and sustainable development: How could digital economy development improve green innovation in China? Bus. Strategy Environ. 2023, 32, 1847–1871. [Google Scholar] [CrossRef]
- Niu, X.X.; Ma, Z.; Ma, W.J.; Yang, J.J.; Mao, T. The spatial spillover effects and equity of carbon emissions of digital economy in China. J. Clean. Prod. 2024, 434, 139885. [Google Scholar] [CrossRef]
- Hou, J.C.; Fu, Y. Study on the spillover effect of digital economy development on CO2 emissions. Front. Energy Res. 2024, 12, 135–8093. [Google Scholar] [CrossRef]
- Li, J.M.; Dong, K.Y.; Dong, X.C.; Shahbaz, M. How green trade influences pollution emissions in China: A provincial perspective. Energy Econ. 2022, 115, 106330. [Google Scholar] [CrossRef]
- Li, J.M.; Dong, K.Y.; Dong, X.C. Green energy as a new determinant of green growth in China: The role of green technological innovation. Energy Econ. 2022, 114, 106260. [Google Scholar] [CrossRef]
- Xu, Q.; Zhong, M.R. The impact of income inequity on energy consumption: The moderating role of digitalization. J. Environ. Manag. 2023, 325, 116464. [Google Scholar] [CrossRef]
- Cheng, J.J.; Wang, Q.; Zhang, H.M.; Matsubara, T.; Yoshikawa, N.; Yu, J. Does farm size expansion improve the agricultural environment? Evidence from apple farmers in China. Agriculture 2022, 12, 1800. [Google Scholar] [CrossRef]
- Xie, S.H.; Zhang, J.Z.; Li, X.J.; Xia, X.L.; Chen, Z. The effect of agricultural insurance participation on rural households’ economic resilience to natural disasters: Evidence from China. J. Clean. Prod. 2024, 434, 140123. [Google Scholar] [CrossRef]
- Cao, C.S.; Zheng, Q. Research on the Driving Effect of Digital Economy on Green Industrial Transformation. China Bus. Mark. 2023, 37, 34–50. (In Chinese) [Google Scholar] [CrossRef]
- Wu, J.Z.; Ge, Z.M.; Han, S.; Xing, L.W.; Zhu, M.S.; Zhang, J.; Liu, J.F. Impacts of agricultural industrial agglomeration on China’s agricultural energy efficiency: A spatial econometrics analysis. J. Clean. Prod. 2020, 260, 121011. [Google Scholar] [CrossRef]
- Li, Z.L.; Jin, M.H.; Cheng, J.W. Economic growth of green agriculture and its influencing factors in china: Based on emergy theory and spatial econometric model. Environ. Dev. Sustain. 2021, 23, 15494–15512. [Google Scholar] [CrossRef]
- Wang, J.; Zhu, J.; Luo, Q. Research on the Measurement of China’s Digital Economy Development and the Charateristics. J. Quant. Tech. Econ. 2021, 38, 26–42. (In Chinese) [Google Scholar] [CrossRef]
- Lin, Z.T.; Zhang, Y.R. Temporal and Spatial Differences and Influencing Factors of Green Total Factor Productivity of Animal Husbandry in China. J. Ecol. Rural Environ. 2023, 39, 1144–1157. (In Chinese) [Google Scholar] [CrossRef]
- Chen, W.H.; Qian, H.H.; Yan, G.Y. Effects of animal husbandry industry agglomeration on animal husbandry carbon emissions- Based on EKC and spatial spillover effect analysis. Heilongjiang Anim. Sci. Vet. Med. 2023, 20, 10–21. (In Chinese) [Google Scholar] [CrossRef]
- Chen, Y.P.; Liu, Y. The Mechanism of How Media Coverage Influences High-polluting Enterprises’ Green Technology Innovation-Based on the Mediating Effect of Government Environmental Regulation and Public Participation. Manag. Rev. 2023, 35, 111–122. [Google Scholar] [CrossRef]
- Wang, S.G. Digital Economy and High-quality Agricultural Development: Influence Effects and Action Paths. Stat. Decis. 2024, 40, 21–26. (In Chinese) [Google Scholar] [CrossRef]
- Fan, G.; Wang, X.L.; Ma, G.R. Contribution of Marketization to China’s Economic Growth. Econ. Res. J. 2011, 46, 4–16. (In Chinese) [Google Scholar]
- Zhang, L.; Liu, C.F. How Can Digital Financial Inclusion Revitalize Rural Industries. J. Guizhou. Univ. Financ. Econ. 2024, 42, 41–51. (In Chinese) [Google Scholar]
- Zhang, Z.P.; Sun, C.; Wang, J. How can the digital economy promote the integration of rural industries—Taking China as an example. Agriculture 2023, 13, 2023. [Google Scholar] [CrossRef]
- Tian, Y.; Cai, Y.R.; Zhang, H.J. The impact of digital economy on agriculture carbon emission efficiency: Based on threshold effect and spatial spillover effect test. J. Agrotech. Econ. 2024. [Google Scholar] [CrossRef]
- Zhou, H.J.; Xu, G.Y. Research on the impact of green finance on China’s regional ecological development based on system GMM model. Resour. Policy 2022, 75, 102454. [Google Scholar] [CrossRef]
- Sun, J.B.; Wu, X.H. Digital Economy, Energy Structure and Carbon Emissions: Evidence from China. SAGE Open 2024, 14, 21582440241255756. [Google Scholar] [CrossRef]
- Zhang, W.; Liu, X.M.; Wang, D.; Zhou, J.P. Digital economy and carbon emission performance: Evidence at China’s city level. Energy Policy 2022, 165, 112927. [Google Scholar] [CrossRef]
- Li, C.Y.; Zhou, W.S. Can digital economy development contribute to urban carbon emission reduction?-Empirical evidence from China. J. Environ. Manag. 2024, 357, 120680. [Google Scholar] [CrossRef]
- Huang, H.Q.; Yu, Y.Z.; Zhang, S.L. Internet development and productivity growth in manufacturing industry: Internal mechanism and China experiences. China. Ind. Econ. 2019, 8, 5–23. (In Chinese) [Google Scholar] [CrossRef]
- Gao, X. An Empirical Test of the Development of Digital Economy Enabling Common Affluence. Stat. Decis. 2023, 39, 11–16. [Google Scholar] [CrossRef]
- Lesage, J.; Pace, R.K. Introduction to Spatial Econometrics; Chapman Hall/CRC: Boca Raton, FL, USA, 2009. [Google Scholar] [CrossRef]
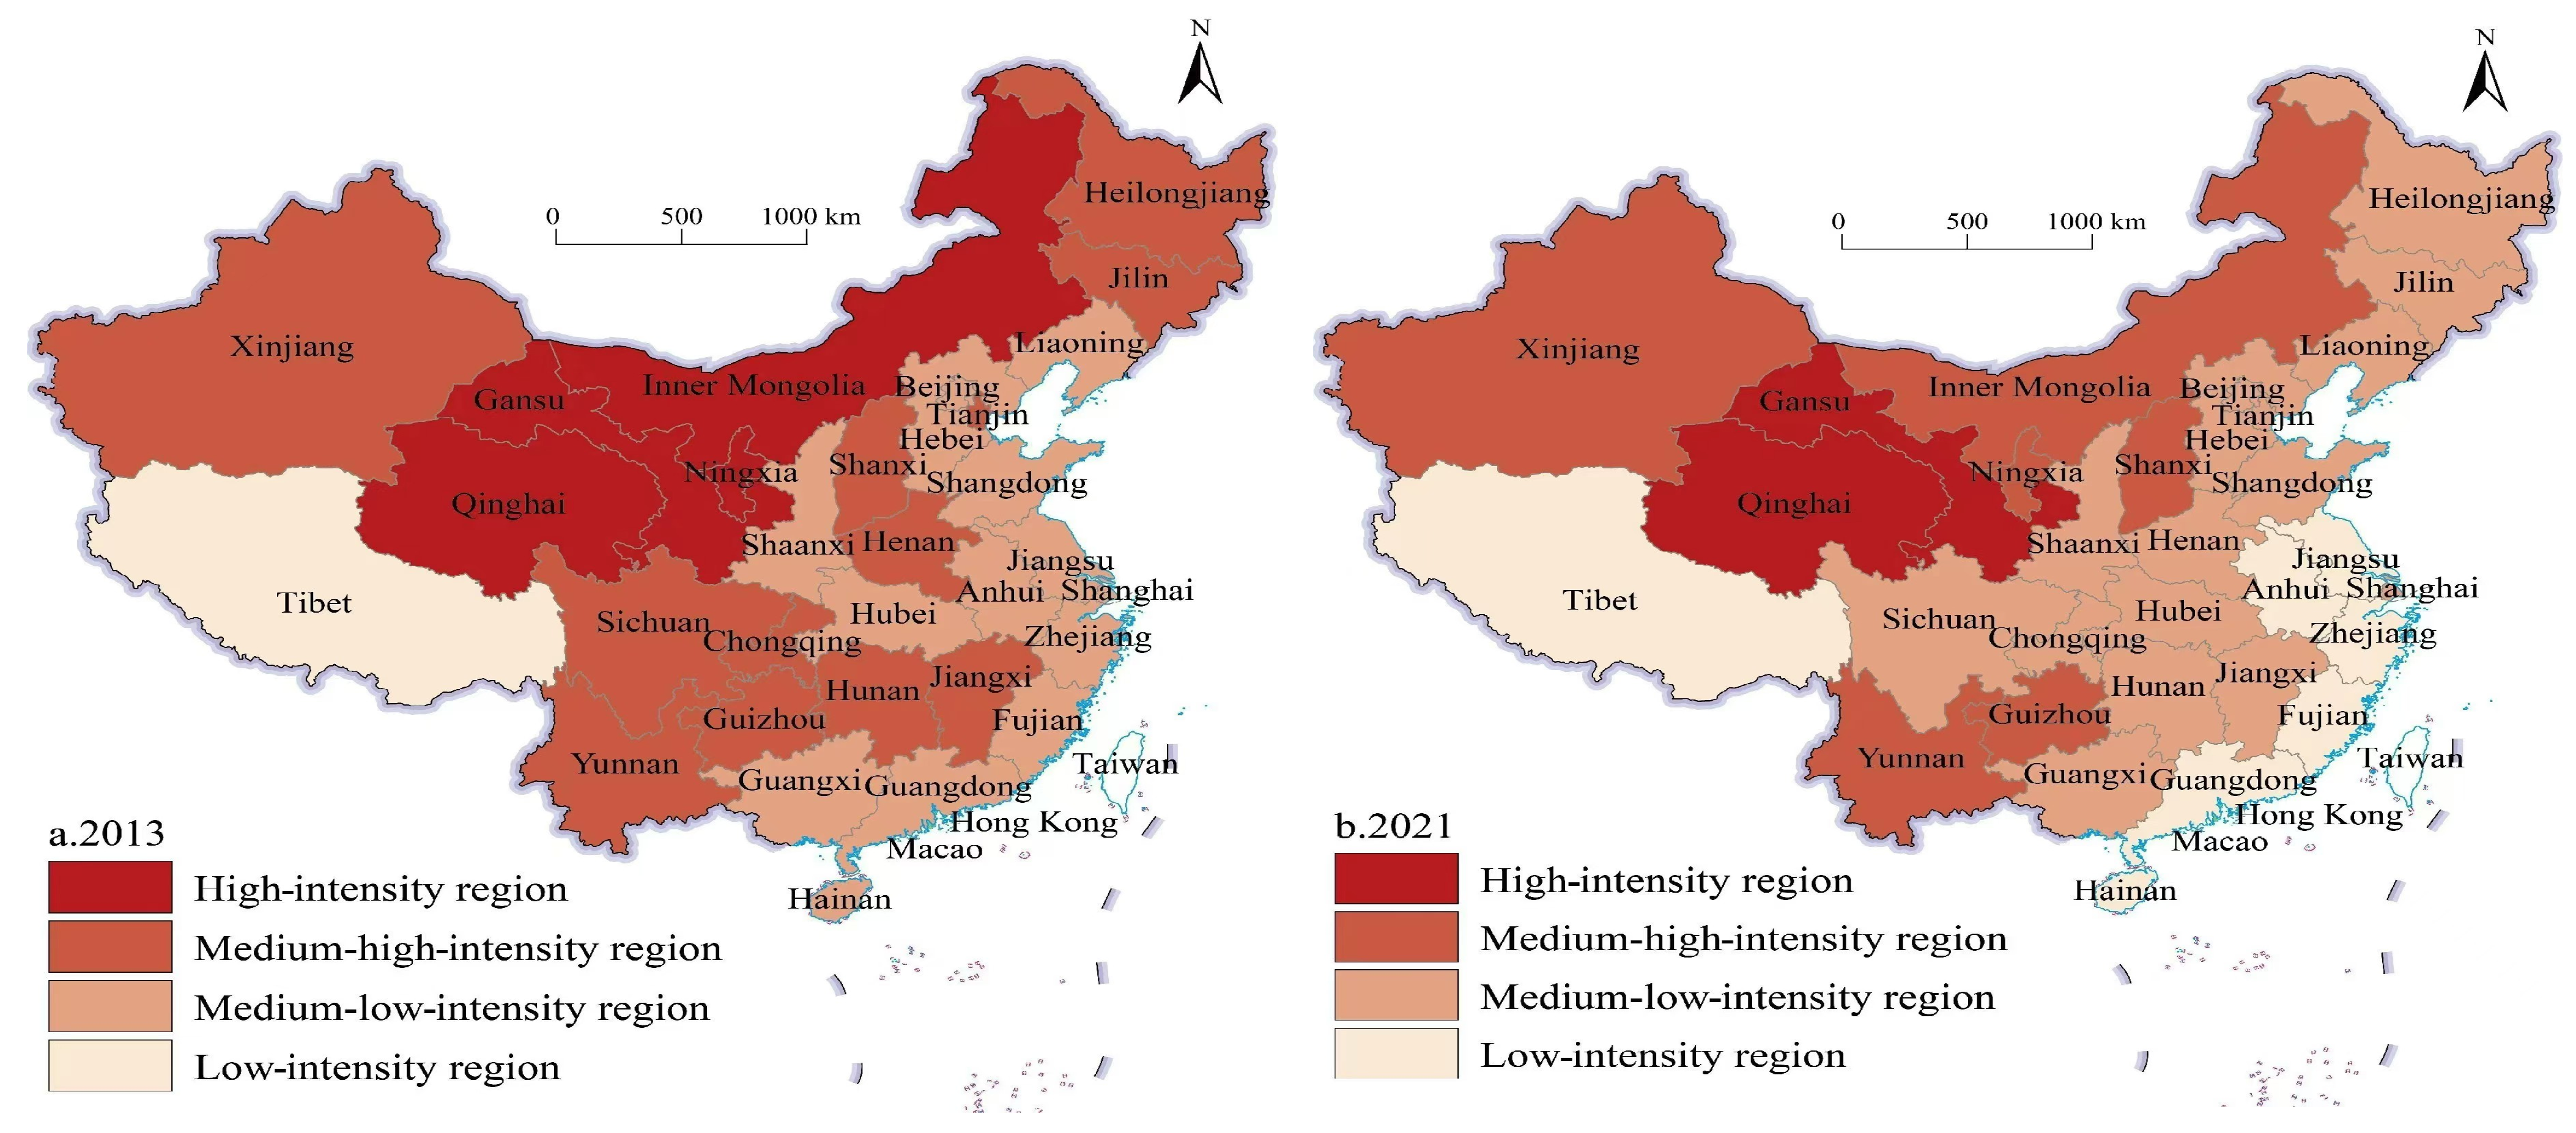
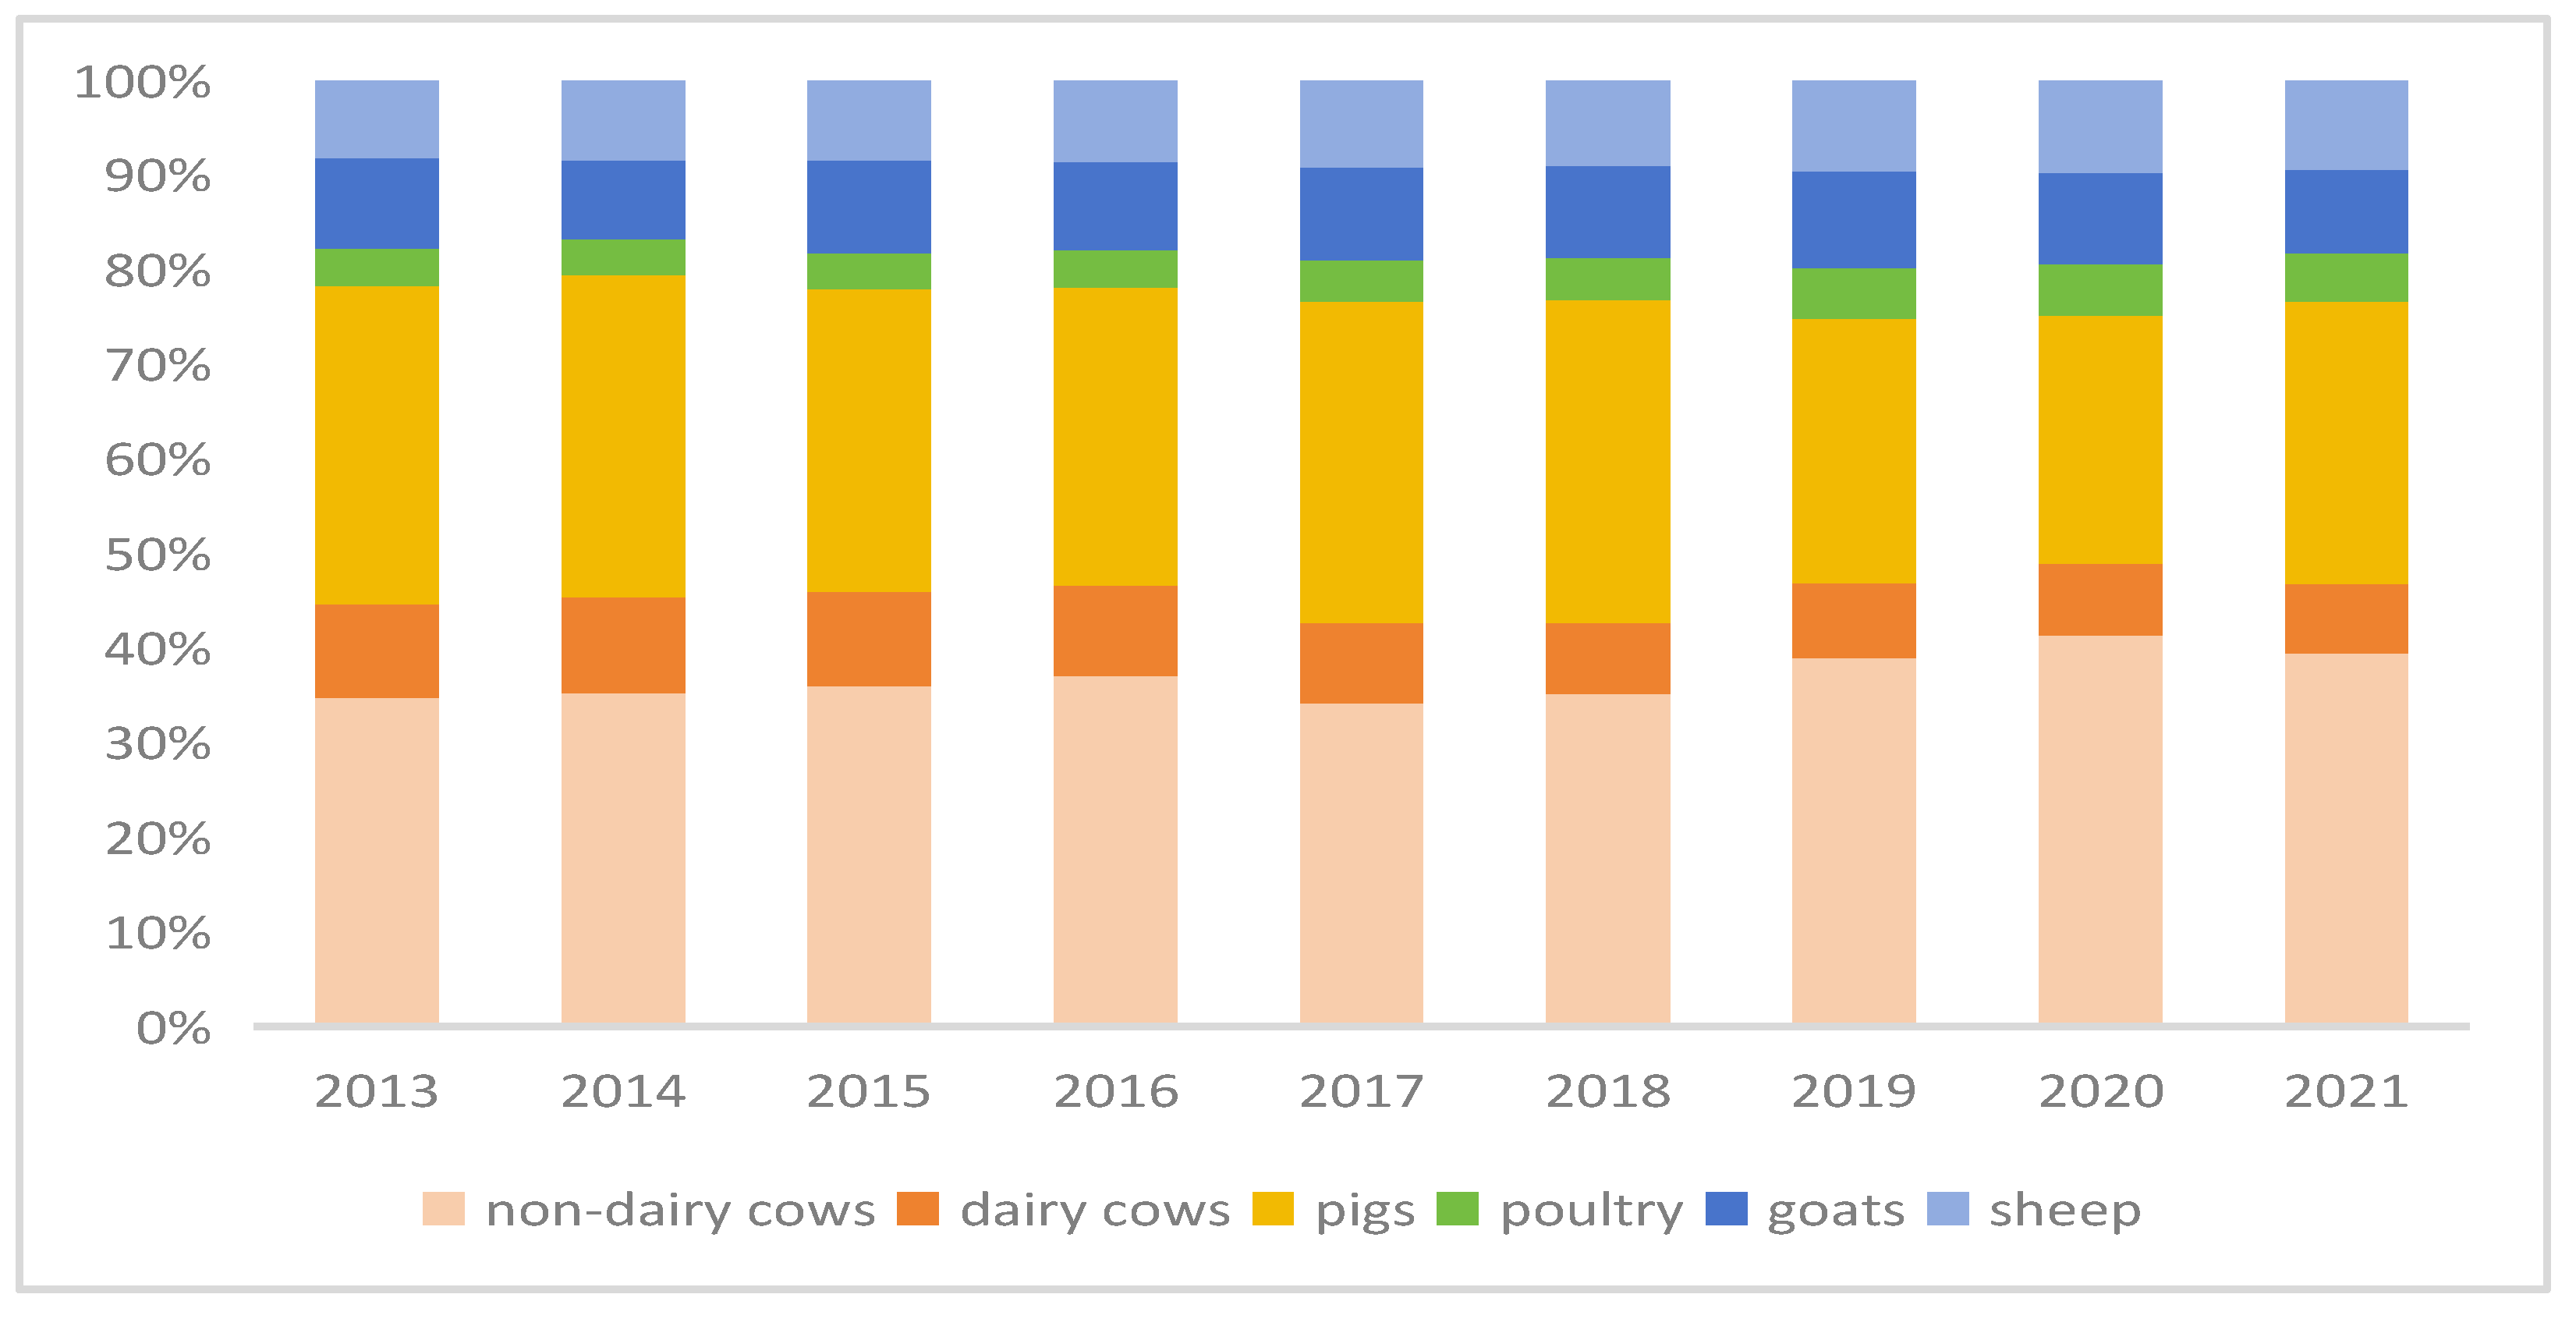
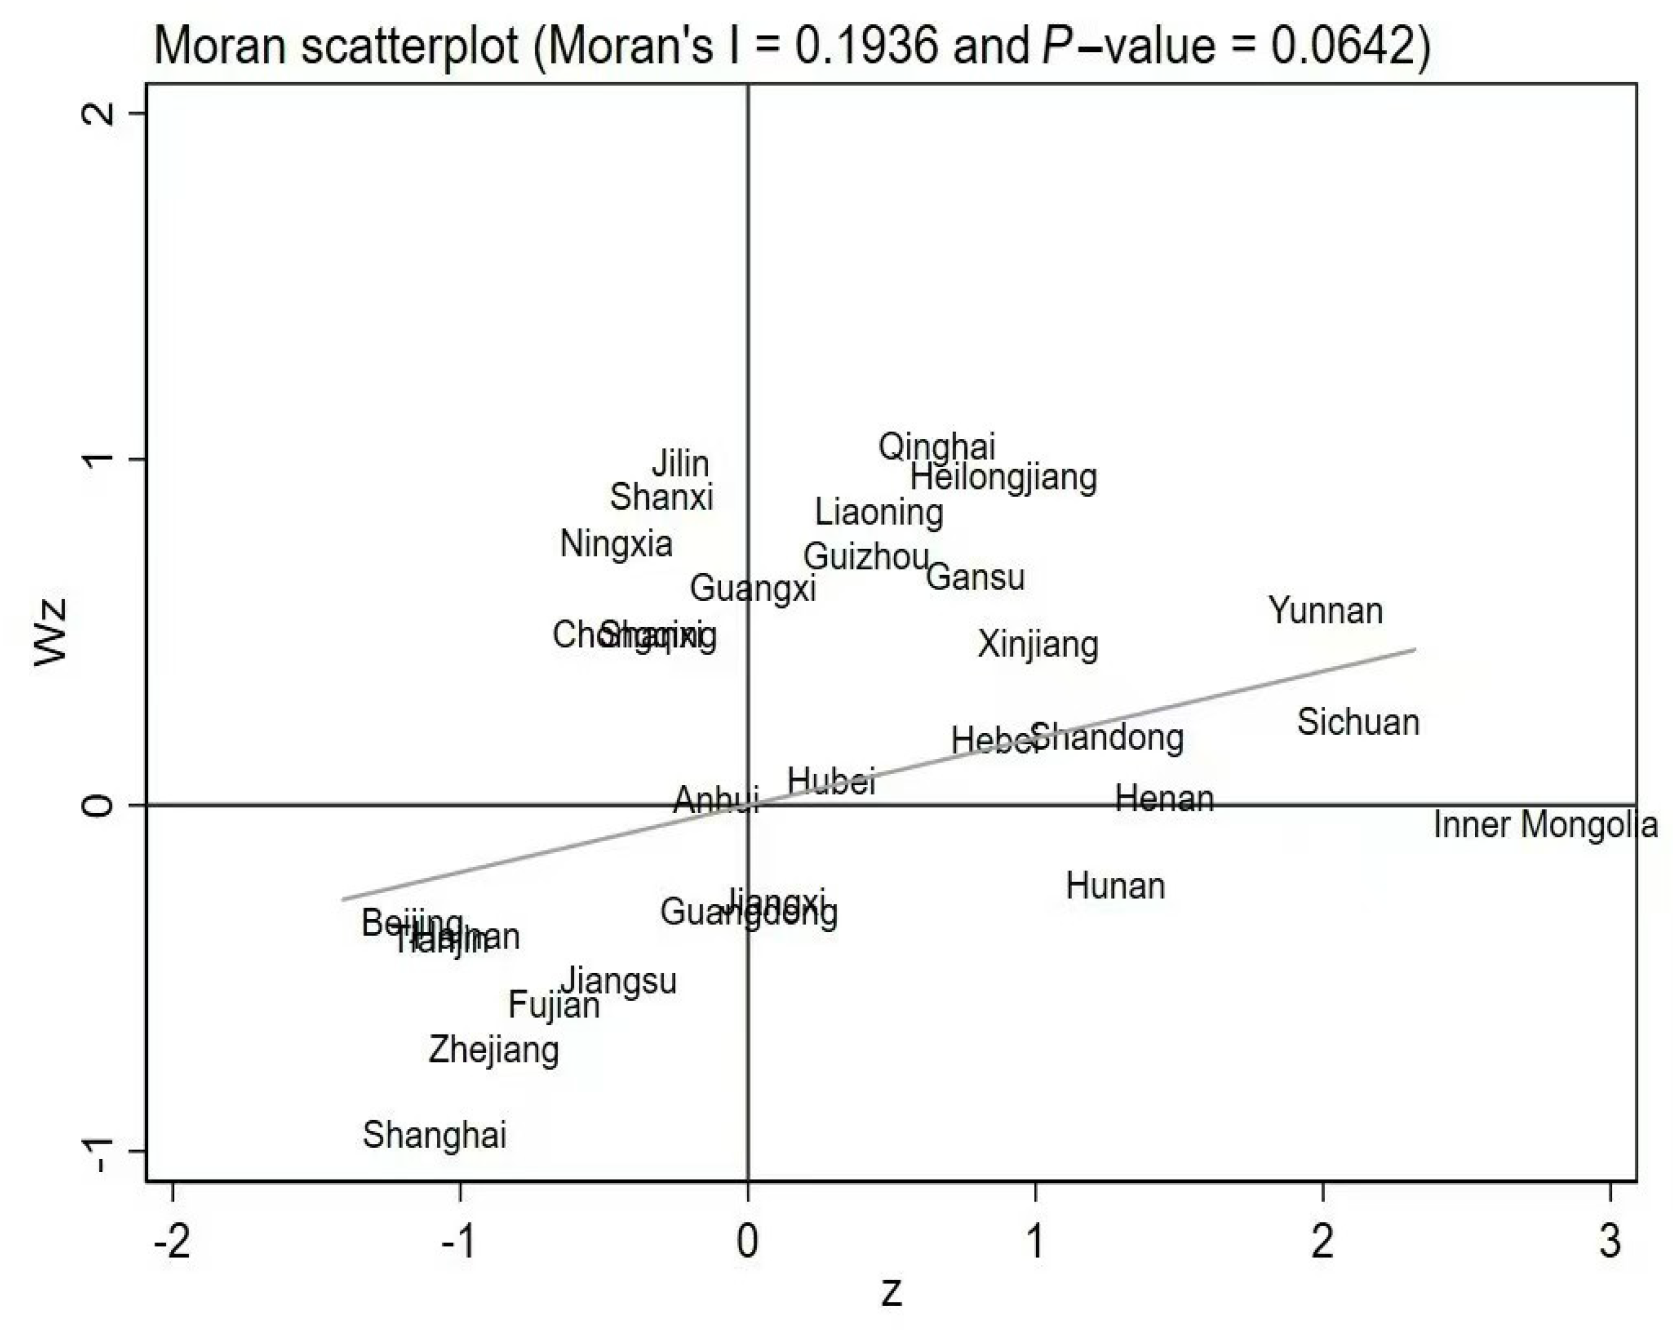
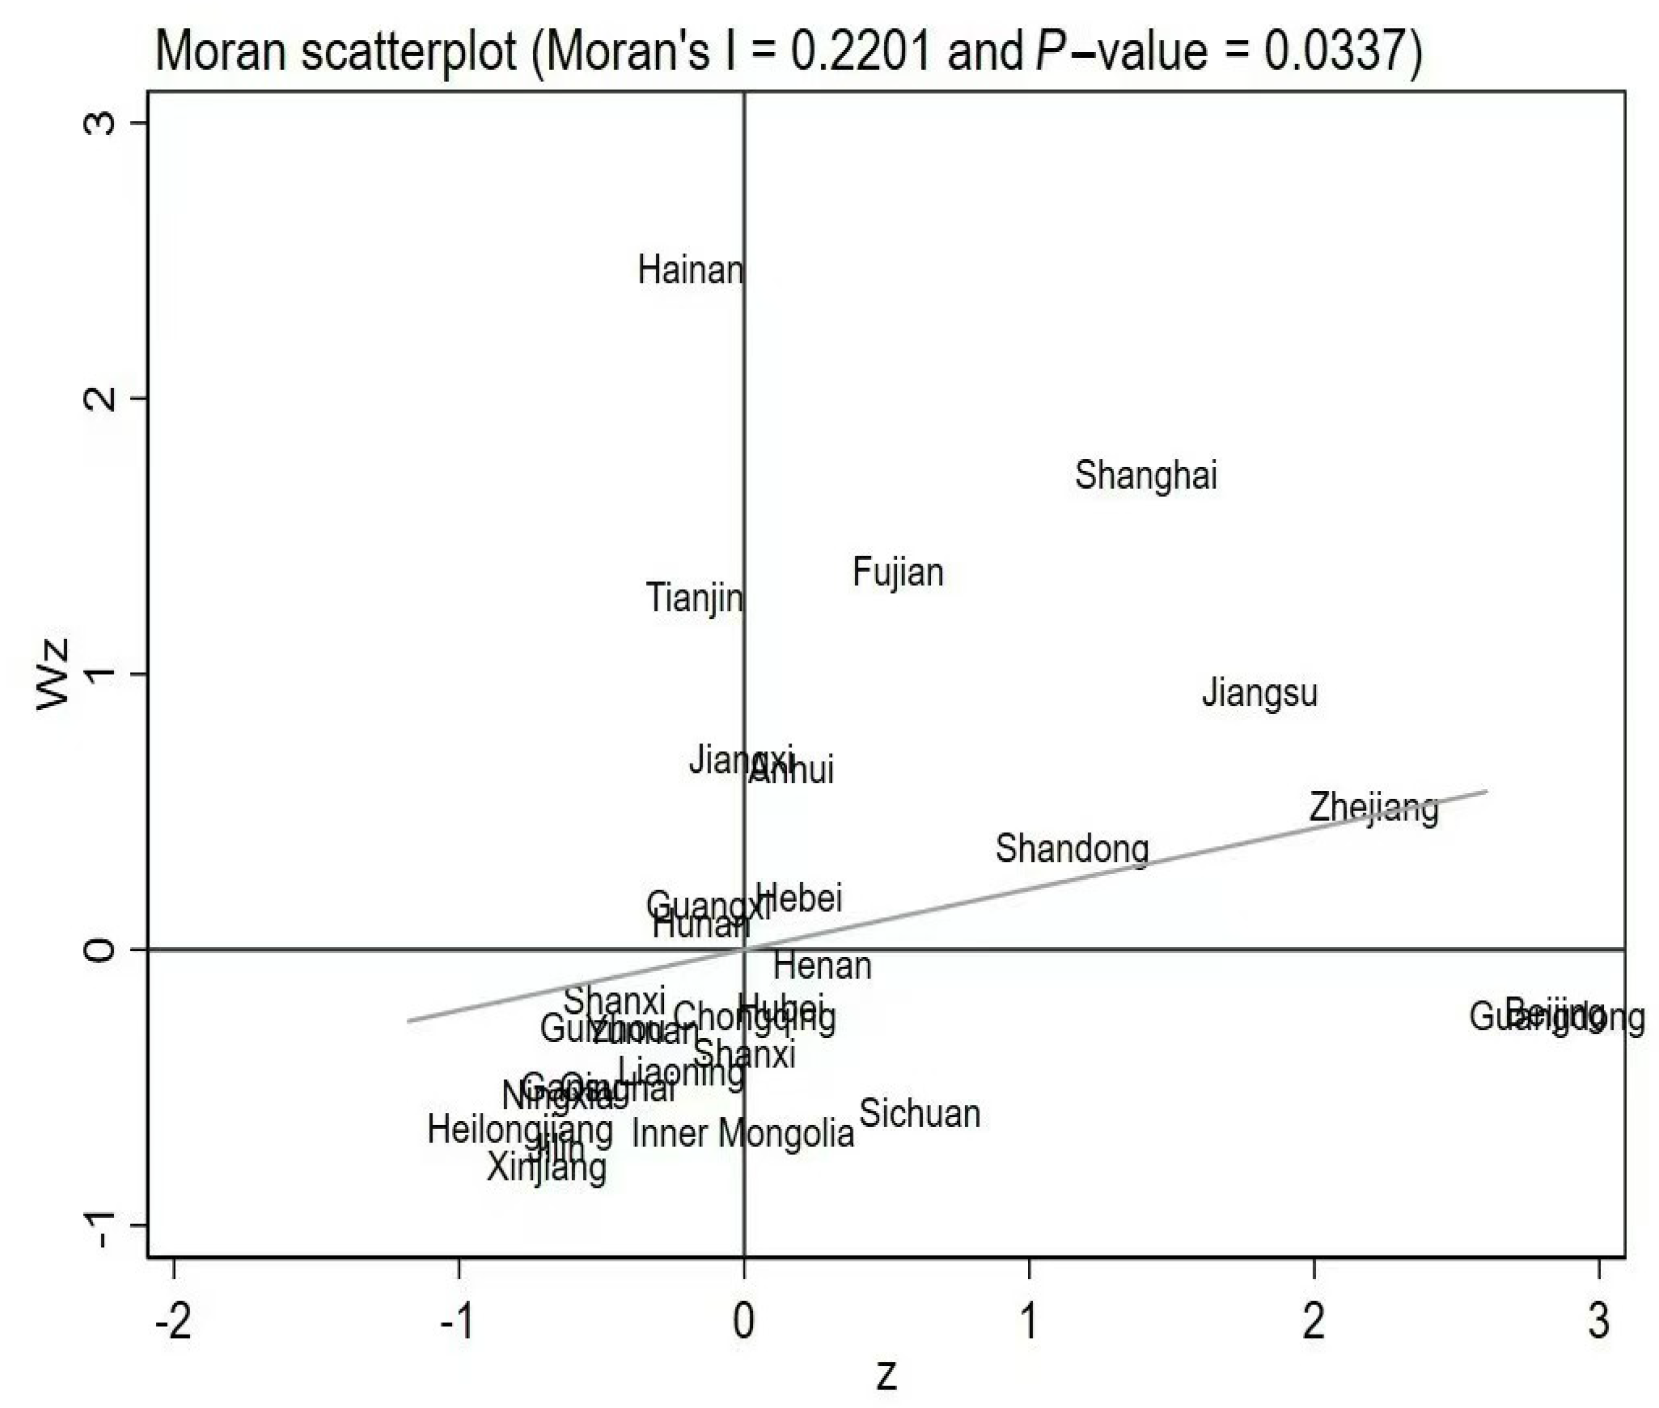
Disclaimer/Publisher’s Note: The statements, opinions and data contained in all publications are solely those of the individual author(s) and contributor(s) and not of MDPI and/or the editor(s). MDPI and/or the editor(s) disclaim responsibility for any injury to people or property resulting from any ideas, methods, instructions or products referred to in the content. |
© 2024 by the authors. Licensee MDPI, Basel, Switzerland. This article is an open access article distributed under the terms and conditions of the Creative Commons Attribution (CC BY) license (https://creativecommons.org/licenses/by/4.0/).