Abstract
The detection of the impurity rate in machine-picked seed cotton is crucial for precision agriculture. This study proposes a novel Cotton-YOLO-Seg cotton-impurity instance segmentation algorithm based on the you only look once version 8 small segmentation model (Yolov8s-Seg). The algorithm achieves precise pixel-level segmentation of cotton and impurities in seed cotton images and establishes a detection model for the impurity rate, enabling accurate detection of the impurity rate in machine-picked cotton. The proposed algorithm removes the Pyramid 4 (P4) feature layer and incorporates Multi-Scale Convolutional Block Attention (MSCBCA) that integrates the Convolutional Block Attention Module (CBAM) and Multi-Scale Convolutional Attention (MSCA) into the Faster Implementation of Cross Stage Partial Bottleneck with 2 Convolutions (C2f) module of the feature extraction network, forming a novel C2f_MSCBCA module. The SlimNeck structure is introduced in the feature fusion network by replacing the P4 feature layer with the small-target detection layer Pyramid 2 (P2). Additionally, transfer learning is employed using the Common Objects in Context (COCO) instance segmentation dataset. The analysis of 100 groups of cotton image samples shows that the Mean Absolute Error (MAE), Root Mean Square Error (RMSE), and Mean Absolute Percentage Error (MAPE) for impurity rate detection are 0.29%, 0.33%, and 3.70%, respectively, which are reduced by 52.46%, 48.44%, and 53.75% compared to the Yolov8s-seg model. The Precision (P), Recall (R), and mean Average Precision at an intersection over union of 0.5 (mAP@0.5) are 85.4%, 78.4%, and 80.8%, respectively, which are improved by 4.2%, 6.2%, and 6.4% compared to Yolov8s-seg model, significantly enhancing the segmentation performance of minor impurities. The Cotton-YOLO-Seg model demonstrates practical significance for precisely detecting the impurity rate in machine-picked seed cotton.
1. Introduction
Cotton is a vital agricultural and strategic commodity worldwide [1]. In 2023, Xinjiang’s cotton sown area reached 2.37 million hectares, with a production output of 5.11 million tons, representing 91% of China’s total cotton production. Mechanized cotton harvesting has become the mainstream trend, with the machine harvesting rate in the Xinjiang region surpassing 85%. However, machine-picked seed cotton contains significant impurities, with an uneven size and mass distribution. The impurity rate of machine-picked seed cotton is a crucial indicator for evaluating the quality of cotton harvesting and grading. Quantitative detection of the impurity rate in machine-picked seed cotton can reflect the harvesting performance of the cotton picker and guide subsequent operations, such as cotton purchasing, processing, and grading [2,3].
The primary methods for quantitatively detecting the impurity rate of cotton include the manual separation and measurement of impurities, mechanical separation using raw cotton impurity analyzers [4], spectral analysis [3,5], and machine vision detection [6,7]. Manual separation and measurement are time-consuming and subjective. The method using raw cotton impurity analyzers is the current standardized approach for measuring the cotton impurity rate. However, it has limited cleaning efficiency, is costly, and can easily damage the cotton fibers [3,5,8]. The spectral analysis involves extracting spectral features using a spectrometer, followed by the analysis, processing, and modeling of the spectra. This method requires a high level of expertise from the operator [3]. Machine vision detection is characterized by high accuracy, fast detection speed, and versatility. By segmenting impurities in cotton images and calculating the impurity rate [1], it has been widely used in various agricultural fields, including fish [9,10], fruits [11,12,13], vegetables [14,15,16], beans, and grains [17,18,19]. Few studies directly employ machine vision technology to detect the impurity rate in machine-harvested seed cotton. Most existing research relies on traditional image-processing and convolution-based deep learning methods for detecting and classifying impurities in machine-picked seed cotton [3,6,7]. Traditional image-processing methods involve converting cotton images into a specific color space, setting segmentation thresholds to extract features, and separating impurities from the cotton images. Taylor [20,21] utilized video impurity scanners to measure the area and quantity of impurities in cotton and subsequently graded the cotton quality based on the impurity content. Wan et al. [4] used Red–Green–Blue (RGB) double-sided imaging technology to obtain the impurity pixel area in seed cotton sample images and established a correlation model between the impurity pixel area and the impurity quality, enabling accurate detection of impurity rate in machine-picked seed cotton. Zhang et al. [8] proposed a method that combines the Genetic Algorithm-Support Vector Machine (GA-SVM) classification technique with morphological segmentation to segment impurities in machine-picked seed cotton images. Li et al. [1] achieved seed cotton grading by evaluating the color of seed cotton using machine vision technology. Yang et al. [22,23] identified and segmented foreign fibers in cotton images using Otsu’s method (Otsu) combined with morphological-processing methods. Traditional image-processing methods rely on manual feature selection, which necessitates complex preprocessing operations on the original image. Additionally, the selected features often lack robustness and the ability to generalize to environmental changes. Due to the limitations of manual feature-extraction techniques, lower-dimensional feature information is typically obtained. This makes it challenging to adequately capture and distinguish the high-dimensional key features necessary for recognizing impurities in complex backgrounds [24,25]. Additionally, the method struggles with segmenting impurities in machine-picked seed cotton images, requiring significant human intervention and reliance on expert experience.
Convolutional neural networks (CNNs) can autonomously extract high-dimensional features and excel at segmenting regions of interest in complex background images [24,25,26]. Zhang et al. [6,7] combined traditional image-segmentation techniques with the you only look once (YOLO) detection algorithm, employing a multi-channel fusion Otsu algorithm and an improved Canny algorithm to segment impurities in cotton images. The YOLO model was then used to classify and recognize both cotton and impurities. Wei et al. [27] improved the U-shaped Network (U-Net) model to segment raw foreign cotton fibers in cotton images, achieving a Root Mean Square Error (RMSE) of 4% between the predicted and actual sizes. Li et al. [28] proposed the Cotton-YOLO model for detecting and classifying foreign fibers in cotton images by integrating ConvNext and SwinTransformer modules based on Yolov7. The detection accuracy improved from 94.53% to 96.14% compared to the baseline model. Xu et al. [29] utilized a high-speed Charge-Coupled Device (CCD) camera to capture images of cotton stream. They detected and classified foreign impurities using the WFF-YOLO model, which incorporated a Weighted Feature Fusion (WFF) strategy and employed a decoupled detector head without anchor frames based on YOLO v4-tiny. The foreign impurity detection achieved an accuracy of 98.0%. Deep learning algorithms exhibit significant advantages over traditional image-processing methods for detecting impurities in machine-picked seed cotton. These advantages include higher detection accuracy, faster detection speeds, greater robustness, and generalization capabilities in response to environmental changes [29]. The above research primarily focuses on detecting and segmenting sizable foreign fibers in cotton images, with fewer studies on directly using instance-segmentation methods to segment minute impurities in machine-picked seed cotton and calculate the impurity rate, and the aforementioned algorithms are difficult to segment small impurities in machine-picked seed cotton.
Machine-picked seed cotton exhibits a high impurity rate, characterized by small-sized impurities that are diverse in type and randomly distributed. This complexity makes detecting and segmenting impurities in cotton images particularly challenging, especially for small-target impurities [5,8]. Zhang et al. [30,31] enhanced the feature-extraction capability for small targets by incorporating an attention mechanism and a small target detection layer into the YOLO network. Zhu et al. [32] improved feature information fusion by incorporating a Path Aggregation Network with Bi-directional Feature Pyramid (Bi-PAN) structure with bi-directional feature connectivity, compensating for the loss of target features and positional information caused by network deepening. Tian et al. [33] employed the Densely Connected Convolutional Network (DenseNet) architecture, integrating data augmentation techniques and an Adaptive Attention Module (AAM) to enhance the extraction and fusion capabilities for small target features. The aforementioned improvement strategy for small-target-dense object detection broadens the scope for optimizing the network model discussed in this study.
This study employs an instance-segmentation method based on deep convolutional neural networks to segment small-target impurities in machine-picked cotton images and utilize the mask pixel areas of cotton and impurities to calculate the impurity rate. There are currently two primary algorithmic approaches to instance segmentation using deep convolutional neural networks. The first is a two-stage instance segmentation algorithm characterized by high detection accuracy but slower speed, typically represented by a Mask Region-based Convolutional Neural Network (Mask R-CNN) [34]. The second is a one-stage instance segmentation algorithm, which offers slightly lower detection accuracy compared to the two-stage algorithm but operates several times faster, enabling real-time detection. This approach is typically represented by You Only Look At Coefficients (YOLACT) [35] and YOLO-Seg. This study chooses Yolov8-Seg as the foundational model owing to its optimal balance between detection accuracy and speed. Its compact model size makes it suitable for deployment on devices with limited computational resources.
2. Materials and Methods
2.1. Datasets for Machine-Picked Seed Cotton
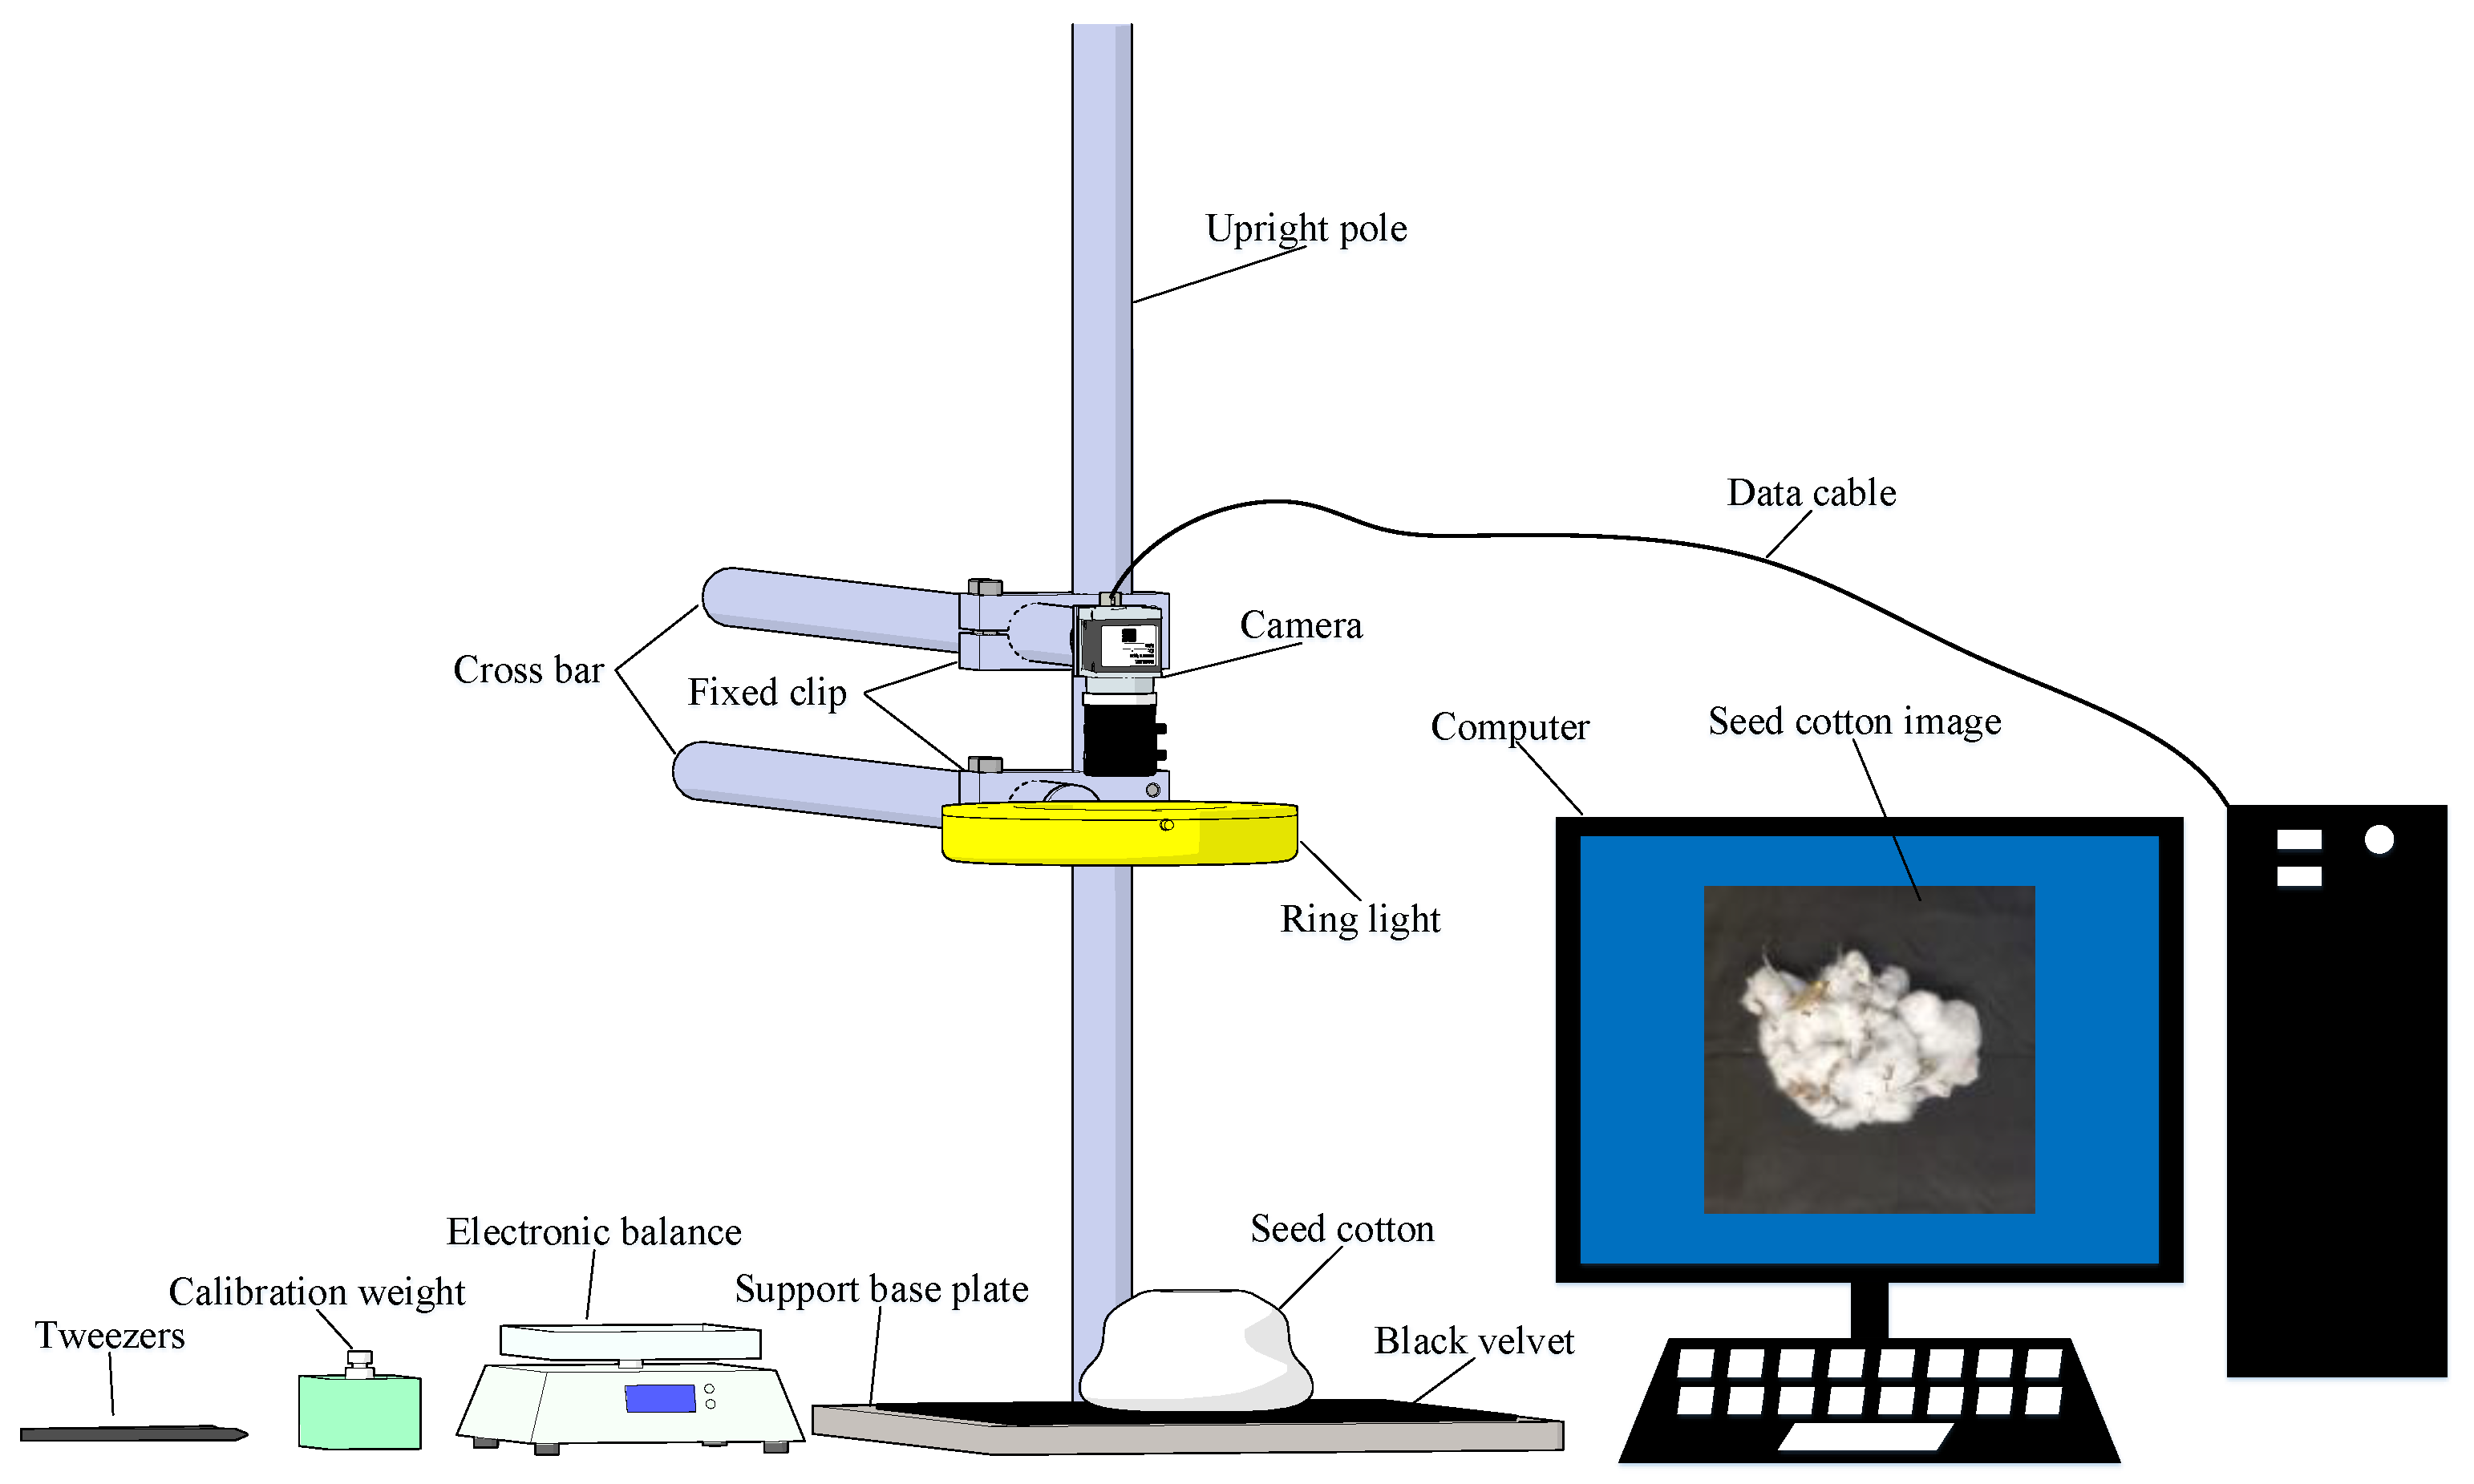
The image acquisition of machine-picked seed cotton is conducted using a portable mobile camera mounted on a bracket for vertical downward-shooting. Figure 1 illuminates the image-acquisition system, which consists of a computer, a camera (Xiaomi Corporation, Beijing, China), a light source (CRENOV, Shenzhen, China), a height-adjustable operating platform, pieces of seed cotton (Shihezi, China), tweezers, electronic balance (CHANGXIE, Dongguan, China), and calibration weight. The seed cotton is placed in its natural state on top of black velvet on the base plate. The shooting distance is approximately 0.25 m directly above the seed cotton. Illumination is provided by a 26 cm diameter, 10 W ring-shaped Light Emitting Diode (LED) white light source. The images are captured using a 12-megapixel rear wide-angle lens of the XiaoMI8 phone, featuring a 4 mm focal length, an aperture set at f/1.8, an exposure time of 1/50 s, and stored in the Joint Photographic Experts Group (JPG) format.

Figure 1.
Schematic diagram of image collection.
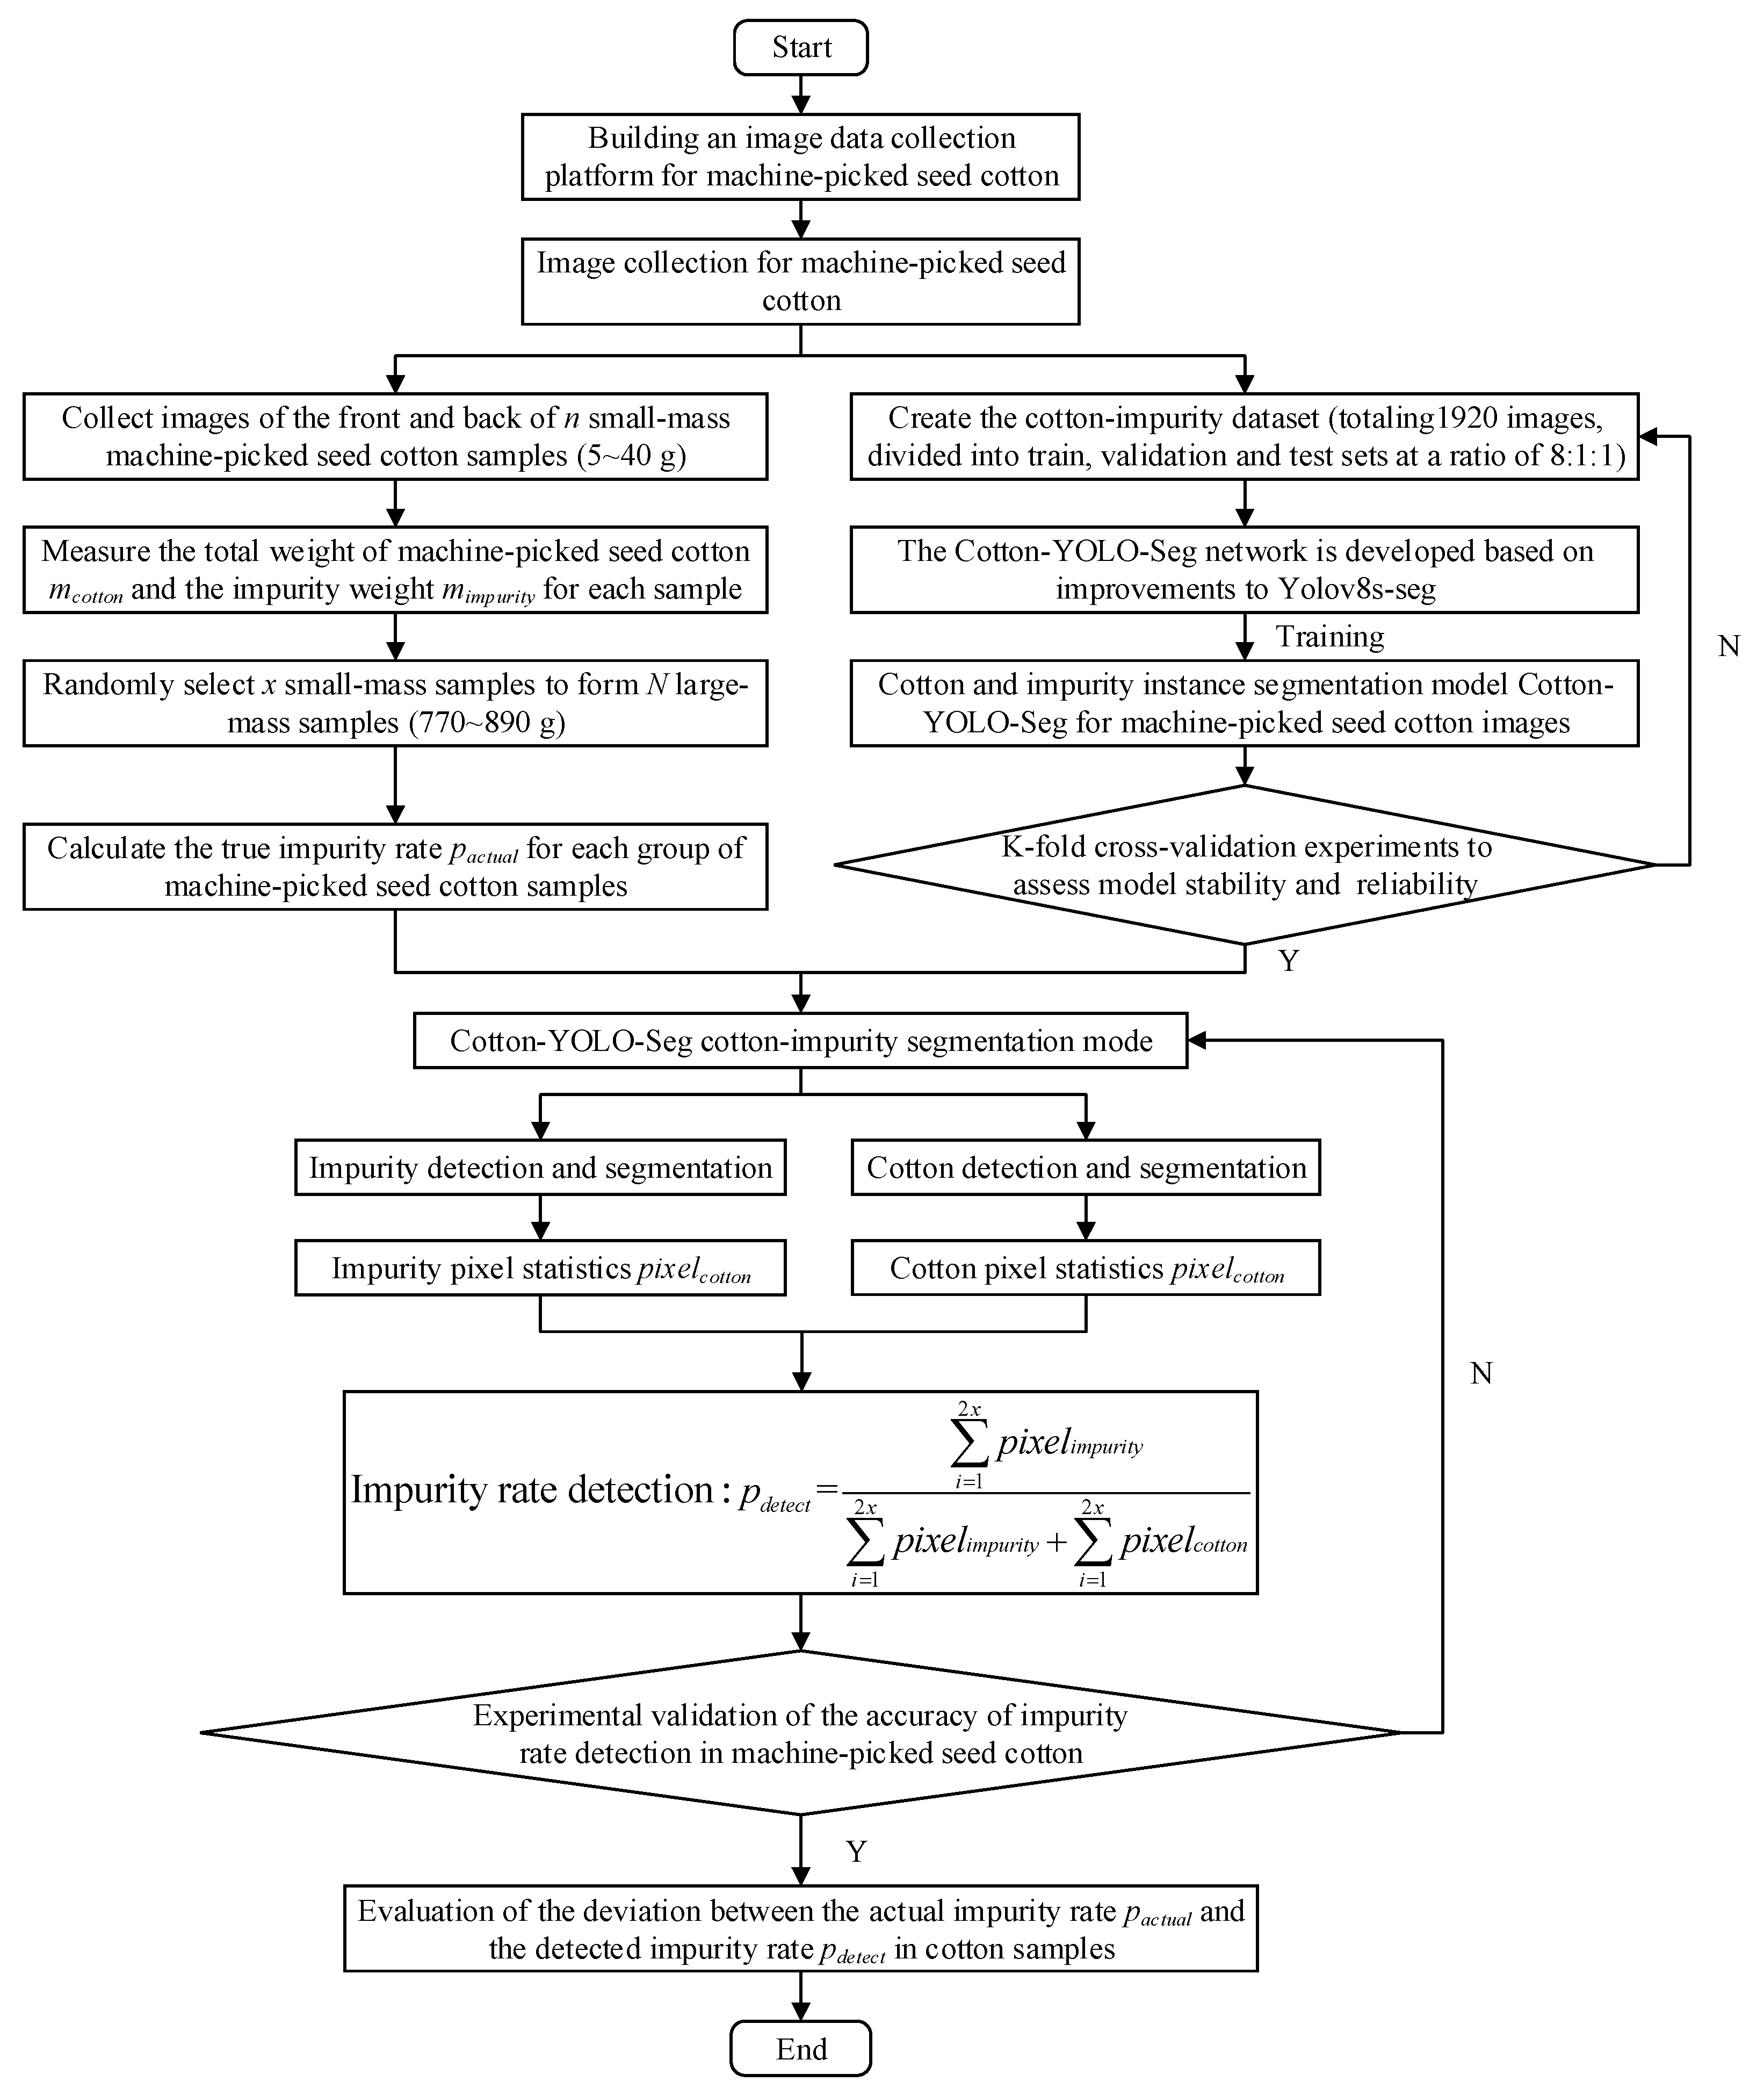
In this study, the actual impurity rate of machine-picked seed cotton samples is measured using manual separation of impurities. Randomly selected samples of machine-picked seed cotton are used, with each sample’s weight and impurity rate being randomized. The mass of each sample is in the range of 5~40 g. In this study, n cotton image samples (n = 100) are captured using an image-collection device. Each cotton sample is photographed from both the front and back, yielding two images per sample. After capturing each image, the images are manually numbered. The total weight of the machine-picked seed cotton samples mcotton is measured using a calibrated electronic balance with a range of 0~500 g and an accuracy of 0.01 g. The impurities in the machine-picked seed cotton samples are manually removed using tweezers. The mass of these impurities mimpurity is then measured with a calibrated electronic balance. This process allows for the determination of the actual impurity rate of the cotton samples.
Owing to the limited cotton quality in each individual machine-picked seed cotton sample, it is necessary to increase the quality of these samples and reduce the randomness of impurity rates caused by different types and densities of impurities. In this study, x samples are randomly selected to form a new sample group (x = 50), divided into a total of N groups of machine-picked seed cotton samples (N = 100). The total cotton mass of each group in in the range of 770~890 g, significantly increasing the sample capacity and enhancing the accuracy of impurity rate detection. The actual impurity rate pactual for each set of samples is given in Equation (1):
The detected impurity rate pdetect for each set of samples is computed and shown in Formula (2), where the number of impurity pixels pixelimpurity and the number of cotton pixels pixelcotton are calculated for each image using the segmentation algorithm.
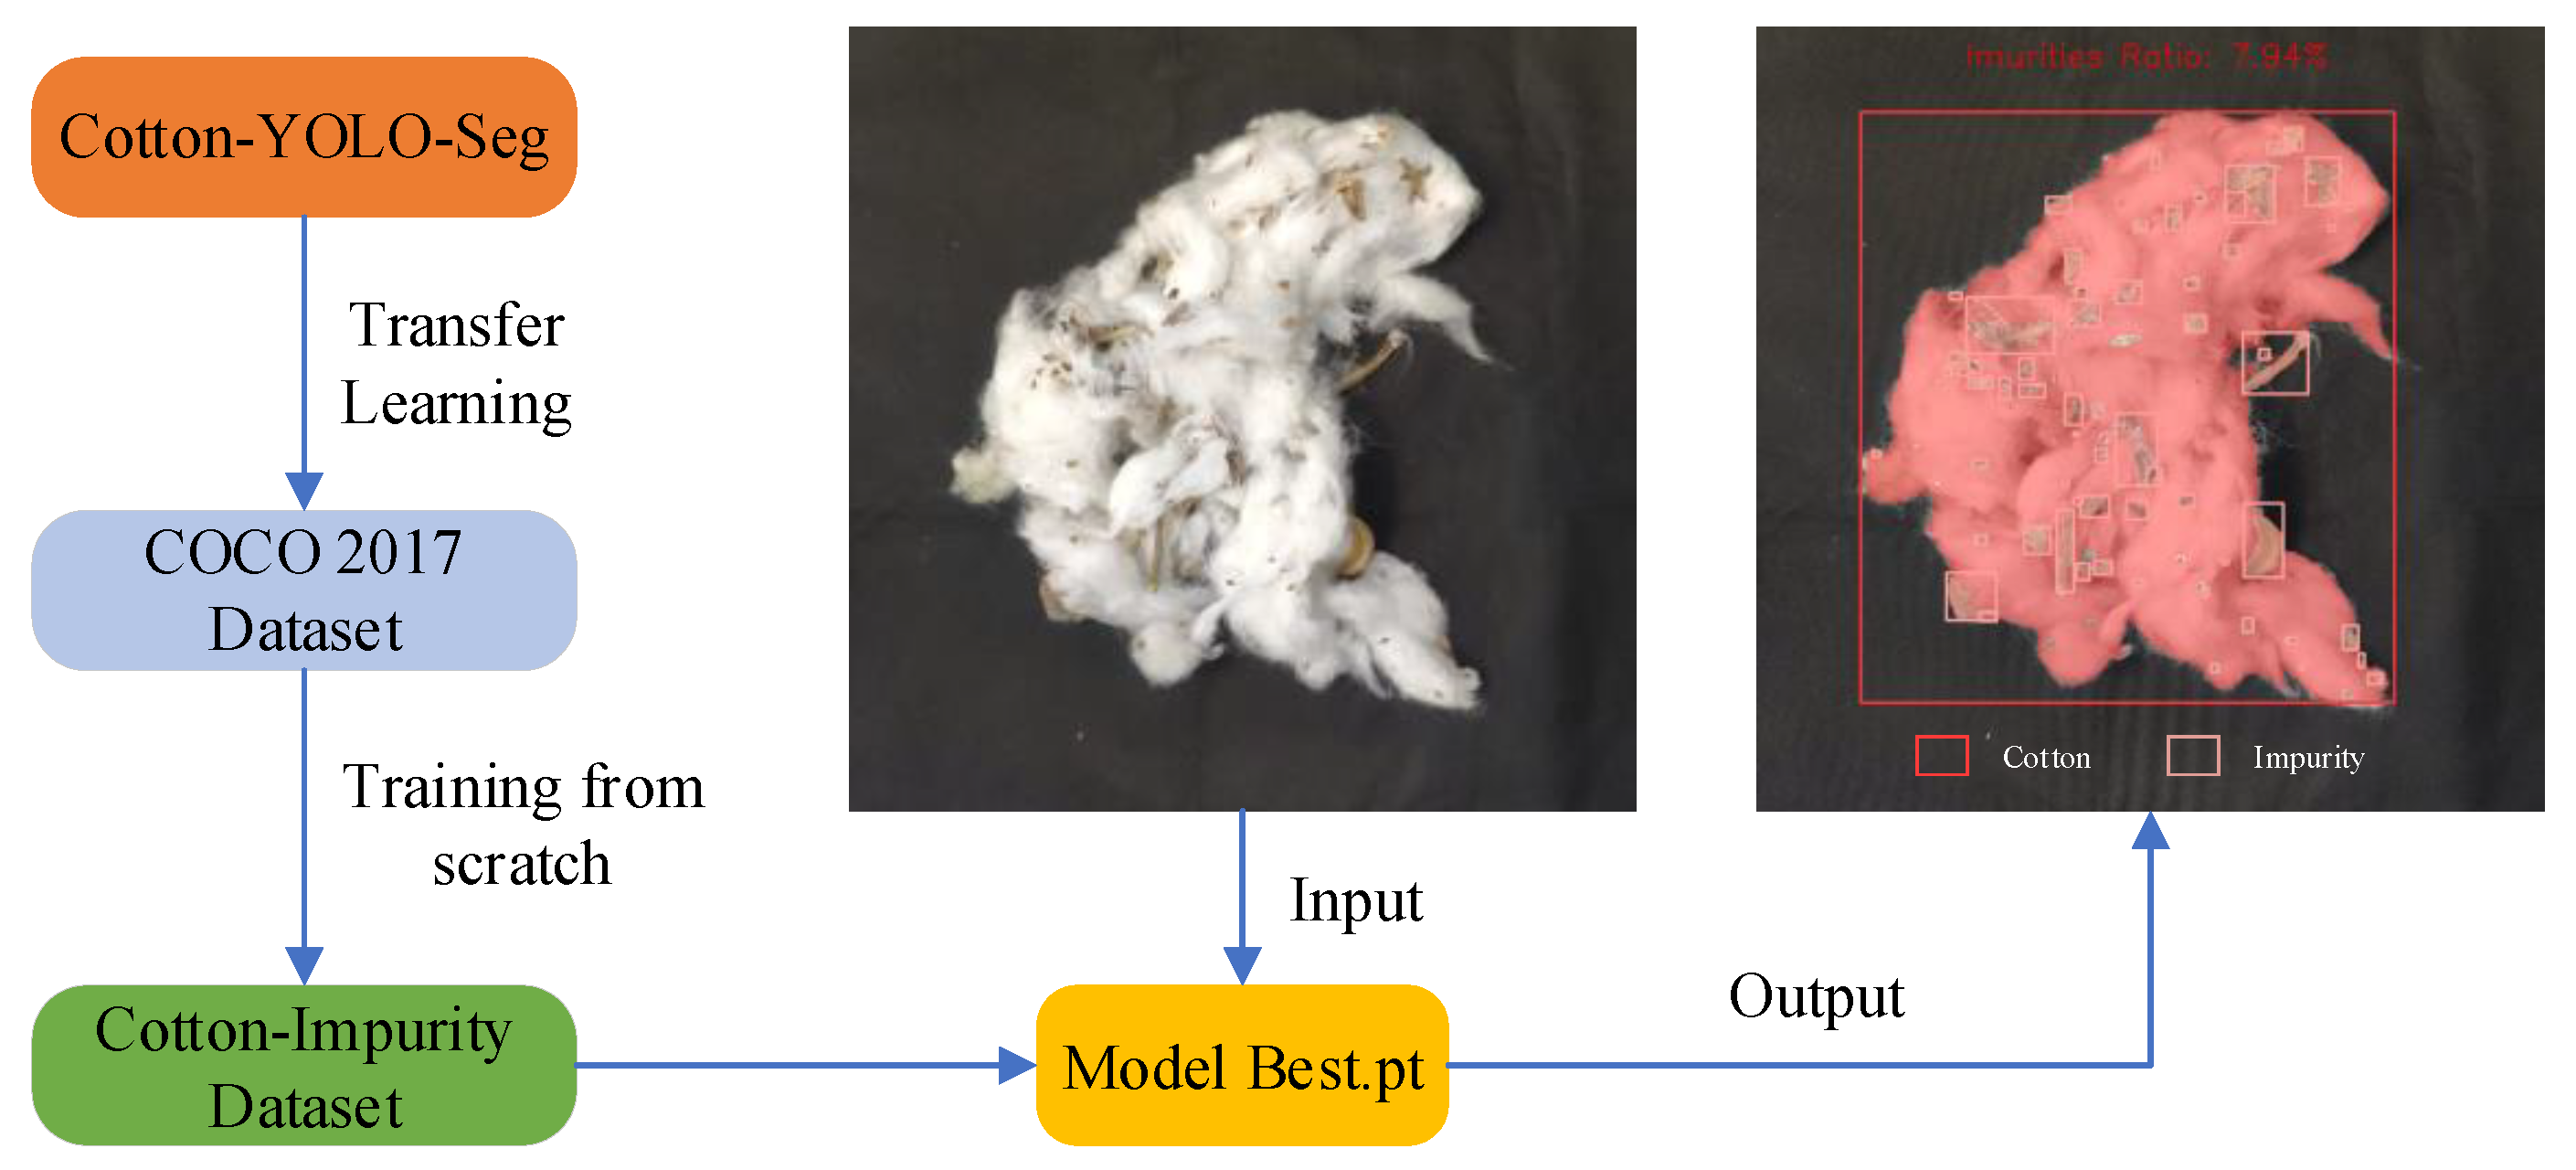
We employed the Cotton-YOLO-Seg model to accurately segment cotton and impurity pixels and to detect the impurity rate in machine-picked seed cotton images. Finally, the deviation between the actual impurity rate pactual and the detected impurity rate pdetect of the cotton samples was evaluated. The flowchart illustrating the entire experimental concept is shown in Figure 2.
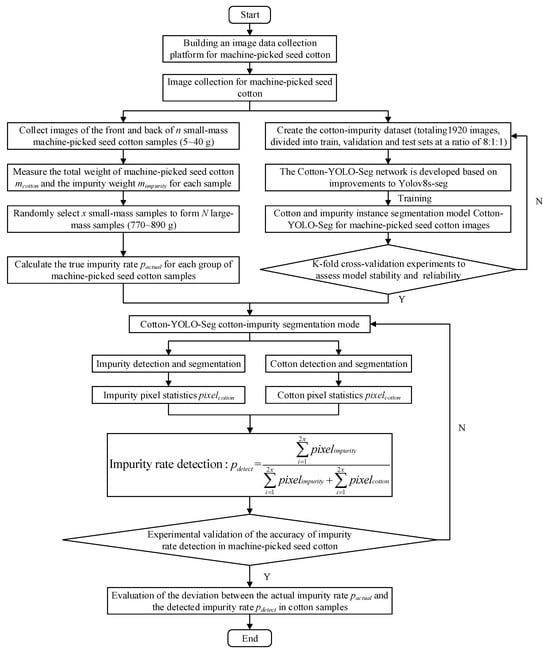
Figure 2.
Flowchart of experimental concepts.
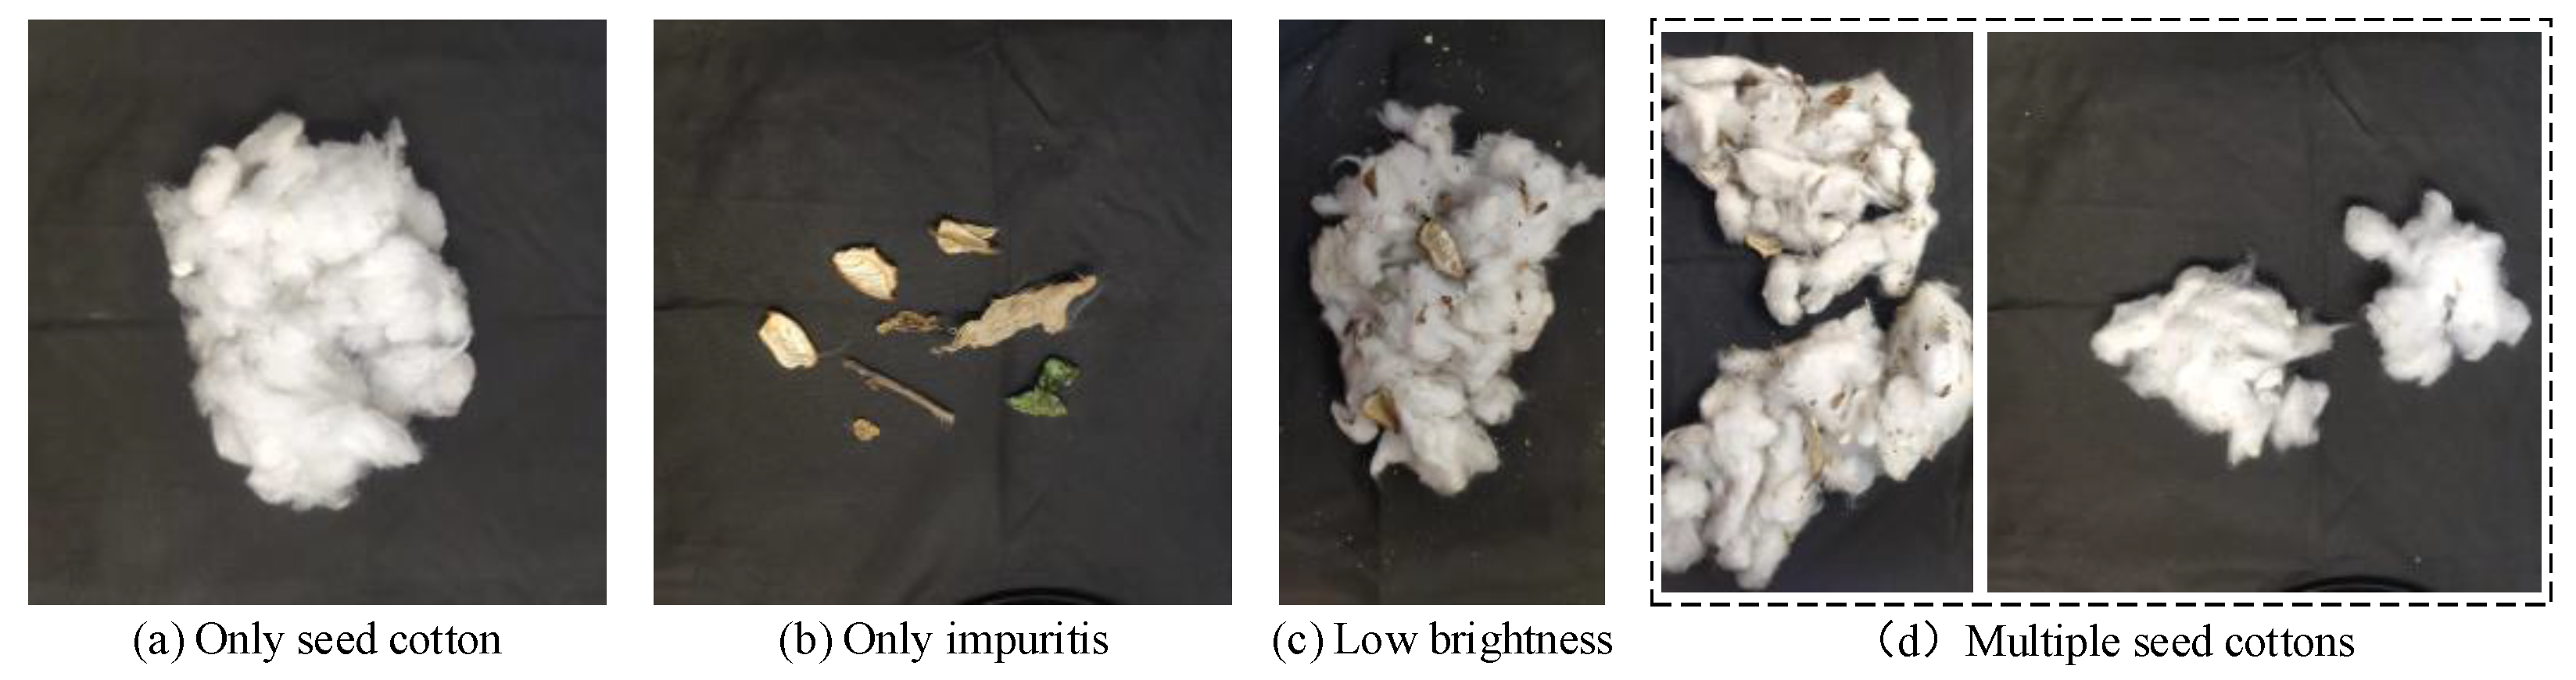
To enhance the diversity of the machine-picked seed cotton image dataset, we collected cotton images with varying resolutions, light intensities, seed cotton quantities, and impurity rates. After data cleaning, identical, structurally similar, or blurry cotton images were removed, resulting in a total of 320 images in the cotton-impurity dataset. The number of images with resolutions of 2268 × 4032 pixels and 3024 × 3024 pixels was 80 and 240, respectively. Among these images, the number of impurities accounted for approximately 95% of the total targets. Figure 3 depicts various complex scenarios in cotton images, encompassing variations in light intensity, mutual occlusion, and the overlapping of seed cotton and impurities.
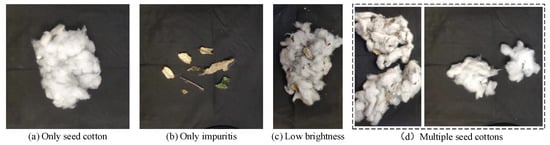
Figure 3.
Sample images of machine-picked seed cotton.
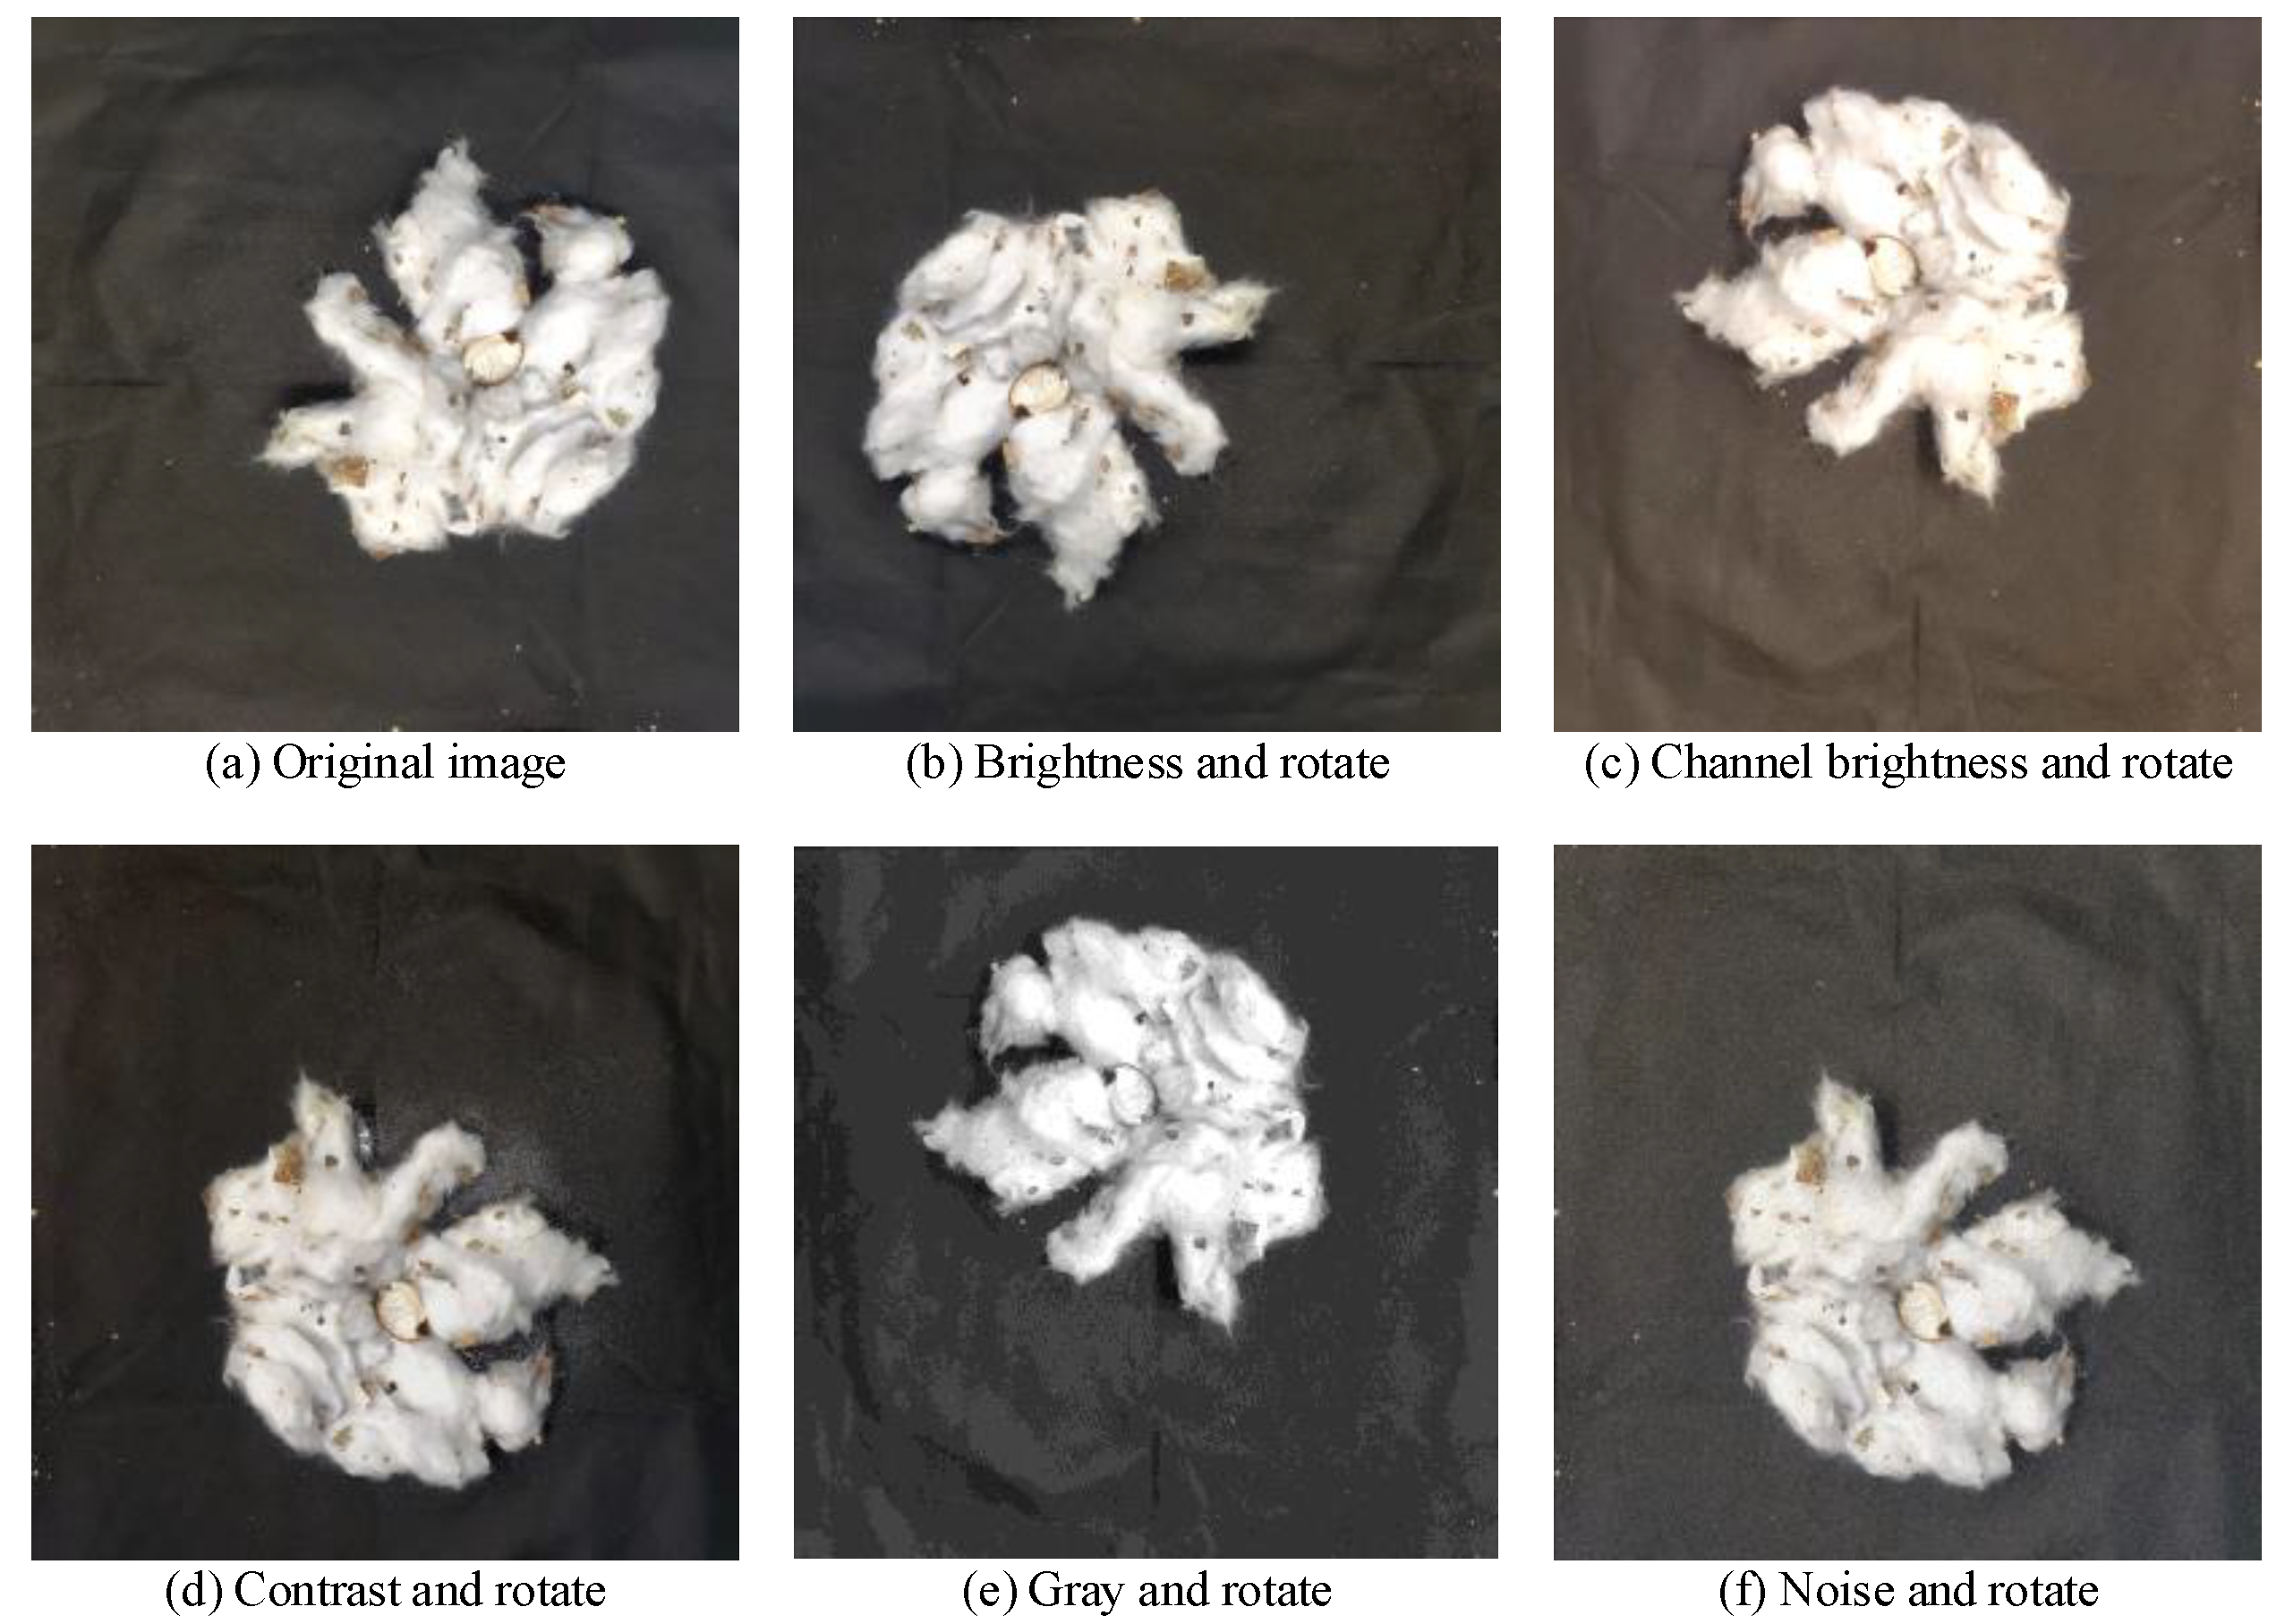
The precision of dataset labeling directly influences the segmentation accuracy of both cotton and impurities. Constructing a dataset of cotton-impurity images and accurately labeling them is both time-consuming and labor-intensive. This study develops a small dataset of 320 images and enhances it using data-augmentation techniques to bolster the model’s robustness. We utilize Labelme to categorize targets in the cotton images into two classes: cotton and impurity. The polygonal areas of cotton and impurities are manually annotated, and the labeled files are saved in JavaScript Object Notation (JSON) format. Figure 4 illustrates the enhancement of image data through flipping, grayscale adjustment, brightness adjustment, contrast adjustment, and noise addition. By combining the original images with the data-enhanced images and their labels, the manuscript creates the cotton-impurity dataset, which contains a total of 1920 images and 1920 JSON-labeled files. Subsequently, the JSON annotation files are converted to a Text (TXT) format compatible with YOLO and randomly partitioned the dataset into training, validation, and test sets in a ratio of 8:1:1, yielding 1536, 192, and 192 images, respectively.
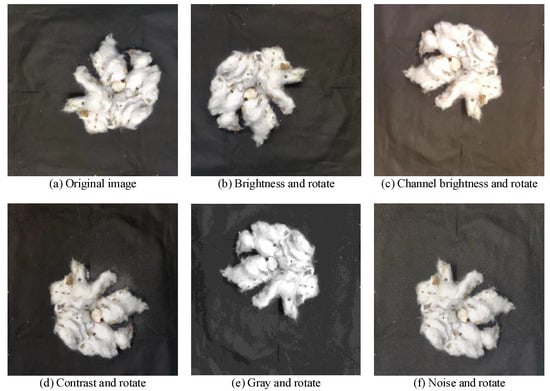
Figure 4.
Data-enhancement methods used for cotton images.
2.2. Cotton-YOLO-Seg Model
The Yolov8-Seg instance-segmentation algorithm provides high detection accuracy, fast processing speed, a relatively small model size, and ease of deployment on devices with limited computing resources. Although Yolov9-Seg [36] and Yolov10-Seg [37] have been released, the current version of Yolov9-Seg is incomplete and possesses a relatively large model size, while Yolov10-Seg represents minor modular improvements over Yolov8-Seg. The Yolov8-Seg network architecture is primarily divided into four parts: Input, Backbone, Neck, and Segment Head.
The machine-picked seed cotton dataset contains various types of impurities, including leaves, shells, and branches. These impurities are numerous, irregularly shaped, densely distributed, and mostly small targets, whereas cotton consists of a small number of large targets.
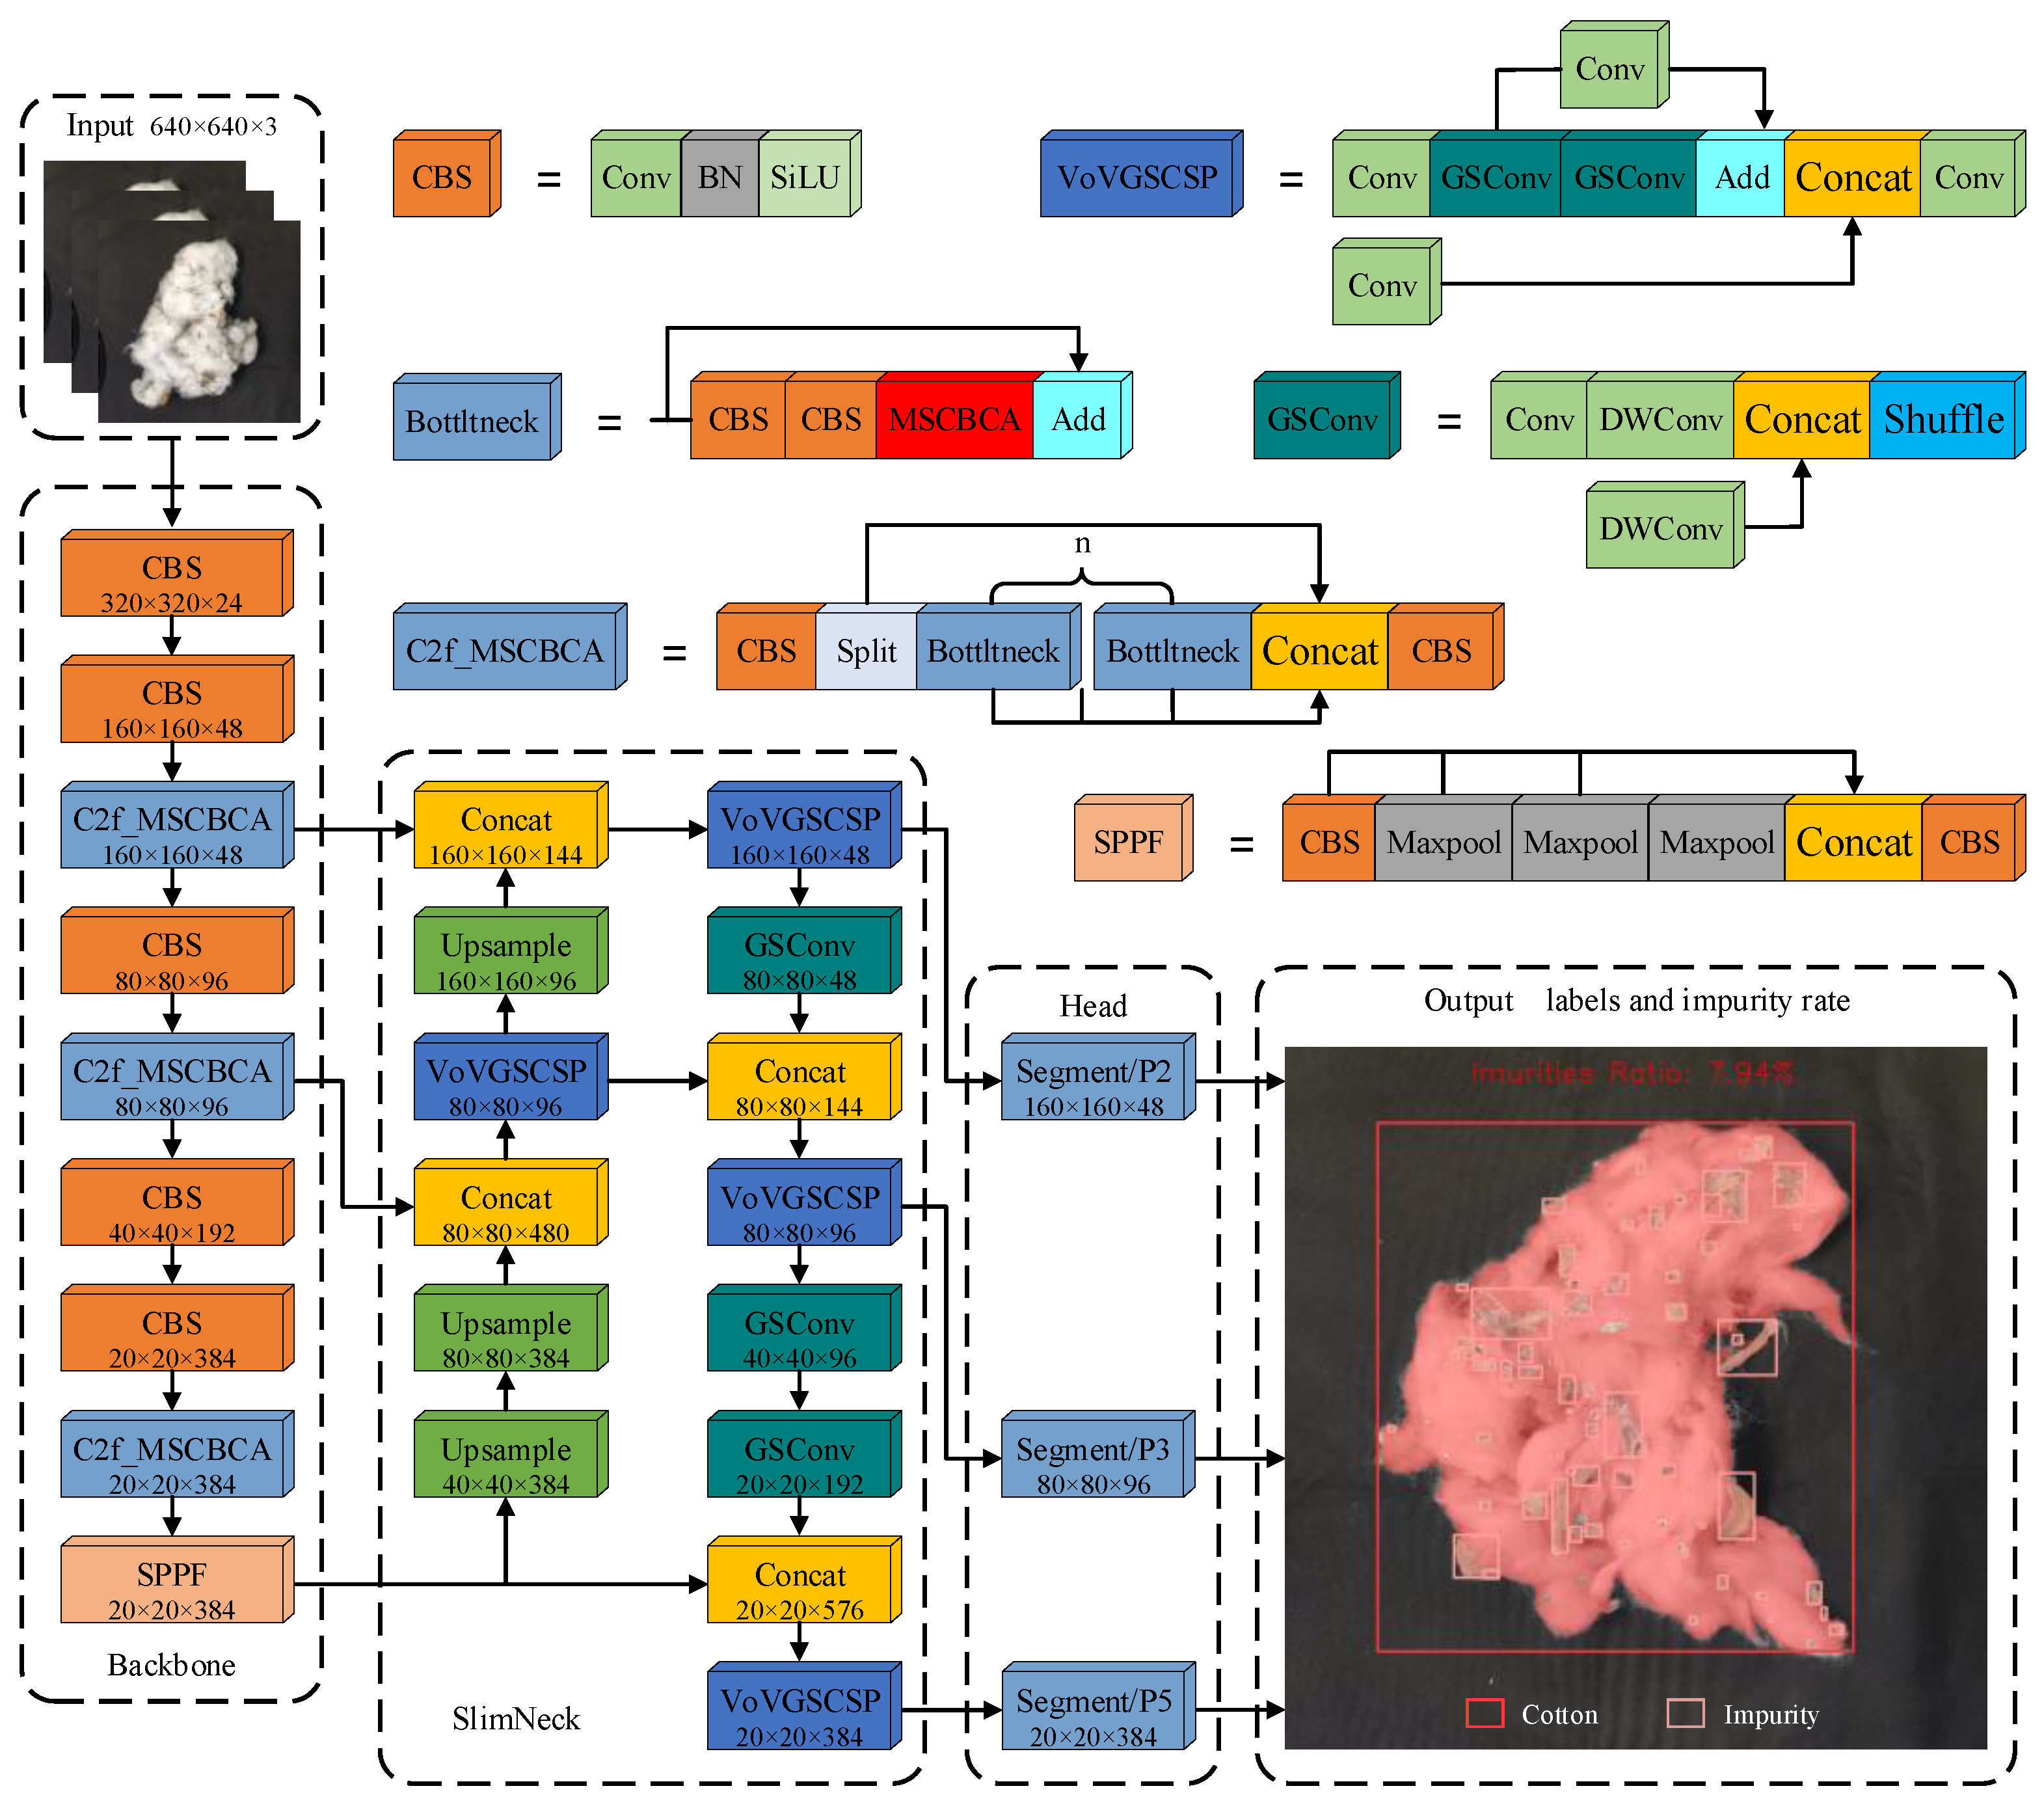
The original Yolov8-Seg algorithm exhibits poor detection and segmentation accuracy for the cotton-impurity dataset, especially for small-target impurities with more obvious missed detections. The improved network structure is illustrated in Figure 5. This manuscript introduces a novel C2f_MSCBCA module, incorporating Multi-Scale Convolutional Block Attention (MSCBCA) mechanism that integrates Convolutional Block Attention Module (CBAM) and Multi-Scale Convolutional Attention (MSCA) within the Faster Implementation of Cross Stage Partial Bottleneck with 2 Convolutions (C2f) module of the feature extraction network in Yolov8s-Seg while eliminating the Pyramid 4 (P4) feature layer. Additionally, this work incorporates the SlimNeck structure into the feature-fusion network, adds the Pyramid 2 (P2) small target detection layer, and removes the P4 feature layer. The improved Cotton-YOLO-Seg model for cotton-impurity segmentation is then subjected to transfer learning using the Common Objects in Context (COCO) [38] instance segmentation dataset.

Figure 5.
Structure of the improved Cotton-YOLO-Seg network.
2.2.1. A Novel MSCBCA Attention Module
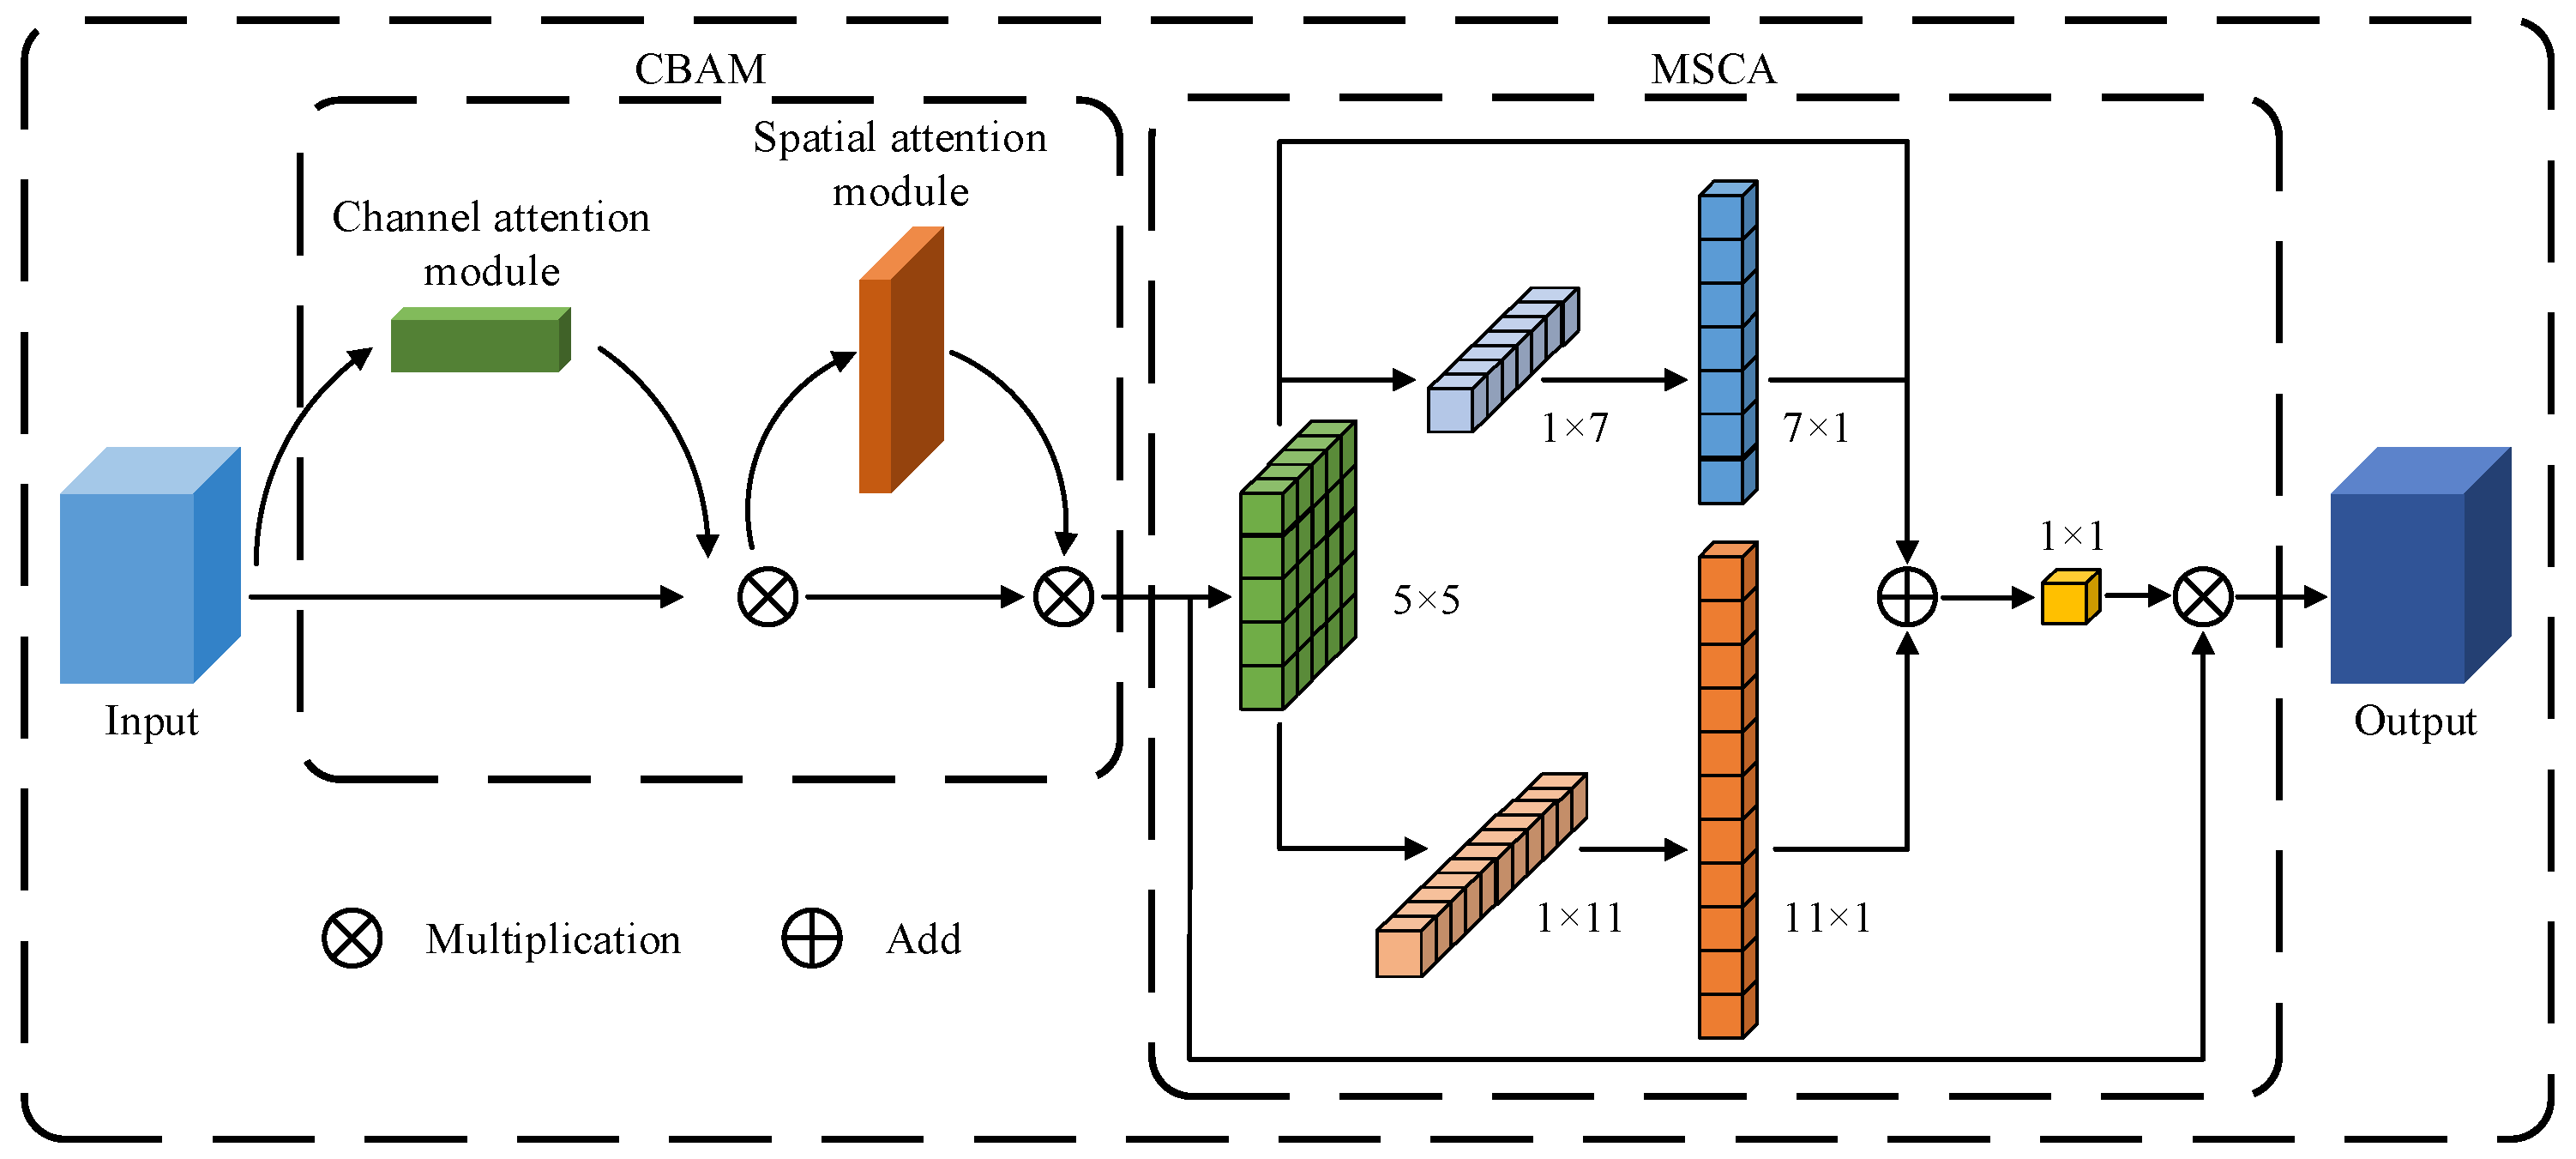
As illustrated in Figure 6, the Cotton-YOLO-Seg segmentation model integrates the CBAM [39] and MSCA [40] to create the new MSCBCA attention module. The CBAM module guides the network in focusing on critical regions in the input feature map by computing both channel and spatial attention. The MSCA module captures multi-scale features using convolutional kernels of various sizes and fuses features from different scales, enhancing the detection and segmentation of small-target impurities of varying sizes. In the original MSCA module, the multi-branch depth-wise strip convolution kernels are sized at 7, 11, and 21, respectively, to extract feature information and allocate weights to small, medium, and large targets. To better emphasize small-target impurities, the depth-wise strip convolution with a kernel size of 21 is removed, and additional weight is allocated to small-target impurities.
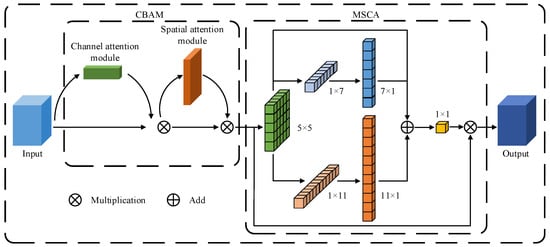
Figure 6.
Structure of MSCBCA module.
The mathematical formula for the MSCBCA module is presented in Equations (3)–(6).
where F represents the input features, F′ denotes the feature map obtained by channel attention weighting, Mc(F) stands for the channel attention output weights, F″ means the feature map obtained by spatial attention weighting, Ms(F) refers to the spatial attention output weights, AttMSCA indicates the MSCA attention output weights, Out signifies the output features, ⊗ is the element-wise matrix multiplication operation, DW-Conv denotes the deep-wise convolution, Scalei represents the ith branch in the MSCA attention map, with i ∈ {0,1,2}, and Scale0 symbolizes the identity connection.
2.2.2. Neck Network Improvements
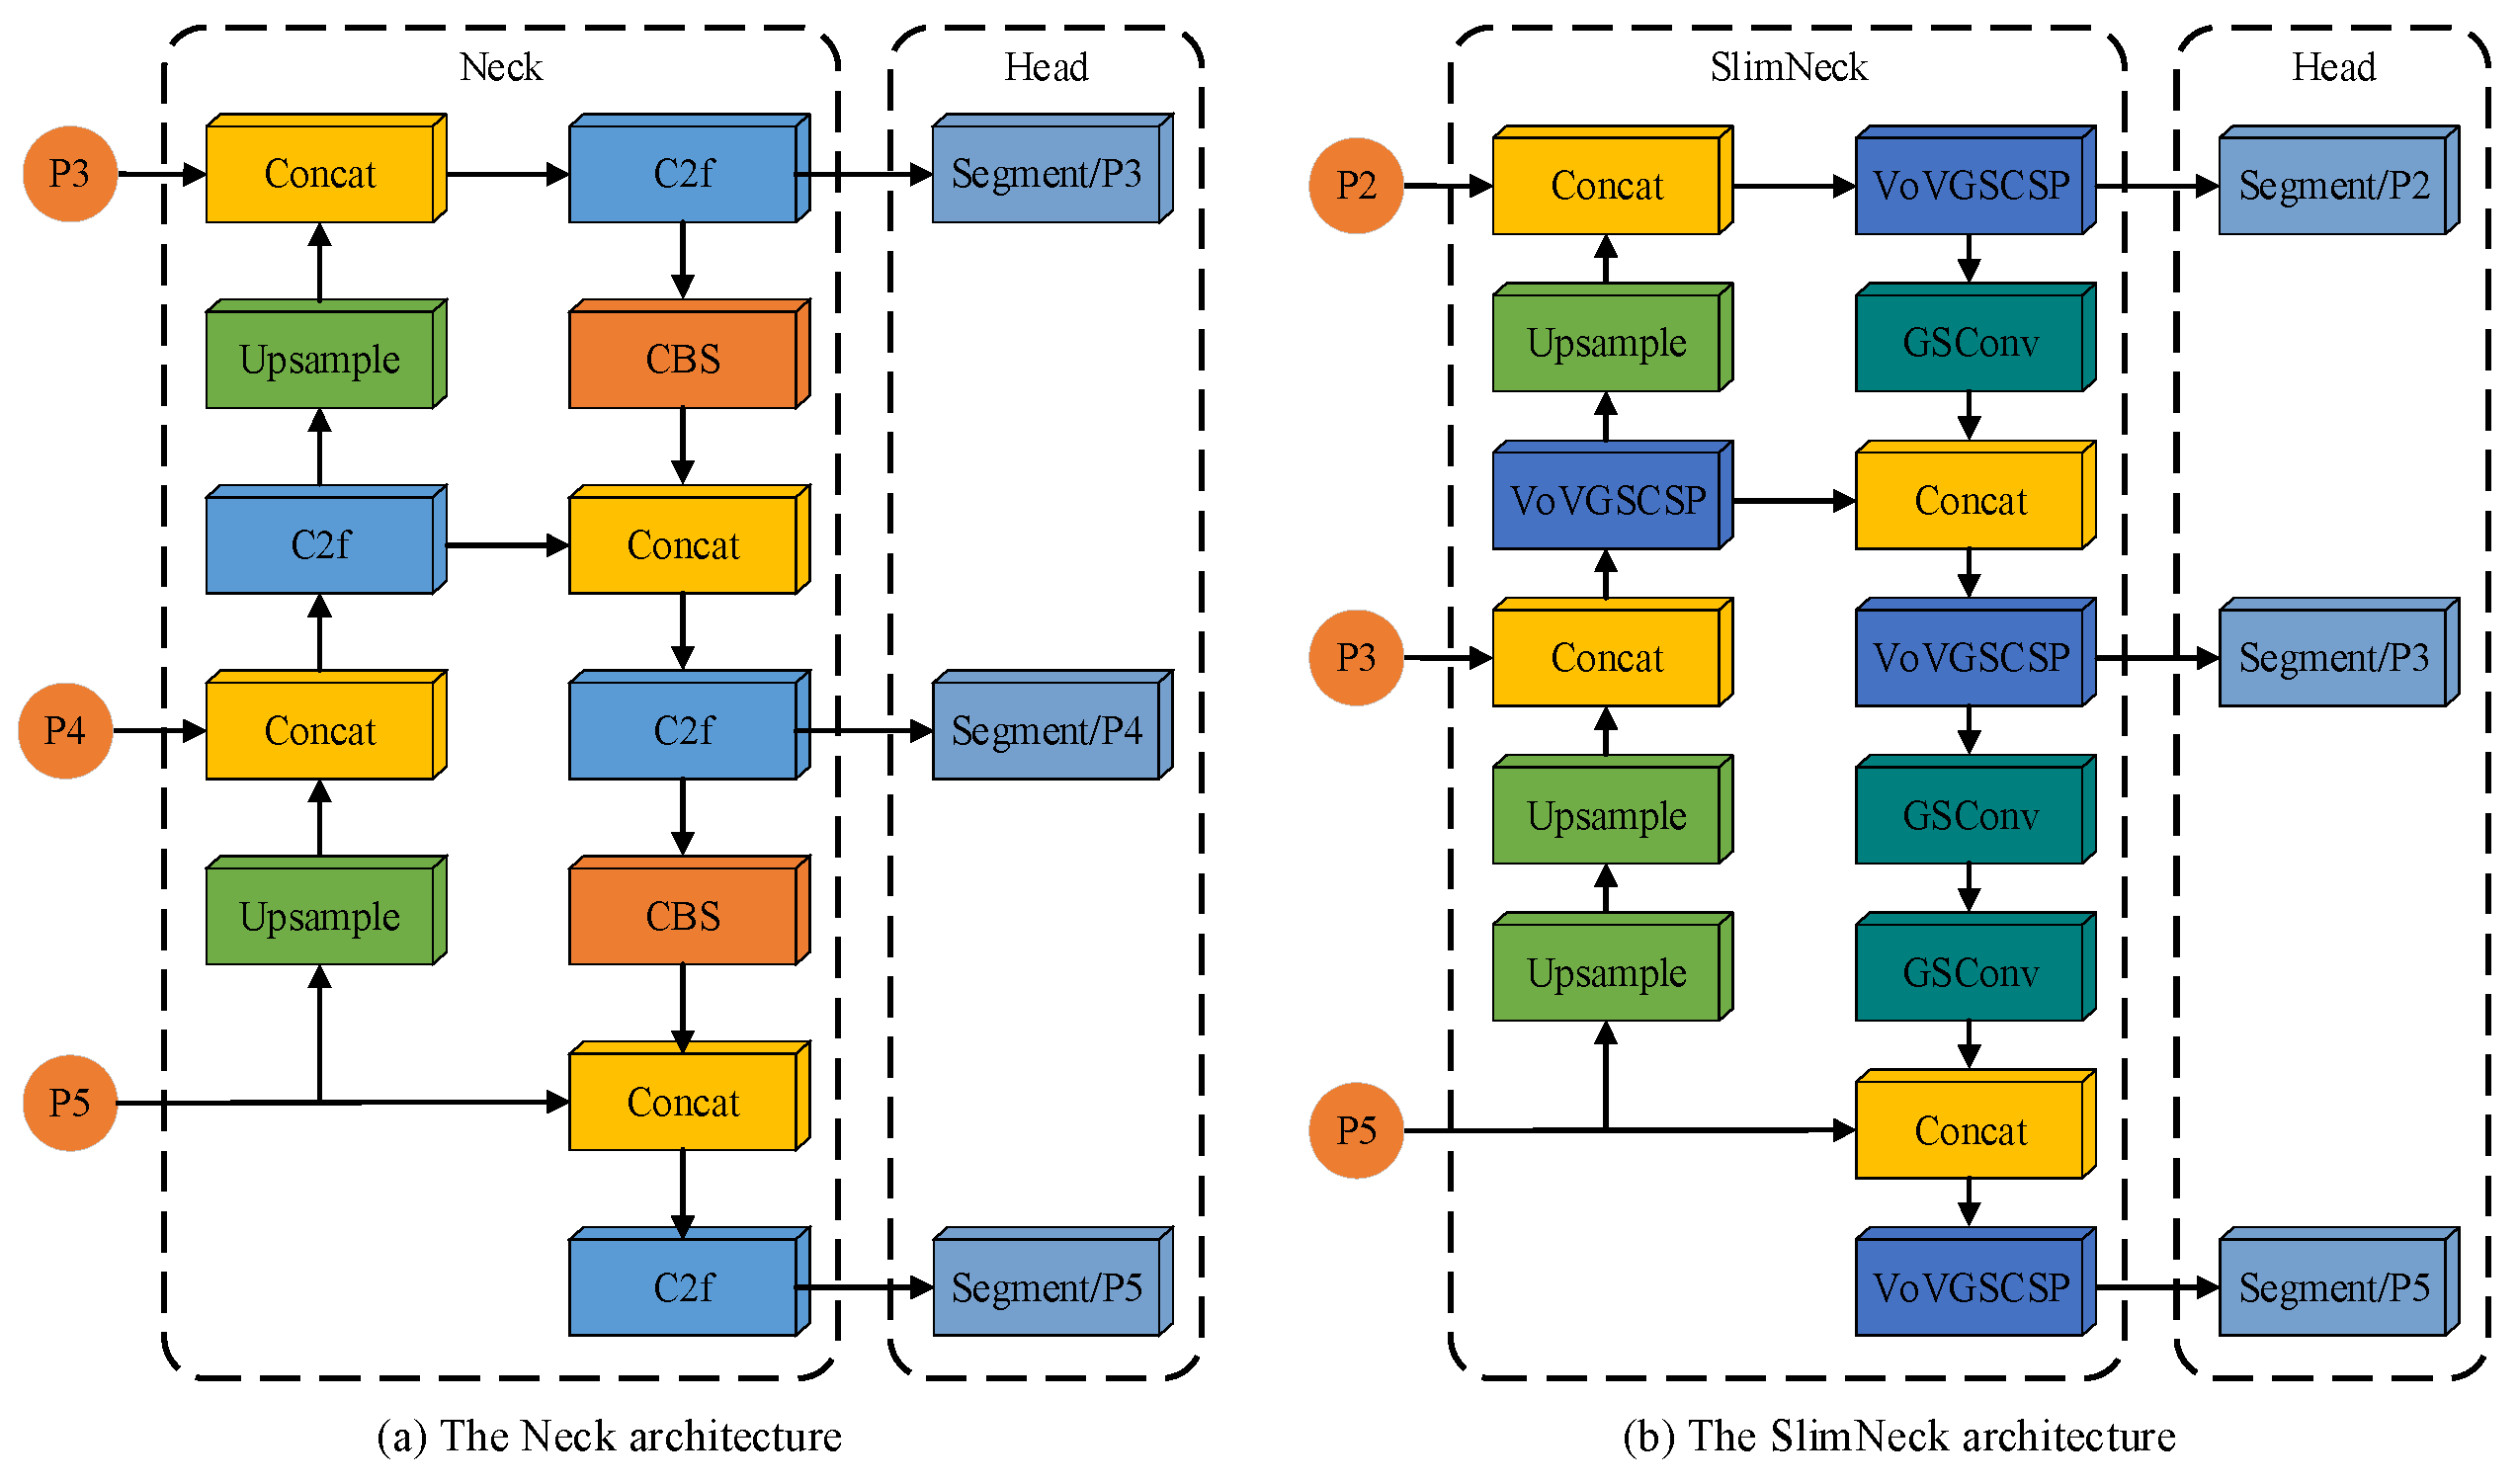
The Yolov8 base model employs three scale feature layers within its Neck network structure. For an image with an input size of 640 × 640 pixels, feature layers with downsampling factors of 8, 16, and 32 are used to detect and segment target objects of different sizes, corresponding to small, medium, and large targets, respectively. However, since most impurities in cotton images are smaller than one-tenth of the input image size and are numerous and densely distributed, the original Neck network structure fails to meet the required detection and segmentation accuracy. Figure 7 illustrates a comparison of the neck network structure pre- and post-improvement. Introducing the SlimNeck network structure, which consists of the Group Shuffle Convolution (GSConv) module and the VoV-Group Sparse and Cross-Stage Partial Network (VoVGSCSP) module, reduces the model’s complexity while maintaining accuracy [41]. The increase in network downsampling multiplicity and the gradual deepening of the network reduce the pixel percentage of small targets, potentially leading to the complete loss of pixel information for small-target impurities. The shallow network can retain more feature information and details of small-target impurities. This study adds the small-target detection layer P2 to the SlimNeck feature fusion network, with a downsampling factor of 4 for the corresponding feature layer. This addition maximizes the retention of pixel information of small-target impurities. It effectively fuses the detailed feature information of small-target impurities in the shallow features, thereby improving the accuracy of small-target impurity detection and segmentation.
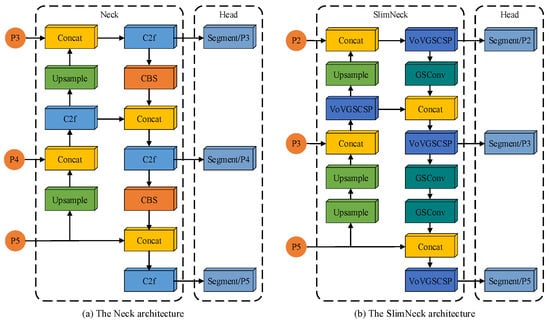
Figure 7.
Comparison of the neck network structure pre- and post-improvement.
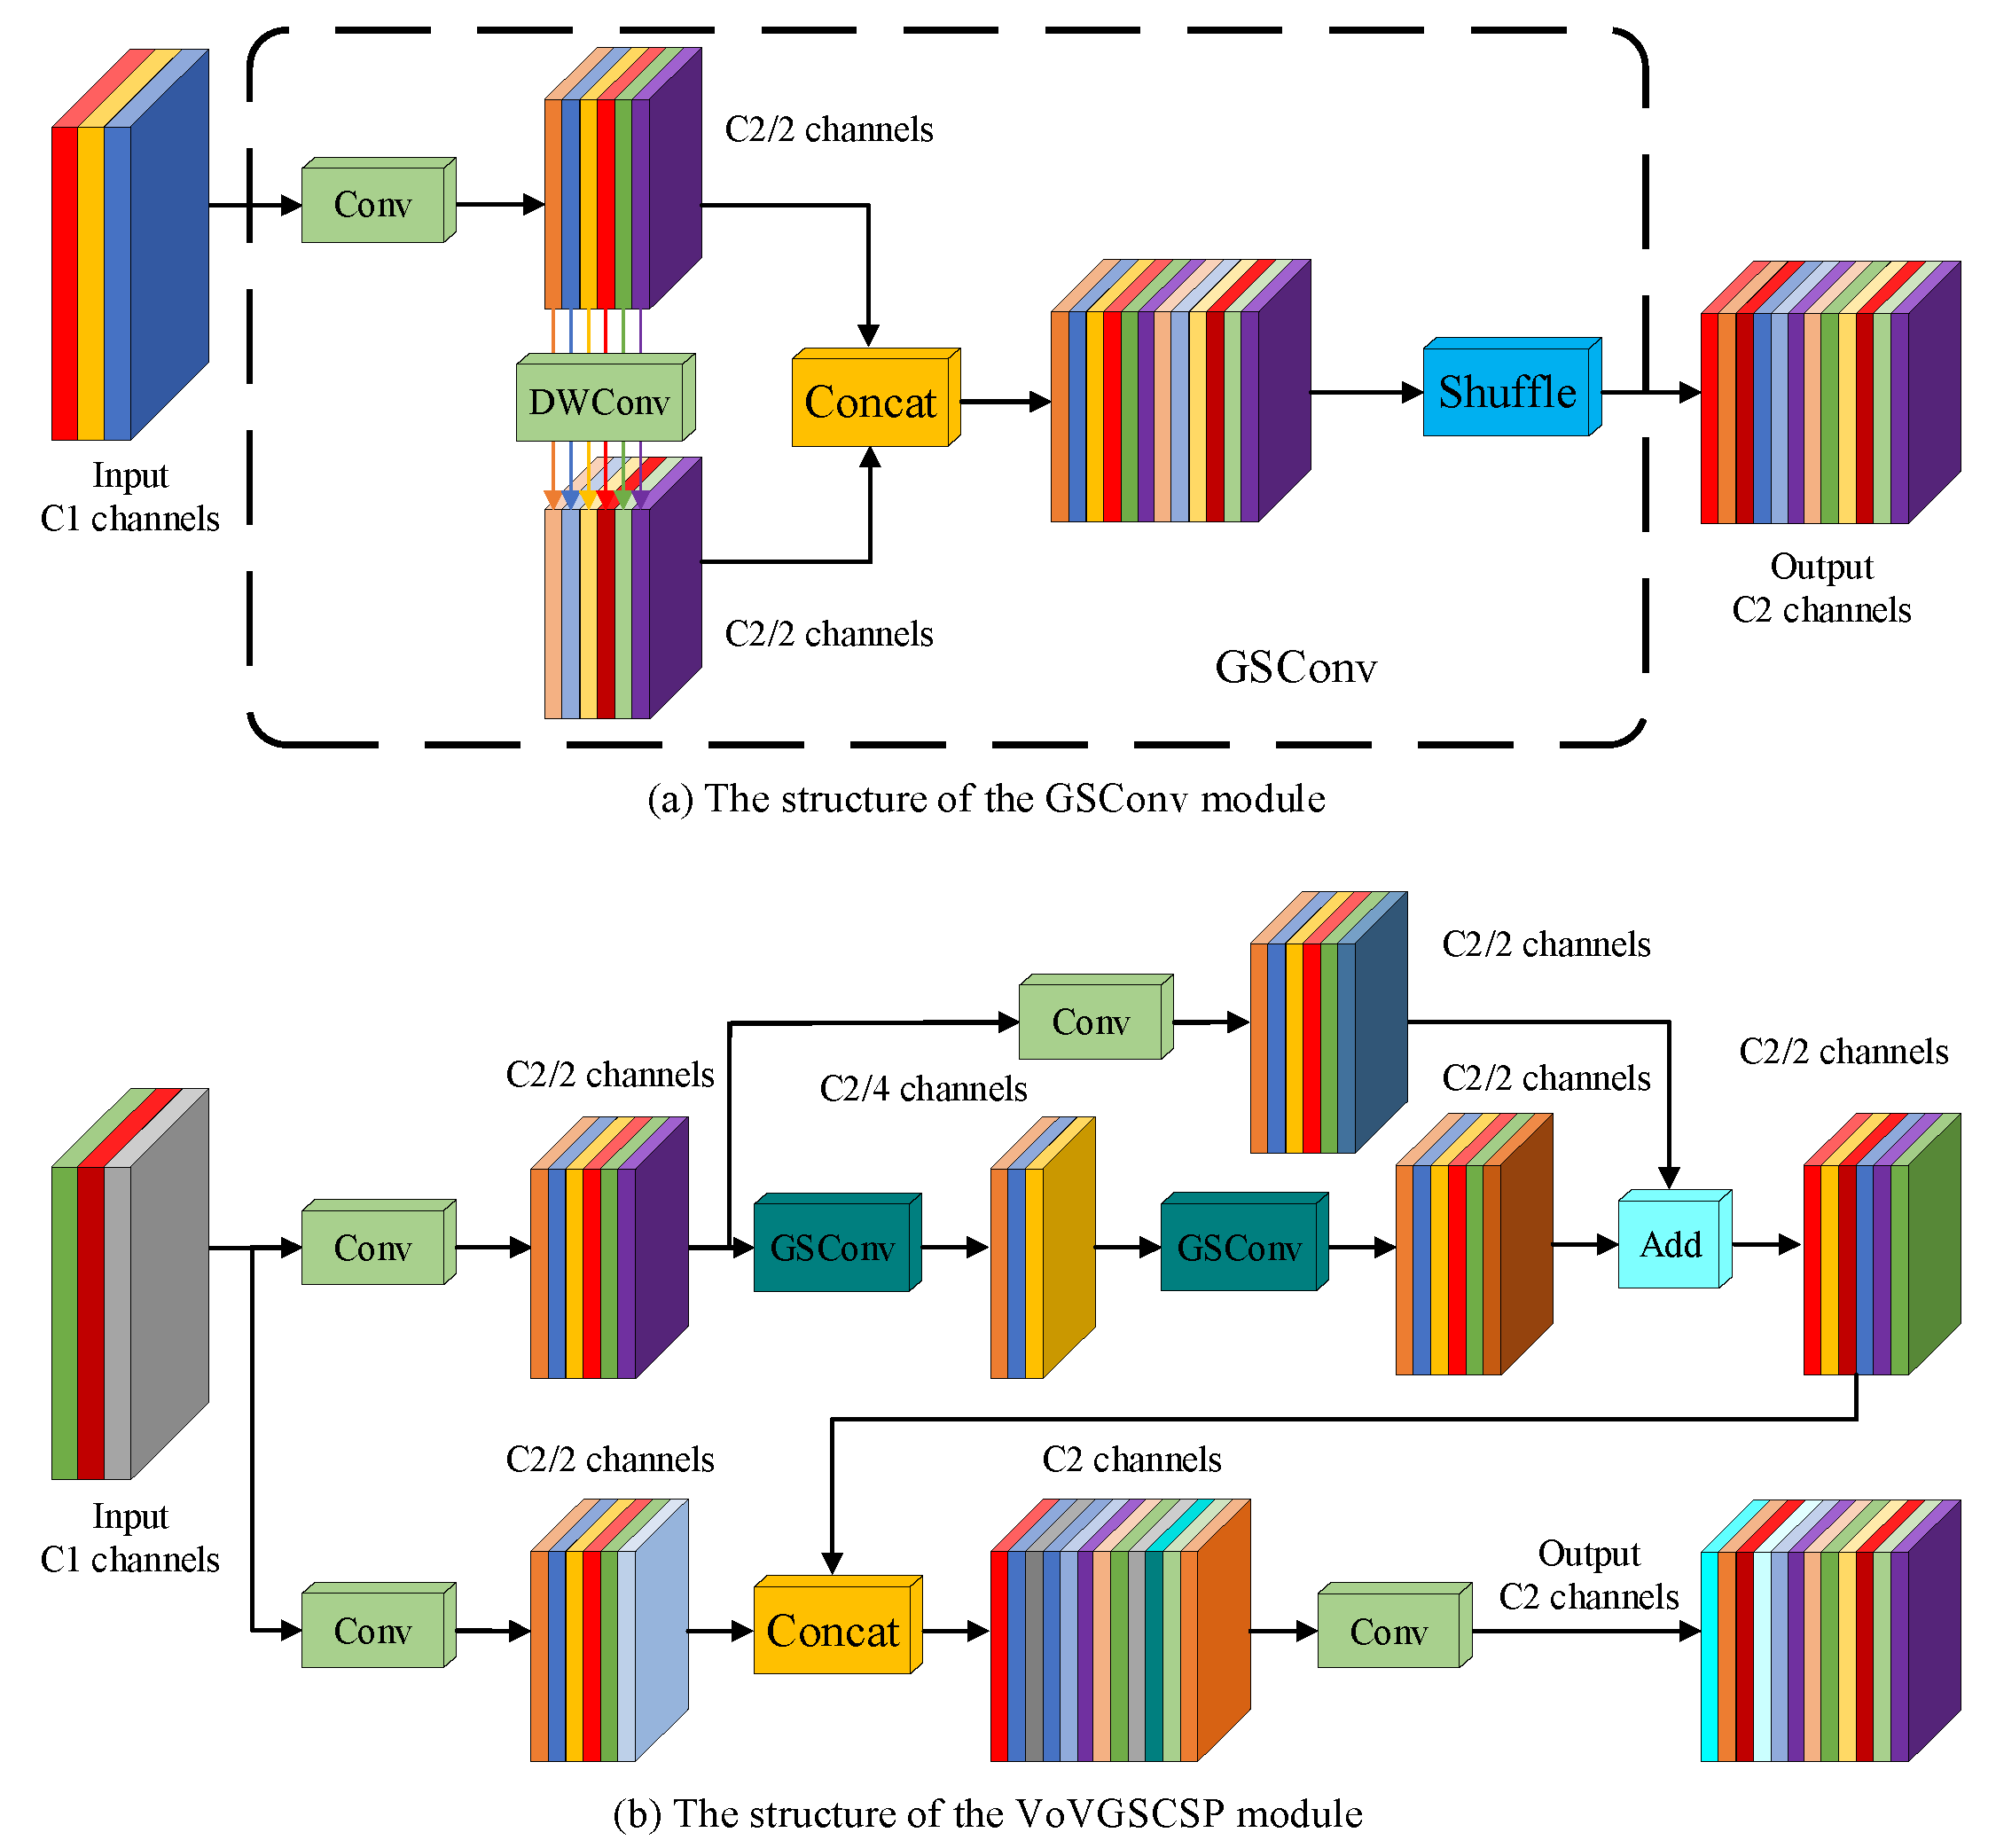
Figure 8 depicts the architecture of the GSConv module and the VoVGSCSP module, collectively attaining an improved equilibrium between model accuracy and speed. GSConv integrates Spatial Convolution (SC), Depthwise Separable Convolution (DSC), and Shuffle operations, blending the information generated by SC and DSC through the Shuffle operation to facilitate the exchange of local feature information across different channels and enhance nonlinear expression capabilities. Compared to standard convolution, GSConv has a computational cost of only 60% to 70%, maintaining accuracy while achieving a balance between precision and speed. The VoVGSCSP module is designed using a one-time aggregation approach, offering a simple and clear structure with faster inference speeds. It effectively reduces computational and structural complexity while retaining sufficient accuracy [42,43].

Figure 8.
Structural diagram of GSConv and VoVGSCSP modules.
2.2.3. Backbone Network Lightweight
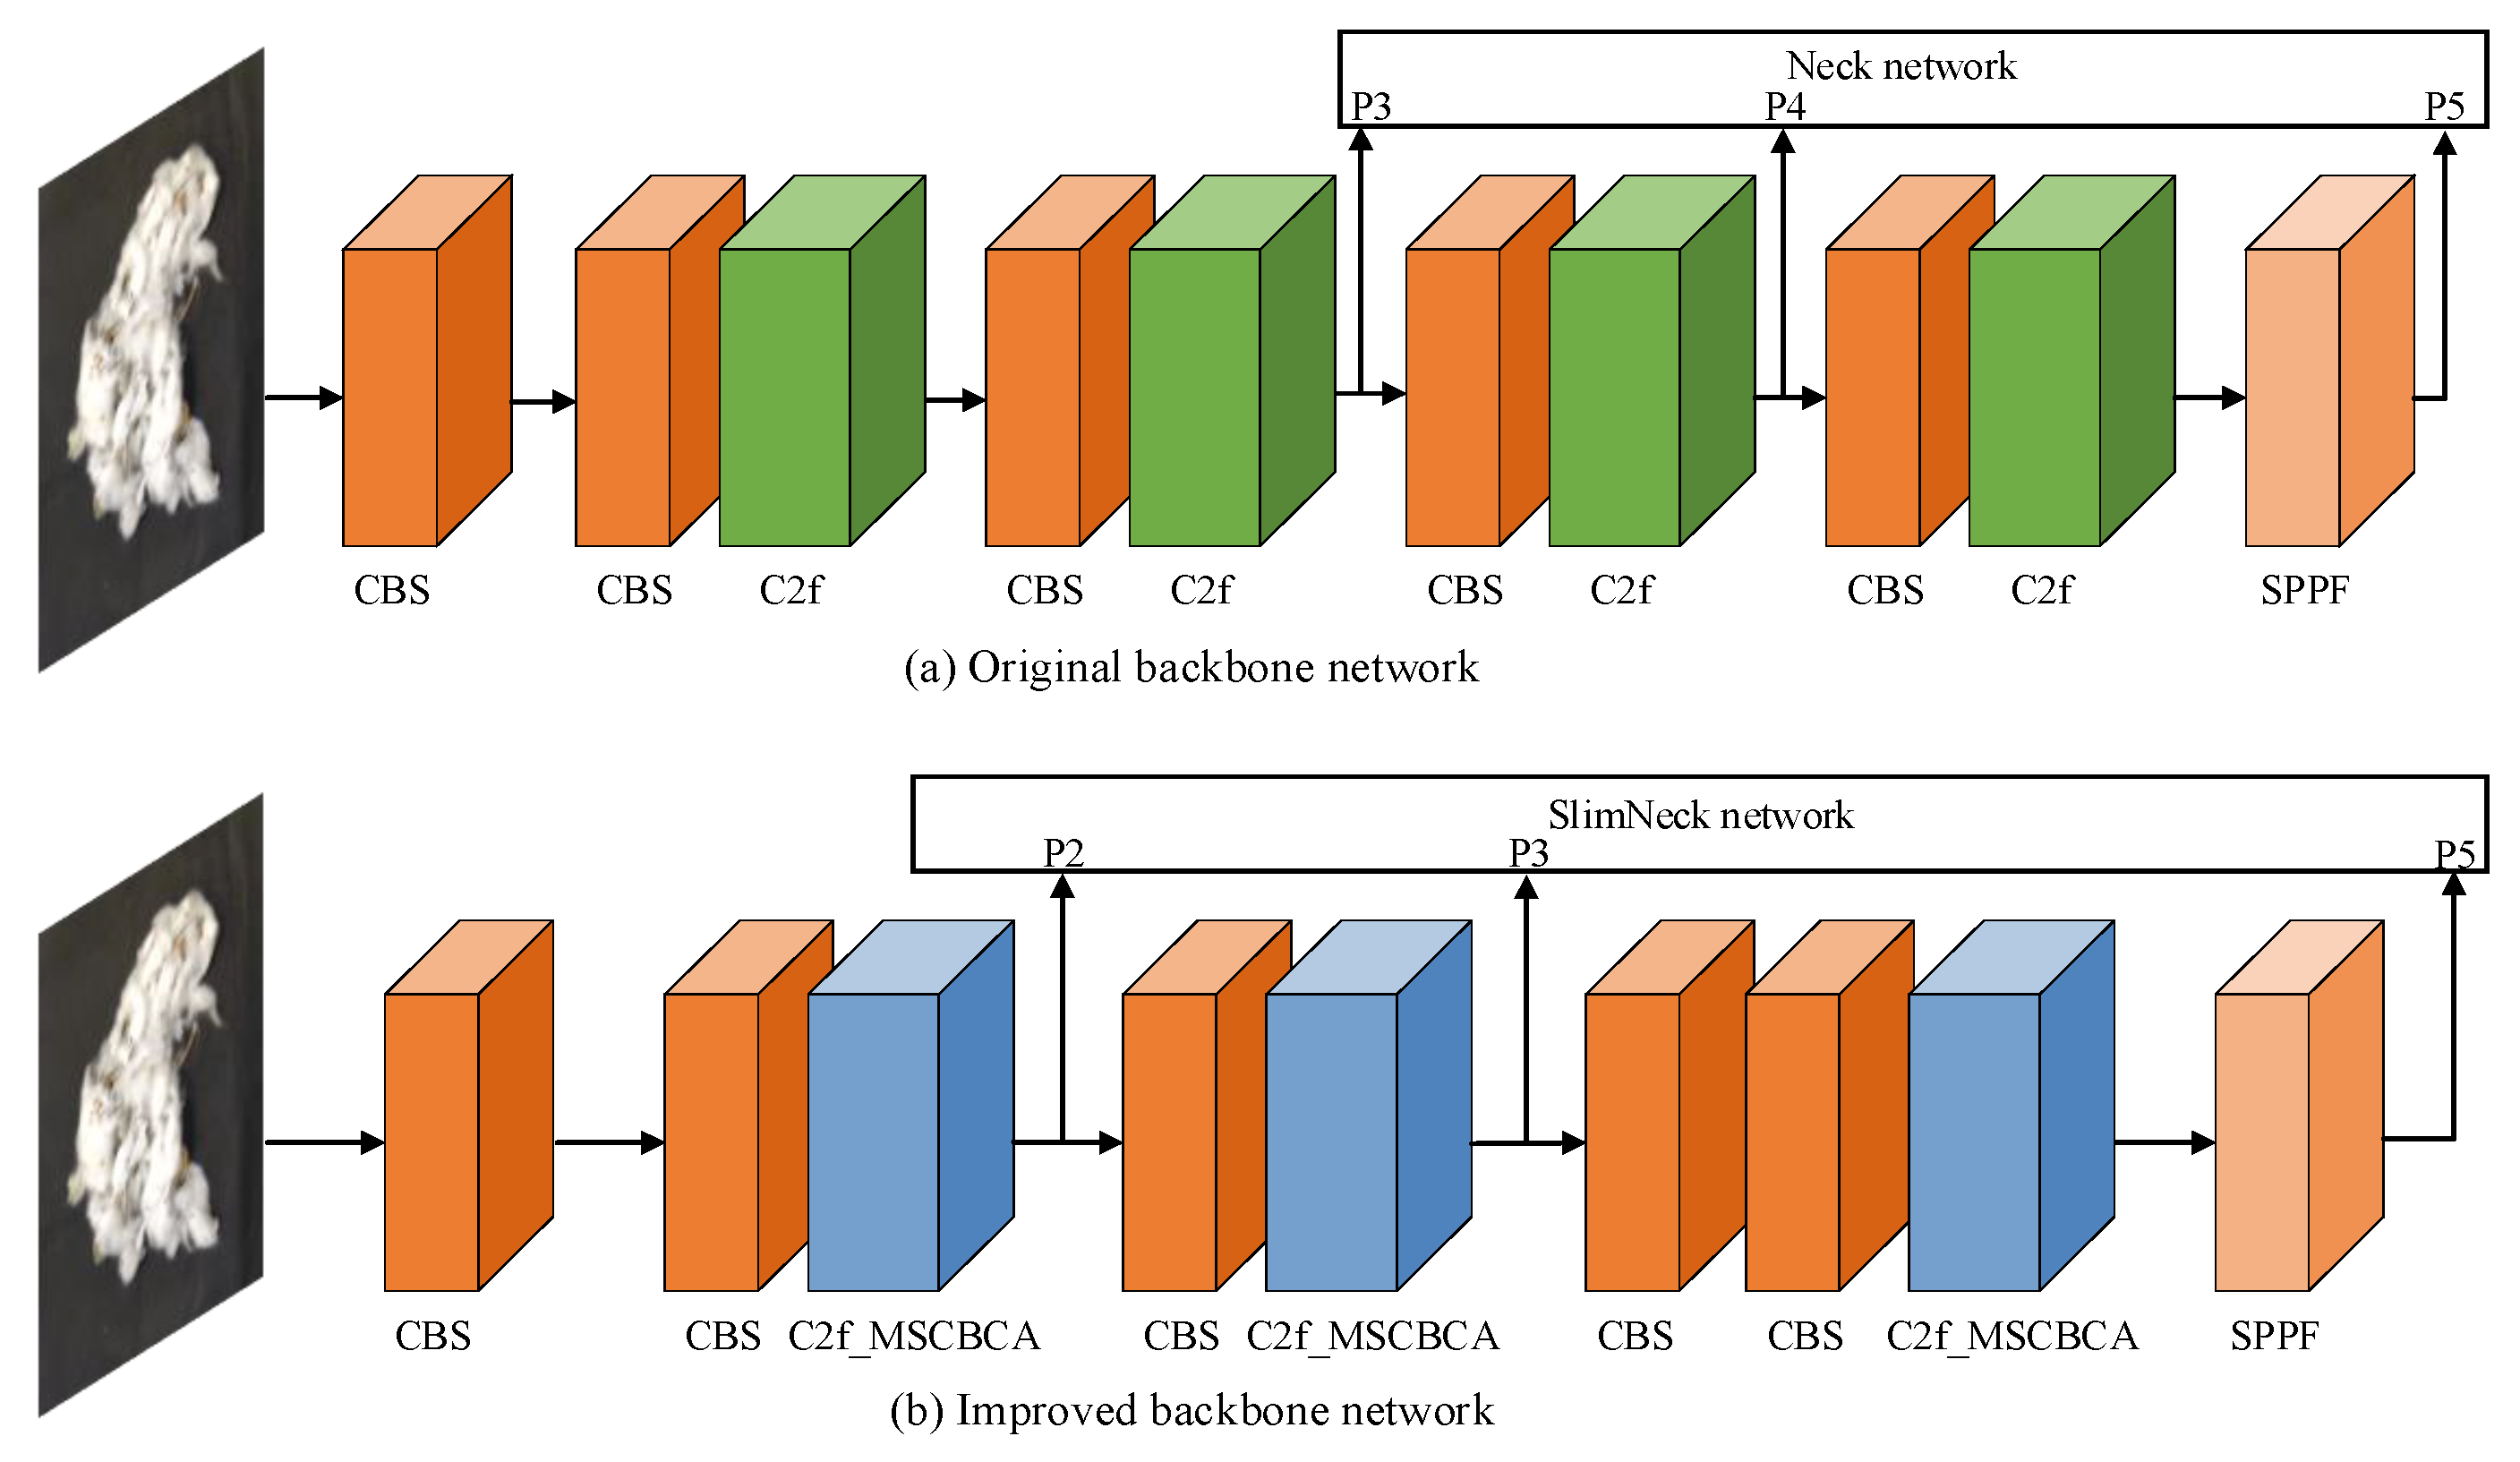
Based on the analysis of the cotton-impurity dataset, the detected objects can be categorized into two main types: large targets (cotton) and small targets (impurity). Figure 9 illustrates a comparison of the backbone network structure pre- and post-improvement. To minimize the number of parameters and computational load of the model while optimizing detection and segmentation accuracy, this study eliminates the P4 feature layer from the backbone network and integrates MSCBCA attention into the C2f module, thereby creating the novel C2f_MSCBCA module. This modification enables the feature extraction network to concentrate more effectively on the feature information of small-target impurities.
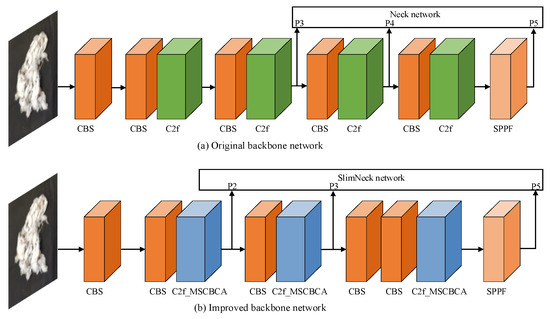
Figure 9.
Comparison of the backbone network structure pre- and post-improvement.
2.2.4. Transfer Learning from the COCO Dataset
Transfer learning suppresses overfitting to a certain extent and improves the model’s accuracy metrics and generalization ability on limited data [44]. Figure 10 illustrates the transfer-learning process in this study. The COCO2017 instance segmentation dataset serves as the source domain, and the improved Cotton-YOLO-Seg model is trained to fully learn its complex features. The cotton-impurity dataset created in this study is used as the target domain. The weight parameters obtained from training on the COCO dataset are transferred to the Cotton-YOLO-Seg model for further training. This process results in a cotton-impurity instance-segmentation model with high detection and segmentation accuracy.
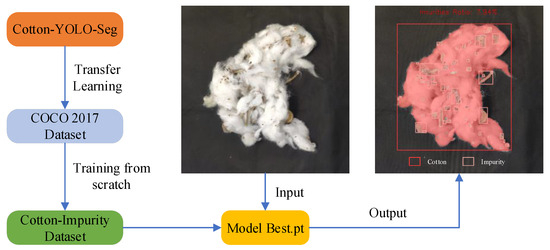
Figure 10.
Transfer-learning process from the COCO2017 dataset.
3. Results
3.1. Experimental Environment Configuration
We trained the improved Cotton-YOLO-Seg model and all comparison models on a Graphics Processing Unit (GPU) server. Table 1 provides the detailed hardware configuration and software environment.

Table 1.
Experimental test platform.
This study conducted all comparison experiments on the created cotton-impurity dataset within the same environment and trains from scratch. Based on recommendations from computer hardware specifications and literature [44], a small batch size with a low learning rate is used. The training parameters are set as follows: the network input image size is 640 × 640 pixels, with a batch size of 8 and 300 epochs. The optimizer is Stochastic Gradient Descent (SGD), the initial learning rate is 0.01, the weight decay is 0.0005, the number of workers is 16, and the momentum is 0.937. All other parameters are set to their default values.
3.2. Precision Evaluation Indicators
To compare the detection performance of different models on the cotton-impurity dataset in this study, Precision (P), Recall (R), mean Average Precision (mAP), Parameters (Params), Model Size, Giga Floating-Point Operations Per Second (GFLOPs), and Frames Per Second (FPS) are used as evaluation metrics. The relevant calculation formulas are provided below in (7)–(10):
where TP denotes the number of correctly predicted positive samples, FN represents the number of actual positive samples that are incorrectly predicted as negative, FP indicates the number of actual negative samples that are incorrectly predicted as positive, and N stands for the number of target categories.
The accuracy of the impurity rate detection across different models is evaluated using Mean Absolute Error (MAE), Root Mean Square Error (RMSE), and Mean Absolute Percentage Error (MAPE). The corresponding formulas are shown in Formulas (11)–(13):
where N represents the number of groups of machine-picked seed cotton samples, and in this study, N is set to 100.
3.3. Comparison of Model Experiments
3.3.1. Comparative Experiments on Improving MSCBCA Attention
To verify the effectiveness of integrating CBAM and MSCA attention, we conducted comparative experiments using the original Yolov8s-seg model. Detailed comparative performance results are presented in Table 2. The baseline is the original Yolov8s-seg model, while +MSCA, +CBAM, and +MSCBCA represent the addition of MSCA, CBAM, and the improved MSCBCA attention to the C2f module of the baseline, respectively.
Table 2.
Performance comparison of attention improvements.
Given the data in Table 2, it is evident that the addition of MSCA, CBAM, and the improved MSCBCA attention to the original Yolov8s-seg model enhances the model’s segmentation performance for small-target impurities. Specifically, the addition of the improved MSCBCA attention resulted in increases of 0.7%, 0.1%, and 0.5% in P, R, and mAP@0.5, respectively, compared to the original model. Compared to the MSCA attention, P and mAP@0.5 increased by 1.2% and 0.3%, respectively. Relative to the CBAM attention, R and mAP@0.5 both increased by 0.6%. These results indicate that the improvements in the MSCBCA attention are effective.
3.3.2. Ablation Experiments
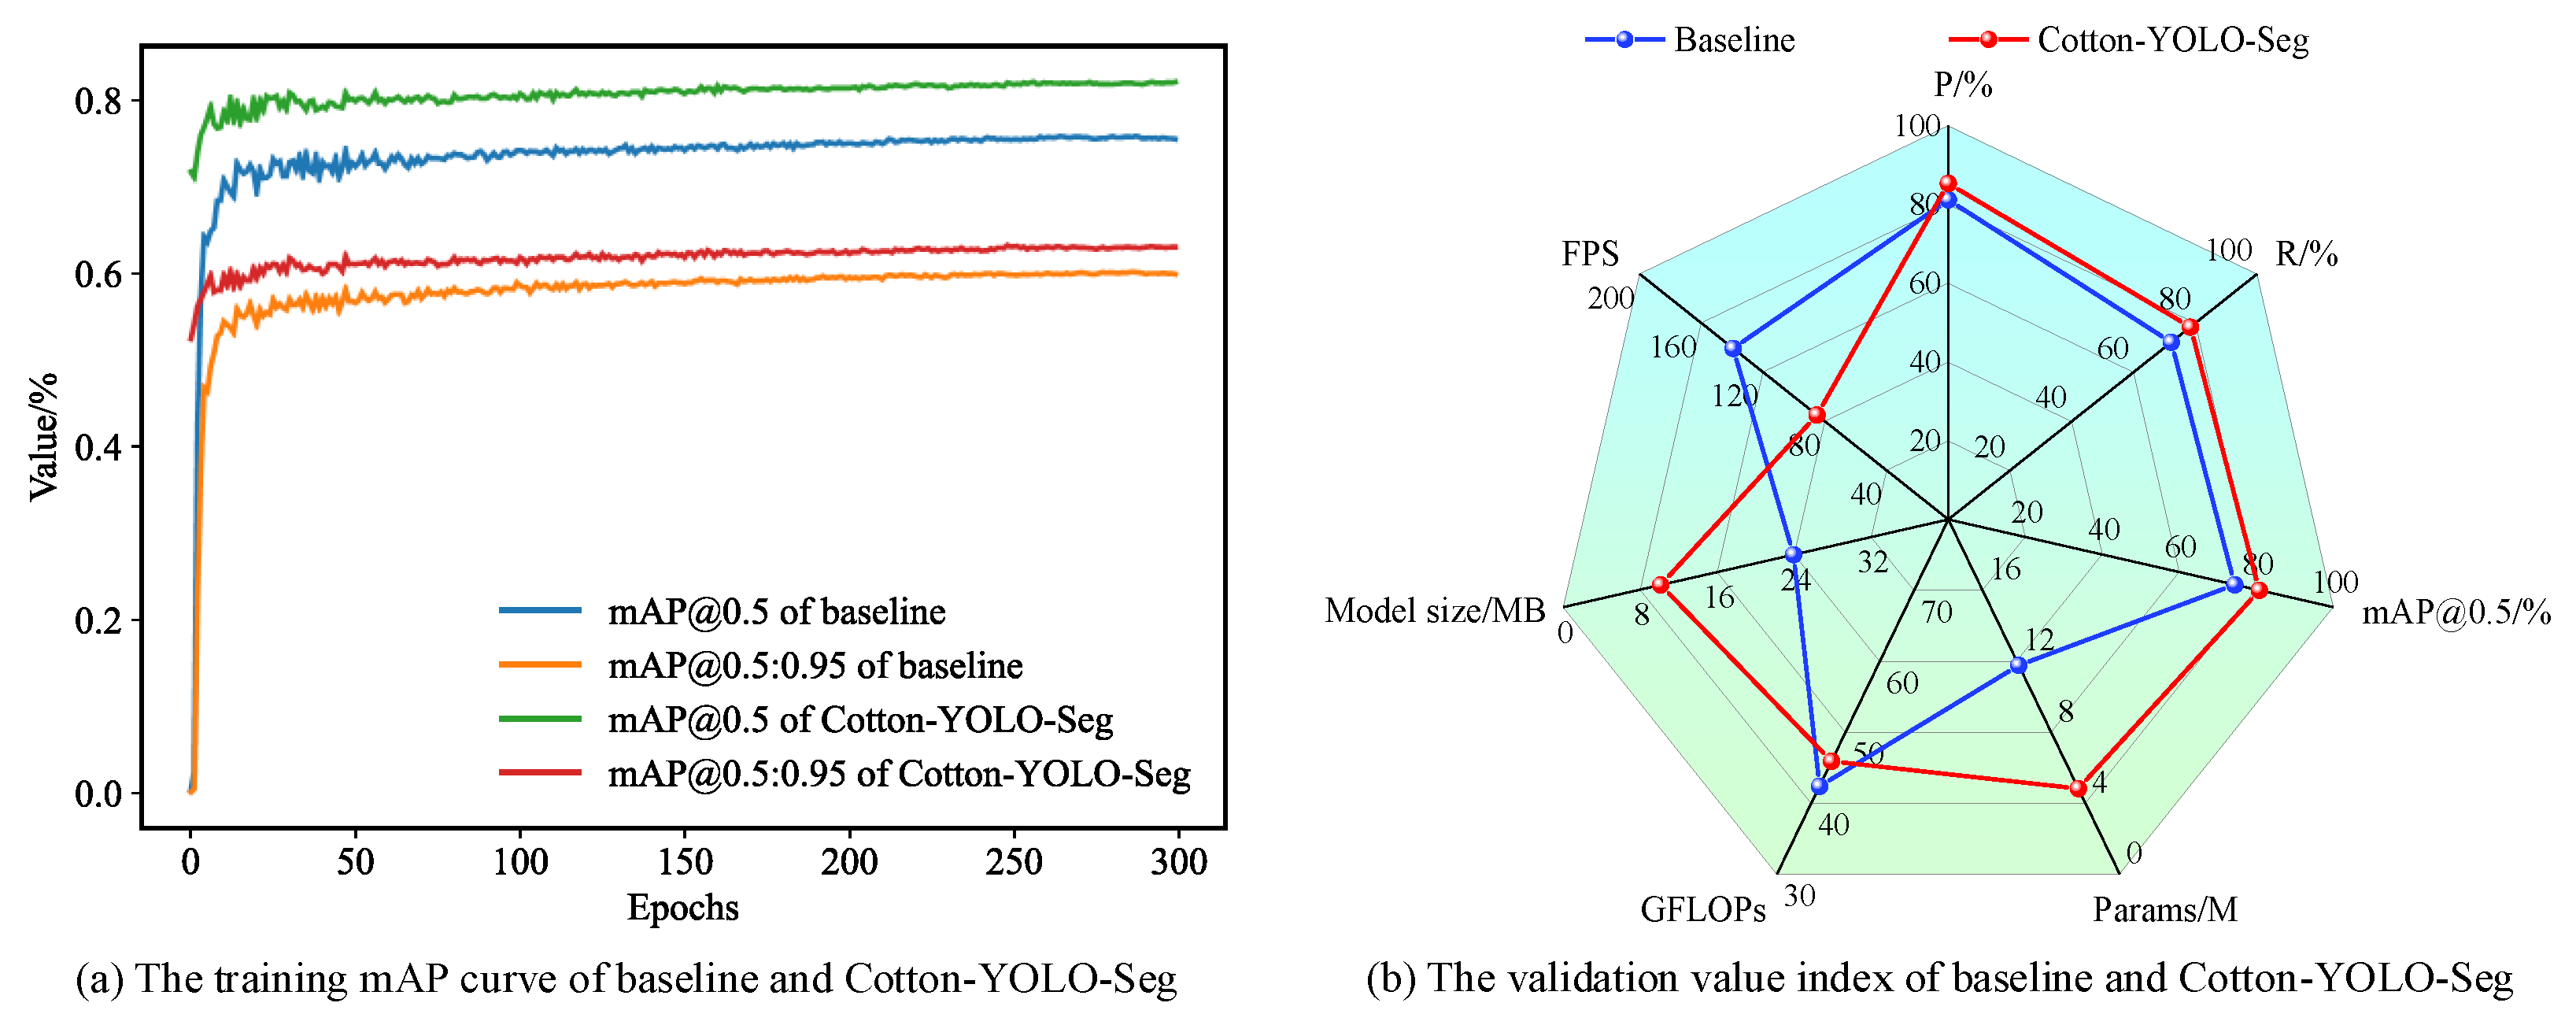
To validate the effectiveness of each improved module, we conducted ablation experiments, where a “✓” denotes the activation of the corresponding method or module. Table 3 performance comparisons of the improved model after adding different modules show that the addition of the improved MSCBCA attention module results in increases of 0.7%, 0.1%, and 0.5% in the accuracy indices P, R, and mAP@0.5, respectively. With the addition of the improved SlimNeck network structure, the model’s accuracy significantly improves, with the accuracy indices P, R, and mAP@0.5 increasing by 4.7%, 5.2%, and 6.0%, respectively. This indicates that most of the target objects in this dataset are small objects. After removing the feature layer P4 from the backbone network, the accuracy index mAP@0.5 increases by 0.4%, indicating that the improvement method is effective. Finally, after using the COCO2017 dataset for transfer learning, the accuracy indices P, R, and mAP@0.5 of the model reach 85.4%, 78.4%, and 80.8%, respectively. These values are 4.2%, 6.2%, and 6.4% higher than those of the original model. This network significantly enhances the detection and segmentation accuracy of the cotton-impurity dataset. Figure 11 shows the comparison of model performance data pre- and post-improvement.
Table 3.
Performance comparison of the improved model after adding different modules.
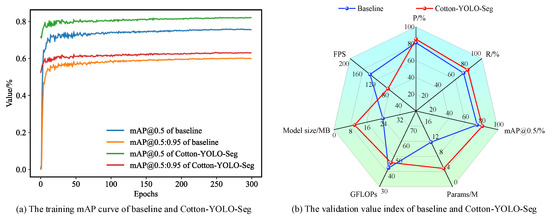
Figure 11.
Comparison of data indicators between pre- and post-improvement.
Figure 12 compares the segmentation performance of the Yolov8s-seg and Cotton-YOLO-Seg for cotton and impurities in the same seed cotton images. Under identical environmental conditions, the final improved Cotton-YOLO-Seg model exhibits obviously better detection and segment performance on the cotton-impurity dataset compared to the original Yolov8s-seg model. The original Yolov8s-seg model is unable to detect and segment small-target impurities effectively, leading to higher rates of missed detections and under-segmentation for these small targets, which consequently results in the overall detected impurity rate in seed cotton images being underestimated.
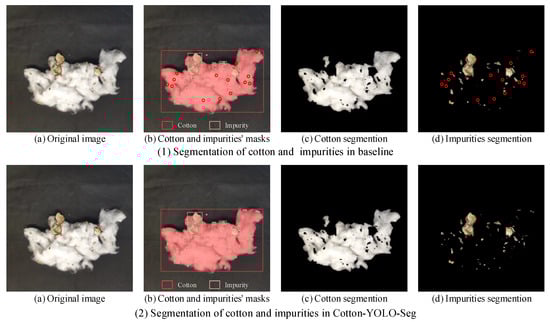
Figure 12.
Comparison of the segmentation result of the Yolov8-seg model and Cotton-YOLO-Seg model for cotton and impurities (where the red circles in (1b,1d) indicate the missed detections of impurities by the Yolov8-seg model).
3.3.3. K-Fold Cross-Validation Experiments
Since the original dataset in this paper is divided into training, validation, and test sets in a ratio of 8:1:1, we fixed the original test set for all K-fold cross-validation experiments to ensure they are evaluated on the same test set. To maintain consistent training conditions, the training and validation sets are also set in a ratio of 8:1. Therefore, this study conducted 9-fold cross-validation experiments on the training and validation sets by randomly selecting a subset as the validation set and the rest as the training set. The partitioning of the dataset in k-fold cross-validation can be seen in Figure 13. This process is repeated until the 9th experiment is completed. Finally, the results of the nine validations are averaged to assess the stability and reliability of the final model’s performance. The results of our K (K = 9) fold cross-validation experiments for the improved model Cotton-YOLO-Seg are shown below.
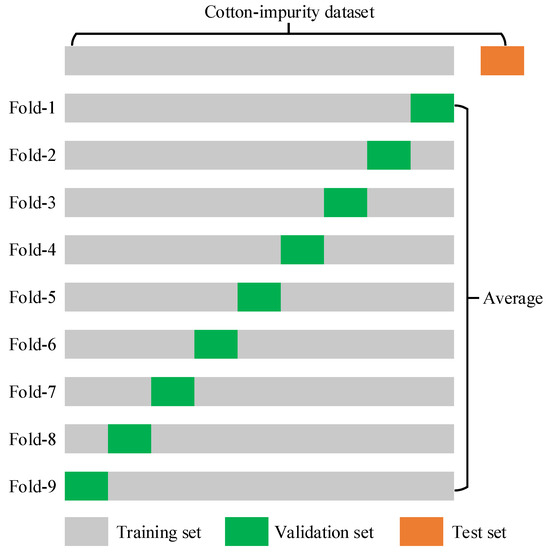
Figure 13.
Partitioning the dataset in K-fold cross-validation.
The experimental data in Table 4 reveal that the precision metrics from the nine cross-validation experiments on the test set are remarkably similar, with average precision indices of 85.2%, 78.4%, and 80.8%, respectively. Compared to the precision metrics of 85.4%, 78.4%, and 80.8% obtained from the test set of the Cotton-YOLO-Seg model with a randomly split dataset in an 8:1:1 ratio, the validation results indicate that our Cotton-YOLO-Seg model exhibits commendable stability and reliability on the self-constructed cotton-impurity dataset.
Table 4.
Evaluation of Cotton-YOLO-Seg model for K-fold cross-validation.
3.3.4. Comparative Experiments with Different Models
To illustrate the advantages of the improved Cotton-YOLO-Seg model, this study compares its instance-segmentation performance with other YOLO instance-segmentation algorithms, as well as instance-segmentation algorithms based on Mask R-CNN, Segmenting Objects by Locations (SOLO) [45], SOLOV2 [46], and YOLACT, using the Open-MMlab Detection Toolbox and Benchmark (MMdetection) [47] toolkit on the cotton-impurity dataset.
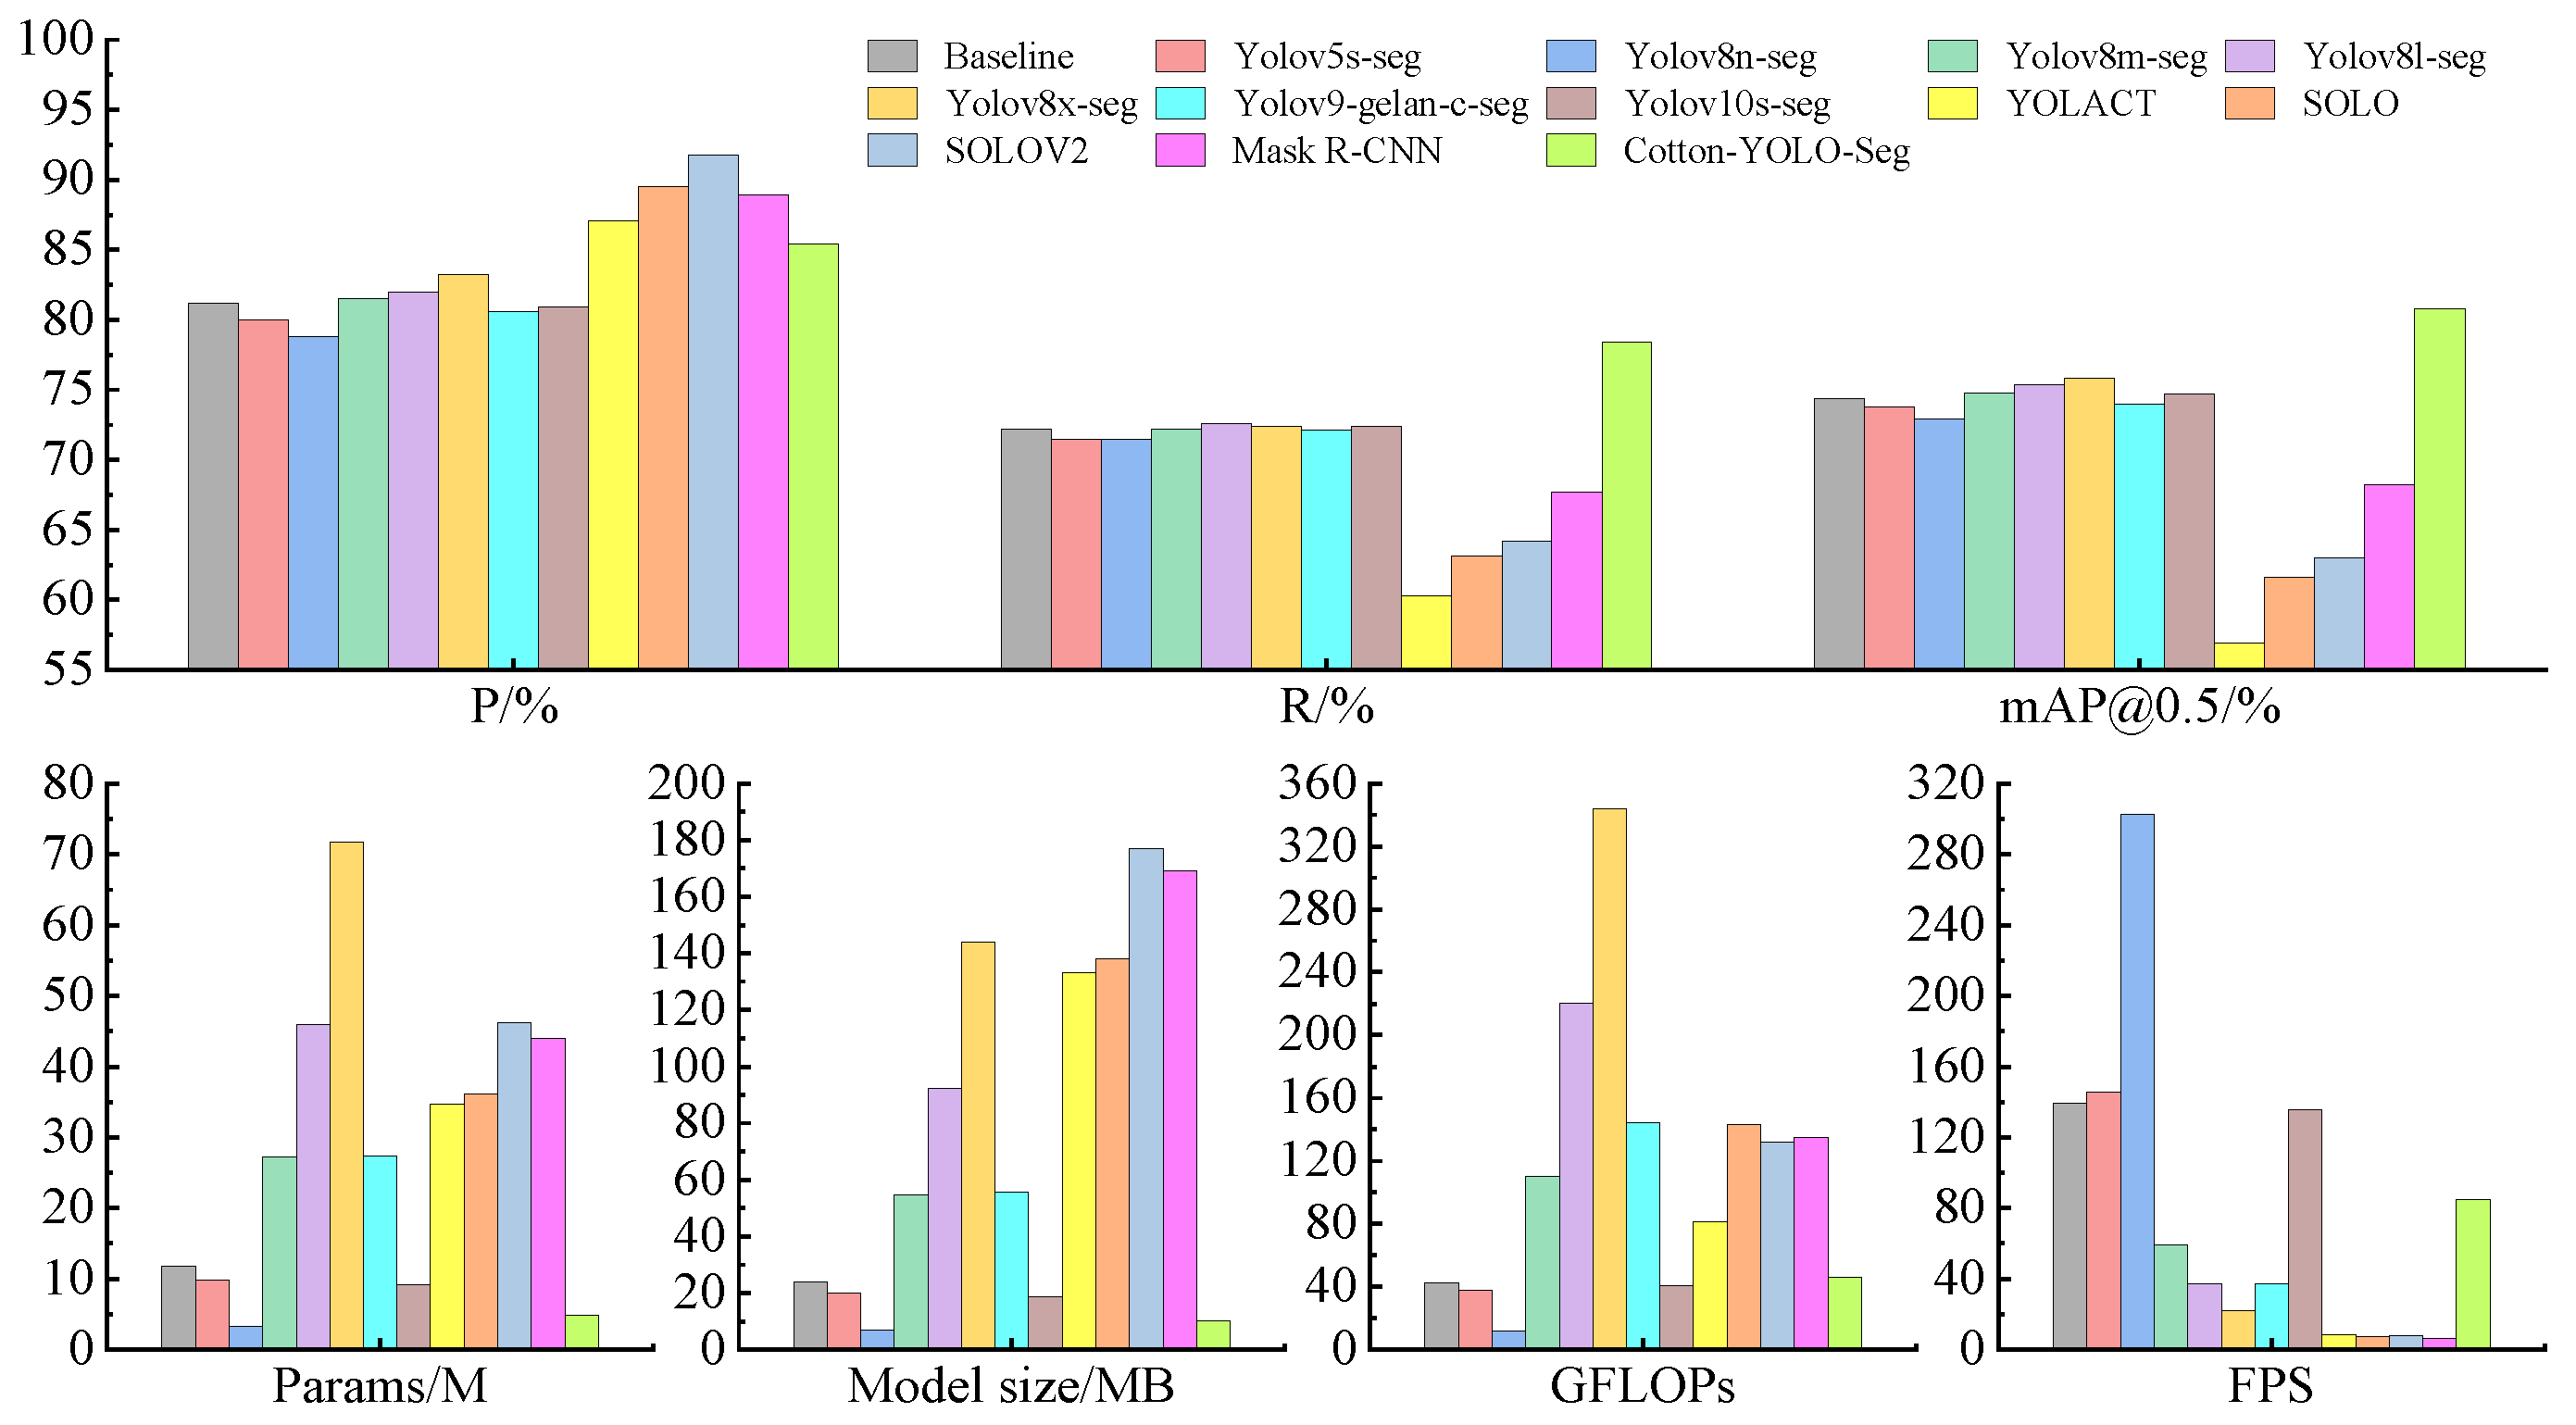
Table 5 and Figure 14 present the comparison results. The Yolov8-seg model demonstrates higher accuracy metrics compared to Yolov5-seg, Yolov9-seg, and Yolov10s-seg, highlighting its advanced capabilities. Among the five versions of Yolov8-seg (n, s, m, l, and x), the depth and width of the models progressively increase, leading to greater model complexity and computational demands. This study selects Yolov8s-seg as the base model for improvement due to its strong feature-extraction capability, higher accuracy metrics, and lighter weight. The n version of Yolov8-seg shows insufficient segmentation performance for small impurities. The m, l, and x versions of Yolov8-seg show only minor improvements compared to the Yolov8s-seg model, but they significantly increase the model size, parameter count, and computational requirements, making them less suitable for edge devices with limited computational resources. YOLACT, SOLO, SOLOV2, and Mask R-CNN perform poorly on the self-constructed cotton-impurity dataset presented in this study. These models exhibit insufficient feature-extraction capabilities for small-target impurities, relatively low accuracy metrics, large model sizes, high parameter counts, and significant computational demands, resulting in slow detection speeds. Consequently, they are not suitable for deployment on edge devices with limited computational resources. As shown in Table 5, the improved Cotton-YOLO-Seg model achieves the highest accuracy metrics. Although the addition of the small target detection layer P2 to the SlimNeck neck network structure slightly increases computational demands, the model’s accuracy metrics significantly improve compared to other models. Additionally, the Cotton-YOLO-Seg model maintains lower complexity and fewer parameters, making the improvements acceptable and beneficial.
Table 5.
Performance comparison of different models.
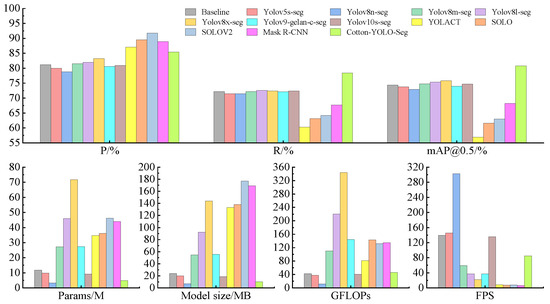
Figure 14.
Histogram comparing the performance of different models.
4. Discussion
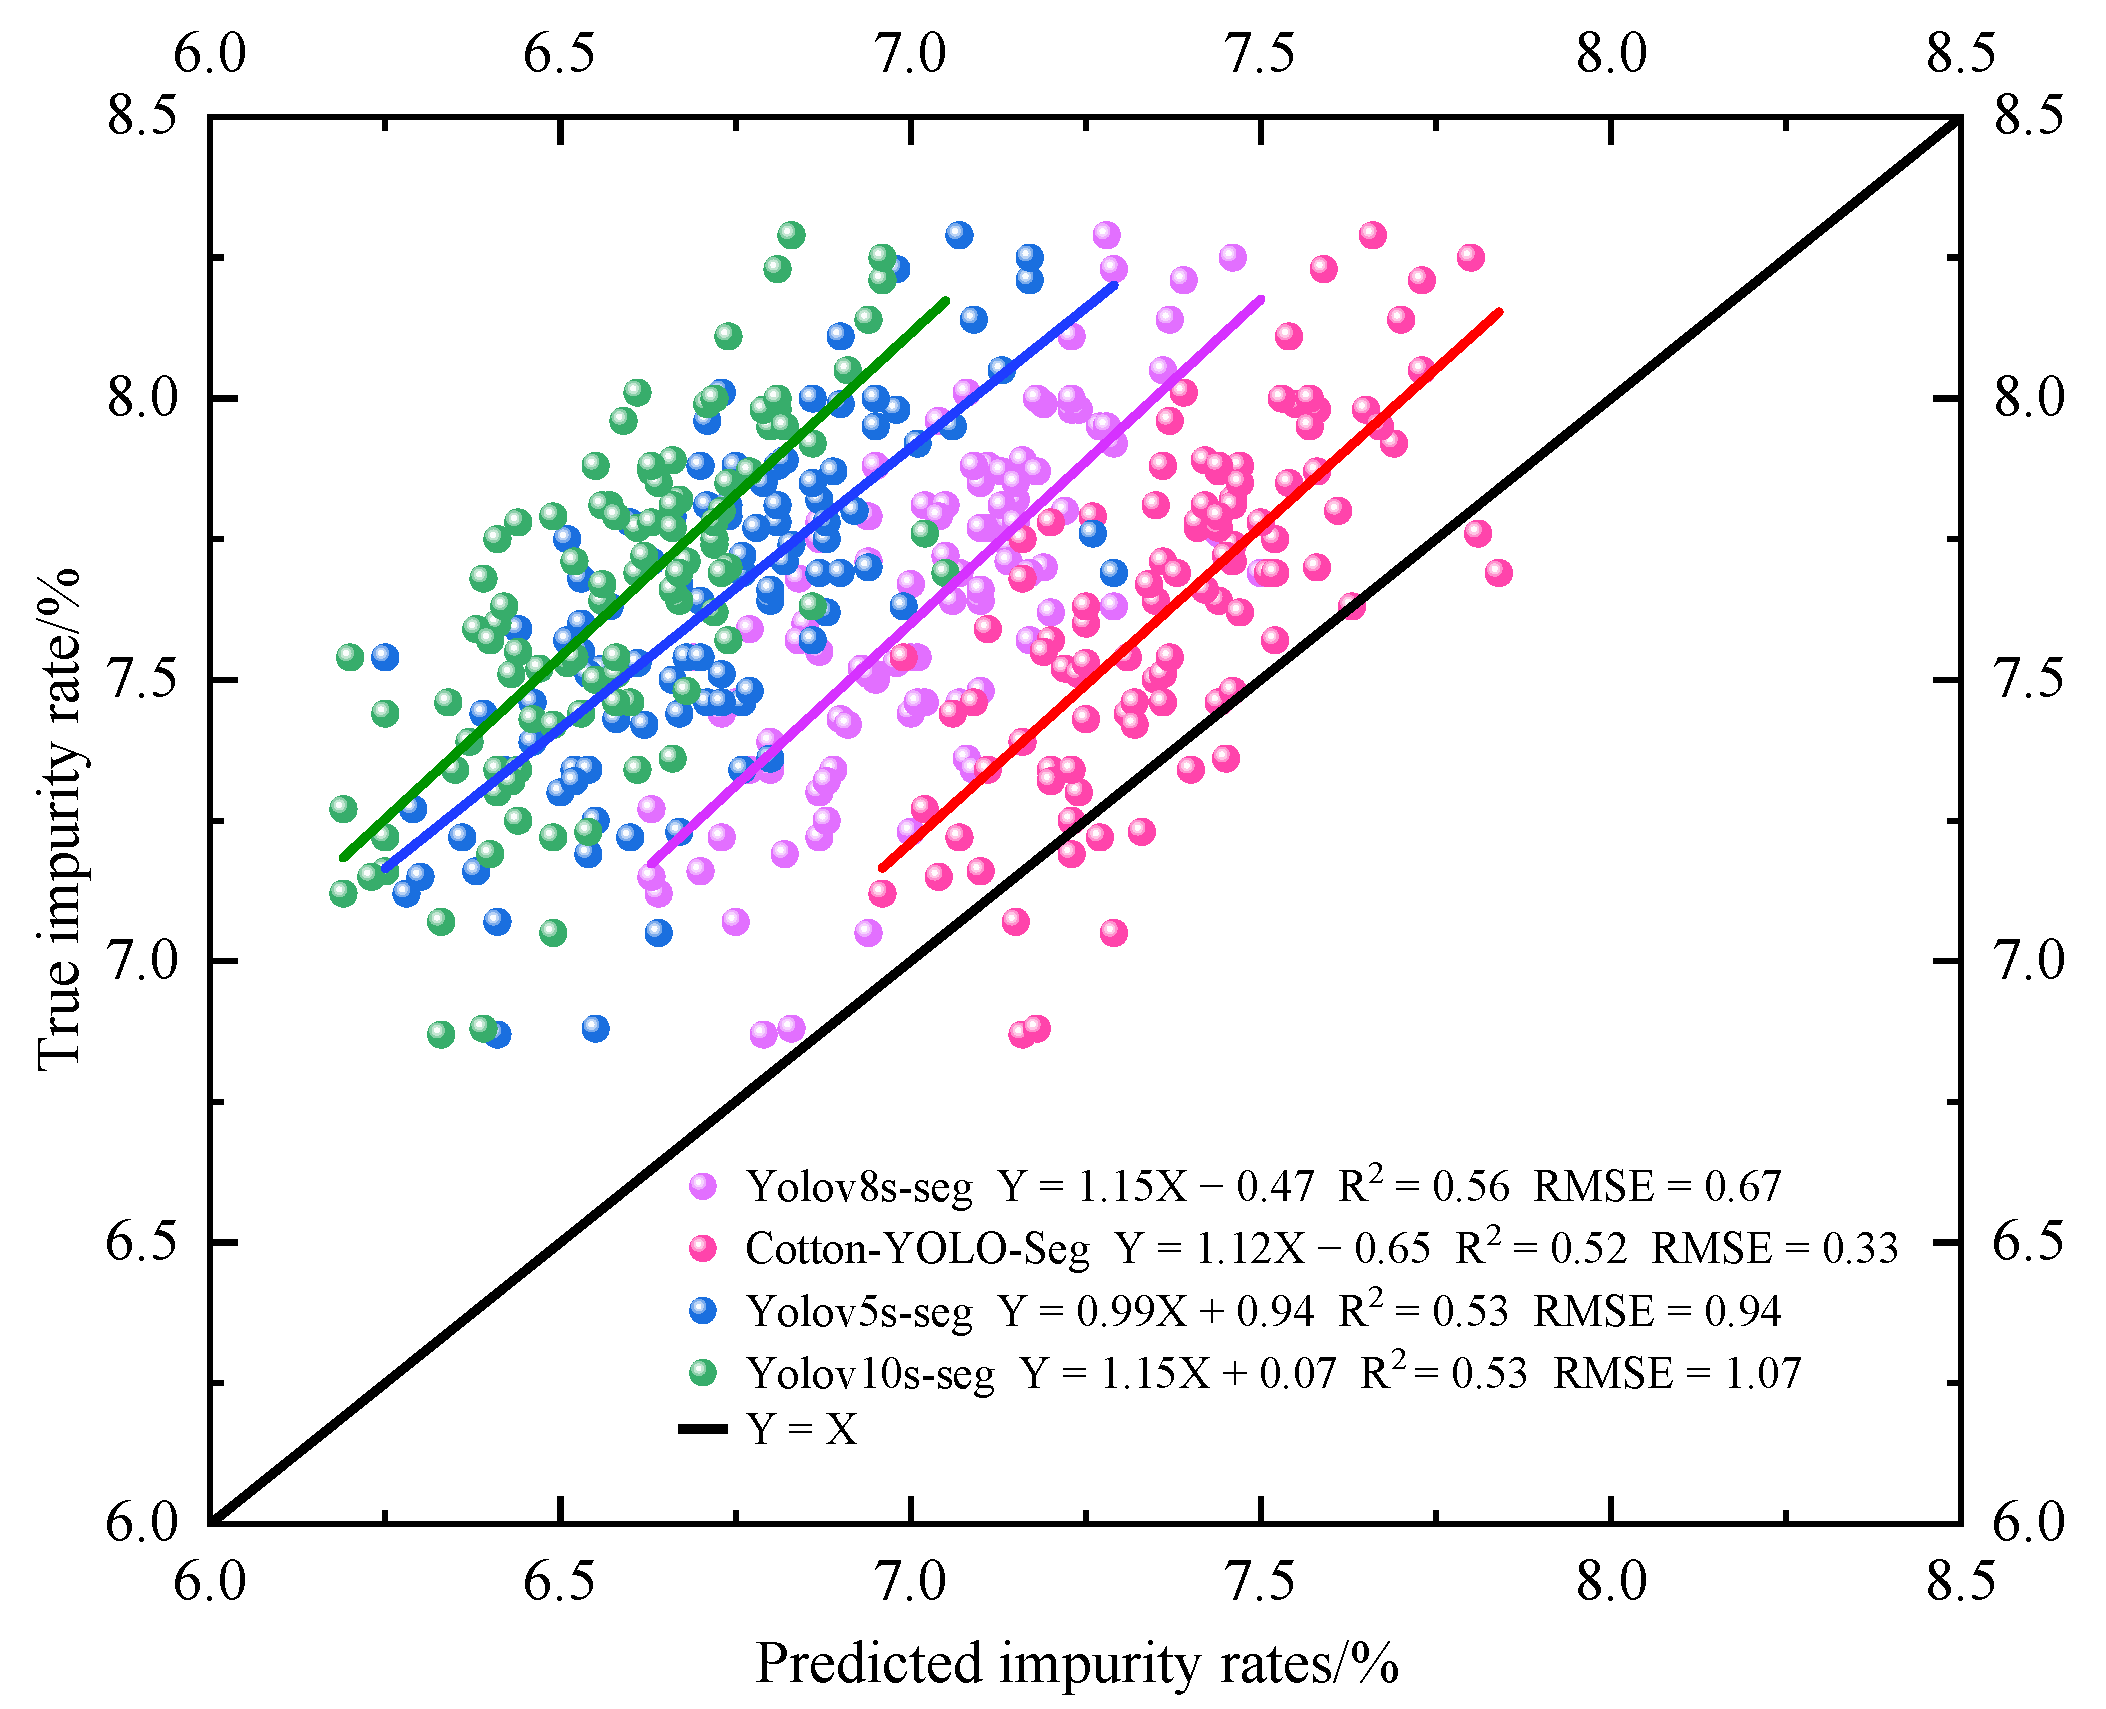
This study conducts impurity rate detection on 100 groups of machine-picked seed cotton image samples. The impurity rate is determined by directly detecting the number of impurities and cotton pixels in each sample group. Figure 15 presents the correlation analysis between the detected and actual impurity rates for each group of cotton samples using different models. The equation relating the detected impurity rate to the actual impurity rate for the Cotton-YOLO-Seg model is y = 1.12x − 0.65, which is closest to y = x. Therefore, the detected and actual impurity rates of the Cotton-YOLO-Seg model are nearly identical. In contrast, the equation for the original Yolov8s-seg model is y = 1.15x − 0.47, indicating a significant deviation from y = x. Table 6 presents the performance evaluation of impurity rate detection across different models. The MAE, RMSE, and MAPE for the Cotton-YOLO-Seg model are 0.29%, 0.33%, and 3.70%, respectively, representing reductions of 52.46%, 48.44%, and 53.75% compared to the original Yolov8s-Seg model. The data indicate that the Cotton-YOLO-Seg model has significantly reduced the deviation between the detected and actual impurity rates. These data demonstrate the advancement of the yolov8s-seg segmentation model in machine-harvested seed cotton compared to yolov5s-seg and yolov10s-seg. They also validate the improvements in the Cotton-YOLO-Seg model and echo the corresponding model data in Table 5 and Figure 14.

Figure 15.
Analysis of the correlation between detected and actual impurity rates across different models.
Table 6.
Performance evaluation of impurity rate detection for different models.
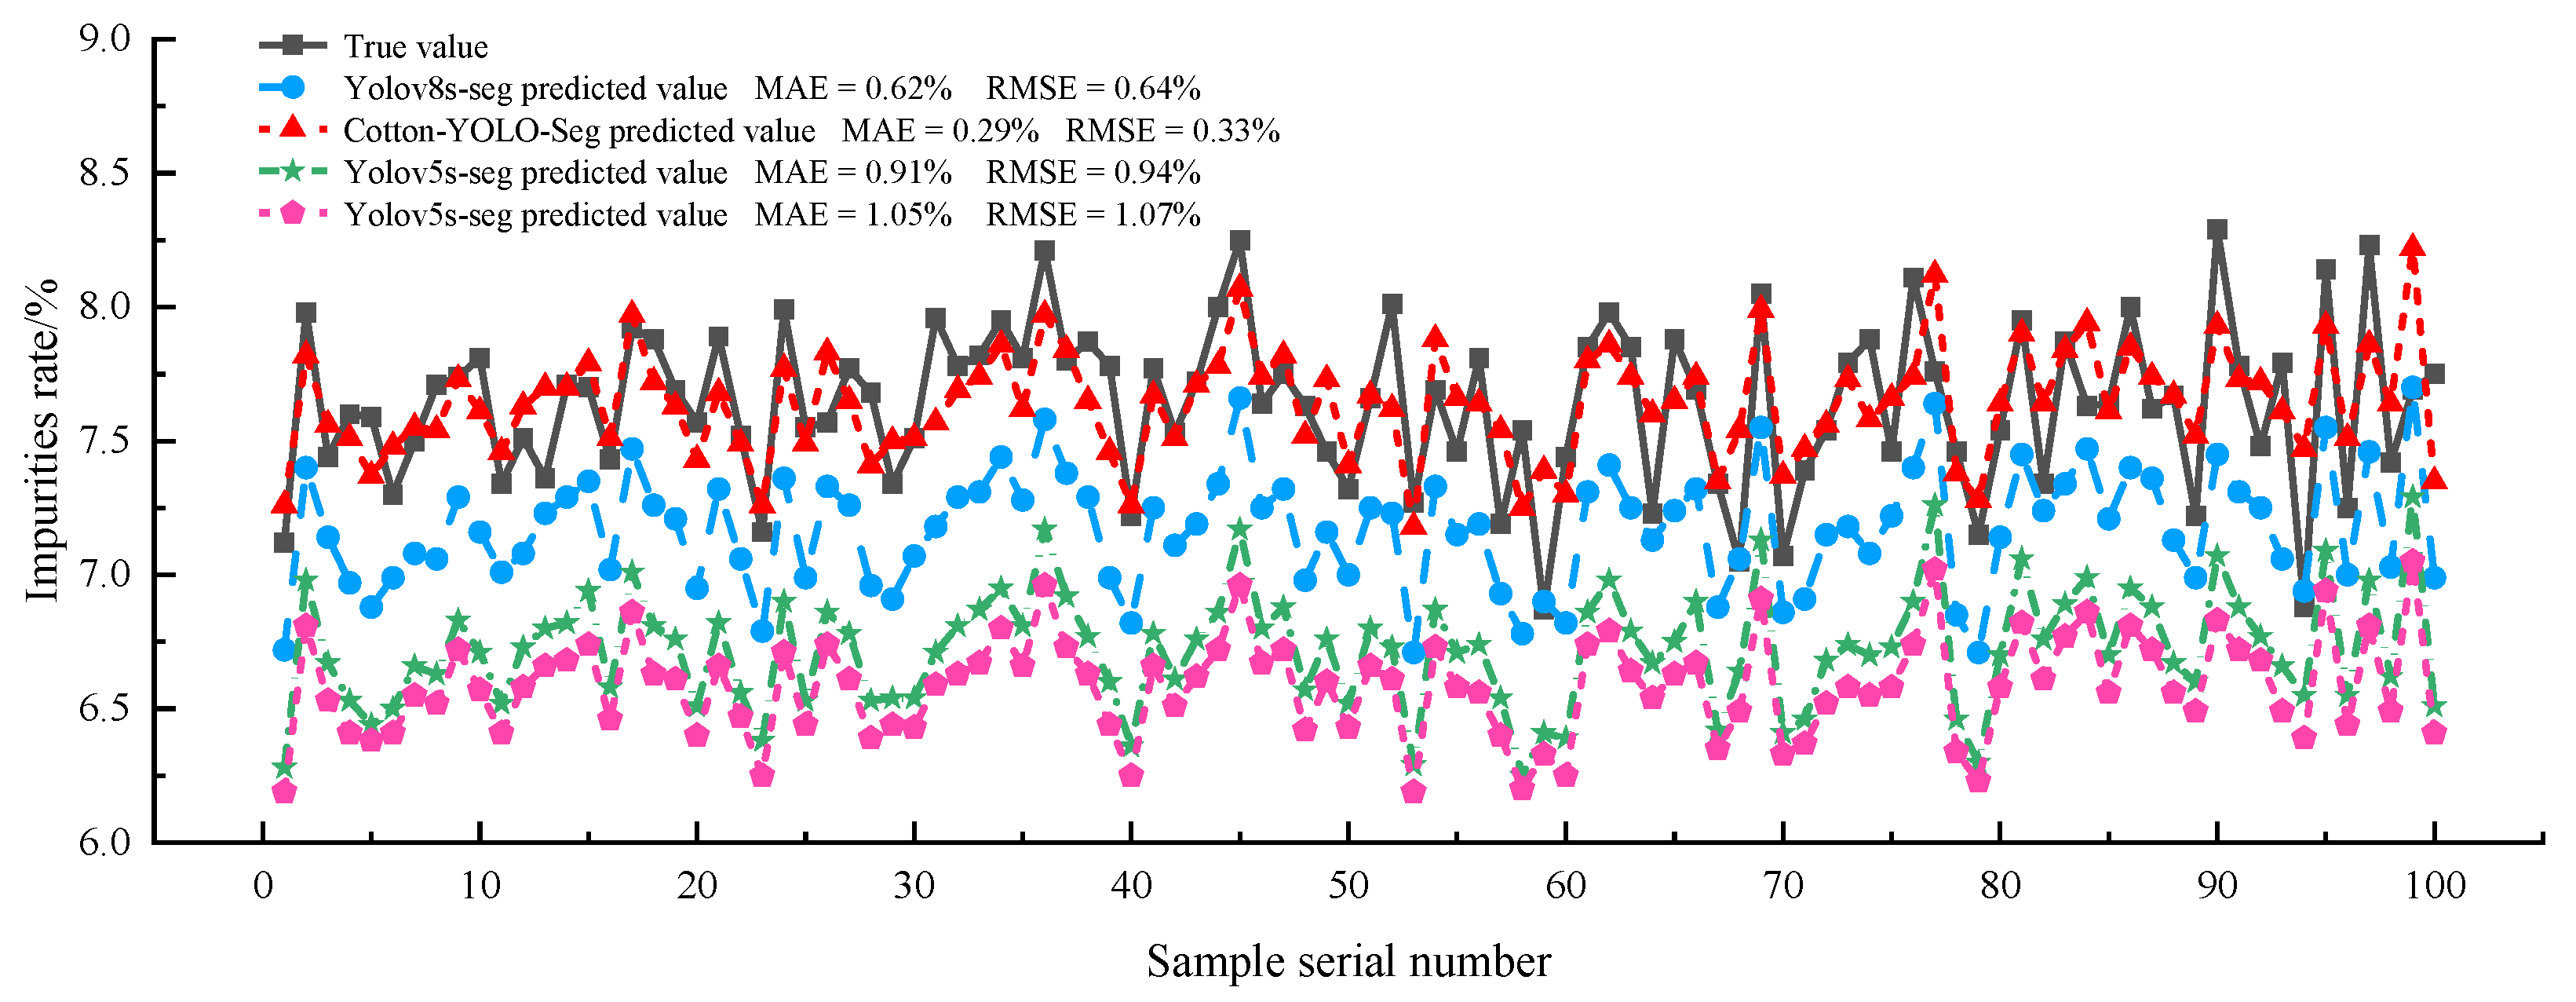
Figure 16 illustrates a line graph comparing the detected and actual impurity rates for 100 sets of cotton samples across different models. The figure clearly demonstrates that the Cotton-YOLO-Seg model detections are more accurate and have smaller errors than other models. The MAE between the detected and actual impurity rates for the Cotton-YOLO-Seg model is only 0.29%, indicating that it fulfills the design requirements. The other models indicate that the overall detected impurity rate in seed cotton images is underestimated.
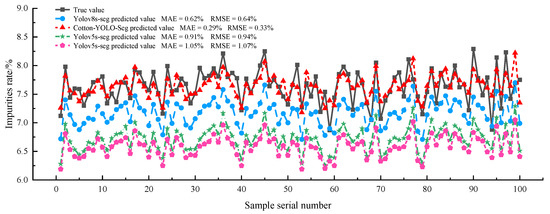
Figure 16.
Relationship between the detected and actual impurity rates of seed cotton in different models.
5. Conclusions
This study proposes a deep learning-based Cotton-YOLO-Seg algorithm for accurately segmenting cotton and impurities in machine-picked seed cotton images. The algorithm detects the impurity rate of machine-picked seed cotton by statistically counting the pixels of cotton and impurities. The manuscript introduces the MSCBCA attention mechanism by fusing CBAM and MSCA in the C2f module of Yolov8s-seg’s feature-extraction network, constructing a new C2f_MSCBCA module, and removing the feature layer P4. The SlimNeck structure is introduced in the feature-fusion network by adding a small target detection layer P2 and removing feature layer P4. Using transfer learning with the COCO instance-segmentation dataset, the Cotton-YOLO-Seg model significantly improves the detection and segmentation performance of small-target impurities, remains robust in complex environments, and accurately detects the impurity rate in cotton images. This method has practical application value for quantitatively detecting the impurity rate of machine-picked seed cotton, evaluating the harvesting quality of cotton pickers, assessing the grade of cotton, and guiding cotton processing.
The Cotton-YOLO-Seg algorithm, as an instance-segmentation and pixel statistical model, is not only suitable for small-target impurity segmentation and impurity rate detection in machine-picked seed cotton images but can also be extended to other application areas, such as crop spot segmentation and area prediction. We plan to continue optimizing and enhancing the Cotton-YOLO-Seg algorithm to achieve both lightweight and high accuracy and embed it into portable devices such as mobile phones. This will enable cotton farmers, purchasers, and processors to use mobile phones to detect the impurity rate of machine-picked seed cotton. This method requires simple equipment, provides accurate impurity detection results, and can be an effective tool for impurity rate detection.
Author Contributions
Methodology, L.J., W.C. and H.S.; validation, L.J. and W.C.; investigation, L.J., H.S., H.Z. and L.W.; data curation, L.J.; writing—original draft preparation, L.J.; writing—review and editing, W.C., H.S., H.Z. and L.W.; supervision, W.C.; funding acquisition, W.C. All authors have read and agreed to the published version of the manuscript.
Funding
This research was funded by National Natural Science Foundation of China (52365008), the Project of Tianchi Talented Young Doctor (CZ002505), the Science and Technology Project of Wujiaqu City (KZ60610101), the High-level Talents Research Initiation Project of Shihezi University (KX012701), and the Research Project of Shihezi University (KX01210406).
Institutional Review Board Statement
Not applicable.
Data Availability Statement
The data presented in this study are available upon request from the corresponding author.
Conflicts of Interest
The authors declare no conflicts of interest.
References
- Li, H.; Zhang, R.; Zhou, W.; Liu, X.; Wang, K.; Zhang, M.; Li, Q. A novel method for seed cotton color measurement based on machine vision technology. Comput. Electron. Agric. 2023, 215, 108381. [Google Scholar] [CrossRef]
- Wang, X.; Yang, W.; Li, Z. A fast image segmentation algorithm for detection of pseudo-foreign fibers in lint cotton. Comput. Electr. Eng. 2015, 46, 500–510. [Google Scholar] [CrossRef]
- Li, Q.; Zhou, W.; Zhang, X. Cotton-Net: Efficient and accurate rapid detection of impurity content in machine-picked seed cotton using near-infrared spectroscopy. Front. Plant Sci. 2024, 15, 1334961. [Google Scholar] [CrossRef] [PubMed]
- Wan, L.; Pang, Y.; Zhang, R.; Jiang, Y.; Zhang, M.; Song, F.; Chang, J.; Xia, B. Rapid measurement system for the impurity rate of machine-picked seed cotton in acquisition. Trans. Chin. Soc. Agric. Eng. 2021, 37, 182–189. [Google Scholar] [CrossRef]
- Zhou, W.; Xv, S.; Liu, C.; Zhang, J. Applications of near infrared spectroscopy in cotton impurity and fiber quality detection: A review. Appl. Spectrosc. Rev. 2016, 51, 318–332. [Google Scholar] [CrossRef]
- Zhang, C.; Li, T.; Li, J. Detection of impurity rate of machine-picked cotton based on improved canny operator. Electronics 2022, 11, 974. [Google Scholar] [CrossRef]
- Zhang, C.; Li, T.; Zhang, W. The detection of impurity content in machine-picked seed cotton based on image processing and improved YOLO V4. Agronomy 2021, 12, 66. [Google Scholar] [CrossRef]
- Zhang, C.; Li, L.; Dong, Q.; Ge, R. Recognition for machine picking seed cotton impurities based on GA-SVM model. Trans. Chin. Soc. Agric. Eng 2016, 32, 189–196. [Google Scholar] [CrossRef]
- Haider, A.; Arsalan, M.; Choi, J.; Sultan, H.; Park, K.R. Robust segmentation of underwater fish based on multi-level feature accumulation. Front. Mar. Sci. 2022, 9, 1010565. [Google Scholar] [CrossRef]
- Fernandes, A.F.; Turra, E.M.; de Alvarenga, É.R.; Passafaro, T.L.; Lopes, F.B.; Alves, G.F.; Singh, V.; Rosa, G.J. Deep Learning image segmentation for extraction of fish body measurements and prediction of body weight and carcass traits in Nile tilapia. Comput. Electron. Agric. 2020, 170, 105274. [Google Scholar] [CrossRef]
- Ni, X.; Li, C.; Jiang, H.; Takeda, F. Deep learning image segmentation and extraction of blueberry fruit traits associated with harvestability and yield. Hortic. Res. 2020, 7, 110. [Google Scholar] [CrossRef] [PubMed]
- Peng, Y.; Wang, A.; Liu, J.; Faheem, M. A comparative study of semantic segmentation models for identification of grape with different varieties. Agriculture 2021, 11, 997. [Google Scholar] [CrossRef]
- Lu, S.; Liu, X.; He, Z.; Zhang, X.; Liu, W.; Karkee, M. Swin-Transformer-YOLOv5 for real-time wine grape bunch detection. Remote Sens. 2022, 14, 5853. [Google Scholar] [CrossRef]
- Wang, X.; Wu, Z.; Jia, M.; Xu, T.; Pan, C.; Qi, X.; Zhao, M. Lightweight SM-YOLOv5 tomato fruit detection algorithm for plant factory. Sensors 2023, 23, 3336. [Google Scholar] [CrossRef]
- Bai, Y.; Mao, S.; Zhou, J.; Zhang, B. Clustered tomato detection and picking point location using machine learning-aided image analysis for automatic robotic harvesting. Precis. Agric. 2023, 24, 727–743. [Google Scholar] [CrossRef]
- Egi, Y.; Hajyzadeh, M.; Eyceyurt, E. Drone-computer communication based tomato generative organ counting model using YOLO V5 and deep-sort. Agriculture 2022, 12, 1290. [Google Scholar] [CrossRef]
- Chen, S.; Xiong, J.; Guo, W.; Bu, R.; Zheng, Z.; Chen, Y.; Yang, Z.; Lin, R. Colored rice quality inspection system using machine vision. J. Cereal Sci. 2019, 88, 87–95. [Google Scholar] [CrossRef]
- Liu, L.; Liang, J.; Wang, J.; Hu, P.; Wan, L.; Zheng, Q. An improved YOLOv5-based approach to soybean phenotype information perception. Comput. Electr. Eng. 2023, 106, 108582. [Google Scholar] [CrossRef]
- He, Y.; Fan, B.; Sun, L.; Fan, X.; Zhang, J.; Li, Y.; Suo, X. Rapid appearance quality of rice based on machine vision and convolutional neural network research on automatic detection system. Front. Plant Sci. 2023, 14, 1190591. [Google Scholar] [CrossRef]
- Taylor, R.A. Estimating the quantity of usable fibers in baled cotton. Text. Res. J. 1986, 56, 705–711. [Google Scholar] [CrossRef]
- Taylor, R.A. Estimating the size of cotton trash with video images. Text. Res. J. 1990, 60, 185–193. [Google Scholar] [CrossRef]
- Yang, W.; Li, D.; Zhu, L.; Kang, Y.; Li, F. A new approach for image processing in foreign fiber detection. Comput. Electron. Agric. 2009, 68, 68–77. [Google Scholar] [CrossRef]
- Zhang, X.; Li, D.; Yang, W.; Wang, J.; Liu, S. A fast segmentation method for high-resolution color images of foreign fibers in cotton. Comput. Electron. Agric. 2011, 78, 71–79. [Google Scholar] [CrossRef]
- Singh, N.; Tewari, V.; Biswas, P.; Dhruw, L.; Pareek, C.; Singh, H.D. Semantic segmentation of in-field cotton bolls from the sky using deep convolutional neural networks. Smart Agric. Technol. 2022, 2, 100045. [Google Scholar] [CrossRef]
- Singh, N.; Tewari, V.; Biswas, P.; Dhruw, L. Lightweight convolutional neural network models for semantic segmentation of in-field cotton bolls. Artif. Intell. Agric. 2023, 8, 1–19. [Google Scholar] [CrossRef]
- Tedesco-Oliveira, D.; da Silva, R.P.; Maldonado Jr, W.; Zerbato, C. Convolutional neural networks in predicting cotton yield from images of commercial fields. Comput. Electron. Agric. 2020, 171, 105307. [Google Scholar] [CrossRef]
- Wei, W.; Zhang, C.; Deng, D. Content estimation of foreign fibers in cotton based on deep learning. Electronics 2020, 9, 1795. [Google Scholar] [CrossRef]
- Li, Q.; Ma, W.; Li, H.; Zhang, X.; Zhang, R.; Zhou, W. Cotton-YOLO: Improved YOLOV7 for rapid detection of foreign fibers in seed cotton. Comput. Electron. Agric. 2024, 219, 108752. [Google Scholar] [CrossRef]
- Xu, T.; Ma, A.; Lv, H.; Dai, Y.; Lin, S.; Tan, H. A lightweight network of near cotton-coloured impurity detection method in raw cotton based on weighted feature fusion. IET Image Proc. 2023, 17, 2585–2595. [Google Scholar] [CrossRef]
- Zhang, Y.; Yang, G.; Liu, Y.; Wang, C.; Yin, Y. An improved YOLO network for unopened cotton boll detection in the field. J. Intell. Fuzzy Syst. 2022, 42, 2193–2206. [Google Scholar] [CrossRef]
- Liu, Q.; Zhang, Y.; Yang, G. Small unopened cotton boll counting by detection with MRF-YOLO in the wild. Comput. Electron. Agric. 2023, 204, 107576. [Google Scholar] [CrossRef]
- Zhu, L.; Li, X.; Sun, H.; Han, Y. Research on CBF-YOLO detection model for common soybean pests in complex environment. Comput. Electron. Agric. 2024, 216, 108515. [Google Scholar] [CrossRef]
- Tian, Y.; Wang, S.; Li, E.; Yang, G.; Liang, Z.; Tan, M. MD-YOLO: Multi-scale Dense YOLO for small target pest detection. Comput. Electron. Agric. 2023, 213, 108233. [Google Scholar] [CrossRef]
- He, K.; Gkioxari, G.; Dollár, P.; Girshick, R. Mask r-cnn. In Proceedings of the IEEE International Conference on Computer Vision 2017, Venice, Italy, 22–29 October 2017; pp. 2961–2969. [Google Scholar] [CrossRef]
- Bolya, D.; Zhou, C.; Xiao, F.; Lee, Y.J. Yolact: Real-time instance segmentation. In Proceedings of the IEEE/CVF International Conference on Computer Vision 2019, Seoul, Republic of Korea, 27 October–2 November 2019; pp. 9157–9166. [Google Scholar] [CrossRef]
- Wang, C.-Y.; Yeh, I.-H.; Liao, H.-Y.M. YOLOv9: Learning What You Want to Learn Using Programmable Gradient Information. arXiv 2024. [Google Scholar] [CrossRef]
- Wang, A.; Chen, H.; Liu, L.; Chen, K.; Lin, Z.; Han, J.; Ding, G. YOLOv10: Real-Time End-to-End Object Detection. arXiv 2024. [Google Scholar] [CrossRef]
- Lin, T.-Y.; Maire, M.; Belongie, S.; Hays, J.; Perona, P.; Ramanan, D.; Dollár, P.; Zitnick, C.L. Microsoft coco: Common objects in context. In Proceedings of the Computer Vision–ECCV 2014: 13th European Conference, Zurich, Switzerland, 6–12 September 2014; Proceedings, Part V 13. pp. 740–755. [Google Scholar] [CrossRef]
- Woo, S.; Park, J.; Lee, J.-Y.; Kweon, I.S. Cbam: Convolutional block attention module. In Proceedings of the European Conference on Computer Vision (ECCV) 2018, Munich, Germany, 8–14 September 2018; pp. 3–19. [Google Scholar] [CrossRef]
- Guo, M.-H.; Lu, C.-Z.; Hou, Q.; Liu, Z.; Cheng, M.-M.; Hu, S.-M. Segnext: Rethinking convolutional attention design for semantic segmentation. Adv. Neural Inf. Process. Syst. 2022, 35, 1140–1156. [Google Scholar] [CrossRef]
- Li, H.; Li, J.; Wei, H.; Liu, Z.; Zhan, Z.; Ren, Q. Slim-neck by GSConv: A better design paradigm of detector architectures for autonomous vehicles. arXiv 2022. [Google Scholar] [CrossRef]
- Chu, B.; Shao, R.; Fang, Y.; Lu, Y. Weed Detection Method Based on Improved YOLOv8 with Neck-Slim. In Proceedings of the 2023 China Automation Congress (CAC), Nanjing, China, 2–5 October 2023; pp. 9378–9382. [Google Scholar] [CrossRef]
- Lin, B. Safety Helmet Detection Based on Improved YOLOv8. IEEE Access 2024, 12, 28260–28272. [Google Scholar] [CrossRef]
- Kandel, I.; Castelli, M. The effect of batch size on the generalizability of the convolutional neural networks on a histopathology dataset. ICT Express 2020, 6, 312–315. [Google Scholar] [CrossRef]
- Wang, X.; Kong, T.; Shen, C.; Jiang, Y.; Li, L. Solo: Segmenting objects by locations. In Proceedings of the Computer Vision–ECCV 2020: 16th European Conference, Glasgow, UK, 23–28 August 2020; Proceedings, Part XVIII 16 2020. pp. 649–665. [Google Scholar] [CrossRef]
- Wang, X.; Zhang, R.; Kong, T.; Li, L.; Shen, C. Solov2: Dynamic and fast instance segmentation. Adv. Neural Inf. Process. Syst. 2020, 33, 17721–17732. [Google Scholar] [CrossRef]
- Chen, K.; Wang, J.; Pang, J.; Cao, Y.; Xiong, Y.; Li, X.; Sun, S.; Feng, W.; Liu, Z.; Xu, J. MMDetection: Open mmlab detection toolbox and benchmark. arXiv 2019. [Google Scholar] [CrossRef]


Disclaimer/Publisher’s Note: The statements, opinions and data contained in all publications are solely those of the individual author(s) and contributor(s) and not of MDPI and/or the editor(s). MDPI and/or the editor(s) disclaim responsibility for any injury to people or property resulting from any ideas, methods, instructions or products referred to in the content. |
© 2024 by the authors. Licensee MDPI, Basel, Switzerland. This article is an open access article distributed under the terms and conditions of the Creative Commons Attribution (CC BY) license (https://creativecommons.org/licenses/by/4.0/).