Article

Spatial and Temporal Variations of Climate Resources during the Growing Season of Early-Season Rice in Hunan Province

1
State Key Laboratory of Hybrid Rice, Hunan Hybrid Rice Research Center, Hunan Academy of Agricultural Sciences, Changsha 410125, China
2
National Innovation Center of Saline-Alkali Tolerant Rice in Sanya, Sanya 572000, China
3
Hunan Biological and Electromechanical Polytechnic, Changsha 410127, China
4
Academy for Advanced Interdisciplinary Studies, Northeast Normal University, Changchun 130024, China
*
Authors to whom correspondence should be addressed.
These authors contributed equally to this work.
Agriculture 2024, 14(9), 1514; https://doi.org/10.3390/agriculture14091514
Submission received: 26 June 2024 / Revised: 30 July 2024 / Accepted: 21 August 2024 / Published: 3 September 2024
(This article belongs to the Special Issue Rice Ecophysiology and Production: Yield, Quality and Sustainability)

Abstract

:
The rising temperatures and changes in precipitation due to climate change have significantly impacted agricultural production. Evaluating the effects of climate change on rice production is crucial for improving rice cultivation techniques and ensuring food security. It is essential to comprehensively examine the climatic, spatial, and temporal variations during the duration of crop production. Previous research has mainly focused on different rice planting areas, rice types, and various growth stages of rice. However, more research is needed on the climatic changes during the crop-growing season in specific regions. Therefore, this study compiled complete daily meteorological data from 37 meteorological stations in Hunan Province from 1961 to 2020. The period from 1961 to 2020 was divided into three segments: 1961–1980 (a), 1981–2000 (b), and 2001–2020 (c), to analyze the characteristics of agricultural climate resource changes during different growth stages of early-season rice in Hunan Province. Results show that the heat resources were significantly increased (accumulated temperature growth rate of 43.36 °C/10a), the sunshine resources were decreased by −14.60 h/10a, and the precipitation resources were slightly increased by 6.85 mm/10a. The increase in heat resources mainly occurs during the vegetative growth stage of early-season rice. Additionally, the high-value regions of heat resources and precipitation in period c are 97.8% and 34.2% higher than the average values of periods a and b, respectively. In contrast, the regions with high sunshine hours significantly decreased in period c compared to periods a and b. In summary, the heat, sunshine, and water resources in the central and eastern regions of Hunan Province increase simultaneously, and appropriate cultivation measures should be adopted in the future to improve the yield and resource utilization efficiency of early-season rice in a double-cropping system.

1. Introduction

Global warming, rising temperatures, and changes in precipitation are having a significant impact on agricultural production. According to the IPCC report, the global average surface temperature has risen by 0.87 °C in the last decade, and it is projected to rise by a further 1.5 °C between 2030 and 2052 [1]. Studies show that if the global temperature rises by 2.5 °C, the maximum reduction in China’s grain yield per unit area could be around 20%. The positive effects of agricultural technological progress and CO2 fertilization on yields will be largely offset by the negative effects of climate change [2,3,4], posing significant potential risks to global food security [5,6]. Rice is China’s most important staple food, with total rice production remaining above 200 million metric tons per year, accounting for about 34% of the national grain production and ensuring the absolute security of the national staple food [7,8]. However, there were four years between 2011 and 2021 when the area decreased year-on-year. Additionally, more than half of the counties and cities across the country have experienced stagnation in rice yield increases due to changes in temperature, radiation, and adverse climatic conditions [9,10]. Consequently, the assessment of the impact of climate change on rice production is of paramount importance for the advancement of rice production technology, the mitigation of global warming, and the assurance of food security.
China is one of the countries most significantly affected by global warming. Over the past 100 years, the average temperature in China has increased by 0.5–0.8 °C, with a warming rate of 0.08 °C per decade [11]. Studies indicate that the rice production system is one of the most sensitive agricultural ecosystems to climate change, which affects rice planting systems, growth periods, quality, and grain yield [12,13,14]. It has been suggested that climate change has resulted in the northward expansion of rice planting areas, a reduction in the rice growth period, and a decline in the quality of rice; on the contrary, climate change has also led to an improvement in the cooking and taste quality of rice, as well as its nutritional value [15,16,17]. The temperature during the global rice-growing season has increased significantly since the 1980s, with the warming rate exceeding the inter-annual variation standard deviation in most regions, and the warming rate is even more than twice the inter-annual variation standard deviation in some rice-producing areas of China [18]. It was reported that the average temperature and the minimum temperature during the rice growing season in China increased by 0.47 °C and 0.61 °C, respectively, from 1961 to 2010 [19]. Additionally, the total effective accumulated temperature (≥10 °C) in China’s rice-growing areas increased by an average of 9.4% in the 2000s compared to the 1960s, with more significant increases observed in the northeastern and southwestern rice regions [20]. In comparison to the double-cropping late rice growing season, the increase in heat resources during the double-cropping early rice growing season in the middle reaches of the Yangtze River is more pronounced [21]. Additionally, the characteristics of temperature changes vary significantly among different rice planting areas, different rice types, and various growth stages of rice [22,23]. Therefore, when analyzing and assessing crop production in a specific region, it is essential to comprehensively analyze the climatic conditions and spatial–temporal variations during the crop growth period. However, more research is needed on the climatic changes during the crop-growing season in specific regions.
Hunan Province is a major rice-producing province in China, with the largest planting area and total production of double-cropping early rice and late rice, consistently ranking first in the country [24,25]. It holds a significant position in China’s indica rice production. Additionally, Hunan Province, located in the middle reaches of the Yangtze River, is one of the main grain-producing areas with the most significant rate and magnitude of warming in China. The region shows a clear trend of climate warming, with the rate of temperature increase slightly below the national average [26,27,28]. The number of sunshine hours is decreasing [29,30], and the annual precipitation shows a downward trend with interannual variations [31,32]. Since the 1980s, Hunan Province has exhibited a significant climate warming trend, with the average temperature rising by 0.42 °C compared to the 1960s and the climate tendency rate being 0.3 °C per decade. The accumulated temperature above 0 °C showed a decreasing trend from the 1960s to the 1980s but increased significantly after the 1980s, with a climate change rate of 42.9 °C per decade. The number of sunshine hours has shown a clear fluctuation trend, increasing from the 1960s to the 1970s and decreasing after the 1980s. The overall trend of precipitation has been upward since the 1960s [33,34]. However, the characteristics of climate change during the growing season of double-cropping early rice in Hunan Province are not yet clear. Therefore, this study compiled complete daily meteorological data from 37 meteorological stations in Hunan Province from 1961 to 2020. The period from 1961 to 2020 was divided into three segments: 1961–1980 (a), 1981–2000 (b), and 2001–2020 (c). This study focused on analyzing the characteristics of agricultural climate resource changes during different growth stages of early double-cropping rice in Hunan Province, aiming to provide a theoretical basis for responding to climate change and rationally utilizing climate resources in the region’s double-cropping rice production.

2. Materials and Methods

2.1. Experimental Site

The study area, located in Hunan Province in the southeastern part of China, lies south of the middle reaches of the Yangtze River and north of the Nanling Mountains, covering a total area of 211,800 square kilometers. It belongs to a typical subtropical monsoon climate zone. The annual sunshine hours in Hunan Province range from 1300 to 1800 h, with an average annual temperature of 16–18 °C and an average annual rainfall of 1200–1700 mm. Rainfall is abundant, though unevenly distributed throughout the seasons, and generally sufficient to meet the water requirements of crops. Hunan Province is one of the major provinces for double-cropping rice cultivation in China, with double-cropping rice mainly grown in the Pinghu area of northern Hunan, the hilly areas of southern Hunan, and the basin areas of eastern hilly Hunan.

2.2. Data Sources

Meteorological data were sourced from the National Meteorological Information Center of the China Meteorological Administration. After sorting and excluding stations with incomplete data for certain years, the meteorological stations are mainly located in the double-cropping rice area of Hunan Province. A total of 35 meteorological stations meeting the data requirements were selected (Supplementary Figure S1). The daily meteorological data spans from 1961 to 2020 and includes elements such as average temperature, maximum temperature, minimum temperature, precipitation, and sunshine hours. Basic geographical information data were collected from the China Surveying and Mapping Bureau’s Data Center (http://www.ngcc.cn/dlxxzy/gjchjzsjk/).

2.3. Research Methods and Measurement Indicators

By organizing and analyzing daily historical meteorological data from 1961 to 2020 in Hunan Province, this study employs mathematical statistical analysis methods based on multiple linear regression to analyze meteorological data. Considering the characteristics of climate change in China and conducting comparative analysis for different periods, this study divides the period from 1961 to 2020 into three complete periods: 1961–1980 (a), 1981–2000 (b), and 2001–2020 (c). The period from March to July is set as the growth period of double-cropping early-season rice, and the growth period of double-season early rice is divided into five stages: seedling breeding period (15 March to 15 April), transplanting and tillering period (15 April to 15 May), panicle initiation period (15 May to 10 June), heading period (10 June to 20 June), and grain filling and ripening period (20 June to 15 July).
(1) Effective accumulated temperature (ATe): It is the sum of daily average temperatures during a period when the average temperature is ≥10 °C [35].
(2) Climate change trend rate: It is represented by 10 times the slope of the linear regression of climate elements with time series, serving as an indicator of the long-term trend of meteorological elements [36]. To fit the climate change elements into a linear regression, the least squares method is used to establish a regression model of meteorological elements with time. The regression coefficient is denoted by a. The mathematical expression is χ t = a t + b t = 1, 2, … n (years), where χ t represents a certain climate variable with a sample size of n, and a and b can be estimated using the least squares method, where a is the regression constant and b is the regression coefficient. The rate of change in climate elements every 10 years is calculated as 10a.
(3) Spatial interpolation and result presentation: To visually display the spatiotemporal characteristics of climate in Hunan Province, GIS graphics are used to display the numerical values of various climate elements and climate trend rates in the meteorological data analysis results. ArcGIS 10.8 software is employed, utilizing the Geostatistical Analyst function module for inverse distance weighting interpolation (IDW) of climate trend rates and various meteorological elements. The spatial raster data are generated using a cell size parameter set to 500 m, and regional area editing and modification of meteorological element data values are conducted using the Spatial Analyst Tools [37]. These figures for the distribution of climate data and their climatic trend rate at separate stages (a: 1961–1980; b: 1981–2000; c: 2001–2020) were created using the NBC natural fracture method in ArcGIS 10.8 software.
(4) Heat resources: It includes daily average temperature (DAT), average daily maximum temperature (DATmax), average daily minimum temperature (DATmin), and effective accumulated temperature (ATe).

3. Results

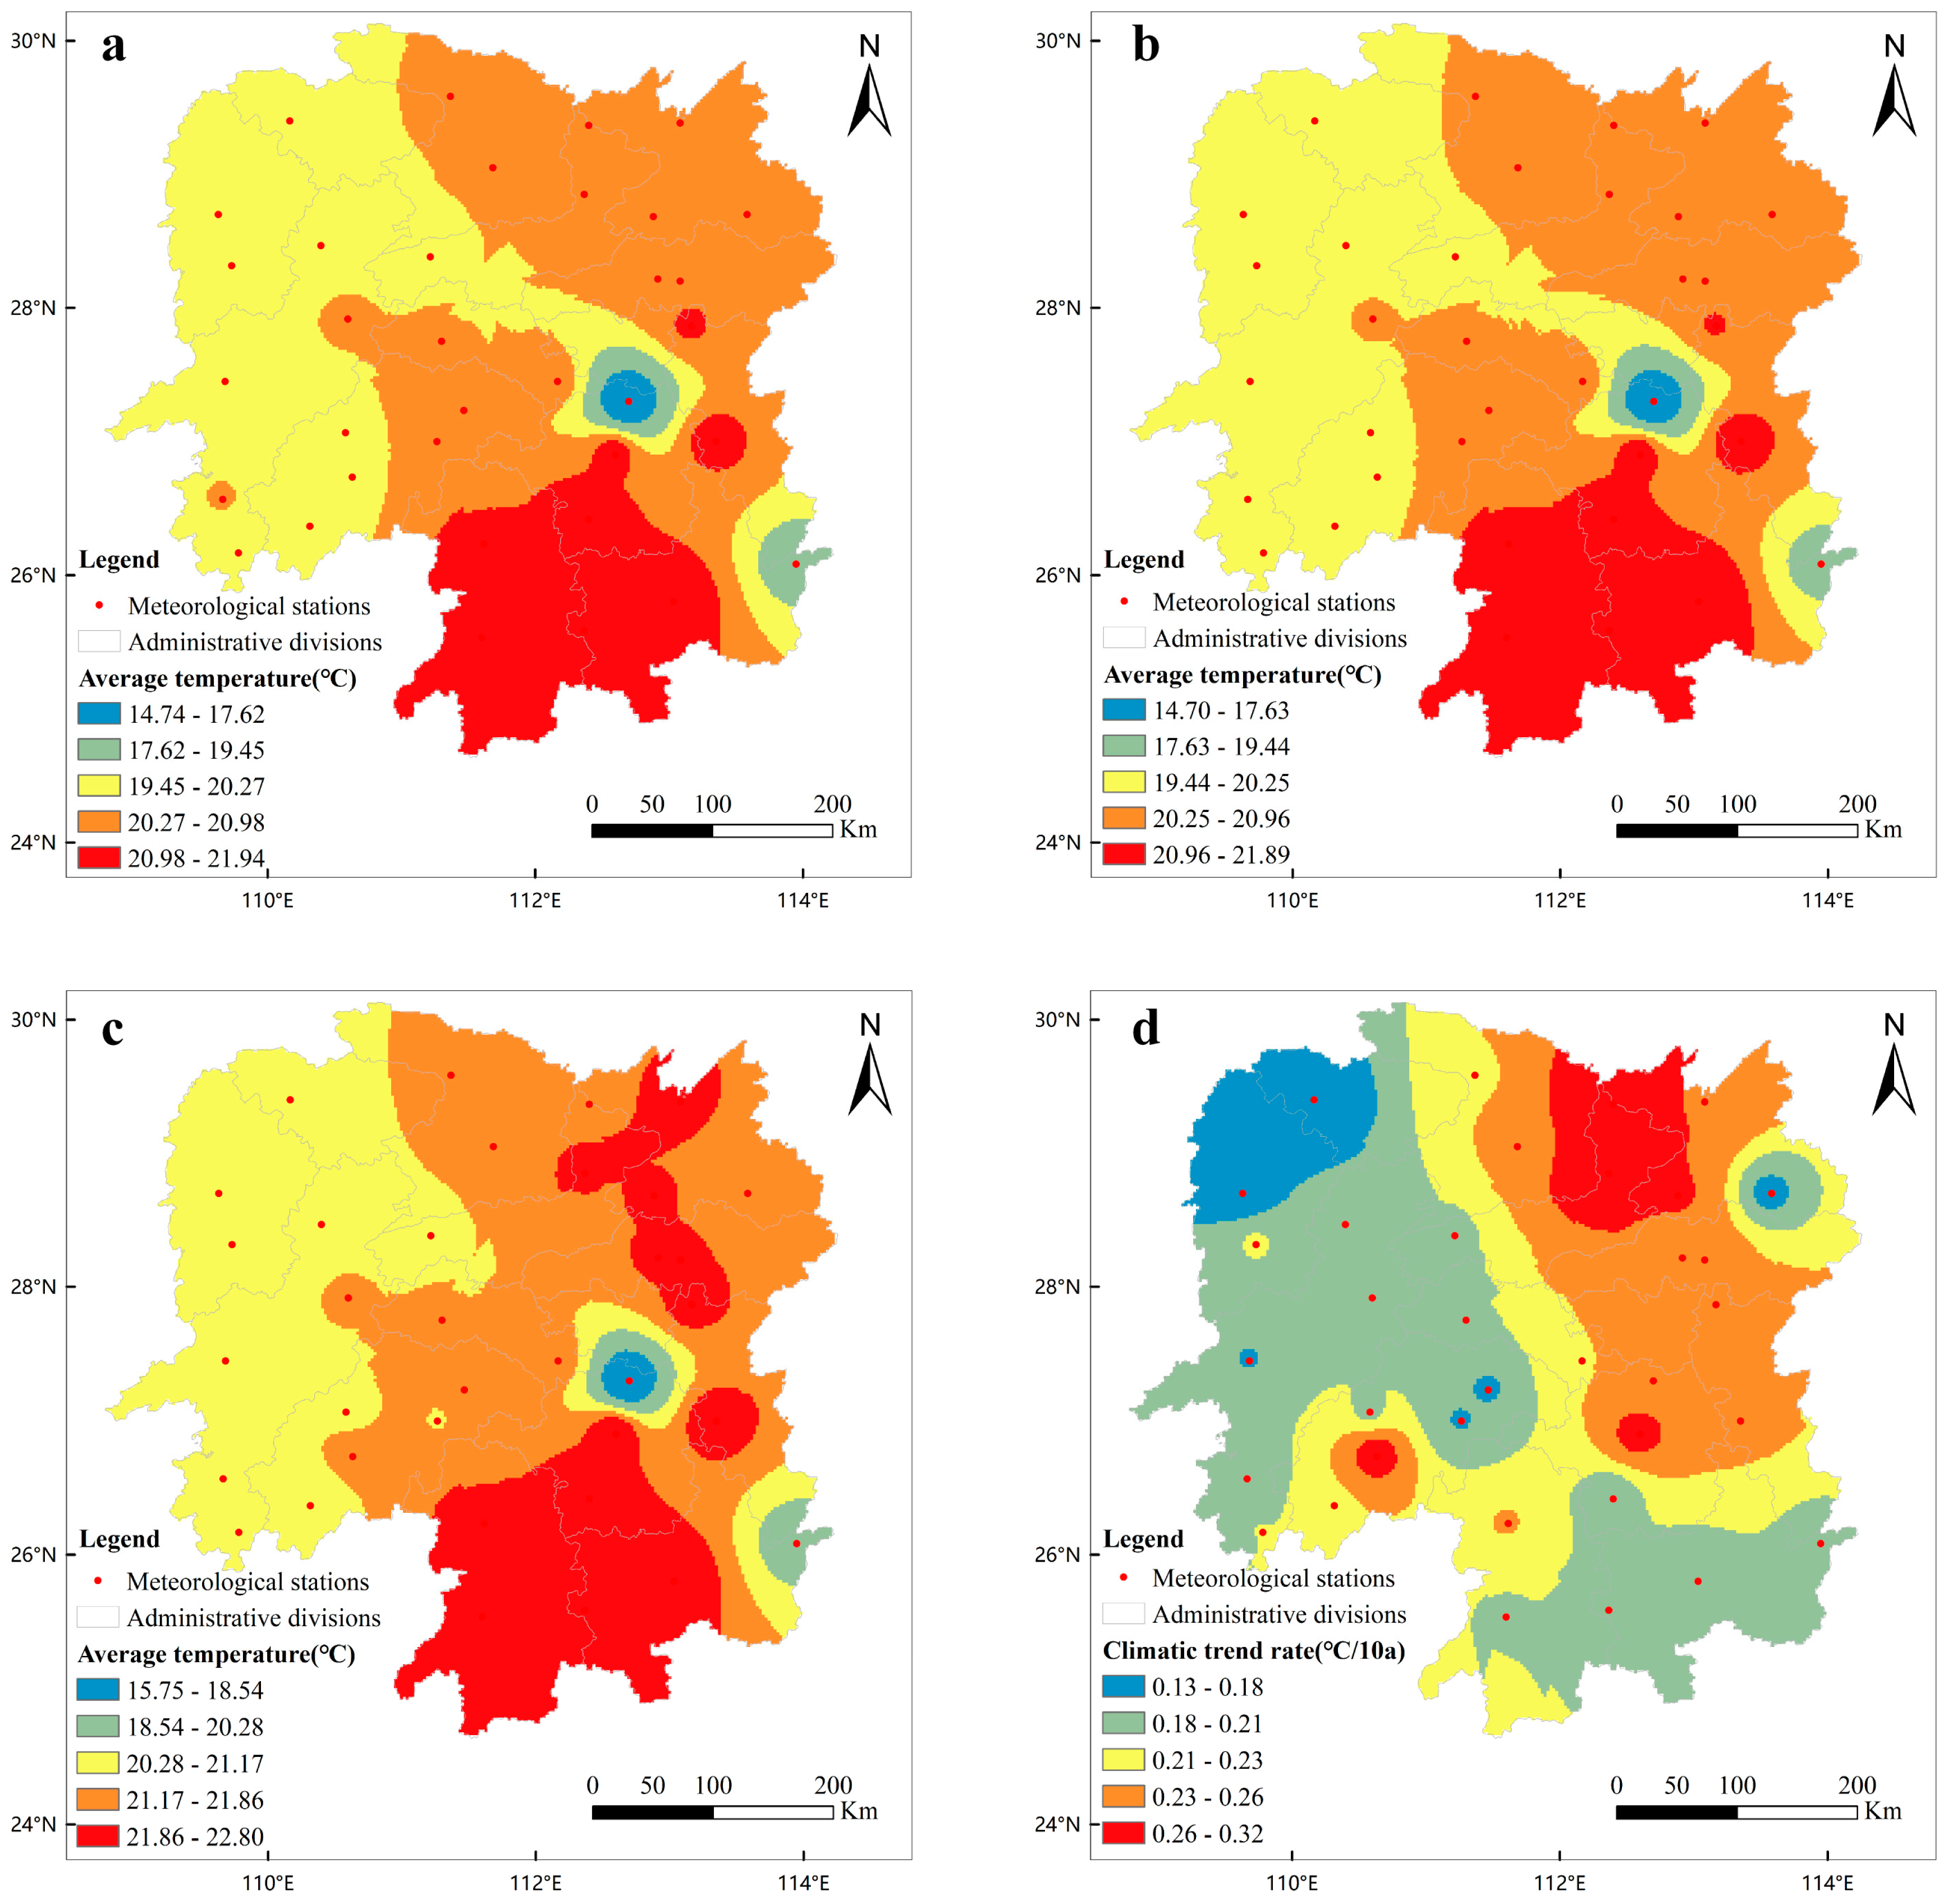
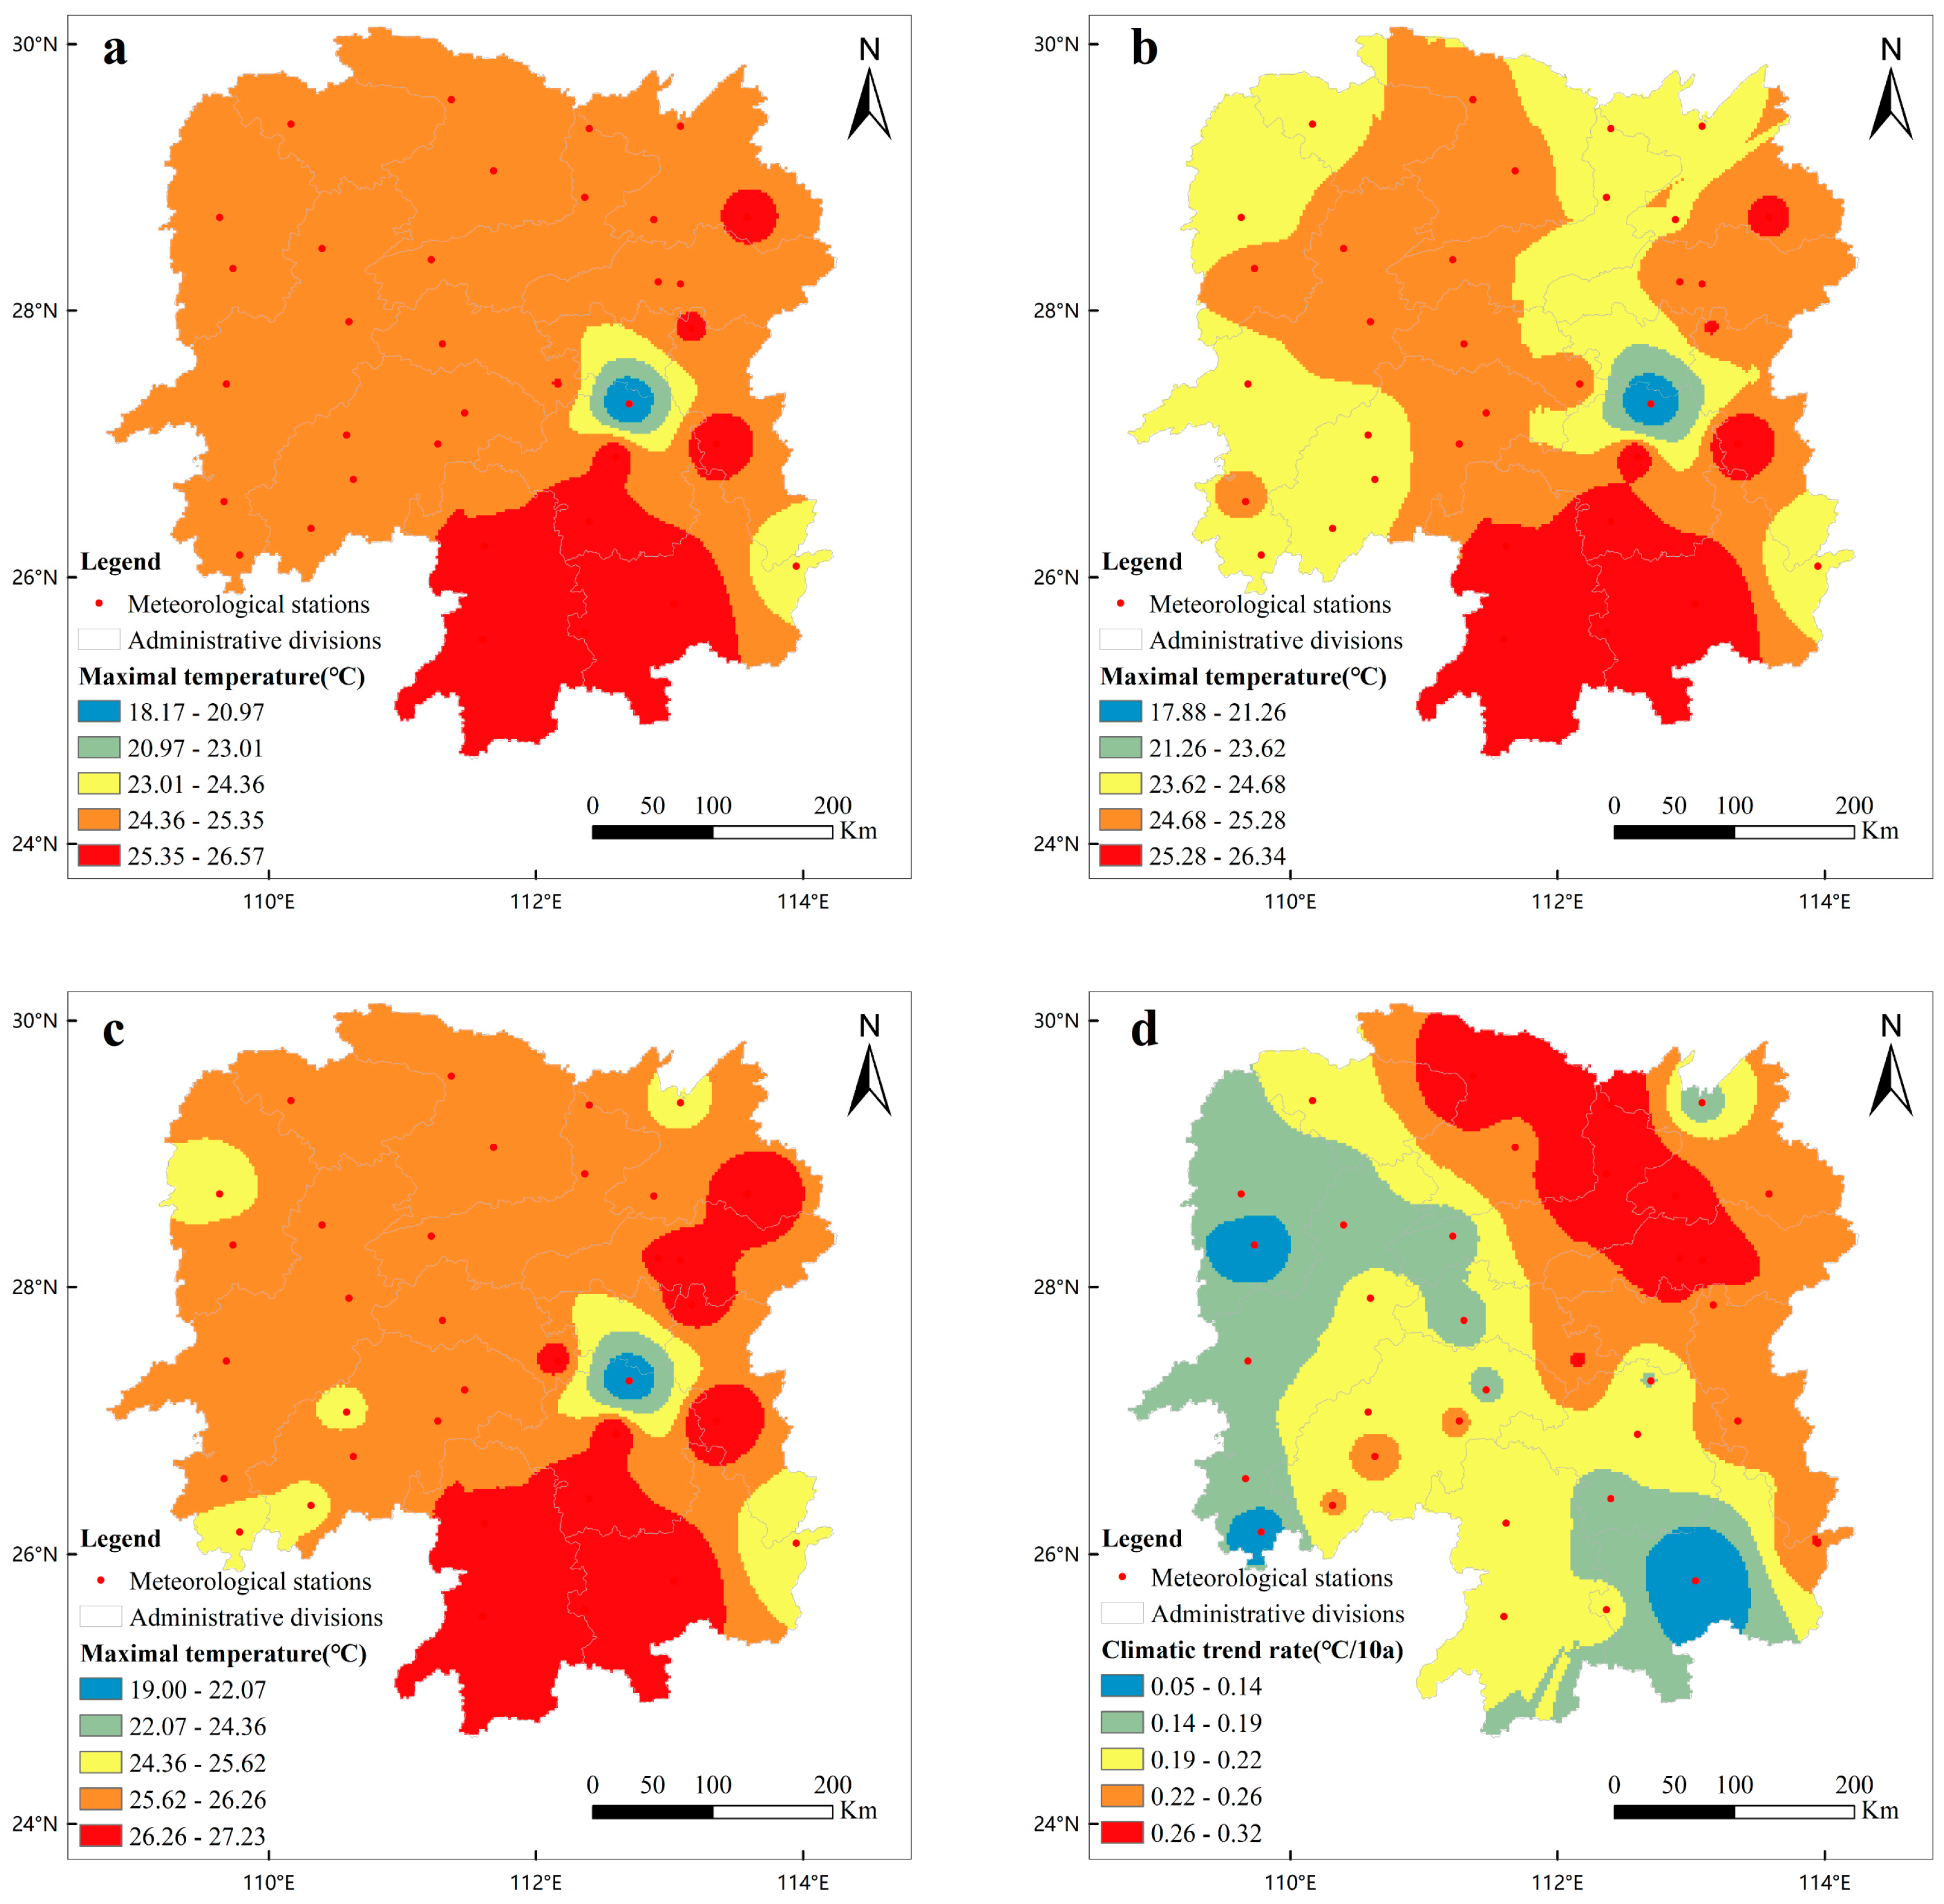
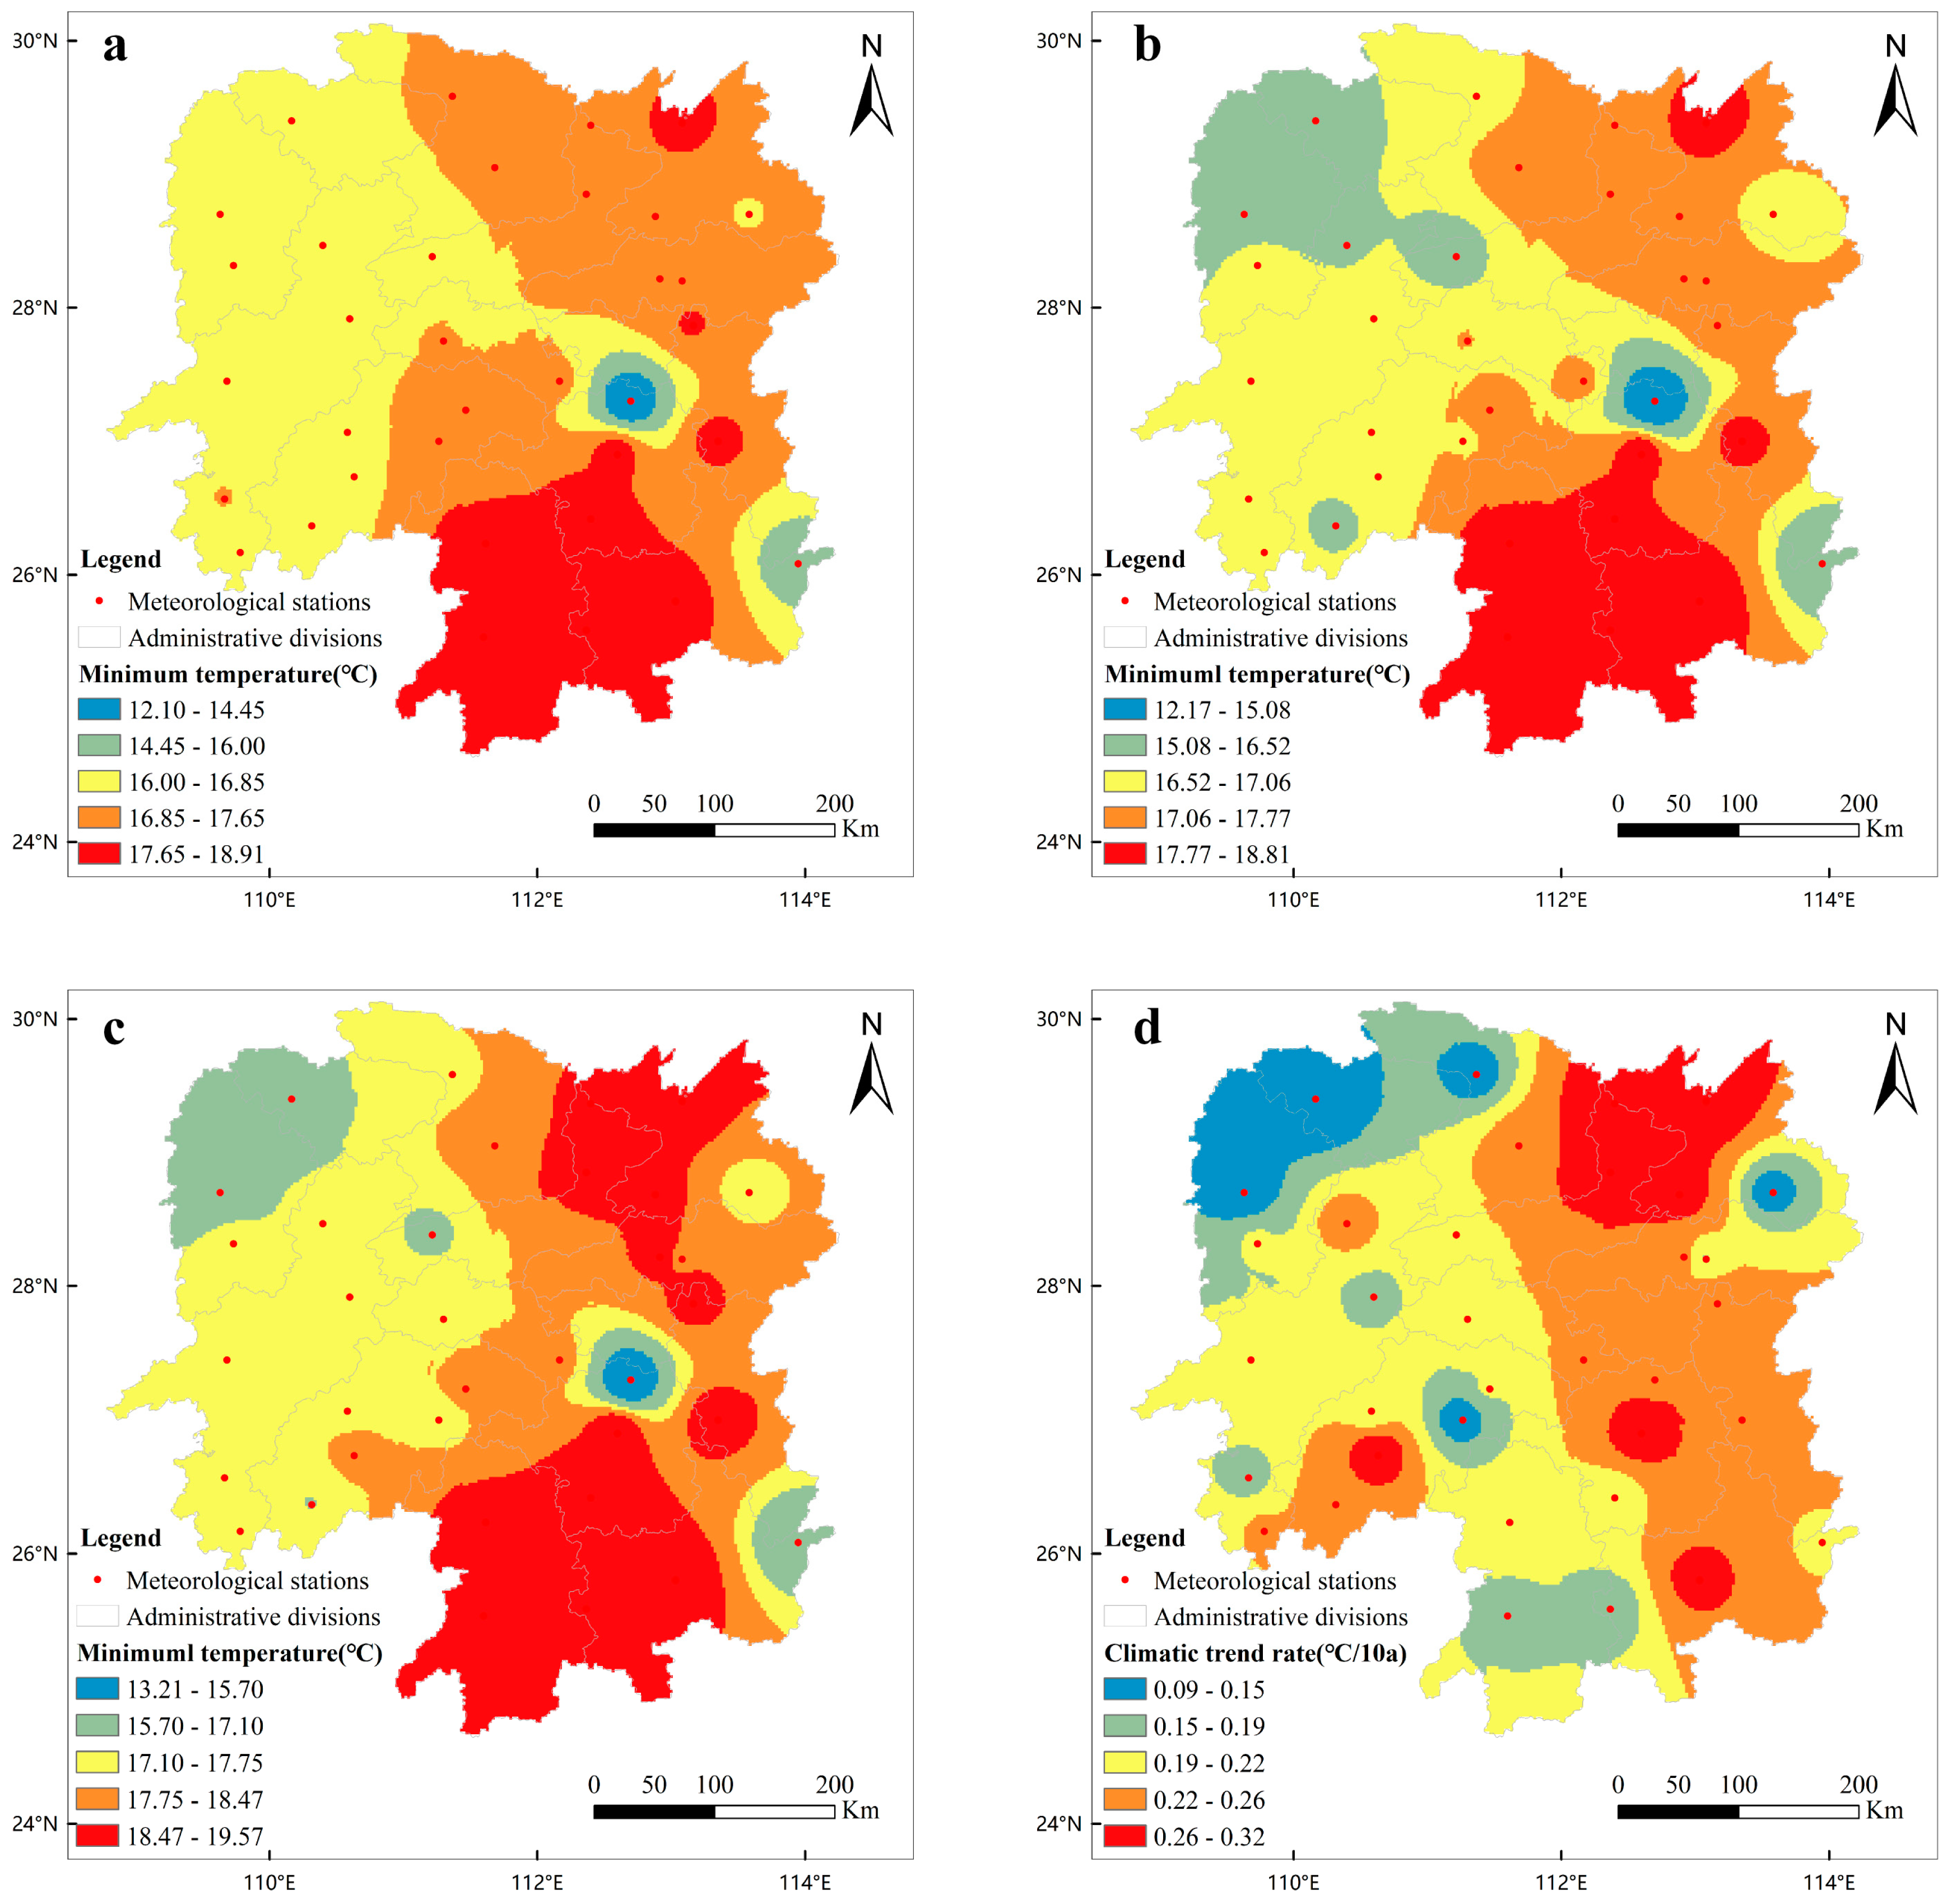
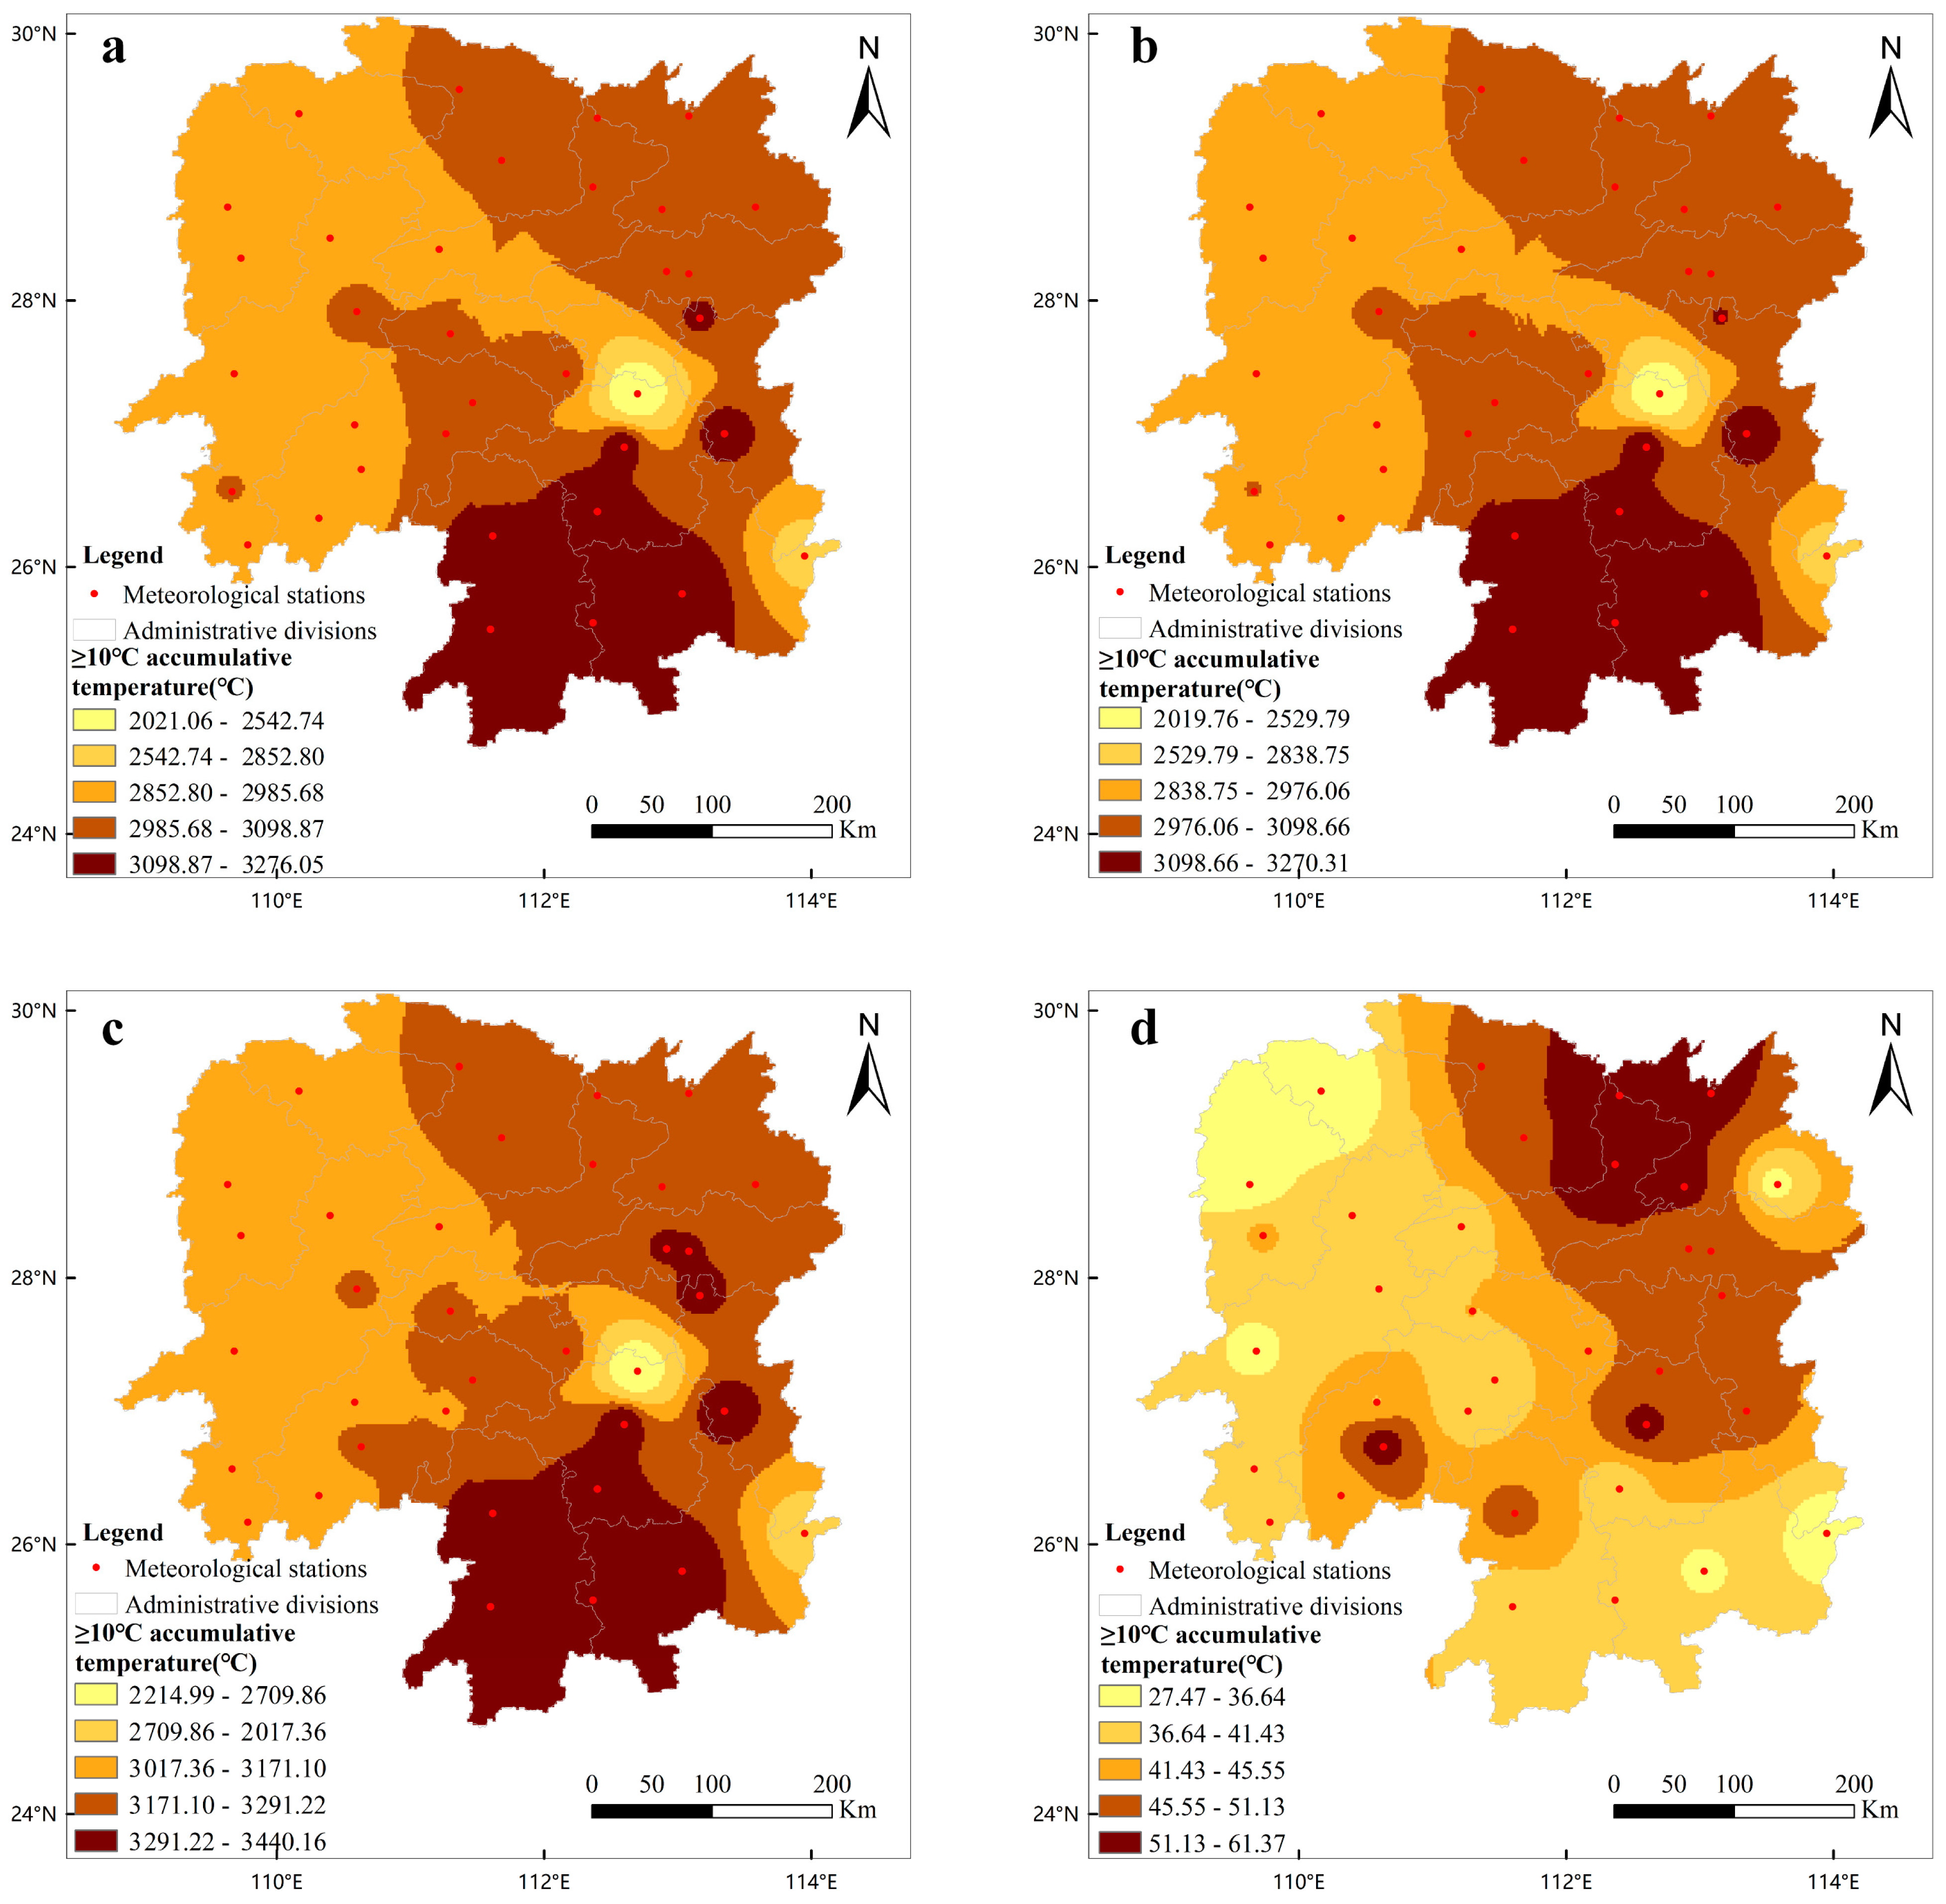
3.1. Variation Characteristics of Heat Resources during the Growth Duration of Early-Season Rice in Hunan Province

From 1961 to 2020, the daily average temperature (DAT) showed an overall increasing trend, with the average temperature decreasing from the southeast to the northwest at different stations (Figure 1). Compared with periods a and b, period c saw a significant increase in the DAT, average daily maximum temperature (DATmax), and average daily minimum temperature (DATmin), and the area of high-value regions continued to expand, indicating that the rate of warming during the past 20 years of the growth duration of early-season rice has accelerated, while the rate of warming in the previous 40 years was not significant. Specifically, compared with period a, the minimum and maximum temperature changes in DAT, DATmax, and DATmin in period b were not significant, while in period c, the minimum and maximum values of DAT, DATmax, and DATmin increased by an average of 0.94 °C, 0.75 °C, and 0.89 °C, respectively. In addition, the areas of high-value regions of DAT (≥20.28 °C, 16.14 × 10⁴ km2), DATmax (≥24.36 °C, 20.47 × 10⁴ km2), and DATmin (≥17.10 °C, 13.35 × 10⁴ km2) during period c of the early rice growth season were significantly higher than those in periods a and b, with an average increase of 39.9%, 96.1%, and 53.8%, respectively.
All stations showed a warming trend over the past 60 years, with climate trend rates of DAT, DATmax, and DATmin ranging from 0.13 °C/10a to 0.32 °C/10a, and all showing a decreasing trend of warming from the central–eastern and northern parts to the western part (Figure 2 and Figure 3). The DAT, DATmax, and DATmin during the growth duration of early-season rice in Hunan Province were 20.71 °C, 25.21 °C, and 17.33 °C, respectively, and the average warming every 10 years was around 0.22 °C (Table 1). Except for period a showing a cooling trend, periods b and c both showed warming trends; the warming effect in period c was more significant (0.35 °C/10a), mainly due to the rise in minimum temperature.
During the growth period of early-season rice, ATe showed a gradual decrease from the southeast to the northwest, with a consistent trend across the three periods (a, b, and c) (Figure 4). The area of high-value regions of ATe during the growth duration of early-season rice in period c (≥3017.36 °C) was 16.11 × 10⁴ km2, significantly higher than that in periods a (≥2985.68 °C, 8.14 × 10⁴ km2) and b (≥2976.06 °C, 8.19 × 10⁴ km2), with an average increase of 97.8%, indicating the enormous potential for expanding double-cropped rice areas and increasing total grain production in Hunan Province. The climate trend rate of ATe averaged 43.36 °C/10a, with period c (73.36 °C/10a) > b (39.01 °C/10a) > a (−71.02 °C/10a), and reached a significant level (p < 0.05); high-value regions of climate trend rates were mainly concentrated in the northeastern, while low-value regions were mainly concentrated in the northwestern part. The average ATe from 1961 to 2020 was 3065.46 °C, showing a trend of period c significantly higher than periods a and b, and the ATe during the growth season of period c significantly increased by 188.20 °C and 194.02 °C compared to periods a and b, respectively (Table 2).

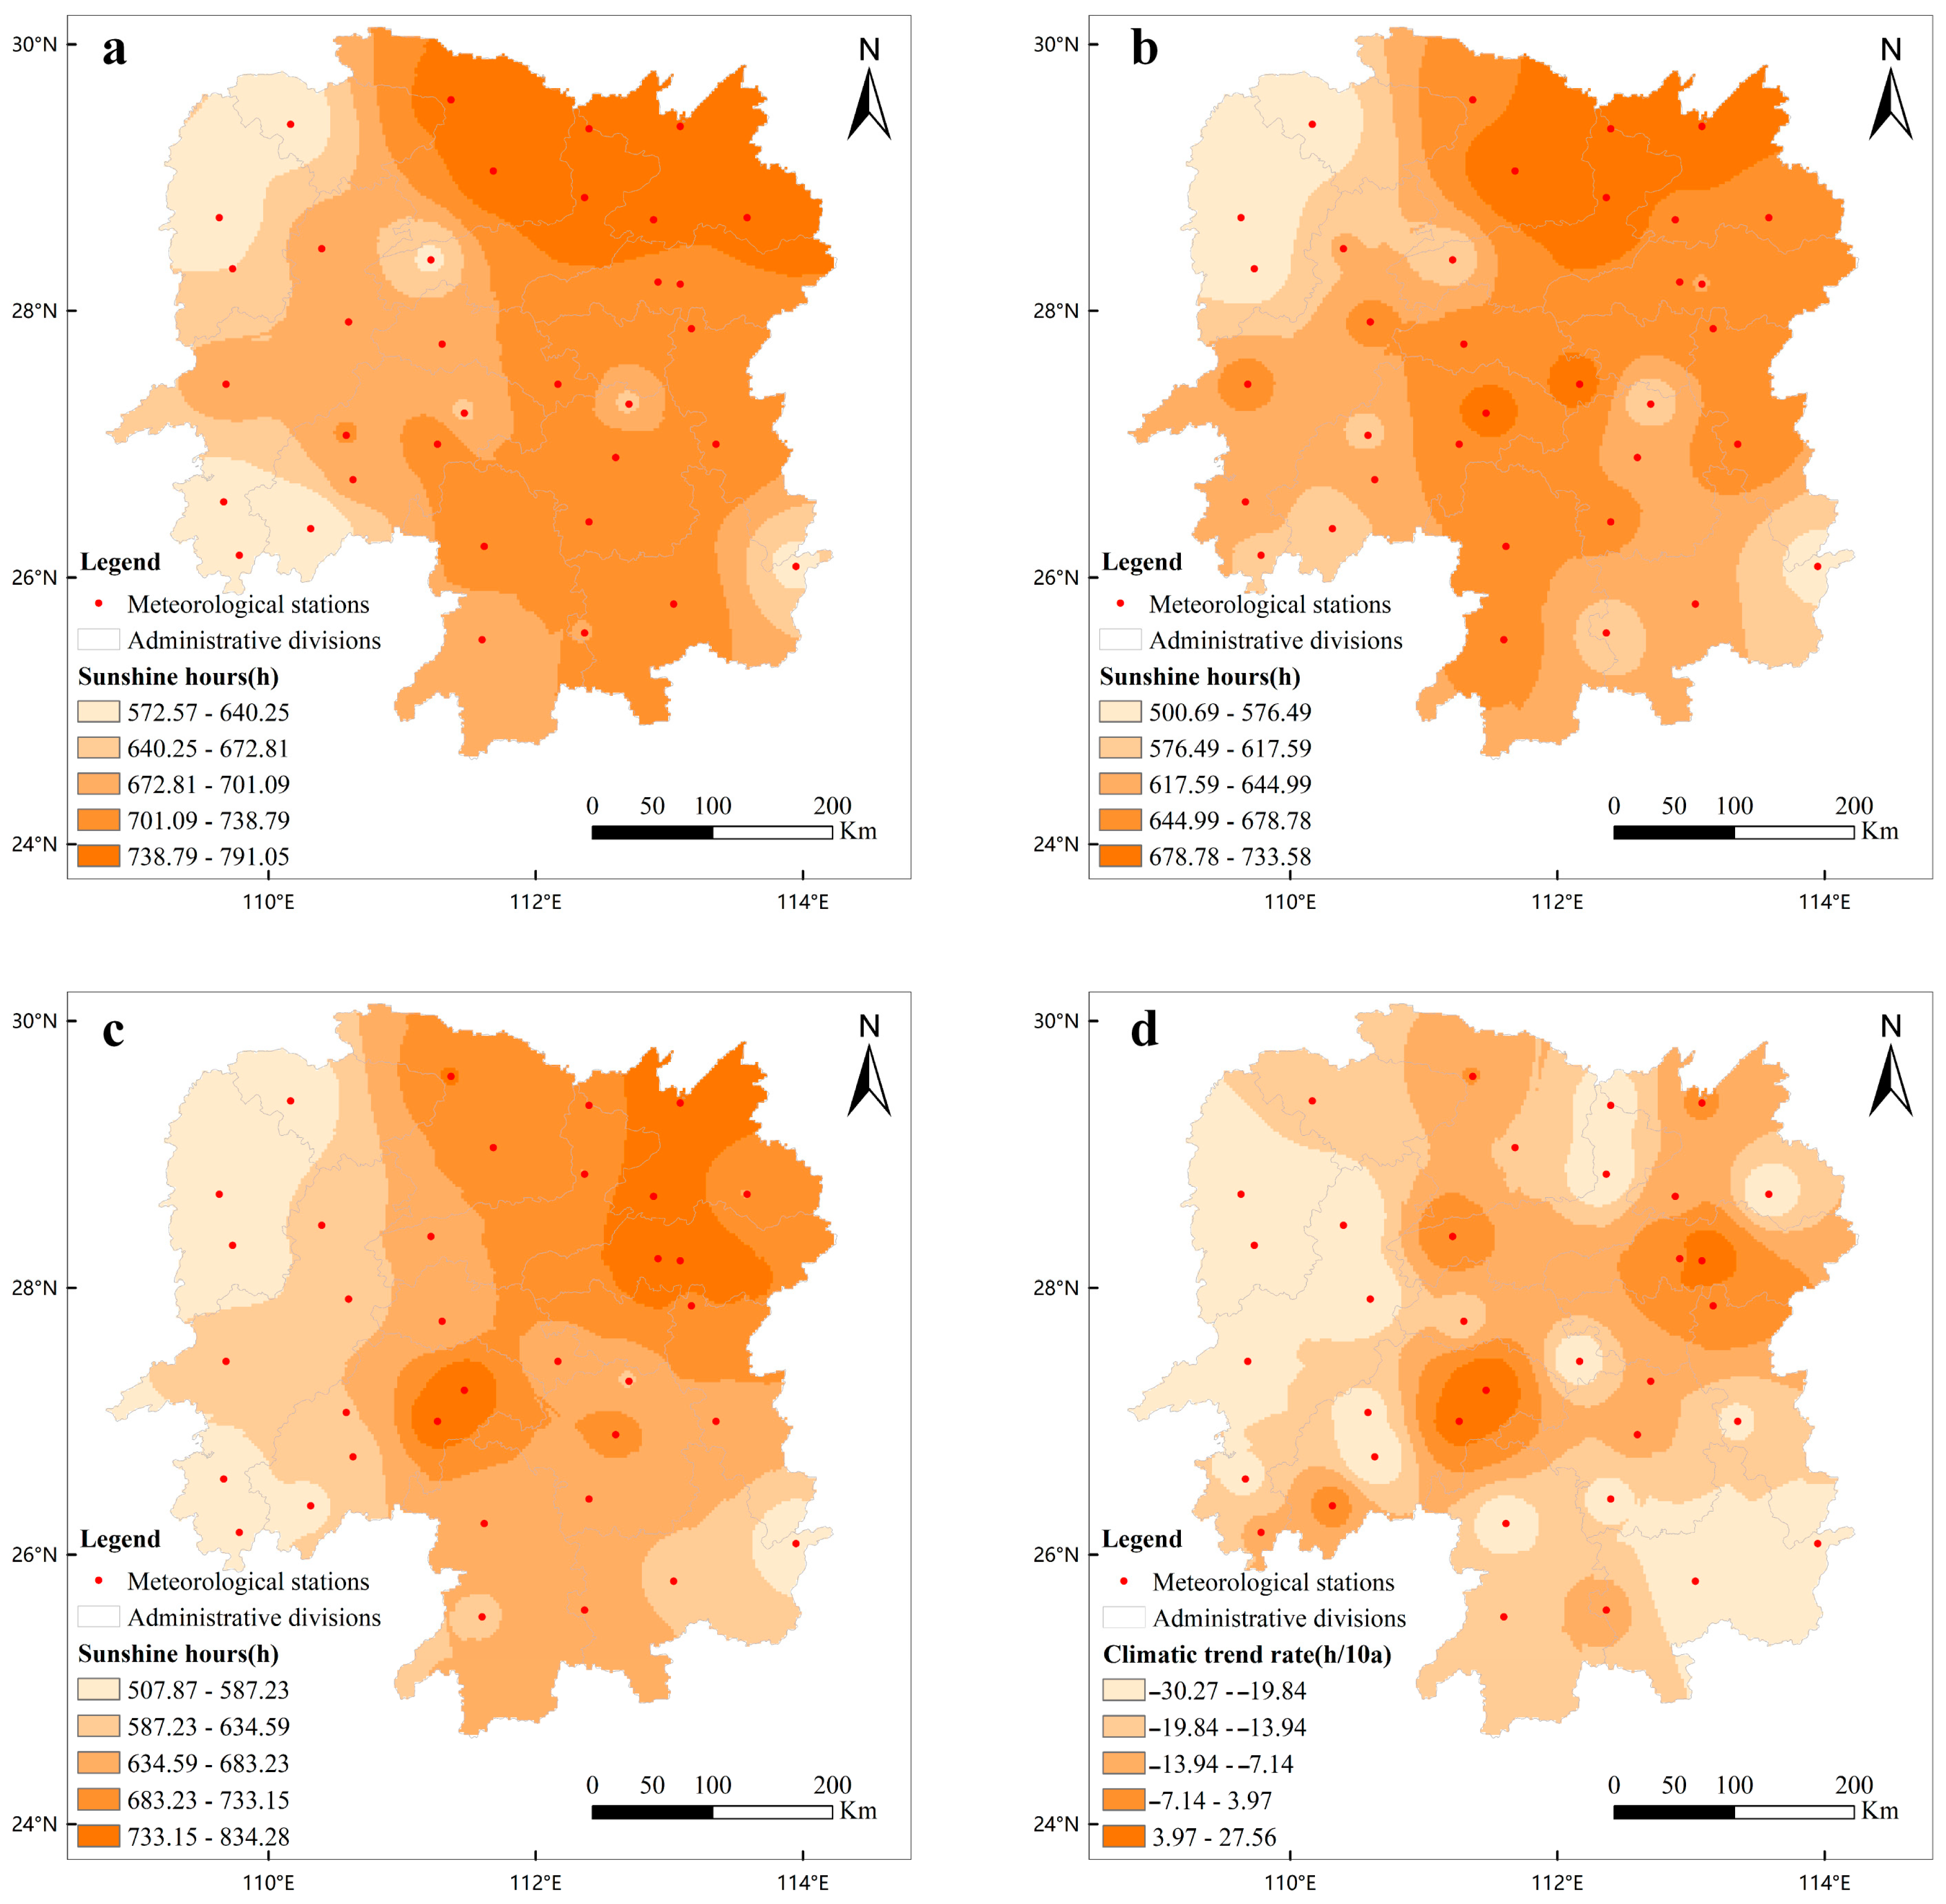
3.2. Variation Characteristics of Sunshine Resources during the Growth Duration of Early-Season Rice in Hunan Province

There is significant spatial variation in sunshine hours, showing a gradual decrease from the northeast to the southwest, with a consistent trend across the three periods (Figure 5). The area of high-value regions of sunshine hours during period a of the early rice growing season (≥672.81 h) was 16.59 × 10⁴ km2, significantly higher than that in periods b (≥678.78 h, 9.99 × 10⁴ km2) and c (≥683.23 h, 7.03 × 10⁴ km2), with the area of high-value regions in period c decreasing by 57.63% compared to period a. The climate trend rate of sunshine hours from 1961 to 2020 averaged −14.60 h/10a, with periods a, b, and c showing significant decreases at −60.57 h/10a, −31.73 h/10a, and −60.43 h/10a, respectively. Meanwhile, the average sunshine hours from 1961 to 2020 were 665.69 h, showing a trend of period a > c > b, with period c and period b significantly decreasing by 40.31 h and 57.97 h, respectively, compared to period a (Table 2).

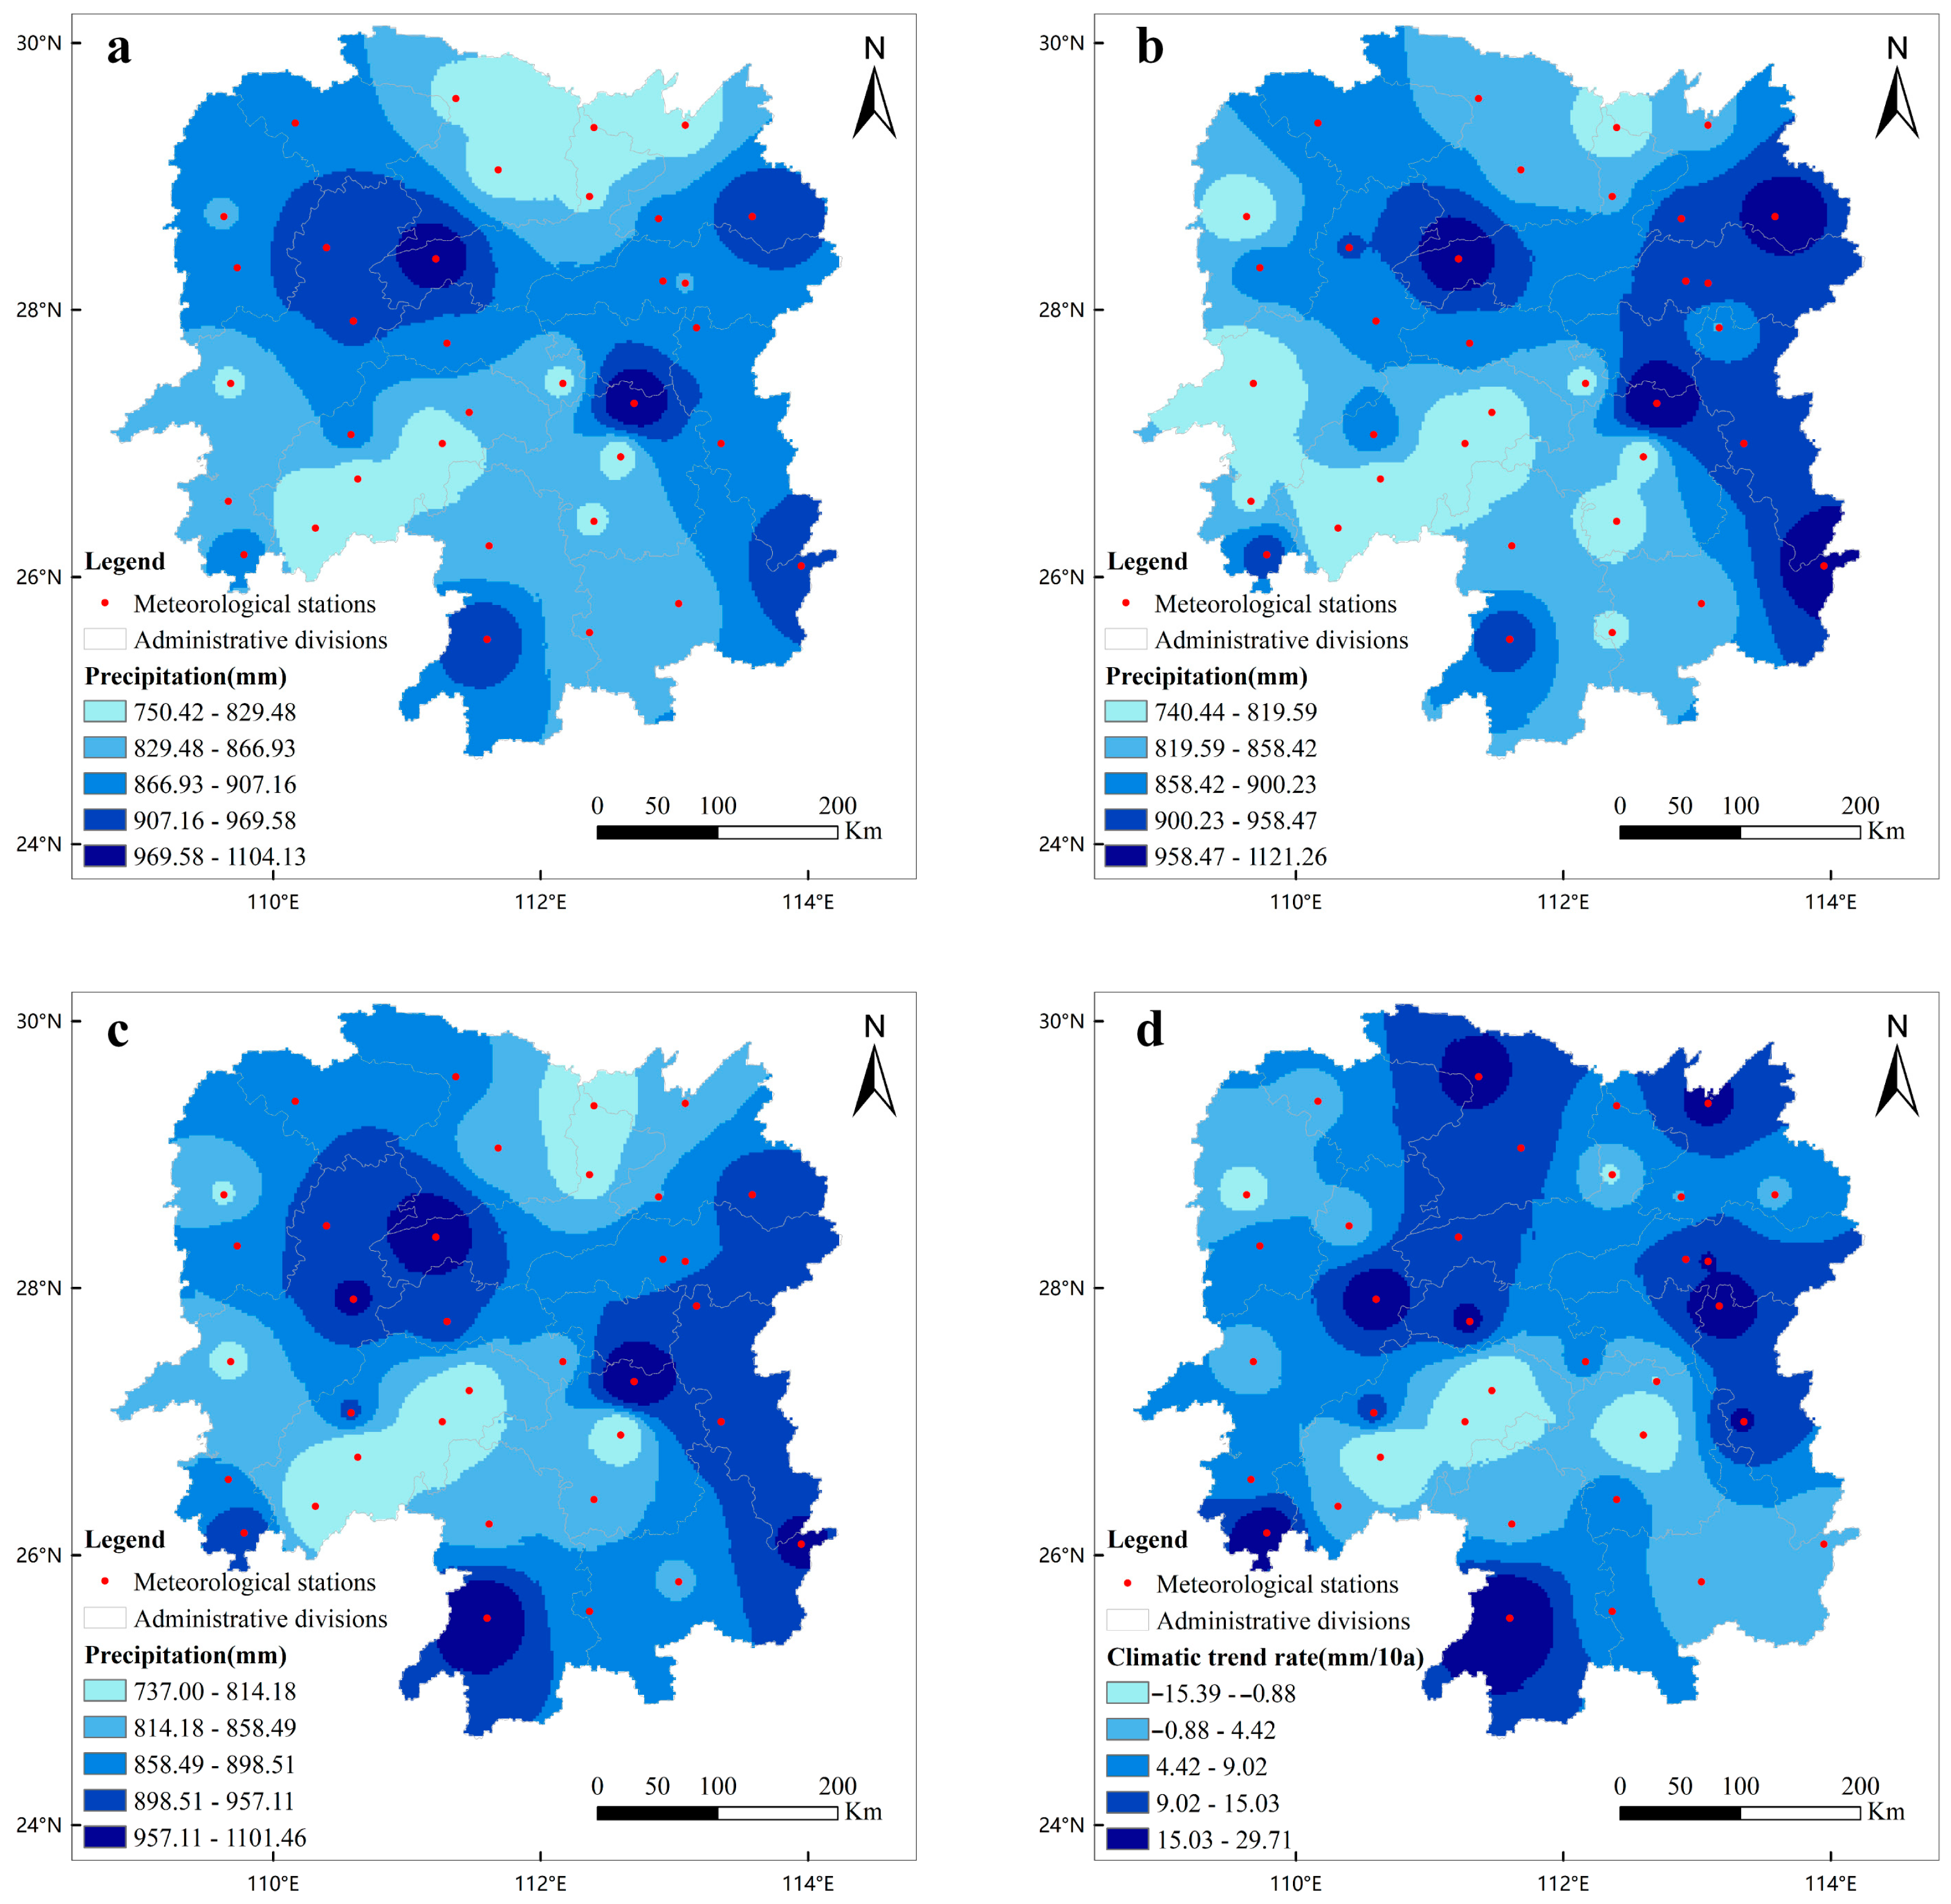
3.3. Variation Characteristics of Rainfall Resources during the Growth Duration of Early-Season Rice in Hunan Province

The distribution of rainfall shows no obvious spatial characteristics, with significant differences in distribution between different stations and regions. Regions with relatively abundant rainfall resources are distributed in the eastern, southern, and northwestern parts, and the characteristics are generally consistent across the three periods (Figure 6). Additionally, small changes were observed in average rainfall across the three periods, and the rainfall in period c increased by only 6.63 mm compared to period b. The area of high-value regions of rainfall (900–1100 mm) showed a trend of period c (6.67 × 10⁴ km2) > b (5.28 × 10⁴ km2) > a (3.50 × 10⁴ km2), with the area of high-value regions in period c expanding by 90.57% compared to period a, mainly distributed in most areas of Chenzhou city, the southern part of Hengyang city, and the northern part of Changde city. The climate trend rate of rainfall from 1961 to 2020 averaged 6.85 mm/10a, with the trend rate of rainfall showing period b (117.87 mm/10a) > c (2.23 mm/10a) > a (0.65 mm/10a).

3.4. The Varying Characteristics of Heat, Sunlight, and Rainfall Resources during Different Growth Stages of Early-Season Rice in Hunan Province

In the period from 1961 to 2020, there were certain increases in the heat resources (ATe, DAT, DATmax, and DATmin) during different growth stages of early-season rice in Hunan Province. Moreover, the rate of increase in period c was significantly higher than that in periods a and b (Table 3 and Table 4). Meanwhile, the most significant warming rate occurred during the transplanting and tillering stages of early rice growth, with warming rates of 0.40 °C/10a, 0.35 °C/10a, 0.37 °C/10a, and 14.86 °C/10a for DAT, DATmax, DATmin, and ATe, respectively. Conversely, the warming rate was less pronounced during the grain filling and maturity stages, with rates of 0.11 °C/10a, 0.08 °C/10a, 0.10 °C/10a, and 5.00 °C/10a, respectively (Table 3). Additionally, there were significant differences in the climate trend rates of sunshine hours and rainfall during different growth periods (Table 4). Apart from a significant increase in the climate trend rate of sunshine hours during the transplanting and tillering stage and the rainfall during the heading and maturity stage, the trend rates in other periods showed varying degrees of decline. In period c, the rainfall during the heading and maturity stages and the sunshine hours during the transplanting and tillering stages were significantly higher than those in periods a and b, while the other growth stages showed a decrease.

4. Discussion

This study analyzed the spatial and temporal variations of climate resources during the growing duration of early-season rice in Hunan Province. Results indicated that the overall climate change characteristics include increased heat resources, decreased sunshine duration, and a slight increase in precipitation, which are typical features of a warming climate (Table 1 and Table 2). These findings are consistent with previous research conducted in the middle and lower reaches of the Yangtze River in China [32,33,34,38]. From 1961 to 2020, the average daily temperature during the growing period of double-cropping early-season rice in Hunan Province was 20.71 °C, with a DAT increase of 0.22 °C/10a over the past 60 years and an increase in ATe of 43.36 °C/10a. Particularly, the warming trend has significantly intensified in the past 20 years. However, there has been an average reduction of 14.60 h/10a in sunshine duration and an average increase of 6.85 mm/10a in rainfall during the same period. Previous studies have shown that under a warming climate, the increase in ATe during the rice growth period will extend the length of the rice growing season [39], while higher temperatures will shorten the rice growth period and improve the utilization efficiency of the rice growing season [36,40]. Based on this, the changing characteristics of agricultural climate resources may have the following impacts on early-season rice production: the increase in temperature and accumulated temperature will shorten the rice growth period and lead to a decrease in yield, but it is conducive to early sowing and transplanting of early rice. Therefore, the selection of early-season rice varieties may tend towards those with longer growth periods, which will have a positive effect on the yield and yield potential of double-season early rice. However, the decrease in sunshine duration may affect the rice development process. The reduction in rice photosynthesis time may lead to a decrease in photosynthetic products and ultimately affect crop production potential and yield [41].
The heat resources during different growth stages of early-season rice have shown a certain degree of increase; the transplanting and tillering stage experienced the greatest warming trend (DAT: 0.40 °C/10a, ATe: 14.86 °C/10a), and the warming trend during the grain filling and maturation stage was minimal (DAT: 0.11 °C/10a, ATe: 5.00 °C/10a) (Table 3). Analysis combining the sunshine duration (2.51 h/10a, −5.64 h/10a) and precipitation resources (−2.20 mm/10a, 5.13 mm/10a) during these two growth stages reveals that the warming phenomenon mainly occurred during the nutritional growth stage of double-season early rice (Table 4). This allows for the appropriate advancement of rice transplanting and promotes tillering, thus enabling the selection of varieties with strong tillering ability to utilize the climatic resource advantages during this growth period [42,43]. The later-stage warming of rice growth is relatively small, accompanied by a decrease in sunshine duration and an increase in precipitation, all of which have certain negative effects on dry matter accumulation and grain filling in early rice [44]. Therefore, it is necessary to establish a high-efficiency group and strengthen the coordinated management of water and fertilizer in the later stage of growth to address the current situation of differential warming during the growth period of early-season rice. Additionally, climate change is influenced by human activities and planting methods [45,46]. In our study, most meteorological stations were distributed within county-level areas and were relatively less affected by human activities (Supplementary Figure S1). Climate change is affected by terrain, so analyzing the spatiotemporal patterns of climate change more accurately based on the terrain conditions of meteorological stations. Furthermore, accurate prediction models were established by predecessors on the laws of climate change in the Yangtze River Basin, China, and even the world [47]. However, a few studies have reported that establishing a predictive model for future climate change based on the climate change patterns of the past 60 years in the spatial area is of great significance for rice production.
The regional differences in the characteristics of climate resource changes are considerable; the heat resources in double-season rice areas exhibit a gradual decrease from southeast to northwest (Figure 1, Figure 2, Figure 3 and Figure 4). Specifically, the central–eastern areas and the northern regions experience a faster rate of temperature increase, and the maximum warming rate occurs in the areas of Yiyang City, Changde City, and Yueyang City, with an average accumulated temperature increase of 51.13–61.37 °C/10a (Figure 4). It was reported that the central–eastern and northern regions were the main planting areas of double-cropping rice [48]. Furthermore, the area of high-value regions (3017.36–3440.16 °C) of ATe in period C has almost doubled compared to periods a and b, reaching 16.11 × 10⁴ km2. Therefore, the increase in heat resources may be beneficial for the release of yield potential in double cropping rice. Additionally, we find that some areas of Hunan Province exhibit synchronous increases in heat, light, and water, such as the central–eastern regions (Changsha, Zhuzhou, and Xiangtan) and the northern regions (Yueyang, Changde, and Yiyang) (Figure 4, Figure 5 and Figure 6). These areas have large arable land areas, relatively flat terrain, and large contiguous areas suitable for large-scale mechanized production, which was the main producing area of double-season rice in Hunan Province [49]. Therefore, it is necessary to fully utilize the favorable agricultural climate resources and land resources in central–eastern and northern areas to enhance rice production capacity. Importantly, investigating the impact of artificially regulating the temperature changes during the rice growing duration on the growth and development of early-season rice is necessary in the future.

5. Conclusions

The climate change characteristics during the growing duration of early-season rice in Hunan Province are characterized by a significant increase in heat resources, a decrease in sunshine duration, and a slight increase in precipitation. Specifically, the warming trend caused by the increase in heat resources mainly occurs during the nutritional growth stage of early-season rice. Moreover, the distribution of heat resources gradually decreases from southeast to northwest, while sunshine duration decreases gradually from northeast to southwest, and precipitation decreases gradually from southwest to northeast. Additionally, there are significant differences in the changes in heat, sunshine, and precipitation resources during different periods. Heat and precipitation resources are significantly higher in period c compared to periods a and b, whereas sunshine resources are significantly lower in period c compared to the other periods. In conclusion, the synchronous increase in heat, sunshine, and water resources in the central–eastern and northern regions of Hunan Province suggests that efforts should be made to fully utilize these resources to achieve increased production and income from double-season rice in the future.

Supplementary Materials

The following supporting information can be downloaded at: https://www.mdpi.com/article/10.3390/agriculture14091514/s1, Figure S1: Distribution of 35 meteorological stations.

Author Contributions

Data curation, P.Z. and J.L. (Jirui Long); writing—original draft preparation, A.H. and J.L. (Jiebing Li); writing—review and editing, X.G. and A.H.; funding acquisition, A.H. and Z.A. All authors have read and agreed to the published version of the manuscript.

Funding

This work is supported by the National Natural Science Foundation of China (Project No. 32372221, 32301934), the National Key R&D Program (Project No. 2023YFD2301403), the Hunan Provincial Natural Science Foundation (Project No. 2023JJ40470), and Fundamental Research Funds for the Central Universities (Project No. 2412022ZD054).

Institutional Review Board Statement

Not applicable.

Data Availability Statement

Restrictions apply to the availability of these data. Data were obtained from the National Meteorological Information Center of the China Meteorological Administration and are available at the http://www.ngcc.cn/dlxxzy/gjchjzsjk/ with the permission of the National Meteorological Information Center of the China Meteorological Administration.

Conflicts of Interest

The authors declare that they have no competing interests.

References

  1. IPCC. Summary for Policymakers. In Global Warming of 1.5 °C. An IPCC Special Report on the Impacts of Global Warming of 1.5 °C Above Pre-Industrial Levels and Related Global Greenhouse Gas Emission Pathways, in the Context of Strengthening the Global Response to the Threat of Climate Change, Sustainable Development, and Efforts to Eradicate Poverty; Cambridge University Press: Cambridge, UK, 2018. [Google Scholar]
  2. Redden, R.J.; Hatfield, J.L.; Prasad, P.V.; Ebert, A.W.; Yadav, S.S.; O’Leary, G.J. Temperature, climate change, and global food security. In Temperature and Plant Development; John Wiley & Sons, Inc.: Hoboken, NJ, USA, 2014. [Google Scholar] [CrossRef]
  3. Li, R.; Geng, S. Impacts of climate change on agriculture and adaptive strategies in China. J. Integr. Agric. 2013, 12, 1402–1408. [Google Scholar] [CrossRef]
  4. Lobell, D.B.; Schlenker, W.; Costa-Roberts, J. Climate trends and global crop production since 1980. Science 2011, 333, 616–620. [Google Scholar] [CrossRef] [PubMed]
  5. Liu, Y.; Li, N.; Zhang, Z.; Huang, C.; Chen, X.; Wang, F. The central trend in crop yields under climate change in China: A systematic review. Sci. Total Environ. 2020, 704, 135355. [Google Scholar] [CrossRef] [PubMed]
  6. Wheeler, T.; Von Braun, J. Climate change impacts on global food security. Science 2013, 341, 508–513. [Google Scholar] [CrossRef] [PubMed]
  7. Zhang, X.F.; Wang, D.Y.; Fang, F.P.; Zeng, X.K.; Liao, X.Y. Food safety and rice production in China. Res. Agric. Mod. 2005, 26, 85–88. [Google Scholar]
  8. Cheng, S.F.; Fang, F.P. Report on the Development of China’s Rice Industry in 2021; China Agricultural Science and Technology Press: Beijing, China, 2021; ISBN 9787511655783. [Google Scholar]
  9. Xu, C.C.; Ji, L.; Li, F.B.; Feng, J.F.; Fang, F.P. Situation and strategies of rice industry development in China. J. Huazhong Agric. Univ. 2022, 41, 21–27. [Google Scholar] [CrossRef]
  10. Wei, X.; Zhang, Z.; Shi, P.J.; Wang, P.; Chen, Y.; Song, S.; Tao, F.L. Is yield increase sufficient to achieve food security in China? PLoS ONE 2019, 14, 0222167. [Google Scholar] [CrossRef]
  11. Shen, Y.P.; Wang, G.Y. Key fingings and assessment results of IPCC WGI fifth assessment report. J. Glaciol. Geocryol. 2013, 35, 1068–1076. [Google Scholar] [CrossRef]
  12. Cheng, Y.X.; Wang, X.Z.; Guo, J.P.; Zhao, Y.X.; Huang, J.F. The temporal-spatial dynamic analysis of China rice production. Sci. Agric. Sin. 2012, 45, 3473–3485. [Google Scholar] [CrossRef]
  13. Zhu, D.F.; Wang, Y.L. Analysis of characteristics of temporal and spatial variation of rice production in the world. China Rice 2021, 27, 7–8. [Google Scholar] [CrossRef]
  14. Han, F.Y.; Zhang, J.B.; Cheng, L.L.; Tong, Q.M.; Liu, Y. Impact of climate change on rice yield and its regional heterogeneity in China. J. Ecol. Rural. Environ. 2019, 35, 283–289. [Google Scholar] [CrossRef]
  15. Laza, M.R.C.; Sakai, H.; Cheng, W.; Tokida, Y.; Peng, S.B.; Hasegawa, T. Differential response of rice plants to high night temperatures imposed at varying developmental phases. Agric. For. Meteorol. 2015, 209–210, 69–77. [Google Scholar] [CrossRef]
  16. Holst, R.; Yu, X.; Grün, C. Climate change, risk and grain yields in China. J. Integr. Agric. 2013, 12, 1279–1291. [Google Scholar] [CrossRef]
  17. Liu, Q.H.; Wu, X.; Ma, J.Q.; Tian, L.; Zhou, X.B.; Tao, G. Effects of high air temperature on rice grain quality and yield under field condition. Agron. J. 2013, 105, 446–454. [Google Scholar] [CrossRef]
  18. Tao, F.L.; Zhang, Z.; Zhang, S.; Rotter, R.P. Variability in crop yields associated with climate anomalies in China over the past three decades. Reg. Environ. Change 2016, 16, 1715–1723. [Google Scholar] [CrossRef]
  19. Wang, Z.; Shi, P.; Zhang, Z.; Reimund, P.R. Separating out the influence of climatic trend, fluctuations, and extreme events on crop yield: A case study in Hunan province, China. Clim. Dyn. 2018, 51, 4469–4487. [Google Scholar] [CrossRef]
  20. Guo, J.P. Advances in impacts of climate change on agricultural production in China. J. Appl. Meteorol. 2015, 26, 1–11. [Google Scholar] [CrossRef]
  21. Xie, Y.Y.; Huang, S.E.; Tian, J.; Wang, Y.; Ye, Q. Spatial-temporal characteristics of thermal respirces and its influence on the growth of double cropping rice in the middle and lower reaches of the Yangtze river, China. J. Appl. Meteorol. 2016, 27, 2950–2958. [Google Scholar] [CrossRef]
  22. Chen, S.B.; Liu, A.G.; Zhang, Y.J.; Wu, K.T. Dynamic variations of heat injury on rice in Hubei province under climate change. Meteorol. Disaster Reduct. Res. 2013, 36, 51–56. [Google Scholar]
  23. Zhang, L.B.; Lou, W.P. Impact of climate warming on the distribution of thermal resources in the lower-middle reaches of the Yangtze River. J. Nat. Resour. 2013, 28, 1361–1372. [Google Scholar] [CrossRef]
  24. National Data Website of National Bureau of Statistics of China. Available online: https://data.stats.gov.cn/ (accessed on 25 June 2024).
  25. Ni, Y.N. Hunan provincial bureau of statistics Hunan. In Statistical Yearbook; China Statistical Publishing House: Beijing, China, 2020. [Google Scholar]
  26. Deng, N.Y.; Grassini, P.; Yang, H.S.; Huang, J.L.; Cassman, K.G.; Peng, S.B. Closing yield gaps for rice self-sufficiency in China. Nat. Commun. 2019, 10, 1752. [Google Scholar] [CrossRef] [PubMed]
  27. Ge, D.K.; Jin, Z.Q. Impacts of climate change and its variability on rice production in the middle and lower valley of the Yangtze river, China. Chin. J. Rice Sci. 2009, 23, 57–64. [Google Scholar]
  28. Li, J.; Jiang, S.D.; Yang, S.B.; Tian, X.Y. Changes of agricultural climate resources during rice growing season in the middle and lower reaches of the Yangtze river. Jiangsu Agric. Sci. 2020, 36, 99–107. [Google Scholar] [CrossRef]
  29. Ma, J.Y.; Luo, Y.; Liang, H.; Ma, S.K. Spatial and temporal variation of total solar radiation in China in recent 50 years. J. Nat. Resour. 2012, 27, 268–280. [Google Scholar] [CrossRef]
  30. Su, B.D.; Jiang, T.; Ren, G.Z.; Chen, Z.H. Observed trends of precipitation extremes in the Yangtze river basin during 1960 to 2004. Adv. Clim. Change Res. 2006, 2, 9–14. [Google Scholar] [CrossRef]
  31. Wang, Y.J.; Liu, F.X.; Zhai, J.Q.; Wang, Y.Y.; Jiang, T. Variation characteristics of extreme precipitation in the Yangtze river basin under the global warming 1.5 °C and 2.0 °C. Meteorol. Sci. 2019, 39, 540–547. [Google Scholar]
  32. Huang, W.F.; Liu, X.B.; Deng, W. Changes in agricultural meteorological elements in Hunan and their impact on main crops. Hunan Agric. Sci. 2009, 1, 61–64. [Google Scholar] [CrossRef]
  33. Liu, S.L.; Xue, J.F.; Zhang, R.; Chen, Z.D.; Chen, B.; Hu, S.J.; Zhang, H.L. Sensitivity analysis of double-rice yield under climate change in Hunan province. Trans. Chin. Soc. Agric. Eng. 2015, 31, 246–252. [Google Scholar] [CrossRef]
  34. Ye, Q.; Yang, X.G.; Li, Y.; Wang, W.F. Changes of China agricultural climate resources under the background of climate change. VIII. Change characteristics of heat resources during the growth period of double cropping rice in Jiangxi Province. Chin. J. Appl. Ecol. 2011, 22, 2021–2030. [Google Scholar] [CrossRef]
  35. Wei, F.Y. Modern Climate Statistical Diagnosis and Prediction Technology; Meteorological Publishing House: Beijing, China, 1999. [Google Scholar]
  36. Ye, Q.; Yang, X.G.; Xie, W.J.; Li, Y.; Liu, Z.Q.; Dong, C.Y.; Sun, S. Tendency of use efficiency of rice growth season in southern China under the background of global warming. Sci. Agric. Sin. 2013, 46, 4399–4415. [Google Scholar]
  37. Jiang, X.J.; Liu, X.J.; Huang, F.; Jiang, H.Y.; Chao, W.; Zhu, Y. Comparison of spatial interpolation methods for daily meteorological elements. Chin. J. Appl. Ecol. 2010, 21, 624–630. [Google Scholar] [CrossRef]
  38. Li, Y.; Yang, X.G.; Dai, S.W.; Wang, W.F. Spatial temporal change characteristics of agricultural climate resources in middle and lower reaches of Yangtze River. Chin. J. Appl. Ecol. 2010, 21, 2912–2921. [Google Scholar] [CrossRef]
  39. Song, Y.L.; Liu, B.; Zhong, H.L. Impact of global warming on the rice cultivable area in Southern China in 1961–2009. Adv. Clim. Change Res. 2011, 7, 259–264. [Google Scholar] [CrossRef]
  40. Yang, S.B.; Shen, S.H.; Zhao, X.Y.; Zhao, Y.X.; Xu, Y.L.; Wang, Z.Y.; Liu, J.; Zhang, W.W. Impacts of climate changes on rice production in the middle and lower reaches of the Yangtze River. Acta Agron. Sin. 2010, 36, 1519–1528. [Google Scholar]
  41. Zhang, Z.; Wang, P.; Chen, Y.; Song, X.; Wei, X. Global warming over 1960–2009 did increase heat stress and reduce cold stress in the major rice-planting areas across China. Eur. J. Agron. 2014, 59, 49–56. [Google Scholar] [CrossRef]
  42. Zhang, T.; Huang, Y.; Yang, X. Climate warming over the past three decades has shortened rice growth duration in China and cultivar shifts have further accelerated the process for late rice. Glob. Change Biol. 2013, 19, 563–570. [Google Scholar] [CrossRef] [PubMed]
  43. Wang, Y.; Zhang, J.; Song, G.; Long, Z.W.; Chen, C.Q. Impacts of recent temperatures rise on double-rice phenology across southern China. Int. J. Plant Prod. 2019, 13, 1–10. [Google Scholar] [CrossRef]
  44. Wang, H.H. A Simulation Study on Rice Productivity under Future Climate Change. Master’s Thesis, Nanjing Agriculture University, Nanjing, China, 2014. [Google Scholar] [CrossRef]
  45. Malhi, G.S.; Kaur, M.; Kaushik, P. Impact of Climate Change on Agriculture and Its Mitigation Strategies: A Review. Sustainability 2021, 13, 1318. [Google Scholar] [CrossRef]
  46. Yin, J.; Wei, D.Q. Study on the Crop Suitability and Planting Structure Optimization in Typical Grain Production Areas under the Influence of Human Activities and Climate Change: A Case Study of the Naoli River Basin in Northeast China. Sustainability 2023, 15, 16090. [Google Scholar] [CrossRef]
  47. Karl, T.R. Modern Global Climate Change. Science 2003, 302, 1719–1723. [Google Scholar] [CrossRef]
  48. Deng, G.; Tang, Z.G.; Li, C.K.; Chen, H.; Peng, H.H.; Wang, X.R. Extraction and analysis of spatiotemporal variation of rice planting area in Hunan province based on MODIS time-series data. Remote Sens. Land Resour. 2020, 32, 177–185. [Google Scholar] [CrossRef]
  49. Tang, J.Y.; Zhang, X.J.; Chen, L.Y.; Zhan, W.X.; Xiao, J.F.; Liu, Y.; Jin, L.X.; Deng, W. Geographical spatial differentiation characteristics of double-season rice in Hunan province based on remote sensing data products. Hunan Agric. Sci. 2023, 5, 82–87+93. [Google Scholar] [CrossRef]
Figure 1. Distribution of average daily temperature ((a): 1961–1980; (b): 1981–2000; (c): 2001–2020) and its climatic trend rate (d) during the early-season rice growth period in Hunan Province.
Agriculture 14 01514 g001
Figure 2. Distribution of average daily maximal temperature ((a): 1961–198; (b): 1981–2000; (c): 2001–2020) and its climatic trend rate (d) during the early-season rice growth period in Hunan Province.
Agriculture 14 01514 g002
Figure 3. Distribution of average daily minimum temperature ((a): 1961–1980; (b): 1981–2000; (c): 2001–2020) and its climatic trend rate (d) during the early-season rice growth period in Hunan Province.
Agriculture 14 01514 g003
Figure 4. Distribution of ≥10 °C accumulative temperature ((a): 1961–1980; (b): 1981–2000; (c): 2001–2020) and its climatic trend rate (d) during the early-season rice growth period in Hunan Province.
Agriculture 14 01514 g004
Figure 5. Distribution of sunshine hours ((a): 1961–1980; (b): 1981–2000; (c): 2001–2020) and its climatic trend rate (d) during the early-season rice growth period in Hunan Province.
Agriculture 14 01514 g005
Figure 6. Distribution of precipitation ((a): 1961–1980; (b): 1981–2000; (c): 2001–2020) and its climatic trend rate (d) during the early-season rice growth period in Hunan Province.
Agriculture 14 01514 g006
Table 1. Changes in daily average temperature, daily average maximal temperature, daily average minimum temperature, and their climatic trend rate during the early-season rice growth period in Hunan Province.
Periods of TimeAverage Temperature (°C)Climatic Trend Rate (°C/10a)Maximal Temperature (°C)Climatic Trend Rate (°C/10a)Minimum Temperature (°C)Climatic Trend Rate (°C/10a)
1961–198020.40 b−0.31 c24.93 b−0.52 c17.01 b−0.06 b
1981–200020.37 b0.18 b24.77 c0.15 a17.08 b0.24 a
2001–202021.36 a0.35 a25.92 a0.06 b17.90 a0.27 a
Note: Different lowercase letters in the same column indicate significant differences at the 0.05 level (p < 0.05).
Table 2. Changes in effective accumulative temperature, sunshine hours, precipitation, and climatic trend rate during the early-season rice growth period in Hunan Province.
Periods of TimeATe (°C)Climatic Trend Rate (°C/10a)Sunshine
Hours (h)
Climatic Trend Rate (h/10a)Precipitation (mm)Climatic Trend Rate (mm/10a)
1961–19803004.66 b−71.02 c698.45 a−60.57 b869.42 a9.89 c
1981–20002998.84 b39.01 b640.48 b−31.73 a866.70 a117.87 a
2001–20203192.86 a73.36 a658.14 b−60.43 b873.33 a34.13 b
Note: Different lowercase letters in the same column indicate significant differences at the LSD 0.05 level (p < 0.05).
Table 3. Changes in thermal resources and their climatic trend rate for early-season rice at different growth periods in Hunan Province.
Meteorological FactorPeriods of TimeSowing-
Seedling Stage
Transplanting-
Tillering Stage
Booting StageHeading StageFilling and Ripening Stage
DAT (°C)1961–198012.62 b18.73 b22.74 b24.84 b26.48 a
1981–200012.58 b18.92 b22.81 b24.69 b26.57 a
2001–202012.90 a19.65 a23.10 a25.19 a26.74 a
Climatic trend rate (°C/10a)0.17 B0.40 A0.16 B0.15 B0.11 C
DATmax (°C)1961–198017.17 b22.32 b26.55 a28.63 b30.47 a
1981–200017.06 b22.49 b 26.41 a28.08 c30.21 a
2001–202017.53 a23.13 a26.74 a29.05 a30.74 a
Climatic trend rate (°C/10a)0.16 B0.35 A0.08 C0.18 B0.16 B
DATmin (°C)1961–19809.42 b14.63 c18.58 c20.78 b22.87 b
1981–20009.56 ab14.91 b18.79 b21.02 a23.01 ab
2001–20209.73 a15.47 a19.14 a21.02 a23.14 a
Climatic trend rate (°C/10a)0.13 BC0.37 A0.24 B0.10 C0.16 B
ATe (°C)1961–1980277.43 b556.79 ab592.42 b646.52 b691.27 b
1981–2000273.53 b543.85 b594.56 b648.21 b692.03 b
2001–2020296.82 a590.96 a610.53 a666.58 a702.78 a
Climatic trend rate (°C/10a)8.43 B14.86 A7.87 B8.72 B5.00 C
Note: Different lowercase letters in the same column under the same meteorological factor indicate significant differences at the LSD 0.05 level. And different uppercase letters on the same line indicate significant differences at the LSD 0.05 level.
Table 4. Changes in sunshine hours, precipitations, and the climatic trend rate of early-season rice at different growth periods in Hunan Province.
Meteorological FactorPeriods of TimeSowing-Seedling StageTransplanting and Tillering StageBooting StageHeading StageFilling and Ripening Stage
Sunshine
hours (h)
1961–1980102.58 a160.49 b158.76 a84.93 a188.45 a
1981–2000100.42 b158.43 b143.64 b79.63 b183.56 ab
2001–202098.43 c164.23 a148.82 b78.14 b177.48 b
Climatic trend rate (°C/10a)−1.80 B2.51 A−7.37 C−2.74 B−5.64 C
Precipitation
(mm)
1961–1980167.81 a239.71 a185.65 b96.04 a179.29 b
1981–2000169.77 a231.67 b185.61 b95.43 ab180.56 b
2001–2020159.49 b234.65 b197.71 a93.56 b192.13 a
Climatic trend rate (°C/10a)−3.62 D−2.20 C3.94 A−1.08 B5.13 A
Note: Different lowercase letters in the same column under the same meteorological factor indicate significant differences at the LSD 0.05 level. And different uppercase letters on the same line indicate significant differences at the LSD 0.05 level.
Disclaimer/Publisher’s Note: The statements, opinions and data contained in all publications are solely those of the individual author(s) and contributor(s) and not of MDPI and/or the editor(s). MDPI and/or the editor(s) disclaim responsibility for any injury to people or property resulting from any ideas, methods, instructions or products referred to in the content.

