Abstract
The aim of this study was to analyze and compare evapotranspiration estimates obtained from different data sources over grassland regions in central-western Poland during the vegetation seasons in the years 2021 and 2022. The dataset provided includes evapotranspiration (ET) estimates derived from three sources: (1) evapotranspiration measurements from the ECOSTRESS satellite; (2) evapotranspiration estimates calculated using the energy balance method based on ERA5-Land meteorological data with land surface temperature (LST) from MODIS; and (3) evapotranspiration estimates with meteorological data derived from ground measurements replacing ERA5-Land data and using MODIS LST for the surface temperature. For the second and third sources, where the energy balance method (Penman–Monteith) was applied, the data used for the ET calculation were obtained from the nearest ground-based meteorological station to the test fields, with the most distant fields being up to 40 km away in a straight line. In addition, for comparison, the MOD16 global evapotranspiration product was added. In a study conducted in the central-western region of Poland, specifically in Wielkopolska (NUTS2–PL41), 18 grassland plots ranging in size from 0.36 to 21.34 ha were studied, providing valuable insights into the complex relationships between environmental parameters and evapotranspiration processes. The evapotranspiration derived from different sources was tested by applying correlation with soil moisture and the height of the grass obtained from ground measurements. It was found that the evapotranspiration data derived from ECOSTRESS had the best correlation with soil moisture (r = 0.46, p < 0.05) and the height of the grass (r = 0.45, p < 0.05), both of which were statistically significant. The values of the ground measurements (soil moisture and vegetation height were considered as verification for the evapotranspiration precision). In addition, the information about precipitation and air temperature during the time of measurements was considered as the verification for the evapotranspiration conditions. Comparisons between ECOSTRESS data and other sources suggest that ECOSTRESS measurements may offer the most precise estimates of evapotranspiration in the studied region.
1. Introduction
Evapotranspiration (ET) is a crucial process in the water cycle that represents the sum of evaporation from the soil surface and transpiration from plants. It plays a significant role in various fields, including agriculture, hydrology, and ecology. ET is a key variable in the hydrological cycle and is essential for applications in agriculture, water resource management, and environmental sustainability. The assessment of evapotranspiration is important for managing water resources efficiently, and its accuracy is crucial for estimates of the water balance. Changes in evapotranspiration rates can be indicative of drought conditions, helping in drought monitoring and early warning systems. Understanding the relationship between evapotranspiration and vegetation in the process of flux exchange between vegetation and atmosphere helps optimize proper crop management and water use efficiency [1].
In Poland, there are periods of water scarcity and drought, and the importance of understanding and monitoring evapotranspiration becomes very significant [2,3,4,5]. By incorporating the information on evapotranspiration into agricultural planning and management practices, farmers in Poland can enhance their resilience to drought conditions and promote sustainable agriculture. Additionally, policymakers can use evapotranspiration data for water resource planning and to develop strategies for mitigating the impact of drought on the agricultural sector.
Evapotranspiration information is valuable for implementing precision agriculture techniques. Farmers can use these data to apply water and nutrients precisely where and when they are needed, optimizing resource use and minimizing the environmental impact. Understanding how much water is lost from both the soil and the crop helps farmers make informed decisions on adjusting agricultural practices, such as altering planting schedules or selecting drought-resistant crop varieties. Accurate evapotranspiration estimates are critical for determining the right amount and timing of irrigation [6,7,8].
There are well-known methods for calculating evapotranspiration, such as the Penman–Monteith method, which is based on meteorological data, and is widely used as a reference method for estimating potential evapotranspiration [9,10]. The amount of heat lost through evapotranspiration depends on various factors, including temperature, humidity, wind speed, and vegetation cover. In regions with higher temperatures and adequate water availability, evapotranspiration rates tend to be higher, leading to significant heat losses [11]. Latent heat flux measurement by eddy covariance is a measurement that needs special and expensive instrumentation [12,13]. Another method for assessing evapotranspiration is the use of lysimeters, which measure the amount of actual evapotranspiration which is released by plants. By recording the amount of precipitation that an area receives and the amount lost through the soil, the amount of water lost to evapotranspiration can be calculated. This in situ method is only site-specific and involves weighing a massive block of soil in a field to detect losses in soil moisture.
A commonly used alternative approach for evapotranspiration calculations, the Penman–Monteith equation, uses meteorological variables, as simplified by Allen in the Food and Agriculture Organization (FAO) guidelines [11]. However, as it was stated, the applications of vegetation temperature is very important in characterizing evapotranspiration [14]. Leaf temperature plays an important role in regulating the rates of mass and energy fluxes at the leaf surface. Many models predict leaf temperature or the difference between leaf and air temperature by combining energy balance with the Penman–Monteith equation. Remote sensing applications for estimating evapotranspiration (ET) have gained popularity due to their ability to provide spatially explicit information over large areas. The Penman–Monteith equation, based on meteorological data, is a widely accepted method for calculating evapotranspiration. The application of remote sensing techniques for the calculation of evapotranspiration offers advantages, especially information about vegetation, spatial coverage, and ease of data acquisition. Here are some reasons why remote sensing applications for evapotranspiration may be considered advantageous compared to the Penman–Monteith method.
High temporal resolution is beneficial for monitoring changes over time, especially in the dynamic growth of crops. The meteorological parameters needed for the Penman–Monteith equation may change spatially, and the meteorological stations are not well distributed spatially. The Penman–Monteith method is based on the concept of the evaporative demand of the atmosphere. The only factors affecting evapotranspiration (ETo) are climatic parameters. The evapotranspiration (ETc) for the specific crop can be determined from ETo using a crop-specific coefficient (Kc), typically obtained from the literature. However, it is worth noting that these coefficients are often modeled values, which may introduce some degree of uncertainty into the calculations.
Thus, remote sensing data can be integrated with hydrological and land surface models to improve the accuracy of evapotranspiration estimates. This integration allows for a more comprehensive understanding of the factors influencing evapotranspiration, including land cover, soil moisture, and vegetation characteristics. Satellite-based remote sensing technologies, such as satellite imagery, thermal infrared sensors, and climate reanalysis can provide spatial and temporal information on land surface temperature and vegetation cover, which gives an estimation of evapotranspiration for specific sites, characterized by the type of crop. One of the most popular repositories of climatological reanalysis data is ERA5-Land. Provided by the European Centre for Medium-Range Weather Forecasts (ECMWF), ERA5-Land serves as a cornerstone for refining evapotranspiration assessments. With a spatial resolution as fine as 9 km2, this repository captures intricate meteorological variations across the globe. Its comprehensive dataset comprises a myriad of meteorological variables, ranging from temperature and humidity to wind speed and precipitation, facilitating detailed analyses of evapotranspiration dynamics on a global scale [15].
Evapotranspiration refers to the combined processes of evaporation from the soil and transpiration from plants. It is an important component of the water and energy balance in ecosystems. The heat losses due to evapotranspiration are primarily associated with the energy required to convert liquid water into water vapor during the process [16].
Contemporary observation and comprehension of climate changes and their impact on the natural environment are crucial components of scientific research. One of the vital aspects of these studies involves monitoring processes related to water circulation and surface temperature on Earth [17]. With satellites capable of recording thermal radiation with sufficient spatial resolution, attention has been directed toward leveraging the phenomenon for the estimation of soil moisture [13]. Evapotranspiration, the process of water release from plants and soil into the atmosphere, is a key factor affecting the water balance and the ability of plants to survive in changing climatic conditions [16]. Simultaneously, surface temperature is a fundamental indicator for assessing climatic processes and alterations occurring on our planet.
While several methods have been developed to estimate ET with high accuracy, many of these techniques rely on complex data that do not define soil–vegetation features and complex algorithms, which can be challenging for non-expert water engineers to utilize effectively. These methodologies require data that are not available, particularly in regions where water resource management is urgently needed, but technical capacity is limited.
In response to these challenges and research needs, scientists and engineers have developed advanced monitoring technologies, including satellites. ECOSTRESS, short for “Ecosystem Spaceborne Thermal Radiometer Experiment on Space Station” [18,19], is one such satellite. It is a NASA project that provides precise measurements of surface temperature, which can be used to monitor changes in evapotranspiration processes in different ecosystems. The study of ECOSTRESS as a precursor for ESA’s future water cycle mission is an important part of the current research. Precise ET estimations are vital for assessing the Earth system’s water and energy balance, as they offer essential insights for water resource and agricultural management. These estimates are derived from land surface temperature (LST) retrievals, combined with supplementary vegetation and meteorological data, primarily from MODIS and Landsat. The calculations employ either the Priestley–Taylor Jet Propulsion Laboratory (PT-JPL) [18] algorithm or the Atmosphere Land Exchange Inverse Disaggregation (DisALEXI) algorithm [19]. Terrestrial ET, which encompasses plant canopy transpiration and evaporation from soil and canopy interception, is a pivotal hydrological component. It plays a significant role in the terrestrial carbon cycle, modulates land–atmosphere energy interactions, and influences the climate system.
This article focuses on the role of the ECOSTRESS satellite in research related to evapotranspiration and surface temperature. We will discuss how this advanced spaceborne instrument collects data and the valuable insights that can be derived from it. Furthermore, we will examine the significance of these measurements for understanding climate change, managing water resources, and monitoring vegetation health worldwide. Specifically, this research aims to create a user-friendly framework that can be employed by non-expert water engineers. By simplifying the workflow and making remote sensing data more accessible, this study seeks to broaden the applicability of ET estimation methods, enabling more accurate water management decisions in a wider range of settings. This research will explore the integration of open-source tools and simplified algorithms that do not compromise accuracy but significantly reduce the technical complexity involved. By doing so, it opens up new possibilities for non-expert engineers to apply remote sensing in water resource management. The primary scientific gap this study addresses is the lack of accessible ET estimation methods for non-expert users. While the literature provides a wealth of methodologies for accurately estimating ET, there is a lack of solutions that address the needs of water engineers who may not have advanced technical training. Existing methods often could not compromise between accuracy and ease of use, leaving a gap in the practical application of these techniques. The novelty of this study lies in its focus on bridging the gap between advanced ET estimation techniques and practical water management needs. This study is innovative in its approach to streamlining the process, making ET estimation methods more approachable and scalable, especially in resource-limited environments. Ultimately, the analysis of ECOSTRESS satellite technology opens up new possibilities in climate change and ecological research, contributing to a better understanding and protection of our planet [19,20,21].
ECOSTRESS, mounted on the International Space Station, represents a state-of-the-art thermal radiometer, offering a unique perspective on Earth’s surface temperature and thermal properties. By capturing high-resolution thermal images, ECOSTRESS facilitates the precise measurement of evapotranspiration—a fundamental process governing the exchange of water and energy between the Earth’s surface and the atmosphere. The ability to monitor these intricate dynamics at a regional scale empowers scientists to address critical environmental questions and understand the impacts of climate change on ecosystems. The Joint Experiment for Crop Assessment and Monitoring (JECAM) provides the essential terrestrial component in this research framework and could be integrated with in situ meteorological and ground observations. The JECAM encompasses an extensive network of ground-based meteorological stations strategically positioned in various ecological settings across the globe [22]. These stations collect real-time meteorological data, enriching the contextual understanding of thermal observations from ECOSTRESS. By synergizing ground-based meteorological data with spaceborne thermal observations, this research contributes to the refinement of our knowledge about Earth’s ecosystems, fosters more accurate environmental predictions, and bolsters our capacity to address the challenges of a changing climate.
The ECOSTRESS instrument is designed to measure plant temperatures, contributing to a comprehensive understanding of plant behavior and water consumption. It addresses three overarching scientific inquiries of significant importance within the field of Earth science [23].
This instrument aims to elucidate how the Earth’s biosphere responds to changes in water availability. By monitoring temperature variations in vegetation, it provides insights into how ecosystems react to alterations in water resources. ECOSTRESS also focuses on the intricate relationship between daily vegetation water stress and its impact on the global carbon cycle. Understanding the effects of daily variations in plant water stress on this vital global process is essential, and ECOSTRESS plays a key role in this endeavor. Furthermore, ECOSTRESS is instrumental in addressing whether advanced agricultural water usage monitoring, and improved drought estimation can reduce the vulnerability of agriculture [24]. By accurately measuring water consumption in agriculture and assessing the consequences of drought, it contributes to the development of strategies aimed at enhancing agricultural resilience and food security. The mission is accomplished through the precise measurement of plant temperatures [25]. Plants employ a mechanism to regulate their temperature by releasing water through specialized leaf structures, known as stomata. When plants have an adequate water supply, they can maintain their temperature within a certain range. However, in water scarcity conditions, their temperature rises as a response to stress [26]. Meteorological conditions such as air temperature, wind speed, humidity, are the important parameters for assessing the amount of net radiation energy used on latent heat flux transferred into evapotranspiration.
To collect these crucial temperature data, ECOSTRESS employs a multispectral thermal infrared radiometer (TIR), installed on the International Space Station. The instrument measures radiance in five spectral bands within the range of 8–12.5 μm, with a spatial resolution of 70 m [23]. In regions of agricultural significance such as Wielkopolska, these data prove particularly invaluable. They enable the precise monitoring of crop conditions, the prediction of water requirements, and the estimation of crop phenology and growth cycles.
2. Materials and Methods
2.1. Location and In Situ Measurements
The aim of grassland research is to obtain information on grass growth from different sources of satellite data. This information is made available to various users, such as scientists, but also farmers and environmental and climate change modelers. This research was carried out on the grassland area at NUTS2 level. Satellite data such as ECOSTRESS provide ET estimates over large and remote areas, where ground-based measurements are not feasible. Combined satellite and ET estimates, when applied using ground-based data, can be integrated with other hydrological and meteorological data to provide relevant information for modelling the water cycle. Comparing the different datasets to assess evapotranspiration helps to understand the spatial and temporal variability of ET. For the ET estimates, the energy budget approach was applied using a ground-based meteorological station located at the JECAM site. Spatial meteorological data from ERA5 and MODIS, obtained for the same time period as the ECOSTRESS ET data, along with ground soil moisture and height, served as a reference to validate and assess the accuracy of the satellite-based ECOSTRESS ET data. This accuracy was measured using the available ground measurements of soil moisture and grass height.
The research focused on the central-western region of Poland–Wielkopolska (NUTS2–PL41), where 18 grassland study fields were examined. The largest field covered an area of 21.34 hectares, while the smallest field measured 0.36 hectares. These grasslands were mown three times during the growing season, with the first mowing taking place in May, the second mowing at the end of June or the beginning of July, and the third mowing occurring until September. At these tested points, fresh matter yield, plant height, and soil moisture were measured during field campaigns throughout the growing season. Fresh matter yield was collected from 0.5 × 0.5 m quadrats and assessed under controlled laboratory conditions. Soil moisture was measured using a TRIME-PICO 64 moisture meter (IMKO Micromodultechnik GmbH, Ettlingen, Germany). The measurement campaigns in 2021 were conducted on the following dates: 2 July, 29 July, 31 July, 2 August, 21–22 August, 23 August, 4 September, 6 September, 19 September, and 23 September. In 2022, in situ measurements were conducted on the following dates: 8 July, 20 July, 24 July, 6–7 August, 25 August, and 28–29 September. Moreover, the timing of the analysis of ECOSTRESS, MODIS, and ERA5-Land imagery was aligned with the in situ measurement periods in the grasslands, and the meteorological station data corresponded precisely with the dates of the measurements and imagery.
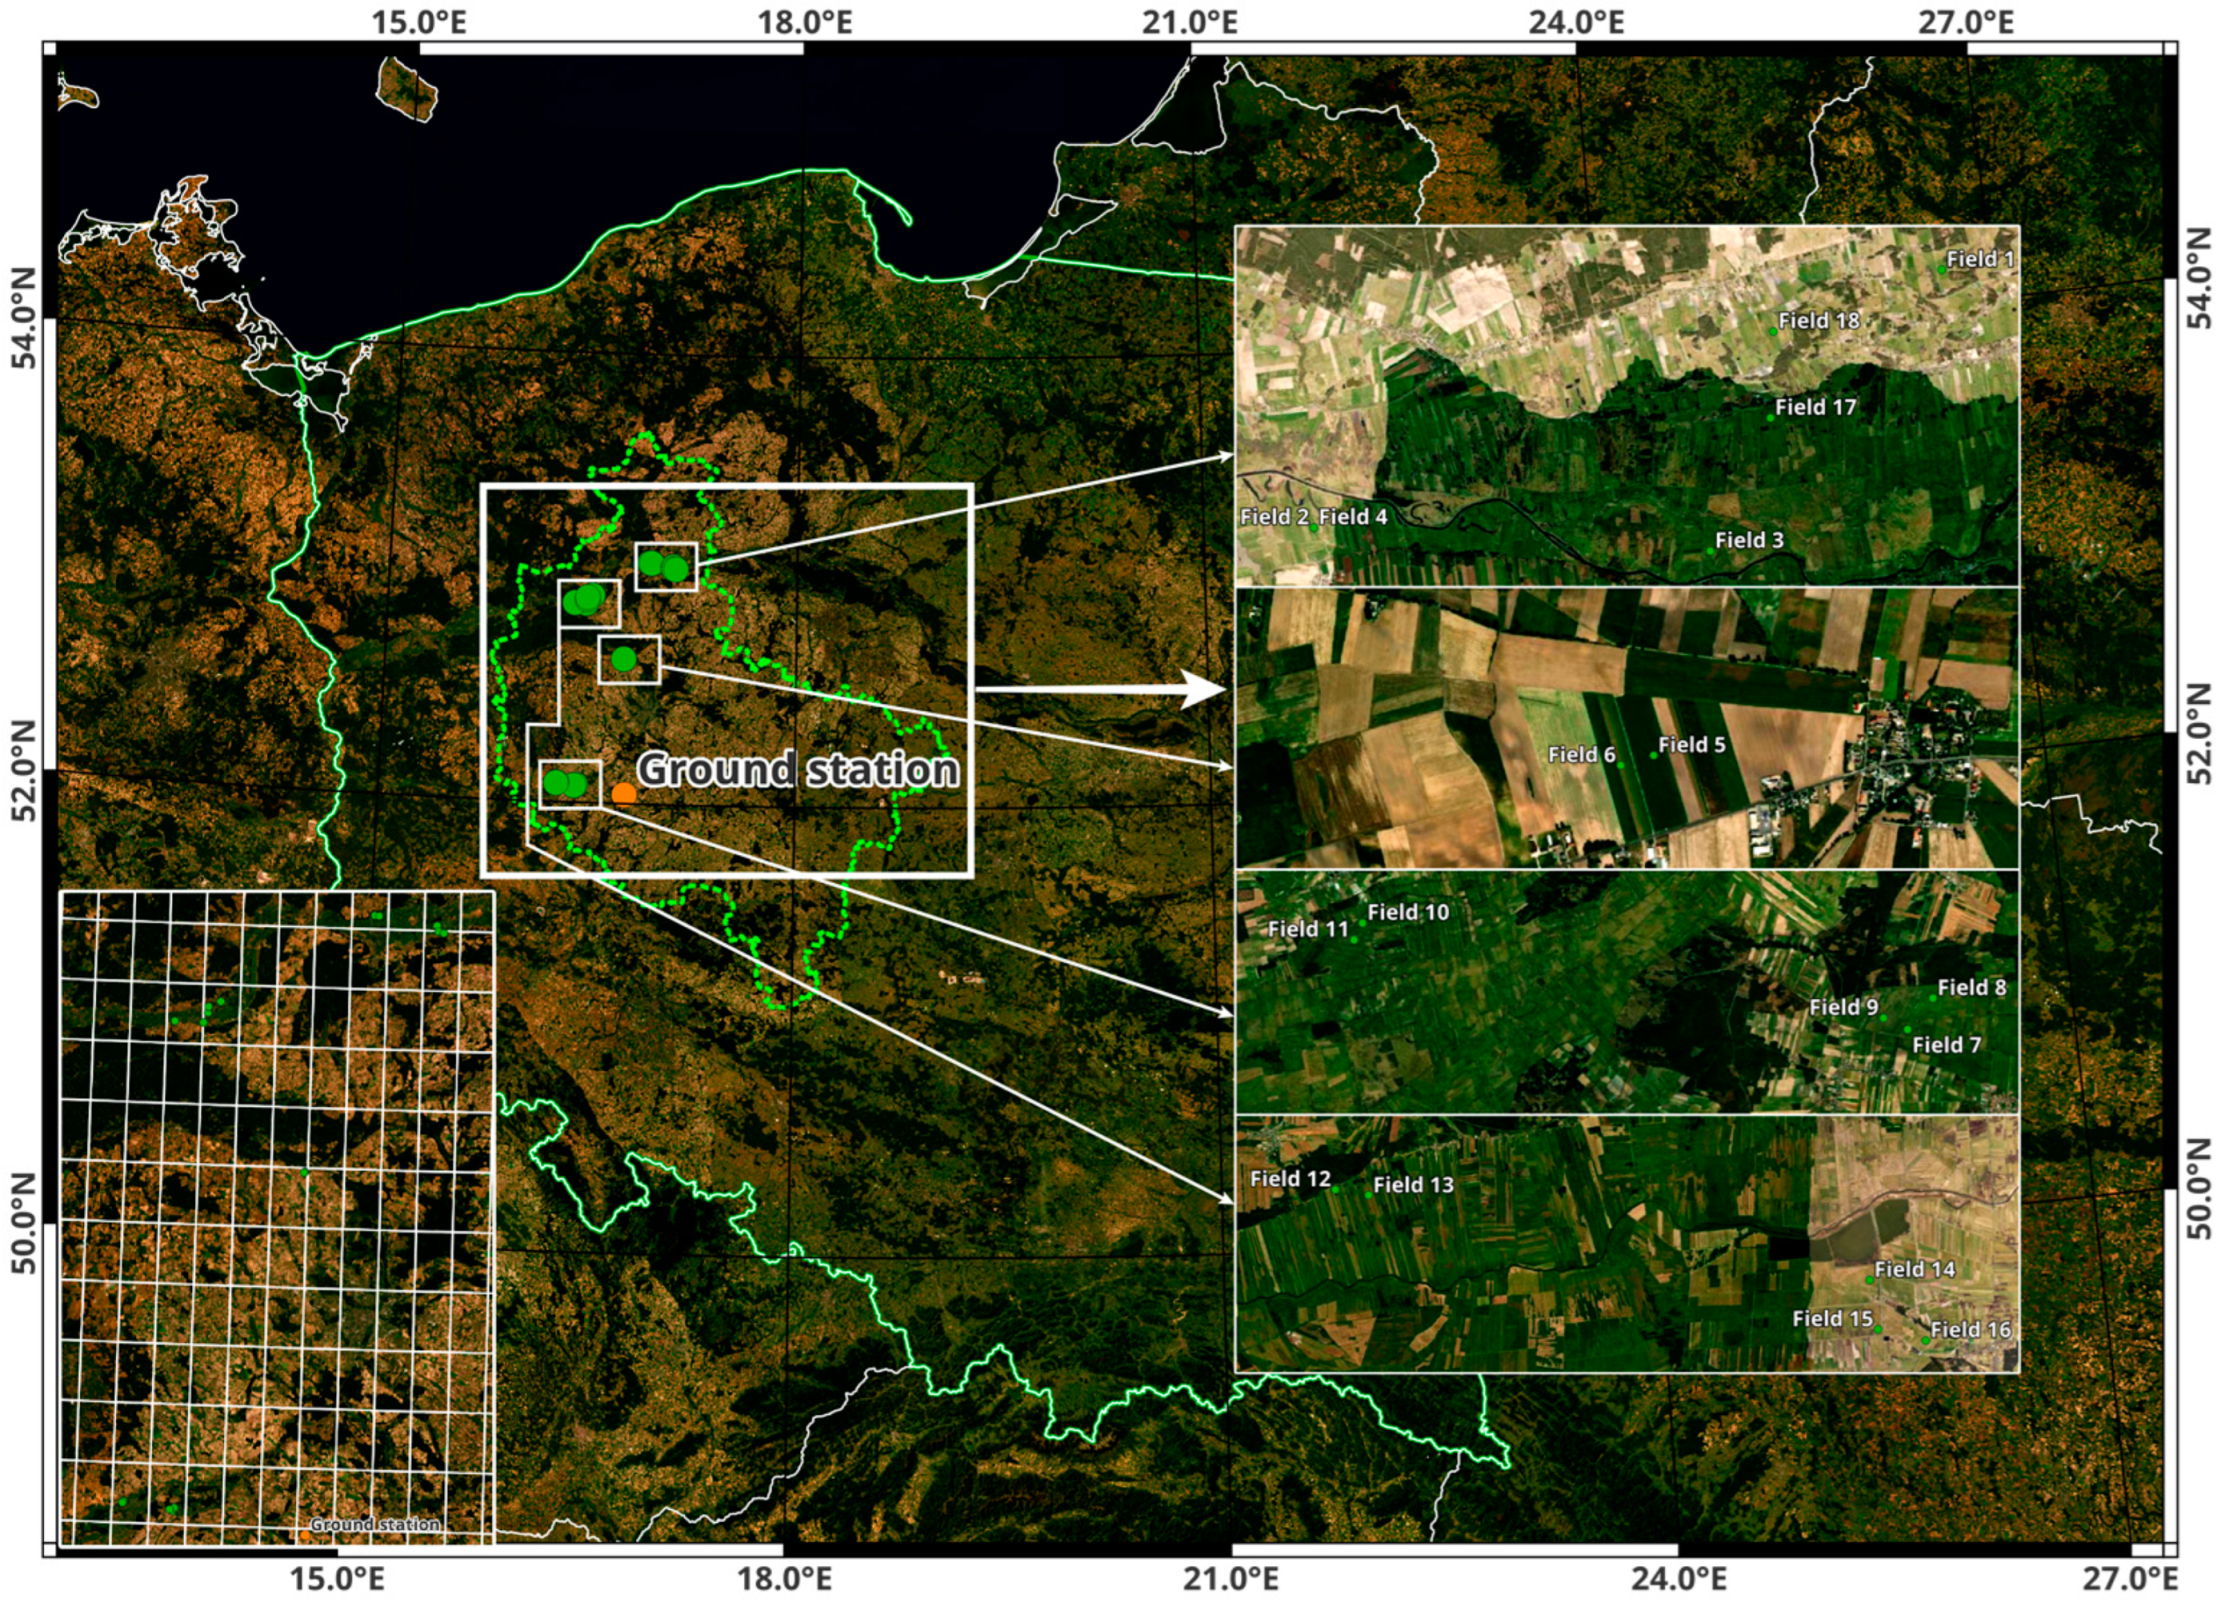
Due to the limited availability of cloud-free satellite data, particularly in the later discussed ECOSTRESS dataset, most of the data pertained to the period between the second and third mowing events. The spatial distribution and significance within the broader landscape are visually represented in Figure 1.
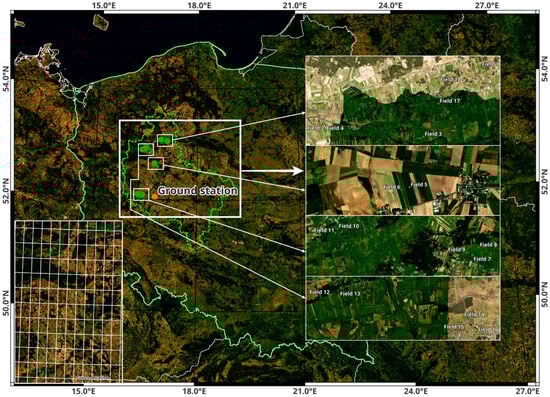
Figure 1.
Location of measurement points and ground station. On the right side, within the white rectangle, there is a close-up view of all the measurement fields displayed on an Esri World Imagery background. The four rectangular areas marked on the map correspond to different regions where detailed measurements were conducted. In the bottom left corner, there is a view of all test fields with an overlaid ERA5-Land grid.
The Wielkopolska region experiences a transitional climate, characterized by relatively mild winters and warmer summers compared to other regions in Poland. With an average annual temperature of approximately 7.5 °C and an annual rainfall of around 500 mm, these climatic conditions significantly influence evapotranspiration processes. The temperature variations throughout the year directly impact the rate of evaporation from the soil and transpiration from vegetation. Additionally, the availability of water, as influenced by rainfall patterns, affects the overall water balance and, consequently, the evapotranspiration rates observed within the study area [27].
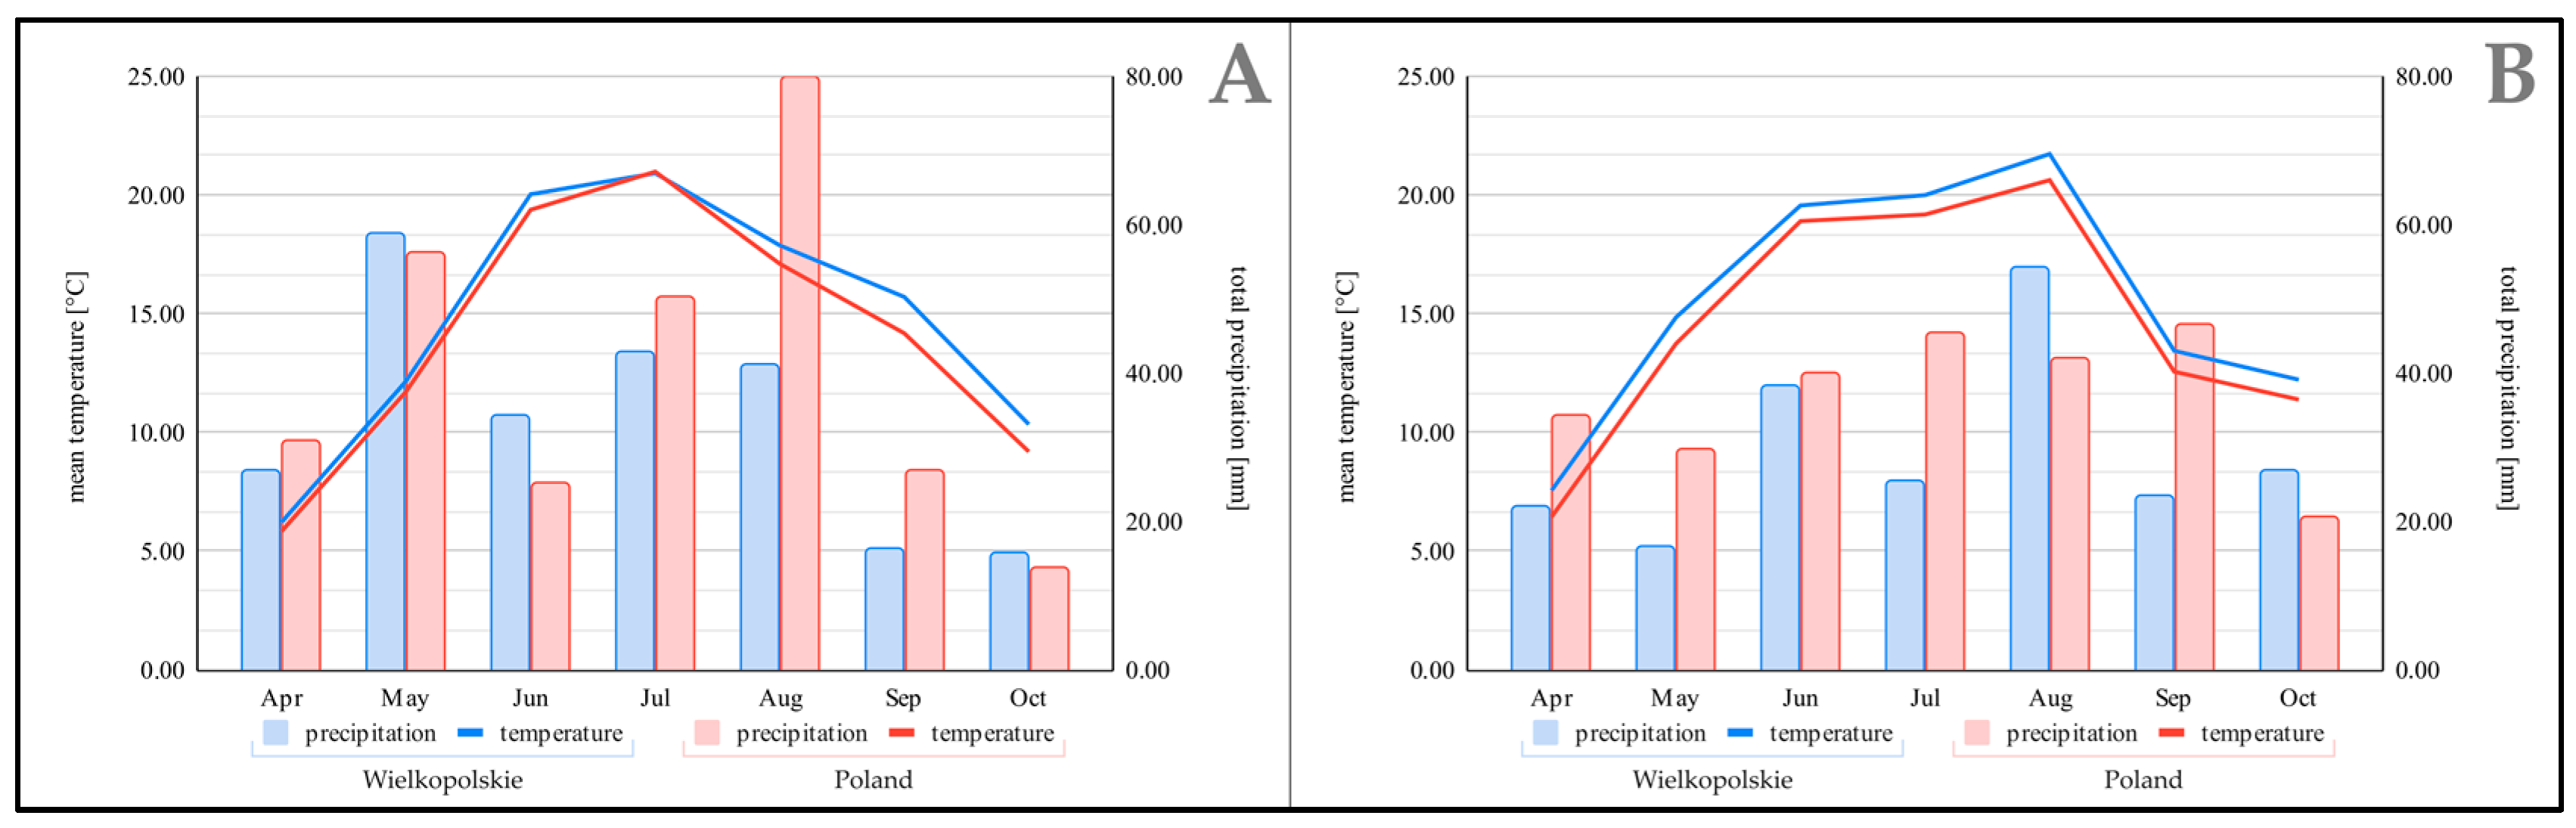
In Figure 2, the seasonal variation in mean temperature and total precipitation for the Wielkopolska region and Poland is presented for the growing seasons (April to October) of 2021 (Graph A) and 2022 (Graph B) based on ERA5-Land data. The temperature trends in both years reveal a consistent peak in July for both regions, with Wielkopolskie consistently showing slightly higher temperatures compared to the national average.
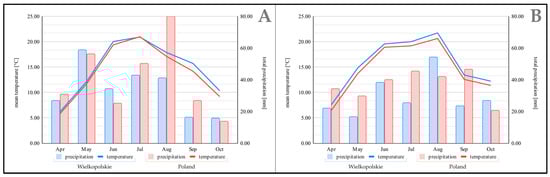
Figure 2.
Seasonal variations in temperature and precipitation for Wielkopolska and the broader domain, based on ERA5-Land data for 2021 (A) and 2022 (B).
In terms of precipitation, distinct differences are observed between the two years. In 2021, precipitation in Wielkopolskie peaks in May, whereas Poland shows its highest precipitation in August. In contrast, the 2022 data display a different pattern, with precipitation in Wielkopolskie being highest in June and July, while Poland exhibits a more even distribution of rainfall across June, July, and August.
2.2. Meteorological Data Collection from Ground Station
The meteorological station (Figure 1), located within the Joint Experiment for Crop Assessment and Monitoring (JECAM), collects a diverse range of data every 15 min, providing insights into various environmental parameters. These include measurements related to radiation, such as shortwave and longwave radiation fluxes, as well as net radiation. Additionally, it captures information on atmospheric conditions, including air temperature, relative humidity, and wind speed, all of which are crucial for calculating evapotranspiration (ET) using the energy balance approach. Furthermore, the station monitors soil properties, such as soil temperature and soil electrical conductivity. Additionally, rainfall data is collected to monitor precipitation events. Together, these measurements enable comprehensive environmental monitoring and analysis, facilitating a better understanding of the local ecosystem dynamics.
It should be noted that this station does not have a lysimeter installed. As a result, direct measurement of ET was not possible, and instead, meteorological data from the station were utilized to calculate ET using the energy balance equation. The station’s data have been thoroughly vetted for homogeneity and normality, ensuring their suitability for the analyses conducted in this study.
In the context of this research, where ECOSTRESS data availability is highly limited, meteorological data corresponding to the exact dates and times of the satellite overpasses were selected.
2.3. ERA5-Land Data
In this study, ERA5-Land reanalysis data were employed to supply essential meteorological inputs for the Penman–Monteith equation, which is used to estimate evapotranspiration across grassland regions in central-western Poland. ERA5-Land provides high-resolution data with a spatial grid of approximately 9 km and a temporal resolution of one hour. This dataset includes key meteorological components, such as net radiation (Rn), soil heat flux (G), air temperature, and wind speed. These variables are integral to the Penman–Monteith equation, which combines both energy balance and aerodynamic principles to estimate evapotranspiration rates. Net radiation (Rn) serves as the primary energy input for evaporation and transpiration processes, while soil heat flux (G) accounts for the energy transferred into the soil, affecting soil temperature and moisture levels. Air temperature is crucial for calculating the saturation vapor pressure and the potential evaporation, while wind speed influences the rate of water vapor transport away from the surface.
2.4. Energy Balance Methodology
Calculations of latent heat (LE) and then evapotranspiration ET are based on the phenomena of the exchange of energy between a plant canopy and the surrounding environment. The input of remotely sensed temperature to the energy balance method is important for the spatial variation of fluxes. The latent heat flux (LE) is calculated as a residual of the simplified energy budget equation [28,29]:
where
- LE—latent heat flux [W m−2], Rn–net radiation [W m−2], H—sensible heat flux [W m−2];
- G—soil heat flux [W m−2].
- Net radiation (Rn), soil heat flux (G), air temperature, and wind speed were measured at the meteorological station and applied from ERA5-Land.
- cp—volumetric heat capacity [J m−3 K−1], Ta—surface temperature [K];
- Ta—air temperature [K];
- ra—stability corrected aerodynamic resistance [s m−1].
- For the stable case (Ts − Ta) < 0 and for the unstable case (Ts − Ta) > 0, ra was calculated as a function of Ri (Richardson number) according to Jackson et al. (1987) [30].
The surface temperature for each grassland pixel was obtained from Terra MODIS.
The amount of thermal energy that moves through an area of soil in a unit of time is the soil heat flux. Much of the energy that enters the soil during the day returns to the atmosphere at night through terrestrial longwave radiation. Soil heat flux (G) is the smallest component of the daily surface energy balance and very often is ignored. Surface soil heat flux typically represents 1 to 10% of Rn. The flux plate method is the most popular method for determining G.
The relationship between the heat flux (G) and net radiation Rn and air temperature (Ta) was determined based on two-year measurements of soil heat flux, net radiation, and air temperature [31]. For 338 observations, the equation defining the calculated soil heat flux as a function of the measured values is represented as follows:
where
- Rn—net radiation [W m−2];
- Ta—air temperature [K].
To calculate the daily evapotranspiration Ed (in mm day−1), a simple relationship proposed by Jackson et al. (1987) and Dąbrowska-Zielińska (1995) was applied [30,31]. Assuming that the ratio of instantaneous evapotranspiration Eo to daily evapotranspiration Ed is proportional to the ratio of instantaneous net radiation flux RNi to the daily net radiation flux RNd, the equation for Ed was expressed as follows:
where
- Ed—daily evapotranspiration [mm day−1];
- ET—instantaneous evapotranspiration [mm];
- RNd—daily net radiation flux [J m−2 day−1];
- RNi—instantaneous net radiation flux [J m−2].
- The value of ET was calculated as the product of latent heat flux LE and the factor L, which transforms LE from W m−2 to millimeters per square meter. The constant L is equal to 2,448,000 J kg−1.
This method also incorporates plant height, measured through in situ observations across 18 field sites. These parameters are essential for characterizing the land surface properties and vegetation dynamics, which significantly influence energy balance calculations and evapotranspiration estimates. Plant height provides information about the aerodynamic roughness of the land surface, affecting wind speed profiles and turbulent heat fluxes. Biomass growth rate reflects the vegetation’s physiological activity and water uptake, influencing the partitioning of available energy into latent and sensible heat fluxes.
2.5. Utilization of MODIS LST and ERA5-Land Data in Evapotranspiration Estimation
2.5.1. Energy Balance Method Based on Ground Measurements with MODIS LST Data
Ground measurements encompass meteorological variables such as wind speed, air temperature, net radiation, and the aggregation of radiative balance throughout diurnal periods, specifically during daylight hours, which are pivotal for computing the energy balance. Wind speed and air temperature exert an influence over the exchange of sensible heat, whereas net radiation represents the energy accessible for driving evapotranspiration processes.
Terra MODIS LST [32,33] also plays a crucial role in this method by providing accurate surface temperature measurements. The high spatial and temporal resolution of MODIS LST enables detailed characterization of surface temperature variations across the study area at the same time as ECOSTRESS acquisition.
2.5.2. Energy Balance Method Based on ERA5-Land with MODIS LST Data
Utilizing the ERA5-Land dataset [15,34,35] facilitated a more detailed analysis of evapotranspiration, particularly in areas distant from ground stations. ERA5-Land provides comprehensive meteorological inputs, including crucial variables, such as wind speed, air temperature, net radiation (Rn), and the amount of solar and thermal radiation reaching the surface of the Earth. These variables play pivotal roles in the estimation of the various components of the energy balance equation governing evapotranspiration dynamics. Wind speed and air temperature govern the exchange of sensible heat between the land surface and the atmosphere, influencing the turbulent transfer of heat. Net radiation represents the equilibrium between incoming and outgoing radiation fluxes at the Earth’s surface, capturing the energy available for driving surface processes.
MODIS LST, with its high temporal resolution, furnishes meticulous temperature data, effectively capturing surface temperature fluctuations, even in remote regions. Incorporating MODIS LST into energy balance calculations facilitates precise estimations of latent heat flux (LE) and subsequent evapotranspiration rates.
2.6. ECOSTRESS Observations
The ECOsystem Spaceborne Thermal Radiometer Experiment on Space Station (ECOSTRESS) was launched to the International Space Station (ISS) on 29 June 2018. It was developed and managed by the National Aeronautics and Space Administration (NASA). The ISS orbit allows ECOSTRESS to capture diurnal temperature variations. The system was designed to measure plant and soil temperatures, providing data for satellite-based crop water analysis [17]. This capability is facilitated by an infrared thermal radiometer, HyspIRI, which measures radiation across five spectral bands between 8 and 12.5 μm, with a Noise Equivalent Differential Temperature (NEDT) of 0.1 K at 300 K. ECOSTRESS operates with a spatial resolution of 70 m and 3–5 days revisit time, with a native pixel size of 38 m × 69 m, resampled by data software to 70 × 70 m, and a swath width of 402 km (53°) [36]. ECOSTRESS offers four tiers of data products, with each successive tier integrating more supplementary information. At level 1, the data include raw instrument and calibration data (L0-1A), calibrated at-sensor radiances (L1B_RAD), and geolocation data (L1B_GEO). At level 2, the instrument uses numerical weather prediction data for atmospheric adjustments, yielding land surface temperature and emissivity (L2_LSTE) and cloud mask (L2_CLOUD). These are derived through the Temperature and Emissivity Separation retrieval algorithm, a method utilized in various other missions. At level 3, the product integrates atmospheric data from MODIS and surface properties from MODIS and Landsat to generate evapotranspiration (ET) components such as canopy transpiration, soil evaporation, and interception evaporation. This is achieved via the Priestley–Taylor (PT) JPL retrieval algorithm (L3_ET_PT-JPL) and ET product (L3_ET_ALEXI), specifically for selected U.S. agricultural sites using the Disaggregated Atmosphere-Land Exchange Inverse model. The highest level 4 features a stress index based on the Evaporative Stress Index (ESI) (L4_ESI_PT-JPL; L4_ESI_ALEXI) and a water use efficiency (WUE) product (L4_WUE). Originally, this incorporated gross primary production from MODIS but later transitioned to a native 70 m gross primary production product via the Breathing Earth System Simulator algorithm. The structure organizes the data products hierarchically, making the information more digestible [37]. Due to the lack of availability of level 4 data in the research area and the limited availability of the algorithm (L3_ET_ALEXI), the (L3_ET_PT-JPL) data products were selected for further analysis.
2.6.1. Introduction to the PT-JPL Model
The PT-JPL model initiates with the Priestley and Taylor equation, which calculates potential evapotranspiration (PET) using net radiation and air temperature data. Land surface temperature (LST) plays a pivotal role in determining the upwelling longwave radiation (AA L Wout). This radiation significantly influences the spatial variability of AAnn, making LST an essential input for PET computation. The model subsequently scales PET to separately estimate the three components of actual ET: plant canopy transpiration (AA ETcc), soil evaporation (AA ETss), and canopy interception evaporation (AA ETii). These estimations are modulated by constraints related to the temperature, moisture content, and vegetation fraction [37]. It is important to note that all the ET values are expressed in units of W m−2 signifying the latent heat essential for converting liquid water in soils and plants into vapor [36]. Latent heat for daily evapotranspiration using the PT-JPL algorithm was used to divide the stream by the latent heat of evaporation. The value of the density of the water vapor stream obtained in kg m−2 s−1.The result was obtained in units commonly used in meteorology mm m−2 day−1. After converting the PT-JPL daily model, it allowed for obtaining the result of the average daily evapotranspiration in mm m−2 day−1 in a given pixel of the ECOSTRESS product.
2.6.2. ECOSTRESS Data Processing
The data processing methodology employed for ECOSTRESS is a structured and systematic approach designed for comprehensive insights into surface evapotranspiration and temperature variations. This methodology unfolds through several distinct phases.
A visual interpretation of the obtained data is performed to identify the dataset. At this stage, priority is given to datasets with minimal cloud cover and the highest pixel-produced category. This has a key impact on the quality of the measurements. The assessment includes a detailed examination of data availability during the designated follow-up period. Importantly, this analysis includes an analysis of data retrieval times, revealing measurements mainly in August, typically between 7:00 a.m. and 10:00 a.m., and later measurements in July and August, which most often occur between 3:00 p.m. and 5:00 p.m.
After data selection, statistical calculations are performed to glean a comprehensive understanding of the selected datasets. These calculations encompass the computation of fundamental statistical parameters, such as the mean, median, standard deviation, maximum, and minimum values. Notably, these statistics are calculated for two key parameters: canopy evapotranspiration, expressed as a percentage (%), and land surface temperature (LST), quantified in degrees Celsius (with conversion from Kelvin).
To facilitate data processing, operations are executed on CSV tables using data analysis tools such as spreadsheets. Additionally, the R programming language, commonly within the R Studio application [38], is leveraged for these operations.
A custom R programming script is then developed to automate the process of generating statistical insights and graphical representations. This script serves as a crucial tool, ensuring the efficient execution of data analysis tasks and contributing to the uniformity of results.
The research findings are finally translated into graphical data visualizations using QGIS 3.28.1 software (Figure 3). These visualizations serve as a means of effectively conveying the research outcomes, enhancing the accessibility and clarity of the results.
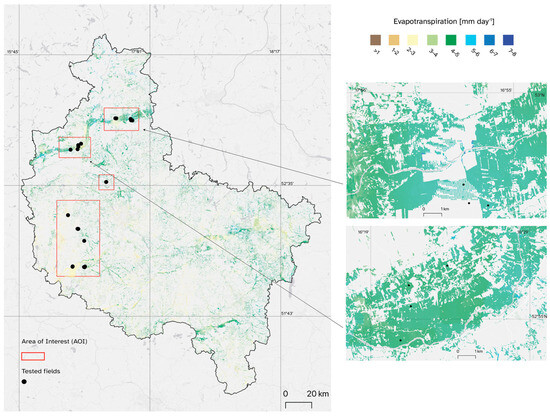
Figure 3.
Grassland daily evapotranspiration [mm day −1] for the Wielkopolska region on 16–17 August 2022.
In the examination of ECOSTRESS data as a grassland daily evapotranspiration map utilizing the PT-JPL algorithm for 16–17 August 2022, discernible spatial patterns of evapotranspiration variability within grassland ecosystems emerged. Despite consistent land use, a pronounced diversity in evapotranspiration values was evident across the grassland landscape. The evapotranspiration values exhibited a wide range, spanning from 3.5 to 5.5 mm day−1, with maximal values reaching 7 mm day−1. This variability highlighted localized areas with distinct evapotranspiration characteristics, suggesting the influence of various factors, such as distance from water bodies, soil conditions, and microclimate conditions. Additionally, notable features, such as the proximity of the Noteć River and nearby forest patches, may have contributed to the observed heterogeneity in evapotranspiration values, emphasizing the need for detailed spatial analysis to elucidate the underlying drivers of water flux dynamics within grassland ecosystems. However, it is important to note that in the ECOSTRESS data for the study area, errors in georeferencing and negative bias were observed, as revealed by in situ and MODIS land surface temperature (LST) measurements. Similarly, areas closer to cities and grassland areas located directly in urban areas presented lower evapotranspiration values. Furthermore, significant cloud cover in the study region limited the availability of ECOSTRESS data primarily to observations from mid-August, coinciding with the onset of the third grassland mowing event. These limitations underscore the challenges associated with remote sensing data processing and highlight the necessity for quality control procedures and enhanced temporal coverage to ensure accurate assessments of evapotranspiration dynamics in grassland ecosystems.
Enhancement of ECOSTRESS Data Processing Techniques
The data processing methodology, employed in the context of ECOSTRESS, incorporates a crucial aspect involving data retrieval and analysis from the appeears.earthdatacloud.nasa.gov portal [39]. This portal offers a distinctive functionality that allows for the extraction of statistics about measurement points, classified under specific categories, notably related to the type of crop under study. This functionality serves as an invaluable asset in the data analysis process, facilitating the examination of data, in alignment with the specific categories of interest.
To execute this operation, users input data points, along with unique identifiers (IDs) and the respective category. The portal then conducts a comprehensive evaluation of the provided data points. The evaluation encompasses an assessment of data availability for these points and, significantly, the extraction of the desired statistics. This feature provides researchers with a tailored approach to access data statistics according to the specific categories and ID points, streamlining the analysis process.
However, it is important to note a challenge that arises in the functioning of the entire application. This challenge pertains to the absence of automation in reading cloud cover information from satellite scenes. Cloud cover information is paramount, as it can significantly influence the final statistical outcomes. The lack of automation in this critical aspect may necessitate manual interventions and adjustments to ensure data accuracy and integrity.
In addition, the methodology extends to the assignment of random cultivation points to each of the measurement fields. This assignment is followed by the retrieval of CSV files containing daily evapotranspiration statistics for each of the specified categories.
3. Results
Analysis of Evapotranspiration Estimates from Ground Station Meteorological Measurements, ERA5-Land, and MODIS Data with ECOSTRESS Observations
The analysis conducted a comparative examination of evapotranspiration estimates obtained from diverse data sources across grassland regions in central-western Poland. The provided dataset comprises evapotranspiration (ET) estimates derived from three sources, including the following:
- ECOSTRESS: measurements of evapotranspiration from the ECOSTRESS satellite.
- Energy balance method based on ERA5-Land data and MODIS LST: evapotranspiration estimates are calculated using the energy balance method based on ERA5-Land meteorological data with surface temperature from MODIS Land Surface Temperature (LST).
- Energy balance method based on meteorological data from ground station measurements and MODIS LST: evapotranspiration estimates derived from ground station measurements, replacing ERA5-Land data and utilizing MODIS LST for land surface temperature.
These three datasets represent distinct methodologies for estimating evapotranspiration. The subsequent analysis aims to elucidate the differences and similarities among these estimates, providing insights into their reliability and applicability for assessing water balance dynamics in grassland ecosystems.
The observations reveal notable variations in the ET values among the different methods for the same dates. For instance, on 12 August 2021, the ET values from ECOSTRESS ranged from 2.04 mm day−1 to 4.61 mm day−1, while the corresponding values from the energy balance method based on ERA5-Land with MODIS LST ranged from 4.17 mm day−1 to 4.74 mm day−1. Similarly, the energy balance method based on ground meteorological measurements with the MODIS LST yielded ET values ranging from 4.65 mm day−1 to 5.01 mm day−1 depending on the tested field. However there is a similarity in the results of evapotranspiration obtained applying meteorological data from ground stations, as well as from ERA5-Land.
The correlation matrix presented in Table 1 illustrates the relationships between different variables related to evapotranspiration (ET) estimation. These correlations provide insight into the degree of agreement between different ET datasets. Each cell in the matrix represents the correlation coefficient (r) between pairs of variables.

Table 1.
Correlation matrix of evapotranspiration variables. Values significant at p < 0.05 are highlighted in red.
Evapotranspiration (ET) estimates from ECOSTRESS and ERA5-Land-based methods exhibit a moderate positive correlation of 0.47. Similarly, ECOSTRESS ET shows a moderate positive correlation with soil moisture (0.46) and grass height (0.45), based on 54 observations, highlighting the influence of these factors on evapotranspiration dynamics in grasslands.
Additionally, ERA5-Land-based evapotranspiration displays a moderate positive correlation with soil moisture (0.36) and grass height (0.28), indicating their interconnectedness. Soil moisture exhibits a strong positive correlation with grass height (0.68), emphasizing the relationship between vegetation growth and soil water content.
Fresh biomass demonstrates a moderate positive correlation with grass height (0.42) and a weaker positive correlation with soil moisture (0.24), suggesting its association with vegetation density and water availability in grassland ecosystems.
The consistent correlations between ECOSTRESS and ERA5-Land-based evapotranspiration not only validate the reliability of these datasets but also open up possibilities for accessing evapotranspiration data in areas accessible to ERA5-Land climatological reanalysis but unavailable for ECOSTRESS due to factors such as cloud cover or biases.
The correlation between ET from ECOSTRESS and ET calculated using the meteorological data from the ground station and MODIS is poor but significant.
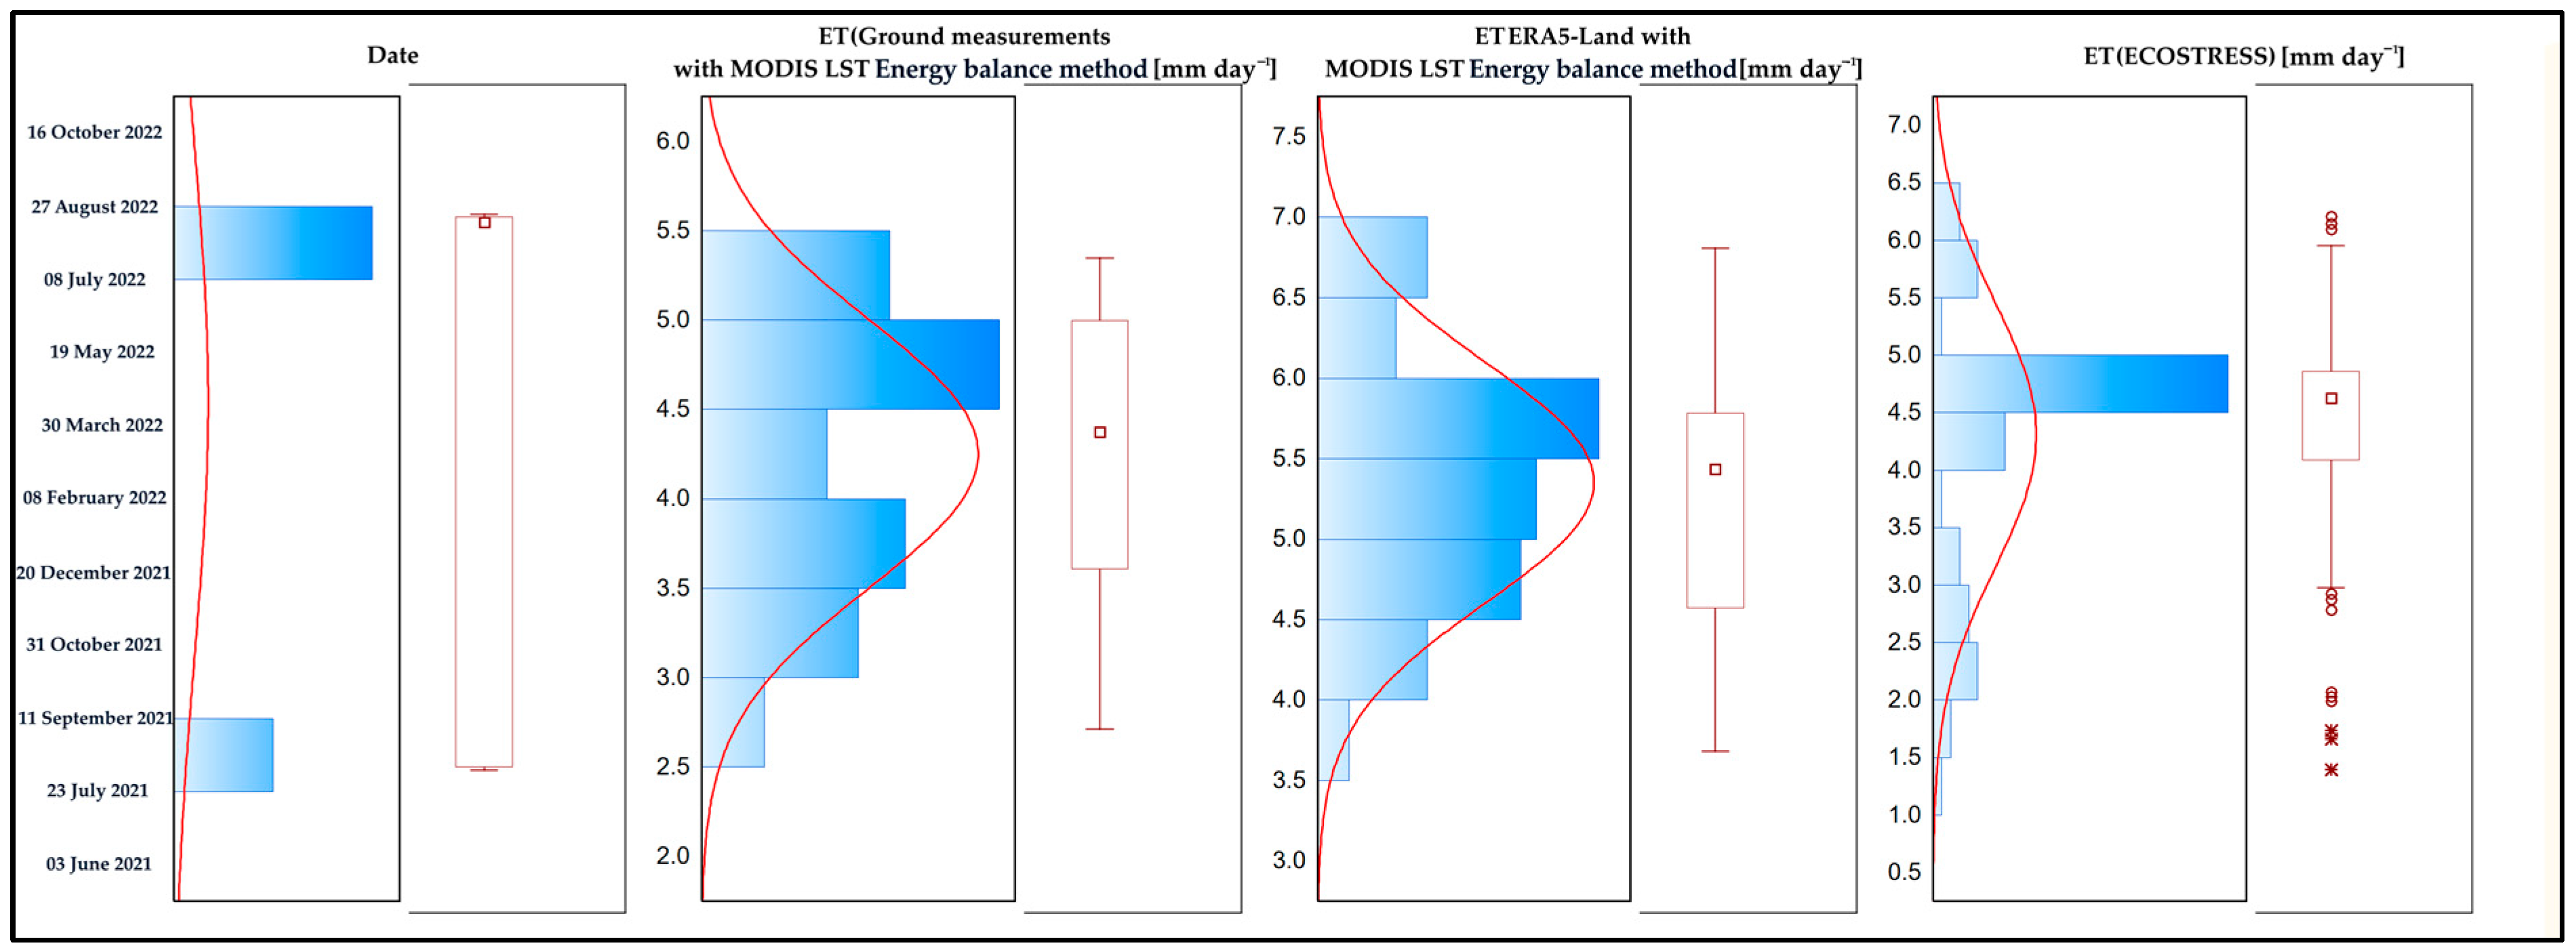
The histogram distribution (Figure 4) was generated to visualize the frequency distribution, spread, and central tendency of the evapotranspiration (ET) values across the different data sources and dates. The first image represents the time period during which the measurements were taken. The subsequent histograms reveal the variability in ET values over time and between the three methods: ECOSTRESS, ERA5-Land-based energy balance method, and ground measurements (meteorological station data)-based energy balance method, aggregated for all in situ measurement points. The distribution illustrates the range of ET values observed, highlighting the spread and central tendency of the data for each method. The histogram provides insights into the distributional characteristics of ET estimates, aiding in the understanding of the variability and consistency of evapotranspiration measurements across the study period and data sources.
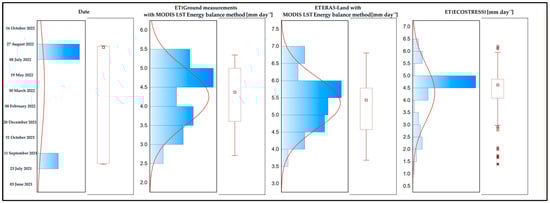
Figure 4.
Comparative analysis of evapotranspiration (ET) from different sources. The red lines represent the fitted distribution curves. The symbols highlight outliers or specific data points that deviate from the overall trend. The square within the box plot indicates the mean value of the dataset.
The distribution of data reveals variations in the ranges of values and their frequencies. For the ET (ECOSTRESS), the evapotranspiration values seem to be distributed around the mean value, with a standard error of 1.14 mm day−1, with occasional outliers, particularly observed from 13 to 16 August 2021. Similarly, the ET ERA5-Land-based values also center around the mean, with a standard error of 0.74 mm day−1, but there are notable outliers, especially at the beginning of August 2022. In contrast, the ET ground meteorological measurements-based values exhibit a concentrated distribution of values around the mean, with a standard error of 0.75 mm day−1, with fewer outliers compared to the other columns. These variations in distribution suggest differences in environmental conditions and the accuracy of the measurement methods at different periods. Additionally, the presence of outliers may indicate measurement errors or atypical environmental conditions in specific instances.
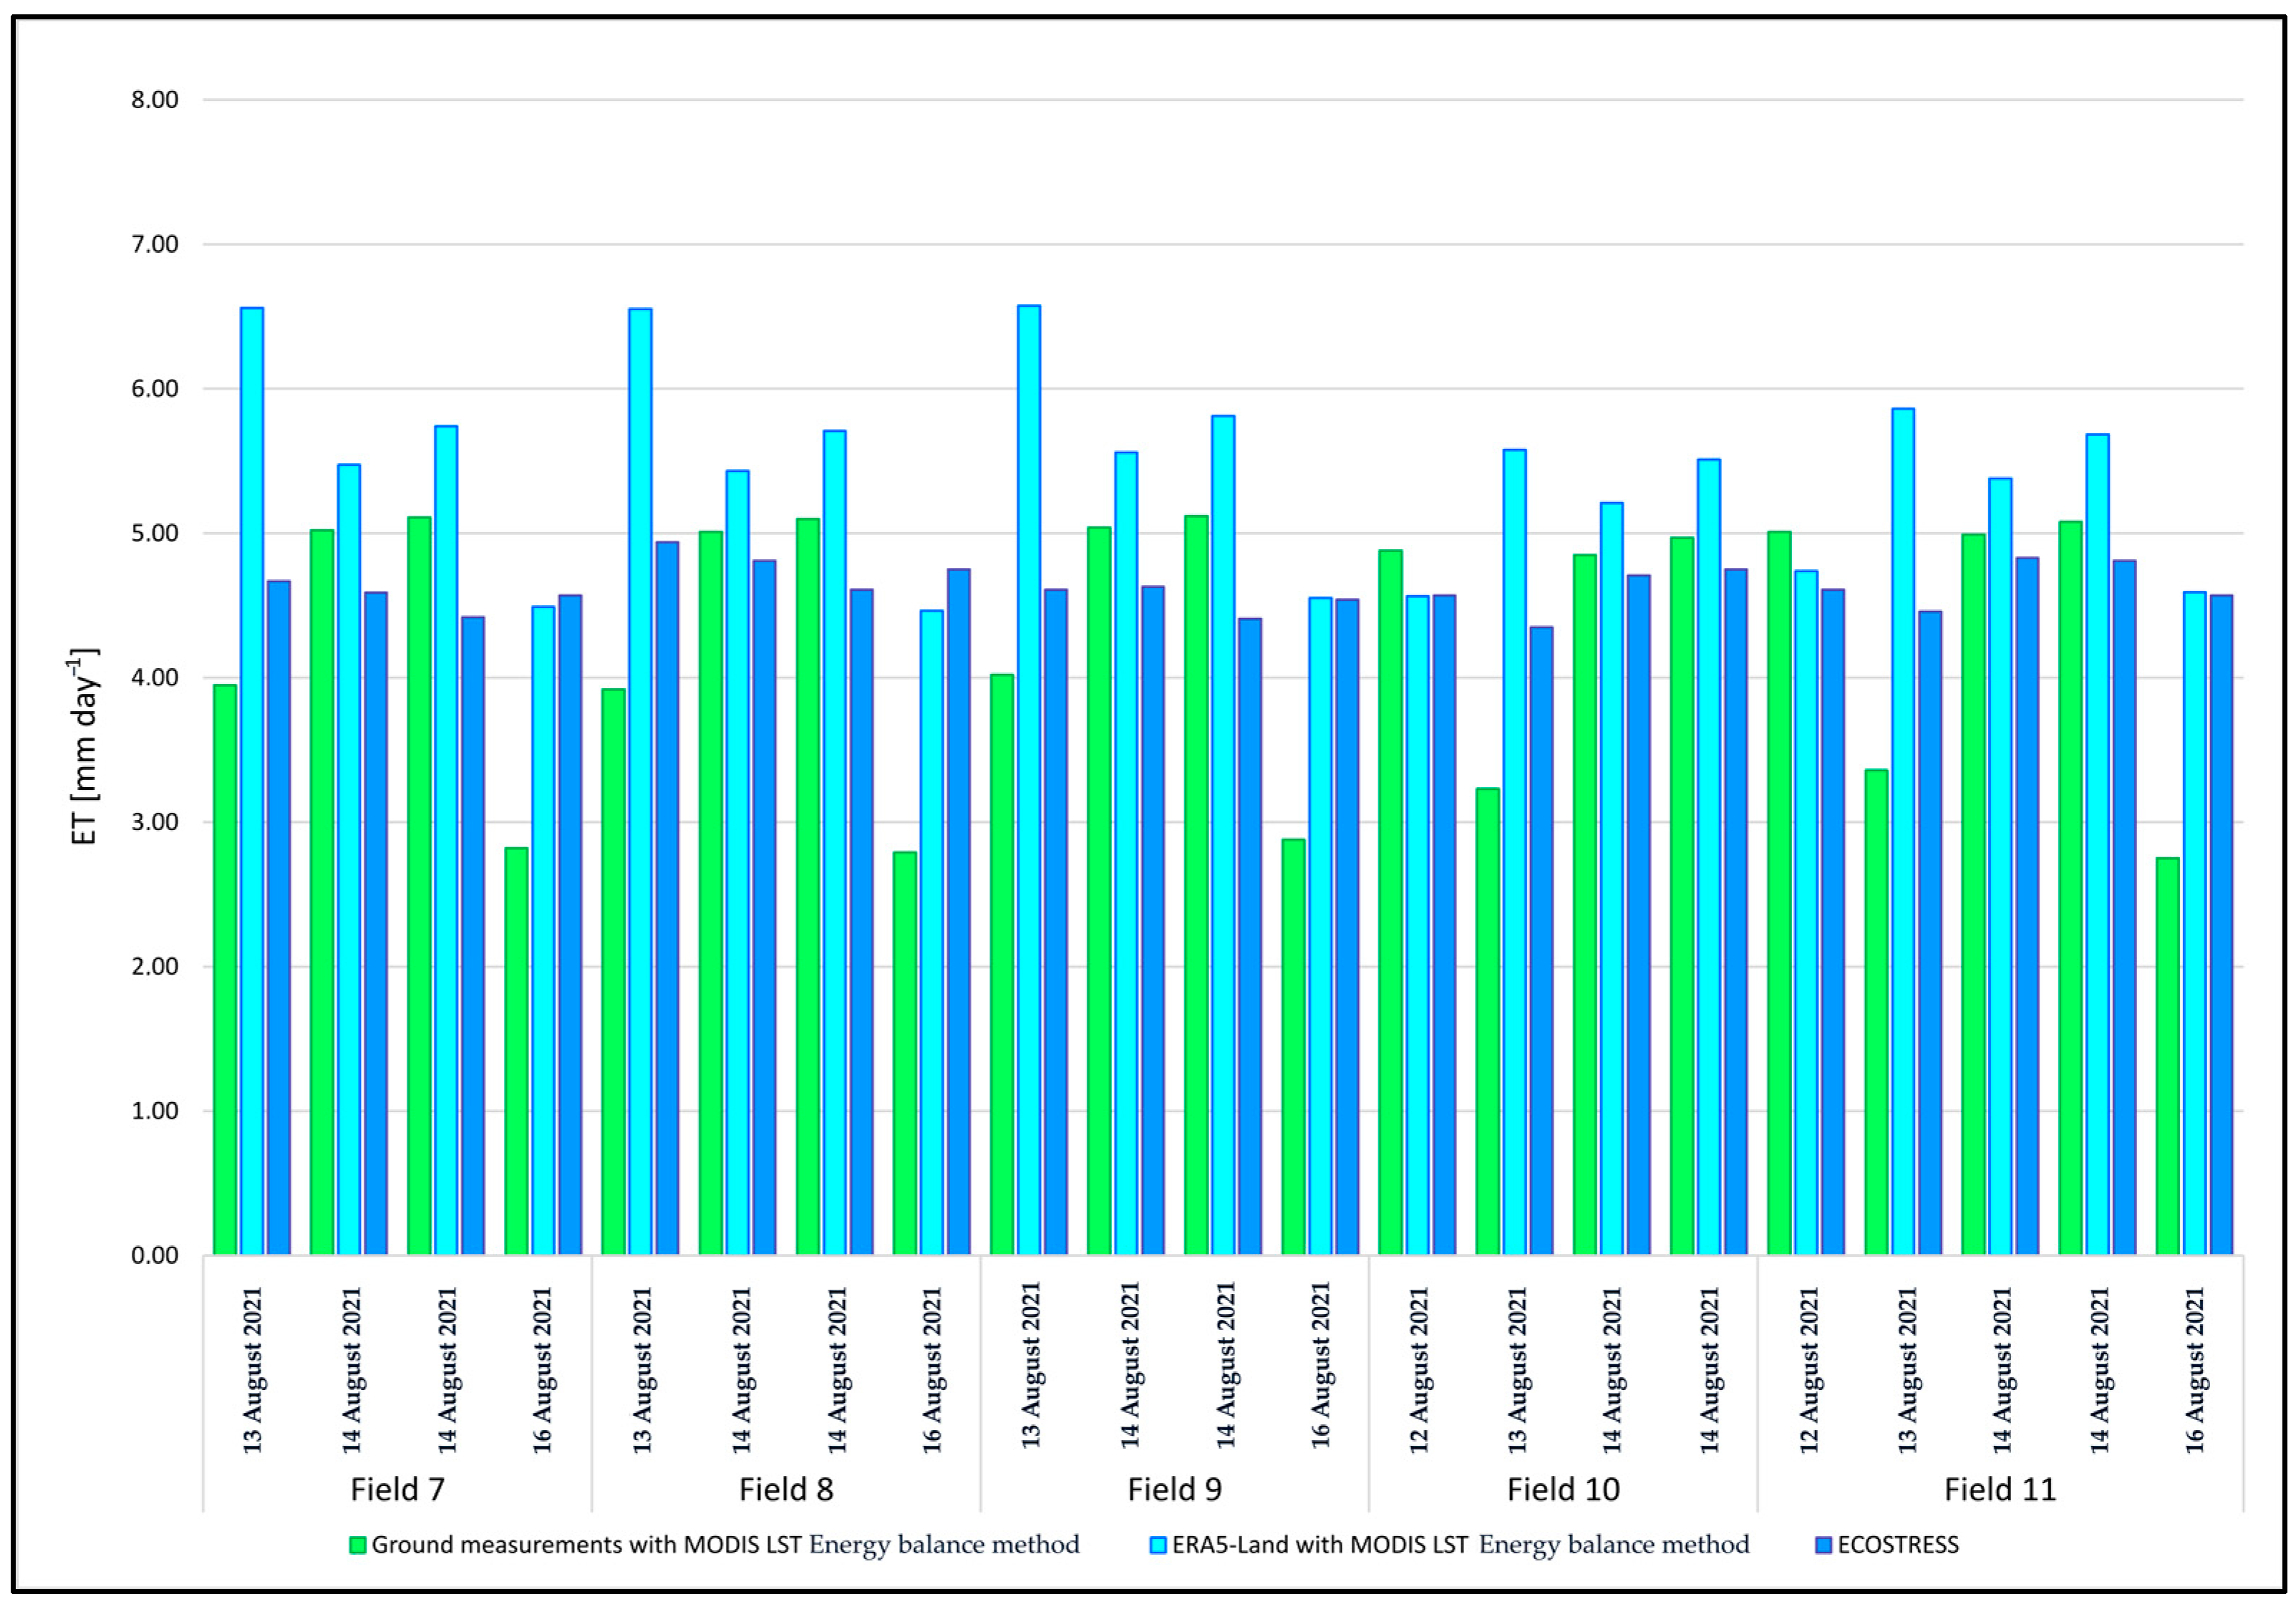
The comparison of evapotranspiration (ET) estimates from different methods for the tested dates, as shown in Figure 5 and Figure 6, reveals several noteworthy findings. Across the selected fields, there is variability in ET values depending on the data source. However, these differences are relatively minor for the three sources on the test date. For example, Field 9 in 2021 exhibits the highest ET value, approximately 5.56 mm day−1, when using the ERA5-Land-based method, while Field 7 shows the lowest ET value, around 4.59 mm day−1, according to the ECOSTRESS data. The average soil moisture for these fields is approximately 37%, with a standard deviation of about 10%. The high soil moisture values at the time of the measurements indicate that the evapotranspiration from the three sources was high.
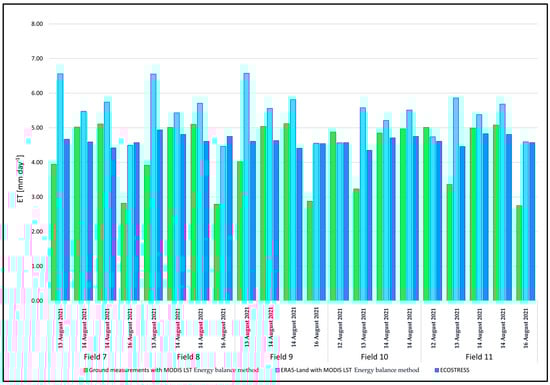
Figure 5.
The variation of evapotranspiration (ET). Estimates from different sources in August 2021.
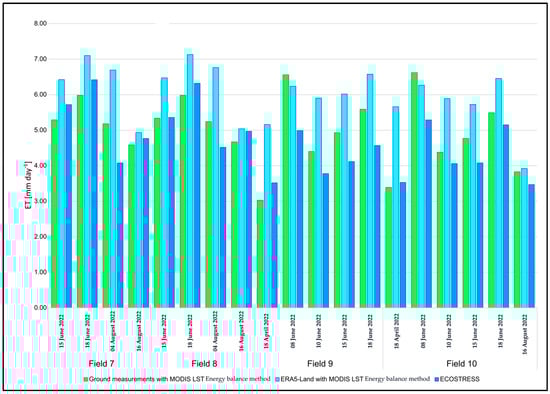
Figure 6.
The variation of evapotranspiration (ET). Estimates from different sources in August 2022.
When comparing these results with those from August 2022 (as shown in Figure 7), a notable shift in ET dynamics is observed. During this period, the overall ET values were lower, reflecting the reduced soil moisture levels, resulting from lower precipitation in August 2022 compared to the same period in 2021. Fields 9 and 10, in particular, demonstrated the lowest ET values among all fields, indicating significant moisture stress. This is directly correlated with the reduced rainfall in the region, which limited the water available for evapotranspiration.

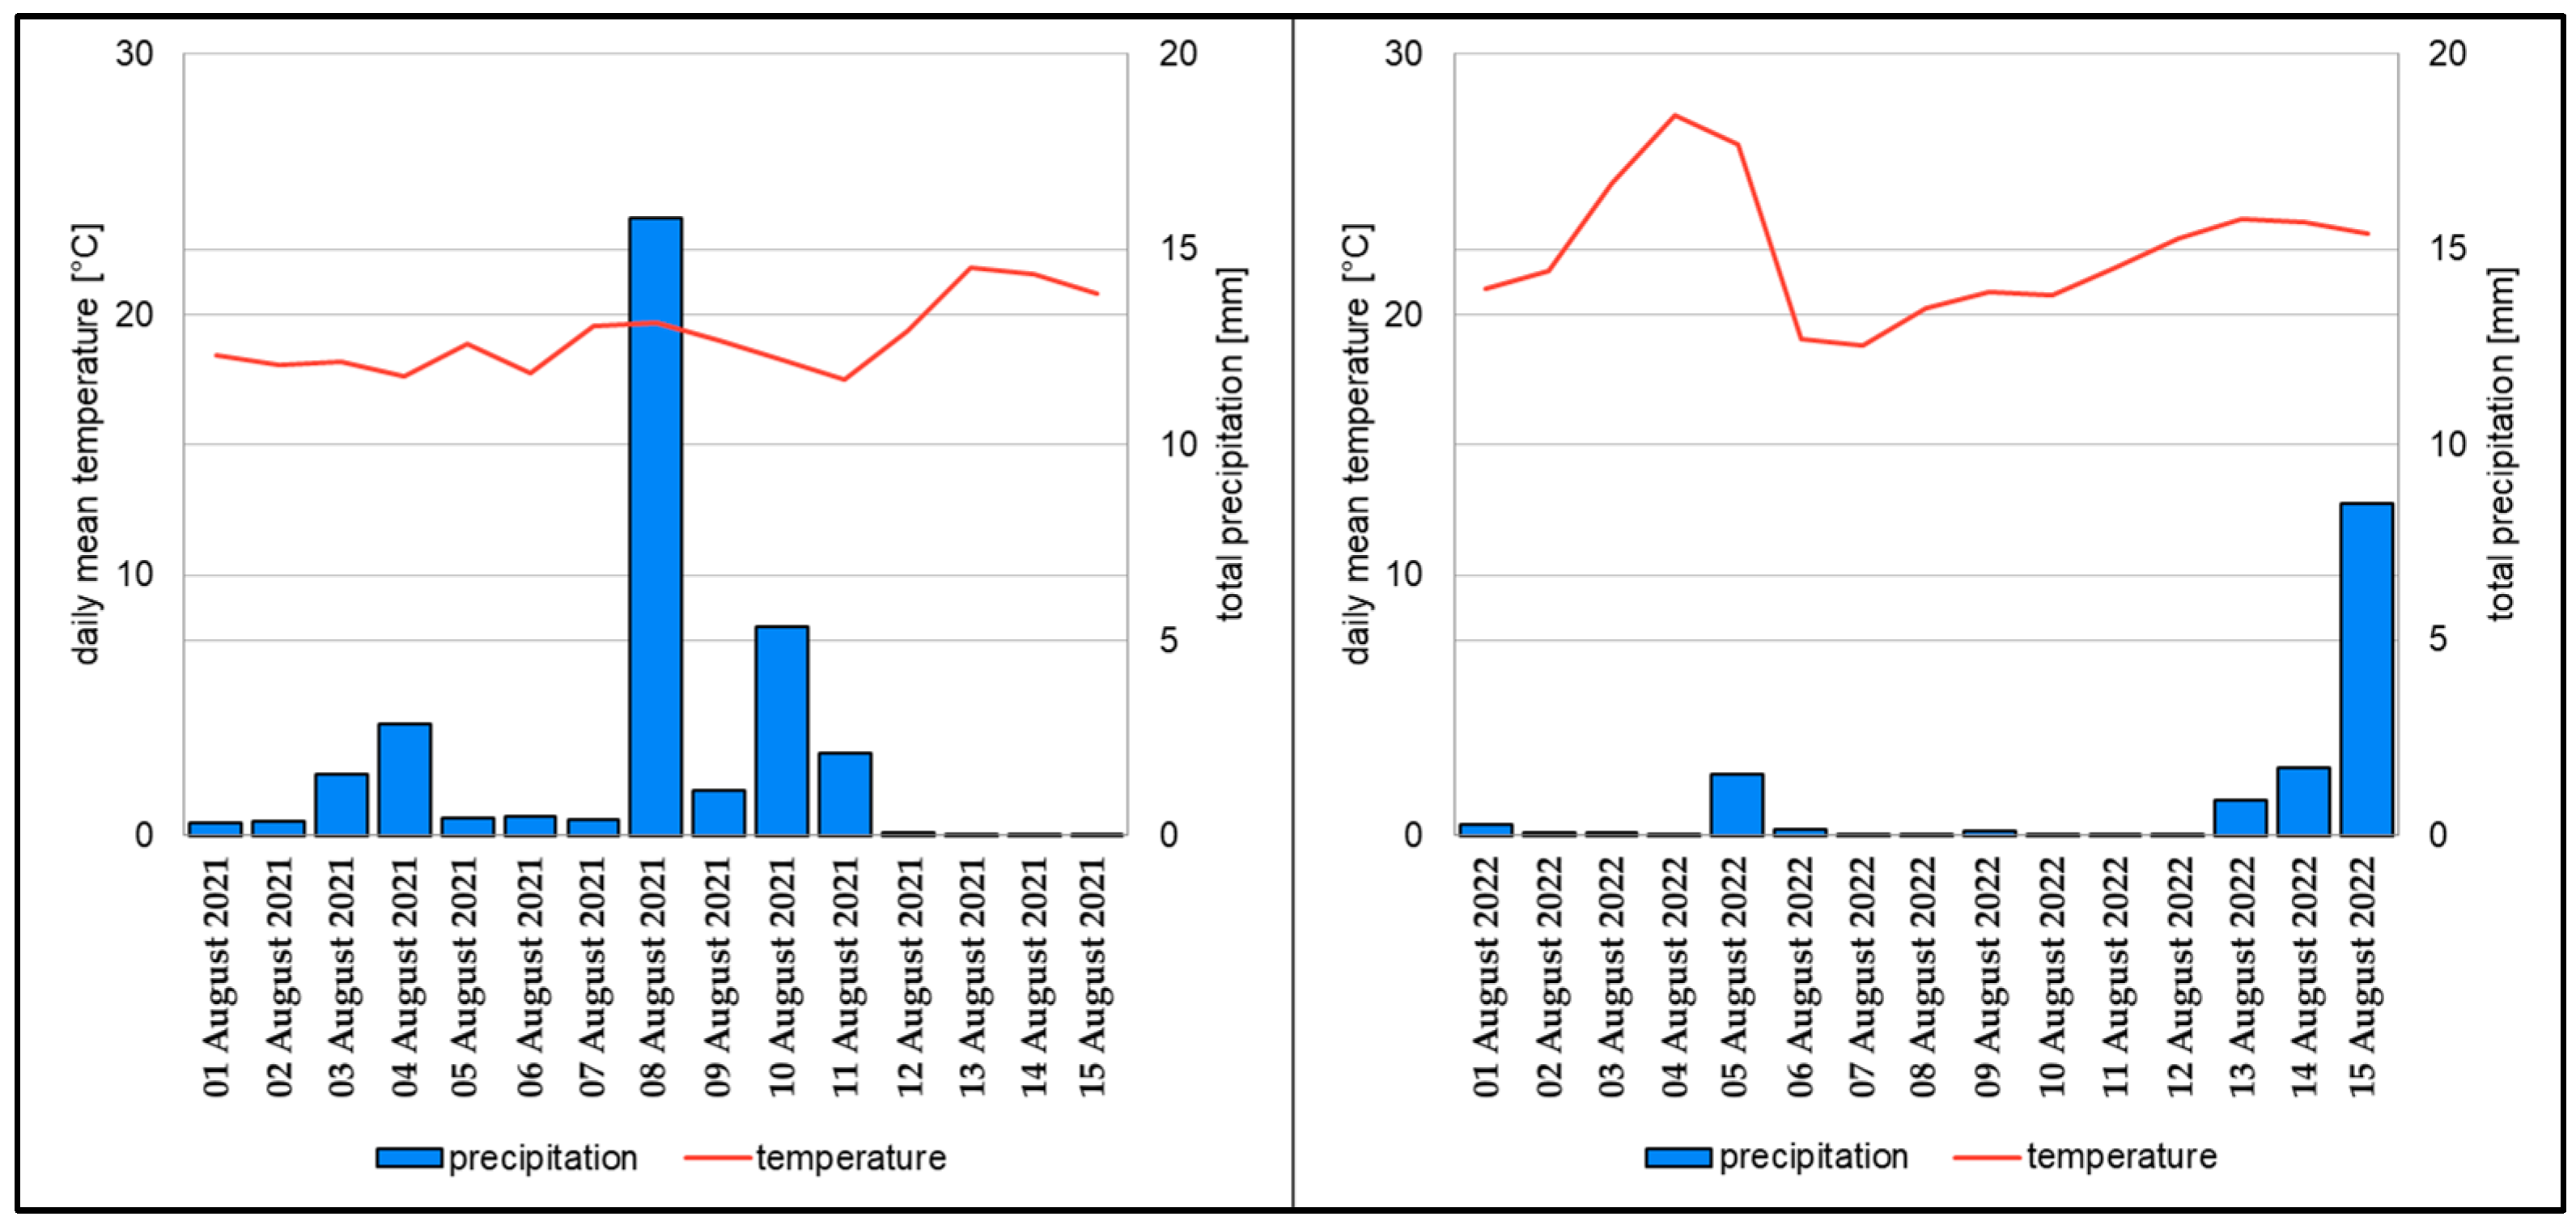
Figure 7.
Values of precipitation and air temperature from ERA5 data set from 1.08 to 15.08 in 2021 (on the left side) and 2022 (on the right side) for the study area.
The year 2022 was much dryer than 2021 (Figure 7), and precipitation occurred after 10 of August, which effected the low evapotranspiration in the first part of August, as observed by ECOSTRESS and ET derived from ERA5 and ground meteorological data. Moreover, the ET values derived from ECOSTRESS in 2022 exhibited greater variability across all fields compared to 2021. This heightened variability could be attributed to the more pronounced differences in soil moisture content across the fields, as well as the increased sensitivity of ECOSTRESS measurements under drier conditions. In contrast, the ET values calculated using ground-based meteorological data in 2022 displayed less variability, which may suggest that the empirical method based on nearest ground station data applied was less responsive to the variations in microclimatic conditions between the fields.
4. Discussion
The European Union’s Common Agricultural Policy recognizes the value of ecosystem services provided by permanent pasture (EU, 2013). The current policy provides for a so-called “green direct payment”. It is well-known how difficult it is to assess evapotranspiration for large areas covered by vegetation, where conditions vary. The only reasonable method is to use remote sensing data. The point measurements are limited to the areas of measurement. The assessment of hydrological effects on vegetation growth must be linked to meteorological data. It is important to fill the gaps between satellite images. The resolution of the LST is very important, as demonstrated in this study. The current study investigated the possibility of assessing evapotranspiration using three data sets. Two of them had meteorological data from different sources and the same source–MODIS for obtaining LST. These data were compared with the ECOSTRESS data.
A better LST resolution will soon be available from the ESA mission as LSTM (land surface temperature monitoring), developed by Airbus Defense and Space, to join the Copernicus Sentinel system in 2028. The satellite will have thermal infrared (TIR) observation capabilities over land and coastal regions to support agricultural management services and possibly a range of additional services. The LSTM mission will consist of two satellites, LSTM-A and LSTM-B, and importantly, the resolution will be 50 m, with an accuracy of 0.3 °C. The imager can provide daily measurements from five bands in the TIR spectral range 8–12.5 μm, complemented by bands in the visible and NIR. The LSTM mission will have a four-day revisit period. The mission will map the Earth’s surface temperature and evapotranspiration rates every 1–3 days [40].
This study will provide the basis for future research. Evapotranspiration must be validated and linked to meteorological data. All other methods investigated the possibility of assessing evapotranspiration using three sets of data. It was found that the evapotranspiration rate calculated using the energy budget methodology with the use of the ERA5-Land grid meteorological data closely align with the results of evapotranspiration from ECOSTRESS.
The analysis conducted in this study aimed to evaluate different methodologies for estimating evapotranspiration (ET) in grassland regions, focusing on the comparison of data from diverse sources, including ECOSTRESS satellite observations, ERA5-Land reanalysis, and ground station meteorological measurements. Through this comparative assessment, we aimed to enhance the understanding of the strengths and limitations of each data source in estimating surface temperature and subsequently evapotranspiration. The subsequent analysis of evapotranspiration estimates from different data sources revealed variations in ET values depending on the methodology and environmental conditions. While ECOSTRESS, the ERA5-Land-based methods, and the ground station meteorological measurements provided consistent estimates in some instances, discrepancies were observed, particularly during periods of high soil moisture. However, the correlation analysis demonstrated moderate correlations between ECOSTRESS and ERA5-Land-based ET estimates, as well as with soil moisture and grass height, underscoring the reliability of these datasets. This strong association can be attributed to the comprehensive consideration of three crucial components within the ECOSTRESS model: plant transpiration, soil surface evaporation, and interception evaporation from precipitation on plant surfaces.
Within grassland environments, plant transpiration serves as a pivotal mechanism through which water is absorbed from the soil by plant roots and subsequently released into the atmosphere via leaves.
Soil surface evaporation entails the direct evaporation of water from the soil surface into the atmosphere. This process is influenced by various factors, such as soil moisture content, temperature, humidity, and wind speed. Given the diverse vegetation cover typically found in grasslands, soil surface evaporation plays a crucial role in regulating soil moisture levels. Ground measurements of soil moisture and vegetation height were assumed to be the “indicators” of the accuracy of evapotranspiration estimates from different sources.
Additionally, interception evaporation occurs when precipitation falls on plant surfaces and is then evaporated back into the atmosphere. This phenomenon is influenced by factors such as leaf structure, surface roughness, and precipitation intensity. In grassland ecosystems, characterized by varying vegetation density, interception evaporation can significantly impact the overall water balance.
By integrating these three components into its calculations, ECOSTRESS accounts for the complex interactions between vegetation, soil, and the atmosphere within grassland ecosystems. This holistic approach allows ECOSTRESS to provide more accurate estimates of soil moisture, reflecting the dynamics of water cycling in these environments. Consequently, ECOSTRESS data offer valuable insights into ecosystem health, water resource management, and climate change impacts, particularly in grassland regions, where these processes are paramount. That is why ESA’s future LSTM mission, which will measure temperature with good spatial resolution, will provide promising information about the energy and water balance, which is very important in the context of climate change.
One of the primary advantages is the comparison of ET data from ECOSTRES to the ET obtained applying the energy balance approach with different sets of meteorological data, i.e., from the ground meteorological station and from Copernicus ERA5. It is important to know as the ET from ECOSTRES is a NASA product that is not often available for Europe and could be filled out with the ET data from other models. The models used in this study simplify complex remote sensing techniques for ET estimation. By focusing on reducing the technical barriers associated with image processing, the models offer a more accessible approach for non-expert water engineers. This simplification is achieved without significantly compromising the accuracy of the ET estimates, making the models practical for widespread use in various water management applications. The use of open-source tools makes it feasible to implement the models on standard computing platforms, which is particularly beneficial in regions with limited access to advanced technology. The models presented in this study are designed to be adaptable to different climatic and agricultural conditions.
Although the models have been tested and validated in the Central European region, their performance in different climatic zones and agricultural conditions may vary. The scope of the validation process in this study might not cover all possible environmental variations, leading to potential limitations in the generalizability of the results across diverse regions and crop types. ECOSTRESS data have been extensively evaluated for their ability to generate land surface temperature (LST) and evapotranspiration (ET) products at the field scale globally. A recent study compared three ECOSTRESS ET products—STIC, SEBS, and TSEB—across 19 eddy covariance sites in Europe between 2018 and 2019, covering six land surface types. The STIC model provided more accurate ET estimates, SEBS showed higher uncertainties in sparsely vegetated areas, and TSEB performed better in water-scarce ecosystems, but with higher uncertainties in radiation-controlled environments. These results highlight the potential of ECOSTRESS ET products for future thermal missions, such as TRISHNA, SBG, and LSTM [41]. Moreover, ET from ECOSTRES has been validated against LE from eddy covariance measurements in the US by Fisher et al. (2020) [23], in which the evaluation of instantaneous ET from PT-JPL was made at 82 eddy covariance sites globally and showed a good correlation (R2 = 0.88). Therefore, the validity of using ET estimation from ECOSTRESS data was confirmed.
In addition to these evaluations, the introduction of a global 30 m ET model (HSEB) that utilizes harmonized Landsat and Sentinel-2, MODIS, and VIIRS data offers another avenue for improving ET estimates. The HSEB model, as demonstrated by Jaafar et al. (2023) [42], provides ET calculations at the field scale, showing significant improvements in temporal and spatial components of ET mapping across various biomes and climatic conditions. When compared to ECOSTRESS data, HSEB performed well, particularly over croplands, although ECOSTRESS had a slightly lower bias in instantaneous latent heat fluxes.
Therefore, the ET derived from sources 2 and 3 was compared with ET from ECOSTRESS, which was considered to be the most accurate. The simplified ET estimation models have direct implications for irrigation management. By providing accessible and reasonably accurate ET estimates, these models empower water engineers and farmers to make more informed decisions about irrigation scheduling. This can lead to more efficient water use, reducing water wastage and ensuring that crops receive the right amount of water, based on their actual evapotranspiration needs.
5. Conclusions
The integrated approach presented in this study facilitates detailed analyses of evapotranspiration dynamics, particularly in regions where ground-based data may be limited or unavailable. The utilization of ERA5-Land data represents a significant advancement in enhancing spatial coverage, and facilitating comprehensive studies across diverse landscapes. Additionally, the synergistic use of ERA5-Land datasets not only improves the reliability and accuracy of the energy balance method but also allows for a more nuanced understanding of energy flux dynamics and water vapor exchange processes at the land surface.
In research conducted in the central-western region of Poland, specifically in Wielkopolska (NUTS2–PL41), 18 grassland fields varying in size from 0.36 to 21.34 hectares were examined, providing valuable insights into the intricate relationships between environmental parameters and evapotranspiration processes. Temperature variations throughout the year directly impact the rate of evaporation from the soil and transpiration from vegetation, significantly influencing the overall water balance and evapotranspiration rates observed within the study area.
The integration of advanced technologies such as satellite-based remote sensing, exemplified by instruments such as ECOSTRESS, has revolutionized our ability to monitor and understand evapotranspiration dynamics. By leveraging high-resolution thermal imagery and sophisticated algorithms, ECOSTRESS provides invaluable insights into surface temperature variations and water exchange processes across diverse ecosystems.
Furthermore, incorporating ground-based meteorological data enriches our contextual understanding of thermal observations. This synergy between spaceborne observations and ground-based measurements enriches our understanding and augments our capacity to address the challenges posed by climate change.
Comparisons between ECOSTRESS data and other sources suggested that the ECOSTRESS measurements may offer the most precise estimates of evapotranspiration. However, further research and refinement of estimation methods are necessary to enhance the accuracy and reliability of evapotranspiration assessments. These findings contribute to a deeper understanding of water balance dynamics in grassland ecosystems, with implications for water resource management in rural areas.
Moreover, acknowledging the variability within grassland ecosystems is crucial. While the analysis assumed homogeneous grassland cover within the 1 km2 grid, the actual composition of these grasslands may vary significantly. Factors such as species composition, vegetation density, and land management practices can influence evapotranspiration rates and other environmental processes. Incorporating this variability into the analysis frameworks is essential for refining estimation models and improving the accuracy of evapotranspiration assessments. Future research should aim to integrate this variability to better capture the complexity of grassland ecosystems and their hydrological dynamics. It has to be stated that remotely assessed evapotranspiration data, when combined with meteorological data, are related to soil moisture. The spatial resolution of evapotranspiration is very important, as evapotranspiration and soil moisture vary with different vegetation and growth conditions.
In conclusion, this study contributes to the understanding of evapotranspiration estimation in grassland regions by comparing data from ECOSTRESS, ERA5-Land, and ground station meteorological measurements. While each data source has its strengths and limitations, the analysis demonstrated the overall reliability of ECOSTRESS and ERA5-Land-based ET estimates, particularly in capturing soil moisture dynamics and vegetation interactions. The ECOSTRESS evapotranspiration data can be directly applied to other models for assessing water depletion for small areas and obtaining daily values of evapotranspiration, without the need to apply meteorological data. The ECOSTRESS Level-3 ET product has been validated with measurements from 82 eddy covariance sites, showing a close linear relationship across different biomes and land use types (r2 = 0.89 [23]).
ET calculated using ERA5 meteorological data and satellite-derived surface temperature provided a better correlation with ECOSTRESS than using ground station meteorological data and MODIS surface temperature. The ERA5 meteorological data are in a 9 × 9 km grid. The meteorological data from the ground station had an exact value around the station, but could very often vary with distance, which affects the precision of the calculated ET. The findings underscore the importance of utilizing multiple data sources and methodologies for robust evapotranspiration assessment, essential for effective water resource management and climate change adaptation in grassland ecosystems.
It is the first time that the ECOSTRESS data have been presented in the research for the Polish region. Having data on grassland parameters such as height or soil moisture was valuable for examining the relationships between evapotranspiration derived by different sources and these parameters. In the future, the Copernicus 2 Programme will launch the new Sentinel satellite with LST resolution similar to that of ECOSTRESS, and evapotranspiration will be one of its products.
Author Contributions
Conceptualization, E.P.-C. and K.D.-Z.; data curation, E.P.-C., M.J. and K.W.; formal analysis, E.P.-C. and M.J.; funding acquisition, K.D.-Z.; investigation, E.P.-C. and K.D.-Z.; methodology, E.P.-C. and K.D.-Z.; project administration, K.D.-Z.; resources, E.P.-C., M.J. and K.W.; software, E.P.-C. and M.J.; supervision, E.P.-C. and K.D.-Z.; validation, E.P.-C. and K.D.-Z.; visualization, E.P.-C., M.J. and K.W.; writing—original draft, E.P.-C., K.D.-Z. and M.J.; writing—review and editing, E.P.-C. and K.D.-Z. All authors have read and agreed to the published version of the manuscript.
Funding
This research was funded by The National Centre for Research and Development within the program “POLNOR 2019 call” under the project number NOR/POLNOR/GrasSAT/0031/2019: “Tools for information to farmers on grasslands yields under stressed conditions to support management practices” (2020–2023).
Institutional Review Board Statement
Not applicable.
Data Availability Statement
The data presented in this study are available on request from the corresponding author.
Acknowledgments
We extend our sincere gratitude to Piotr Goliński and his dedicated team at Poznań University of Life Sciences, Department of Grassland and Natural Landscape Sciences, for their invaluable collaboration and guidance throughout the research process.
Conflicts of Interest
The authors declare no conflicts of interest. The funders had no role in the design of the study; in the collection, analyses, or interpretation of data; in the writing of the manuscript; or in the decision to publish the results.
References
- Dabrowska-Zielinska, K. Inferring Evapotranspiration from Remotely Sensed Thermal Radiation Data; The Australian National University (Australia) ProQuest Dissertations Publishing: Canberra, Australia, 1987. [Google Scholar]
- Goliński, P.; Czerwiński, M.; Jørgensen, M.; Mølmann, J.A.B.; Golińska, B.; Taff, G. Relationship between Climate Trends and Grassland Yield across Contrasting European Locations. Open Life Sci. 2018, 13, 589–598. [Google Scholar] [CrossRef] [PubMed]
- Dabrowska-Zielinska, K.; Goliński, P.; Jørgensen, M.; Mølmann, J.; Taff, G.; Twardy, S.; Budzynska, M.; Czerwiński, M.; Kopacz, M.; Kurnicki, R.; et al. Importance of Grassland Monitoring in European Perspective of Climate Change—FINEGRASS Project; Instytut Geodezji i Kartografii: Warszawa, Poland, 2016; Volume 8, pp. 55–71. [Google Scholar] [CrossRef]
- Hopkins, A.; Del Prado, A. Implications of Climate Change for Grassland in Europe: Impacts, Adaptations and Mitigation Options: A Review. Grass Forage Sci. 2007, 62, 118–126. [Google Scholar] [CrossRef]
- Dabrowska-Zielinska, K.; Malinska, A.; Bochenek, Z.; Bartold, M.; Gurdak, R.; Paradowski, K.; Lagiewska, M. Drought Model DISS Based on the Fusion of Satellite and Meteorological Data under Variable Climatic Conditions. Remote Sens. 2020, 12, 2944. [Google Scholar] [CrossRef]
- Javadian, M.; Behrangi, A.; Smith, W.K.; Fisher, J.B. Global Trends in Evapotranspiration Dominated by Increases across Large Cropland Regions. Remote Sens. 2020, 12, 1221. [Google Scholar] [CrossRef]
- Qiao, C.; Sun, R.; Xu, Z.; Zhang, L.; Liu, L.; Hao, L.; Jiang, G. A Study of Shelterbelt Transpiration and Cropland Evapotranspiration in an Irrigated Area in the Middle Reaches of the Heihe River in Northwestern China. IEEE Geosci. Remote Sens. Lett. 2015, 12, 369–373. [Google Scholar] [CrossRef]
- Dabrowska-Zielinska, K.; Kogan, F.; Ciolkosz, A.; Gruszczynska, M.; Kowalik, W. Modelling of Crop Growth Conditions and Crop Yield in Poland Using AVHRR-Based Indices. Int. J. Remote Sens. 2002, 23, 1109–1123. [Google Scholar] [CrossRef]
- Beven, K. A Sensitivity Analysis of the Penman-Monteith Actual Evapotranspiration Estimates. J. Hydrol. 1979, 44, 169–190. [Google Scholar] [CrossRef]
- Verstraeten, W.; Veroustraete, F.; Feyen, J. Assessment of Evapotranspiration and Soil Moisture Content Across Different Scales of Observation. Sensors 2008, 8, 70–117. [Google Scholar] [CrossRef]
- Allen, R.G.; Tasumi, M.; Morse, A.; Trezza, R. A Landsat-Based Energy Balance and Evapotranspiration Model in Western US Water Rights Regulation and Planning. Irrig Drain. Syst. 2005, 19, 251–268. [Google Scholar] [CrossRef]
- Zhang, F.; Zhou, G. Deriving a Light Use Efficiency Estimation Algorithm Using in Situ Hyperspectral and Eddy Covariance Measurements for a Maize Canopy in Northeast China. Ecol. Evol. 2017, 7, 4735–4744. [Google Scholar] [CrossRef]
- Dabrowska-Zielinska, K.; Budzynska, M.; Tomaszewska, M.; Malinska, A.; Gatkowska, M.; Bartold, M.; Malek, I. Assessment of Carbon Flux and Soil Moisture in Wetlands Applying Sentinel-1 Data. Remote Sens. 2016, 8, 756. [Google Scholar] [CrossRef]
- Kibler, C.L.; Trugman, A.T.; Roberts, D.A.; Still, C.J.; Scott, R.L.; Caylor, K.K.; Stella, J.C.; Singer, M.B. Evapotranspiration Regulates Leaf Temperature and Respiration in Dryland Vegetation. Agric. For. Meteorol. 2023, 339, 109560. [Google Scholar] [CrossRef]
- Muñoz-Sabater, J.; Dutra, E.; Agustí-Panareda, A.; Albergel, C.; Arduini, G.; Balsamo, G.; Boussetta, S.; Choulga, M.; Harrigan, S.; Hersbach, H.; et al. ERA5-Land: A State-of-the-Art Global Reanalysis Dataset for Land Applications. Earth Syst. Sci. Data 2021, 13, 4349–4383. [Google Scholar] [CrossRef]
- Ghiat, I.; Mackey, H.R.; Al-Ansari, T. A Review of Evapotranspiration Measurement Models, Techniques and Methods for Open and Closed Agricultural Field Applications. Water 2021, 13, 2523. [Google Scholar] [CrossRef]
- Hulley, G.; Shivers, S.; Wetherley, E.; Cudd, R. New ECOSTRESS and MODIS Land Surface Temperature Data Reveal Fine-Scale Heat Vulnerability in Cities: A Case Study for Los Angeles County, California. Remote Sens. 2019, 11, 2136. [Google Scholar] [CrossRef]
- Marshall, M.; Tu, K.; Andreo, V. On Parameterizing Soil Evaporation in a Direct Remote Sensing Model of ET: PT-JPL. Water Resour. Res. 2020, 56, e2019WR026290. [Google Scholar] [CrossRef]
- Cawse-Nicholson, K.; Braverman, A.; Kang, E.L.; Li, M.; Johnson, M.; Halverson, G.; Anderson, M.; Hain, C.; Gunson, M.; Hook, S. Sensitivity and Uncertainty Quantification for the ECOSTRESS Evapotranspiration Algorithm–DisALEXI. Int. J. Appl. Earth Obs. Geoinf. 2020, 89, 102088. [Google Scholar] [CrossRef]
- Anderson, M.C.; Yang, Y.; Xue, J.; Knipper, K.R.; Yang, Y.; Gao, F.; Hain, C.R.; Kustas, W.P.; Cawse-Nicholson, K.; Hulley, G.; et al. Interoperability of ECOSTRESS and Landsat for Mapping Evapotranspiration Time Series at Sub-Field Scales. Remote Sens. Environ. 2021, 252, 112189. [Google Scholar] [CrossRef]
- Quan, J.; Guan, Y.; Zhan, W.; Ma, T.; Wang, D.; Guo, Z. Generating 60–100 m, Hourly, All-Weather Land Surface Temperatures Based on the Landsat, ECOSTRESS, and Reanalysis Temperature Combination (LERC). ISPRS J. Photogramm. Remote Sens. 2023, 205, 115–134. [Google Scholar] [CrossRef]
- JECAM–Joint Experiment for Crop Assessment and Monitoring. Available online: https://jecam.org/ (accessed on 17 April 2024).
- Fisher, J.B.; Lee, B.; Purdy, A.J.; Halverson, G.H.; Dohlen, M.B.; Cawse-Nicholson, K.; Wang, A.; Anderson, R.G.; Aragon, B.; Arain, M.A.; et al. ECOSTRESS: NASA’s Next Generation Mission to Measure Evapotranspiration from the International Space Station. Water Resour. Res. 2020, 56, e2019WR026058. [Google Scholar] [CrossRef]
- Wilder, B.A.; Kinoshita, A.M. Incorporating ECOSTRESS Evapotranspiration in a Paired Catchment Water Balance Analysis after the 2018 Holy Fire in California. Catena 2022, 215, 106300. [Google Scholar] [CrossRef]
- Hulley, G.C.; Göttsche, F.M.; Rivera, G.; Hook, S.J.; Freepartner, R.J.; Martin, M.A.; Cawse-Nicholson, K.; Johnson, W.R. Validation and Quality Assessment of the ECOSTRESS Level-2 Land Surface Temperature and Emissivity Product. IEEE Trans. Geosci. Remote Sens. 2022, 60, 1–23. [Google Scholar] [CrossRef]
- Buckley, T.N. The Control of Stomata by Water Balance. New Phytol. 2005, 168, 275–292. [Google Scholar] [CrossRef] [PubMed]
- Kubiak-Wójcicka, K.; Machula, S. Influence of Climate Changes on the State of Water Resources in Poland and Their Usage. Geosciences 2020, 10, 312. [Google Scholar] [CrossRef]
- Monteith, J.L.; Unsworth, M.H. Principles of Environmental Physics: Plants, Animals, and the Atmosphere, 4th ed.; Elsevier: Amsterdam, The Netherlands; Academic Press: Amsterdam, The Netherlands; Boston, MA, USA, 2013; ISBN 978-0-12-386910-4. [Google Scholar]
- Dąbrowska-Zielińska, K.; Ciołkosz, A.; Budzyńska, M.; Kowalik, W. Monitorowanie Wzrostu i Plonowania Zbóż Metodami Teledetekcji. Probl. Inżynierii Rol. 2008, 16, 45–54. [Google Scholar]
- Jackson, R.D.; Moran, M.S.; Gay, L.W.; Raymond, L.H. Evaluating Evaporation from Field Crops Using Airborne Radiometry and Ground-Based Meteorological Data. Irrig. Sci. 1987, 8, 81–90. [Google Scholar] [CrossRef]
- Dąbrowska-Zielińska, K. Assessment of evapotranspiration, soil moisture and green biomass of grassland using NOAA satellite images. Pr. Geogr. Pol. Akad. Nauk. 1995, 165, 81. [Google Scholar]
- Wan, Z.; Hook, S.; Hulley, G. MOD11A1—MODIS/Terra Land Surface Temperature/Emissivity Daily L3 Global 1 km SIN Grid V006 2015. Available online: https://lpdaac.usgs.gov/products/myd11b1v006/ (accessed on 1 September 2024).
- Wu, Z.; Teng, H.; Chen, H.; Han, L.; Chen, L. Reconstruction of Gap-Free Land Surface Temperature at a 100 m Spatial Resolution from Multidimensional Data: A Case in Wuhan, China. Sensors 2023, 23, 913. [Google Scholar] [CrossRef]
- De Caro, D.; Matteo, I.; Provenzano, G. Assessing Daily ERA5-Land Reanalysis Data to Estimate Actual Evapotranspiration of Olive Orchards in Sicily. In Proceedings of the AIIA 2022: Biosystems Engineering towards the Green Deal, Palermo, Italy, 19–22 September 2022; Ferro, V., Giordano, G., Orlando, S., Vallone, M., Cascone, G., Porto, S.M.C., Eds.; Lecture Notes in Civil Engineering. Springer: Cham, Switzerland, 2023; Volume 337. [Google Scholar] [CrossRef]
- Xu, C.; Wang, W.; Hu, Y.; Liu, Y. Evaluation of ERA5, ERA5-Land, GLDAS-2.1, and GLEAM Potential Evapotranspiration Data over Mainland China. J. Hydrol. Reg. Stud. 2024, 51, 101651. [Google Scholar] [CrossRef]
- Wen, J.; Fisher, J.B.; Parazoo, N.C.; Hu, L.; Litvak, M.E.; Sun, Y. Resolve the Clear-Sky Continuous Diurnal Cycle of High-Resolution ECOSTRESS Evapotranspiration and Land Surface Temperature. Water Resour. Res. 2022, 58, e2022WR032227. [Google Scholar] [CrossRef]
- Fisher, J.B.; Tu, K.P.; Baldocchi, D.D. Global Estimates of the Land–Atmosphere Water Flux Based on Monthly AVHRR and ISLSCP-II Data, Validated at 16 FLUXNET Sites. Remote Sens. Environ. 2008, 112, 901–919. [Google Scholar] [CrossRef]
- R: The R Project for Statistical Computing. Available online: https://www.r-project.org/ (accessed on 17 April 2024).
- AρρEEARS. Available online: https://appeears.earthdatacloud.nasa.gov/ (accessed on 17 April 2024).
- The Copernicus LSTM Expansion Mission Moves a Step Closer to Helping Climate Change Adaptation|Airbus. Available online: https://www.airbus.com/en/newsroom/stories/2022-11-the-copernicus-lstm-expansion-mission-moves-a-step-closer-to-helping (accessed on 30 April 2024).
- Hu, T.; Mallick, K.; Hitzelberger, P.; Didry, Y.; Boulet, G.; Szantoi, Z.; Koetz, B.; Alonso, I.; Pascolini-Campbell, M.; Halverson, G.; et al. Evaluating European ECOSTRESS Hub Evapotranspiration Products across a Range of Soil-Atmospheric Aridity and Biomes Over Europe. Water Resour. Res. 2023, 59, e2022WR034132. [Google Scholar] [CrossRef]
- Jaafar, H.; Mourad, R.; Schull, M. A Global 30-m ET Model (HSEB) Using Harmonized Landsat and Sentinel-2, MODIS and VIIRS: Comparison to ECOSTRESS ET and LST. Remote Sens. Environ. 2022, 274, 112995. [Google Scholar] [CrossRef]


Disclaimer/Publisher’s Note: The statements, opinions and data contained in all publications are solely those of the individual author(s) and contributor(s) and not of MDPI and/or the editor(s). MDPI and/or the editor(s) disclaim responsibility for any injury to people or property resulting from any ideas, methods, instructions or products referred to in the content. |
© 2024 by the authors. Licensee MDPI, Basel, Switzerland. This article is an open access article distributed under the terms and conditions of the Creative Commons Attribution (CC BY) license (https://creativecommons.org/licenses/by/4.0/).