Article

Spatiotemporal Dynamics and Spatial Spillover Effects of Resilience in China’s Agricultural Economy

1
College of Agriculture, Guangxi University, Nanning 530004, China
2
College of Smart Human Settlements Industry, Guangxi Arts University, Nanning 530007, China
*
Authors to whom correspondence should be addressed.
These authors contributed equally to this work.
Agriculture 2024, 14(9), 1522; https://doi.org/10.3390/agriculture14091522
Submission received: 22 July 2024 / Revised: 29 August 2024 / Accepted: 3 September 2024 / Published: 4 September 2024
(This article belongs to the Section Agricultural Economics, Policies and Rural Management)

Abstract

:
It is very important to enhance the risk resistance of the agricultural sector to realize the modernization transformation of the agricultural industry and strengthen the competitiveness of national agriculture. Based on the relevant spatial data of 30 provincial administrative regions in China from 2013 to 2022, this study constructs a multi-dimensional index framework to comprehensively evaluate the resilience of China’s agricultural economy by comprehensively considering the three key aspects of adaptability, management strategy, and innovation drive. This study adopts several quantitative analysis tools including the Theil index, global and local analysis of the Moran I index, and kernel density estimation (KDE), and further combines with the spatial Durbin model (SDM) to conduct an in-depth spatiotemporal analysis of the resilience of China’s agricultural economy. This study not only reveals the evolution trend of agricultural economic resilience in different times and spaces but also analyzes the differences in resilience among regions and its spread in space. Through these refined analytical tools, we aim to reveal how agricultural economic resilience changes over time, the differences in resilience levels among regions, and the geospatial interactions and diffusion. This study reveals a series of key findings: (1) The resilience of China’s agricultural economy shows a trend of steady improvement. (2) Differences within the three regions are the main factors generating differences in the development of resilience in China’s agricultural economy. (3) The resilience of the agricultural economy in different regions shows obvious spatial correlations. (4) Further analysis shows that the efficiency of agricultural production and the urbanization process have a positive direct impact on the resilience of the agricultural economy, and this impact has a significant positive spatial diffusion effect. Meanwhile, although the level of agricultural mechanization is not significant in its direct impact, it has a positive spatial impact on the enhancement of agricultural economic resilience in other regions. In addition, the restructuring of agricultural cropping has both direct negative impacts and positive spatial spillover effects on the resilience of the agricultural economy. Based on these findings, this paper suggests that agricultural policies should consider regional development differences, implement differentiated agricultural support policies, fully account for the spatial spillover effects of agricultural ecological efficiency, and strengthen the exchange and cooperation of resources between regions. This study deepens the understanding of the spatial and temporal characteristics of the resilience of China’s agricultural economy, reveals its inherent dynamic processes and spatial interactions, and provides valuable references for policymakers and practitioners to better cope with the various challenges encountered in agricultural production, and to jointly promote the sound development of China’s agricultural economy.

1. Introduction

In the economic structure of many developing countries, agriculture plays a central role and provides important economic support for these countries [1]. China has a profound cultural tradition of agriculture, and its agricultural sector holds the key to the stability and development of the country’s economy. Since ancient times, agriculture has not only provided the basic material foundation for China’s survival and development but has also nurtured a profound farming culture and formed a unique agricultural economic system, the stability and development of whose agricultural economy has an important impact on domestic and even global food security and economic stability. Among the numerous industries contributing to quality development, agriculture stands out as one of the most remarkable driving forces [2,3]. Against the backdrop of heightened uncertainty in the current global economy, frequent natural disasters, geopolitical conflicts, and trade tensions around the world, among other volatile factors, in such a situation, many countries are confronted with varying degrees of recessionary risk. According to the World Economic Patterns and Prospects report released by the United Nations in 2021, the size of the economy of developed economies contracted by 5.6 percent in 2020, while developing economies contracted by 2.5 percent. Overall, the economy suffered a major recessionary shock, resulting in a 4.3% contraction in the size of the global economy. China’s agricultural economy finds itself in an era of unprecedented trials and opportunities. Strengthening resilience is particularly important and urgent in order to effectively respond to these complex challenges and ensure its sustainable and healthy development [4]. Agricultural production, as a complex production activity, often requires a series of uncertainties to be resolved in carrying out production activities [5]. Given the current challenging and uncertain international backdrop, formulating and implementing effective strategies to enhance the adaptability and resilience of the agricultural industry has become a crucial and urgent issue for China and the world. Strengthening adaptability is key to promoting progress and achieving long-term stability and sustainable development in agriculture.
The purpose is to test the resilience of China’s agricultural economy, its diverse performance over time and geography, and the evolution of law and regional interactions behind it. The aim is to provide policymakers and practitioners with empirical insights and guidelines for promoting steady agricultural development and enhancing adaptability to complex external environments. Additionally, this research enhances understanding of the agricultural economy’s adaptability and sustainable development. Through scientific analysis and rational strategies, this study aims to effectively cushion the uncertainty shocks faced by agricultural production and promote China’s agricultural economy towards a more prosperous and sustainable future. This study establishes an evaluation index system for resilience and analyzes panel data from 30 Chinese provinces over the period of 2013–2022. The regional differences, dynamic evolution, and spatial spillover effects of agricultural economic resilience are analyzed using the Thiel index, Moran index, and spatial Durbin model methods.
Section 1 of this paper describes the motivation for studying the resilience of the agricultural economy and provides the latest academic trends and research trends in this field. Section 2 regarding research methods explains the process of data collection and the research methods applied in detail, which lays a solid foundation for further in-depth analysis. Then, Section 3 of the thesis deeply analyzes the evolution characteristics of China’s agricultural economic resilience in time and space and tries to show its inherent complexity and dynamics in detail. Section 4 will summarize the research findings, put forward targeted policy recommendations, and provide an outlook for future research directions.

1.1. Literature Review

Academic research on agricultural economic resilience focuses on three main areas: First, the definition and theoretical framework of agricultural economic resilience. The term “resilience” originally stems from the physical sciences. Today, the concept of resilience has expanded significantly and is widely used in economics, psychology, agricultural science, environmental science, physics, political science, and other fields [6]. In the academic field, the core connotation of the concept of economic resilience is widely recognized as adaptive resilience, which emphasizes a dynamic ability to adjust and cope with external shocks. Specifically, the concept encompasses four key dimensions: resistance, the ability to withstand shocks; resilience, the efficiency with which one recovers from shocks; reorganization, the ability to reconfigure resources after shocks to adapt to new environments; and renewal, the ability to achieve long-term development through innovation and learning [7]. When we apply this concept to the agricultural economy, it essentially measures its robustness in the face of external challenges such as natural disasters and market volatility, as well as its ability to recover quickly and develop sustainably [8]. Current research focuses on the resilience of agroecology [9], agricultural production resilience [10,11], the adaptability of the agricultural sector to growth [12], and the resilience of household economies [13]. Considering the central role of agriculture in the country’s economic structure, it is a crucial strategy to strengthen its resilience against uncertainties. This enhancement improves agricultural production efficiency and product quality, ensuring national food security and supporting sustainable economic development, agricultural modernization, and a robust rural economy [14]. Scholars have innovatively explored agricultural resilience from the perspective of farmers [15]. They distinguish between stability, robustness, vulnerability, and resilience [16]. Resilience is increasingly replacing sustainability as a key concept in rural development [17]. Some studies suggest that resilience thinking offers new perspectives and greater research potential for rural agriculture [18,19].
Second, research focuses on the multi-scale measurement of agricultural economic resilience, primarily using entropy methods, kernel density estimation, and the Dagum Gini coefficient. Recent research reveals that the spatial distribution of agricultural economic resilience exhibits rich and delicate dynamic changes, which are not only affected by local natural conditions, policy environment, and market mechanisms but also generate significant geographical spillover effects through trade, investment, and technology diffusion mechanisms [20,21,22,23,24,25]. This spillover effect not only promotes the resilience of the agricultural economy in neighboring regions but may also spread to a wider region, affecting the stability and sustainability of the global agricultural industry chain [26]. This suggests that agricultural economic resilience is not only a local issue but also a complex system with global implications.
Third is the in-depth analysis of resilience and influencing factors. The formation of this is not independent, but a dynamic construction process of interaction and interdependence of many factors, including a series of complex interweaving of external environment and internal conditions. These factors include agricultural market risks [27], policy adjustments [28], rural development conditions [29], the digital economy [30], industrial integration [31], rural sustainability [32], government policies [33], an aging population [34], and green production [35]. Academic research on agricultural economic resilience covers defining evaluation, analyzing influencing factors, and studying spatiotemporal dynamics. These studies deepen our understanding of agricultural economic resilience and provide valuable contributions to the field.

1.2. Summarizing and Researching Gaps

After reviewing and analyzing current research on agricultural economic resilience within the academic field, we identify the following points of research that remain to be refined and expanded: First, previous studies have explored the development of and changes in regional agricultural economic resilience itself, while ignoring the spatial spillover effect based on the regional context level. Second, the agricultural economy is complex, and researchers may lack a comprehensive view of China’s agricultural development when analyzing its resilience factors. The exploration of its research content is still very limited, and the analysis of the economic law behind it and the exploration of its influencing factors are worth further exploration. Third, most previous studies have predominantly relied on cross-sectional data for their analyses and less panel data. While cross-sectional data can provide a static snapshot at a point in time, they have obvious limitations in capturing long-term evolutionary trends, analyzing time-series characteristics, and identifying cross-regional variability.
The anticipated contributions are primarily manifested in the following: First, this study will utilize the basic data related to 30 provinces in China between 2013 and 2022, focusing on the cutting-edge topic of agricultural economic resilience, and attempting to fill the gaps in data timeliness and geographic coverage of the current study. By systematically analyzing the current status and evolution of China’s agricultural economic resilience over this period, this study aims to provide the academic community with a set of up-to-date and comprehensive empirical evidence. Second, this study employs the entropy method to establish an evaluation framework for quantitatively assessing the current status and development trajectory of agricultural economic adaptability across various regions in China. Leveraging the empirical findings, specific policy recommendations will be proposed, with the aim of providing strategic guidance. Third, this research leverages the Moran I index and the spatial Durbin model to scrutinize the temporal fluctuations and spatial influences on the adaptability of China’s agricultural economy. It delves into the spatial transmission mechanisms and the extent of influence, with the ultimate goal of promoting balanced development in the agricultural economy.

2. Research Materials and Methods

2.1. Study Object and Data Sources

The time span of the data selected for this study is 10 years, from 2013 to 2022. It should be noted that because Hong Kong, Macao, Taiwan, and the Tibet Autonomous Region are significantly different from the mainland in terms of politics, economy, culture, and geography, which may affect the accuracy and comparability of the results of the study, the selection of samples for this study excludes these regions. The data selection and processing methods of this study are designed to increase credibility and practicality. To ensure the consistency and comparability of the analysis of regional differences, this study follows the regional division criteria of the National Bureau of Statistics of China. This classification system divides the country into East, Central, and West based on a number of geographic, economic, and social dimensions. According to this system, the eastern region includes Beijing, Tianjin, Hebei, Liaoning, Shanghai, Jiangsu, Zhejiang, Fujian, Shandong, Guangdong, and Hainan; the central region comprises Shanxi, Inner Mongolia, Jilin, Heilongjiang, Anhui, Jiangxi, Henan, Hubei, and Hunan; and the western region includes Guangxi, Chongqing, Sichuan, Guizhou, Yunnan, Shaanxi, Gansu, Qinghai, Ningxia, and Xinjiang.
The primary data sources for this study are the annual editions of the China Statistical Yearbook, the China Agricultural Yearbook, the China Rural Statistical Yearbook, and the China Science and Technology Statistical Yearbook.

2.2. Indicator System Construction

2.2.1. Evaluation Indicators for the Resilience Level of China’s Agricultural Economy

When constructing the evaluation indicator system, it is important to recognize that resilience not only signifies the ability of a system to return to its initial state after being impacted by risks but also emphasizes the adaptability of complex socio-ecological systems to external influences. This includes their capacity for change, adaptation, and transformation [36,37]. A resilience-centric conceptual model and indicator system have been developed to gauge the resilience of resource-based cities, incorporating concepts like persistence, adaptability, and transformative capacity [38]. Some scholars have assessed resilience indices for 26 regions (provinces) in China from ecological, economic, engineering, and social perspectives [39]. The PSR model, which relies on Pressure, State, and Response factors based on the evaluated object, is extremely valuable for identifying resilience indicators. [40].
This study’s dependent variable is agricultural economic resilience, with its indicator system inspired by the “Pressure-State-Response” (PSR) framework and the pertinent literature. A resilience level indicator system for agricultural economics is constructed across three dimensions: Resistance (P), Adaptation (S), and Innovation (R). A total of 18 secondary indicators have been selected, as detailed in Table 1.
In Table 1, the symbol “+” represents positive indicators, meaning that an increase in these indicator values positively influences agricultural economic resilience. Conversely, “−” denotes negative indicators, signifying that an increase in these values negatively affects resilience. Entropy was used to determine the weights of 18 indicators, and the sum of the weights was 1. Rural electricity consumption carries the highest weight at 0.2384 and exerts the most substantial influence on assessing resilience.

2.2.2. Spatial Durbin Model Explanatory Variables

In selecting explanatory variables, considering the actual situation of agricultural development in China and data availability, six major influencing factors are examined: agricultural production efficiency, urbanization rate, degree of agricultural mechanization, agricultural planting structure, severity of natural conditions, and export value of agricultural products. It is crucial to emphasize that the raw data in this study underwent preprocessing to bolster analysis robustness and enhance result interpretability. By trimming the top and bottom 1% of some data and performing natural logarithm transformations on other data, we ensured that all processing steps were based on clear statistical principles. These preprocessing steps improved data quality and provided a cornerstone for subsequent analysis.
The agricultural system’s output efficiency directly influences the assessment of the agricultural economy’s health and its capacity for sustainable development. An efficient agricultural system can better withstand risks and shocks, such as climate change and market fluctuations [41]. Therefore, this study selects agricultural production efficiency as one of the explanatory variables, represented by the total production value per hectare of sown area.
Urbanization degree, a pivotal variable in this study, encapsulates a range of factors including labor migration, market dynamics, capital and technological innovation, policy influence, economic and social structural shifts, and environmental resource capacity [42]. Collectively, these elements define resilience and its ability to withstand external shocks. The study employs the urban population ratio as an index to gauge the level of urbanization, thereby capturing the urbanization status across different provinces.
The extent of agricultural mechanization exerts a considerable impact on agricultural production, and given that agricultural machinery often operates across various regions, it produces notable spatial spillover effects [43]. In this study, agricultural mechanization is indicated by the total machinery power in each province.
The structure of agricultural cultivation is a central element of the agricultural economic system, which not only directly shapes the diversity, yield levels, and quality standards of agricultural products but also indirectly exerts a significant influence on the overall efficiency and competitiveness of the agricultural economy. It also exhibits a certain spatial spillover effect [44]. Crop diversity is crucial for enhancing the agricultural system’s market adaptability and for bolstering the stability of the agri-economy. In this paper, the diversity of the planting structure was measured by assessing the proportion of grain crops in each province’s planting mix.
Natural environment challenges directly affect agricultural yields, with adverse conditions potentially causing crop losses. This study quantifies the potential impact of natural conditions on agricultural production. The severity of natural conditions is represented by the ratio of the crop disaster area to the affected area.
The export value of agricultural products directly reflects the international competitiveness and status of agriculture, significantly impacting the resilience of agricultural economic growth. International trade not only significantly affects productivity but also has spatial spillover effects [45]. Therefore, a stable and growing export value of agricultural products indicates that the agricultural economy can better withstand external shocks and maintain sustained growth.

2.3. Methods

2.3.1. Entropy Method

In the process of establishing the evaluation index, many methods are adopted [46,47]. The concept of entropy originated from physics, specifically thermodynamics, where it measures the efficiency of energy conversion and the system’s level of disorder [48]. Its first application in decision analysis took place in 1965 [49]. This concept has since been widely used in a variety of disciplines such as information theory, statistical mechanics, chemistry, ecology, etc., developing their own unique entropy theories and applications. Information entropy, originally proposed by the founder of information theory, is a concept used to quantify the uncertainty or amount of information. Faced with the challenge of a multi-index comprehensive evaluation, the entropy weight method reveals the uniqueness and weight of each index in the data set by measuring its entropy value. This method digs deeply into the index value to eliminate the subjective weight distribution bias [50]. After comparing a variety of evaluation tools, the entropy method stands out because of its objectivity and comprehensiveness, so this study decided to use this method to give scientific weight to the index.
As the starting point of research, it is essential to ensure the accuracy of data comparison and the reliability of analysis results. To this end, we will apply a series of standardized techniques to transform the original data set of that resilience:
X i j = Y i j m i n Y i j m a x Y i j m i n Y i j
X i j = m a x Y i j Y i j m a x Y i j m i n Y i j
Among them, X i j and Y i j , respectively, denote the standardized value of China’s agricultural economy resilience level and the original value of the i -th indicator in the j -th year; m a x Y i j and m i n Y i j , respectively, represent the maximum and minimum values of the i -th indicator across all the years of the study.
Secondly, calculate the weight of the i -th indicator in the j -th year:
P i j = X i j i = 0 m X I J
Among them, m represents the number of years participating in the evaluation.
Thirdly, calculate the information entropy of the indicators:
k = 1 l n m
e j = k i = 1 m p i j l n p i j 0 e j 1
Fourth, calculate the weight of the indicators:
f j = 1 e j
w j = f j j = 1 m f j
Finally, calculate the development level of each indicator:
S i = j = 1 n w j × p i j
n represents the number of indicators. The larger the value of S i , the higher the resilience level; conversely, the lower the value of S i , the lower the resilience level.

2.3.2. Theil Index

Most scholars use Dagum’s decomposition of the Gini coefficient [51] or the Theil index [52] to analyze spatial differences. The Theil index is a statistical indicator for measuring the degree of inequality, proposed by Dutch economist Henri Theil. It is widely used in economics, sociology, and other fields to analyze income inequality, regional economic differences, industry concentration, and other issues [53,54,55]. The main advantage of the Theil index is its capability to decompose overall disparities between regions into within-region and between-region differences. This helps to observe and reveal the directions and magnitudes of changes in within-region and between-region differences, as well as their respective importance and impact on the total difference [56]. This study uses the Theil index to analyze and measure overall national differences, within-region differences, between-region differences, and their respective contribution rates.
T = 1 n i = 1 n y i y ¯ × l n y i y ¯
T = T w + T b
T w = p = 1 m n p n × e ¯ p e ¯ × T p
T b = p = 1 m n p n × e ¯ p e ¯ × l n e ¯ p e ¯
In the formulas numbered (9) to (12), n is the total number of provinces, y i is the index of agricultural economic resilience of province i , and y ¯ is the average index of agricultural economic resilience of provinces nationwide. Using the Theil inequality decomposition formula, the total inequality can be classified into within-group differences ( T w ) and between-group differences ( T b ). Here, it refers to the total number of regions divided, n p is the number of provinces in region p, e ¯ p e ¯ represents the relative value of the average level of resilience in region p and the national average level, and T b is the inequality degree calculated by the Theil index in the region p.

2.3.3. Kernel Density Estimation (KDE) Method

In 1956, Rosenblatt pioneered the statistical method of kernel density estimation (KDE). The focus of the KDE method is that it provides a nonparametric way of estimating a probability density function that is unknown in probability theory from a known sample of data [57]. KDE has found application in feature selection [58]. KDE avoids the bias of model specification and is widely applied in the fields of economics, geography, and sociology [59,60,61]. KDE provides smoother and more continuous probability density estimates than traditional histograms. In this study, KDE is utilized to conduct a comprehensive time-series examination of China’s agricultural resilience, analyzing its spatial distribution and evolutionary patterns. Specifically, we adopt the widely recognized Gaussian kernel function as the basis of kernel density estimation to ensure the precision and reliability of the analysis. The Gaussian kernel function, with its smoothness and properties against outliers, can effectively reveal the trends of agricultural resilience development levels in different time and spatial dimensions, as well as the underlying patterns and structures. The specific formula is as follows:
f x = 1 n h i = 1 n K x i x ¯ h
f K x = 1 2 π e x p x 2 2
In Equations (13) and (14), n stands for the number of provinces, K · denotes the kernel density function, h represents the bandwidth, x i signifies the resilience level of agricultural economic development in province i , and x ¯ represents the mean resilience level of agricultural economic development in China.

2.3.4. Spatial Autocorrelation Analysis

The first theorem of geography emphasizes the effect of spatial proximity on the degree of interconnectedness. This principle states that all phenomena and entities on Earth are interconnected to some degree with other things and that this interconnectedness usually increases as geographic distance decreases. In short, there are stronger connections and interactions between things that are geographically close to each other [62]. Moran’s index, introduced in 1950, is key for analyzing spatial autocorrelation, helping to identify if geographic phenomena cluster or disperse significantly from random patterns. Moran’s index has a wide range of applications in the fields of geographic information systems (GISs), epidemiology, economics, ecology, etc. [63]. With this analytical tool, the spatial layout of data can be clearly mapped, enabling researchers to gain insight into potential spatial concentration trends or regional differences, which is essential for deepening research and making decisions [64]. This study applied both global and local Moran’s I indices to evaluate the spatial correlation of the agricultural economy’s resilience capacity. The overall Moran I index shows the spatial connection of regional characteristics at the macro scale. The specific formula is as follows:
I = n i = 1 n j = 1 n w i j y i y ¯ y j y ¯ i = 1 n j = 1 n w i j i = 1 n y i y ¯ 2
The local Moran index reveals the spatial correlation patterns among different regions. The specific formula is as follows:
I i = y i y ¯ 1 n y i y ¯ 2 j i n w i j y j y ¯
In Equations (15) and (16), n represents the total number of provinces, w i j represents the spatial weights (this study uses a geographic distance weight matrix), y i represents the resilience index of province i s agricultural economy, and y ¯ represents the resilience index of agricultural economy averaged across all provinces.
Both global Moran’s I and local Moran’s I are limited to values in the interval from −1 to 1. This range reflects the positive, negative, and strong degree of spatial autocorrelation. When the value of the index is close to 1, it suggests the existence of notable positive spatial autocorrelation among the research object, i.e., geographically similar units have similar eigenvalues; conversely, when an index value approaches −1, it signifies substantial negative spatial autocorrelation, i.e., the eigenvalues of the neighboring units show obvious differences. If equal to 0, then no spatial correlation exists. With these two indices, we can quantitatively assess and understand the spatial distribution pattern and correlation of geographic data.

2.3.5. Spatial Durbin Model (SDM)

Within the context of spatial econometrics research, several core econometric models have been adopted, namely the Spatial Lag Model (SLM), the Spatial Error Model (SEM), and the spatial Durbin model (SDM). Unlike SLM and SEM models, the SDM also has the advantage of analyzing spatial autocorrelation and spatial interaction effects simultaneously [65,66]. The SDM is an econometric model for analyzing spatial panel data, proposed by economists Ricardo Hausman and William Taylor in the 1970s. It extends traditional econometric models to account for spatial dependence, i.e., spatial correlation between observations, which is particularly important in fields such as geo-economics, regional science, and environmental economics. Incorporating a spatial weight matrix and considering the effects of spatial spillovers, the analysis and interpretation of spatially interlinked data become more precise, which is crucial for grasping the spatial dynamics of regional economic and social phenomena. The aim is to explore the impact of each independent variable on the resilience of the agricultural economy. The foundational model is outlined below:
y = α + ρ W y + β X + W X γ + ε
where y is the dependent variable, ρ represents the spatial spillover effects from neighboring provinces, X denotes the independent variable, β and γ represent the coefficients to be estimated, and W X represents the weight of the independent variable.
Based on the variables selected in this paper, the SDM is constructed as follows:
y i t = β j = 1 n W j t y j t + x i t γ + α j = 1 n W i j x j t + u i + v t + ε i t
In the equations, y i t is defined as the dependent variable data of region i at time t, x i t is the observed value of the explanatory variable in year t in region i , and the β coefficient reflects the spatial lag effect of the dependent variable. γ is the coefficient estimate of the independent variable, while the α coefficient describes the spatial spillover effect of the independent variable. W j t forms a 30 × 30 spatial weight array, which maps the spatial relationship between different provinces. u i and v t correspond to fixed effects in space and time, respectively, and ε i t is an independently distributed random error. W represents the spatial weight matrix. This study is based on the geographical distance weight array, supplemented by the geographical proximity weight array to enhance the robustness of the analysis. The detailed configuration is as follows: (1) Geographical proximity weight array: if two areas are geographically adjacent, W i j = 1 for i j ; if two areas are not geographically adjacent, W i j = 0 for i = j . (2) Geographical distance weight array: the weight Wij is defined by the reciprocal of the distance between areas: W i j = 1 d i j , i j , where d i j is the distance between area i and area j .

3. Results and Analysis

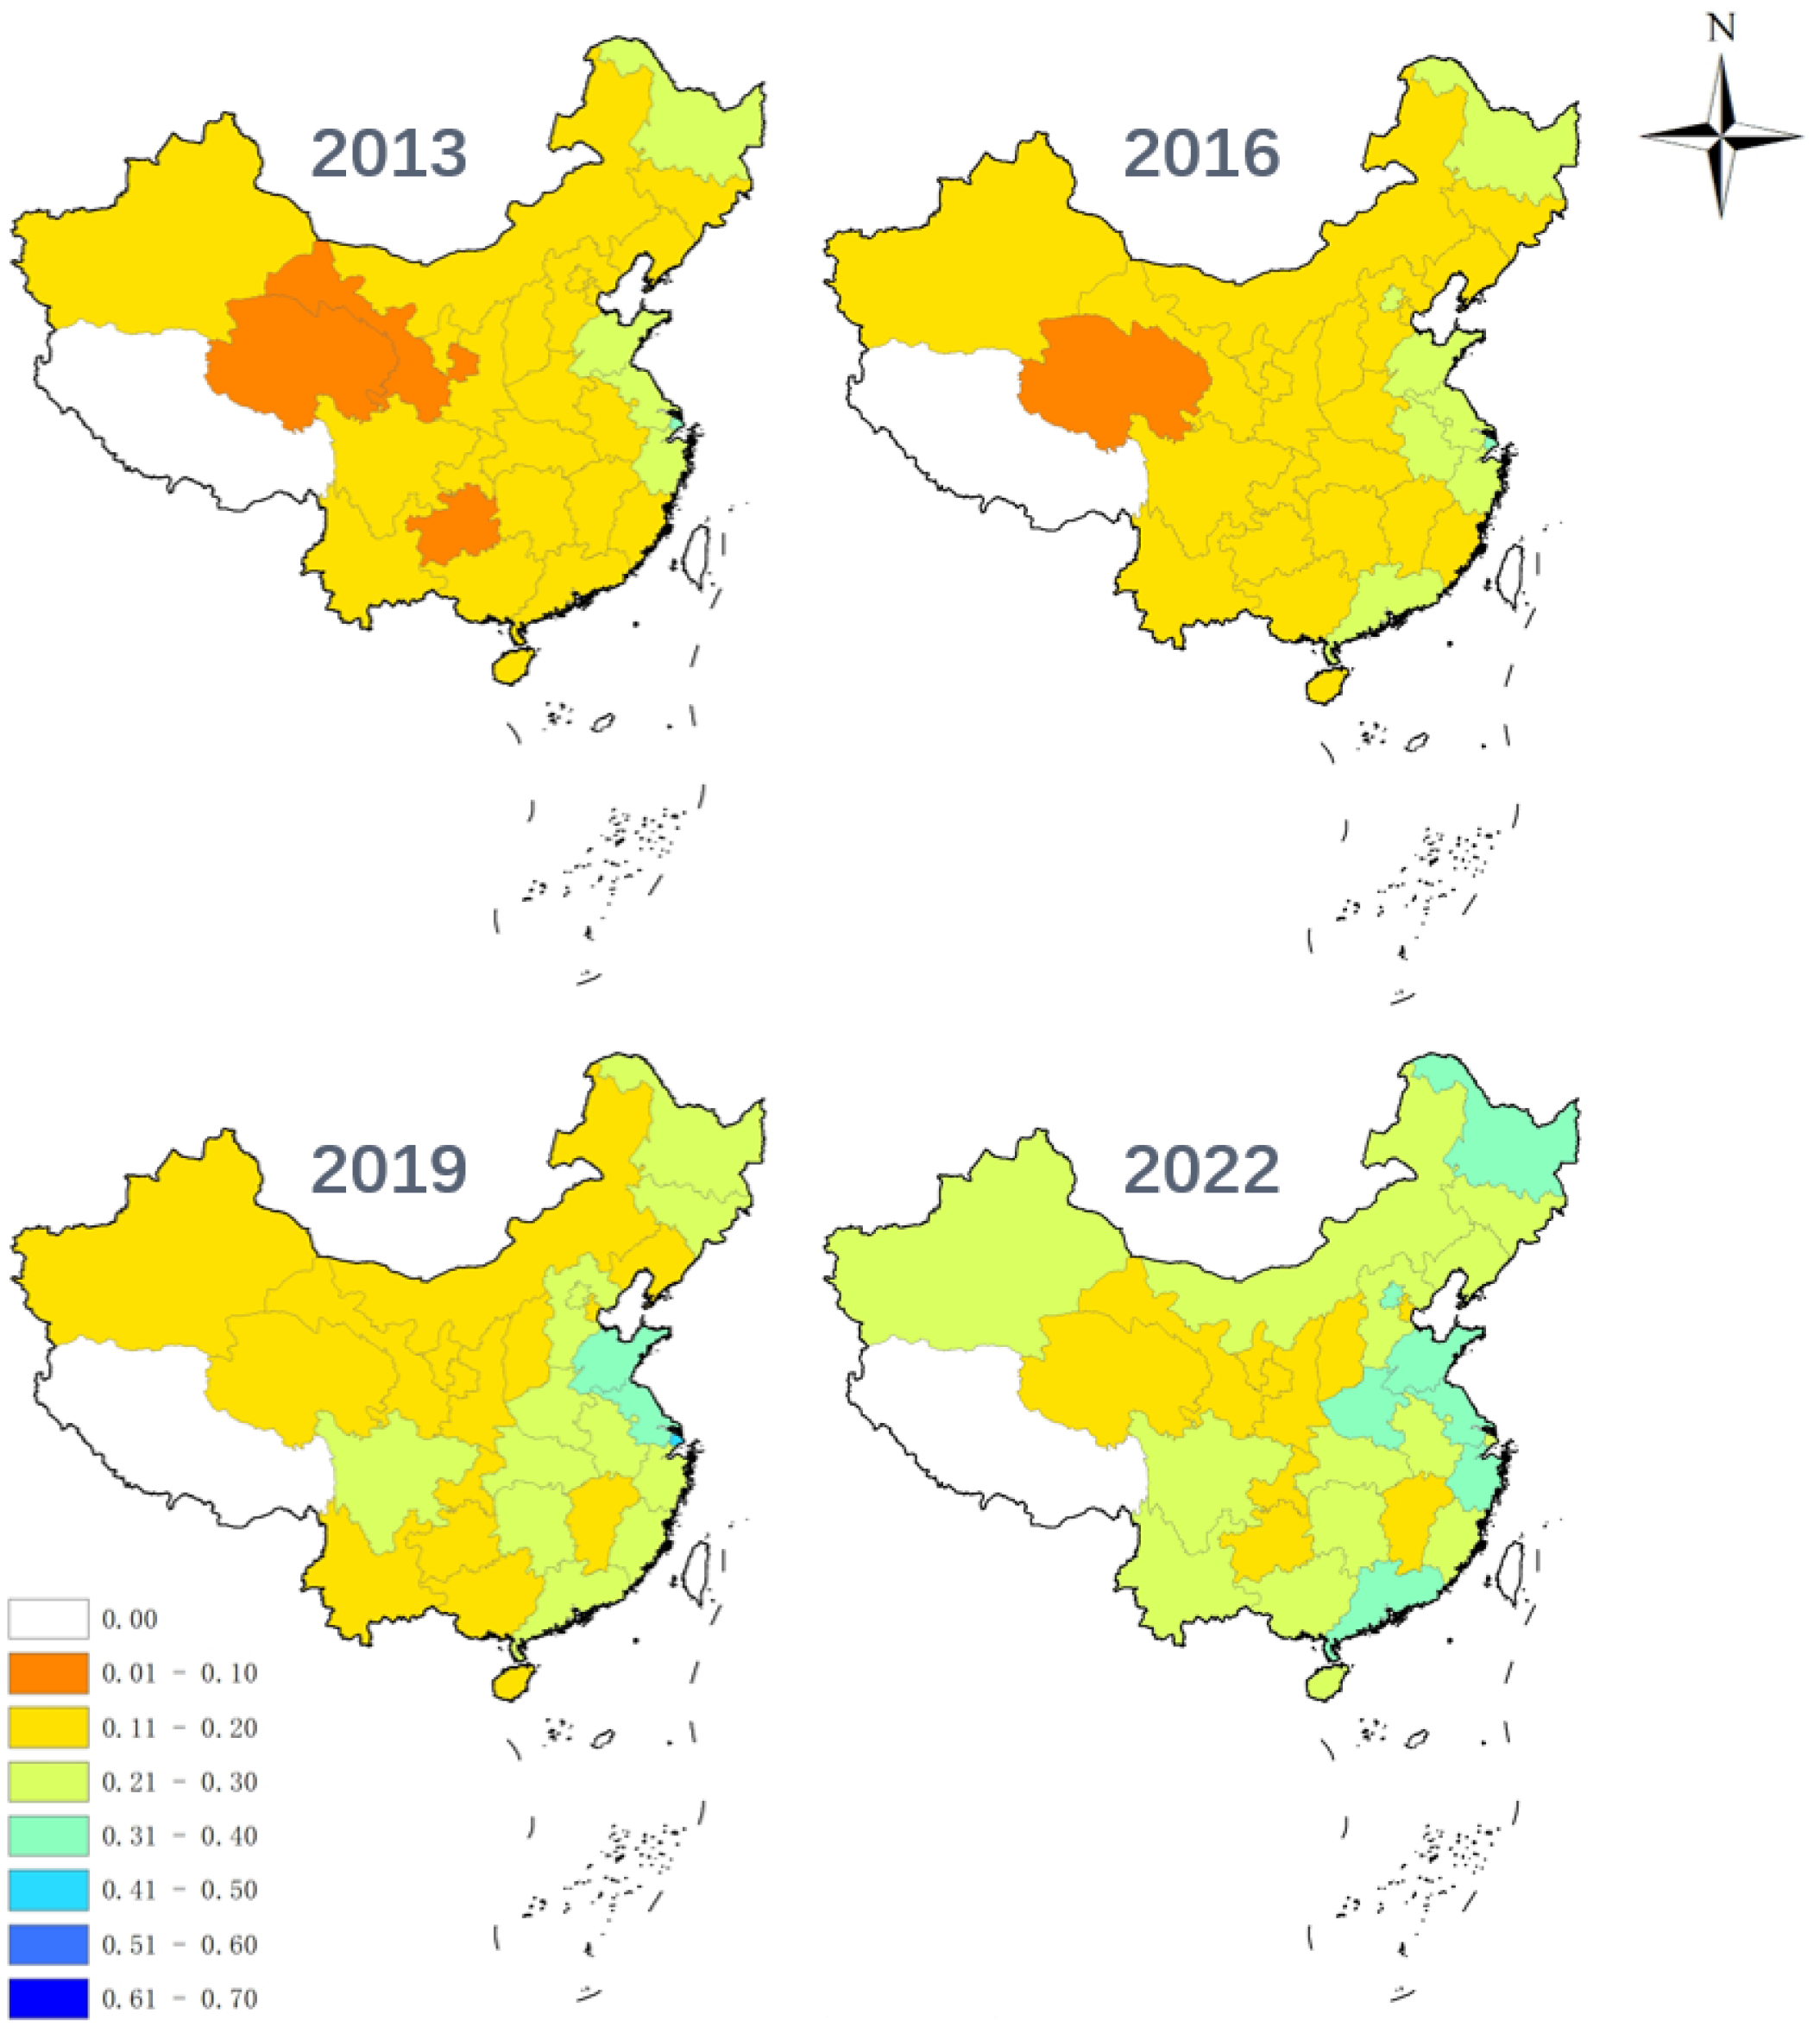
3.1. Measurement of Rural Economic Resilience in China

This study has developed a comprehensive evaluation system for resilience, using the entropy method to assign weights, and facilitating a quantitative and comparative analysis from 2013 to 2022. The assessment has produced time-series insights into China’s agricultural resilience, as shown in Figure 1, revealing its dynamics and regional variations. At the same time, the level of China’s agricultural economic resilience development in 2013, 2016, 2019, and 2022 was visualized and analyzed, as shown in Figure 2.
Figure 1 demonstrates that the national index for the development of agricultural economic resilience has shown an ascending trajectory throughout the sample period, rising from a value of 0.1562 to 0.2506. The eastern provinces demonstrated superior resilience, exceeding the national average (from 0.1913 to 0.2967). The central provinces demonstrated solid growth (from 0.1557 to 0.2527), consistent with the national average. The western region’s growth was slower (from 0.1182 to 0.1198), with a gap to the national average. Overall, resilience is rising, particularly in the east, with the central region keeping pace and the west needing further development.
Figure 2 indicates a low start for China’s resilience agricultural economy in 2013, with central, western, and some provinces falling below 0.1. By 2016, a significant improvement was observed, particularly in the east, raising most indices to the 0.2 to 0.3 range. However, in the central and western regions, Qinghai’s index remained below 0.1, while other provinces saw their indices increase to the 0.1 to 0.2 range. By 2019, most eastern provinces had a development index between 0.2 and 0.3, with Shandong, Jiangsu, and Shanghai exceeding 0.3. In the central region, the development index generally exceeded 0.2. In the western region, it remained generally low, with only Sichuan reaching a development index above 0.2. By 2022, significant changes occurred, with most provinces having indices surpassing 0.2. In the eastern region, the majority of provinces had development indices between 0.3 and 0.4. The central and western regions showed an upward trend as well, with most indices falling between 0.2 and 0.3.
In summary, China’s agricultural economic resilience has been steadily enhanced year after year under the sustained impetus of its rural development policies. The effective application of these policies has reinforced agriculture’s foundational role and bolstered the agricultural system’s resilience and self-healing capacity against shocks, establishing a strong basis for the rural economy’s sustained and stable growth. Despite this, rural economic and social development has seen significant advances through urban–rural integration and the development of unique rural industries, yet regional imbalances remain. The east has been ahead of the rest of the regions in terms of overall performance. Although there have been certain advancements, the western region continues to lag in growth when compared to other regions, compounded by issues like the scarcity of economic and technological assets, impeding the enhancement of agricultural economic resilience. The agricultural economy in the central region has shown strong resilience and rapid growth momentum. What is particularly important is that the central region has been China’s “granary” since ancient times, accounting for 5 of the 13 national grain-producing regions, which not only highlights its strategic position in national food security but also provides a solid material foundation and broad development space for the development of resilience.

3.2. Measurement of Regional Disparities

To better analyze spatial disparities in agricultural economic resilience across regions and identify whether these differences originate from within regions (intra-regional) or between regions (inter-regional), this study calculated the Theil index for the whole country, dividing China into east, central, and west. The analysis includes overall differences, intra-group (within-region) and inter-group (between-region) differences, and their respective contribution rates, as seen in Table 2 and Table 3.
From the perspective of the overall Theil index, China’s agricultural economic resilience development level fluctuated from 0.05415 in 2013 to 0.04463 in 2022. The results reveal that the difference in resilience is narrowing, with the regional imbalance decreasing from 0.0194 points in 2013 to 0.0137 points in 2022. In the time span of the study, the gap between the three regions in agricultural economic resilience gradually decreased. This implies that resilience has room for sustained growth under the joint promotion of rational allocation of resources, scientific and technological progress, and effective policy regulation. However, internal policy adjustments, such as the implementation of rural land “trifurcation” in 2016 and agricultural supply-side structural reforms in 2017, caused fluctuations in regional differences during the reform and adaptation periods. In 2020, the overall Theil index peaked, but in 2021, it experienced a sharp decline. This was primarily due to concentrated efforts in 2020 to combat poverty and address significant weaknesses in the agricultural sector. As of 2021, China has achieved a decisive victory in poverty eradication, eradicated extreme poverty, and effectively reduced the differences among different regions. On the whole, the adaptability difference in China’s agricultural economy shows a continuous reduction in the time span of the study.
After a thorough examination of disparities within regions, it is evident that the eastern region’s mean Theil index significantly surpasses those of the central and western regions. This indicates a higher degree of intra-regional inequality in the development of resilient agricultural economies in the east, in contrast to the more equitable distribution observed in the central and western regions. This is likely due to the stronger economic performance in eastern regions such as Guangdong, Shandong, and Jiangsu, which results in higher agricultural economic resilience and creates imbalances compared to provinces like Hainan and Fujian. The Theil index for the eastern region shows a reduction in volatility from 0.02173 to 0.01298 over the time frame studied. On the contrary, the Theil index in the midwest region shows obvious growth momentum. The index gradually increased from 0.00693 in 2013 to 0.01063 in 2021 but fell back to 0.00899 in 2022. The Theil index of the western region as a whole also shows an increasing trend, from 0.00608 to 0.00889. This trend reflects that the gap in agricultural economic adaptability in the whole country is gradually narrowing, although there are large internal differences in the eastern region. The central and western areas exhibit relatively smaller intra-regional differences; however, there is a risk of fluctuating and widening disparities in agricultural economic resilience between these regions. Continued monitoring of future trends and implementation of effective measures are needed to address and reduce intra-regional disparities.
Inter-regional differences contributed 36.82%, while intra-regional differences accounted for 63.18%. This indicates that differences among the three major regions are relatively minor, with most disparities arising within each region. Intra-regional differences are the primary factor driving variations in agricultural economic resilience across China, reflecting significant imbalances in development at finer geographical scales. These disparities primarily result from the extensive north–south span and geographic variations between China’s major regions (eastern, central, and western), leading to substantial differences in climate, resource distribution, and economic development within regions. Additionally, intra-regional differences in the eastern area are closely linked to the economic agglomeration effects of the Yangtze River Delta, while disparities in the western region are largely influenced by the relatively slower economic development in provinces such as Qinghai and Guizhou. These factors collectively contribute to pronounced intra-regional disparities.

3.3. Dynamic Evolution Based on Kernel Density Estimation (KDE)

This paper employs KDE to deeply analyze the sample data from 2013 to 2022 to probe the distributional characteristics of resilience at the national, eastern, central, and western regional levels, as well as to examine polarization phenomena and trends in its dynamic evolution. The analysis reveals the temporal dynamics of resilience, with findings presented in Figure 3. This series of research results not only present the current situation of agricultural economic resilience in various regions but also further reveal their internal development trends and expected future paths.
The nationwide dynamic evolution of agricultural economic resilience shows the following characteristics: (1) Distribution: The kernel density distribution’s peak moves rightward, indicating a steady rise in resilience. (2) Shape of the Main Peak Distribution: Over the study period, the main peak’s sharpness diminishes, reaching its flattest and widest form by 2022. The highest peak during the observation period was in 2014, suggesting that the gap may be gradually widening. (3) Distribution Spread: The right tailing trend of the resilience level kernel density curve from 2013 to 2022 shows a slight strengthening. This indicates sustained higher levels of resilience in Beijing, Shanghai, and Shandong.
The dynamic evolution of resilience in China’s eastern region is characterized by three trends: (1) Peak Position: The kernel density curve’s peak moves generally to the right, signaling an overall enhancement of resilience. A slight leftward shift in 2022 suggests a minor decrease in resilience for that year. (2) Main Peak Height: Over the sample period, the kernel density curve’s main peak height decreases, indicating growing disparities in resilience levels within the region. (3) Polarization Trends: The 2022 data analysis reveals a bimodal distribution, indicating significant differentiation in resilience levels.
The rightward shift of the central peak of the kernel density curve in the central region indicates an overall increase in the level of agricultural economic resilience in the region. The peak height of the core density of the agricultural economy in the central region shows a cyclical fluctuation pattern of “increase-decrease-increase-decrease”, which implies that the region has experienced cyclical fluctuations in improving its ability to withstand risks. The variation of peak width also shows an alternating trend of narrowing first and then widening, which indicates that the concentration trend within the central region is weakening, while the heterogeneity within the region is increasing. The kernel density curve in the central region has shifted from a “single-peak” to a “multi-peak” configuration, indicating a pronounced trend towards multi-polarization, particularly noticeable in 2020. However, this trend of multi-polarization gradually weakened and eventually disappeared in the following years, returning to a more homogeneous peak pattern, which may mean that after an initial phase of diversification, the regional levels of agricultural economic resilience started to converge towards a more unified state.
The kernel density distribution demonstrates a steady increase in the adaptability of the agricultural economy in the western region, as indicated by the significant rightward movement of the primary peak. Furthermore, the decrease in peak height and the expansion of peak width throughout the sample period indicate a growing variability in the resilience of the agricultural economy in that region, i.e., the imbalance within the region is gradually increasing. The western region does not exhibit a pronounced multi-polar pattern; instead, the distribution of its agricultural economic robustness levels displays clear unipolar traits. This observation suggests that there is a pronounced spatial convergence in the robustness of the agricultural economy in that region, that is, the majority of regions exhibit modest variations in agricultural economic resilience levels, with an overall trend towards a more concentrated distribution.

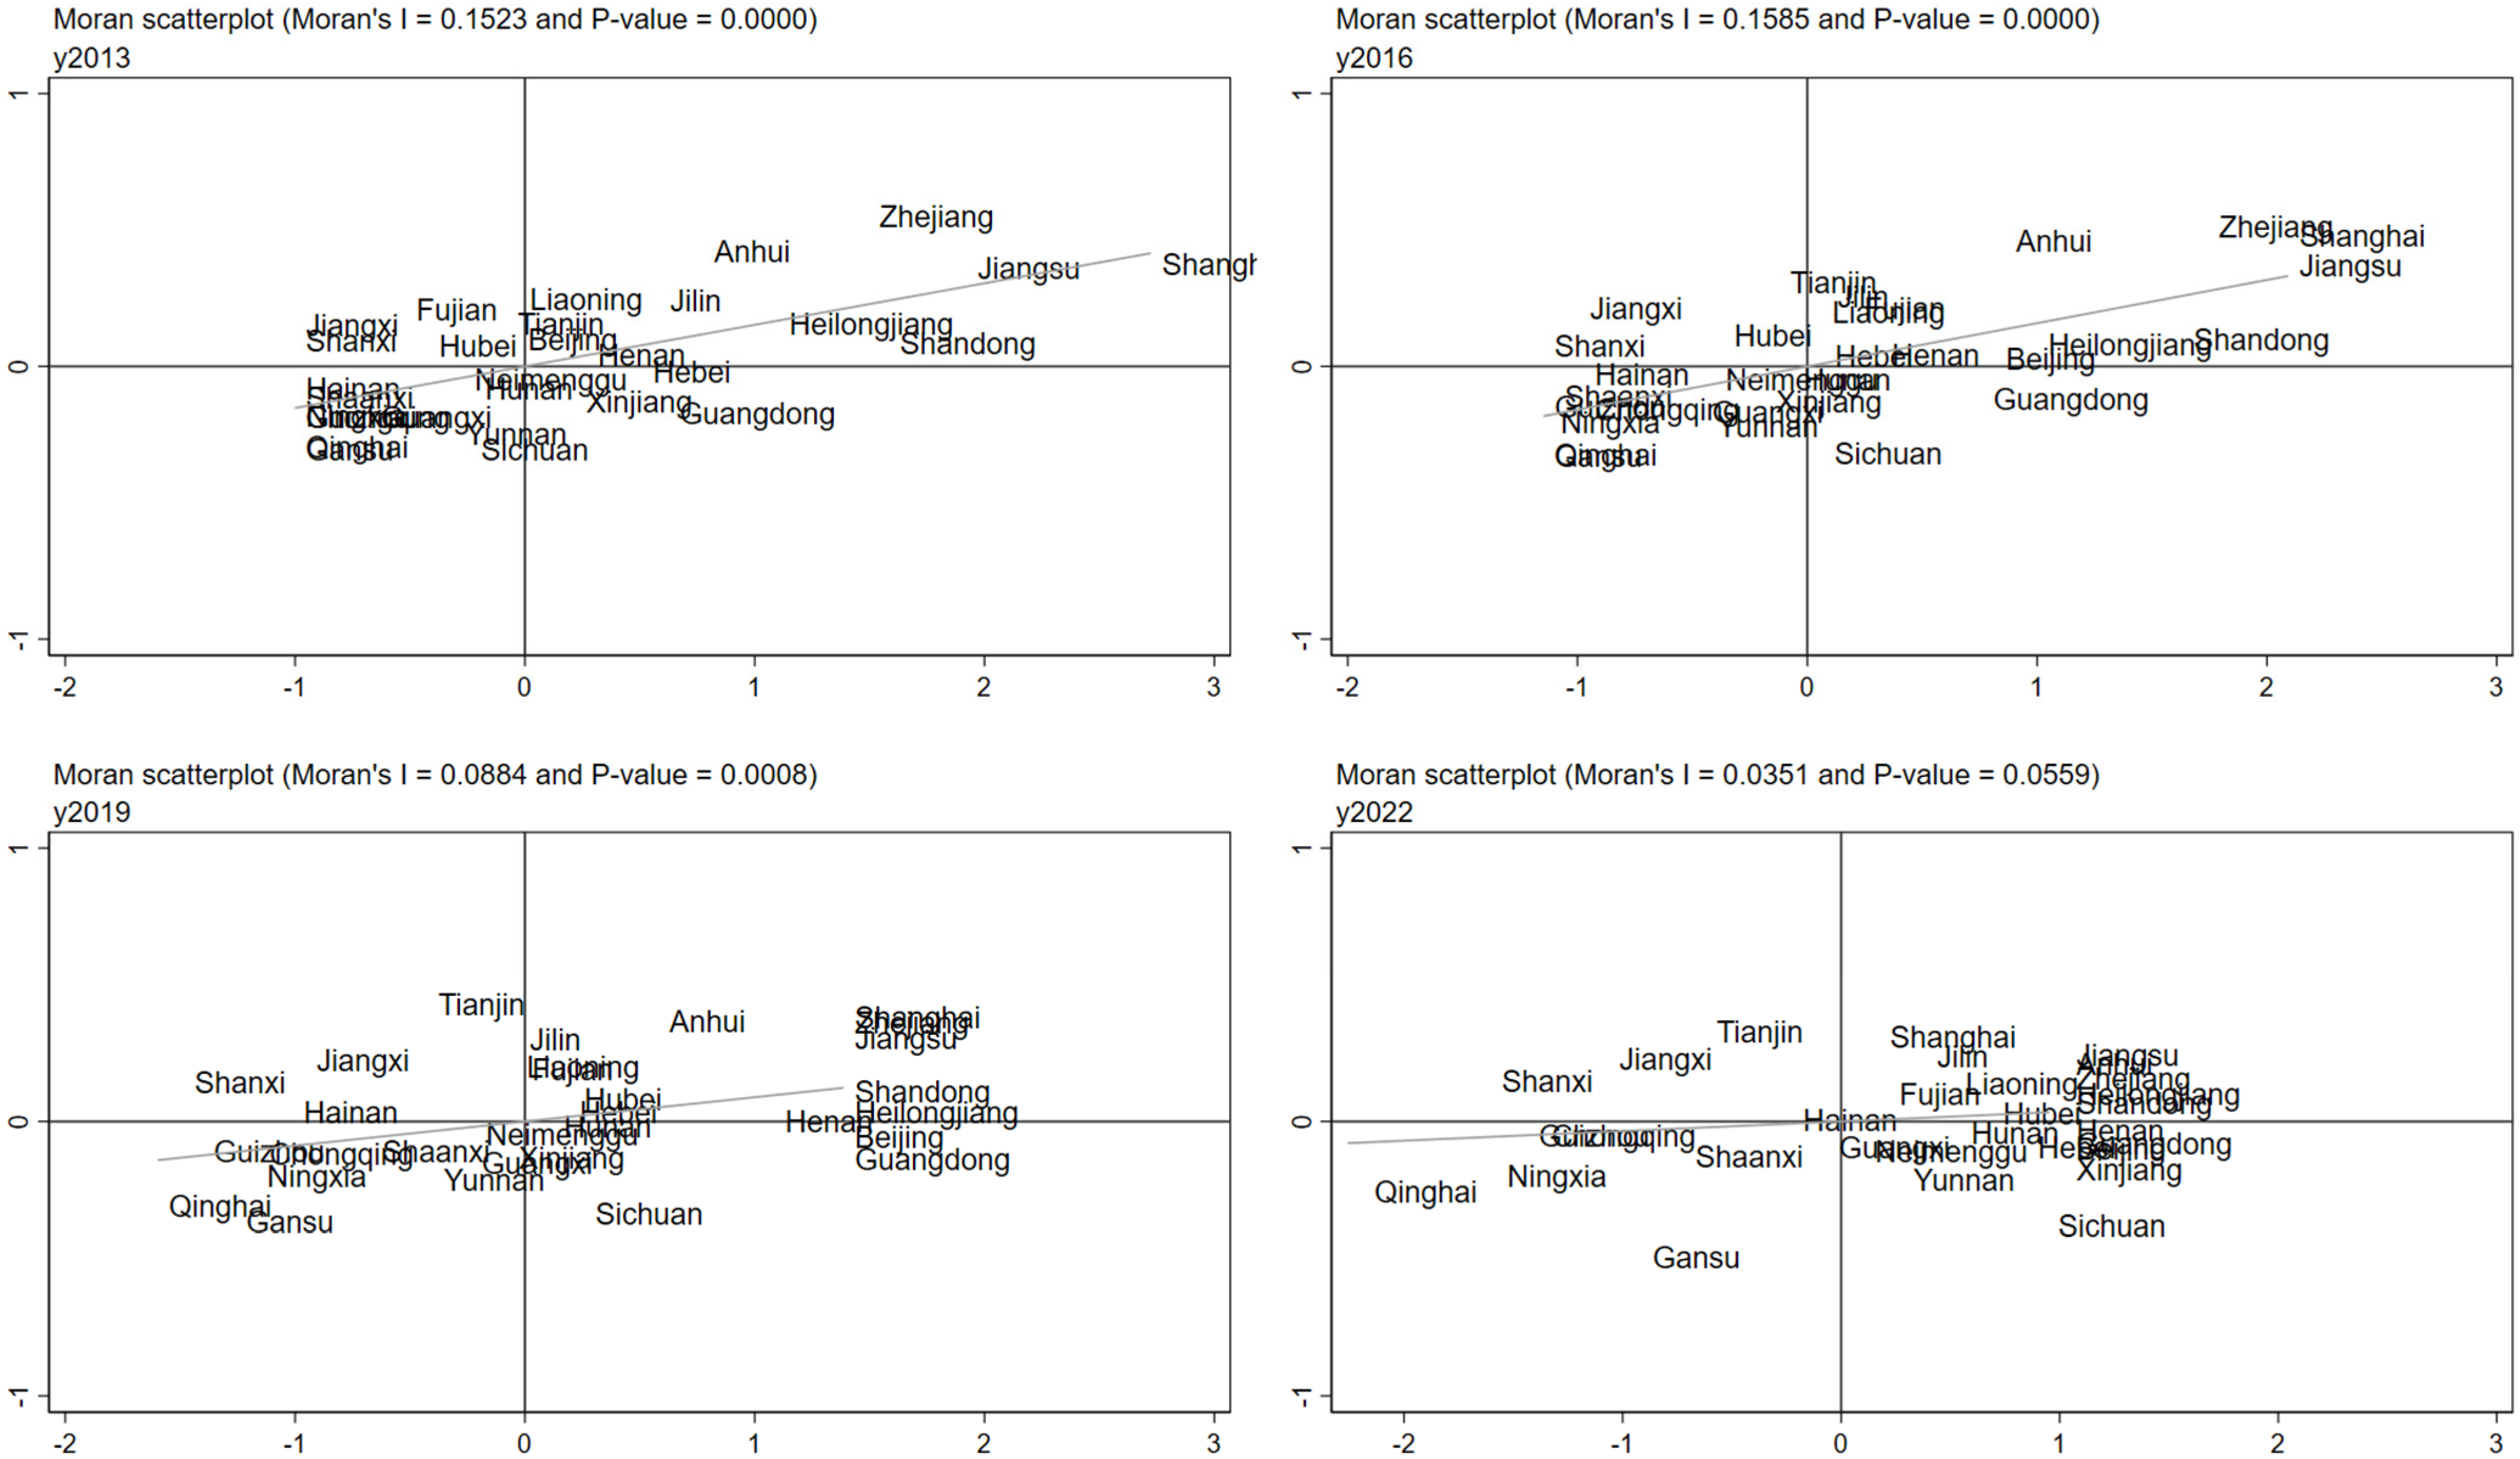
3.4. Analysis of Spatial Autocorrelation Test Results

The research utilizes a global Moran I index analysis, incorporating a matrix of geographic distance weight matrix, to explore the spatial aggregation of agricultural economic resilience, as delineated in Table 4. To further examine the spatial distribution, this study selects three-year intervals for local spatial pattern analysis, with local Moran scatter diagrams for the key years 2013, 2016, 2019, and 2022 presented in Figure 4.
Table 4 shows that the Moran index of agricultural resilience in China is consistently positive, confirming that regional adaptive correlations continue to be significant over time and pass the test of significance. Especially from 2014, the overall Moran index has shown a downward trajectory, gradually decreasing from the initial value of 0.1603, which reflects that although the positive spatial correlation of agricultural economic adaptability still exists, its correlation is gradually decreasing. In summary, China’s agricultural economic resilience exhibits distinct spatial clustering patterns. Provinces with robust agricultural economic resilience are commonly encircled by other high-performing provinces, whereas those with weaker resilience are typically flanked by provinces with comparable low-development levels. Declining spatial autocorrelation over time may mean that features or variables within a geographic space become more heterogeneous in their spatial distribution.
Figure 4 illustrates the spatial distribution of local Moran I indices for agricultural economic resilience in the representative years 2013, 2016, 2019, and 2022. The visual representation indicates that the spatial arrangement of local Moran I indices typically displays two distinct clusters of positive association: the “High-High” (H-H) group in the upper left quadrant and the “Low-Low” (L-L) group in the lower left quadrant. This distribution suggests that provinces with higher agricultural economic resilience are bordered by similarly resilient ones, and those with lower resilience are surrounded by provinces with comparable resilience levels. Examination of the Moran scatter plots for various years shows that provinces exhibiting “H-H” clustering are primarily located in the eastern and central regions. Conversely, provinces with “L-H” clustering characteristics are mostly in the eastern and central regions, with no western provinces represented. Provinces in remote geographic locations with natural conditions that impede agricultural development, such as Qinghai and Guizhou in the western region, predominantly exhibit “L-L” clustering. Provinces with “H-L” clustering characteristics are predominant in the eastern and central regions. Overall, these observations underscore the strong spatial correlation in agricultural economic resilience across China, highlighting the importance of considering spatial attributes when advancing agricultural economic resilience development.

3.5. Spatial Durbin Model Estimation Results

3.5.1. Model Construction

Spatial econometric models commonly include the spatial Durbin model (SDM), the Spatial Autoregressive Model (SAR), and the Spatial Error Model (SEM). In the preliminary stage of model construction, we applied a series of statistical tests, including the LM, the Wald, the LR, and the Hausman test, determining the most appropriate model form. By integrating and scrutinizing the outcomes of these evaluations, we have been able to distinctly identify the appropriate model category for the subsequent analytical phase, along with the comprehensive test data and rationale for the model selection. The details are shown in Table 5.
As presented in Table 5, the LM tests reveal that the p-values for both the SAR and the SEM are significant, indicating that these models are suitable for further analysis. Given that SAR and SEM are specific cases of the SDM, additional tests were conducted to evaluate whether the SDM can be simplified to either the SAR or SEM. The findings from the Wald statistic and the Hausman test at a 5% confidence level suggest that the spatial Durbin model with fixed effects is more appropriate than the SAR or SEM models, as well as the models with random effects. Table 6 presents the regression results, which show improved fit and significance when incorporating both time and space fixed-effects. Therefore, this study adopts the fixed effects spatial Durbin model for further analysis.

3.5.2. Decomposition Analysis of Spatial Effects

As illustrated in Table 7, agricultural production efficiency has a notably positive impact as a control variable. Improvements in agricultural production efficiency have both direct and indirect positive effects. This positive impact stems from enhanced agricultural production efficiency, which indicates improved use of regional production factors, resulting in efficient resource allocation, minimized waste, and increased yield per unit area. Consequently, this enhances the region’s economic resilience against external shocks.
The urbanization rate exerts a favorable influence on agricultural economic resilience, with both its direct and indirect impacts being notably beneficial. This suggests that increases in urbanization levels enhance agricultural economic resilience within the region and its neighboring areas. As the pace of urbanization continues to accelerate, it acts as a huge gravitational field, bringing together huge flows of capital and highly skilled people, a phenomenon that has far-reaching implications for the agricultural sector. Urbanization has bolstered the agricultural economy’s resilience to challenges like economic shifts and natural disasters by enhancing the agricultural financing environment and fostering technological innovation, thereby significantly strengthening the sector’s robustness. During the urbanization process, governments frequently implement various supportive policies, including agricultural subsidies, insurance, and financial services. These initiatives are designed to strengthen the stability and resilience of agricultural economies.
Agricultural mechanization positively impacts economic resilience in agriculture. The indirect effect is significantly positive while the direct effect is not statistically significant. This indicates that advancements in agricultural mechanization in one region contribute to resilience enhancement in adjacent areas. Enhanced mechanization boosts labor productivity and reduces labor costs. The widespread adoption of agricultural machinery across China facilitates the transfer of mechanization benefits between regions. Furthermore, a higher density of agricultural machinery within a region positively impacts the agricultural economic resilience of adjacent regions.
The agricultural planting structure has notable direct and indirect effects. The local effect of grain cultivation area share is negative, but its spatial spillover effect is positive. This suggests that while increasing the area sown to grain within a region may hinder its own agricultural economic resilience, it can boost resilience in neighboring regions. An increase in the grain-sowing area typically corresponds to a reduction in the area allocated to cash crops. Since cash crops generally provide higher income for farmers compared to grain crops, expanding the grain-sowing area within a region can adversely affect its resilience to shocks and risks, thus negatively influencing agricultural economic resilience. Conversely, the expansion of grain sowing creates a “siphon effect” and promotes “scale operation,” leading to a decrease in the proportion of grain-sowing areas in neighboring regions. This diversification in planting structure in adjacent areas contributes positively to their agricultural economic resilience.
The direct impact coefficients of the level of openness and harsh natural conditions, as well as their indirect impact coefficients, do not meet the statistically significant criteria in the significance test. This implies that neither the degree of regional openness nor the harshness of natural conditions are pivotal factors in driving resilient growth within China’s agricultural economy. In other words, although these factors may influence the performance of the agricultural economy to some extent, their contribution to the resilient growth of the agricultural economy is not dominant compared to other factors.

3.5.3. Robustness Tests

To validate the empirical findings, robustness checks were conducted using a geographic adjacency weight matrix. Table 8 displays the direct, indirect, and total effects of the space–time fixed-effects spatial Durbin model (SDM) with this matrix. The slight variations in regression coefficients and their significance when switching from a geographic distance to an adjacency weight matrix confirm the robustness of the research outcomes.

4. Conclusions and Discussion

4.1. Conclusions

Employing the entropy weight method, this study quantitatively evaluates agricultural resilience, utilizing panel data spanning the period from 2013 to 2022 as its foundation. In the course of the study, various statistical methods such as Theil’s index, kernel density estimation (KDE), and the spatial Durbin model (SDM) are comprehensively applied to deeply analyze the distributional characteristics of agricultural economic resilience and its evolutionary trends in time and space dimensions in various regions of China. This innovative combination of methodologies not only reveals the variability of agricultural economic resilience across regions but also captures its dynamic changes over time, providing a solid empirical foundation for understanding the complexity of China’s agricultural economy as well as formulating targeted resilience enhancement strategies. The principal findings are thus summarized: (1) Resilience Trends: Spanning the period from 2013 to 2022, the aggregate resilience within China’s agricultural economy has been modest, yet a discernible upward trajectory is observed among the provinces. This suggests that China’s agricultural economy’s capacity to withstand risks is progressively improving. Notably, the eastern region has shown the most significant growth in resilience, whereas the western region continues to exhibit relatively low resilience levels. (2) The difference in China’s agricultural economic resilience among different regions is still prominent, and the overall change shows a ladder-like trend of volatility reduction, which reflects that although the overall development trend is good, the regional differences are still a phenomenon that cannot be ignored. At present, the uneven development of agricultural economic adaptability is mainly manifested in the interior of each region; however, the differences between regions also need our attention. Notably, the eastern region exhibits stark internal disparities, highlighting considerable developmental inequalities; conversely, despite less pronounced differentiation, there is apprehension regarding the expanding disparities within the central and western regions. These disparities may originate from variations in resource distribution, policy inclinations, or accessibility to markets, which require the full attention of policymakers to avoid potentially greater divergence in the future. (3) Spatial Autocorrelation: The spatial econometric analysis indicates a pronounced autocorrelation in resilience, yet this correlation is on a declining trajectory. This pattern implies a growing disparity among regions and a diminishing spatial synchrony within the area under study. (4) Although the development of a region’s agricultural economic resilience is primarily attributable to the direct influence of factors within the region itself, the spatial spillover effects triggered by a variety of potential influencing factors in neighboring regions also play an indispensable role, the importance of which should not be underestimated. It is particularly significant that the efficiency of agricultural output and the progression of agricultural mechanization in adjacent areas exhibit notable spatial spillover effects, which are pivotal in strengthening the regional agricultural economy’s resilience.

4.2. Discussion and Recommendations

This study focuses on the dynamic evolution patterns of China’s agricultural economic resilience in the time and space dimensions, and also quantitatively assesses the development level of agricultural economic resilience. The results indicate an overall increase in resistance to adversity during the study period, but with imbalances between regions. Notably, the development of the western region is slow compared to the eastern and central regions. There are differences in the development of the resilience of China’s agricultural economy, with a large gap between the two regions, the eastern region and the western region, where the differences in the development of the resilience of China’s agricultural economy come mainly from within the region. These are consistent with previous findings.
The distinctive contribution of this research lies in its novel approach to elucidating the spatial patterns that characterize the adaptability of China’s agricultural economy, which shows that the geographical location characteristics of a region not only directly shape its agricultural economic adaptability but also have an impact on the surrounding areas through spatial spillovers. Among the variables analyzed in this study, it is confirmed that the proportion of sown area of grain, the level of agricultural mechanization, the urbanization process, and the efficiency of agricultural production exhibit significant spatial spillover effects. This finding enriches our understanding of the mechanism underlying the development of resilience and serves as a valuable contribution to existing studies.
Overall, this study further enhances our understanding of the evolution of agricultural economic adaptability and its interaction between different regions. At the same time, it provides important perspectives for policymakers and practitioners, which are essential for designing and implementing strategies aimed at enhancing resilience, especially in achieving balanced regional development, promoting inter-regional cooperation, and improving the efficiency of resource allocation.
Drawing on the findings of prior research and the current state of China’s agricultural economic development, this paper offers targeted recommendations to bolster resilience across different regions.
First, in order to better cope with the problems in agricultural production activities, it is crucial to continue to enhance the resilience of the strong agricultural economy. Fortifying resilience entails a holistic approach, encompassing a spectrum of strategic elements, including policy development, technological advancement, market expansion, and community engagement [67]. This process needs the joint efforts of all sectors of society. For example, the comprehensive implementation of strategies such as promoting agricultural science and technology, broadening market access and branding strategies, strengthening the maintenance and management of the agricultural ecological environment, and implementing diversified crop planting schemes can effectively improve the anti-risk ability of the agricultural economy and help agriculture transition to a higher level of development [36,68].
Secondly, the long-standing development gap between regions, particularly the significant lead of the eastern region, necessitates targeted policies to reduce these disparities. Each region should leverage its specific resources and advantages to develop distinctive agricultural industries. Rational and scientific planning for agricultural economic resilience should be based on regional development needs and trajectories to ensure more balanced development across provinces. The western region in particular should develop targeted strategies to enhance resilience considering its specific agricultural characteristics and vulnerabilities.
Finally, recognizing the impact of spatial spillover effects on agricultural economic resilience is crucial. The subjectivity and flexibility of government agencies in policy formulation have a more profound impact on agricultural economic resilience, and policy coordination should be strengthened to align the development goals of agricultural economic resilience with broader rural development strategies [67,69]. Regions should foster resource and element exchanges to fully leverage spatial spillovers, thus supporting coordinated development across agricultural economies. By implementing these recommendations, China can bolster agricultural economic resilience, promote sustainable development, and ensure food security across diverse regions.

4.3. Limitations and Prospects

It is undeniable that our study still has some limitations. This paper concentrates on three pivotal dimensions—resilience, adaptability, and innovation—in crafting the index system to gauge the agricultural economy’s adaptability in China. While numerous factors could influence its adaptive development, research and data constraints have impeded a thorough examination of these influences. Moreover, this study reveals considerable regional disparities, necessitating further detailed regional analysis and refined sampling techniques in subsequent research.
In our next study, we can divide China into more regions to narrow down the regional scope, which will help to study the differences in resilience within regions. At the same time, we can have more choices in the selection of research methods, such as using the Farmers’ Difficulty Index (FDI) [67], which is constructed with the plight of farmers in mind. Further research in the future should focus more on the exploration of pathways to resilient development of the agricultural economy based on further refined data to advance the cause of agriculture.

Author Contributions

Conceptualization, Q.N. and Y.C.; data curation, Q.N.; funding acquisition, J.W.; software, L.L. and F.L.; supervision, Y.C.; validation, F.L.; visualization, Y.J.; writing—original draft, L.L.; writing—review and editing, Y.J. and J.W. All authors have read and agreed to the published version of the manuscript.

Funding

This research received financial support from the Department of Agriculture and Rural Affairs of Guangxi Zhuang Autonomous Region (Project Name: Citrus Industry Project of the Guangxi Innovative Team of Modern Agricultural Industry Technology System; Project Number: nycytxgxcxtd-2021-05-08), the Department of Science and Technology of Guangxi Zhuang Autonomous Region (Project Name: Key Technology Research and Application for High-Efficiency Breeding of Healthy Seedlings for Citrus Fine Varieties; Project Number: Guike AA22068092-4), the Guangxi Association for Science and Technology (Project Name: Grassroots Science Popularization Action Plan—Guangxi Science and Technology Small Courtyard Construction Special Project; Project Number: 202101296), the Innovation and Practice of Rural Revitalization Design Institute of Art Colleges and Universities in the Context of New Agricultural Science, funded by the Department of Education of Guangxi Zhuang Autonomous Region (Project No. XNK2023010), and Guangxi Arts University’s high-level talent introduction research project funded by Guangxi Arts University (Project No. GCRC202110).

Institutional Review Board Statement

Not applicable.

Data Availability Statement

The raw data supporting the conclusions of this article will be made available by the authors upon request.

Acknowledgments

The authors are grateful to the editors and the anonymous referees for their constructive and thorough comments, which contributed to the improvement of this study.

Conflicts of Interest

The authors declare no conflicts of interest.

References

  1. Delvaux, P.A.G.; Riesgo, L.; Paloma, S.G. Are Small Farms More Performant than Larger Ones in Developing Countries? Sci. Adv. 2020, 6, eabb8235. [Google Scholar] [CrossRef]
  2. Cao, K.H.; Birchenall, J.A. Agricultural Productivity, Structural Change, and Economic Growth in Post-Reform China. J. Dev. Econ. 2013, 104, 165–180. [Google Scholar] [CrossRef]
  3. Ito, J.; Bao, Z.; Su, Q. Distributional Effects of Agricultural Cooperatives in China: Exclusion of Smallholders and Potential Gains on Participation. Food Policy 2012, 37, 700–709. [Google Scholar] [CrossRef]
  4. Yao, R.; Ma, Z.; Wu, H.; Xie, Y. Mechanism and Measurement of the Effects of Industrial Agglomeration on Agricultural Economic Resilience. Agriculture 2024, 14, 337. [Google Scholar] [CrossRef]
  5. Kostov, P.; Lingard, J. Risk Management: A General Framework for Rural Development. J. Rural. Stud. 2003, 19, 463–476. [Google Scholar] [CrossRef]
  6. Volkov, A.; Žičkienė, A.; Morkunas, M.; Baležentis, T.; Ribašauskienė, E.; Streimikiene, D. A Multi-Criteria Approach for Assessing the Economic Resilience of Agriculture: The Case of Lithuania. Sustainability 2021, 13, 2370. [Google Scholar] [CrossRef]
  7. Martin, R.; Gardiner, B. The Resilience of Cities to Economic Shocks: A Tale of Four Recessions (and the Challenge of Brexit). Pap. Reg. Sci. 2019, 98, 1801–1833. [Google Scholar] [CrossRef]
  8. Li, L.; Huang, X. The Latest Research Progress of Regional Economic Resilience in China. In Proceedings of the 2022 7th International Conference on Social Sciences and Economic Development (ICSSED 2022), Wuhan, China, 25–27 March 2022; Atlantis Press: Dordrecht, The Netherlands, 2022; pp. 1745–1750. [Google Scholar]
  9. Li, W.; Guo, J.; Tang, Y.; Zhang, P. Resilience of Agricultural Development in China’s Major Grain-Producing Areas under the Double Security Goals of “Grain Ecology”. Environ. Sci. Pollut. Res. 2024, 31, 5881–5895. [Google Scholar] [CrossRef] [PubMed]
  10. Gao, Q.; Sun, M.; Chen, L. The Impact of Digital Inclusive Finance on Agricultural Economic Resilience. Financ. Res. Lett. 2024, 66, 105679. [Google Scholar] [CrossRef]
  11. Singh, N.; Kumar, A.; Dey, K. Unlocking the Potential of Knowledge Economy for Rural Resilience: The Role of Digital Platforms. J. Rural. Stud. 2023, 104, 103164. [Google Scholar] [CrossRef]
  12. Tao, T.; Ma, L.; Wang, X.; Wu, S.; Shi, Z.; Cui, X. Resilience or Efficiency? Strategic Options for Sustainable Development of Agricultural Systems in Ecologically Fragile Areas of China. Sci. Total Environ. 2023, 881, 163411. [Google Scholar] [CrossRef] [PubMed]
  13. Xie, S.; Zhang, J.; Li, X.; Xia, X.; Chen, Z. The Effect of Agricultural Insurance Participation on Rural Households’ Economic Resilience to Natural Disasters: Evidence from China. J. Clean. Prod. 2024, 434, 140123. [Google Scholar] [CrossRef]
  14. Berry, R.; Vigani, M.; Urquhart, J. Economic Resilience of Agriculture in England and Wales: A Spatial Analysis. J. Maps 2022, 18, 70–78. [Google Scholar] [CrossRef]
  15. Perrin, A.; Milestad, R.; Martin, G. Resilience Applied to Farming: Organic Farmers’ Perspectives. Ecol. Soc. 2020, 25, 5. [Google Scholar] [CrossRef]
  16. Urruty, N.; Tailliez-Lefebvre, D.; Huyghe, C. Stability, Robustness, Vulnerability and Resilience of Agricultural Systems. A Review. Agron. Sustain. Dev. 2016, 36, 15. [Google Scholar] [CrossRef]
  17. Freshwater, D. Vulnerability and Resilience: Two Dimensions of Rurality. Sociol. Rural. 2015, 55, 497–515. [Google Scholar] [CrossRef]
  18. Volkov, A.; Morkunas, M.; Balezentis, T.; Streimikiene, D. Are Agricultural Sustainability and Resilience Complementary Notions? Evidence from the North European Agriculture. Land Use Policy 2022, 112, 105791. [Google Scholar] [CrossRef]
  19. Scott, M. Resilience: A Conceptual Lens for Rural Studies? Geogr. Compass 2013, 7, 597–610. [Google Scholar] [CrossRef]
  20. Lin, C.; Yang, J. Research on the Technology Spillover Effect of Taiwanese Investment on Agricultural Products Processing Industry in Mainland China. In Proceedings of the 2017 International Conference on Education Science and Economic Management (ICESEM 2017), Xiamen, China, 14–15 October 2017; Lin, X., Li, B., Lamba, J., Eds.; Atlantis Press: Paris, France, 2017; Volume 106, pp. 82–86. [Google Scholar]
  21. Zhang, C.; Tian, G.; Tao, Y. The Spillover Effect of Agricultural Product Market Price Fluctuation Based on Fourier Analysis. Int. J. Inf. Syst. Supply Chain. Manag. 2022, 15, 1–17. [Google Scholar] [CrossRef]
  22. Xu, L.; Jiang, J.; Du, J. The Dual Effects of Environmental Regulation and Financial Support for Agriculture on Agricultural Green Development: Spatial Spillover Effects and Spatio-Temporal Heterogeneity. Appl. Sci. 2022, 12, 11609. [Google Scholar] [CrossRef]
  23. Jinji, N.; Zhang, X.; Haruna, S. Trade Patterns and International Technology Spillovers: Evidence from Patent Citations. Rev. World Econ. 2015, 151, 635–658. [Google Scholar] [CrossRef]
  24. Zhang, X.; Xu, F. Environmental Regulation and Spatial Spillover Effect of Green Technology Innovation: An Empirical Study on the Spatial Durbin Model. Sustainability 2023, 15, 14133. [Google Scholar] [CrossRef]
  25. Zhang, Q.; Zhang, F.; Wu, G.; Mai, Q. Spatial Spillover Effects of Grain Production Efficiency in China: Measurement and Scope. J. Clean. Prod. 2021, 278, 121062. [Google Scholar] [CrossRef]
  26. Li, C.; Yu, G.; Deng, H.; Liu, J.; Li, D. Spatio-Temporal Pattern and the Evolution of the Distributional Dynamics of County-Level Agricultural Economic Resilience in China. PLoS ONE 2024, 19, e0300601. [Google Scholar] [CrossRef]
  27. Xu, J. Agricultural Marketing Issues and Strategies in Western China. In Proceedings of the 2nd International Conference on Science and Social Research (ICSSR 2013), Beijing, China, 13–14 July 2013; Atlantis Press: Dordrecht, The Netherlands, 2013; pp. 426–428. [Google Scholar]
  28. Does the Common Agricultural Policy Enhance Farming Systems’ Resilience? Applying the Resilience Assessment Tool (ResAT) to a Farming System Case Study in The Netherlands—ScienceDirect. Available online: https://www.sciencedirect.com/science/article/pii/S0743016720303740 (accessed on 17 July 2024).
  29. Sanchez-Zamora, P.; Gallardo-Cobos, R.; Cena-Delgado, F. Analyzing resilience factors in rural territories of Andalusia through techniques of Analytical Network Process (ANP). ITEA Inf. Tec. Econ. Agrar. 2017, 113, 68–89. [Google Scholar] [CrossRef]
  30. Zhao, X.; Zhao, R. The Impact and Mechanism of Digital Villages on Agricultural Resilience in Ecologically Fragile Ethnic Areas: Evidence from China’s Provinces. Agriculture 2024, 14, 221. [Google Scholar] [CrossRef]
  31. Zhou, J.; Chen, H.; Bai, Q.; Liu, L.; Li, G.; Shen, Q. Can the Integration of Rural Industries Help Strengthen China’s Agricultural Economic Resilience? Agriculture 2023, 13, 1813. [Google Scholar] [CrossRef]
  32. Kalogiannidis, S.; Papadopoulou, C.-I.; Loizou, E.; Chatzitheodoridis, F. Risk, Vulnerability, and Resilience in Agriculture and Their Impact on Sustainable Rural Economy Development: A Case Study of Greece. Agriculture 2023, 13, 1222. [Google Scholar] [CrossRef]
  33. Yang, Q.; Zhang, P.; Li, Y.; Ning, J.; Chu, N. Does the Policy of Decoupled Subsidies Improve the Agricultural Economic Resilience?—Evidence from China’s Main Corn Producing Regions. Sustainability 2023, 15, 10164. [Google Scholar] [CrossRef]
  34. Zhang, H.; Li, J.; Quan, T. Strengthening or Weakening: The Impact of an Aging Rural Workforce on Agricultural Economic Resilience in China. Agriculture 2023, 13, 1436. [Google Scholar] [CrossRef]
  35. Gai, M.; Yang, Q. Synergistic Study of the Green Efficiency and Economic Resilience of Agriculture from a Sustainable Development Perspective: Evidence from Northeast China. Environ. Sci. Pollut. Res. 2023, 30, 77568–77592. [Google Scholar] [CrossRef]
  36. Meuwissen, M.P.M.; Feindt, P.H.; Spiegel, A.; Termeer, C.J.A.M.; Mathijs, E.; de Mey, Y.; Finger, R.; Balmann, A.; Wauters, E.; Urquhart, J.; et al. A Framework to Assess the Resilience of Farming Systems. Agric. Syst. 2019, 176, 102656. [Google Scholar] [CrossRef]
  37. Zhu, W.; Li, B.; Han, Z. Synergistic Analysis of the Resilience and Efficiency of China’s Marine Economy and the Role of Resilience Policy. Mar. Policy 2021, 132, 104703. [Google Scholar] [CrossRef]
  38. Tang, Y.; Wang, Y. Impact of Digital Economy on Ecological Resilience of Resource-Based Cities: Spatial Spillover and Mechanism. Environ. Sci. Pollut. Res. 2023, 30, 41299–41318. [Google Scholar] [CrossRef]
  39. Wu, Y.; Que, W.; Liu, Y.G.; Cao, L.; Liu, S.B.; Zhang, J. Is Resilience Capacity Index of Chinese Region Performing Well? Evidence from 26 Provinces. Ecol. Indic. 2020, 112, 106088. [Google Scholar] [CrossRef]
  40. Martin, R.; Sunley, P.; Gardiner, B.; Tyler, P. How Regions React to Recessions: Resilience and the Role of Economic Structure. Reg. Stud. 2016, 50, 561–585. [Google Scholar] [CrossRef]
  41. Smyth, S.J.; Phillips, P.W.B.; Kerr, W.A. Food Security and the Evaluation of Risk. Glob. Food Secur. 2015, 4, 16–23. [Google Scholar] [CrossRef]
  42. Xu, J.; Zha, T. Chinese Urbanisation and Food Security. Oxid. Commun. 2016, 39, 2159–2170. [Google Scholar]
  43. Li, X.C.; Zhu, M.D. Analysis on the Spatial Spillover Effect of Agricultural Mechanization on the “Tendency to Grain Production” in Planting Structure. RAM 2022, 42, 684–693. [Google Scholar] [CrossRef]
  44. Liu, Y.; Wang, S.; Zhu, H.; Wang, Y. Crop Diversification, Land Price Spillovers, and Land Governance: Evidence from China. Front. Sustain. Food Syst. 2024, 7, 1334476. [Google Scholar] [CrossRef]
  45. Long, Y. Export Competitiveness of Agricultural Products and Agricultural Sustainability in China. Reg. Sustain. 2021, 2, 203–210. [Google Scholar] [CrossRef]
  46. Hou, Y.; Liang, X. Research on Food Security Risk Assessment and Early Warning in China Based on BP Neural Network Model. J. Food Qual. 2022, 2022, 5245752. [Google Scholar] [CrossRef]
  47. Chen, Y.K.; Chen, C.-Y.; Hsieh, T.F. Establishment and Applied Research on Environmental Sustainability Assessment Indicators in Taiwan. Environ. Monit. Assess. 2009, 155, 407–417. [Google Scholar] [CrossRef] [PubMed]
  48. Nong, W.; Wen, J.; He, J. Spatial-Temporal Variations and Driving Factors of the Coupling and Coordination Level of the Digital Economy and Sustainable Rural Development: A Case Study of China. Agriculture 2024, 14, 849. [Google Scholar] [CrossRef]
  49. Heusler, S.; Duer, W.; Ubben, M.S.; Hartmann, A. Aspects of Entropy in Classical and in Quantum Physics. J. Phys. A Math. Theor. 2022, 55, 404006. [Google Scholar] [CrossRef]
  50. Ouadfel, S.; Abd Elaziz, M. A Multi-Objective Gradient Optimizer Approach-Based Weighted Multi-View Clustering. Eng. Appl. Artif. Intell. 2021, 106, 104480. [Google Scholar] [CrossRef]
  51. Liu, K.; Xue, Y.; Chen, Z.; Miao, Y.; Shi, J. Economic Spatial Structure of China’s Urban Agglomerations: Regional Differences, Distribution Dynamics, and Convergence. Sustain. Cities Soc. 2022, 87, 104253. [Google Scholar] [CrossRef]
  52. Cui, Y.; Khan, S.U.; Deng, Y.; Zhao, M. Spatiotemporal Heterogeneity, Convergence and Its Impact Factors: Perspective of Carbon Emission Intensity and Carbon Emission per Capita Considering Carbon Sink Effect. Environ. Impact Assess. Rev. 2022, 92, 106699. [Google Scholar] [CrossRef]
  53. Gao, X. Regional Differences of China’s Foreign Direct Investment Management System: An Analysis Based on Theil Index. In Proceedings of the 2018 8th International Conference on Education and Management (ICEM 2018), Shenyang, China, 29–31 December 2018; Atlantis Press: Dordrecht, The Netherlands, 2019; pp. 482–488. [Google Scholar]
  54. He, Y.; Lin, Z.; Chen, X. Regional Difference of Water Use in a Significantly Unbalanced Developing Region. Water Policy 2020, 22, 1182–1199. [Google Scholar] [CrossRef]
  55. Yu, D. An Empirical Research on Statistical Measurement of Regional Economic Differences. In Proceedings of the 2019 4th International Conference on Financial Innovation and Economic Development (ICFIED 2019), Sanya, China, 18–20 January 2019; Atlantis Press: Dordrecht, The Netherlands, 2019; pp. 303–308. [Google Scholar]
  56. Malakar, K.; Mishra, T.; Patwardhan, A. Inequality in Water Supply in India: An Assessment Using the Gini and Theil Indices. Environ. Dev. Sustain. 2018, 20, 841–864. [Google Scholar] [CrossRef]
  57. Davis, R.A.; Lii, K.-S.; Politis, D.N. Remarks on Some Nonparametric Estimates of a Density Function. In Selected Works of Murray Rosenblatt; Davis, R.A., Lii, K.-S., Politis, D.N., Eds.; Springer: New York, NY, USA, 2011; pp. 95–100. ISBN 978-1-4419-8339-8. [Google Scholar]
  58. Senga Kiesse, T.; Corson, M.S. The Utility of Less-Common Statistical Methods for Analyzing Agricultural Systems: Focus on Kernel Density Estimation, Copula Modeling and Extreme Value Theory. Behaviormetrika 2023, 50, 491–508. [Google Scholar] [CrossRef]
  59. Minoiu, C.; Reddy, S.G. Kernel Density Estimation on Grouped Data: The Case of Poverty Assessment. J. Econ. Inequal. 2014, 12, 163–189. [Google Scholar] [CrossRef]
  60. Vermeesch, P. On the Visualisation of Detrital Age Distributions. Chem. Geol. 2012, 312–313, 190–194. [Google Scholar] [CrossRef]
  61. Dong, X.; Liu, S. Spatiotemporal Differences, Dynamic Evolution and Trend of Cultivated Land Use Efficiency: Based on Three Food Functional Areas. Heliyon 2024, 10, e27249. [Google Scholar] [CrossRef]
  62. Ou, B.-L. Moran’s I Tests for Spatial Dependence in Panel Data Models with Time Varying Spatial Weights Matrices. In Proceedings of the 2014 International Conference on Economic Management and Trade Cooperation (EMTC 2014), Xi’an, China, 12–13 April 2014. [Google Scholar]
  63. Liu, F.; Liu, C. Regional Disparity, Spatial Spillover Effects of Urbanisation and Carbon Emissions in China. J. Clean. Prod. 2019, 241, 118226. [Google Scholar] [CrossRef]
  64. Hao, L.; Zhu, Q. Spatial Structure of Regional Economic Development in Henan Province, China. In Recent Developments in Chinese Urban Planning: Selected Papers from the 8th International Association for China Planning Conference, Guangzhou, China, 21–22 June 2014; Pan, Q., Cao, J., Eds.; Springer International Publishing: Cham, Switzerland, 2015; pp. 169–181. ISBN 978-3-319-18470-8. [Google Scholar]
  65. Deng, Y.; Cui, Y.; Khan, S.U.; Zhao, M.; Lu, Q. The Spatiotemporal Dynamic and Spatial Spillover Effect of Agricultural Green Technological Progress in China. Environ. Sci. Pollut. Res. 2022, 29, 27909–27923. [Google Scholar] [CrossRef]
  66. Wang, Y.; Zhao, T.; Wang, J.; Guo, F.; Kan, X.; Yuan, R. Spatial Analysis on Carbon Emission Abatement Capacity at Provincial Level in China from 1997 to 2014: An Empirical Study Based on SDM Model. Atmos. Pollut. Res. 2019, 10, 97–104. [Google Scholar] [CrossRef]
  67. Reddy, A.A.; Bhattacharya, A.; Reddy, S.V.; Ricart, S. Farmers’ Distress Index: An Approach for an Action Plan to Reduce Vulnerability in the Drylands of India. Land 2021, 10, 1236. [Google Scholar] [CrossRef]
  68. Dardonville, M.; Urruty, N.; Bockstaller, C.; Therond, O. Influence of Diversity and Intensification Level on Vulnerability, Resilience and Robustness of Agricultural Systems. Agric. Syst. 2020, 184, 102913. [Google Scholar] [CrossRef]
  69. Quendler, E.; Morkunas, M. The Economic Resilience of the Austrian Agriculture since the EU Accession. J. Risk Financ. Manag. 2020, 13, 236. [Google Scholar] [CrossRef]
Figure 1. Agricultural economic resilience development levels in various regions of china from 2013 to 2022.
Agriculture 14 01522 g001
Figure 2. Visualization of agricultural economic resilience development levels in various regions of China from 2013 to 2022.
Agriculture 14 01522 g002
Figure 3. Three-dimensional kernel density evolution map of China and its eastern, central, and western regions from 2013 to 2022.
Agriculture 14 01522 g003
Figure 4. Local Moran scatter plots for the years 2013, 2016, 2019, and 2022.
Agriculture 14 01522 g004
Table 1. Evaluation indicator system for agricultural economic resilience in China.
Primary IndicatorSecondary IndicatorExplanationIndicator PropertiesWeight
Resistance (P)Ability of agriculture to resist disastersAgricultural disaster-affected area/total cropped area of crops0.0043
Power of agricultural machinery per unit areaTotal power of agricultural machinery/total cropped area of crops+0.0385
Total agricultural outputTotal output value of the primary industry+0.0558
Number of rural residents engaged in agricultureNumber of people primarily engaged in agricultural-related work in rural areas+0.0195
Grain yield per unit of cultivated landTotal grain production/total area planted with grain crops+0.0215
Disposable income per capita in rural areasReflects the level of income that rural residents’ households can freely dispose of over a certain period+0.0354
Rural living guarantee expenditureGovernment and societal investment in basic living security for rural residents0.0107
Adaptation (S)Fertilizer usage intensityAmount of chemical fertilizer used in agriculture/total cropped area for agricultural crops0.0106
Intensity of agricultural plastic film usageAmount of agricultural plastic film used/total cropped area for agricultural crops0.0064
Number of rural health clinics per ten thousand peopleRural population count/number of rural health clinics+0.0507
Effective irrigation rateEffective irrigated area/total cropped area for agricultural crops+0.0399
Per capita consumption expenditure in rural areasAverage annual expenditure per capita on goods and services in rural areas+0.0362
Per capita grain yieldTotal grain production/total population of the region+0.0645
Innovation (R)Fixed asset investment in agricultureTotal investment by rural residents in purchasing, constructing, and renovating agricultural fixed assets+0.0697
Application and authorization of new plant variety rights in agricultureBreeding and discovery of new varieties in agriculture+0.1063
Number of valid patents domesticallyThe number of patents still valid in China+0.1496
Number of township cultural stations per ten thousand peopleRural population count in the region/number of township cultural stations in the region+0.0409
Per capita electricity consumption in rural areasTotal electricity consumption in rural areas of the region/rural population of the region+0.2394
Note: The main sources of data are the China Rural Statistical Yearbook, the China Science and Technology Statistical Yearbook, and the Peking University Digital Financial Inclusion Index.
Table 2. Intra-regional Theil index and contribution to the level of resilient development of China’s agricultural economy, 2013–2022.
YearIntra-Regional DifferenceContribution Rate of Intra-Regional Difference
Total DifferenceEastCentralWestContribution Rate of Total DifferenceEastCentralWest
20130.034750.021730.006930.0060864.18%40.14%12.80%11.23%
20140.032640.021520.006780.0043562.69%41.32%13.03%8.35%
20150.029570.019000.006430.0041558.62%37.66%12.74%8.22%
20160.030670.018950.006810.0049157.08%35.26%12.68%9.14%
20170.034780.020720.008580.0054861.22%36.48%15.10%9.65%
20180.035230.021300.008060.0058863.26%38.24%14.47%10.56%
20190.034900.020870.008610.0054262.44%37.33%15.40%9.70%
20200.038290.021590.010700.0060063.64%35.89%17.78%9.98%
20210.030010.011790.010630.0076069.56%27.32%24.63%17.61%
20220.030870.012980.008990.0088969.15%29.08%20.15%19.92%
Mean0.033170.019040.008250.0058863.18%35.87%15.88%11.44%
Table 3. Overall Theil index and inter-regional contribution to the level of resilient development of China’s agricultural economy, 2013–2022.
YearOverall Theil IndexInter-Regional DifferenceContribution Rate of Inter-Regional Difference
20130.054150.0194035.82%
20140.052070.0194337.31%
20150.050440.0208741.38%
20160.053740.0230642.92%
20170.056800.0220338.78%
20180.055690.0204636.74%
20190.055900.0210037.56%
20200.060170.0218836.36%
20210.043140.0131330.44%
20220.044630.0137730.85%
Mean0.052670.0195036.82%
Table 4. Moran’s I index of agricultural economic resilience in China from 2013 to 2022.
YearMoran’s Ip-ValueZ-Value
20130.15230.00005.2346
20140.16030.00005.4121
20150.15770.00005.3065
20160.15850.00004.3319
20170.12390.00003.5678
20180.09640.00043.3506
20190.08840.00082.9614
20200.07420.00312.5842
20210.06010.00982.5842
20220.03510.05591.9115
Table 5. LM, LR, Wald, and Hausman test results.
Inspection IndexTest MethodStatisticp-Value
LM testRobust LM no test spatial lag31.1450.000
Robust LM no test spatial error4.5640.033
Wald testWald test for SAR14.570.0239
Wald test for SEM13.120.0412
LR testLR test for SAR14.160.0279
LR test for SEM12.800.0463
Hausman testHausman test13.330.0381
Table 6. Regression results of spatial Dubin model under different effects.
IndTimeBoth
Main
APE0.0497 *** (15.44)0.0859 *** (23.94)0.0518 *** (14.99)
UL0.121 * (2.11)0.115 *** (4.91)0.118 * (2.06)
AM0.0130 (1.90)0.0121 *** (6.92)0.00905 (1.32)
ACS−0.0244 * (−1.99)−0.0372 *** (−3.55)−0.0214 (−1.77)
NC−0.00583 (−1.38)−0.00768 (−1.28)−0.00651 (−1.55)
AEA0.00104 (0.60)0.00471 *** (5.12)0.00100 (0.56)
Wx
APE0.0118 (0.57)0.127 *** (3.80)0.0699 * (2.26)
UL0.269 * (2.34)0.998 *** (6.32)0.611 (1.63)
AM0.00996 (0.43)0.0794 *** (6.28)0.0747 * (2.01)
ACS0.133 * (1.98)−0.0501 (−1.01)0.155 * (2.24)
NC−0.00413 (−0.33)−0.00921 (−0.26)−0.0258 (−1.07)
AEA−0.00249 (−0.36)−0.0343 *** (−5.09)−0.00354 (−0.26)
Spatial autoregression coefficient0.125 (0.75)−0.645 ** (−2.58)−0.410 (−1.72)
Spatial error factor0.000126 *** (12.24)0.000282 *** (12.26)0.000117 *** (12.21)
R 2 0.8360.8820.784
Note: The symbols *, **, and *** denote significance at the 5%, 1%, and 0.1% levels, respectively. The standard error is indicated in (). APE denotes agricultural production efficiency, UL denotes urbanization level, AM denotes agricultural mechanization, ACS denotes Agricultural Cropping Structure, NC denotes Natural Condition Severity, and AEA denotes Agricultural Export Amount.
Table 7. Decomposition of spatial effects based on geographic distance weight matrices.
VariablesDirectIndirectTotal
APE0.0509 *** (0.00346)0.0349 * (0.0180)0.0858 *** (0.0184)
UL0.101 * (0.0529)0.385 * (0.228)0.486 ** (0.203)
AM0.00841 (0.00773)0.0505 * (0.0288)0.0589 ** (0.0252)
ACS−0.0235 * (0.0135)0.118 ** (0.0543)0.0947 * (0.0549)
NC−0.00697 (0.00500)−0.0154 (0.0202)−0.0223 (0.0200)
AEA0.00112 (0.00168)−0.00202 (0.0110)−0.000900 (0.0114)
Note: The symbols *, **, and *** denote significance at the 10%, 5%, and 1% levels, respectively. The standard error is indicated in (). APE denotes agricultural production efficiency, UL denotes urbanization level, AM denotes agricultural mechanization, ACS denotes Agricultural Cropping Structure, NC denotes Natural Condition Severity, and AEA denotes Agricultural Export Amount.
Table 8. Decomposition of spatial effects based on geographic proximity weight matrices.
VariablesDirectIndirectTotal
APE0.0508 *** (0.00329)0.0163 ** (0.00807)0.0670 *** (0.00911)
UL0.113 ** (0.0494)0.147 (0.127)0.260 ** (0.113)
AM0.0196 *** (0.00739)−0.0104 (0.0145)0.00923 (0.0124)
ACS−0.0373 *** (0.0139)0.0767 ** (0.0300)0.0394 (0.0306)
NC−0.00642 (0.00481)−0.0178 (0.0123)−0.0243 * (0.0132)
AEA0.00164 (0.00171)0.00300 (0.00510)0.00464 (0.00591)
Note: The symbols *, **, and *** denote significance at the 10%, 5%, and 1% levels, respectively. The standard error is indicated in (). APE denotes agricultural production efficiency, UL denotes urbanization level, AM denotes agricultural mechanization, ACS denotes Agricultural Cropping Structure, NC denotes Natural Condition Severity, and AEA denotes Agricultural Export Amount.
Disclaimer/Publisher’s Note: The statements, opinions and data contained in all publications are solely those of the individual author(s) and contributor(s) and not of MDPI and/or the editor(s). MDPI and/or the editor(s) disclaim responsibility for any injury to people or property resulting from any ideas, methods, instructions or products referred to in the content.

