Article

Effect of A PLC-Based Drinkers for Fattening Pigs on Reducing Drinking Water Consumption, Wastage and Pollution

1
Chongqing Academy of Animal Sciences, Chongqing 402460, China
2
National Center of Technology Innovation for Pigs, Chongqing 402460, China
*
Author to whom correspondence should be addressed.
Agriculture 2024, 14(9), 1525; https://doi.org/10.3390/agriculture14091525
Submission received: 30 July 2024 / Revised: 21 August 2024 / Accepted: 2 September 2024 / Published: 4 September 2024
(This article belongs to the Section Farm Animal Production)

Abstract

:
In this study, we propose an intelligent drinking water controller based on programmable logic controller (PLC) specifically designed for pig breeding, which significantly reduces the water waste caused by the use of traditional drinking bowls by regulating the frequency and flow of water release. In addition, the drinking water system has a tracking and recording function, which can record the frequency and duration with which fattening pigs drink water in each pen in detail, thus providing farmers with a wealth of pig health and behavior data to help optimize breeding management decisions. In order to deeply analyze the effects of the intelligent drinking water controller on the growth, resources environment and economic benefits of fattening pigs under the condition of large-scale breeding, a single factor comparison experiment was designed.In this experiment, 84 fattening pigs were selected and distributed in 12 pens. Among them, six pens were randomly designated as the control group;the pig in this group used ordinary drinking water bowls for the water supply. The other six pens were designated as the experimental group;the pigs in this group used the intelligent drinking water controller. The experimental results showed that in the experimental group with the intelligent drinking water controller, the average daily water waste per finishing pig was only 0.186 L (p < 0.05), accounting for only 25.98% of the average daily water waste per pig in the control group (p < 0.05). In terms of water quality, the intelligent drinking water controller also showed better performance, and the performance indicators were effectively reduced, with the highest reduction reaching 39.86%, which greatly reduced water pollution. Compared with the traditional drinking bowl, the average daily weight increment of fattening pigs in the pen using the intelligent drinking water controller was increased by 0.02 kg. In terms of long-term benefits, the PLC-based intelligent drinking water controller significantly improves the economic returns of the farm and has a positive impact on pig health. The high frequency data collection of the pigs’ drinking habits through the intelligent drinking water controller can also provide data support for the subsequent establishment of a pig water-drinking behavior analysis model.

1. Introduction

The intelligent mode of factory pig farming has become an inevitable trend in the development of China’s pig industry [1]. With the progress of information technology and the normalization of African swine fever, traditional retail farming has been gradually eliminated, and the domestic pig farming industry is undergoing a transformation from the traditional model to the intelligent and large-scale model [2]. It is expected that by 2025, the proportion of large-scale farming will exceed 78%, and the total output value is expected to reach more than CNY 1.5 trillion. The modern pig industry is currently undergoing a major transformation: in addition to improving animal welfare standards, the focus is on improving the production of safe and high-quality pork using climate-and resource-friendly production systems. Compared with countries with more advanced pig breeding technology, China’s pig breeding industry faces great challenges such as high production costs, low annual sow productivity and the low use efficiency of information equipment [3,4].
In the efficient management of animal husbandry, it is crucial to ensure that the drinking water demand of finishing pigs is met to ensure animal welfare. An insufficient water supply will lead to reduced feed intake, which will further affect production performance and feed efficiency [5]. At the same time, at high temperatures, the higher the relative humidity, the more difficult it is for pigs to regulate their body temperature [6,7]. Since pigs have less sweat in their skin, they can regulate their body temperature by finding other cooling methods [8] or panting [9].
According to Tierschutznutztierhaltungsverordnung(TierSchNutztV) [10], guiding principles such as body weight (BW) and feed consumption (FC) and key variables such as environment temperature, need to be taken into account for the maintenance of pig health. Schiavon [9] and Gill [10] have deduced the equation for calculating the water requirement of finishing pigs, proving the importance of meeting the drinking water demand of pigs for improving pig welfare farming.
Animal husbandry accounts for about 29% of the total water consumption in China, and drinking water for livestock and poultry accounts for 27% [11,12]. In particular, the pig behaviors of drinking water and playing with water lead to serious water waste increase the cost of fecal sewage treatment [13,14]. Therefore, reducing the waste of water caused by pigs is of great significance to the farming industry. Studies have shown that the type of water fountain and an unlimited water supply are important factors for drinking water and water waste in pigs [15]. The existing research often uses a PLC to realize various control systems. Smith et al. developed an intelligent irrigation system based on a PLC to optimize water resource utilization and improve irrigation management efficiency through the automatic regulation and monitoring of water quality [16]. Martinez et al. introduced an intelligent control system for drinking water treatment combining PLC and SCADA, and discussed the system architecture, control strategy and user interface design in detail [17].
However, at present, less attention has been paid to the research on pigs’ drinking water welfare and the application of PLC technology in intelligent water supply systems. This study proposed an intelligent drinking water controller based on a PLC, which realized the analysis of pigs’ water-drinking behavior through automatic control technology and a data recording module, and designed a single factor comparative test from the physical properties of drinking water equipment and the two dimensions of pigs’ drinking water behavior, aiming to prove the advantages of an intelligent drinking water controller on reducing water consumption, waste water and water pollution in pig farms. It provides a practical and effective reference for the transformation of China’s pig industry to the adoption of green, efficient and intelligent operations, and the construction of intelligent pig factories [18,19].

2. Materials and Methods

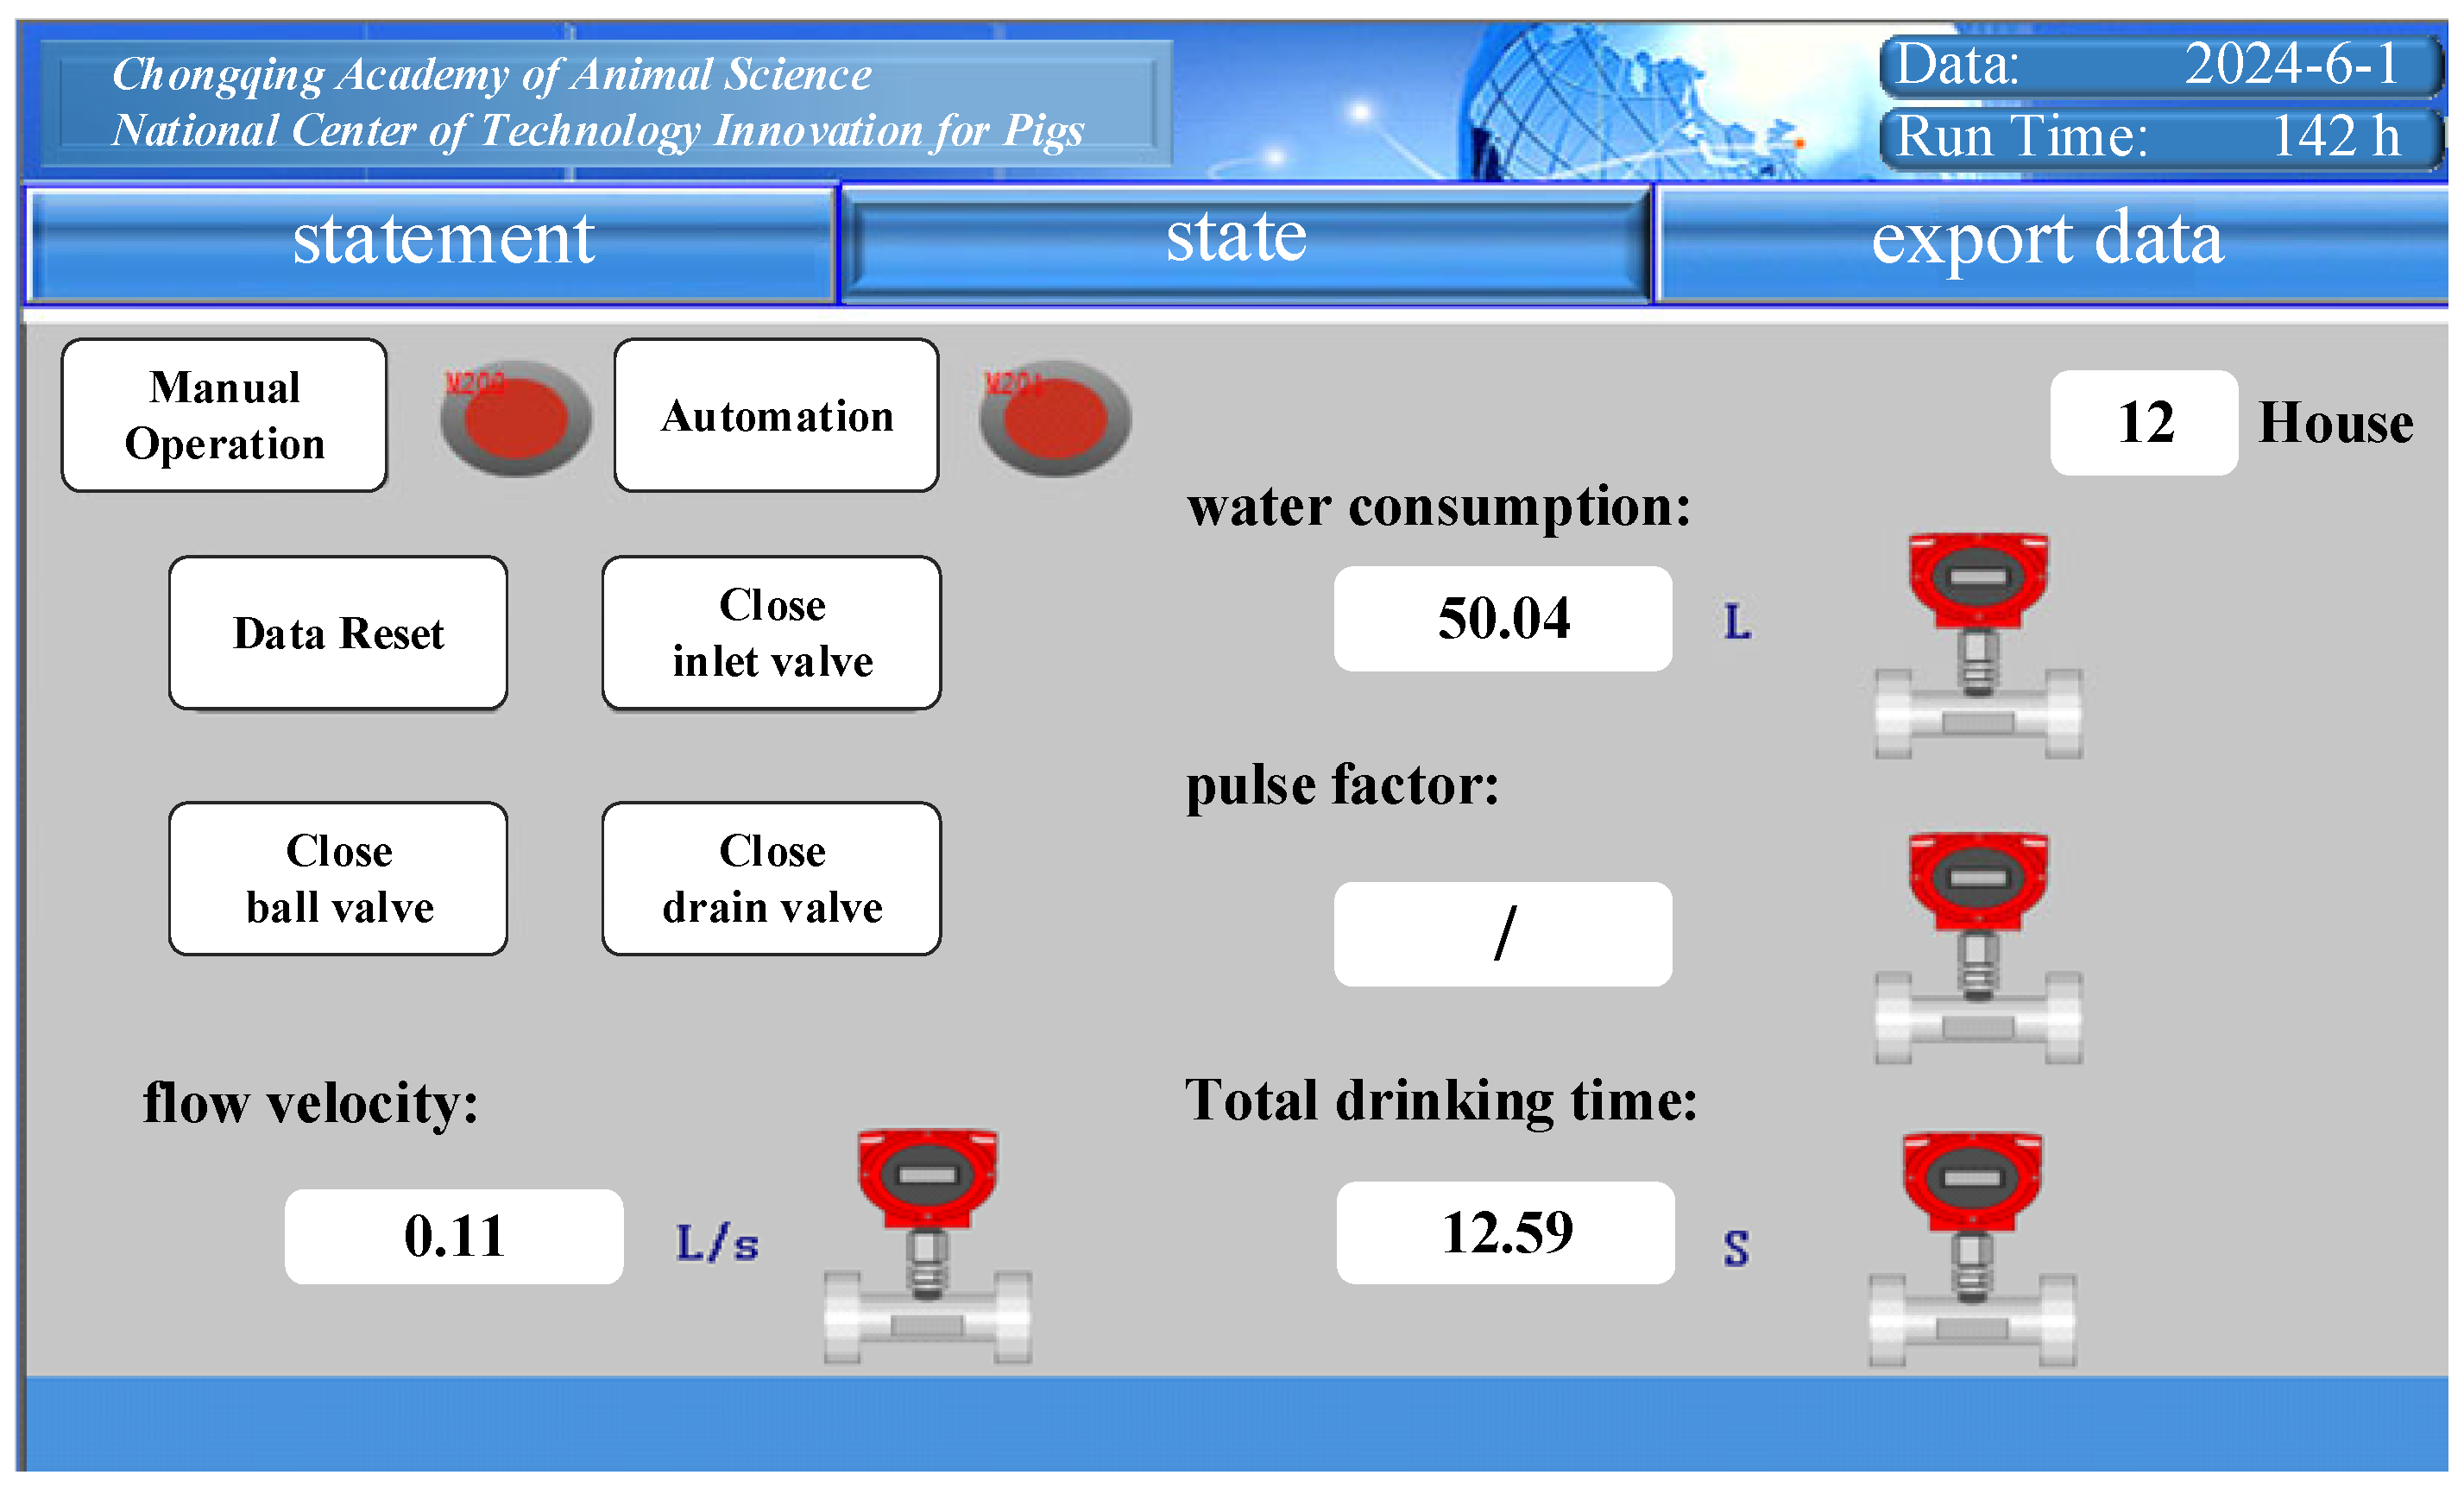
2.1. Intelligent Drinking Water Controller Based on PLC

The intelligent drinking water controller based on the PLC proposed in this paper is mainly composed of drinking water bowl module and a PLC. The PLC adopts SIMATIC S7-200 SMART CPUST20 owned by Siemens of Germany, and the software version number is v2.6. The drinker identifies the water level in the drinking bowl and the drinking behavior of the pig through various sensors and converts it into an electrical signal for transmission to the PLC. The main control unit of the PLC acts as the “brain” of the whole system to receive various signals, and gives corresponding control instructions to the discharge valve, solenoid valve, and other executive components according to the set program [20].

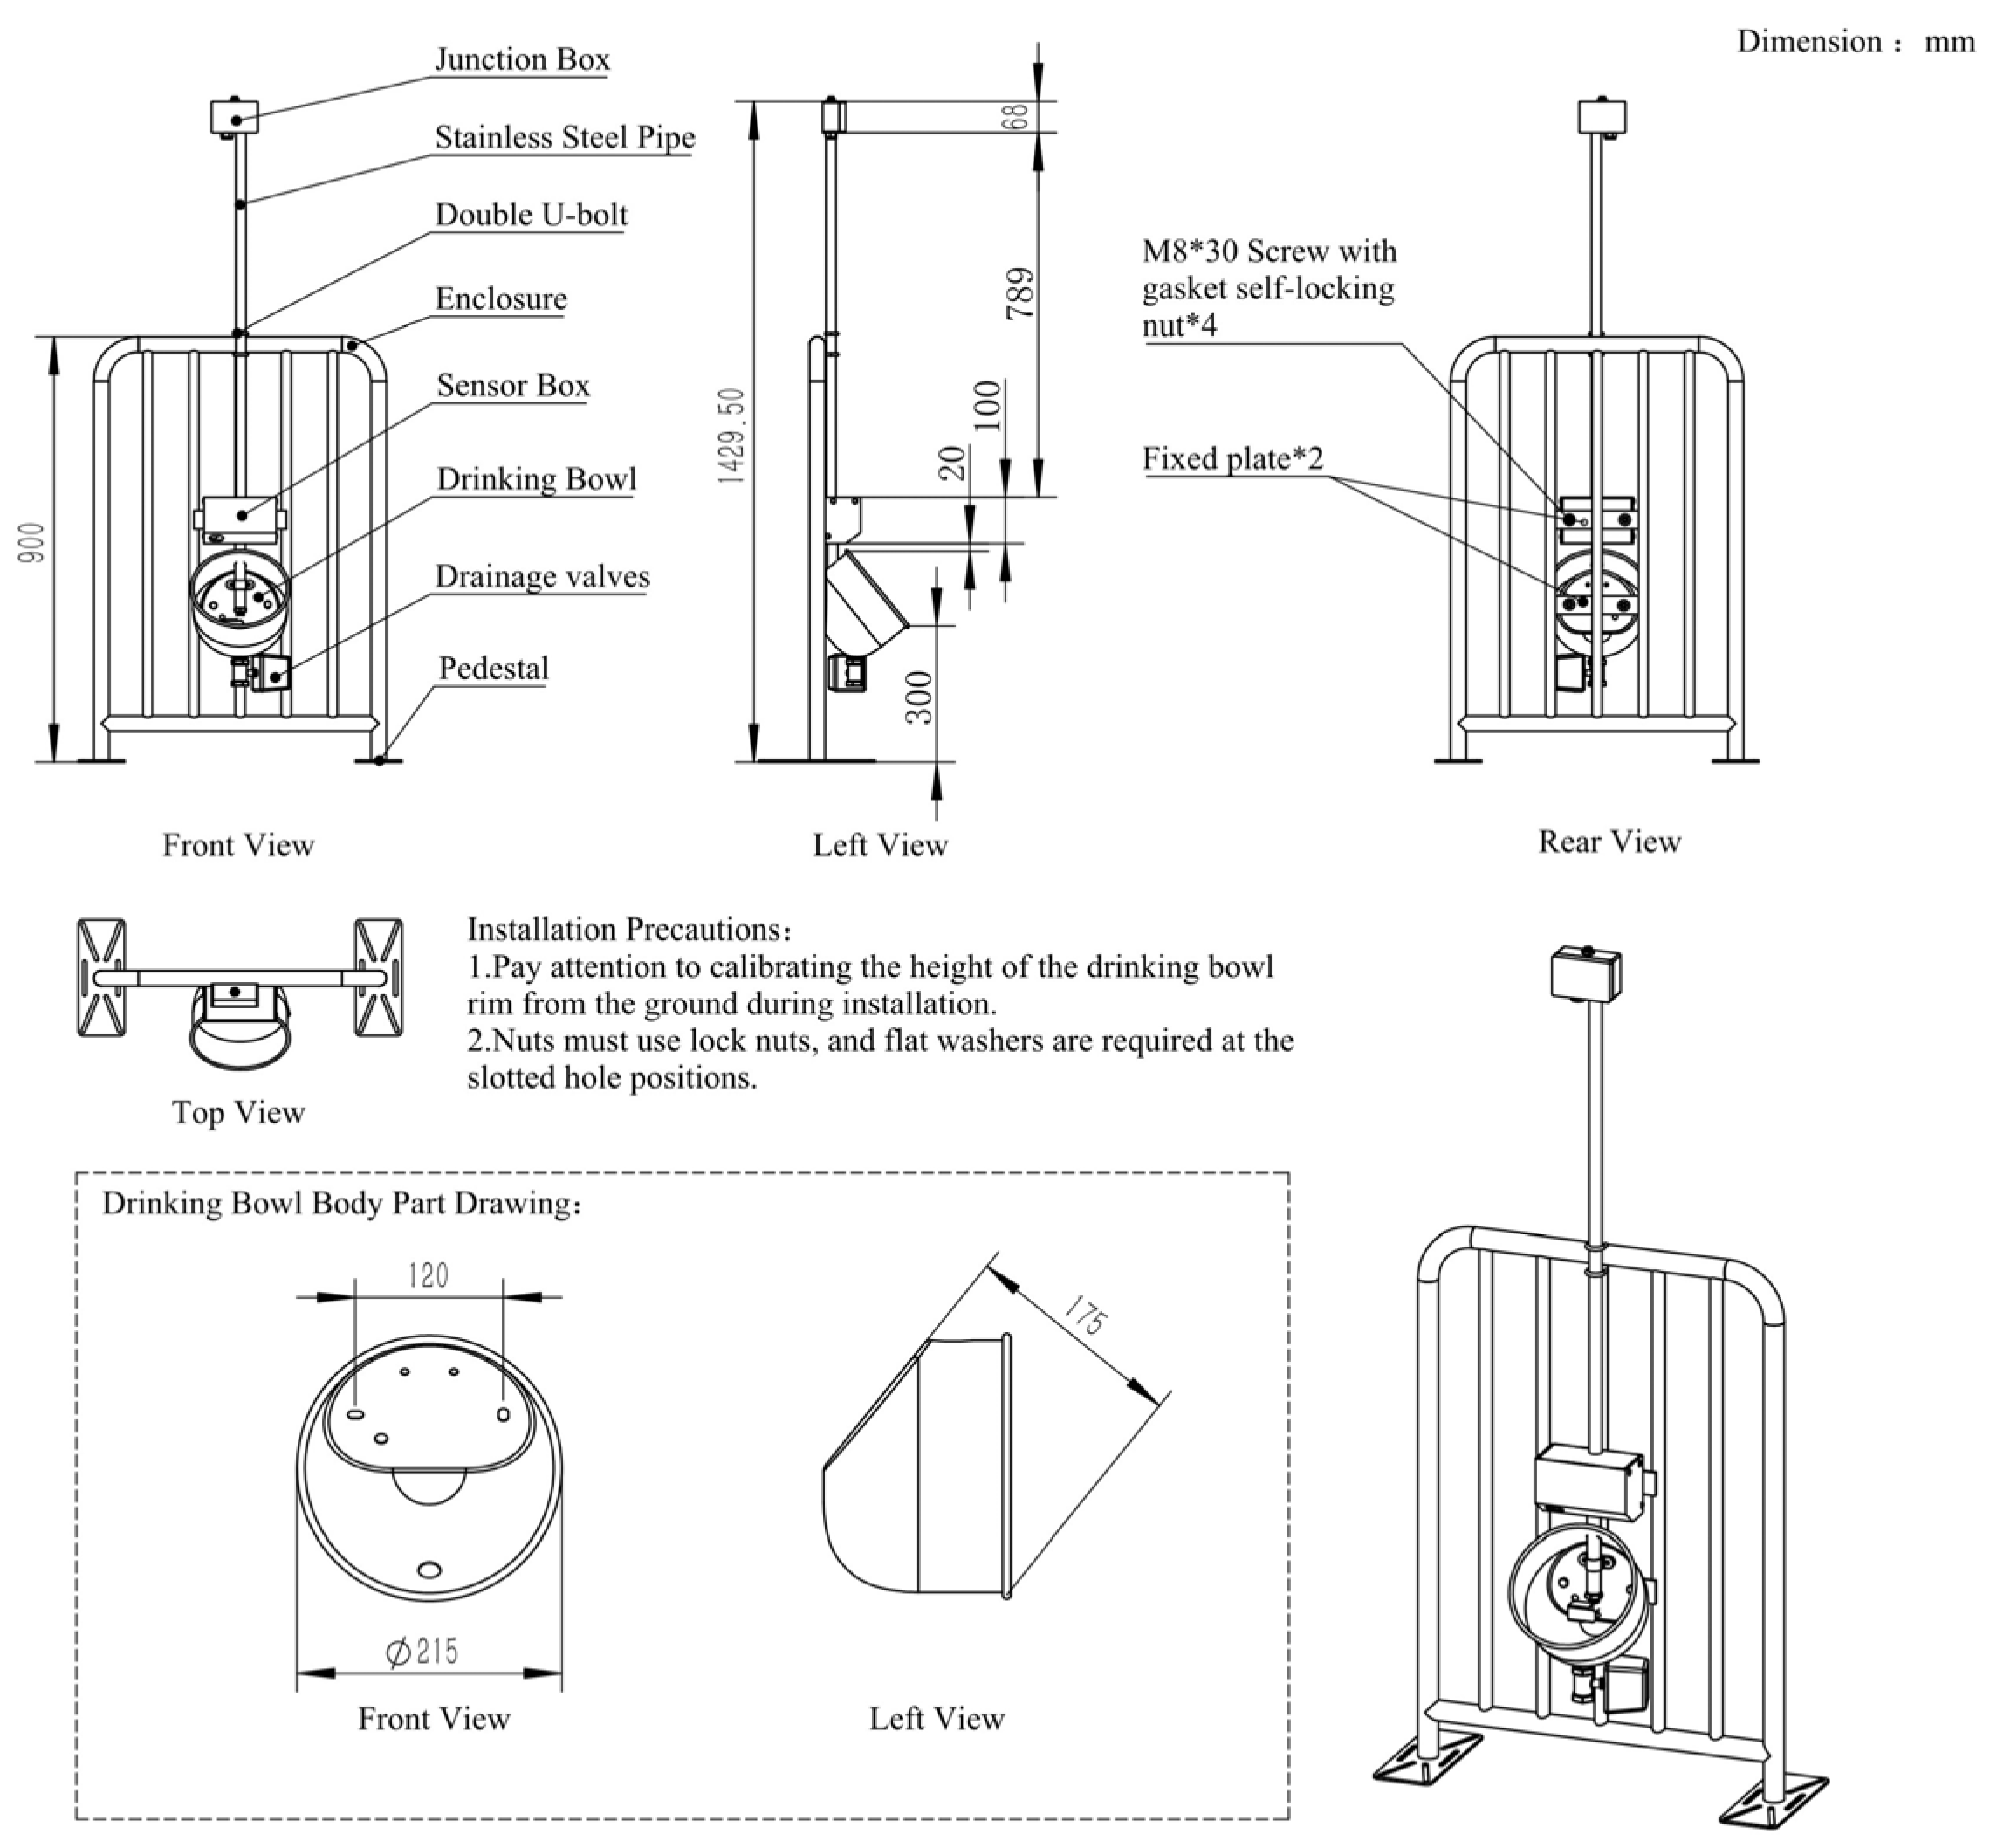
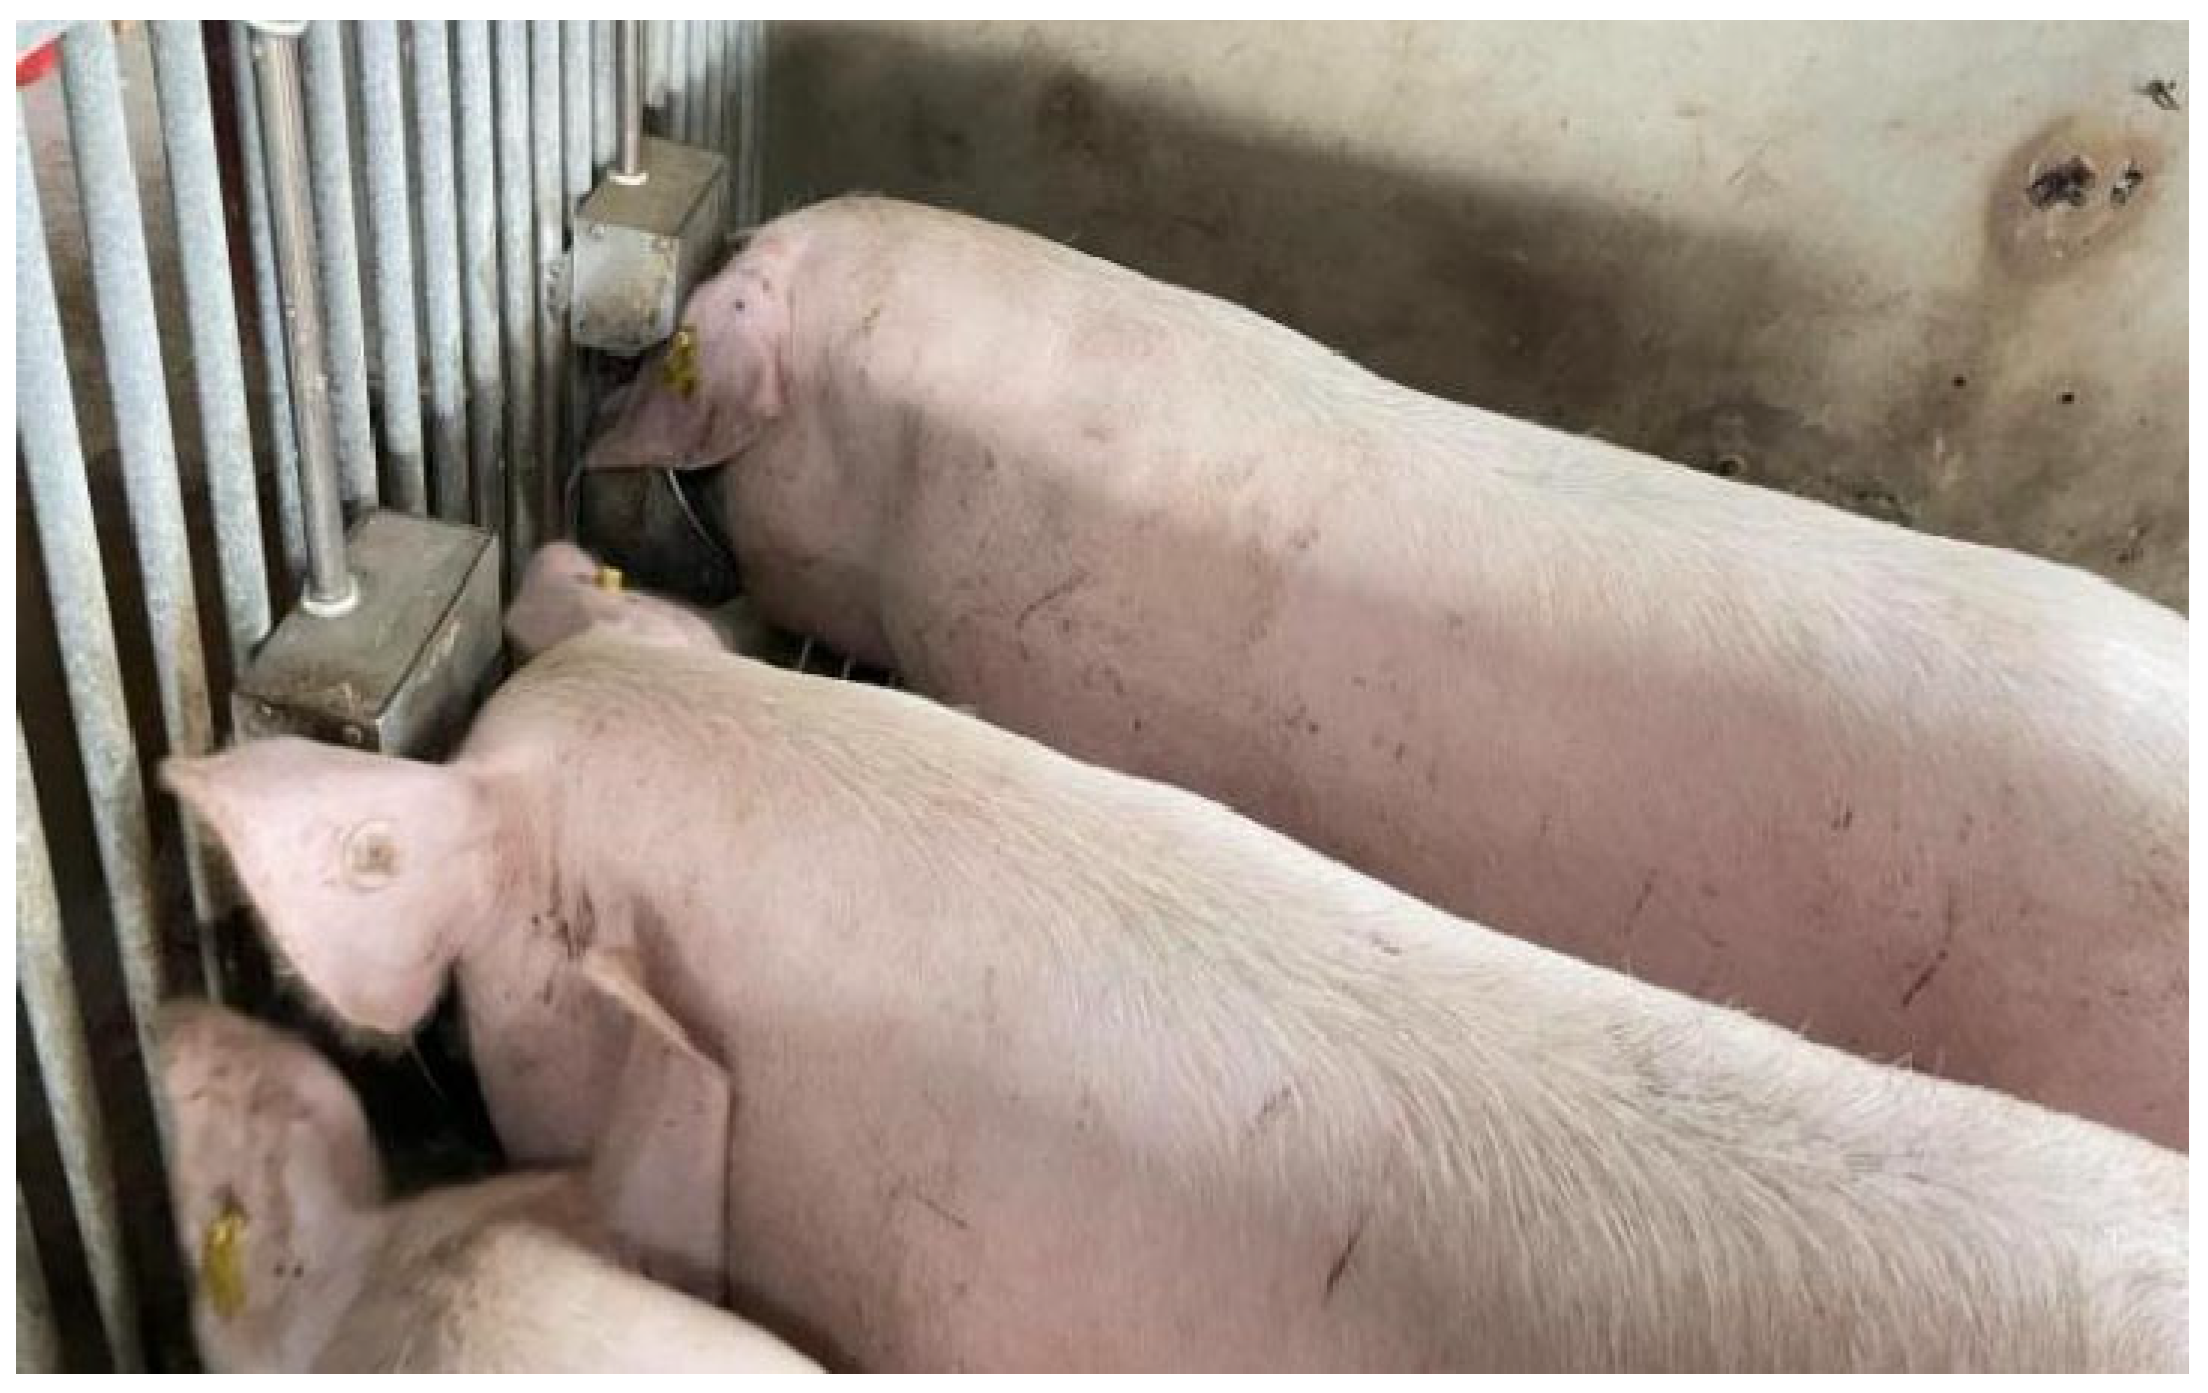
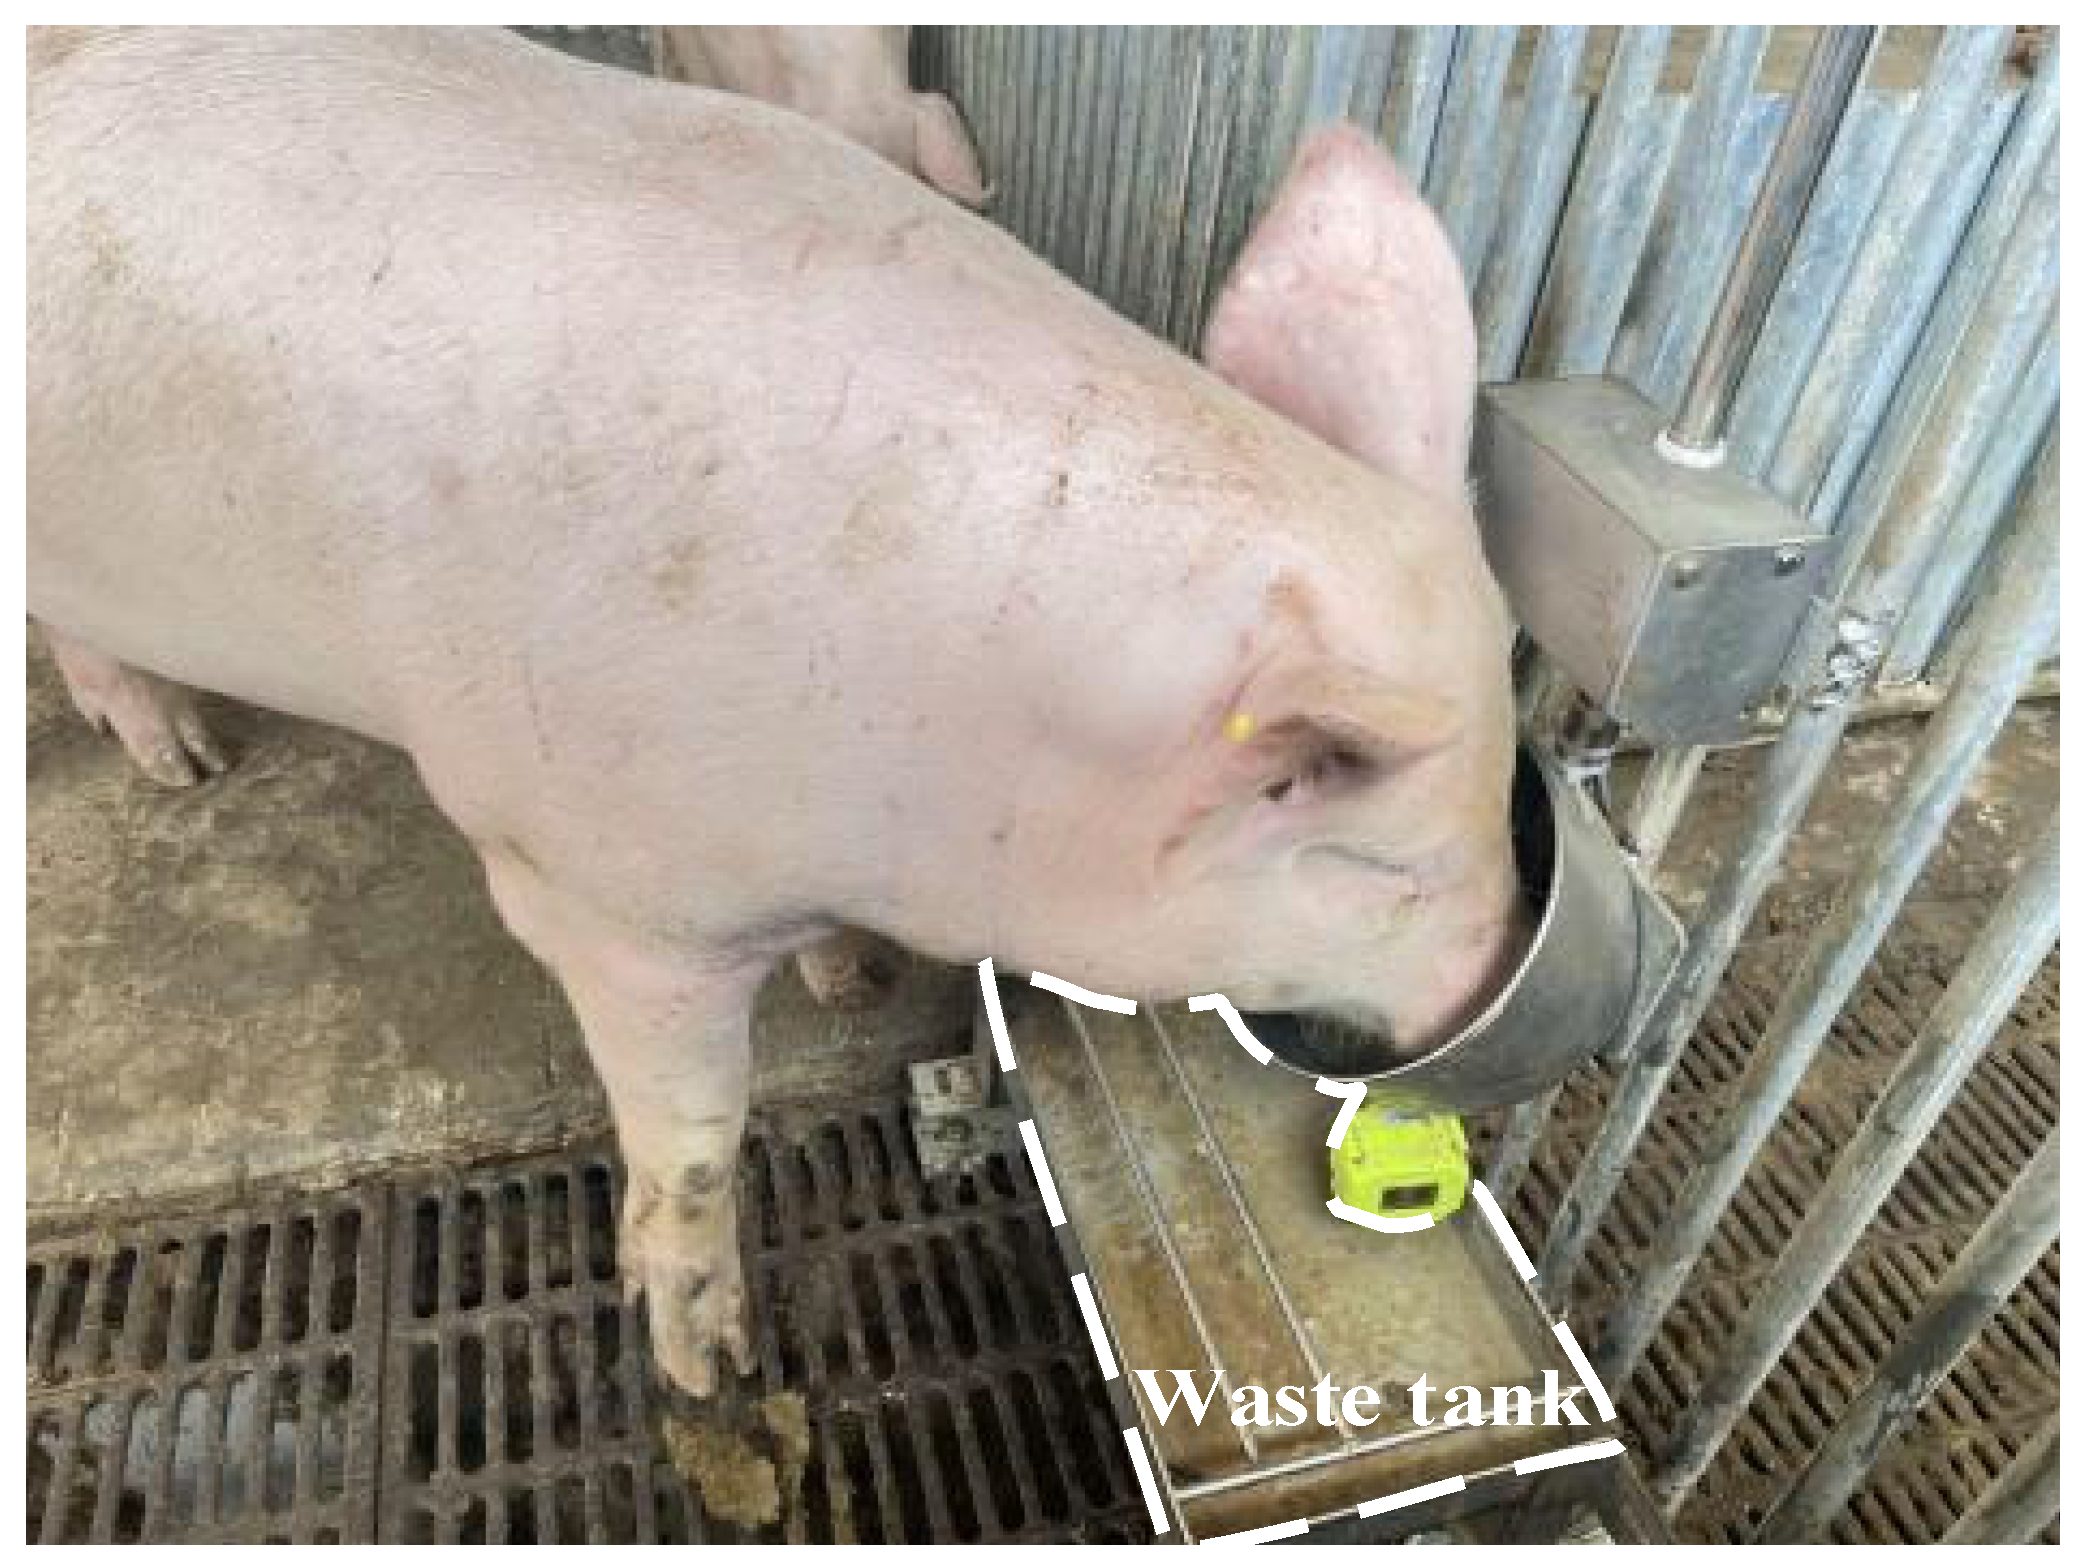
2.1.1. Drinking Bowl Module

Each drinker is equipped with a variety of sensors as input devices, which can monitor the water level, water consumption and drinking behavior of pigs in real time [21]. The structure of the drinker is shown in Figure 1, and the design standard of the drinker in Figure A1 is shown in the Appendix A.
The top of the round drinking bowl is welded and fixed and equipped with a variety of sensors, which is one of the core components of the entire intelligent drinking device. Its design draws on the principle of bionics [22] and is made of 304 stainless steel with a diameter of 215 mm and a wall thickness of 1.5 mm [23], as shown in Figure 2.
  • The drinker is composed of a water level detection module, pig water-drinking behavior identification module, water consumption detection module, water pressure regulation module and drainage module.
  • Water level detection module:
The water level detection module consists of a sensor mounting base and a water level sensor. When the water level reaches the preset height, the water level sensor is triggered and the signal is sent to the PLC system, which then issues the stop water instruction. The water level sensor is high (5–24 V) when triggered and low (0 V) when there is no water and has a response time of less than 1 s.
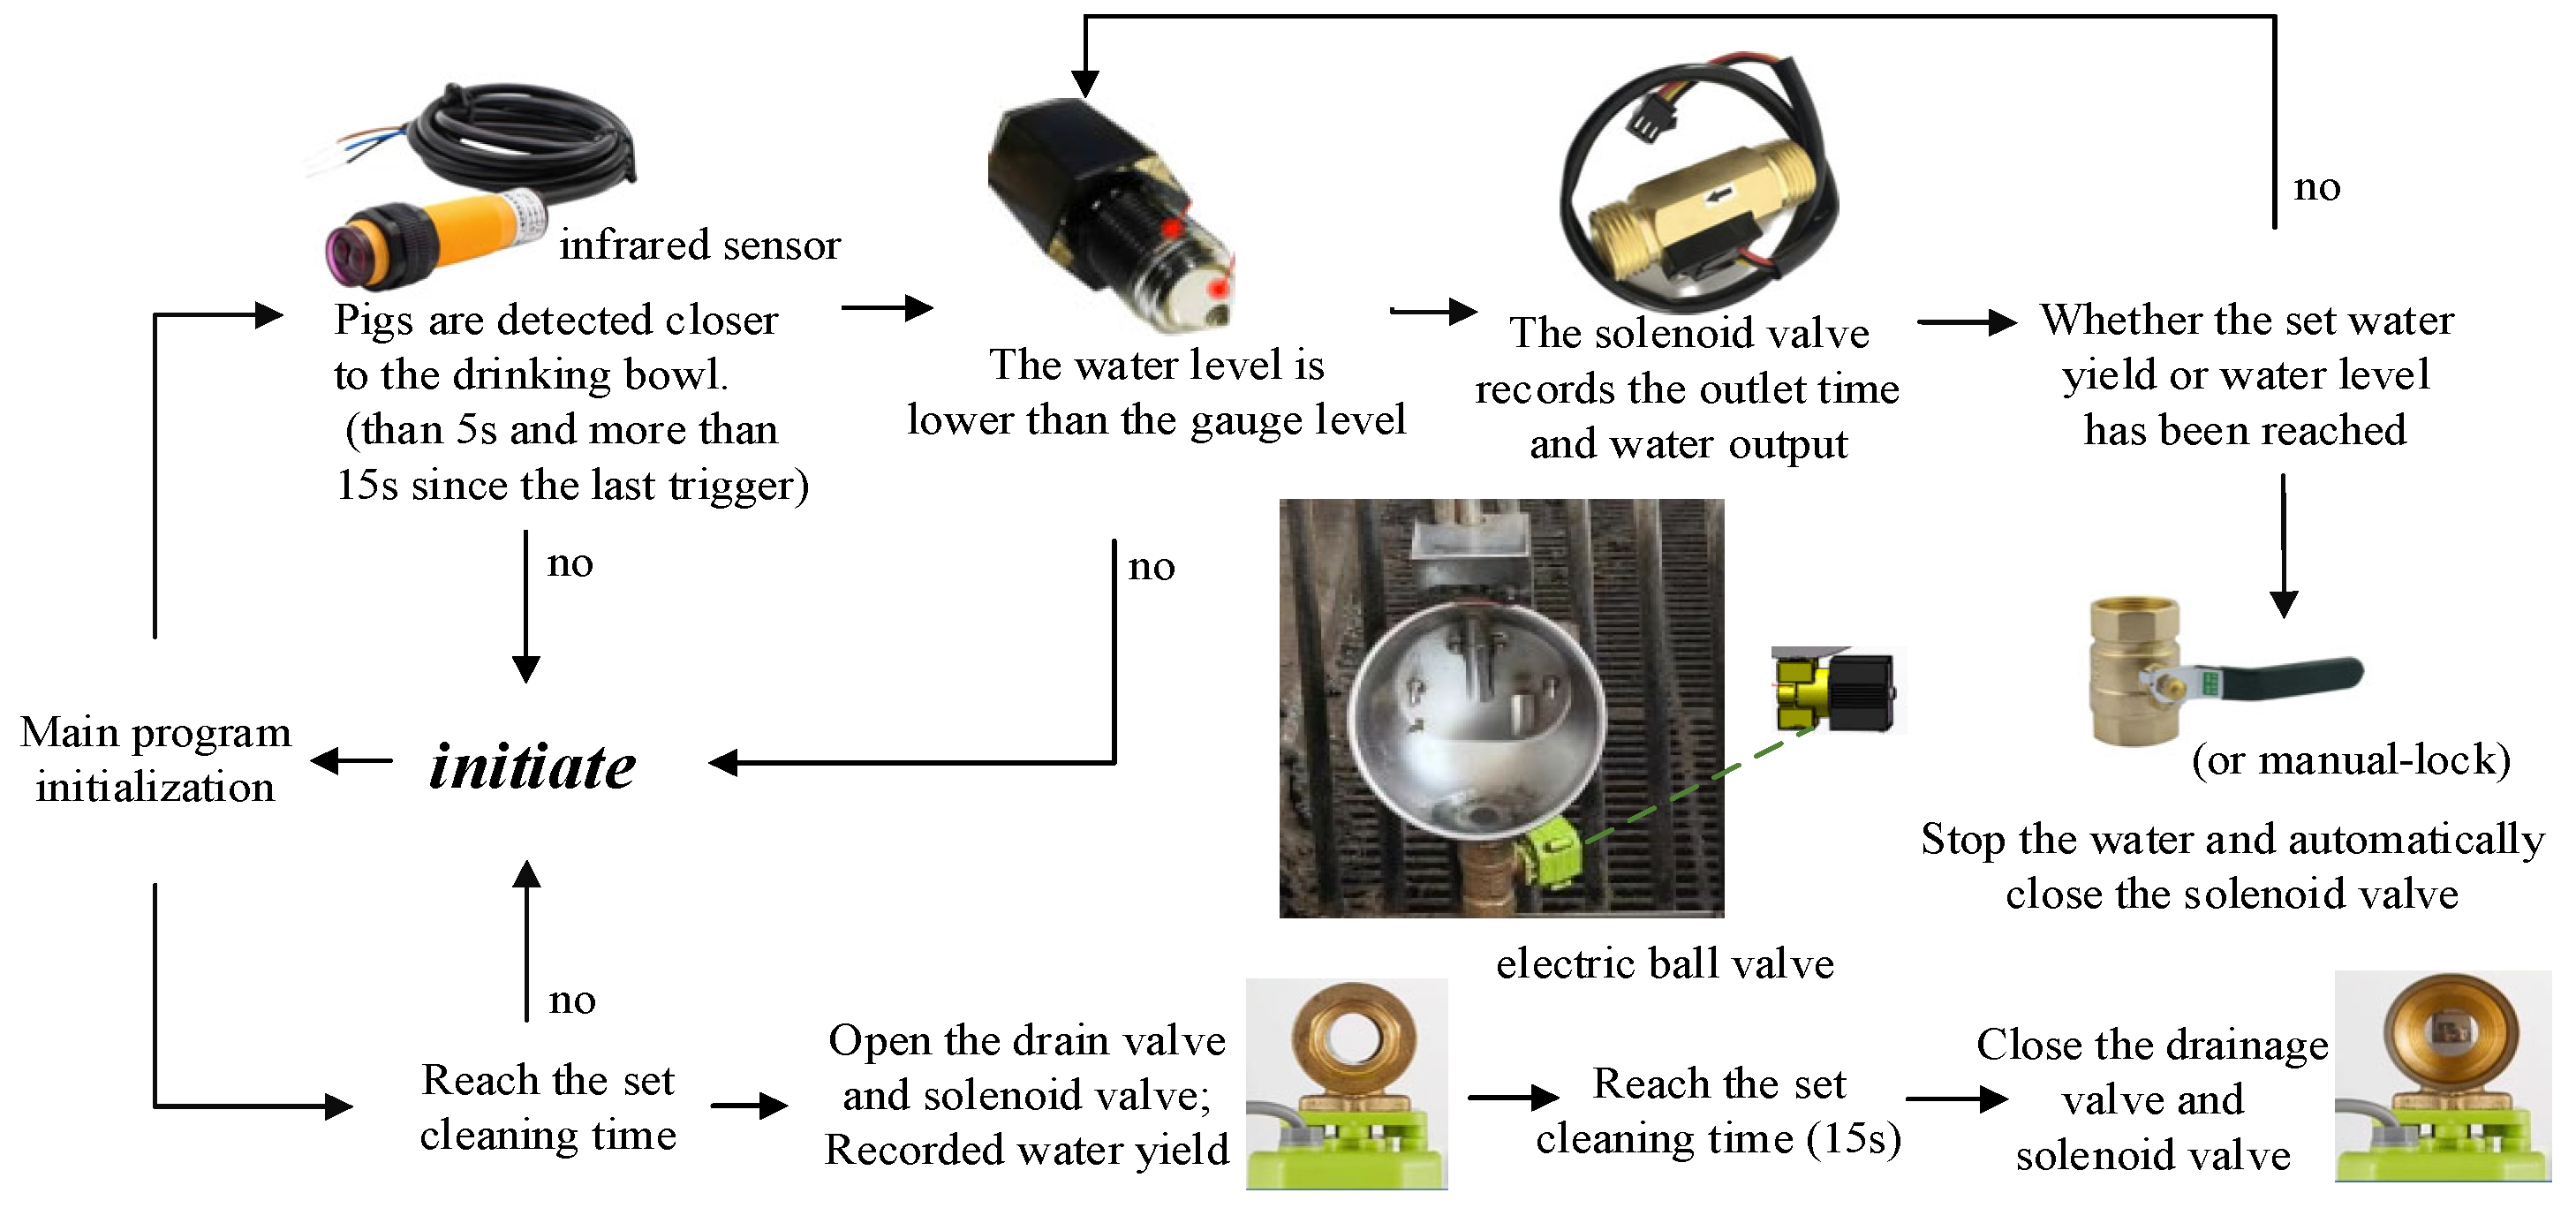
  • Pig water-drinking behavior identification module:
The pig water-drinking behavior identification module is composed of infrared photoelectric sensors, sensor protective cover and solenoid valve. The photoelectric sensors identify the reflected signal to determine if the pig is approaching. Once a pig is detected, the photoelectric sensor feeds the signal back to the PLC for processing. If the water conditions are met, the PLC will send a signal to the solenoid valve to open the water release, and the response time is less than 2 ms to ensure that the pig’s drinking action is quickly identified.
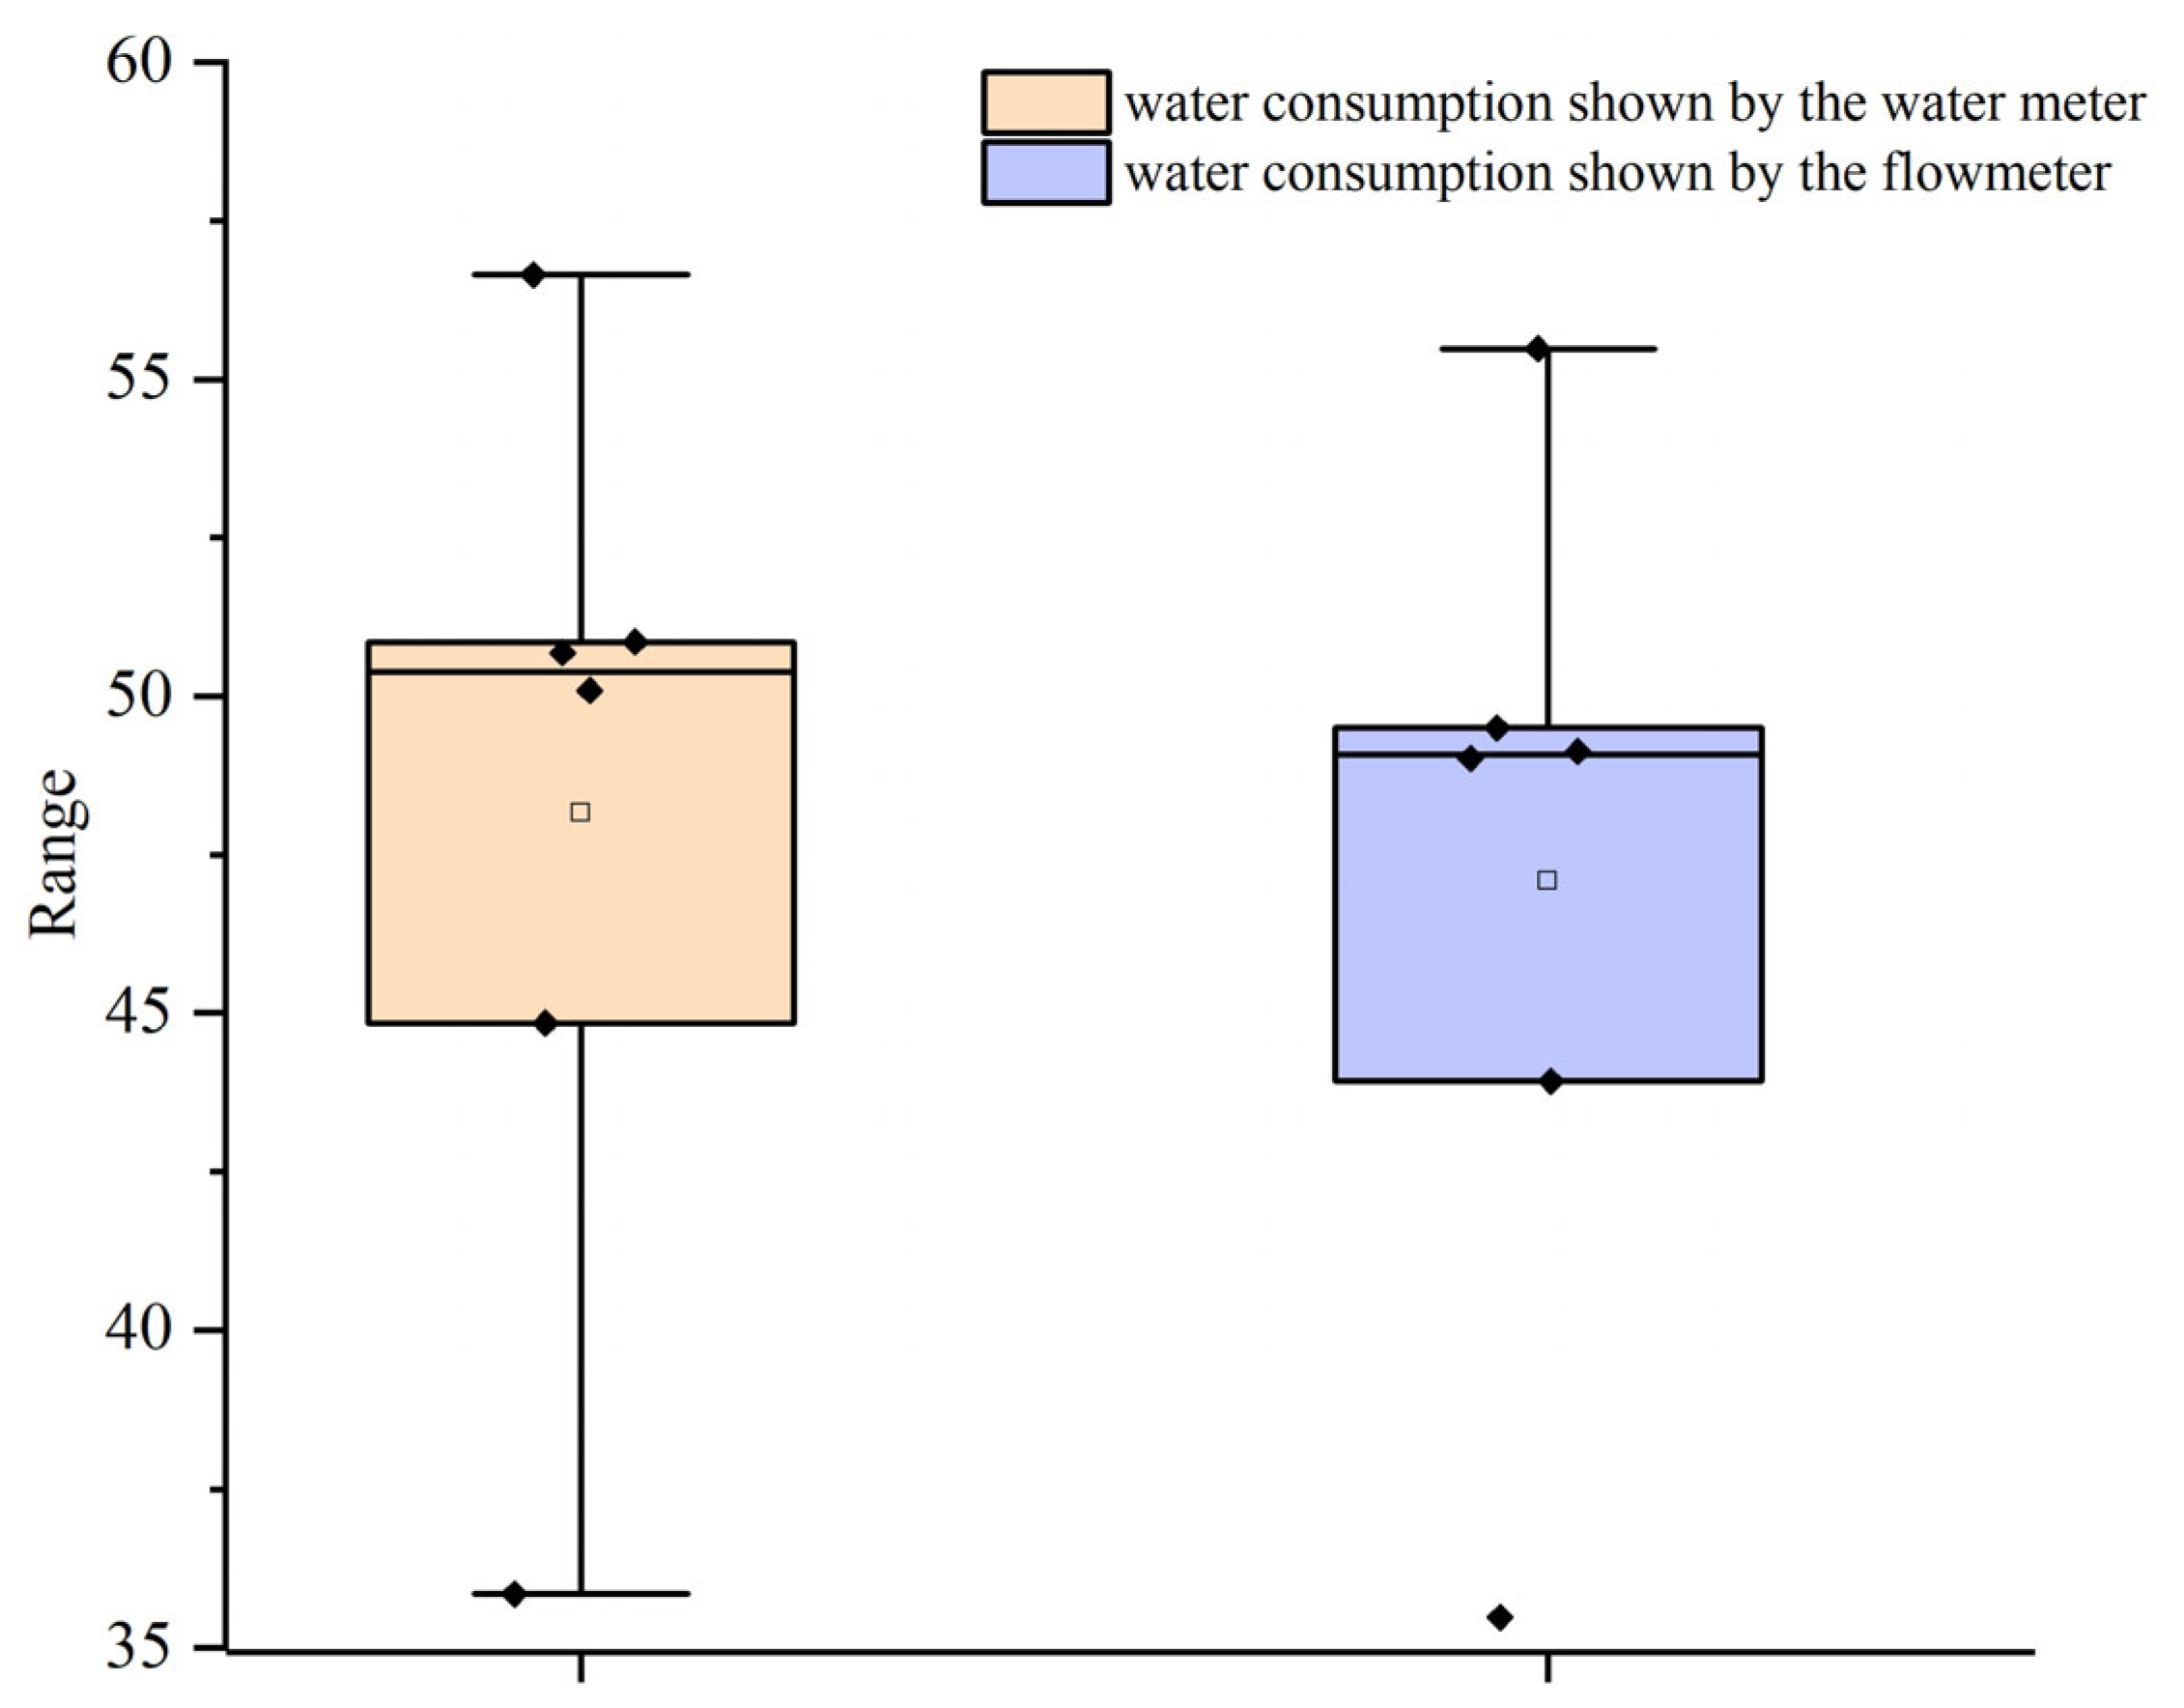
  • Water consumption detection module:
The water consumption detection module mainly includes the Hall water flow sensor. When the water flows through the pipe, it turns the inner fan, and the Hall sensor feeds the pulse signal back to the PLC. After the controller recognizes the signal, it is converted into a standard unit of measurement (mL) for recording.
  • Water pressure regulation module and drainage module:
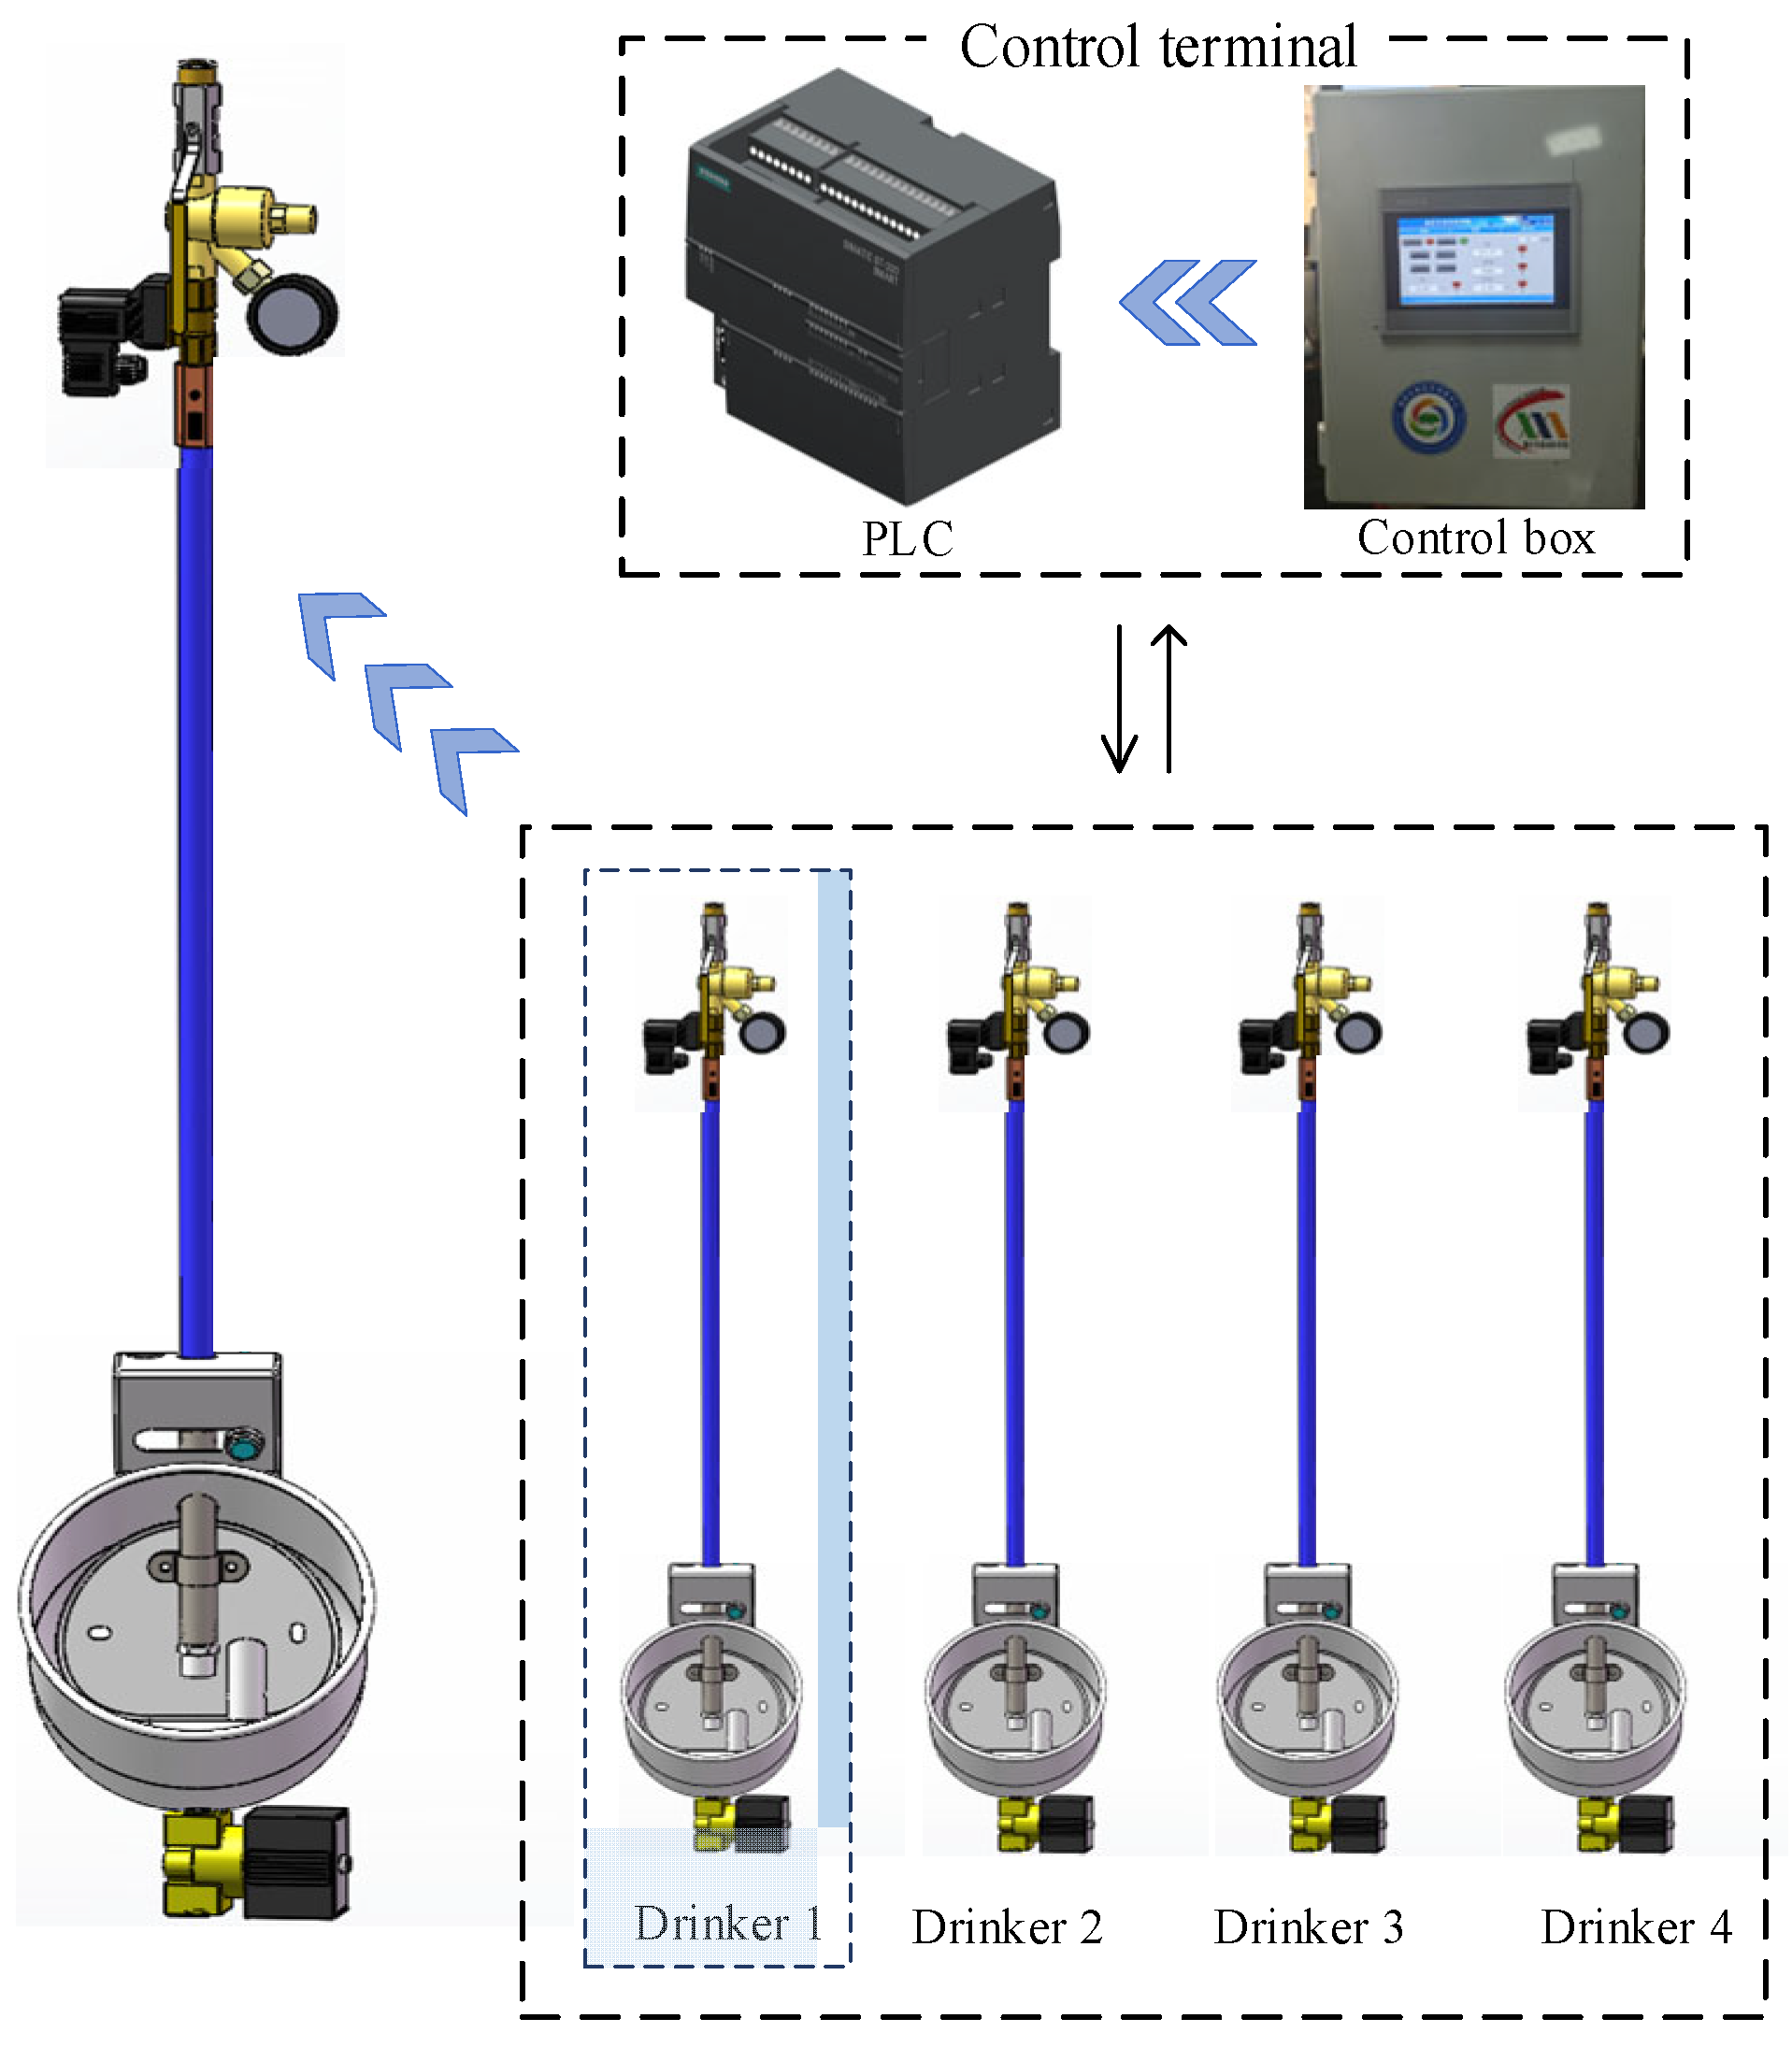
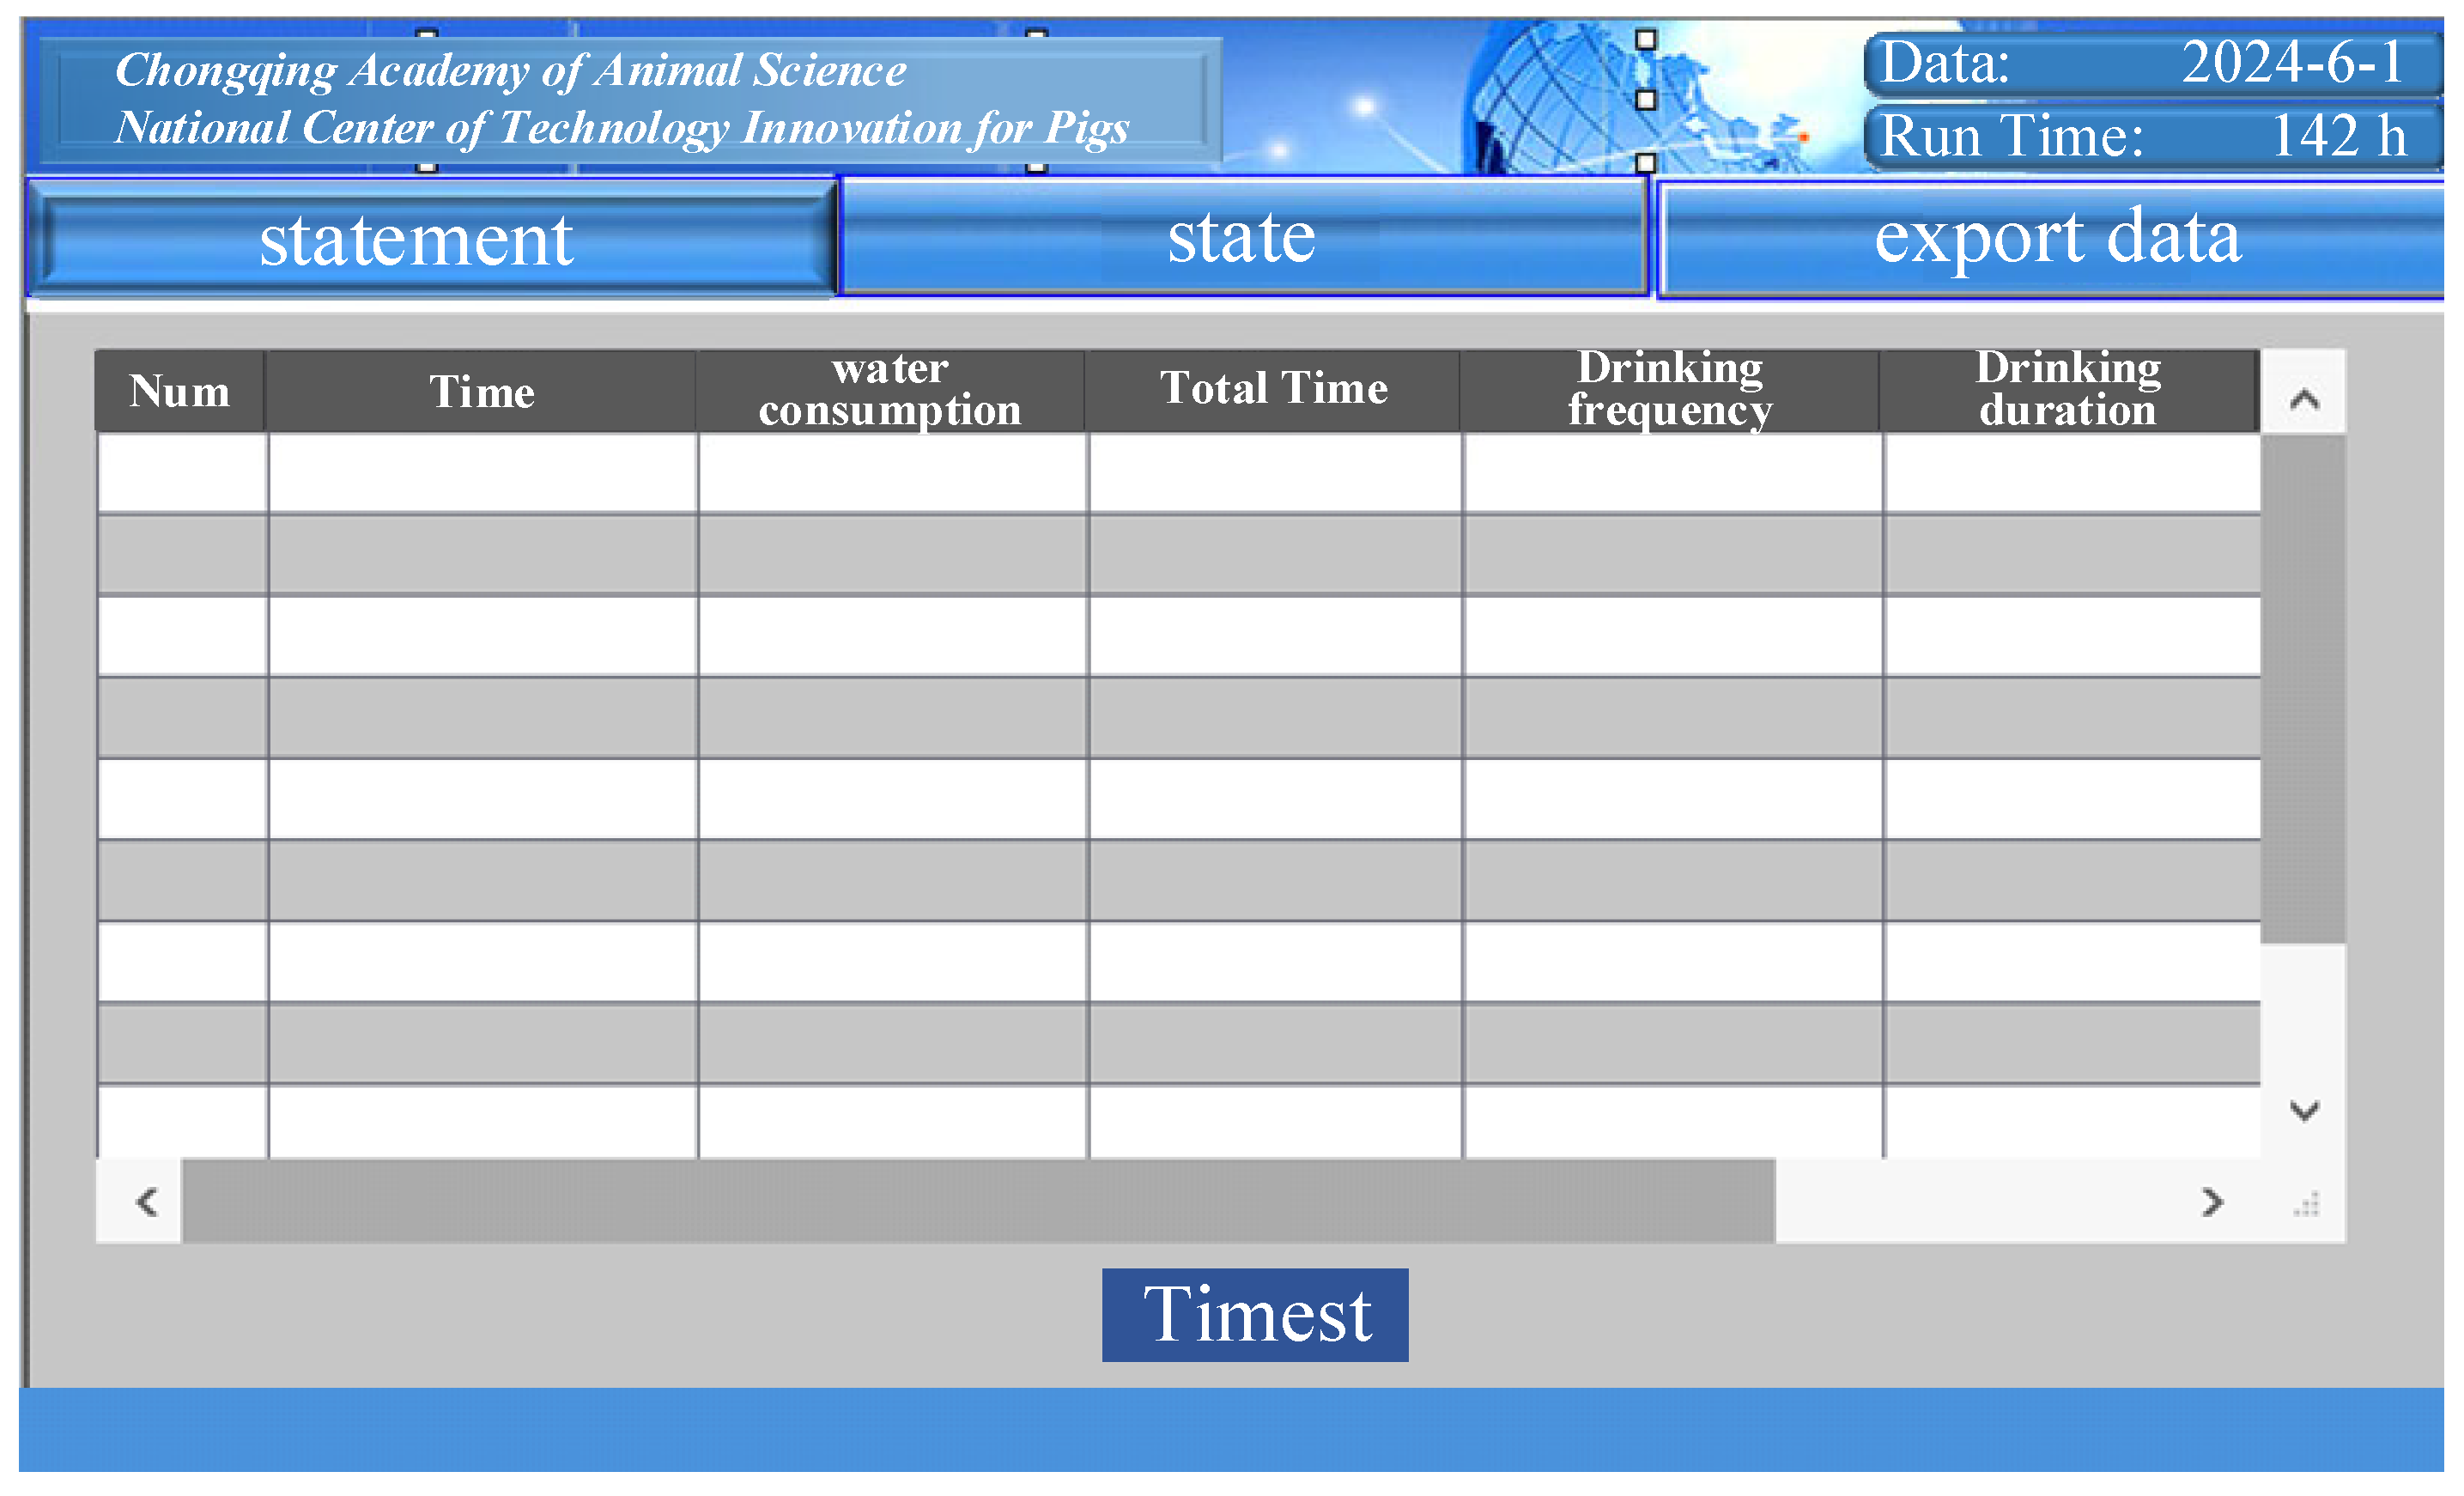
The water pressure regulation module and drain age module are composed of a DN15 copper pressure reducing valve with pressure gauge and DN15 copper steel core manual ball valve [24]. According to our many tests, to avoid slow water discharge due to low water pressure and to avoid water splashing as a result of excessively high water pressure, the optimal front-end water pressure is 0.2 MPA. The drainage mechanism includes DN32 inner and outer wire core and a DN32 electric ball valve. The core is welded as a mounting base under the drinking bowl for ball valve installation.

2.1.2. PLC System

The PLC uses the Mitsubishi FX series PLC terminal, which can manage up to four water fountains at the same time, ensuring that the pigs in the farm can get the right amount of water at all times, while maintaining a clean water source, as shown in Figure 3.
The control system consists of two control modes: a manual mode and automatic mode. In the manual mode, the keeper can manually control the switch of each valve with the help of the PLC panel, and the collected drinking water volume data will be displayed in the table in real time and can be copied at any time. In the automatic mode, the detection switch is used to detect whether the pig is in the drinking position. When the pig has only reached the drinking position, stays there for more than 5 s, and it has been more than 15 s since the last triggering of the water, the intake valve opens. From the opening of the inlet valve to the point at which the water level gauge detects that the set water level has been reached, the data of the volume of drinking water will be automatically collected and uploaded [25]. In order to prevent water waste, each drinking bowl should be filled with a maximum of 1.5 L within 60 s to reduce the possibility of pigs playing with water.
The working flow chart when the intelligent drinking water controller is set to automatic mode is shown in Figure 4.
The display interface of the intelligent drinking water controller adopts the MCGS touch screen, as shown in Figure 5. In addition to the remote-control function, the remote monitoring system can also monitor the water consumption in the pig pen in real time and the drinking time of the pigs. This means that farm managers can determine the drinking situation of pigs in real-time, detect anomalies in time and take appropriate measures. At the same time, the intelligent drinking water controller also has the function of output reports, as shown in Figure 6. This makes data analysis much easier and more intuitive. Farm managers can conduct an in-depth analysis of the drinking water of pigs according to the data in the report, so as to optimize the feeding management plan and improve the breeding efficiency.

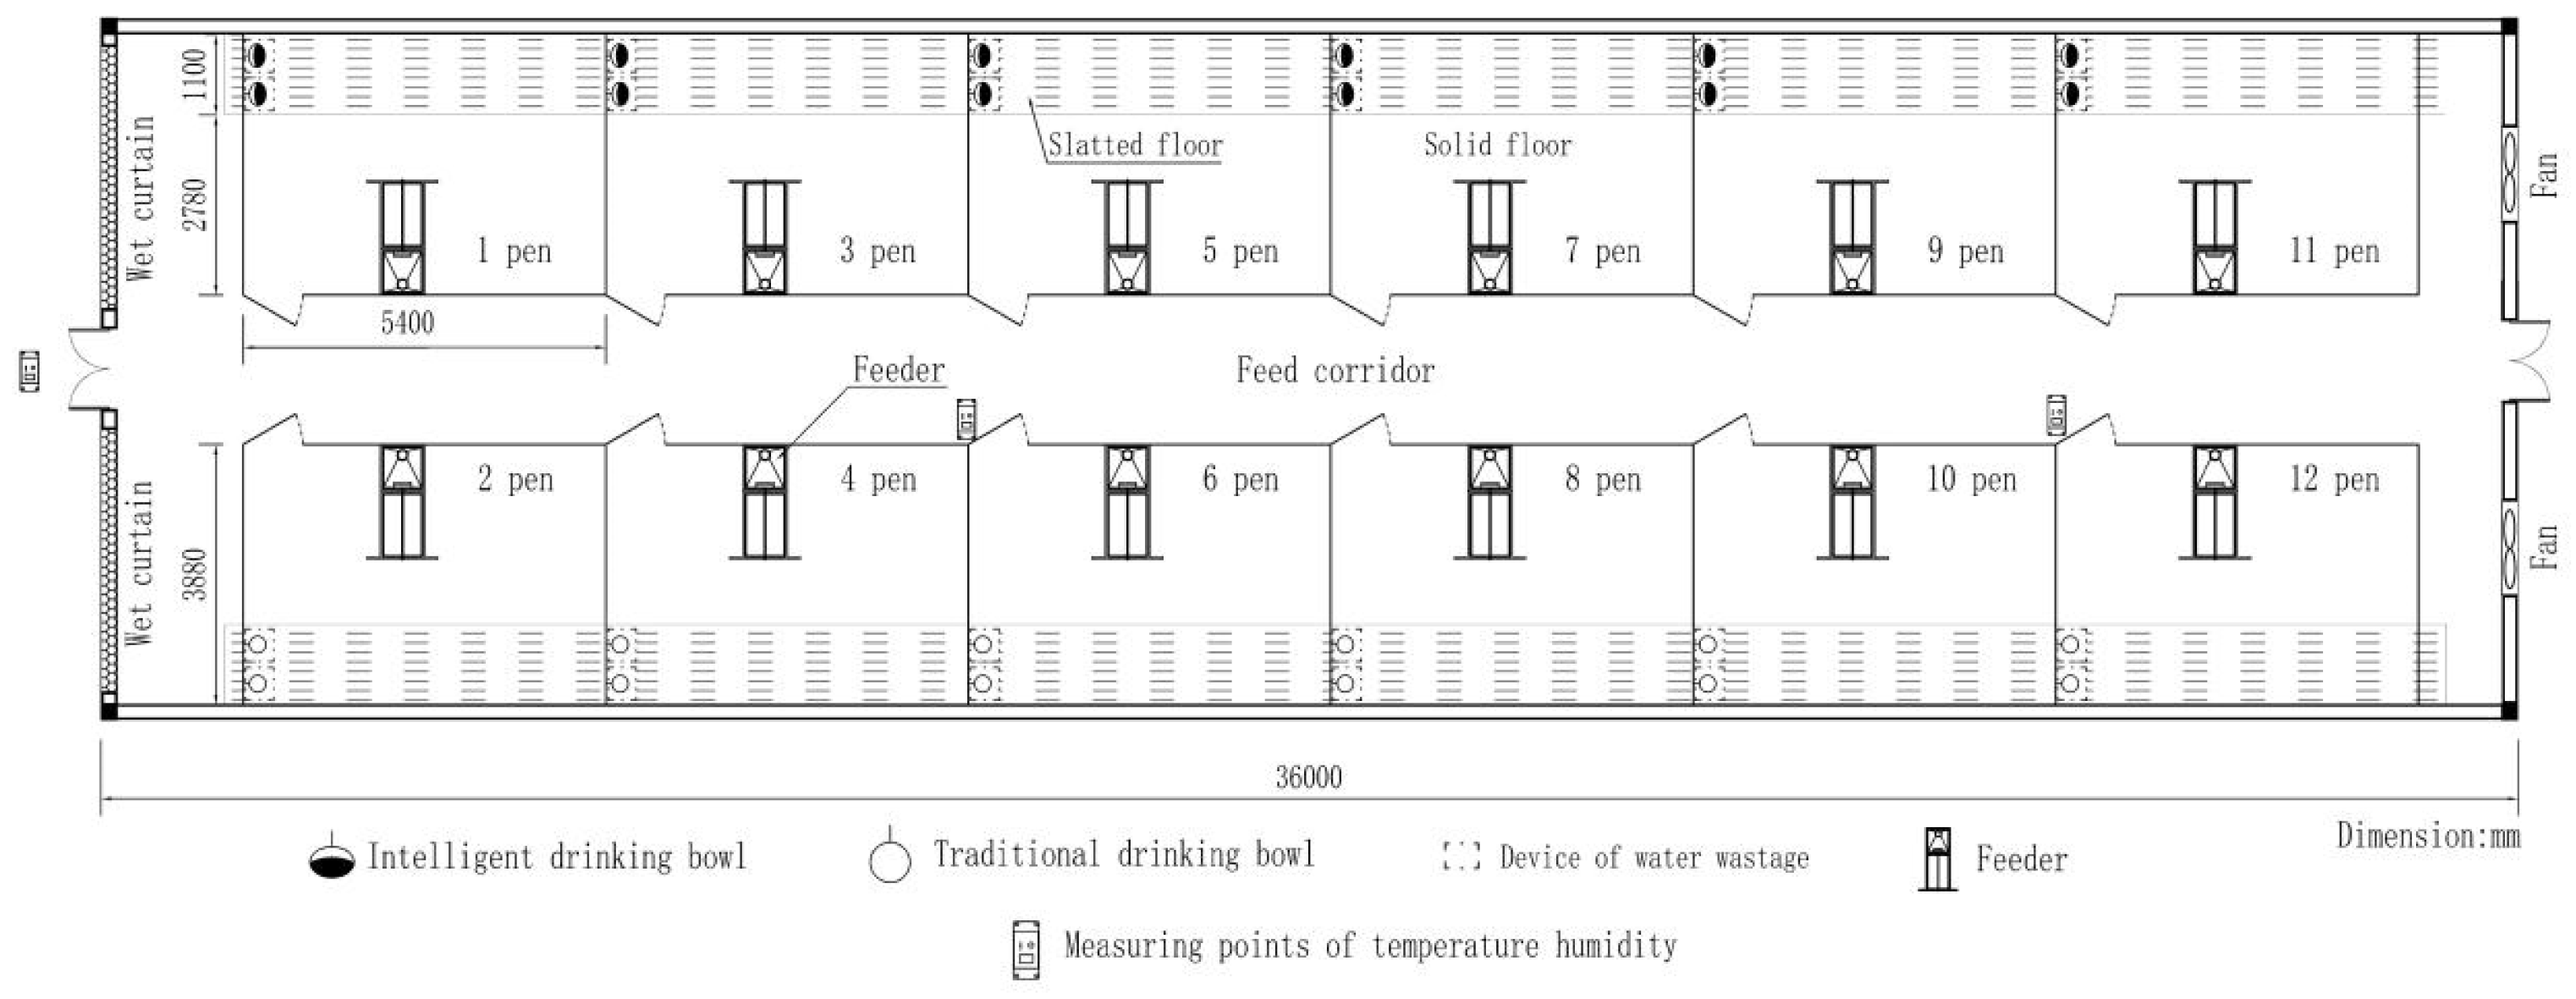
2.2. Experimental Arrangement

2.2.1. Experimental Condition

This study was conducted at the Shuanghe Experimental Base of the Chongqing Academy of Animal Sciences. The aim was to compare the effects of using an intelligent drinking water controller with the effects of using traditional drinking bowls. To achieve this, we set up 12 pens as experimental sites, each housing 7 fattening pigs. In these sites, two different drinking schemes were adopted: 6 sites were equipped with an intelligent water control system, while the other 6 used traditional drinking bowls or nozzles. The positions of the drinkers are shown in Figure 6.
Throughout the experiment, all pigs underwent standard immunization programs to ensure their health status. Additionally, the pigs were allowed to feed and drink freely to simulate natural breeding environments. To ensure the accuracy and reliability of the experiment, we paid special attention to the cleanliness and hygiene of the sites, regularly disinfecting them to provide a clean and hygienic living environment for the pigs. The installation positions and environmental layout of the drinking bowls in the experimental group and the control group are shown in Figure 7. The life picture of fattening pigs in the experimental environment is shown in Figure 8.
Four hobo temperature and humidity meters are installed in the pig pens, one is placed outside the air intake end (wet curtain end), and three are evenly arranged in the house according to the length of the pig pen to measure the ambient temperature of the pig pen, and the sampling interval can be set to 20–30 min. The installation height of the hobo temperature and humidity meters outside the pen is 0.6–1 m, and the installation height inside the pen is 0.9–1.1 m; this ensures that the meters are not being touched or damaged by the pigs.

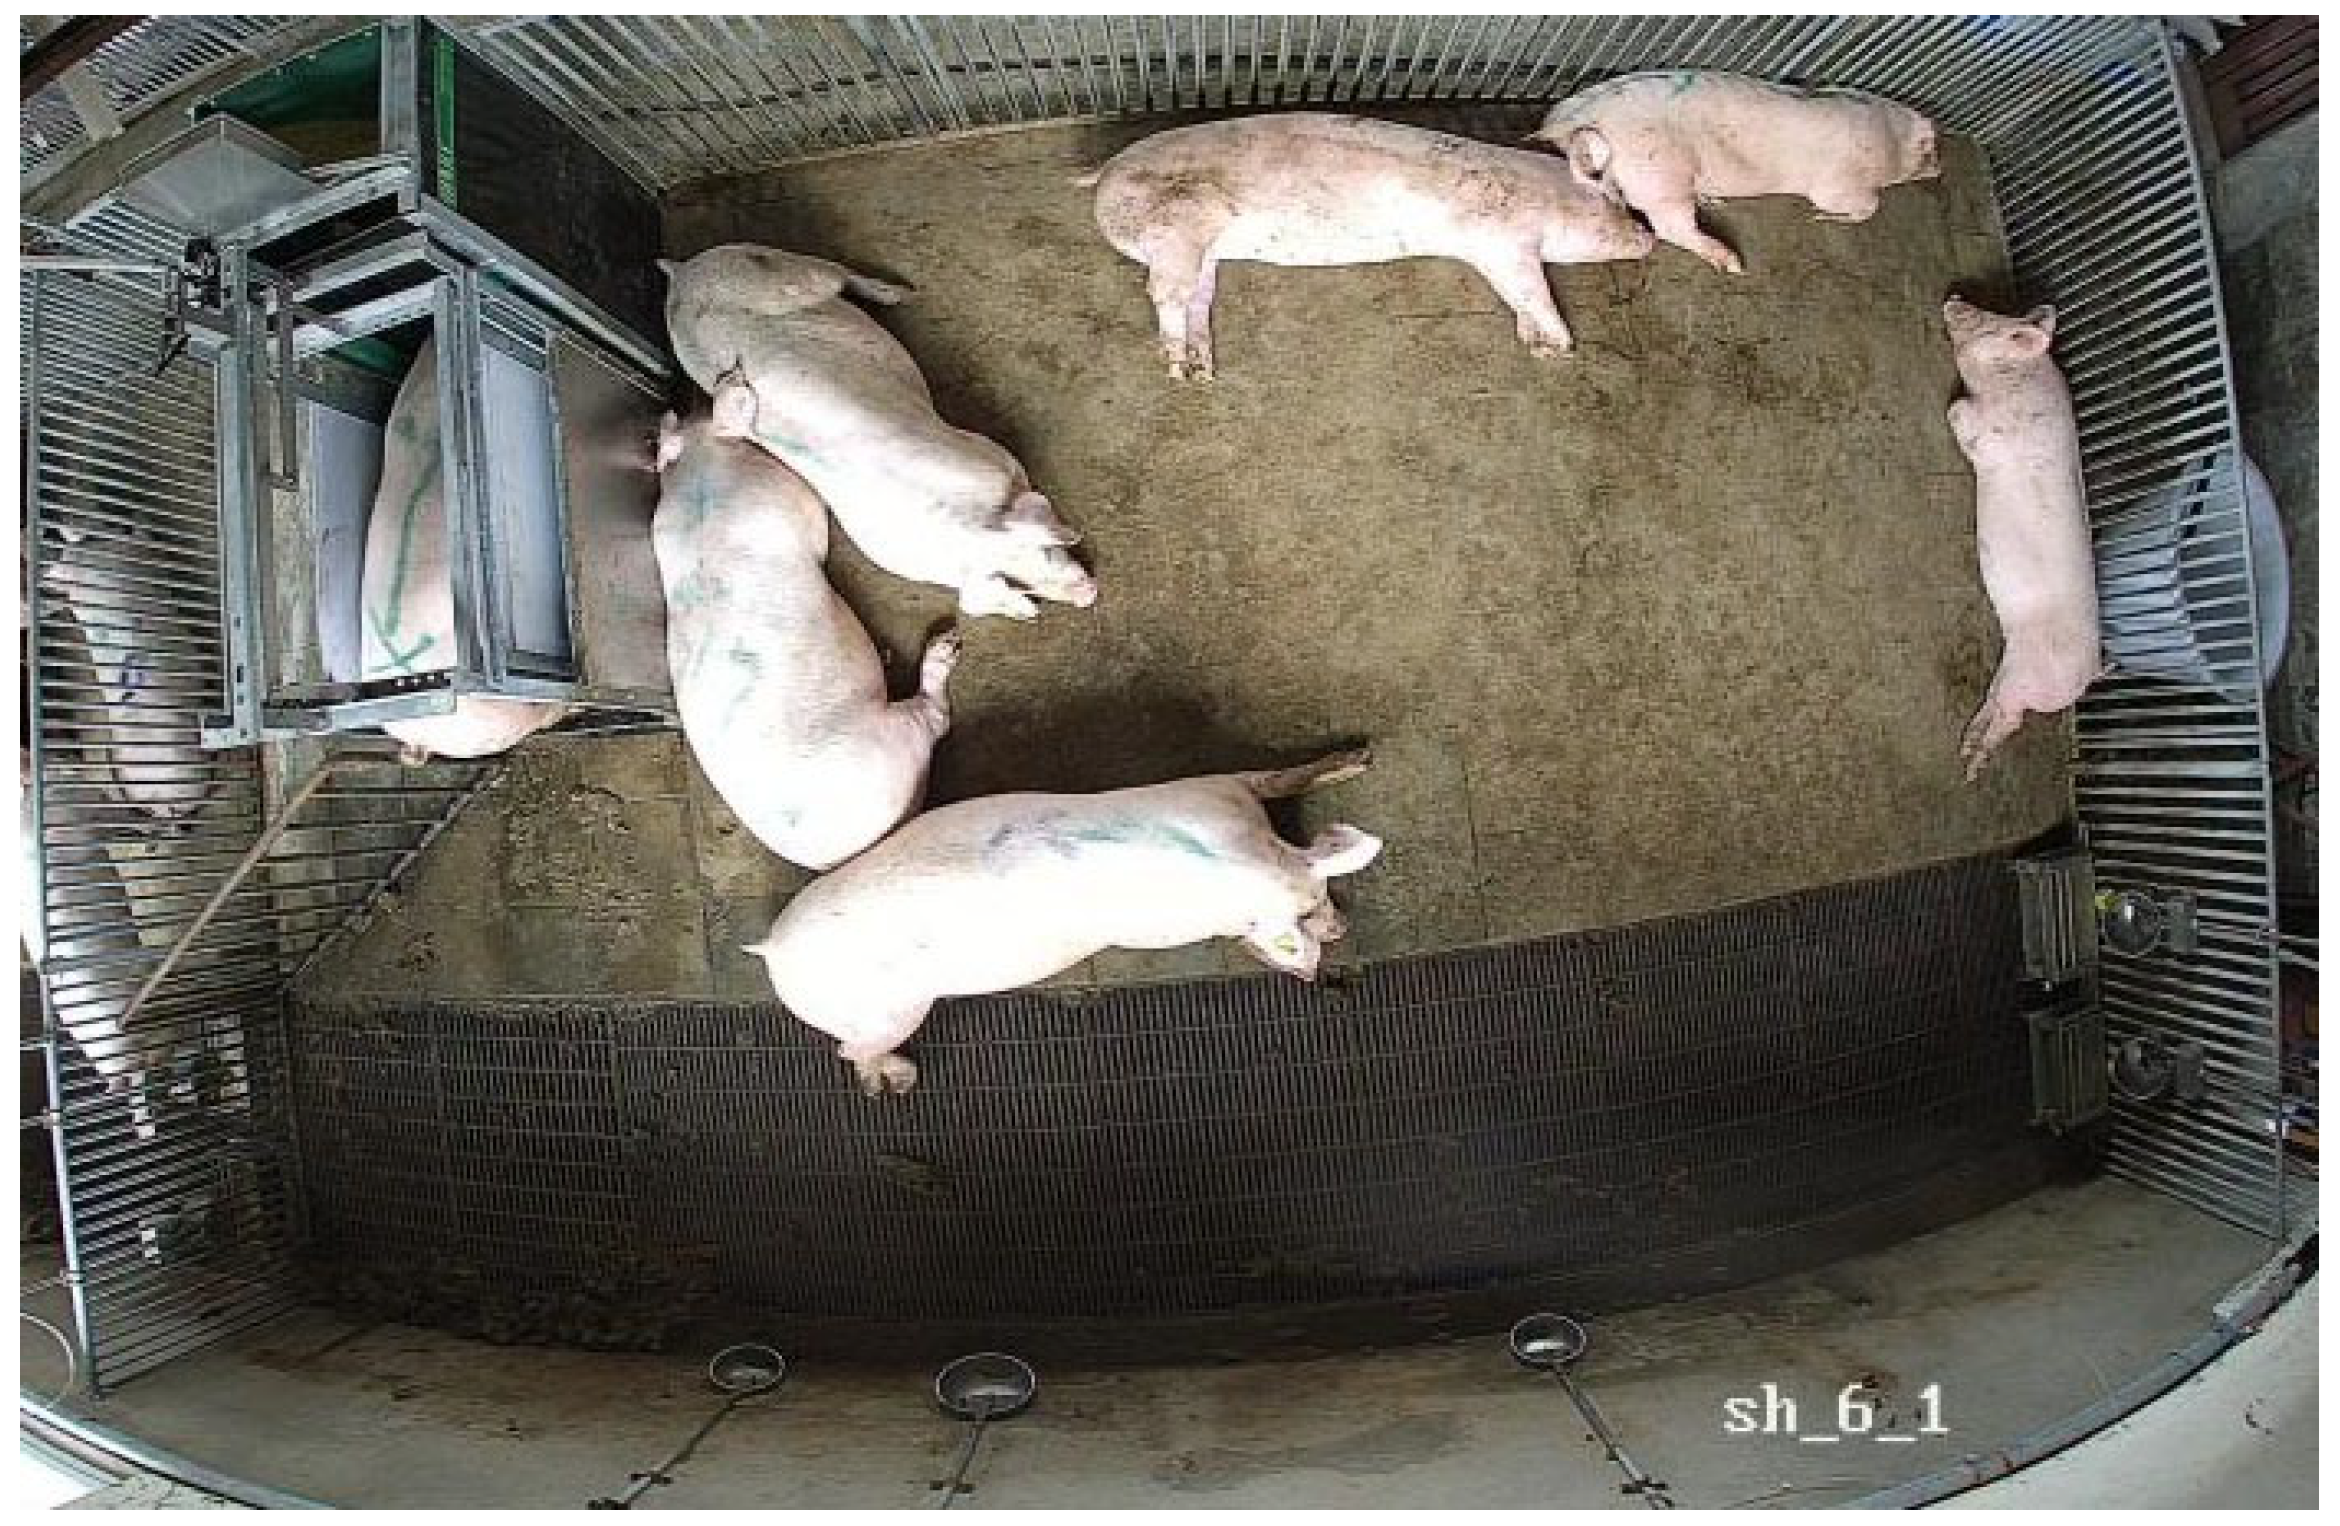
2.2.2. Experimental Object

In this study, we meticulously selected 84 fattening pigs as experimental subjects. All of these pigs were hybrids of Landrace and Large White breeds, with their body weight strictly controlled between 100 and 112 kg, as depicted in Figure 9. To ensure the scientific rigor of the experiment, we further categorized these fattening pigs into three weight intervals based on their body weight: 100–104 kg, 104–108 kg, and 108–112 kg. Within each weight interval, we randomly selected two fattening pigs, with every six pigs forming a breeding unit, or one pen. Through this grouping method, we evenly distributed these 84 fattening pigs into 12 pens [26,27]. In this trial, we ensured that the experimental pigs could grow under completely identical conditions, granting them the freedom to feed and drink at will. The feed used in the experiment was the “Piglet Kang” brand, which is designed to meet the nutritional needs of fattening pigs at different growth stages.
The time frame for this experiment was scheduled from 6 June 2024 to 26 June 2024, totaling 21 days. During this period, we divided the 12 pens into two groups, namely the control group and the experimental group, with each group containing 6 pens. The pigs in the control group’s pens continued to use traditional drinking methods, while the pigs in the experimental group’s pens were equipped with advanced intelligent water control systems, allowing us to observe and compare differences in water efficiency, pig health, and growth performance between the two groups.
In order to ensure the accuracy and comparability of the experimental data, we installed water meters for each circle of the control group and the experimental group. The function of these water meters is to accurately measure and record the water consumption of all the drinking bowls or drinking spouts in the ring bar, and the water meter of the experimental group can also help compare the reading accuracy of the flow meter of the intelligent drinking water controller of the experimental group. Every morning at 8:00 a.m., just before the first feeding, a detailed recording of the water intake in each pen was taken, ensuring that we accurately tracked and monitored the drinking habits and needs of the pigs. At the same time, the experimental group used smart drinking bowls as drinking equipment, and each ring was equipped with two smart drinking bowls, while other types of drinking bowls or drinking spouts were closed to avoid interfering with the experimental results. The data recording time of the experimental group was set to be consistent with that of the control group to ensure the synchronization of data and the effectiveness of the comparative analysis. The specific number of drinking bowls and the settings of the test group and control group are shown in Table 1.

2.3. Experimental Evaluation Index

In this experiment, in order to explore the actual effects of using the intelligent drinking water controller and traditional drinking water bowls, we discussed the following two aspects.

2.3.1. Drinker Performance

In the evaluation of the physical performance of drinking water equipment, we pay special attention to the water consumption and water utilization rate of drinking water equipment. Considering the importance of water quality to the health of pigs, we also added an index for the water quality analysis in the assessment [28]. By monitoring the water quality between the intelligent drinking water controller compared with the ordinary drinking water bowl, the effect of the intelligent drinking water controller on the cleanliness of the water supply can be verified.
  • Water consumption:
Independent water meters were installed in the pig stalls of the experimental group and the control group, and the water consumption of the stalls should be independent respectively. During the experiment, the total water consumption of each enclosure of the experimental group and the control group was recorded every day: the reading of the water meter was recorded as WE1 at 9:00 a.m. every day (before the first meal feeding), the reading of the water meter was recorded as W E 2 at the same time the next day, and the average actual water consumption of each enclosure of the experimental group was recorded as W E S = W E 1 W E 2 .
W E is the average daily water consumption recorded by the water meter in the experimental group, W E I is the average daily water consumption recorded by the flow meter of the intelligent drinking water controller, and W E d is the average daily actual drinking water consumption of pigs in each pen of the experimental group. The difference between the average daily water consumption W I recorded by the flowmeter of the intelligent drinking water controller and the average daily water consumption W E recorded by the water meter ω is the recording error of the intelligent drinking water controller flowmeter. W I is automatically collected and uploaded to the cloud by the intelligent drinking water controller, and other data are obtained by manual meter reading.
ω = | W E S W E I |
Similarly, W C S = W C 1 W C 2 is the average daily actual water consumption per pen of the control group, W C is the average daily water consumption shown by the water meter of the control group, and W C d is the average daily actual drinking water consumption of pigs per pen in the control group.
The calculation formula of the average daily water consumption (DWC) per pig per pen in the control group is shown in Equation (2), and the calculation formula for the average daily water consumption (DWE) per pig per pen in the experimental group is shown in Equation (3).
D W E = W C S 7
D W C = W E S 7
  • Water waste:
The waste water in the waste water tray is set directly below the drinking water fountain, which can basically catch the leaked water caused by the water-drinking behavior of the pig using the drinking water fountain. It may be difficult to avoid certain errors when the pig’s plays with the water, but considering the comfort provided by the pig drinking water and the economic benefits of the drinking bowl, we finally chose a waste tank of 30 cm × 40 cm. During the trial, in order to precisely monitor the amount of wastewater produced by the pigs, we adopted a rigorous data collection process:
The waste tank under the drinking bowl is collected and recorded twice a day (at 8:30 a.m. and 3:30 p.m.), as shown in Figure 10. The experimenter sucked out all the waste water in the waste tank through a large syringe and poured it into the measuring cylinder. By observing the scale of the waste water, the average daily amount of waste water in the experimental group and the average daily amount of waste water in the control group were accurately recorded.
  • Water utilization rate:
According to the difference between total water consumption and waste water, the water utilization rate ( η E ) of pig breeding in the experimental group and that of pig breeding in the control group ( η C ) can be obtained as follows:
η E = W E d W E 1 W E 2 = W E S W E L W E S
η C = W C d W C 1 W C 2 = W C S W C L W C S
  • Water quality:
The cleanliness of the water source directly affects the health of pigs. Clean water reduces the risk of water-borne diseases in pigs, such as diarrhea and digestive problems. A continuous supply of clean, adequate water can enhance the immune system of pigs, reduce the incidence of disease, and improve survival [29].
From the onset of the experiment, all pens in the tap water group, control group, and experimental group were subject to pig’s drinking water in drinking bowls every alternate day. The pen number and collection time for each pen sample were duly recorded; there were two samples in the tap water group and six samples each in the control and experimental groups, totaling fourteen samples. For each sample, 100 mL of water was collected. In instances where feed remnants were present in the drinking bowl, the supernatant was directly extracted using two 50 mL centrifugal tubes during sampling. The quality of the drinking water was subsequently assessed based on several test indices: pH, total suspended solids (TSSs), ammonia nitrogen (NH3-N), total nitrogen (TN), and chemical oxygen demand (COD). pH, TSS, NH3-N, and TN levels were measured directly by the instrument, while the COD value was determined through reflux titration by employing the potassium dichromate method.

2.3.2. Drinking Behavior and Weight Change

The drinking behavior of pigs is an important indicator of their health status. Through the intelligent drinking water controller, we recorded the amount of water and duration of consumption by the pigs in detail, aiming to provide data support for predicting the health and comfort of pigs for their water-drinking needs in the future. The weight change in the pigs in different drinking water equipment (intelligent drinking water controller and ordinary drinking water bowl) feeding environments was compared to detect the effect of the intelligent drinking water controller on the growth rate of pigs.
  • Frequency and duration of water-drinking:
In the existing studies, there are few relevant studies on the drinking behavior of pigs, mainly because it is difficult to accurately record the amount of water and the duration of consumption by the pigs manually. Recording the drinking habits of pigs through intelligent drinking water controllers can directly show their current water demand, for example, a rapidly growing pig may need to take in more water due to accelerated metabolism. Monitoring the frequency and duration of water drinking for pigs is key to ensuring breeding efficiency and animal welfare [30].
Intelligent drinking water controllers can provide data recording and analysis functions to help breeders make management decisions, such as adjusting feeding strategies and improving the breeding environment [31].
  • Weight change:
During the experiment, we conducted two weighing sessions to accurately assess the growth performance of pigs. The first session occurred before the experiment commenced, and the second followed its conclusion. This approach allowed us to compare data from both weighings, thereby determining the average daily weight gain per fattening pig in each pen for the experimental group (ME) and the control group (MC) during the 21-day trial period. This comprehensive evaluation was aimed at understanding the weight gain of the pigs throughout the trial.
D M E = M E 21
D M C = M C 21
To maintain the precision and scientific integrity of our study, we employed an ad libitum feeding approach, enabling the pigs to consume food in accordance with their inherent dietary requirements. Given that the pigs in the experiment were meticulously chosen based on their weight to guarantee consistency, it is logical to deduce that the feed intake per pig within each enclosure was roughly equivalent. The investigation spanned 21 days, during which 112 bags of feed, each weighing 40 kg, were distributed, totaling 4480 kg. In light of the uniformity in the pigs’ weights, it is reasonable to assume that each pig consumed an equal quantity of feed, translating to a daily consumption rate of 2.54 kg per pig. The methodologies for calculating the Feed Conversion Ratio (FCR) for both the experimental and control groups of fattening pigs are illustrated in Equations (8) and (9).
F C R E = 2.54 D M E
F C R C = 2.54 D M C
  • Frequency and duration of water-drinking:
The growth indicators of pigs directly reflect the effectiveness of farming practices, while their drinking behavior indirectly indicates their health status. These indicators can provide scientific decision support for farmers and optimize the breeding process. The experimental group implemented a remote management strategy by using an intelligent drinking water controller, which recorded the real-time drinking behavior data for live pigs, including the number of times each fattening pig in each pen drank water daily, and the duration of water consumption for each fattening pig in each pen daily. Managers can directly export, organize, and analyze these data reports.

3. Results

According to the indoor sensor data, the breeding environment for pigs was generally suitable. The average temperature during the experiment was 24.15 °C, the average humidity was 91.27%, and the average dew point was 22.63 °C. The highest recorded temperature was 29.67 °C, while the lowest was 18.98 °C, as illustrated in Figure 11.
Over the course of a 21-day experiment, we gathered crucial data on various production performance and growth indicators during the pig fattening process. Subsequently, we analyzed the data from both the experimental group and the control group.

3.1. Performance Analysis of Drinker

3.1.1. Water Consumption

As can be seen from Table 2, during the 21-day trial period, the average daily water consumption per pen of the experimental group was 47.77 L, and the average daily water consumption per pen of the control group was 62.42 L; the average daily water consumption per pen of the experimental group and the control group was significantly different (p < 0.05). The average daily water consumption of each pig in the experimental group was 6.82 L, and the average daily water consumption of each pig in the control group was 8.92 L. The average daily water consumption of fattening pigs in the experimental group and the control group was significantly different (p < 0.05). From the analysis of daily water consumption, the intelligent drinking water controller only accounts for 76.53% of the water consumption of ordinary drinking water bowls; the water saving rate is 23.47%, and the average daily water saving amount per finishing pig is as high as 2.1 L.
The data presented in Figure 12 demonstrate that the flowmeter incorporated in the intelligent drinking water controller of the experimental group exhibits high precision in water measurement. The deviation between the water consumption logged by the intelligent drinking water controller and the actual water usage is a mere 2.14%. This suggests that the intelligent drinking water controller possesses an effective water collection capability, fulfilling the requirements of real-world applications.

3.1.2. Water Waste

As can be seen from Table 3, during the test period, the average daily water waste of the six experimental groups using the intelligent drinking water controller was 7.81 L, while the total water waste of the six control groups using the ordinary drinking bowl was 30.09 L, which was 3.85 times that of the intelligent drinking water device. There was a significant difference in the average daily water waste between the experimental group and the control group (p < 0.05). The daily waste of water per fattening pig in the pens using ordinary drinking bowls was 0.716 L, while the average daily waste of water per fattening pig in the pens using intelligent drinking fountains was only 0.186 L, accounting for only 25.98% of the daily waste of water per fattening pig in pens using ordinary drinking bowls. The average water waste per pig per day was significantly different between the experimental group and the control group (p < 0.05).

3.1.3. Water Utilization Analysis

According to Figure 13, the experimental group’s average daily water waste constituted only 2.60% of their actual daily water consumption, whereas the control group, utilizing standard drinking bowls, had a water waste of 10%. This comparison underscores the superior efficacy of the intelligent water controller in conserving water.
As demonstrated in Table 4, the average daily water resource utilization rates for the experimental and control groups were 96.64% ± 1.4% and 90.08% ± 4.29%, respectively. This indicates that the experimental group’s water utilization rate exceeded that of the control group by 6.56%. During the experiment, the average water consumption per fattening pig in the experimental group was 7.16 L, and the actual drinking water consumed by the pigs was 5.86 L (p < 0.05). The daily water consumption of pigs in the control group was 8.92 L, and the actual daily drinking water consumed by the pigs was only 3.90 L (p < 0.05). Based on these findings, it is evident that the intelligent drinking water controller used in the experimental group not only enhanced the water resource utilization rate but also significantly reduced the water consumption. This showcases a more resource-efficient approach compared to traditional drinking water devices and substantially decreases the operational costs of pig farms.

3.1.4. Water Quality Analysis

To ensure the positive influence of water quality on pigs, conducting regular water quality analyses is crucial. Through these analyses, breeders can promptly identify and address any water quality issues, thereby ensuring that pigs have access to sufficient and high-quality water resources. This practice not only maintains the health of the pigs but also significantly enhances farming efficiency. During a twenty-one-day test period, we selected four days for the comprehensive water quality index analysis. To ensure the accuracy and representativeness of our data. We used the TRIMMEAN function to first remove the extreme outliers from the data set, and then averaged the remaining data to represent the water quality conditions of the experimental and control groups [32]. This approach minimizes errors caused by outliers, making our analysis results more consistent and reliable.
The water quality analysis results of the experimental group and the control group can be obtained from Figure 14. Through a one-way ANOVA test, although there is no significant difference between the two groups of data, it can still be seen from the specific data that the intelligent drinking water controller can purify the water quality. The quality of tap water has a significant effect on the pH value of the experimental group and the control group. The pH values of the experimental and control groups were significantly influenced by the tap water on those days. The optimal pH range for the pigs’ drinking water should be between 6.5 and 8.5. The average pH value of the experimental group was 7.32 per day, while the control group had an average value of 7.19 per day. Compared to the control group, the TDS level in the experimental group decreased by an average of 52.8 ppm (37.56%). NH3-N in the experimental group also decreased by an average of 1.65 ppm (39.86%) compared to the control group. Similarly, the TN level in the experimental group decreased by an average of 8.43 ppm (30.59%) when compared to the control group. Finally, the COD level of the experimental group decreased by an average of 98.43 mg/L, which is a reduction of 38.97%.
Using these indicators, it can be seen that the intelligent drinking water controller performs better, indicating that it can reduce water pollution more effectively [33,34,35,36]. From the long-term observation, the intelligent drinking water control system has a stronger role in promoting the health of pigs.

3.2. Analysis of Water-Drinking Behavior and Weight Change

3.2.1. Analysis of Weight Change

Before the formal start of the experiment, all pigs were weighed individually and evenly divided into columns according to their weight (corresponding to the ear tag one by one). The experiment lasted for 3 weeks, and at the end of the experiment, each pig was weighed once. For the experimental pig weight data, the TRIMMEAN function was also used to screen non-characteristic values (weight gain below 10 kg and weight gain above 30 kg), and Table 5 was obtained according to Equations (5) and (6).
During the experiment, the average weight increase per fattening pig in the pen using the intelligent drinking water controller was 17.29 ± 3.50 kg (p < 0.05), and the average weight increase per fattening pig in the control group was 16.88 ± 2.89 kg (p < 0.05). The average daily body mass gain of fattening pigs in the pen using the intelligent drinking water controller was 0.82 ± 0.17 kg (p < 0.05), and the average daily body mass gain per fattening pig in the control group was 0.80 ± 0.14 kg (p < 0.05). Compared with the traditional drinking bowl, the average daily weight gain of the fattening pigs using the intelligent drinking water controller was increased by 0.02 kg. These data clearly show the excellent potential of smart drinking water systems in promoting pig growth while reducing overall water consumption.
Based on the experimental environment of free feeding, we assumed that the feed intake of each fattening pig was the same, and the ratio of feed to gain of the fattening pigs in the experimental group was 3.10 and that of the fattening pigs in the control group was 3.18. Compared with the control group, the feed to gain ratio of the experimental group was reduced by 2.52%.

3.2.2. Analysis of Drinking Frequency and Drinking Duration

The data gathered using the intelligent drinking water controller from the experimental group were extracted and organized. Table 6 documents the daily average drinking frequency, duration of drinking, and the average drinking time for each fattening pig in the experimental group over the past 21 days.
Compared to the traditional manual recording of the pigs’ water-drinking behavior, the use of an intelligent water control system automates and enhances the monitoring of pigs’ drinking times. This data can offer valuable insights for breeding decisions. During our experiment, the average water intake frequency for seven fattening pigs in each pen was 270.04 times per day, with each pig drinking an average of 38.58 times per day for an average duration of 12.8 s.

4. Discussion

Based on the above analysis of the performance of the drinking water equipment and the water-drinking behavior and weight of pigs, and combined with the experimental data, we can draw the following conclusions:
  • Water consumption and waste:
Compared with the control group, the water utilization rate of the experimental group was increased by 7.26%, and the average water saving rate of the experimental group was as high as 23.47%. The average daily water waste of fattening pigs in pens using the intelligent drinking water controller was only 0.186 L, accounting for only 25.98% of the daily water waste of fattening pigs in pens using ordinary drinking water bowls.
  • Drinking water quality:
Compared with traditional drinking water units, the use of the intelligent drinking water controller has shown significant advantages in key water quality indicators such as TDS, NH3-N, TN and COD, with a maximum reduction of 39.86%. According to the data collected, we found that there are problems with fecal residue and feed contamination in drinking bowls. In the experimental design, in order to reduce the interference caused by the self-cleaning process of the intelligent drinking water controller to the fattening pigs, we chose to carry out the self-cleaning process in the middle of the night. However, due to the long time interval between this time point and the water quality sampling, this arrangement may affect the accuracy of the water quality analysis. Therefore, in a future experimental design, we plan to adjust the self-cleaning time according to the drinking behavior rhythm of pigs to ensure that it can be effectively cleaned without causing unnecessary stress to pigs.
  • Pig health status:
In the short term, although there is no large gap in the weight data of live pigs, in terms of the average daily body mass gain, compared with the traditional drinking water bowls, the average daily weight increment is increased by 0.05 kg using the intelli gent drinking water controller. Combined with the significant reduction in water consumption, the benefits brought by using the smart drinking devices are also very significant. In the long run, cleaner water sources will have a greater beneficial impact on the health status of pigs, and healthy pigs will only show better performance in terms of growth rate and weight gain [37].
  • Intelligent monitoring of the pigs’ drinking frequency and duration:
Compared with the difficulty associated with the real-time and accurate monitoring of pigs’ drinking behavior and drinking time using manual recording methods, the intelligent drinking water controller obtained unmanned data collection and recording through sensor detection [38]; the average frequency of daily drinking behaviors of each pig was 38.58 times, and the average drinking time of each pig was 12.8 s during the test period.
In summary, in the modern pig industry, the intelligent drinking water controller shows a multi-dimensional advantage compared with the traditional drinking water bowl. These benefits are not limited to improving farming efficiency, but also include the rational use of resources and the promotion of animal welfare. The intelligent drinking water controller based on the PLC is obviously superior to traditional drinking water device in reducing the waste of resources, improving the utilization rate of resources, ensuring the safety of water quality and promoting the healthy growth of animals. The above indicators are relatively comprehensive and highly representative and have important reference significance for evaluating the efficiency of modern farming equipment and its application value in animal husbandry [39].

5. Conclusions

PLC-based intelligent drinking water control systems show significant advantages in reducing water waste, improving drinking water quality, promoting pig health, and supporting data-driven management decisions through intelligent monitoring. Although the initial investment is high, the intelligent drinking water controller can significantly improve breeding efficiency and animal welfare in the long run, while reducing management costs, and provide strong support for modern farming businesses. Nevertheless, future research efforts need to be deepened and improved in at least two key areas:
  • Improvement and intellectualization of control accuracy: Although there are Intelligent drinking water controllers that can meet the drinking water needs of different pigs to a certain extent, there is still room for improvement. Future research could focus on improving camera functions to accurately capture and predict the drinking habits of individual pigs, and flexibly adjust the drinking regimen according to their health status, growth stage, and environmental factors (such as temperature and humidity) [40]. For example, machine learning techniques can be applied to analyze drinking data from pigs to optimize their drinking plans.
  • Reduce the pollution of feces in drinking water: pig feed and feces will inevitably enter drinking water bowls and pollute the water quality. In the future, we will consider taking protective measures, such as adding baffles or shielding curtains in combination with the automatic cleaning module of the Intelligent drinking water controllers, to reduce water pollution.
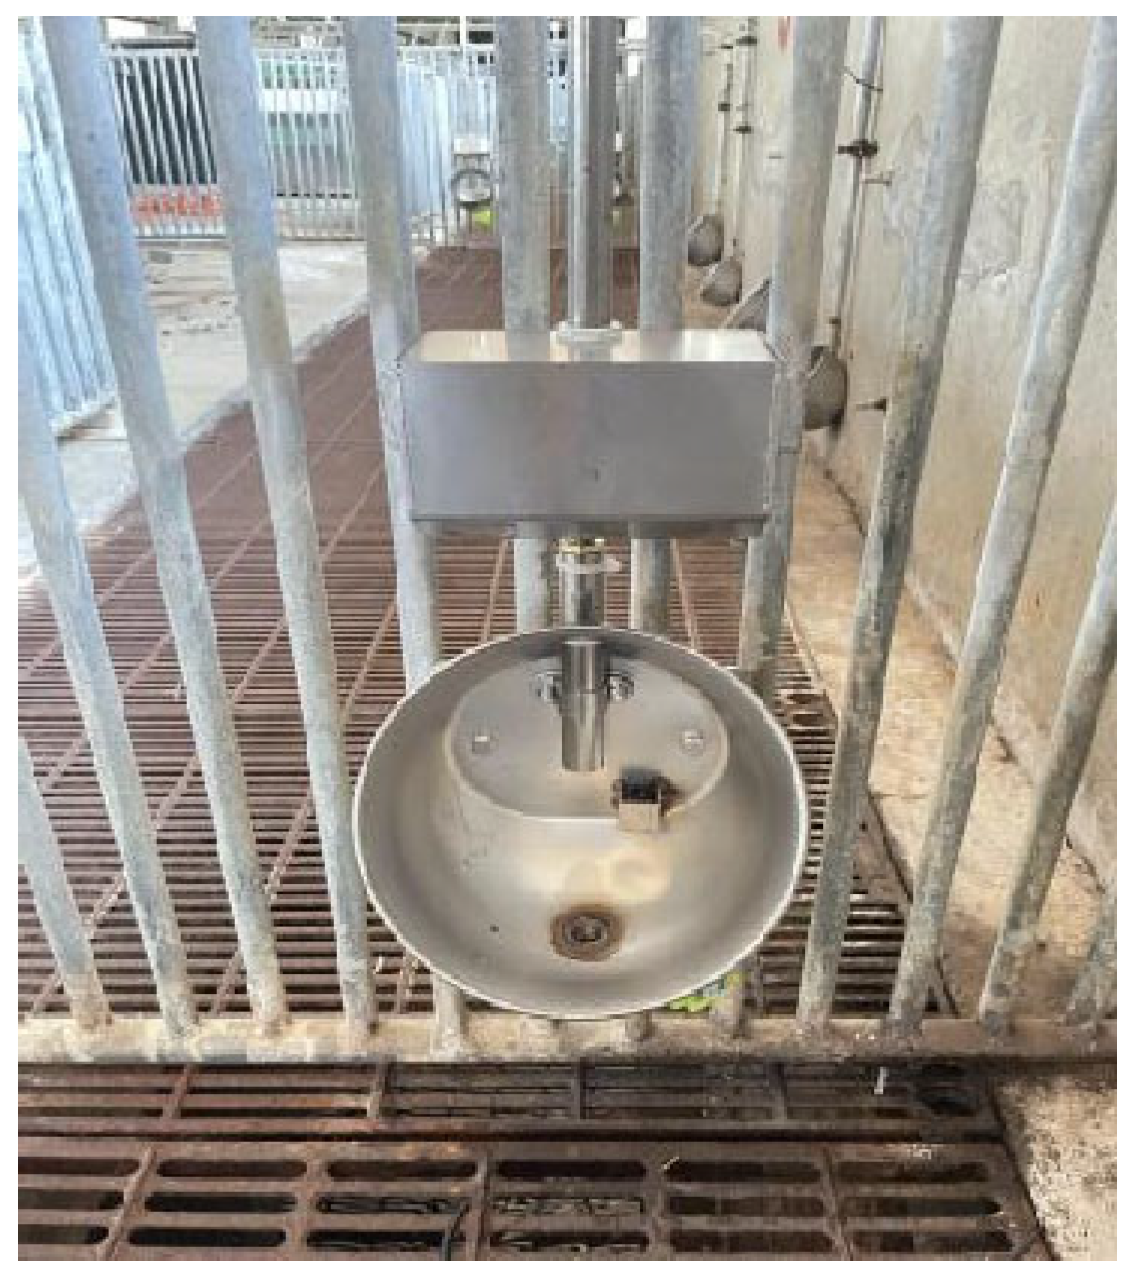
  • During the experiment, we found that drinking bowls became damaged. After careful investigation, one of the reasons is that pigs play with drinking bowls. Therefore, we decided to update the housing of the drinker to a metal material for increased durability. At the same time, this discovery also indicated that pigs have a certain need for toys. In the future, to improve breeding management practice and improve the welfare of pigs, we will consider introducing appropriate welfare toys into the breeding environment [41].

Author Contributions

Conceptualization, J.L. and H.W.; methodology, X.P.; software, Z.Y.; validation, X.P., Z.Y. and M.T.; formal analysis, Y.Z.; investigation, R.Q.; resources, H.W.; data curation, M.T.; writing—original draft preparation, J.L.; writing—review and editing, H.W.; visualization, Z.L.; supervision, J.L.; project administration, Z.Y.; funding acquisition, H.W. All authors have read and agreed to the published version of the manuscript.

Funding

This research was funded by the Leading Science and Technology Project of National Center of Technology Innovation for Pigs, grant number: NCTIP-XD/B08.

Institutional Review Board Statement

Not applicable.

Data Availability Statement

Data sharing is available upon request.

Conflicts of Interest

The authors declare no conflicts of interest.

Appendix A

Figure A1 specifically introduces the design standard of the drinking water module for the design of the intelligent drinking water controller.
Figure A1. Design standard of drinking water module of intelligent drinking water controller.
Agriculture 14 01525 g0a1

References

  1. Yang, L.; Wang, H.; Chen, R.; Xiao, D. Research progress and prospect of intelligent pig factory. J. South China Agric. Univ. 2023, 44, 13–23. [Google Scholar]
  2. Feng, C.; Zhao, Z.; Zhou, G.; Hong, S. Thinking on the prevention and control of swine disease under the normal condition of African Swine fever. Today’s Anim. Husb. Vet. Med. 2022, 38, 27–28. (In Chinese) [Google Scholar]
  3. Li, N.; He, X.; Zhou, Y. Comparison of ammonia emission reduction policies and technologies in Animal husbandry in China and foreign countries. China Anim. Husb. 2024, 2, 41–42. [Google Scholar]
  4. Jia, Z.; Zhai, H.; Su, H.; Cui, J.; Wang, W.; Li, A.; Zhou, H.; Li, W.; Teng, X. Comparison of pig breeding management and biosafety operation in China and the United States. China Anim. Quar. 2021, 38, 37–42. (In Chinese) [Google Scholar]
  5. Kamphues, J.; Flachowsky, G.; Rieger, H.; Meyer, U. Für und Wider eine Verabreichung von Futtermittelzusatzstoffen über das Tränkwasser. Übersichten zur Tierernährung 2019, 43, 205–248. [Google Scholar]
  6. Ingram, D.L. Evaporative Cooling in the Pig. Nature 1965, 207, 415–416. [Google Scholar] [CrossRef]
  7. Jessen, C. Wärmebilanz und Thermoregulation. In Physiologie der Haustiere; Engelhardt, W.V., Breves, G., Eds.; Enke in HippokratesVerlag GmbH: Stuttgart, Germany, 2000. [Google Scholar]
  8. TierSchNutztV. Verordnung zum Schutz Landwirtschaftlicher Nutztiere und Anderer zur Erzeugung Tierischer Produkte Gehaltener Tiere bei Ihrer Haltung (Tierschutz-Nutztierhaltungsverordnung—TierSchNutztV). 2021. Available online: https://www.gesetze-im-internet.de/tierschnutztv/TierSchNutztV.pdf (accessed on 27 June 2021).
  9. Schiavon, S.; Emmans, G.C. A model to predict water intake of a pig growing in a known environment on a known diet. Br. J. Nutr. 2000, 84, 873–883. [Google Scholar] [CrossRef]
  10. Gill, B.P. Water Use by Pigs Managed under Various Conditions of Housing, Feeding, and Nutrition. Ph.D. Thesis, University of Plymouth, Plymouth, UK, 1989. [Google Scholar]
  11. Zhou, Z.; Shao, W.; Zhang, R.; Zhang, X. Challenges and countermeasures on the water use in the process of urbanization and industrialization of China. China Water Resour. 2015, 1, 7–10. [Google Scholar]
  12. Wang, M.; Xue, X.; Liu, J.; Wang, W.; Han, M.; Yi, L.; Wu, Z. Effect of different allocations of wet-dry feeders and drinkers on production performance and water saving of finishing pigs. Trans. Chin. Soc. Agric. Eng. 2018, 34, 66–72. [Google Scholar] [CrossRef]
  13. Tavares, J.M.R.; Filho, P.B.; Coldebella, A.; Oliveira, P.D. The water disappearance and manure production at commercial growing-finishing pig farms. Livest. Sci. 2014, 169, 146–154. [Google Scholar] [CrossRef]
  14. Wang, M.; Zhao, W.; Wu, Z.; Liu, J.; Chen, Z.; Lü, N. Comparison experiment of total water consumption and water leakage of different types of drinker for nursery pig. Trans. Chin. Soc. Agric. Eng. 2017, 33, 242–247. [Google Scholar]
  15. Wang, M.; Yi, L.; Liu, J.; Zhao, W.; Wu, Z. Water consumption and wastage of nursery pig with different drinkers at different water pressures in summer. Trans. Chin. Soc. Agric. Eng. 2017, 33, 161–166. [Google Scholar]
  16. Smith, J.; Johnson, D. Development of a PLC-based Smart Watering System for Efficient Irrigation Management. J. Irrig. Drain. Eng. 2021, 147, 04021019. [Google Scholar]
  17. Martinez, D.; Garcia, P.; Benitez, A. A PLC-driven Precision Irrigation System Using Wireless Sensor Networks. Comput. Electron. Agric. 2023, 198, 106434. [Google Scholar]
  18. Misra, S.; van Middelaar, C.E.; O’Driscoll, K.; Quinn, A.J.; de Boer, I.J.; Upton, J. The water footprint of pig farms in Ireland based on commercial farm data. Clean. Water 2024, 2, 100023. [Google Scholar] [CrossRef]
  19. Alarcón, L.V.; Allepuz, A.; Mateu, E. Biosecurity in pig farms: A review. Porc. Health Manag. 2021, 7, 5. [Google Scholar] [CrossRef]
  20. Lin, H.; He, J.; Li, H.; Wang, C.; Li, H.; Tan, L. Design and Experiment of Automatic Variable speed Straw crushing and Returning Device Driven by Equal diameter CAM based on PLC Control. Trans. Chin. Soc. Agric. Mach. 2024, 55, 96–110. (In Chinese) [Google Scholar]
  21. Zhang, C.; Wang, Z.; Fu, J.; Zong, Z.; Yang, J.; Hou, Q.; Liu, G. Design of drinking water control system for sheep in northern winter based on PLC. Heilongjiang Anim. Husb. Vet. Sci. 2021, 7, 52–54+59+155. (In Chinese) [Google Scholar]
  22. Lenshi, T.; Rajaganapathy, V.; Mandal, P.K.; Ganesan, R.; Venugopal, S.; Raghy, R.; Sreekumar, D. Pig feeding practices of backyard pig farmers in Imphal, Manipur. Indian Vet. J. 2024, 101, 58–61. [Google Scholar]
  23. Baxter, S.H. Designing the Pig Pen. In Manipulating Pig Production II; Barnett, J.L., Hennessy, D.P., Eds.; Australasian Pig Science Association: Werribee, Australia, 1989; pp. 191–206. Available online: https://www.apsa.asn.au/wp-content/uploads/2021/11/1989-Manipulating-Pig-Production-II.pdf (accessed on 27 June 2021).
  24. Tan, L.; Gu, X.H. Study on water flow rate, installation height and quantity of pig teat drinking water dispenser. J. Anim. Sci. Vet. Med. 2009, 41, 47–49. [Google Scholar]
  25. Luo, Y.; Xia, J.; Lu, H.; Luo, H.; Lv, E.; Zeng, Z.; Li, B.; Meng, F.; Yang, A. Automatic Recognition and Quantification Feeding Behaviors of Nursery Pigs Using Improved YOLOV5 and Feeding Functional Area Proposals. Animals 2024, 14, 569. [Google Scholar] [CrossRef] [PubMed]
  26. Godyń, D.; Nowicki, J.; Herbut, P. Effects of environmental enrichment on pig welfare—A review. Animals 2019, 9, 383. [Google Scholar] [CrossRef] [PubMed]
  27. Li, X.; Xiong, X.; Wu, X.; Liu, G.; Zhou, K.; Yin, Y. Effects of stocking density on growth performance, blood parameters and immunity of growing pigs. Anim. Nutr. 2020, 6, 529–534. [Google Scholar] [CrossRef]
  28. Edwards, L. Drinking Water Quality and Its Impact on the Health and Performance of Pigs; Innovation Project 2A-118; Co-Operative Research Centre for High Integrity Australian Pork: Willaston, Australia, 2018; Available online: https://porkcrc.com.au/wp-content/uploads/2018/08/2A-118-Drinking-Water-Quality-Final-Report.pdf (accessed on 27 June 2021).
  29. Yazici-Karabulut, B.; Kocer, Y.; Yesilnacar, M.I. Bottled water quality assessment through entropy-weighted water quality index (EWQI) and pollution index of groundwater (PIG): A case study in a fast-growing metropolitan area in Türkiye. Int. J. Environ. Health Res. 2024, 34, 61–72. [Google Scholar] [CrossRef]
  30. Liu, C.; Ye, H.; Wang, L.; Lu, S.; Li, L. Novel tracking method for the drinking behavior trajectory of pigs. Int. J. Agric. Biol. Eng. 2024, 16, 67–76. [Google Scholar] [CrossRef]
  31. Faverjon, C.; Bernstein, A.; Grütter, R.; Nathues, C.; Nathues, H.; Sarasua, C.; Sterchi, M.; Vargas, M.E.; Berezowski, J. A transdisciplinary approach supporting the implementation of a big data project in livestock production: An example from the Swiss pig production industry. Front. Vet. Sci. 2019, 6, 215. [Google Scholar] [CrossRef] [PubMed]
  32. Dohmen, R.; Catal, C.; Liu, Q. Computer vision-based weight estimation of livestock: A systematic literature review. N. Z. J. Agric. Res. 2022, 65, 227–247. [Google Scholar] [CrossRef]
  33. Broom, D.M.; Fraser, A.F. Domestic Animal Behaviour and Welfare, 5th ed.; CABI Publishing: Cambridge, MA, USA, 2015. [Google Scholar]
  34. Ren, Q.; Chen, D.; Cao, S.; Li, X.; Wang, M.; Teng, J.; Du, X.; Huang, Y.; Gao, X.; Liu, C.; et al. The Microbiota Dynamics in Water Distribution System of Pig Farm. Available online: https://papers.ssrn.com/sol3/papers.cfm?abstract_id=4760755 (accessed on 27 June 2021).
  35. Sefeedpari, P.; Pishgar-Komleh, S.H.; Aarnink, A.J. Model Adaptation and Validation for Estimating Methane and Ammonia Emissions from Fattening Pig Houses: Effect of Manure Management System. Animals 2024, 14, 964. [Google Scholar] [CrossRef]
  36. Sanad, H.; Mouhir, L.; Zouahri, A.; Moussadek, R.; El Azhari, H.; Yachou, H.; Ghanimi, A.; Oueld Lhaj, M.; Dakak, H. Assessment of Groundwater Quality Using the Pollution Index of Groundwater (PIG), Nitrate Pollution Index (NPI), Water Quality Index (WQI), Multivariate Statistical Analysis (MSA), and GIS Approaches: A Case Study of the Mnasra Region, Gharb Plain, Morocco. Water 2024, 16, 1263. [Google Scholar] [CrossRef]
  37. Beilage, E.G. Literaturübersicht zur Unterbringung von Sauen währned Geburtsvorbereitung, Geburt und Säugezeit (Hessisches Ministerium für Umwelt, Klimaschutz, Landwirtschaft und Verbraucherschutz). 2020. Available online: https://tierschutz.hessen.de/sites/tierschutz.hessen.de/files/2022-11/literaturuebersicht_unterbringung_sauen_0.pdf#:~:text=Die%20Unterbringung%20von%20Sauen%20w%C3%A4hrend%20der%20Geburtsvorbereitung,#:~:text=Die%20Unterbringung%20von%20Sauen%20w%C3%A4hrend%20der%20Geburtsvorbereitung (accessed on 27 June 2021).
  38. Faucitano, L.; Conte, S.; Pomar, C.; Paiano, D.; Duan, Y.; Zhang, P.; Drouin, G.; Rina, S.; Guay, F.; Devillers, N. Application of extended feed withdrawal time preslaughter and its effects on animal welfare and carcass and meat quality of enriched-housed pigs. Meat Sci. 2020, 167, 108163. [Google Scholar] [CrossRef]
  39. Borell, E.V.; Bonneau, M.; Holinger, M.; Prunier, A.; Stefanski, V.; Zöls, S.; Weiler, U. Welfare aspects of raising entire male pigs and Immunocastrates. Animals 2020, 10, 2140. [Google Scholar] [CrossRef] [PubMed]
  40. Khullar, V.; Singh, H.P.; Miro, Y.; Anand, D.; Mohamed, H.G.; Gupta, D.; Kumar, N.; Goyal, N. IoT Fog-Enabled Multi-Node Centralized Ecosystem for Real Time Screening and Monitoring of Health Information. Appl. Sci. 2022, 12, 9845. [Google Scholar] [CrossRef]
  41. Li, Y.; Wang, C.; Huang, S.; Liu, Z.; Wang, H. Effects of stocking density and toy provision on production performance, behavior and physiological indexes of finishing pigs. Trans. Chin. Soc. Agric. Eng. 2021, 37, 191–198. [Google Scholar]
Figure 1. Intelligent drinking water controller and drinking bowl hardware structure diagram.
Agriculture 14 01525 g001
Figure 2. Picture of the intelligent drinking water controller and drinking bowl.
Agriculture 14 01525 g002
Figure 3. PLC can control 4 drinking bowls.
Agriculture 14 01525 g003
Figure 4. Diagram of the intelligent drinking water controller in automatic mode.
Agriculture 14 01525 g004
Figure 5. Status setting interface based on PLC module.
Agriculture 14 01525 g005
Figure 6. Report display interface based on PLC module.
Agriculture 14 01525 g006
Figure 7. The layout of the experimental pig pen.
Agriculture 14 01525 g007
Figure 8. Breeding environment of fattening pigs under experimental environment.
Agriculture 14 01525 g008
Figure 9. Participating fattening pigs (Landrace × Large White Pigs).
Agriculture 14 01525 g009
Figure 10. A waste sink placed under a drinking bowl to collect wasted water.
Agriculture 14 01525 g010
Figure 11. Temperature, humidity and dew point records in the pig pen during the test.
Agriculture 14 01525 g011
Figure 12. The water consumption recorded by the water meter was compared with that recorded by the flow meter in the experimental group.
Agriculture 14 01525 g012
Figure 13. The ratio of average water waste and average drinking water consumption to actual water consumption during the experimental and control groups.
Agriculture 14 01525 g013
Figure 14. Water quality data of control group and experimental group during the experiment.
Agriculture 14 01525 g014
Table 1. The number of water fountains was set in the experimental group and the control group.
Experimental ArrangementExperimental GroupControl Group
6 June 2024–26 June 2024
Fattening pigs (100–110 kg)
6 pens, 2 intelligent drinking
water controllers per pen (12 in total)
6 pens, 2 ordinary drinking bowls
per pens (12 in total)
Table 2. The average daily water consumption per pen and the average daily water consumption per pen per pig during the experiments for the experimental and control groups.
Experimental GroupDWEControl GroupDWC
Pen 18.09Pen 210.07
Pen 3/1Pen 46.50
Pen 57.24Pen 69.13
Pen 76.41Pen 88.05
Pen 97.26Pen 1011.34
Pen 115.12Pen 128.41
Average6.82 ± 1.12 aAverage8.92 ± 1.86 b
1 During the experiment, experiment fence 3 was damaged two days before the experiment, and the water consumption increased sharply. Although measures were taken to repair it in time, the recorded data did not have statistical value, so it will not be shown here. Note: Different lowercase letters indicate a significant difference in the same row (p < 0.05).
Table 3. The average amount of water wasted per day per fattening pig in the experimental and control groups during the trial period.
Experimental GroupWasted Water/LControl GroupWaste Water/L
Pen 11.31Fence 24.08
Pen 30.57Fence 43.50
Pen 51.12Fence 63.65
Pen 72.01Fence 89.22
Pen 91.12Fence 1010.88
Pen 111.69Fence 126.56
Sum total7.81 aSum total37.89 b
Average1.30 ± 0.50Average6.32 ± 3.14
Note: Different lowercase letters indicate a significant difference in the same row (p < 0.05).
Table 4. The average utilization rate of water resources per pen during the experiments in the experimental group and control group.
Experimental Group
η E
Control Group
η E
Pen 197.69%Fence 294.21%
Pen 3/1Fence 492.30%
Pen 597.79%Fence 694.29%
Pen 795.52%Fence 883.64%
Pen 997.80%Fence 1086.30%
Pen 1195.29%Fence 1288.86%
Average96.64% ± 1.4% aAverage90.08% ± 4.29% b
1 During the experiment, experiment fence 3 was damaged two days before the experiment, and the water consumption increased sharply. Although measures were taken to repair it in time, the recorded data did not have statistical value, so it will not be shown here. Note: Different lowercase letters indicate a significant difference in the same row (p < 0.05).
Table 5. Average weight gain per fattening pig per pen during the experiments in the experimental and control groups.
Experimental GroupControl Group
PensME/kgPensMC/kg
Pen 124.77 ± 4.44Pen 214.88 ± 2.39
Pen 315.60 ± 3.81Pen 414.25 ± 1.71
Pen 517.85 ± 1.72Pen 619.43 ± 2.11
Pen 715.00 ± 3.75Pen 821.87 ± 4.90
Pen 914.65 ± 2.33Pen 1016.63 ± 4.35
Pen 1115.85 ± 0.21Pen 1214.23 ± 5.42
DME0.82 ± 0.17 aDMC0.80 ± 0.14 b
FCRE3.10 aFCRC3.18 b
Note: Different lowercase letters indicate a significant difference in the same row (p < 0.05).
Table 6. The average number and duration of drinking water per day in each circle during the ex periment in the experimental group and control group.
Experimental GroupDrinking FrequencyDrinking Duration/sMean Drinking Time/s
Pen 1248.783130.9212.58
Pen 3244.303559.6514.57
Pen 5307.653465.1011.26
Pen 7222.232924.8013.16
Pen 9353.044550.4712.89
Pen 11244.253109.7012.73
Average270.043456.7712.80
Disclaimer/Publisher’s Note: The statements, opinions and data contained in all publications are solely those of the individual author(s) and contributor(s) and not of MDPI and/or the editor(s). MDPI and/or the editor(s) disclaim responsibility for any injury to people or property resulting from any ideas, methods, instructions or products referred to in the content.

