Article

Microbiological Soil Quality Indicators Associated with Long-Term Agronomical Management of Mediterranean Fruit Orchards

1
International PhD Course on Bioecosystems and Biotechnology, Università degli Studi della Basilicata, Viale dell’Ateneo Lucano, 10, 85100 Potenza, Italy
2
Olive Institute, University of Sfax, Sfax 3000, Tunisia
3
Ages s.r.l. s—Spin-off Accademico, Università degli Studi della Basilicata, Viale dell’Ateneo Lucano, 10, 85100 Potenza, Italy
4
Consiglio per la Ricerca in Agricoltura e l’Analisi dell’Economia Agraria (CREA), Centro di Ricerca Orticoltura e Florovivaismo, Via Cavalleggeri, 25, 84098 Pontecagnano Faiano, Italy
5
Degree Course of Agriculture, Università degli Studi di Salerno, Via Giovanni Paolo II, 132, 84084 Fisciano, Italy
*
Author to whom correspondence should be addressed.
Agriculture 2024, 14(9), 1527; https://doi.org/10.3390/agriculture14091527
Submission received: 11 July 2024 / Revised: 21 August 2024 / Accepted: 28 August 2024 / Published: 5 September 2024
(This article belongs to the Section Agricultural Soils)

Abstract

:
Soil microorganisms play a crucial role in maintaining soil fertility sensu lato. Sustainable soil management aims to make the soil environment more hospitable increasing microorganism diversity and complexity by means of the minimal disturbance of soil and inputs of organic material. This results in the effective functioning of agricultural systems, better crop productivity, and a reduction in environmental impacts. A study was carried out to evaluate the effects of the long-term application (more than 15 years) of sustainable practices versus conventional ones on soil microbial biomass activity and its functional diversity within different Mediterranean commercial fruit orchards located in Southern Italy. A preliminary survey—performed using the electromagnetic induction technique (EMI)—guided the collection of representative soil samples by reducing the spatial heterogeneity of soil microorganisms. Soil management practices, based on no tillage and the recycling of organic materials of different origins and quality produced within the orchard, increased soil organic carbon, telluric microorganisms activity and their functional diversity compared to ‘non-conservative’ management methods such as continuous tillage. In addition, the rational use of the orchard-inside organic matter (natural/seeded grass cover and pruning material) allowed it to virtuously transform from useless waste into precious resources, eliminating the logistical and economic constraints for their disposal. The simultaneous use of different types of soil management strategies aimed at soil conservation reinforced the positive effects on the microbiological indicators of soil quality rather than the application of a single strategy. This study provides the opportunity to represent what could be the possible evolution of tilled orchards towards more balanced soil conditions when subjected to conservative practices, offering a reference model for fruit growers and technicians who want to improve the stability and the resiliency of their agrosystems.

1. Introduction

Soil fertility management is a key factor for developing sustainable agriculture models worldwide and targets soil quality monitoring in order to optimize the planning of farming practices [1]. Soil quality results from the complex interactions among its physical, chemical, and biological features and can be described and properly assessed by determining a huge number of parameters [1,2]. Soil enzymatic activities and microbial-modulated processes show a quicker responsiveness to environmental changes than chemical and physical properties [3]. In this view, a lot of biological soil quality indicators have been proposed, including soil microbial biomass C, extracellular enzyme activity, and soil respiration rate [4,5,6,7]. Besides the size of microbial biomass, its functional and structural diversity has ecological relevance as well. Accordingly, there is a keen interest in understanding the factors that regulate its size, development, and structure. Soils managed with organic inputs generally have larger and more active microbial populations than those managed with mineral fertilizers [4,8,9,10,11]. Soil microbial biomass and activity are greatly stimulated by the addition of manure through the modification of soil physical characteristics and the addition of readily available C for microbial populations [12,13].
The soil’s organic matter cycle is the fuel for the telluric microbial engine, and all agronomic practices that result in inputs (soil amendment, cover cropping, etc.) and losses (tillage, continuous replanting, etc.) of organic matter can impact its functionality. Organic matter mineralization is catalyzed by the action of the microbial communities; therefore, by following their growth, composition, and activity, useful information regarding their impact on the telluric ecological systems can be derived [14,15,16,17,18]. It follows that those agricultural practices, such as organic, biodynamic-based, and low-input protocols taken over the long term, as alternatives to conventional agricultural techniques based on mineral fertilizers and continuous tillage affecting organic matter levels, can have significant effects on soil biological properties [19]. However, space variability in the physico-chemical soil features may differentially modulate the net presence of organic matter that settles in the soil, and consequently, microbiological indicators may appear to fluctuate within the orchard [20]. The spatial heterogeneity of soil microorganisms can make the interpretation of data on microbial diversity very difficult, so requesting the collection of representative soil samples is useful for giving relevance to the processed data [21]. Therefore, in addition to a consistent indicator of soil quality, it is necessary to rely on soil sampling techniques that tend to minimize this spatial variability and allow for the examination of data from homogeneous areas. For this purpose, the electromagnetic induction technique (EMI) is a valuable method for the collection of spatially oriented samples [22]. It is a non-invasive geophysical technique that measures the apparent soil electrical conductivity (ECa) by inducing an electrical current in the soil. Measurements are taken quickly in the field, and the volume of measurement is large, perhaps 2–3 m3, reducing local scale variability. As reported by Greenhouse and Slaine [23], ECa is a depth-weighted, average conductivity measurement for a column of earthen materials to a specific depth. Variations in ECa depend on changes in the electrical conductivity of such earthen materials. Particularly, ECa will increase with increases in soluble salt, water, clay contents, temperature, etc. Therefore, EMI is an effective way of obtaining spatially distributed ECa that can be used to map the above-cited soil physical-chemical properties at the intermediate spatial scale which, in turn, affect the cycle of soil microorganisms [24,25,26,27,28,29].
Taking into account what has been previously reported, a study was set up to determine the effects of soil management practices (conservative versus not conservative with relation to soil organic matter) on soil microbial biomass activity and functional diversity within different Mediterranean commercial fruit orchards. Particularly, the latter were characterized by different soil management histories that had been applied over a long period of time. Among the fruit orchard management techniques, the biodynamic method was also considered. This latter strategy, which is not yet widespread in Italy and other European countries, needs long-term scientific results for its validation.. The experimental orchards are located within two important agricultural production areas in Southern Italy, characterized by different pedoclimatic conditions, to broaden the experimental case series. The EMI technique was used to guide and optimize the collection of representative soil samples to be analyzed for chemical and microbiological characterization.

2. Materials and Methods

2.1. Study Cases

This study was carried out on six commercial Mediterranean fruit orchards grown in two different pedoclimatic areas of Southern Italy: Metapontino and Piana del Sele. The former is a very important agricultural area of the Basilicata region (40°12′ N 16°40′ E; 25 m a.s.l.). Fruit harvested in this area plays a leading role in the Italian agricultural economy. The climate of this area is semi-arid, with hot, dry summers and mild and rainy winters. Precipitation is not uniform and is concentrated mostly in the winter season. The average annual rainfall is 539 mm, and the annual mean temperature is 16.8 °C. Soil is clay loam and classified according to IUSS WRB as Calcic Luvisols [30]. Piana del Sele is an agricultural area within Salerno province in the Campania region (40°36′ N 15°03′ E; 145 m a.s.l.). The climate is temperate and rainy. The annual mean temperature is 15.4 °C and the average rainfall is 842 mm. Soil is clay and classified according to IUSS WRB as Pachic Phaeozems [31]. The climate features of the areas under study make them very vulnerable to soil desertification risks. In most agricultural systems in these areas, soil fertility is deteriorating over time. In the above-described experimental areas, a preliminary survey was carried out to identify which soil management systems were the most used in the local fruit orchards. For this purpose, the Agricultural Extension Services of the two regions provided a list of agricultural farms that cultivate fruit trees. General data on farms (species and cultivar, plant age, density, and training systems) and those regarding soil management (pruning material management, number of tillage operations per year, type of herbaceous ground cover—natural or seeded—and its management, chemical weeding, etc.) were collected by means of interviews with the growers in the list. From data elaboration, six representative fruit orchards, characterized by a different and long history of soil management (application of more than 15 years), were identified:
  • Plum BioDynamic (Pl-BioD): the soil was not tilled but covered by seeded grasses—mowed in April, June, and July—and by shredded pruning material (September). Plant residues were left on the ground as mulch;
  • Peach Organic system (Pe-Org): the soil was managed as above, except for the time of grass mowing (May and June) and pruning shredding (January);
  • Apricot Conventional Tillage (Ap-CT): the soil was tilled at 20–25 cm depth throughout the year by a milling machine with the aim of maintaining it free from weeds. Pruning material was left on the ground as mulch in September;
  • Plum Conventional Tillage (Pl-CM): the soil of inter-rows was temporarily covered by spontaneous grasses—from autumn until spring—and tilled at least twice a year by means of a motor hoe operating at 10 cm depth. Plant residues were left on the ground as mulching. Weeds in the row under the trees were managed by mechanical weeding. Pruning residues were shredded and left on the ground as mulch in September;
  • Kiwi Conventional Management (Ki-CM): the soil was managed according to the local best management practices (BMPs) adopted within Piana del Sele. In particular, soil between the rows was covered by natural grasses which were mowed three times per year and left on the ground as mulching. In the rows under the trees, weeds were controlled by chemical weeding (Glyphosate). Pruning material was shredded and left in the rows as mulch;
  • Peach Conventional Management (Pe-CM): the soil was managed following the same criteria used for Ki-CM.
The first four fruit orchards were placed in the Metapontino area, and the remaining two within Piana del Sele. Details on fruit tree orchard history, characteristics, and management are reported in Table 1 and Table 2. Pruning material was, on average, 6.6 tons h−1 y−1 in Pl-BioD and Pe-Org, 3.5 tons h−1 y−1 in Ki-CM and Pe-CM systems, and about 2.5 tons h−1 y−1 in Ap-CT and Pl-CM (values are expressed on a dry weight basis). Plant residues (natural or seeded) were equal to 2.5 tons h−1 y−1 in Pl-BioD, Pe-Org, Ki-CM, and Pe-CM systems, and about 1 ton h−1 y−1 in Ap-CT and Pl-CM (values are expressed on a dry weight basis). The carbon to nitrogen ratio (C/N) ranged from 40 (twigs and leaves) to 62 (branches) for pruning materials and less than 18 for cover crops (essentially leguminous plants, seeded or natural). Fruit production for each orchard system under study was comparable to productive data of orchard systems grown according to the same soil management practices within the two geographical areas in consideration, Metapontino and Piana del Sele.

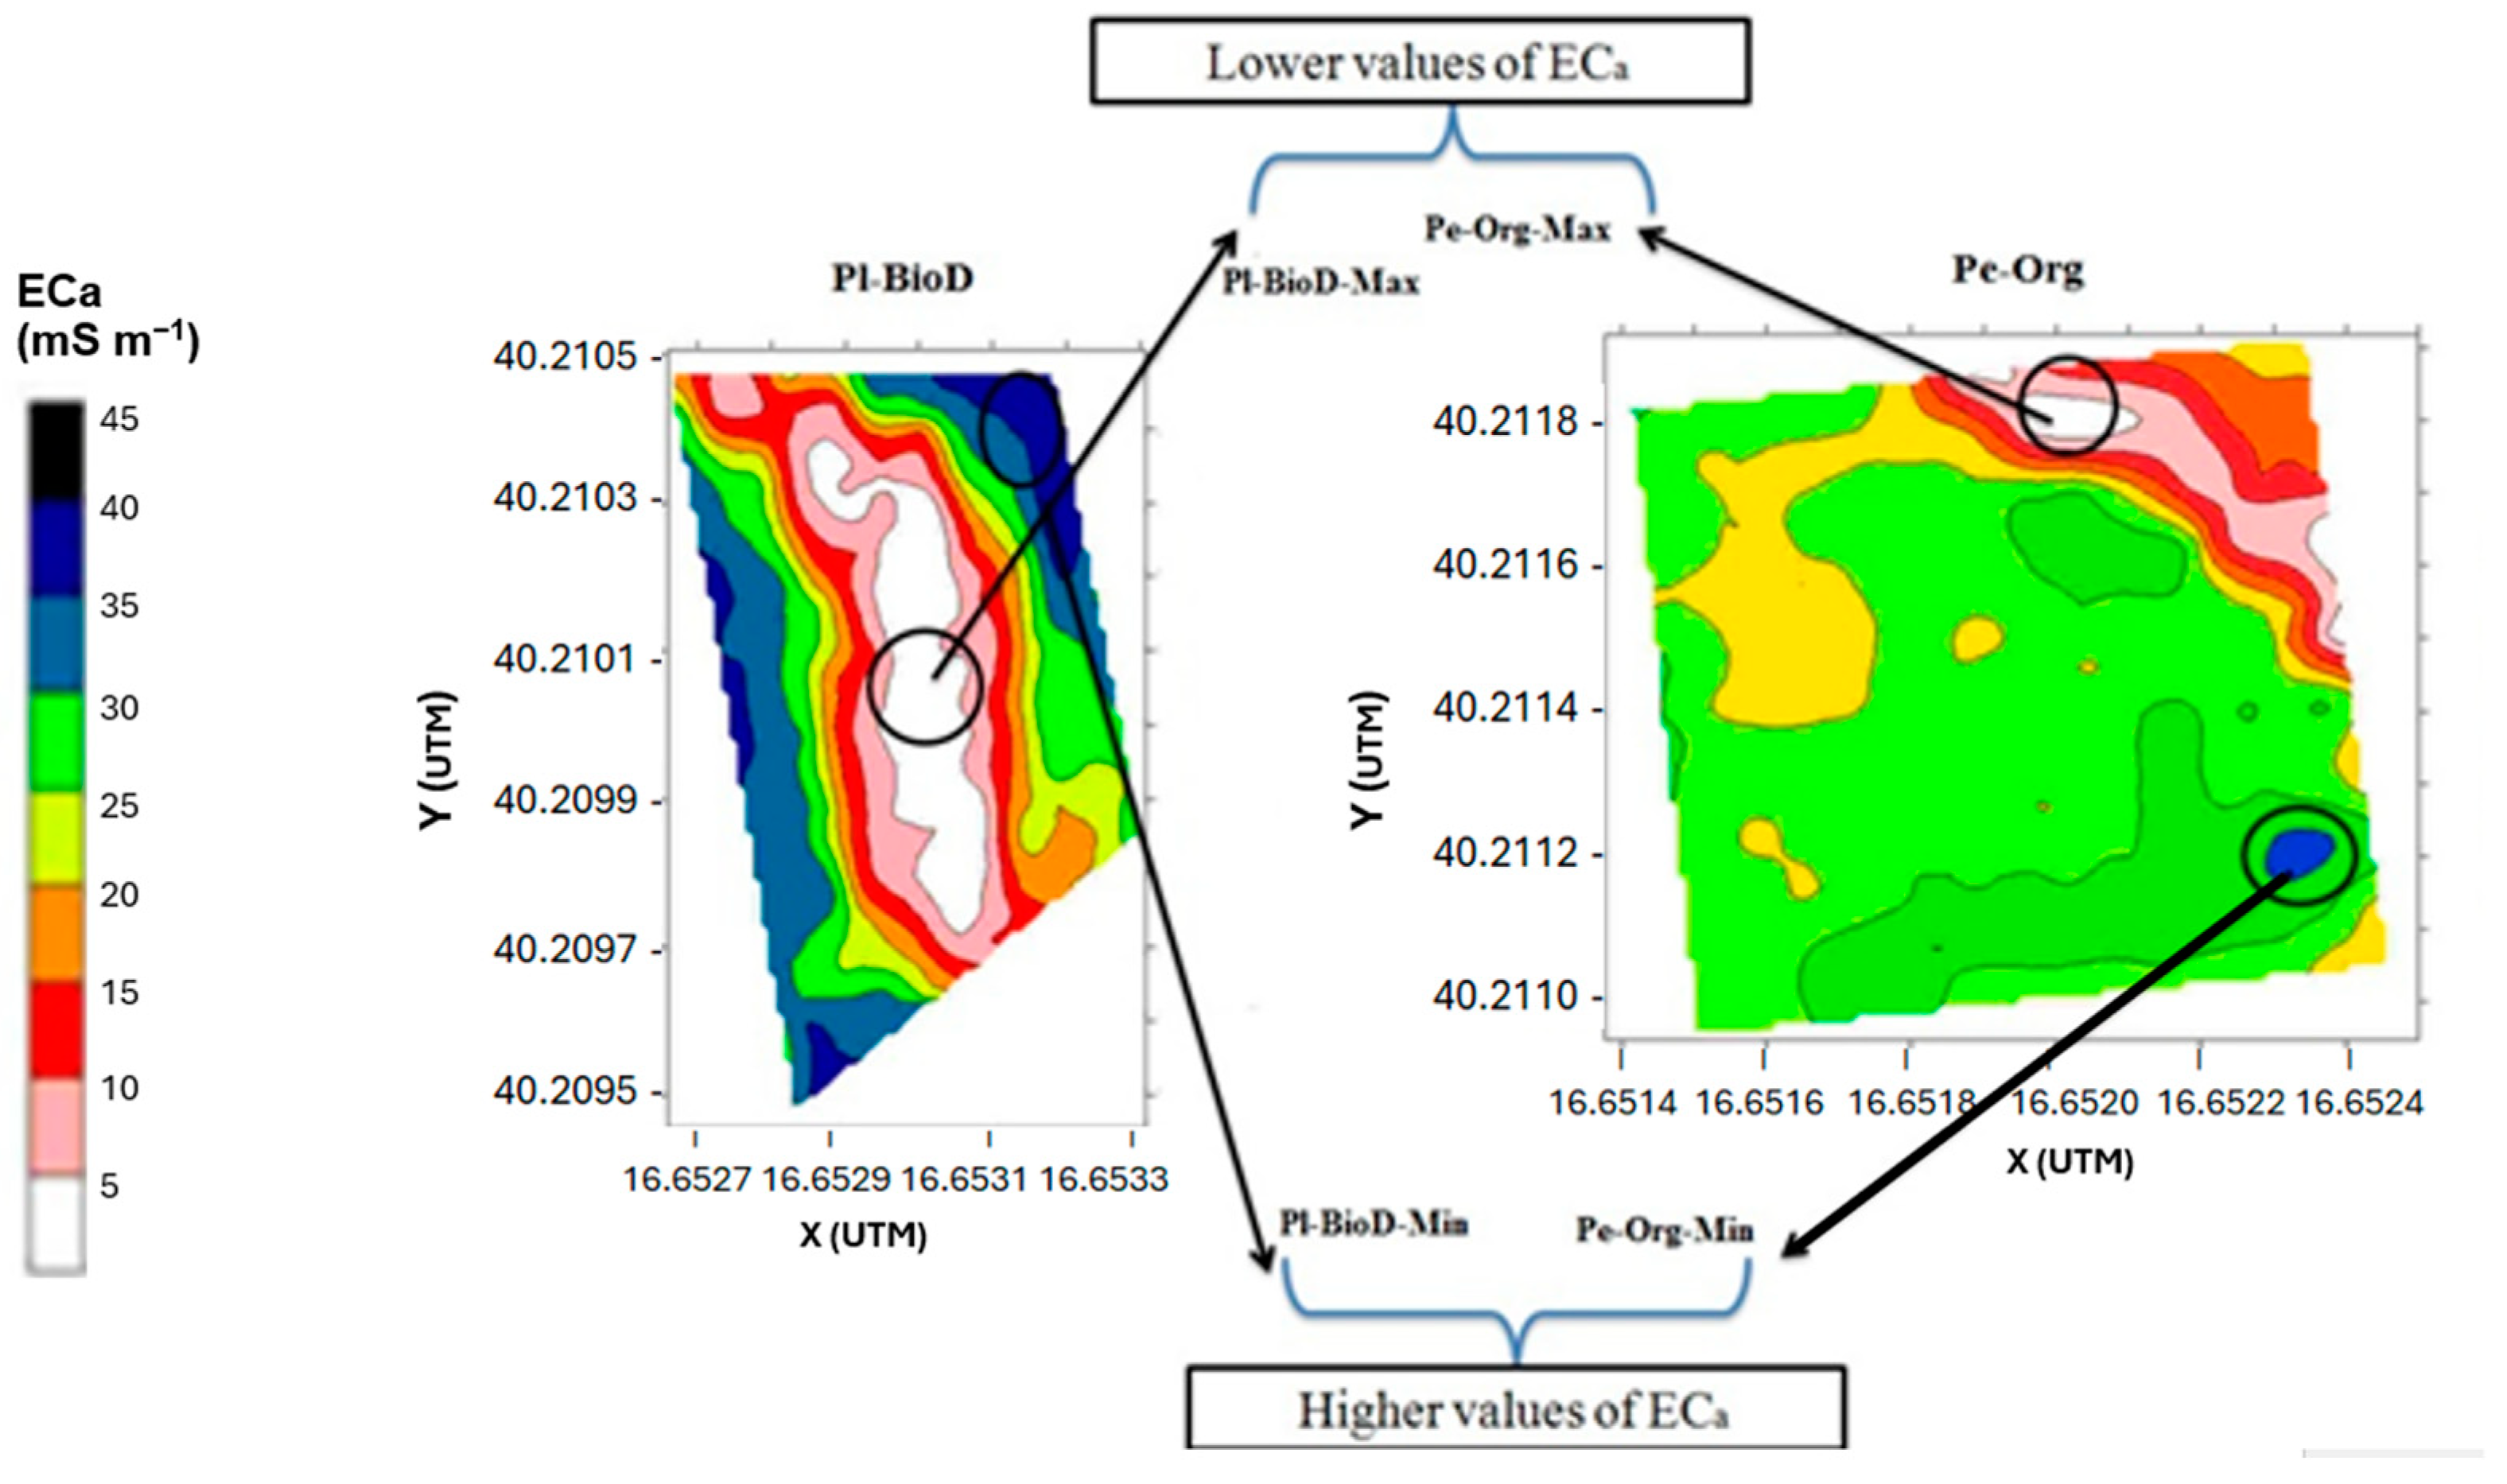
2.2. Electromagnetic Induction Acquisitions and Identification of Sampling Zones within the Experimental Fruit Orchards

EMI measurements were performed on 22 and 23 May 2014 within the experimental fruit orchards using a multi-frequency EMI sensor (GSSI Profiler EMP-400). The profiler can operate to simultaneously measure up to 3 frequencies between 1 kHz and 16 kHz, with intercoil spacing of 1.2 m. For this study, we chose to operate at 3, 7, and 14 kHz to extract information about different soil layers. The instrument was used in vertical dipole mode (VDP). The depths of the magnetic field penetration were about 1.5 m for VDP modes [32]. The instrument sensitivity varies as a non-linear function of depth [33]. ECa value outputs (mS m−1) of the Profiler were used. The instrument was calibrated according to its technical standards. The acquisition modality was 0.75 s each using continuous mode data collection. ECa measurements were made by walking along each inter-row at a speed of about 4–5 km h−1. All ECa points acquired were georeferenced using the Tripod Data System Recon PDA with integrated Bluetooth service and Holux™ WAAS-GPS with differential correction HDOP allows one to estimate the accuracy of GPS horizontal (latitude/longitude) position fixes by adjusting the error estimates according to the geometry of the satellites used. Then, EMI maps were made by processing survey data using the kriging method (singular cell 1 × 1 m) with MagMap2000© and Surfer Golden software© (Version 8).

2.3. Soil Sampling

EMI maps guided soil samplings which were performed within all the identified fruit orchards after the EMI survey on 22 and 23 May 2014. Soil samples were taken from two zones identified within each orchard by EMI survey and characterized by the highest values of ECa (ECa-max) and the lowest ones (ECa-min). Five soil samples from each zone (Pl-BioD ECa-max, Pl-BioD ECa-min; Pe-Org ECa-max, Pe-Org ECa-min; Ap-CT ECa-max, Ap-CT ECa-min; Pe-CM ECa-max, Pe-CM ECa-min; Ki-CM ECa-max, Ki-CM ECa-min; Pl-CM ECa-max, Pl-CM ECa-min) were taken from the 0–30 cm soil layer. Then, a portion of each soil sample was air-dried overnight for chemical analysis. The other portion was stored at 4 °C for the microbiological analyses.

2.4. General Soil Analysis

Soil samples were air-dried overnight and then passed through a 2 mm sieve to have a skeleton fraction (>2 mm). On soil fine fraction < 2 mm, soil pH, and electrical conductivity (EC) were determined using soil/water suspensions (1/1, w/v) after 15 min of stirring and 10 min of centrifugation. Soil organic carbon (SOC) content was determined by dichromate oxidation using the Walkley and Black method [34]. Soil texture was measured by dispersion of the soil sample with the sodium hexametaphosphate (SHMP) and anhydrous sodium carbonate (Na2CO3) and the separation and determination of various particle sizes [35].

2.5. Microbiological Activity Analysis

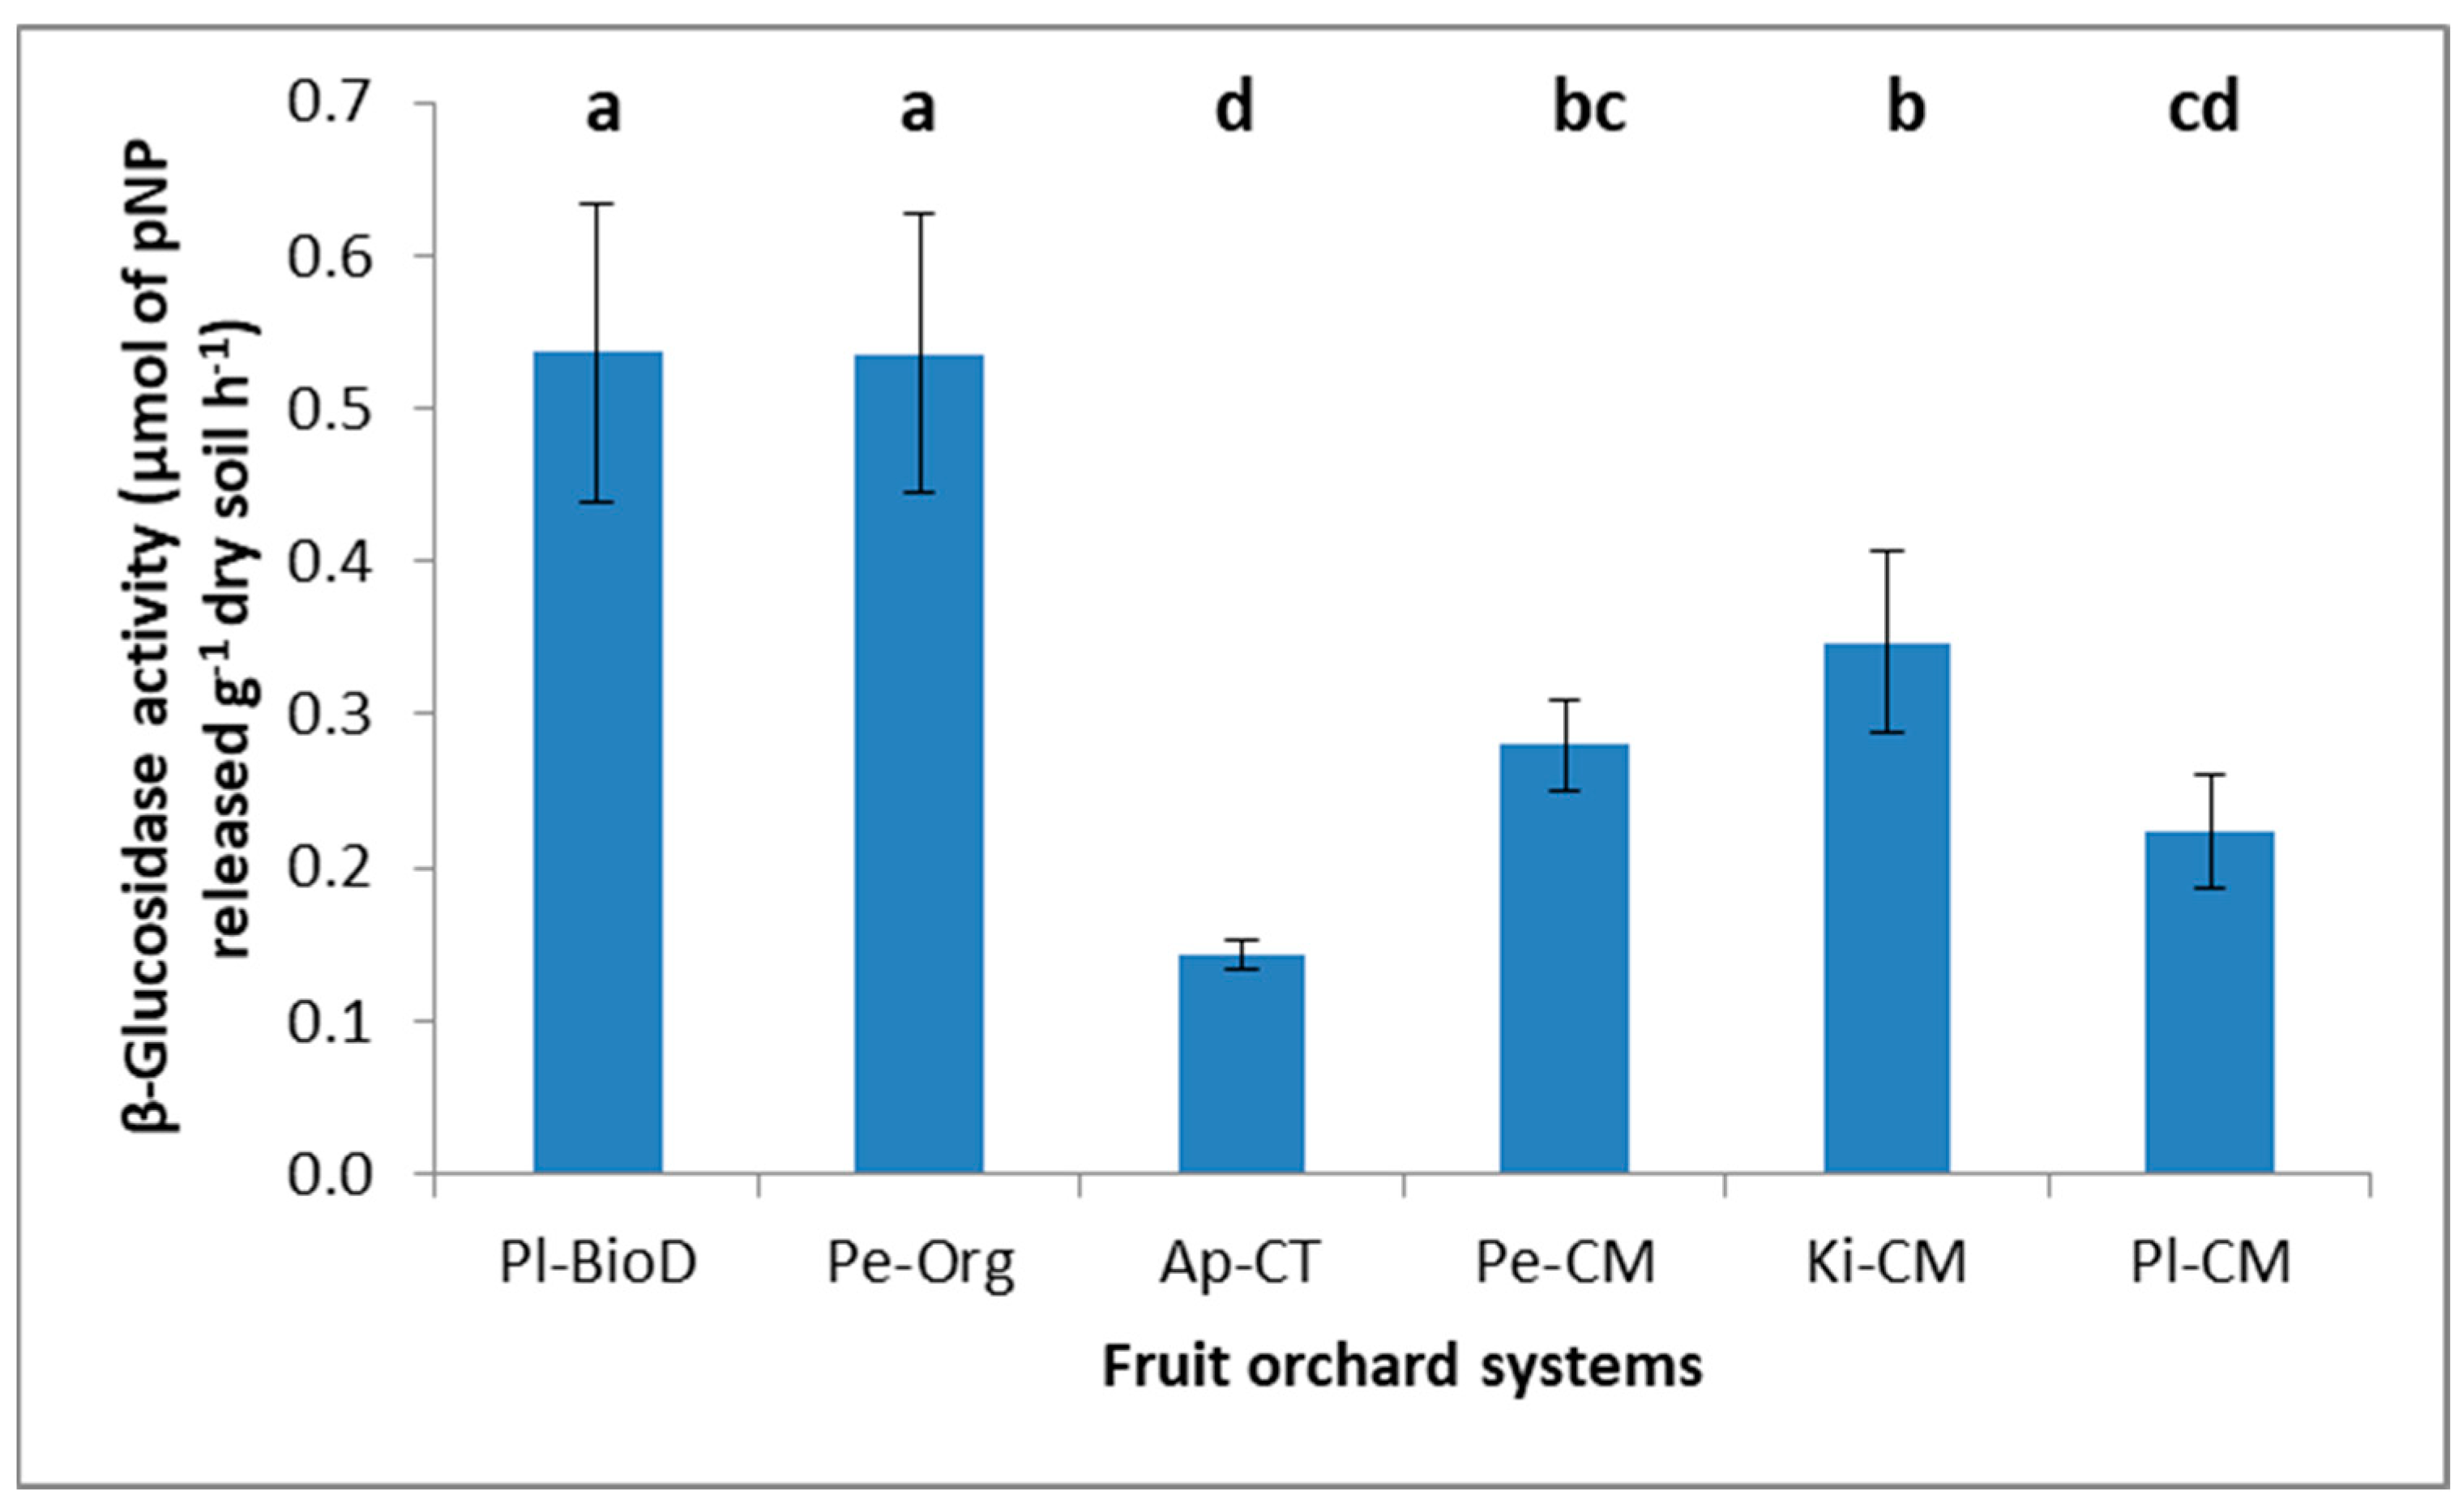
2.5.1. β-Glucosidase Assay

β-glucosidase activity was assayed using the method of Eivazi and Tabatabai [36], using the substrate analog para-nitrophenyl-β-D-glucopranoside (pNPG). The concentrations of buffer and terminator solutions were increased from those used in the original method to account for the greater buffering capacity of our soils. Moist soil (1.00 g) was weighed into screw-cap glass test tubes and incubated for 1 h in a water bath at 37 °C with 4 mL of 0.05 M modified universal buffer (pH 6.0) and 1 mL of 25 mM pNPG (5 mM final concentration) dissolved in buffer. The reaction was terminated by adding 1 mL of 0.5 M CaCl2 and 4 mL of 0.2 M Tris–hydroxymethyl (aminomethane), adjusted to pH 12 with NaOH. The mixture was centrifuged for 10 min at 1500 g, and the absorbance was measured at 400 nm. Values were corrected for a blank (substrate added immediately after the addition of CaCl2 and Tris–NaOH) and for the adsorption of released para-nitrophenol (pNP) in the soil [37]. β-glucosidase activity was expressed as µmol of pNP released g−1dry soil h−1.

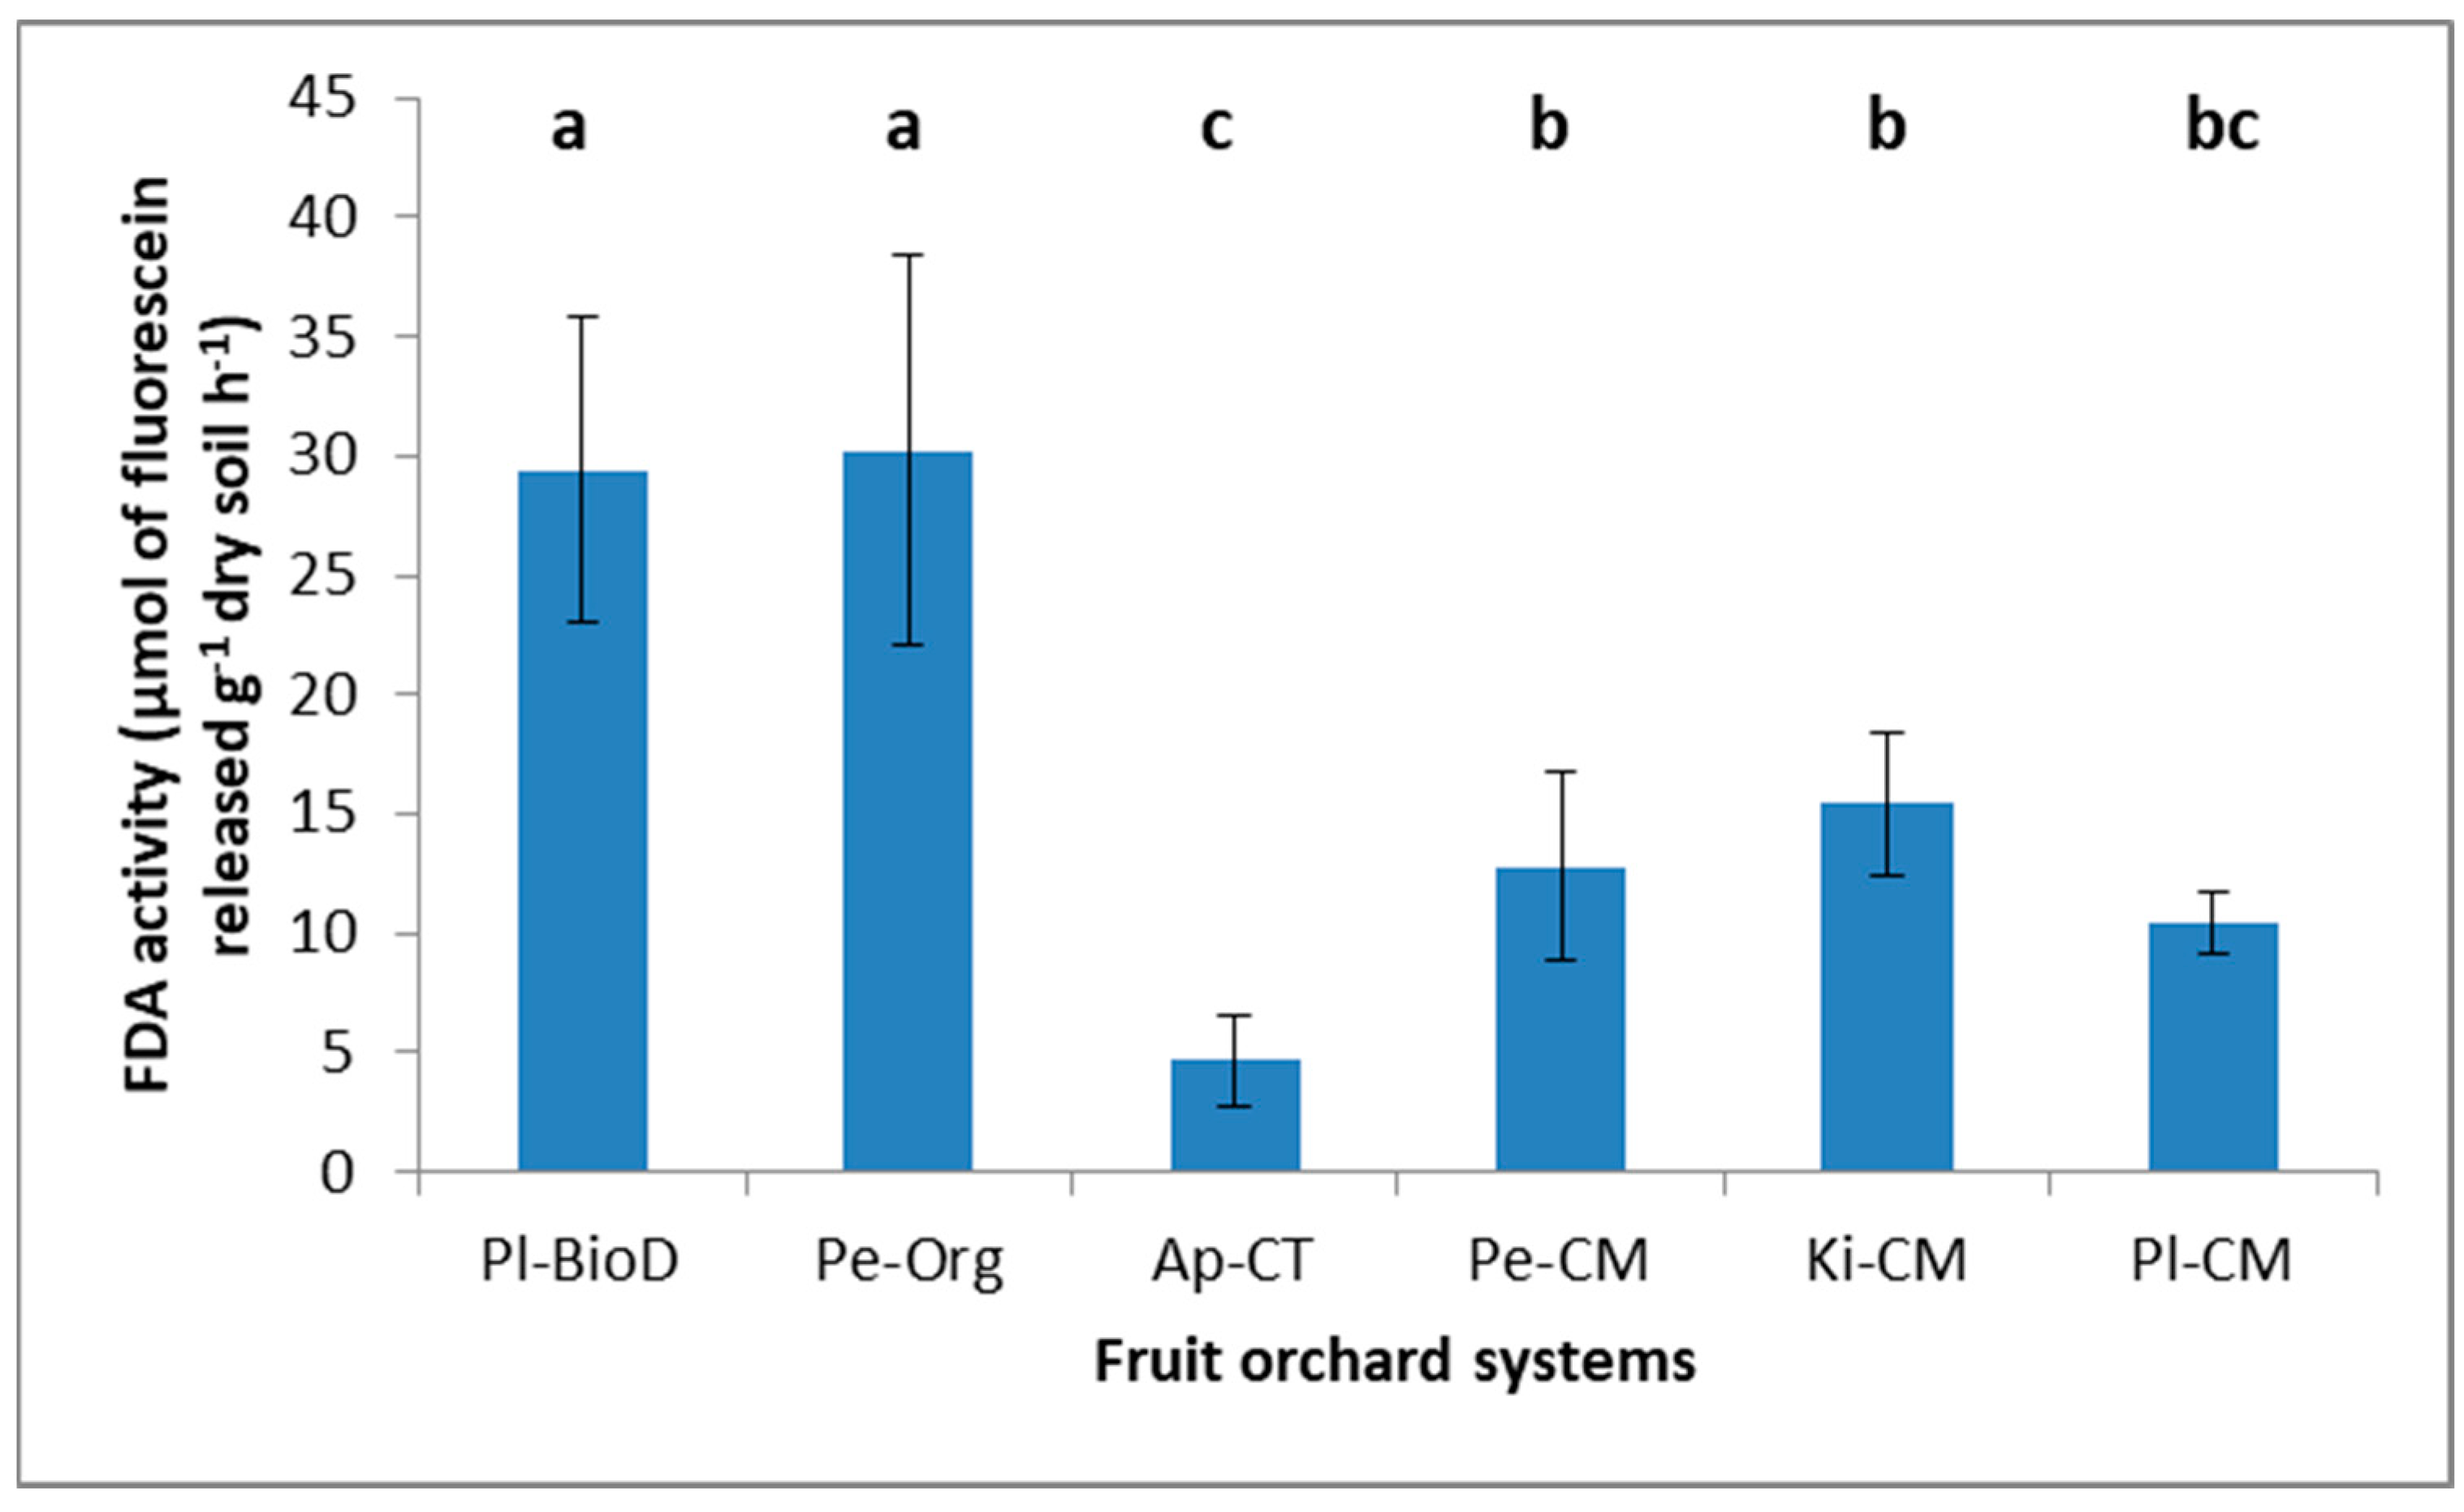
2.5.2. Fluorescein Diacetate Hydrolysis Assay

The fluorescein diacetate hydrolysis (FDA) assay measures the enzyme activity of microbial populations and can provide an estimate of overall microbial activity in an environmental sample. The assay is considered non-specific because it is sensitive to the activity of several enzyme classes, including lipases, esterases, and proteases. The activity of these enzymes results in the hydrolytic cleavage of FDA (colorless) into fluorescein (fluorescent yellow-green). FDA hydrolysis was performed following a procedure adapted from Ntougias et al. [38]. A soil sample of 2.5 g was added to 15 mL of 0.2 M potassium phosphate buffer, pH 7.6. Enzymatic hydrolysis started by adding 0.5 mL FDA solution (2 mg mL−1). The sample was shaken for 2 h in an orbital incubator and the hydrolysis reaction was stopped by adding 15 mL CHCl3/CH3OH (2:1 v v−1). Following centrifugation (700× g) and filtration of the aqueous phase, the absorbance of filtrates was measured at 490 nm using a spectrophotometer. Blanks, without the addition of FDA, were also included to correct for background absorbance, and the amount of fluorescein release was determined against a calibration curve. Fluorescein diacetate hydrolysis activity is expressed as µmol of fluorescein released g−1dry soil h−1.

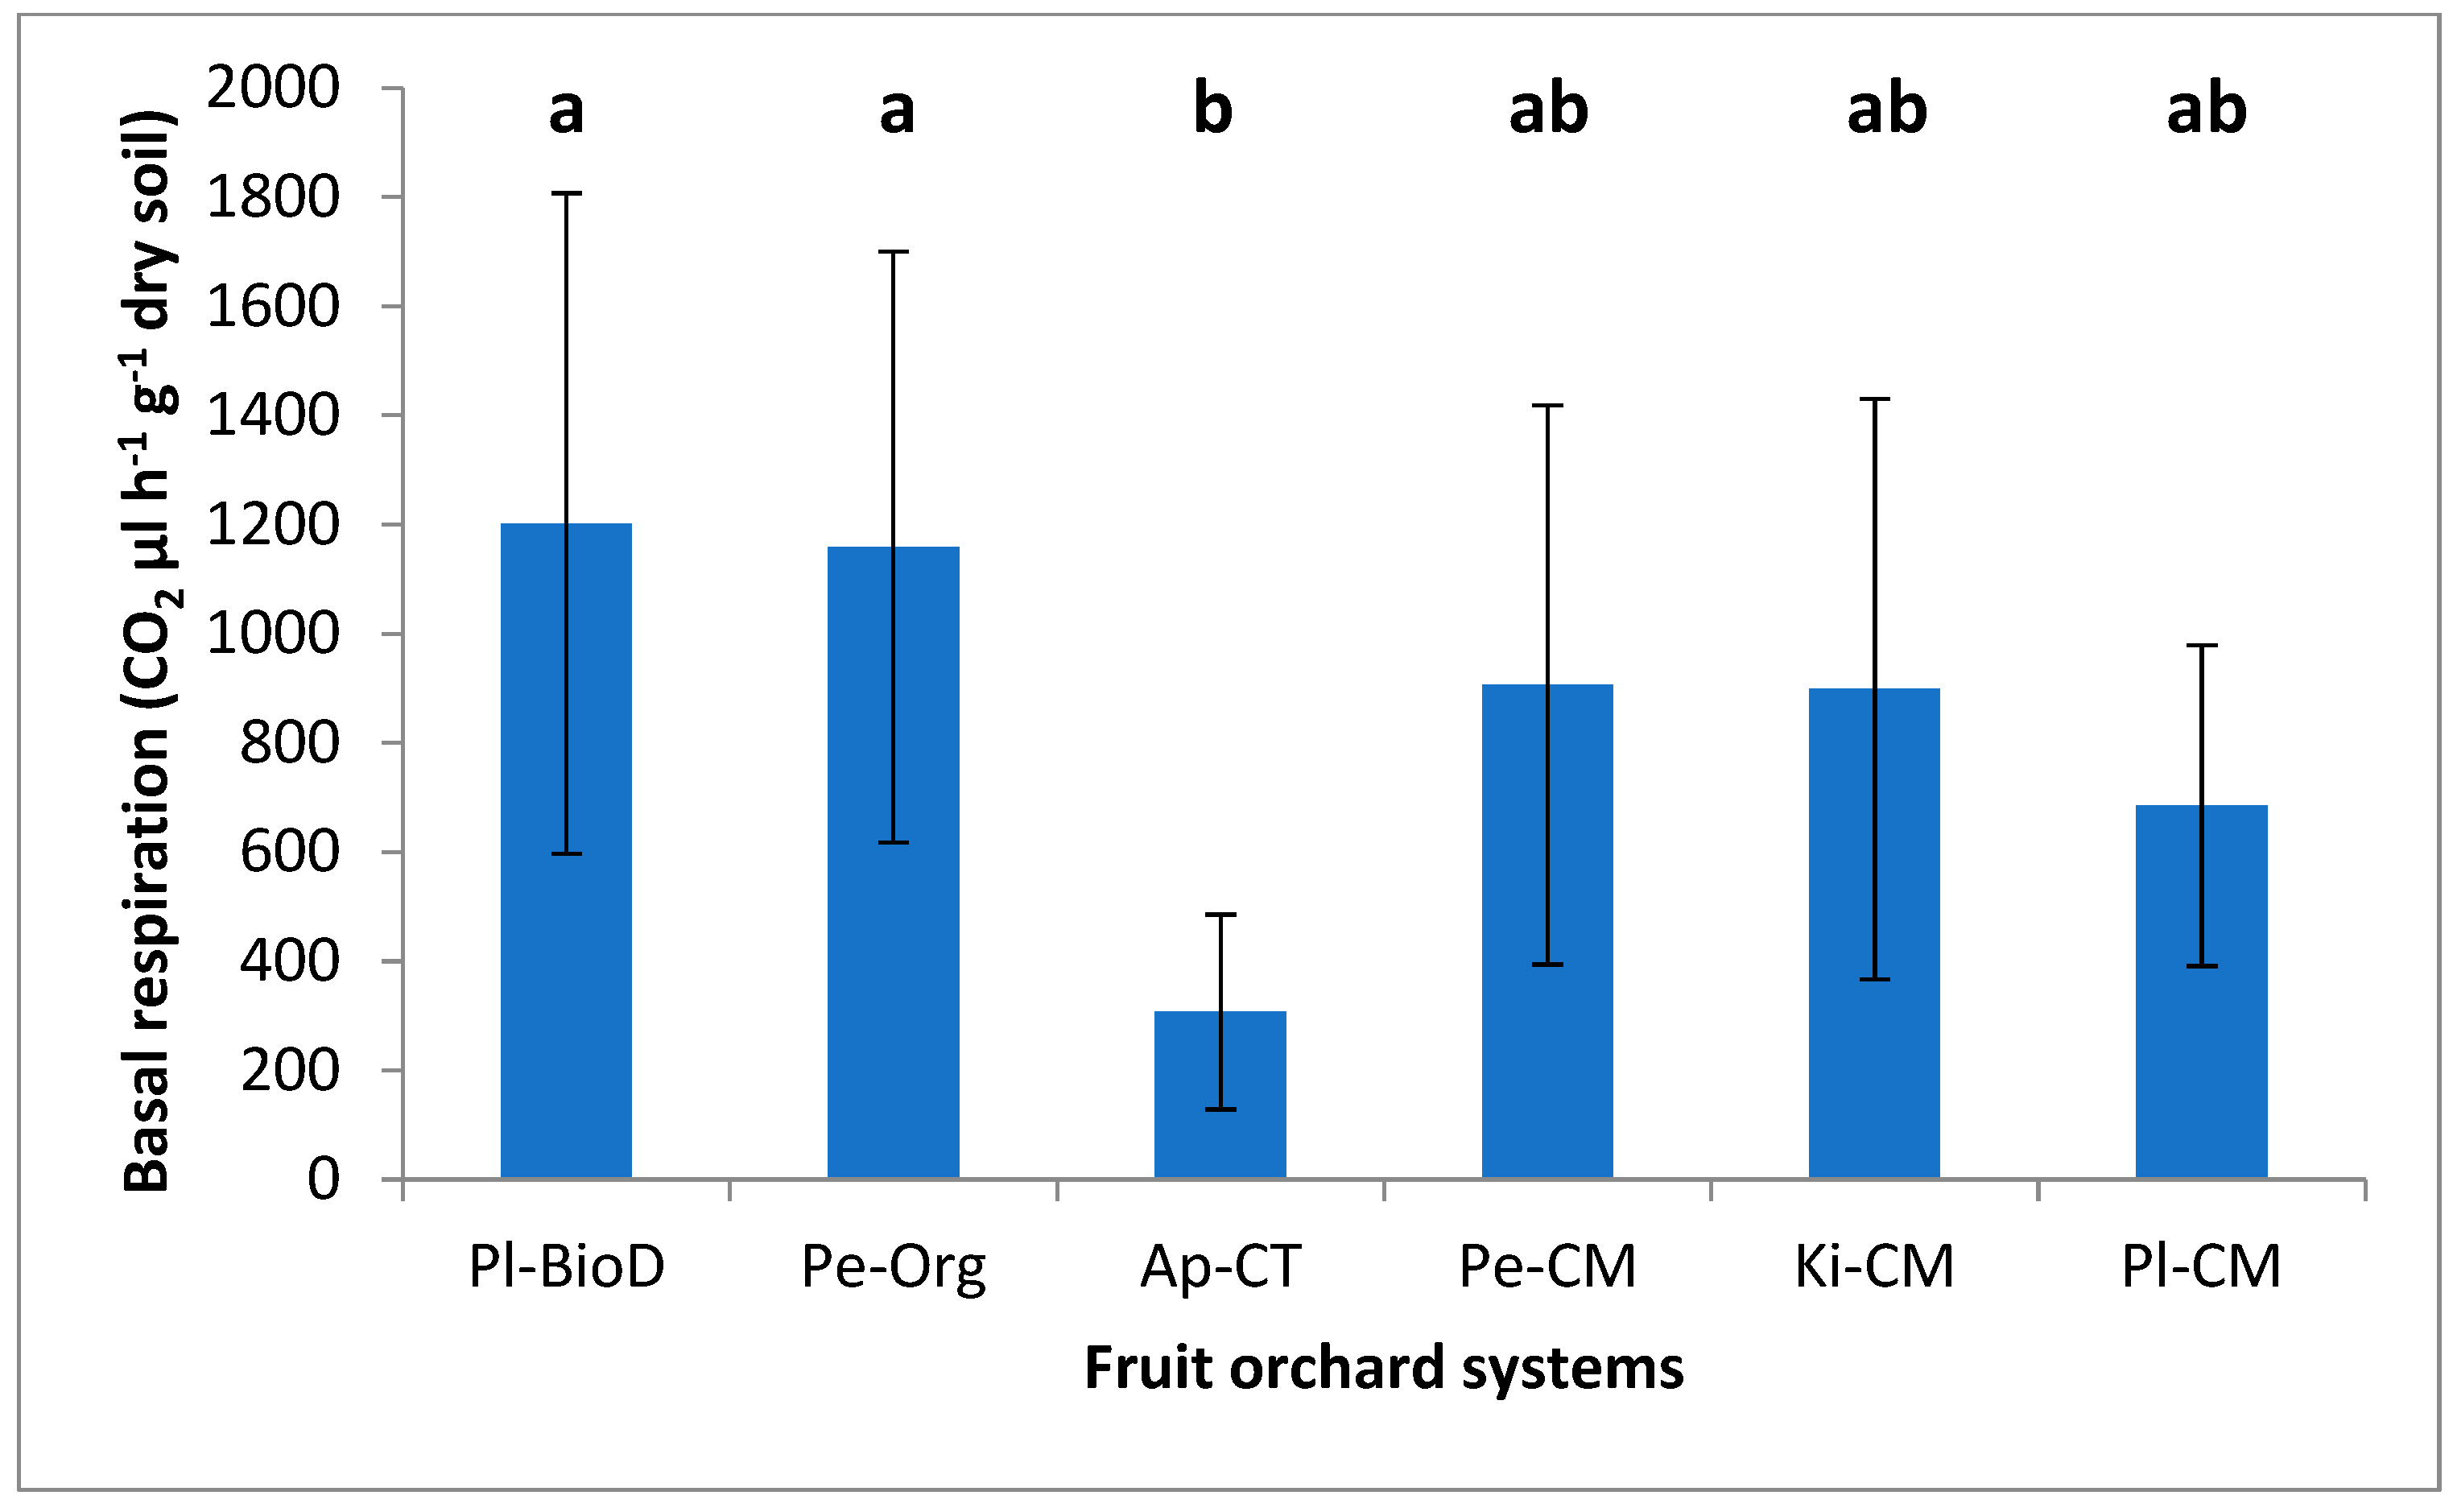
2.5.3. Soil Basal Respiration

Soil basal respiration (Resp) measurement was detected through CO2 production rate expressed as CO2 µL h−1 g−1 dry soil. It was measured in soil samples as described by Perez-Piqueres et al. [39] with some modifications. For basal respiration, fresh soil—equivalent to 100 g of soil dry weight—was placed in a jar (500 mL) with an airtight cap, and then water was added until 80% field water capacity was reached. CO2 concentration was measured using the CO2 Analyzer IRGA SBA-4 OEM (PP Systems, Amesbury, MA, USA) for a maximum acquisition time of 1 min.

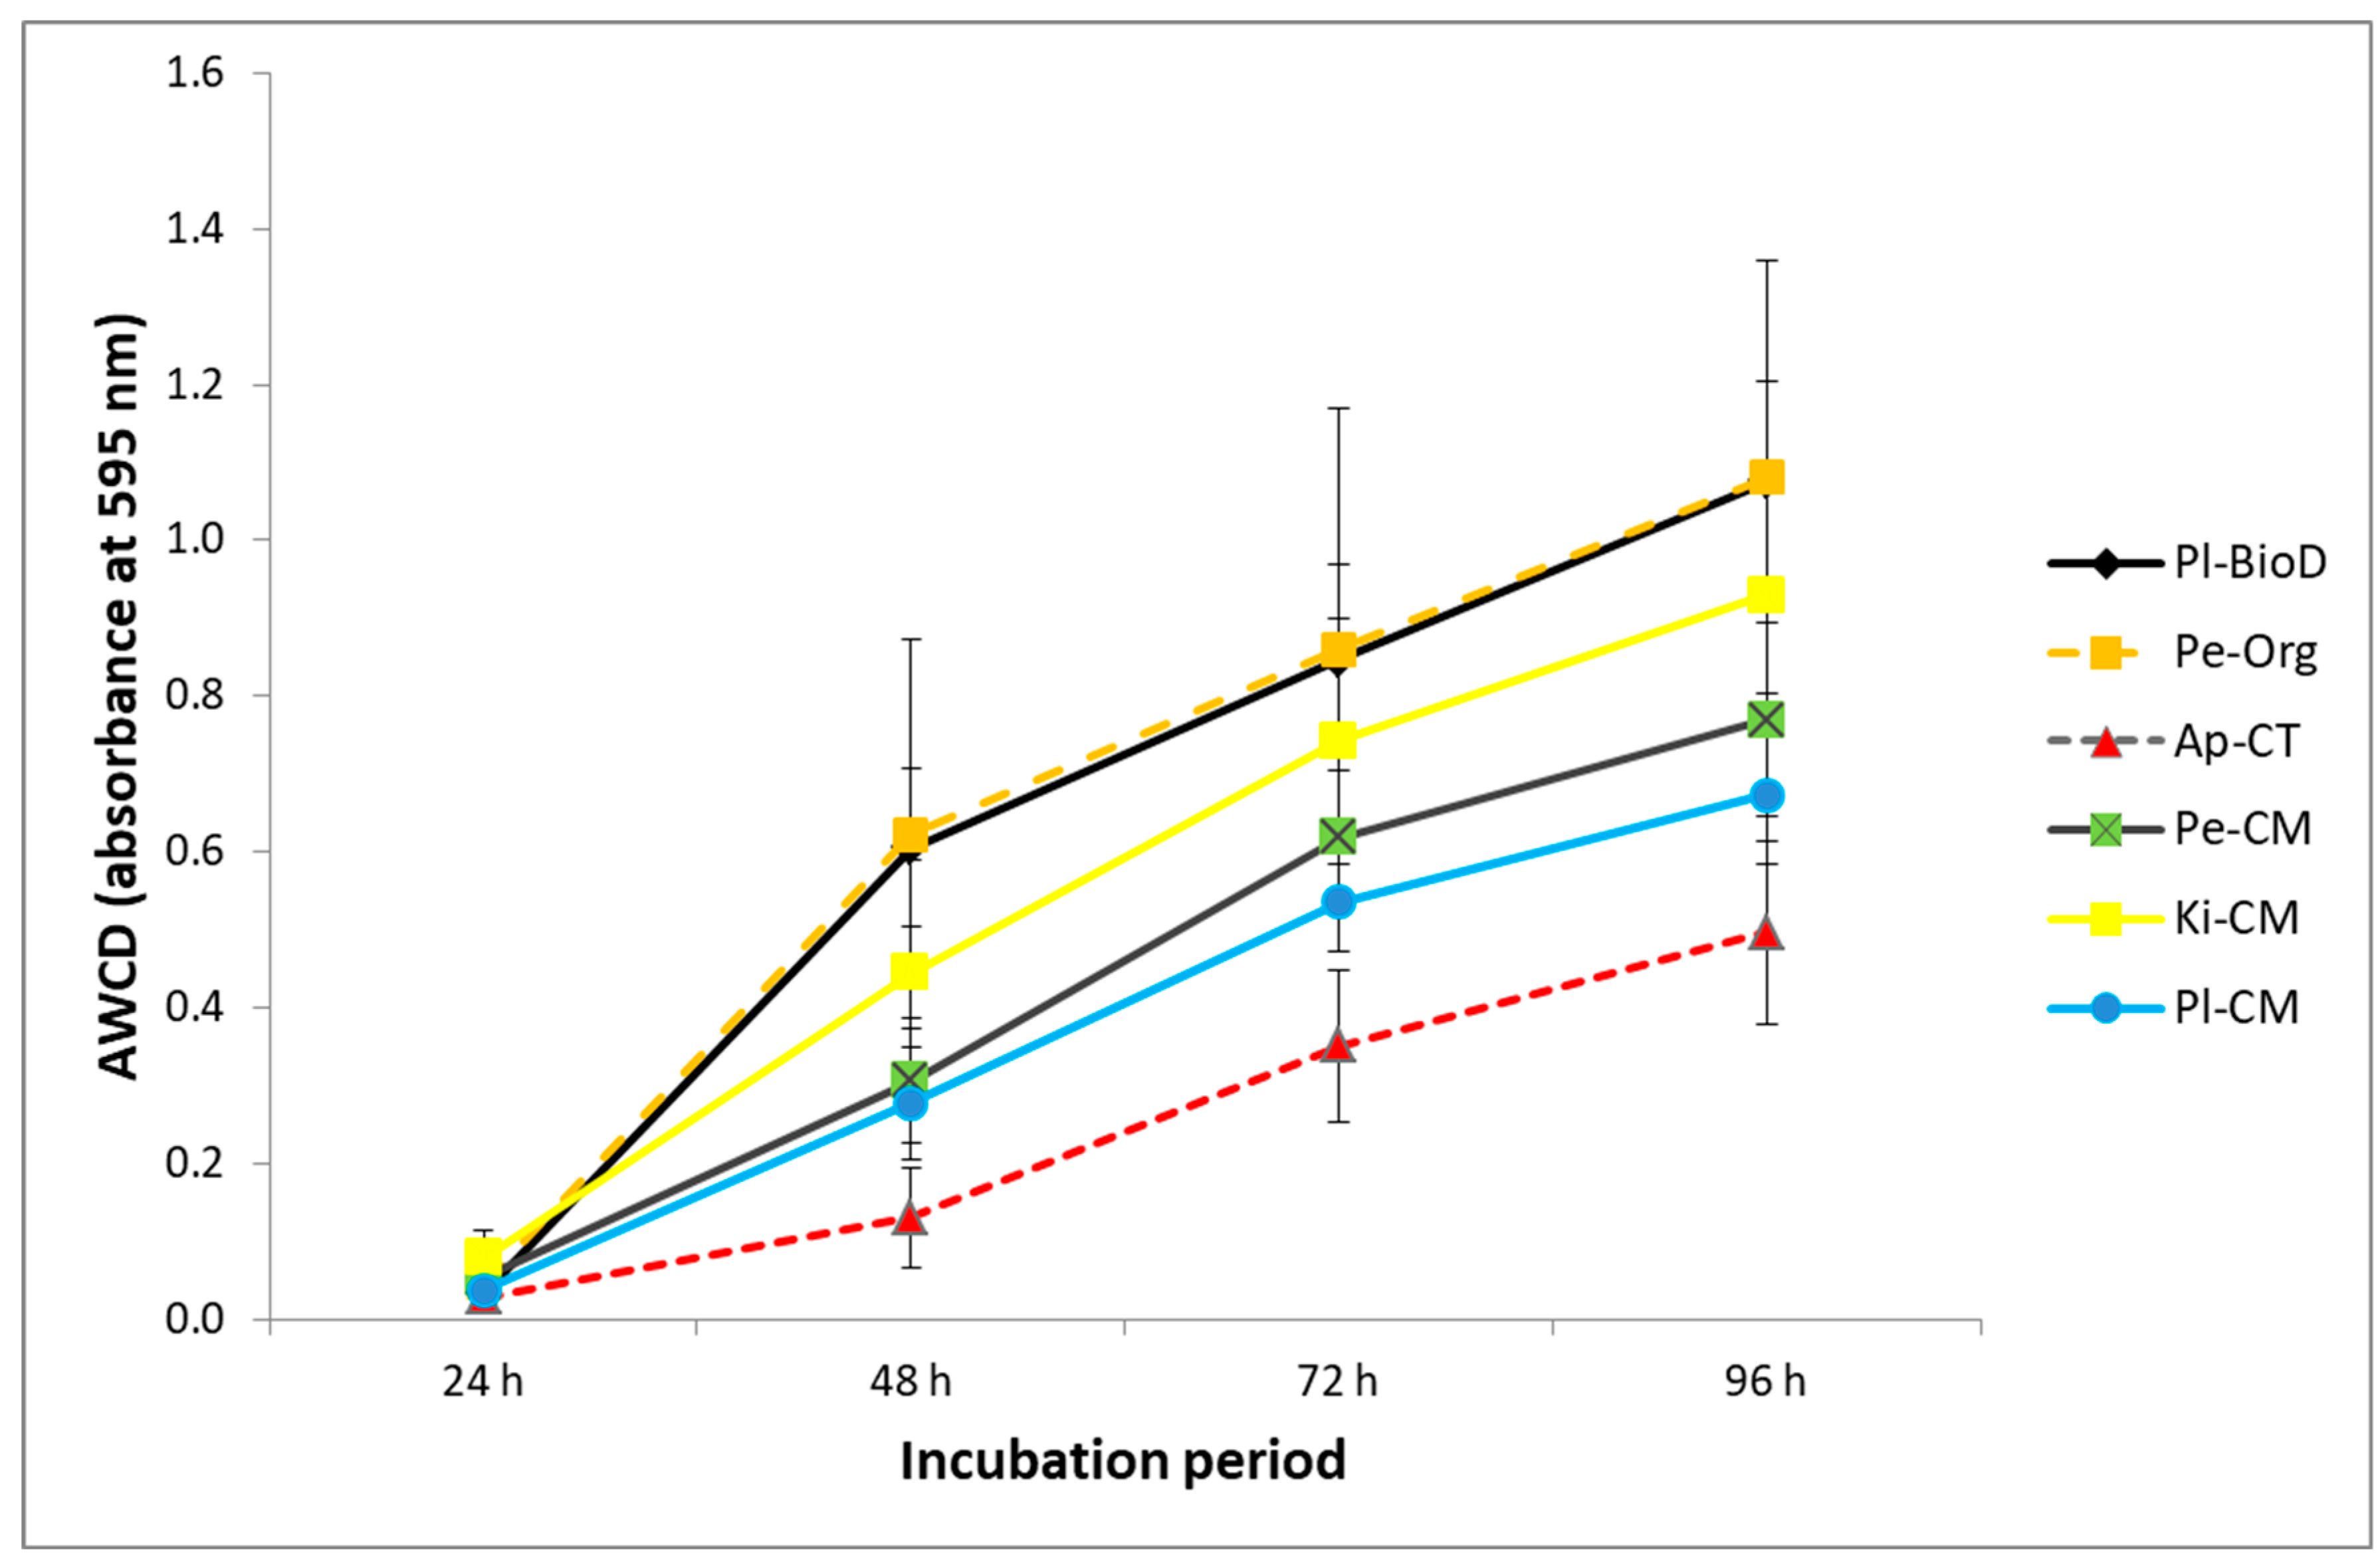
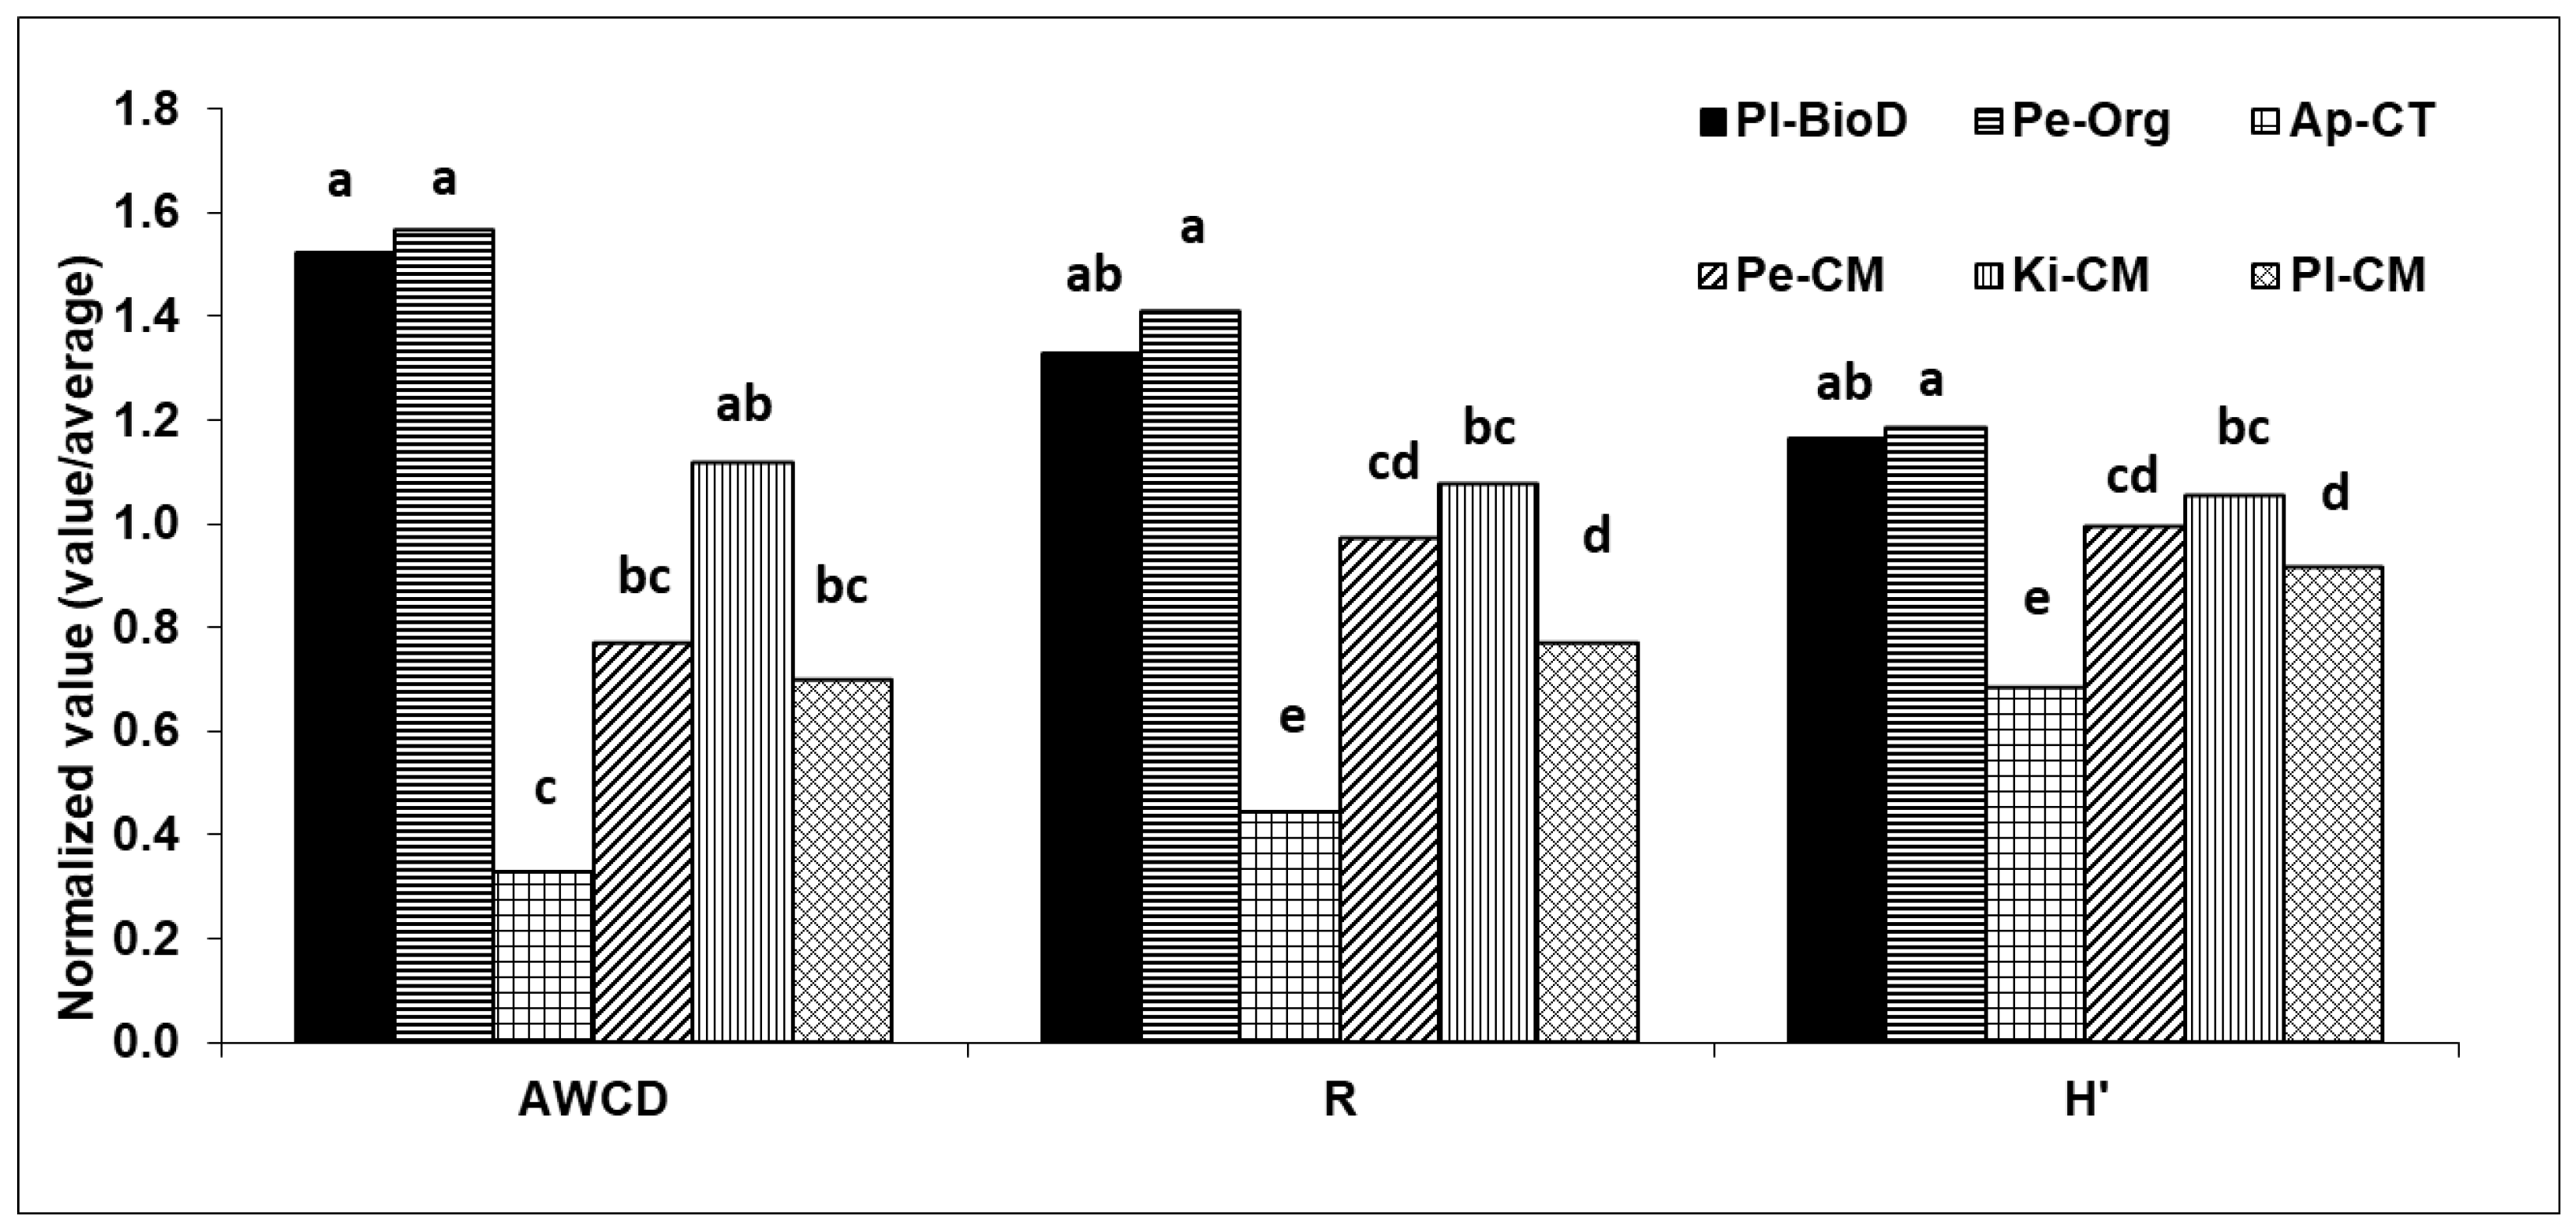
2.5.4. Community-Level Physiological Profiling (CLPP) Analysis

The microbial biomass CLPP analysis was carried out via a Biolog plate using 31 carbon substrates grouped into (1) carbohydrates, (2) carboxylic and acetic acids, (3) amino acids, (4) polymers, and (5) amines and amides, according to Weber and Legge [40]. Fresh soil, equivalent to 10 g of dry soil, was added to 100 mL of a sterile sodium pyrophosphate solution (0.1%) in a 250 mL flask and was shaken at 200 rpm for 20 min. The resulting mixture was diluted about 100-fold with a sterile NaCl solution (0.85%). According to the protocol defined by Calbrix et al. [21], the dilution was adjusted to obtain a pre-defined concentration of microbial cells. Thereafter, the dilution was used to inoculate the wells of the Biolog plate. The plate was incubated at 25 °C and the absorbance at 595 nm was measured daily for 4 days. Metabolism of the different substrates in the wells resulted in the reduction of tetrazolium, which changed from colorless to purple formazan. The absorbance value of the Biolog plates’ control well (containing no substrate), filled with the 100-fold soil dilution, was subtracted from the absorbance of every other well to eliminate background color from the soil suspension. The average well-color development (AWCD) value was calculated for each well separately, as first described by Garland and Mills [41]. Thereafter, and as suggested by Preston-Malfham et al. [42], AWCD values of substrates were assigned to guilds (amino acids, amides/amines, carbohydrates, carboxylic acids, miscellaneous and polymers) and used to express the results of bacterial functional diversity.
Richness (R) values were calculated as the number of oxidized C substrates.
Shannon–Weaver index values (H′), the evenness of the response, was calculated as follows:
H′ = −Σpi(lnpi)
where pi is the ratio of the activity on each substrate (ODi) to the sum of activities on all substrates ΣODi. R and H′ were calculated using an OD of 0.25 as a threshold for positive response [43]. Readings were carried out at 24, 48, 72, and 96 h but plate readings at 48 h of incubation were used to calculate AWCD, R, and H′ since it was the incubation time that allowed the best resolution among the treatments. For each series, the corrected absorbance values of the substrates were summarized in the substrate categories and expressed as a percentage of the total absorbance value of the plate corresponding to a particular tree orchard soil [40,44].

2.6. Statistical Analysis

Statistical analysis was carried out using STATISTICA version 9 software (www.statsoft.com). Basic statistical parameters, such as the mean and standard deviation for all the measured soil parameters (β-gluc, FDA, Resp, AWCD 48, R 48, H′ 48, ECa, pH, CE, Skeleton, Coarse sand, Clay, SOC) were examined. Analyses of variance (One-way repeated measures ANOVA’s) were followed by the Tukey–Kramer test to separate means at a significance level of 0.05. Analyses of the correlation between the above-mentioned parameters in the different zones studied were made using the Pearson Product Moment Correlation Coefficient (R), which is a measure of the linear association of two independent variables. Principal component analysis (PCA) and redundancy analysis (RAD) were performed on 120 h Ecoplate readings in order to evaluate the distribution of cases and the correlation of the variables along the first two principal components. Data were used in the Pearson correlation matrix to evaluate differences among soil samples and assess relationships among soils and the two first principal components (PC 1 and PC 2) identified for this study. Differences in β-Gluc, FDA, Resp, AWCD, R, H′, A/A, A, C(H2O), COOH, M, Pol, and SOC (variables) among fruit orchard systems (cases) were computed for each sampling replicate by performing PCA using R software to assess the biplot distribution of cases and the correlation of the variables along the first two principal components.

3. Results

3.1. ECa Values

Two examples of EMI maps are reported in Figure 1.
A wide variability existed between the lowest ECa values (ECa min) and the highest ones (ECa max) in all the studied orchards (Table 3). While the ECa min values were less than 10 mS m−1 in three of the orchards belonging to the Metapotino area (Pl-BioD, Pe-Org, and Ap-CT), the minimum values shown by fruit groves of Piana del Sele (Pe-CM and Ki-CM) ranged from 30.1 to 50.0 mS m−1 (Table 3). The highest ECa values, from 75.6 and 106.1 mS m−1, were found in Pl-CM.

3.2. Soil Parameters

Values of pH, EC, skeleton, coarse sand, clay, and SOC, measured in each fruit orchard within the two zones characterized by the highest and lowest ECa values (ECa-max and ECa-min), are reported in Table 3.
In some cases, these soil parameters showed wide oscillations between ECa-min and ECa-max.
Soils in orchard systems showed very slight to slight alkaline reactions, having pH ranging between 7.1 and 8.0. The highest pH values were recorded in Pe-CM and Ki-CM, falling within the Piana del Sele area. Statistical differences in SOC values (at p < 0.001) were found among the fruit orchard systems. As expected, the lowest SOC contents were found in Ap-CT (mean 7.82 g kg−1), due to its management based essentially on soil tillage, followed by Pl-CM (mean 14.69 g kg−1), from which it was significantly different; the other systems clustered and significantly differed from the tilled fruit orchards Ap-CT and Pl-CM (means—Pl-BioD: 18.19 g kg−1; Ki-CM: 17.69 g kg−1; Pe-CM: 16.97 g kg−1; Pe-Org: 16.96 g kg−1). Except for Pl-CM, EC values found in soil samples taken from the other orchard systems falling within the Metapontino area (Pl-BioD, Pe-Org, Ap-CT) were significantly higher (at p < 0.001) than those of systems belonging to Piana del Sele (in some cases almost double) (Table 3). This is in agreement with the highest values of ECa measured within the fruit orchards located in the Basilicata region (Table 3).

3.3. Microbial Activities
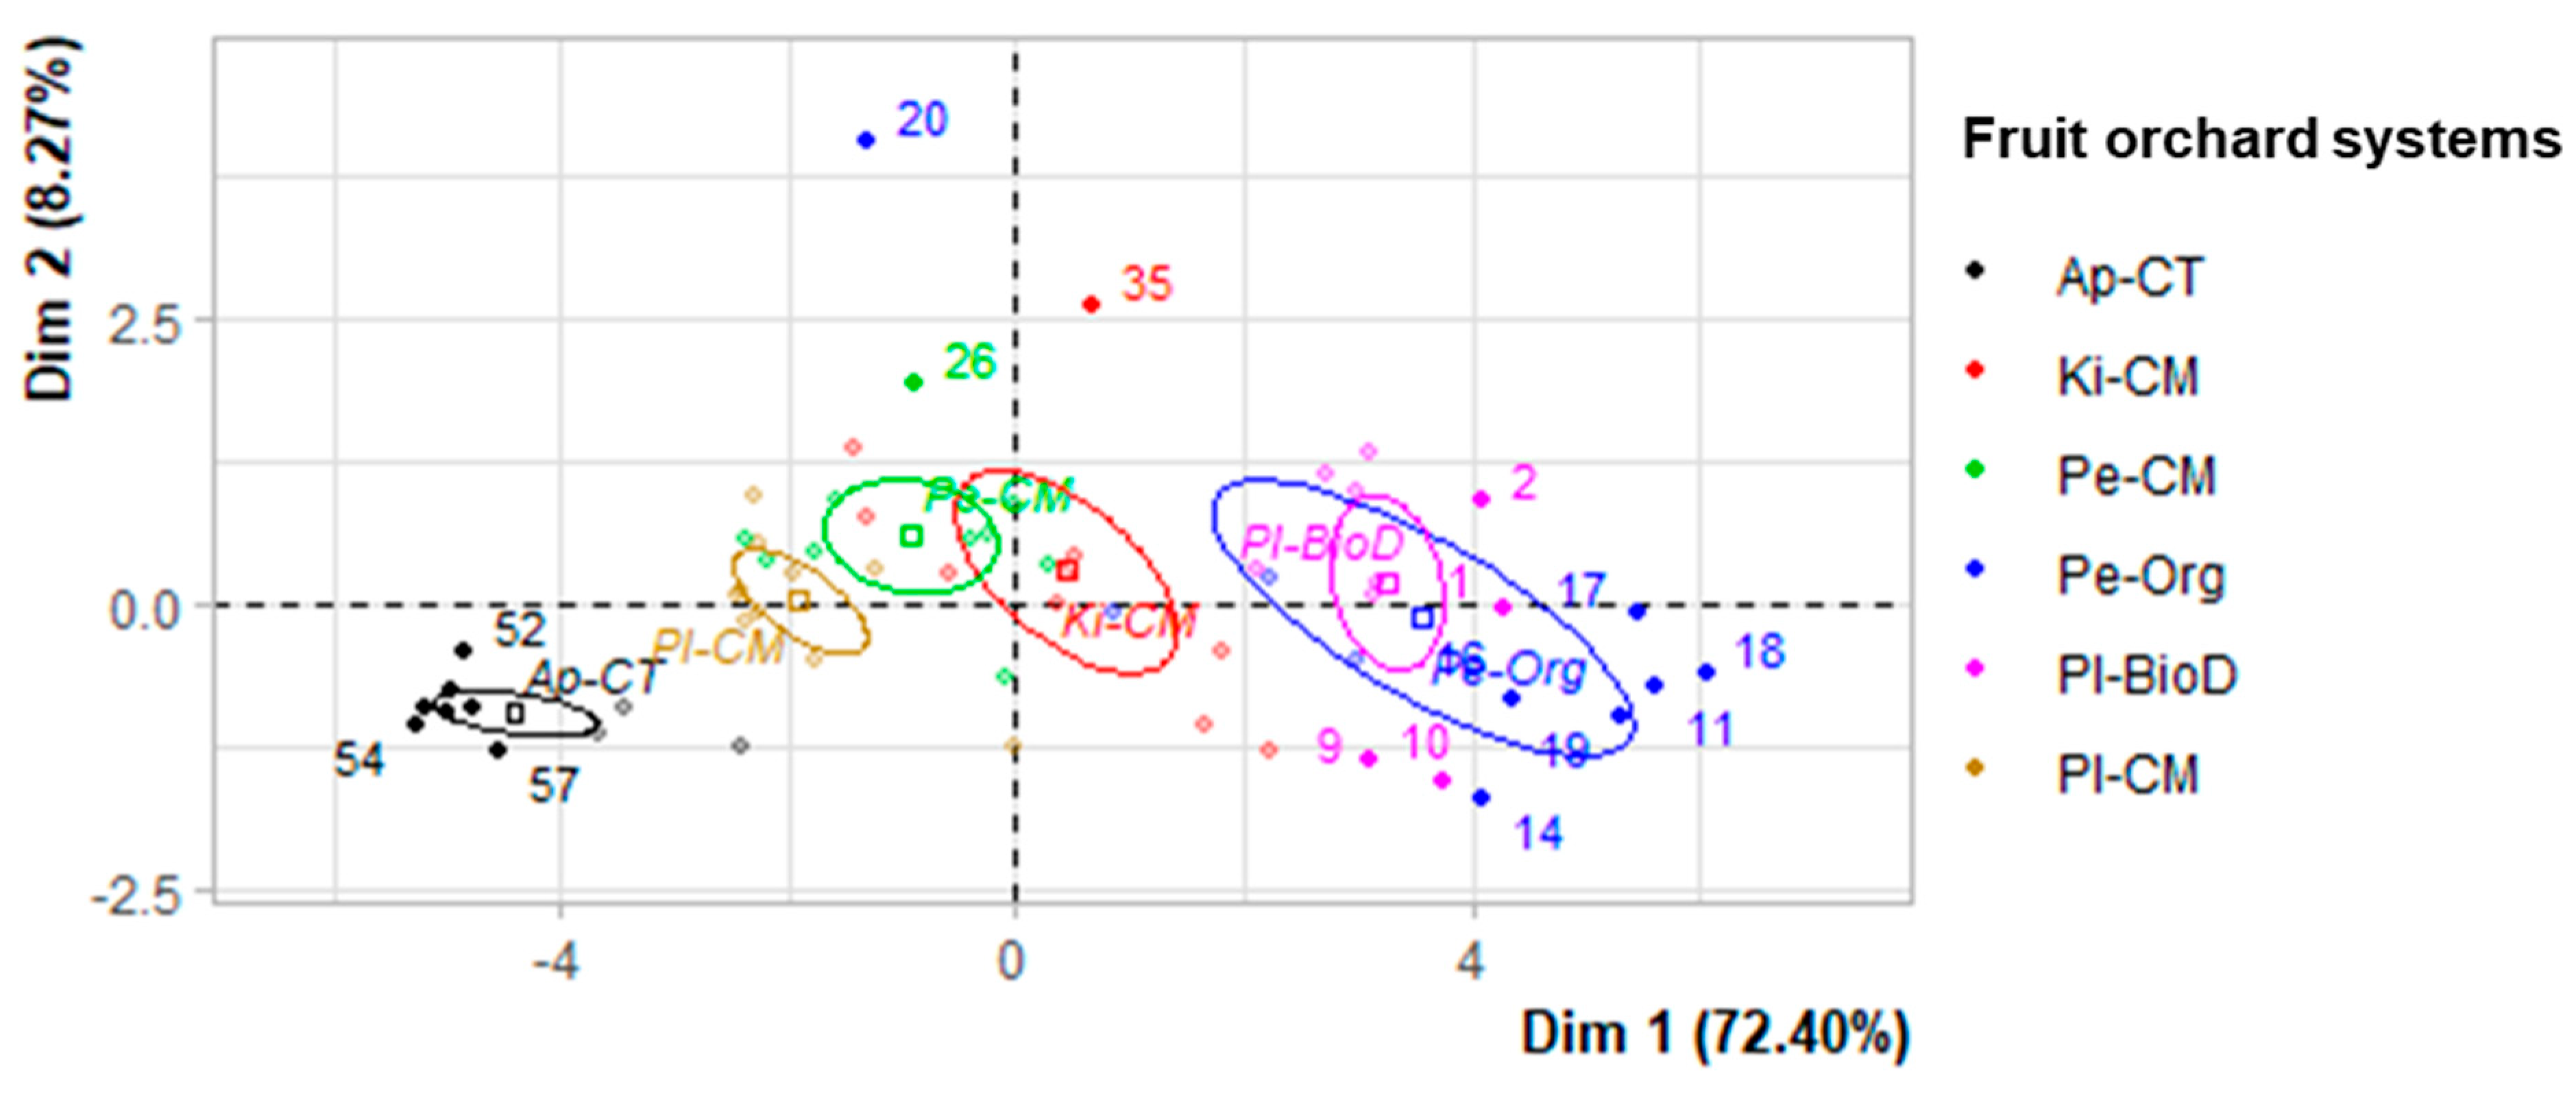
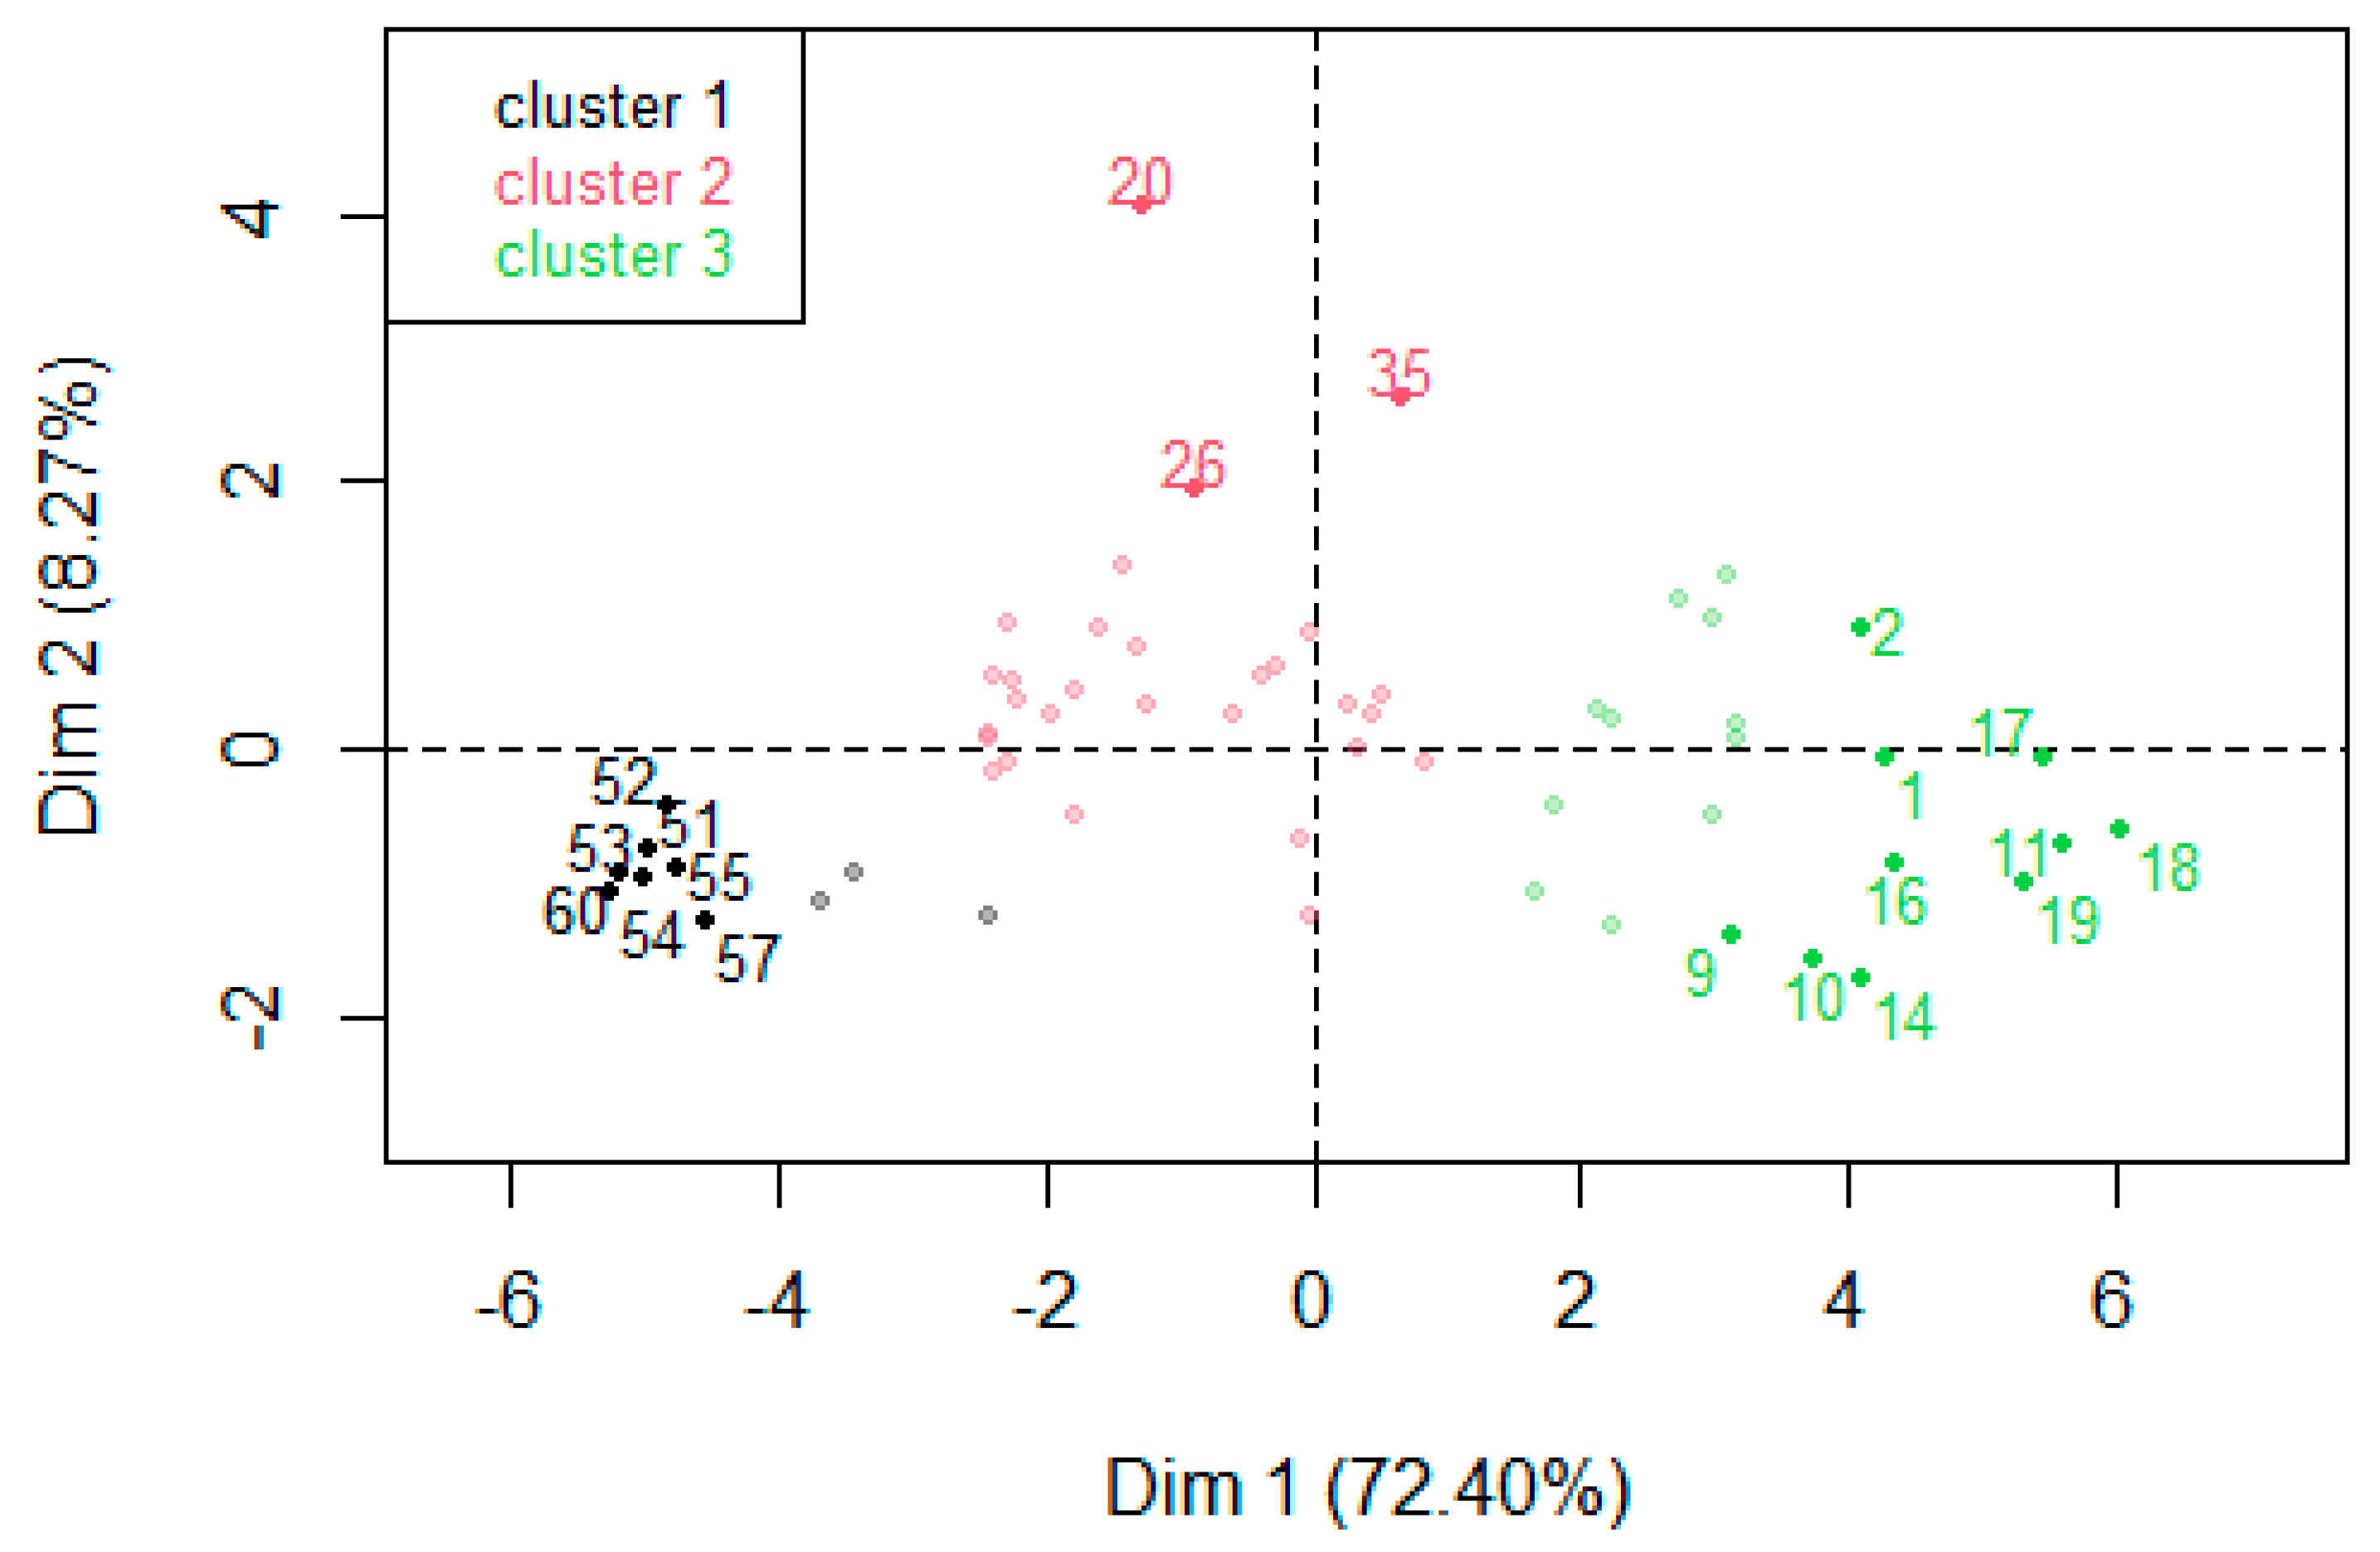
The fruit orchard systems under study exhibited significant differences (at p < 0.05) in microbial activities, measured by β-glucosidase, FDA, and soil basal respiration (Resp) (Figure 2, Figure 3 and Figure 4).
Soil contents of β-glucosidase and FDA were significantly greater in Pl-BioD and Pe-Org than in the other fruit orchards. The lowest values of such parameters were recorded in Ap-CT. Generally, β-glucosidase and FDA showed growing values according to the following sequence: Pe-Org > Pl-BioD > Ki-CM > Pe-CM > Pl-CM > Ap-CT. Soil basal respiration followed a similar trend to that of β-glucosidase and FDA, and it ranged from 1.202 to 307 CO2 µL h−1 g−1 of dry soil in Pl-Org and Ap-CT treatments, respectively. Particularly, the assessment of the basal respiration showed soil clustering in three main groups (Figure 4). In particular, the burst of activity was retrieved for PI-BioD and Pe-Org soil samples, while Pe-CM, Ki-CM, and PI-CM showed intermediate levels of CO2 release rate. Finally, the soil sampled in Ap-CT—expressed in terms of respiration—exhibited relatively very low microbial activity (Figure 4).
The correlation among β-glucosidase, FDA and Resp, and SOC was really strong (at p ≤ 0.001) and equal to 0.93, 0.96, and 0.87, respectively.
Community-level physiological profiling is an efficient and fast technique that is useful for providing information about soil microbial communities, taking into account the utilization of carbon substrates by microorganisms. AWCD, together with R and H′, is a sensitive index able to establish the functional diversity of microbial populations. Figure 5 shows the AWCD curves recorded during the incubation period after the inoculation of the samples into the Biolog plates.
Although the increasing trend of the curves was similar in all the treatments, the microbial communities in soils sampled from Pl-BioD and Pe-Org systems showed the highest AWCD kinetics. Diversely, samples from Ap-CT showed the lowest AWCD evolution rates. The latter were about half of those shown by the soil sampled from Pl-BioD and Pe-Org systems. An intermediate behavior was found by the remaining treatments, which showed a values sequence as follows: Pe-CM > Ki-CM > Pl-CM.
The normalized values of AWCD, R, and H′ after 48 h of incubation are reported in Figure 6.
a-Cyclodextrine, 2-Hidroxy Benzoic Acid, a-Ketobutyric Acid, L-Threonine, and Glycil-L-Glutamic Acid, used as substrates, did not provide a positive response (threshold less than 0.25). Therefore, they were not used for R and H′ calculation. Among the systems, Pl-BioD and Pe-Org showed the highest values of all the indexes, which were significantly different (at p < 0.05) from the values measured in the other treatments. In particular, Ap-CT exhibited the lowest AWCD, R, and H′ values followed by Pl-CM, Pe-CM, and Ki-CM.
With respect to the AWCD for the six groups of substrates at 48 h of incubation in Biolog EcoPlate, there were no statistically significant differences between Pl-BioD and Pe-Org which, at the same time, showed the highest values compared to the other systems (Figure 7).
These last had the same trend for all six physiological groups following the sequence Ki-CM > Pe-CM > Pl-CM > Ap-CT, and they showed significant differences within amino acid, carbohydrate, and carboxylic acid groups (Figure 7). Carboxylic acids were the carbon substrates most utilized by microorganisms within all the fruit tree systems under comparison, followed by amino acids, carbohydrates, polymers, miscellaneous, and amines/amides (Figure 7).
As expected, a good correlation was found between AWCD, H′ and R, and SOC contents (Figure 8a–c). R2 showed values of 0.799, 0.684, and 0.760 for AWCD, H′ and R, respectively. Such findings seem to indicate that SOC represents a good indicator of the other examined indexes and the driving force of soil microbial diversity.

3.4. PCA Results

The multivariate analysis was performed using PCA to establish the relationships among SOC, soil microbiological parameters, and functional microbial groups responding to substrates in the microplates, with respect to the different fruit orchard systems. The first two dimensions of analysis express 80.67% of the total dataset inertia; this means that 80.67% of the individuals’ (or variables’) cloud total variability is explained by the plane. The first factor, in particular, is major, expressing 72.4% of the data variability (Figure 9).
Dimension 1 opposes individuals such as 19, 1, 17, 16, 18, 14, 11, 10, 2, and 9 (to the right of the graph, characterized by a strongly positive coordinate on the axis) to individuals such as 55, 52, 51, 53, 54, 60, 57, and 20 (to the left of the graph, characterized by a strongly negative coordinate on the axis) (Figure 9). The group in which the individuals 19, 1, 17, 16, 18, 14, 11, 10, 2, and 9 stand (characterized by a positive coordinate on the axis) shares high values with variables like A/A, COOH, A, Pol, AWCD, C(H2O), FDA, R, ß-Gluc and M (variables are sorted from the strongest to the weakest).
The group in which individuals 55, 52, 51, 53, 54, 60, and 57 stand (characterized by a negative coordinate on the axis) shares low values for variables like SOC, H′, R, FDA, A, ß-Gluc, COOH, AWCD, RESP, and A/A (variables are sorted from the weakest). The group in which the individual 20 stands (characterized by a negative coordinate on the axis) shares low values with the variables A/A, Pol, C(H2O), COOH, AWCD, M, and A (variables are sorted from the weakest to the strongest). Note that the variables Ap-CT, Pe-Org, Pl-BioD, and Pl-CM are highly correlated with this dimension (respective correlations of 0.92, 0.98, 0.98, and 0.95). These variables could therefore summarize dimension 1.
The classification of the individuals reveals three clusters (Figure 10).
Cluster 1 comprises individuals such as 51, 52, 53, 54, 55, 57, and 60 (all belonging to the Ap-CT system). This group is characterized by low values for variables like SOC, H′, R, A, COOH, ß-Gluc, AWCD, FDA, RESP, and Pol (variables are sorted from the weakest to the strongest). Cluster 2 comprises individuals such as 20, 26, and 35, which belong to Pe-Org, Pe-CM and Ki-CM, respectively. This group is characterized by low values for the variables C(H2O), A/A, Pol, AWCD, M, COOH, FDA, ß-Gluc, and A (variables are sorted from the weakest to the strongest). Cluster 3 comprises individuals belonging to Pl-BioD and Pe-Org, such as 1, 2, 9, 10, 11, 14, 16, 17, 18, and 19. This group is characterized by high values for variables like AWCD, Pol, C(H2O), COOH, A, A/A, FDA, ß-Gluc, M, and R (variables are sorted from the strongest to the weakest).

4. Discussion

As indicated by several previous studies [22,45,46,47,48], the EMI technique appeared to be an interesting approach to optimize the number of soil samples and, as a consequence, to contain sampling costs, still giving reliable representativeness to physico-chemical and microbiological parameters at field scale. Recently, many researchers have considered ECa an effective estimator of soil features, able to spatially represent their variability in soils and to hypothesize the productive potential of different crops according to precision agriculture requirements [49,50]. Under our experimental conditions, the EMI technique guided rational soil sampling, allowing to evidence zones with different Eca values within the studied orchards, indirectly showing the spatial variability of ECa-dependent soil characteristics [22]. Therefore, EMI gave the opportunity to take into account dissimilar soil features within each fruit orchard when collecting soil samples to better represent the local spatial variability of soils. In addition, the EMI survey allowed us to highlight the diverse types of soils of the fruit orchards belonging to the two geographical areas under study (Table 3).
In this research, the use of soil management practices for long periods (≥15 years) that are based on the reduction of tillage operations and the recycling of organic material produced within the orchard (Table 3) increased SOC, the activity of telluric microorganisms, and their functional diversity compared to ‘non-conservative’ management practices such as continuous tillage. This indicates that the implementation of organic matter applications on lightly disturbed soils can be a strategic approach to creating a hospitable environment for the root systems of fruit trees which could be more effective in recovering useful elements for plant feeding and development. Furthermore, the exploitation of the orchard-inside organic matter, such as natural/seeded grass cover and pruning material, represents a virtuous solution to optimize fruit orchard system components, transforming them from useless waste—to be disposed of with much effort from logistical and economical points of view—into precious resources. In addition, the simultaneous use of different types of strategies combined with each other and aimed at soil conservation (no tillage, application of organic materials of diverse kinds such as cover crops and prunings, as occurred in Pl-BioD and Pe-Org)—named “stacking practices” by Tully and McAskill [51]—allowed us to enhance the effects on beneficial soil parameters more than the application of a single technique.
Regarding SOC, the Ap-CT, managed with continuous tillage well before 1996, showed the lowest C content, followed by Pl-CM, the other system subjected to tillage operations—but shallow and of less intensity—combined with winter natural grass cover (Table 1). Otherwise, the systems receiving agronomical techniques conservative of soil organic matter (Pl-BioD; Ki-CM; Pe-CM; Pe-Org) had similar C values to each other, and these were significantly higher than those found in the tilled orchards. In general, it has been demonstrated by various studies [51,52] that both tillage limitation and long-term soil application of organic materials from different sources (i.e., crop rotation, manure, prunings, crop residues, or other organic amendments) and with diverse quality (i.e., C/N ratio) positively affects soil C by gradually increasing its content in soils up to a probable saturation level [53,54,55]. García-González et al. [56], comparing barley and vetch cover crops to the fallow over the course of 10 years, found a significant increase in SOC by the end of the experiment (from 1.0% to 1.6% in both cover crop treatments in the 0–5 cm soil layer) due to the C input remaining in the soil as crop residues. This C accumulation process is crucial in catching CO2 from the atmosphere and storing it in soils in C form and, thus, it falls within sequestration strategies mitigating detrimental greenhouse gas effects. In addition, soil management aiming to maintain organic C stocks in soils allows agrosystems to be more resilient to stresses or disturbances [57].
Usually, microbial activity is higher when cover crops or organic residues are added as compared to treatments without organic inputs [58,59]. The response was always more significant as the organic input increased and its composition varied (with particular reference to the C/N ratio) [53,55]. In fact, Pl-BioD and Pe-Org, received annually —on average—about 9 tons per hectare (on a dry weight basis) of plant residues composed of 78% seeded grass and 28% pruned material; an average amount of 6 tons per hectare (on a dry weight basis) of biomass (made of 62% of natural grass and 38% of pruning residues) was applied in Ki-CM and Pe-CM systems. The tilled systems (Ap-CT and Pl-CM) produced 3.5 tons every year from natural grass mowing (29% of the total) and pruning residue shredding (71% of the total). According to Praveen et al. [60], herbaceous plant residues with a C/N ratio of less than 18 can be considered highly decomposable, diversely by pruned material (C/N from 40 to 62), which shows a slow to the lowest decomposition. Evidently, the faster decomposition of low C/N materials promoted soil microbial activity and stimulated a diversification of microbial populations, as found especially in Pl-Biod and Pe-Org, where the percentage of such residues prevailed over the woody portion of the pruning material. In addition, the mixture of plant residues of different types and the products used under both organic and biodynamic regimes provided feed for a wider range of soil microorganisms, affecting both the structure and richness of the microbial community [61] (Figure 6 and Figure 7). As reported by Finney et al. [62], mixing organic materials characterized by high and low C/N, in this case cereal rye and legumes, respectively, allowed them to obtain mixtures with a moderate C/N ratio.
β-glucosidase, FDA, and soil basal respiration were measured in soil samples taken from the different fruit orchard systems since they are indicators known to be effective for describing soil biological activity and soil quality and, thus, for detecting the effect of management on soils [58,63,64,65,66]. Significant differences were recorded in enzymatic activities, both β-glucosidase and FDA, and Resp among the fruit orchard systems under observation: as expected, the highest values were found in Pl-BioD and Pe-Org systems, the lowest ones in Ap-CT. On the other hand, no significant differences were recorded between BioD and Org systems (Figure 2, Figure 3 and Figure 4). This can be explained by the fact that we are comparing systems characterized by non-disturbed soil and a similar content of organic carbon assured by consistent organic material inputs applied over time. The other fruit systems, although they showed soil C contents similar to those of Pl-BioD and Pe-Org, were significantly different from the latter, revealing lower values, especially in enzymatic activities (Figure 2 and Figure 3). It is probable that the lower plant residue application combined with soil disturbance occurring in the other systems (Pe-CM; Ki-CM; Pl-CM) throughout the orchard’s history and during the seasonal cycle (Table 1) strongly affected enzymatic responses (Figure 2 and Figure 3). The high values of β-glucosidase found in Pl-BioD and Pe-Org, which have been subjected to biodynamic and organic management for many years, could also be the expression of past biological activity resulting from techniques used for soil and crop management and, therefore, it could provide information about the ability of soil to stabilize the soil organic matter [58,65,67]. According to Dick et al. [67], enzymes strongly correlated with soil organic matter (SOM), by forming complexes with the latter and being protected by humus and clay particles, can be considered the best predictors of long-term changes in soil quality. In this study, all these indicators—enzymatic activities and Resp—were strongly and positively correlated with SOC content as corroborated by previous indications [68,69,70], suggesting that an increase of C and N from SOM provides substrates and energy able to positively stimulate microorganism activities and their enzymes production.
With respect to Resp, it seems that SOC modulated the variation of basal respiration. As a matter of fact, this parameter showed a behavior reflecting the SOC trend and SOC differences among the considered systems (Figure 4): this is in agreement with what was observed by Perez-Bejarano et al. [71], who showed that higher values of SOM led to increased soil respiration, and Zhou et al. [72], who demonstrated that CO2 efflux is well predicted by soil organic carbon content. Basal respiration is also positively correlated with FDA and β-glucosidase: this is probably due to the amelioration of physical soil features—such as soil aggregation and porosity—that sustain soil microbial activity [52,70]. Therefore, soil respiration is a good indicator of both overall soil biological activity and soil quality [66], indicating the soil’s capacity to support the growth of both plants and telluric microbes.
What was found for the above-mentioned parameters—describing soil microbiological activity—helped to interpret and confirm the results on soil microbial metabolic diversity indices.
The response to the inoculation of soil samples into the Biolog plates showed—throughout the incubation period—a similar trend of the kinetic curves independent of the fruit orchard systems considered (Figure 5). On the other hand, the highest AWCD kinetics found in Pl-BioD and Pe-Org suggest that the microbiota of these samples were highly active in using the different types of carbon sources during cell growth.
As shown by Figure 6, the AWCD, R, and H′ indexes measured in the organic and biodynamic systems were significantly (p < 0.05) greater than those recorded in fruit orchards subjected to tillage or managed according to the BMPs. This is in accordance with what was found by Smith et al. [73] in a Mediterranean-climate agricultural soil subjected to different cropping systems. The authors found higher microbial abundance and diversity under no-till and cover crop plots with respect to tillage plots. As reported by the same authors, soil biological diversity seems to reflect the diversity of microhabitats within the soil structure. Therefore, tillage reduces the microbiological species richness of soil by homogenizing its nutrient and microhabitat content. This gives a clear indication of the better capacity of the microbial communities belonging to Pl-BioD and Pe-Org to utilize substrates, thus showing a greater functional diversity. It is important to highlight that Pl-BioD and Pe-Org were characterized by non-disturbed soil, which received huge amounts of organic residues of different types (above-ground plant parts, root systems, root exudates, etc.) and quality (C/N ratio; tissue lignification level; aerial parts to roots ratio) annually. All such conditions create a very complex environment characterized by a great resource diversity and a consistent nutrient supply ideal for the performance of a wide range of microorganisms [74,75,76,77]. Therefore, the long-term and cumulative effects of cover cropping can significantly diversify microbial communities thanks to the preservation of the microhabitat heterogeneity [73]. This finding has an important operational implication when a farmer has to choose cover crop species to be seeded in the fruit orchard [78].
As demonstrated by the PCA results, the improvement of soil microbiota complexity showed an increasing gradient, passing from non-conservative soil management techniques to conservative ones along the first dimension, which explains the majority of variability in the data of metabolic functional biodiversity exhibited by the soil microbial communities (Figure 9 and Figure 10). Particularly, the above-mentioned trend followed this order: Ap-CT < Pl-CM < Pe-CM < Ki-CM < Pe-Org < Pl-BioD, with a distribution along the Dim 1 axis, which positively correlated with SOC, microbial activity, and biodiversity. Taking into account that both Pl-BioD and Pe-Org systems were subjected to a common previous history based on continuous tillage (Table 2), it is conceivable that this positive evolution could be the normal result of regular, consistent, and long-term applications of organic matter and of reduced operation tillage (low soil disturbance) [73]. In this evolution, integrated fruit management—in Pe-CM and Ki-CM—represented the intermediate conditions: a switch towards the strengthening of practices (based on organic matter input) and tillage limitation can lead to better soil conditions. Obviously, the process towards a new soil equilibrium has a gradual trend and for this reason, it takes many decades [53,79].

5. Conclusions

Results achieved by this research confirm that the long-term (≥15 years) use of sustainable soil management techniques can significantly modify the soil environment in fruit orchards by ameliorating SOC and microbiological components known as important soil vital parameters. Some useful operative indications for implementing this slow and gradual soil improvement process in orchards are suggested as follows: to extend the application time of the sustainable practices—the longer the time, the better the results; to reduce those agronomical actions which could disturb soil (i.e., tillage, chemical weeding); to cover soil by spontaneous or seeded grasses; to select herbaceous plants to be seeded within the orchard based on the objective to be achieved on (i.e., to increase organic biomass input, to provide mineral elements readily available for fruit trees nourishment); to choose the right timing of cover crop suppression (to provide organic materials with different C/N ratios and decomposition rates by modulating the grade of plant tissue lignification); to exploit the different type of organic material inputs internal and external to the orchard/farm (i.e., pruning material, on-farm compost, manure); to apply a mixture of organic matter of different qualities. All these practices, if performed simultaneously, can amplify beneficial effects on soil status and, as a consequence, on the overall conditions of fruit orchard systems. Under our experimental conditions, the increase of the SOC, enzyme activities, and diversity/functionality of bacterial communities—measured in soil samples taken following the EMI technique application—agree in demonstrating the importance of using these strategies in combination. This result is evident, especially under organic and biodynamic regimes. The above-cited indices are confirmed to be useful in soil environment characterization and clearly respond to the different soil management systems. This study also provided the opportunity to assess the possible evolution of tilled fruit orchards towards more balanced soil conditions when subjected to conservative soil practices. Therefore, the present research—being a picture of the status of some representative fruit orchards characterized by a different agronomical history—can represent a reference model for fruit growers and technicians operating within the study areas. In any case, it is recommended to perform further research to acquire information on the combined effects of conservative soil practices on fruit orchards within other pedoclimatic areas, thus widening the data range and making it useful for stakeholders.

Author Contributions

Conceptualization, A.A. and G.C.; methodology, A.A., A.M.P., R.S., C.P. and G.C.; validation, A.A. and G.C.; formal analysis, A.A. and G.C.; investigation, A.A., R.S. and C.P.; resources, K.G., G.C. and M.Z.; data curation, A.A., A.M.P., R.S., C.P. and G.C.; writing—original draft preparation, A.A, A.M.P., R.S. and C.P.; writing—review and editing, A.A., K.G., A.M.P., R.S., C.P., M.Z., G.A. and G.C.; visualization, A.A. and A.M.P.; supervision, K.G. and G.C.; project administration, G.C.; funding acquisition, G.C. All authors have read and agreed to the published version of the manuscript.

Funding

This research received no external funding.

Institutional Review Board Statement

Not applicable.

Data Availability Statement

Data will be made available on reasonable request by the corresponding author.

Acknowledgments

This research was funded by MIPAAF Project “Modelli Circolari—Modelli di sistemi circolari multifunzionali per produzioni tipiche”.

Conflicts of Interest

The authors declare no conflicts of interest.

References

  1. Bloem, J.; Schouten, A.J.; Sørensen, S.J.; Rutger, M.; van der Werf, A.; Breure, A.M. Monitoring and evaluating soil quality. In Microbiological Methods for Assessing Soil Quality; Bloem, J., Hopkins, D.W., Benedetti, A., Eds.; CABI Publishing: Oxfordshire, UK, 2006. [Google Scholar]
  2. Marzaioli, R.; D’Ascoli, R.; De Pascale, R.A.; Rutigliano, F.A. Soil quality in a Mediterranean area of Southern Italy as related to different land use types. Appl. Soil Ecol. 2010, 44, 205–212. [Google Scholar] [CrossRef]
  3. Schloter, M.; Dilly, O.; Munch, J.C. Indicators for Evaluating Soil Quality. Agric. Ecosyst. Environ. 2003, 98, 255–262. [Google Scholar] [CrossRef]
  4. Dick, W.A. Influence of long-term tillage and crop rotation combinations on soil enzyme activities. Soil Sci. Soc. Am. J. 1984, 48, 569–574. [Google Scholar] [CrossRef]
  5. Dick, R.P. Soil enzyme activities as indicators of soil quality. In Defining Soil Quality for a Sustainable Environment; Doran, J.W., Coleman, D.C., Bezdicek, D.F., Stewart, B.A., Eds.; Soil Science Society of America: Madison, WI, USA, 1994; pp. 107–124. [Google Scholar]
  6. Doran, J.W.; Parkin, T.B. Defining and Assessing Soil Quality. In Defining Soil Quality for a Sustainable Environment; SSSA Special Publication no. 35; Soil Science Society of America: Madison, WI, USA, 1994. [Google Scholar]
  7. Karlen, D.L.; Mausbach, M.J.; Doran, J.W.; Cline, R.G.; Harris, R.F.; Schuman, G.E. Soil quality: A concept, definition, and framework for evaluation. Soil Sci. Soc. Am. J. 1997, 61, 4–10. [Google Scholar] [CrossRef]
  8. Doran, J.W.; Fraser, D.G.; Culik, M.N.; Liebhard, W.C. Influence of alternative and conventional agricultural management on soil microbial processes and nitrogen availability. Am. J. Altern. Agric. 1987, 2, 99–106. [Google Scholar] [CrossRef]
  9. Powlson, D.S.; Brookes, P.C.; Christensen, B.T. Measurement of soil microbial biomass provides an early indication of changes in total soil organic matter due to straw incorporation. Soil Biol. Biochem. 1987, 19, 159–164. [Google Scholar] [CrossRef]
  10. Werner, M.R.; Dindal, D.L. Effects of conversion to organic agricultural practices on soil biota. Am. J. Altern. Agric. 1990, 5, 24–32. [Google Scholar] [CrossRef]
  11. Fauci, M.F.; Dick, R.P. Soil microbial dynamics: Short- and long-term effects of inorganic and organic nitrogen. Soil Sci. Soc. Am. J. 1994, 58, 801–806. [Google Scholar] [CrossRef]
  12. Reganold, J.P. Comparison of soil properties as influenced by organic and conventional farming systems. Am. J. Altern. Agric. 1988, 3, 144–155. [Google Scholar] [CrossRef]
  13. Fraser, D.G.; Doran, J.W.; Sahs, W.W.; Lesoing, G.W. Soil microbial populations and activities under conventional and organic management. J. Environ. Qual. 1988, 17, 585–590. [Google Scholar] [CrossRef]
  14. Rastin, N.; Rosenplanter, K.; Huttermann, A. Seasonal variation of enzyme activity and their dependence on certain soil factors in a beech forest soil. Soil Biol. Biochem. 1988, 20, 637–642. [Google Scholar] [CrossRef]
  15. Criquet, S.; Vogt, G.; Le Petit, J. Endoglucasase and -glycosidase activities in an evergreen oak litter: Annual variation and regulating factors. Soil Biol. Biochem. 2002, 34, 1111–1120. [Google Scholar] [CrossRef]
  16. Tabatabai, M.A.; Garcia-Manzanedo, A.M.; Acosta-Martinez, V. Substrate specificity of arylamidase in soils. Soil Biol. Biochem. 2002, 34, 103–110. [Google Scholar] [CrossRef]
  17. Andersson, M.; Kjoller, A.; Struwe, S. Microbial enzyme activities in leaf litter, humus and mineral soil layers of European forests. Soil Biol. Biochem. 2004, 36, 1527–1537. [Google Scholar] [CrossRef]
  18. Niemi, R.M.; Vepsalainen, M.; Wallenius, K.; Simpanen, S.; Alakukku, L.; Pietola, L. Temporal and soil depth-related variation in soil enzyme activities and in root growth of red clover (Trifolium pratense) and timothy (Phleum pratense) in the field. Appl. Soil Ecol. 2005, 30, 113–125. [Google Scholar] [CrossRef]
  19. Nguyen, M.L.; Haynes, R.J.; Goh, K.M. Nutrient budgets and status in three pairs of conventional and alternative mixed cropping farms in Canterbury, New Zealand. Agric. Ecosyst. Environ. 1995, 52, 149–162. [Google Scholar] [CrossRef]
  20. Lehmann, J.; Hansel, C.M.; Kaiser, C.; Kleber, M.; Maher, K.; Manzoni, S.; Nunan, N.; Reichstein, J.P.; Schimel, J.P.; Torn, M.S.; et al. Persistence of soil organic carbon caused by functional complexity. Nat. Geosci. 2020, 13, 529–534. [Google Scholar] [CrossRef]
  21. Calbrix, R.; Laval, K.; Barray, R. Analysis of the potential functional diversity of the bacterial community in soil: A reproducible procedure using sole-carbon source utilization profiles. Eur. J. Soil Biol. 2005, 41, 11–20. [Google Scholar] [CrossRef]
  22. Doolittle, J.A.; Brevik, E.C. The use of electromagnetic induction techniques in soils studies. Geoderma 2014, 223–225, 33–45. [Google Scholar] [CrossRef]
  23. Greenhouse, J.P.; Slaine, D.D. The use of reconnaissance electromagnetic methods to map contaminant migration. Ground Water Monit. Rev. 1993, 3, 47–59. [Google Scholar] [CrossRef]
  24. Rhoades, J.D.; Chanduvi, F.; Lesch, S.M. Soil Salinity Assessment: Methods and Interpretation of Electrical Conductivity Measurements. FAO Irrigation and Drainage Paper 57; Food and Agricultural Organization of the United Nations: Rome, Italy, 1999. [Google Scholar]
  25. Corwin, D.L.; Kaffka, S.R.; Hopmans, J.W.; Mori, Y.; Lesch, S.M.; Oster, J.D. Assessment and field-scale mapping of soil quality properties of a saline-sodic soil. Geoderma 2003, 114, 231–259. [Google Scholar] [CrossRef]
  26. Chen, L.F.; Ong, C.K.; Neo, C.P.; Varadan, V.V.; Varadan, V.K. Microwave Electronics: Measurement and Material Characterization; John Wiley & Sons, Ltd.: Chichester, UK, 2004; p. 537. [Google Scholar]
  27. Domsch, H.; Giebel, A. Estimation of soil textural features from soil electrical conductivity recorded using the EM38. Precis. Agric. 2004, 5, 389–409. [Google Scholar] [CrossRef]
  28. Bronson, K.F.; Booker, J.D.; Officer, S.J.; Lascano, R.J.; Maas, S.J.; Searcy, S.W.; Booker, J. Apparent electrical conductivity, soil property and spatial covariance in the U.S. Southern high plains. Precis. Agric. 2005, 6, 297–311. [Google Scholar] [CrossRef]
  29. Friedman, S.P. Soil properties influencing apparent electrical conductivity: A review. Comput. Electron. Agric. 2005, 46, 45–70. [Google Scholar] [CrossRef]
  30. Regione Basilicata, Dipartimento Agricoltura, Sviluppo Rurale, Economia montana. I suoli Della Basilicata. Carta pedologica della Regione Basilicata in scala 1:250.000; Note illustrative; Ufficio Risorse Naturali in Agricoltura: Potenza, Italy, 2006. [Google Scholar]
  31. Regione Campania. I Suoli della Piana in Destra Sele. Progetto Carta dei Suoli della Campania 1:50.000; Assessorato all’Agricoltura—SeSIRCA: Caserta, Italy, 2004. [Google Scholar]
  32. Allen, D.; Clarke, J.; Lawrie, K.; Fitzpatrick, A.; Apps, H.; Lowis, W.; Hatch, M.; Price, A.; Wilkes, P.; Dore, D.; et al. Geophysics for the Irrigation Industry, Irrigation Insights n. 7; Land & Water Australia: Malaga, Australia, 2007; p. 180. [Google Scholar]
  33. McNeil, J.D. Geonics EM38 Ground Conductivity Meter: EM38 Operating Manual; Geonics Limited: Mississauga, ON, Canada, 1990. [Google Scholar]
  34. Walkley, A.; Black, I.A. An examination of the Degtjareff method for determining soil organic matter and a proposed modification of the chromic acid titration method. Soil Sci. 1934, 37, 29–38. [Google Scholar] [CrossRef]
  35. Pauwels, J.M.; Van Ranst, E.; Verloo, M.; Mvondo Ze, A. Méthode d’analyse de Sols et de Plantes, Gestion de Stock de Verrerie et de Produits Chimiques. Manuel de Laboratoire de Pédologie. Publications Agricoles; AGCD: Bruxelles, Belgium, 1992; 28p. [Google Scholar]
  36. Eivazi, F.; Tabatabai, M.A. Glucosidases and Galacosidases in Soils. Soil Biol. Biochem. 1988, 20, 601–606. [Google Scholar] [CrossRef]
  37. Vuorinen, A.H. Requirement of p-nitrophenol standard for each soil. Soil Biol. Biochem. 1993, 25, 295–296. [Google Scholar] [CrossRef]
  38. Ntougias, S.; Ehaliotis, C.; Papadopoulou, K.K.; Zervakis, G. Application of respiration and FDA hydrolysis measurements for estimating microbial activity during composting processes. Biol. Fertil. Soils 2006, 42, 330–337. [Google Scholar] [CrossRef]
  39. Perez-Piqueres, A.; Edel-Hermann, V.; Alabouvette, C.; Steinberg, C. Response of soil microbial communities to compost amendments. Soil Biol. Biochem. 2006, 38, 460–470. [Google Scholar] [CrossRef]
  40. Weber, K.P.; Legge, R.L. One-dimensional metric for tracking bacterial community divergence using sole carbon source utilization patterns. J. Microbiol. Methods 2009, 79, 55–61. [Google Scholar] [CrossRef]
  41. Garland, J.L.; Mills, A.L. Classification and characterization of heterotrophic microbial communities on the basis of patterns of community-level sol carbon- source utilization. Appl. Environ. Microbiol. 1991, 57, 2351–2359. [Google Scholar] [CrossRef]
  42. Preston-Malfham, J.; Boddy, L.; Randerson, P.F. Analysis of microbial functional diversity using sole-carbon-source utilization profiles e a critique. FEMS Microbiol. Ecol. 2002, 42, 1–14. [Google Scholar] [CrossRef]
  43. Garland, J.L. Analysis and interpretation of community-level physiological profiles in microbial ecology. FEMS Microbiol. Ecol. 1997, 24, 289–300. [Google Scholar] [CrossRef]
  44. Chodak, M.; Niklińska, M. Effect of texture and tree species on microbial properties of mine soils. Appl. Soil Ecol. 2010, 46, 268–275. [Google Scholar] [CrossRef]
  45. Carroll, Z.L.; Oliver, M.A. Exploring the spatial relations between soil physical properties and apparent electrical conductivity. Geoderma 2005, 128, 354–374. [Google Scholar] [CrossRef]
  46. King, J.A.; Dampney, P.M.R.; Lark, R.M.; Wheeler, H.C.; Bradley, R.I.; Mayr, T.R. Mapping Potential Crop Management Zones within Fields: Use of Yield-map Series and Patterns of Soil Physical Properties Identified by Electromagnetic Induction Sensing. Precis. Agric. 2005, 6, 167–181. [Google Scholar] [CrossRef]
  47. Lardo, E.; Palese, A.M.; Nuzzo, V.; Xiloyannis, C.; Celano, G. Variability of total soil respiration in a Mediterranean vineyard. Soil Res. 2015, 53, 541–551. [Google Scholar] [CrossRef]
  48. Lardo, E.; Arous, A.; Palese, A.M.; Nuzzo, V.; Celano, G. Electromagnetic induction: A support tool for the evaluation of soil CO2 emissions and soil organic carbon content in olive orchards under semi-arid conditions. Geoderma 2016, 264, 188–194. [Google Scholar] [CrossRef]
  49. Peralta, N.R.; Costa, J.L. Delineation of management zones with soil apparent electrical conductivity to improve nutrient management. Comput. Electron. Agric. 2013, 99, 218–226. [Google Scholar] [CrossRef]
  50. de Assis Silva, S.; dos Santos, R.O.; de Queiroz, D.M.; de Souza Lima, J.S.; Pajehú, L.F.; Carvalho Medauar, C. Apparent soil electrical conductivity in the delineation of management zones for cocoa cultivation. Inf. Process. Agric. 2022, 9, 443–455. [Google Scholar] [CrossRef]
  51. Tully, K.L.; McAskill, C. Promoting soil health in organically managed systems: A review. Org. Agric. 2019, 10, 339–358. [Google Scholar] [CrossRef]
  52. Gomiero, T.; Pimentel, D.; Paoletti, M.G. Environmental Impact of Different Agricultural Management Practices: Conventional vs. Organic Agriculture. Crit. Rev. Plant Sci. 2011, 30, 95–124. [Google Scholar] [CrossRef]
  53. Bai, Z.; Caspari, T.; Gonzalez, M.R.; Batjes, N.H.; Mäder, P.; Bünemann, E.K.; de Goede, R.; Brussaard, L.; Xu, M.; Ferreira, C.S.S.; et al. Effects of agricultural management practices on soil quality: A review of long-term experiments for Europe and China. Agric. Ecosyst. Environ. 2018, 265, 1–7. [Google Scholar] [CrossRef]
  54. Stewart, C.E.; Paustian, K.; Conant, R.T.; Plante, A.F.; Six, J. Soil carbon saturation: Concept, evidence and evaluation. Biogeochemistry 2007, 86, 19–31. [Google Scholar] [CrossRef]
  55. Quintarelli, V.; Radicetti, E.; Allevato, E.; Stazi, S.R.; Haider, G.; Abideen, Z.; Bibi, S.; Jamal, A.; Mancinelli, R. Cover Crops for Sustainable Cropping Systems: A Review. Agriculture 2022, 12, 2076. [Google Scholar] [CrossRef]
  56. García-González, I.; Hontoria, C.; Gabriel, J.L.; Alonso-Ayuso, M.; Quemada, M. Cover crops to mitigate soil degradation and enhance soil functionality in irrigated land. Geoderma 2018, 322, 81–88. [Google Scholar] [CrossRef]
  57. Degens, B.P.; Schipper, L.A.; Sparling, G.P.; Vojvodic-Vukovic, M. Decreases in Organic C Reserves in Soils Can Reduce the Catabolic Diversity of Soil Microbial Communities. Soil Biol. Biochem. 2000, 32, 189–196. [Google Scholar] [CrossRef]
  58. Bandick, A.P.; Dick, R.P. Field management effects on soil enzyme activities. Soil Biol. Biochem. 1999, 31, 1471–1479. [Google Scholar] [CrossRef]
  59. Vukicevich, E.; Lowery, T.; Bowen, P.; Úrbez-Torres, J.R.; Hart, M. Cover crops to increase soil microbial diversity and mitigate decline in perennial agriculture. A review. Agron. Sustain. Dev. 2016, 36, 48. [Google Scholar] [CrossRef]
  60. Praveen-Kumar, T.; Jagadish, C.; Panwar, J.; Shyam, K. A rapid method for assessment of plant residue quality. J. Plant Nutr. Soil Sci. 2003, 166, 662–666. [Google Scholar] [CrossRef]
  61. Hättenschwiler, S.; Jørgensen, H.B. Carbon quality rather than stoichiometry controls litter decomposition in a tropical rain forest. J. Ecol. 2010, 98, 754–763. [Google Scholar] [CrossRef]
  62. Finney, D.M.; Mirsky, S.B.; Ackroyd, V.J. Cover Crop Mixture Selection and Management. 2016 Southern SARE Cover Crop Conference. p. 3. Available online: https://southerncovercrops.org/wp-content/uploads/2019/03/Cover-Crop-Mixture-Selection-and-Management.pdf (accessed on 10 July 2024).
  63. Adam, G.; Duncan, H. Development of a sensitive and rapid method for the measurement of total microbial activity using fluorescein diacetate (FDA) in a range of soils. Soil Biol. Biochem. 2001, 33, 943–951. [Google Scholar] [CrossRef]
  64. Taylor, J.P.; Wilson, B.; Mills, M.S.; Burns, R.G. Comparison of microbial numbers and enzymatic activities in surface soils and subsoils using various techniques. Soil Biol. Biochem. 2002, 34, 387–401. [Google Scholar] [CrossRef]
  65. Ndiaye, E.L.; Sandeno, J.M.; McGrath, D.; Dick, R.P. Integrative biological indicators for detecting change in soil quality. Am. J. Altern. Agric. 2000, 15, 26–36. [Google Scholar] [CrossRef]
  66. Fisk, M.C.; Fahey, T.J. Microbial biomass and nitrogen cycling responses to fertilization and litter removal in young northern hardwood forests. Biogeochemistry 2001, 53, 201–223. [Google Scholar] [CrossRef]
  67. Dick, R.P.; Breakwell, D.P.; Turco, R.F. Soil enzyme activities and biodiversity measurements as integrative microbiological indicators. In Methods of Assessing Soil Quality; Doran, J.W., Jones, A.J., Eds.; SSSA: Madison, WI, USA, 1996; Volume 49, pp. 247–271. [Google Scholar]
  68. Frankenberger, W.T.; Dick, W.A. Relationship between enzyme activities and microbial growth and activity indices in soil. Soil Sci. Soc. Am. J. 1983, 47, 945–951. [Google Scholar] [CrossRef]
  69. Perez-Guzman, L.; Phillips, L.A.; Seuradge, B.J.; Agomoh, I.; Drury, C.F. An evaluation of biological soil health indicators in four long-term continuous agroecosystems in Canada. Agrosyst. Geosci. Environ. 2021, 4, e20164. [Google Scholar] [CrossRef]
  70. Sainju, U.M.; Liptzin, D.; Dangi, S.M. Enzyme activities as soil health indicators in relation to soil characteristics and crop production. Agrosyst. Geosci. Environ. 2022, 5, e20297. [Google Scholar] [CrossRef]
  71. Perez-Bejarano, A.; Mataix-Solera, J.; Zornoza, R.; Guerrero, C.; Arcenegui, V.; Mataix-Beneyto, J.; Cano-Amat, S. Influence of plant species on physical, chemical and biological soil properties in a Mediterranean forest soil. Eur. J. For. Res. 2010, 129, 15–24. [Google Scholar] [CrossRef]
  72. Zhou, Z.; Zhang, Z.; Zha, T.; Lu, Z.; Zheng, J.; Sun, O.J. Predicting soil respiration using carbon stock in roots, litter and soil organic matter in forests of Loess Plateau in China. Soil Biol. Biochem. 2013, 57, 135–143. [Google Scholar] [CrossRef]
  73. Schmidt, R.; Gravuer, K.; Bossange, A.V.; Mitchell, J.; Scow, K. Long-term use of cover crops and no-till shift soil microbial community life strategies in agricultural soil. PLoS ONE 2018, 13, e0192953. [Google Scholar] [CrossRef] [PubMed]
  74. Bertin, C.; Yang, X.; Weston, L.A. The role of root exudates and allelochemicals in the rhizosphere. Plant Soil 2003, 256, 67–83. [Google Scholar] [CrossRef]
  75. De Graaff, M.A.È.; Classen, A.T.; Castro, H.F.; Schadt, C.W. Labile soil carbon inputs mediate the soil microbial community composition and plant residue decomposition rates. New Phytol. 2010, 188, 1055–1064. [Google Scholar] [CrossRef] [PubMed]
  76. Navarro-Noya, Y.E.; Gomez-Acata, S.; Montoya-Ciriaco, N.; Rojas-Valdez, A.; Suárez-Arriaga, M.C.; Valenzuela-Encinas, C.; Jiménez-Bueno, N.; Verhulst, N.; Govaerts, B.; Dendooven, L. Relative impacts of tillage, residue management and crop-rotation on soil bacterial communities in a semi-arid agroecosystem. Soil Biol Biochem. 2013, 65, 86–95. [Google Scholar] [CrossRef]
  77. Ramirez-Villanueva, D.A.; Bello-Lopez, J.M.; Navarro-Noya, Y.E.; Luna-Guido, M.; Verhulst, N.; Govaerts, B.; Dendooven, L. Bacterial community structure in maize residue amended soil with contrasting management practices. Appl. Soil Ecol. 2015, 90, 49–59. [Google Scholar] [CrossRef]
  78. Balkcom, K.; Schomberg, H.; Dewey Lee, R. Cover Crop Management. In Conservation Tillage Systems in the Southeast Production, Profitability and Stewardship; Bergtold, J., Sailus, M., Eds.; SARE Handbook Series 15 Sustainable Agriculture Research and Education (SARE); U.S. Department of Agriculture: Washington, DC, USA, 2020; pp. 56–76. [Google Scholar]
  79. Jenkinson, D.S.; Hart, P.B.S.; Rayner, J.H.; Parry, L.C. Modelling the turnover of organic matter in long-term experiments at Rothamsted. INTECOL Bull. 1987, 15, 1–8. [Google Scholar]
Figure 1. Maps obtained using the electromagnetic induction technique (EMI) within the Plum BioDynamic (Pl-BioD) and Peach Organic (Pe-Org) systems show the soil electrical conductivity (ECa) values. Soil sampling areas, marked with circles and identified after the EMI survey, fell into the zones characterized by the highest ECa values (ECa-max) and the lowest ones (ECa-min).
Agriculture 14 01527 g001
Figure 2. β-Glucosidase activity of soils taken from the fruit orchard systems under study (Pl-BioD: Plum BioDynamic; Pe-Org: Peach Organic; Ap-CT: Apricot Conventional tillage; Ki-CM: Kiwi Conventional Management; Pe-CM: Peach Conventional Management; Pl-CM: Plum Conventional Management). β-Glucosidase activity is expressed as µmol of pNP-released g−1dry soil h−1. Means (n = 10) with different letters are significantly different at p < 0.05 (Tukey–Kramer test). Vertical bars represent the standard deviation.
Agriculture 14 01527 g002
Figure 3. Fluorescein diacetate hydrolysis (FDA) activity of soils taken from the fruit orchard systems under study (Pl-BioD: Plum BioDynamic; Pe-Org: Peach Organic; Ap-CT: Apricot Conventional tillage; Ki-CM: Kiwi Conventional Management; Pe-CM: Peach Conventional Management; Pl-CM: Plum Conventional Management). FDA activity is expressed as µmol of fluorescein-released g−1dry soil h−1. Means (n = 10) with different letters are significantly different at p < 0.05 (Tukey–Kramer test). Vertical bars represent the standard deviation.
Agriculture 14 01527 g003
Figure 4. Basal respiration of soils (Resp) taken from the fruit orchard systems under study (Pl-BioD: Plum BioDynamic; Pe-Org: Peach Organic; Ap-CT: Apricot Conventional tillage; Ki-CM: Kiwi Conventional Management; Pe-CM: Peach Conventional Management; Pl-CM: Plum Conventional Management). Resp is expressed as CO2 µL h−1 g−1 dry soil. Means (n = 10) with different letters are significantly different at p < 0.05 (Tukey–Kramer test). Vertical bars represent the standard deviation.
Agriculture 14 01527 g004
Figure 5. Average well color development (AWCD) values measured during the incubation period (24, 48, 72, and 96 h from the inoculation of soil samples into the Biolog plates) in soils taken from the fruit orchard systems under study (Pl-BioD: Plum BioDynamic; Pe-Org: Peach Organic; Ap-CT: Apricot Conventional tillage; Ki-CM: Kiwi Conventional Management; Pe-CM: Peach Conventional Management; Pl-CM: Plum Conventional Management). Means (n = 10) are reported in each reading point; vertical bars represent the standard deviation.
Agriculture 14 01527 g005
Figure 6. Average well color development (AWCD), richness (R), and Shannon–Weaver index (H′) normalized values after 48 h of incubation from metabolized substrates in Biolog EcoPlate. Means (n = 5) with different letters are significantly different at p < 0.05 (Tukey–Kramer test). (Pl-BioD: Plum BioDynamic; Pe-Org: Peach Organic; Ap-CT: Apricot Conventional tillage; Ki-CM: Kiwi Conventional Management; Pe-CM: Peach Conventional Management; Pl-CM: Plum Conventional Management).
Agriculture 14 01527 g006
Figure 7. The AWCD for the six groups of substrates (amines/amides; amino acids; carbohydrates; carboxylic acids; miscellaneous; polymers) at 48 h of incubation in Biolog EcoPlate. Means (n = 5) with different letters are significantly different at p < 0.05 (Tukey–Kramer test). (Pl-BioD: Plum BioDynamic; Pe-Org: Peach Organic; Ap-CT: Apricot Conventional Tillage; Ki-CM: Kiwi Conventional Management; Pe-CM: Peach Conventional Management; Pl-CM: Plum Conventional Management).
Agriculture 14 01527 g007
Figure 8. Regression function between (a) average well color development (AWCD); (b) Shannon–Weaver index values (H′), and (c) richness (R) from metabolized substrates in Biolog EcoPlate (at 48 h of incubation) and soil organic carbon (SOC).
Agriculture 14 01527 g008
Figure 9. Individuals factor map (PCA). The labeled individuals are those with the higher contribution to the plane construction. The individuals are colored after their category for the variable “fruit orchard systems”. (Pl-BioD: Plum BioDynamic; Pe-Org: Peach Organic; Ap-CT: Apricot Conventional Tillage; Ki-CM: Kiwi Conventional Management; Pe-CM: Peach Conventional Management; Pl-CM: Plum Conventional Management).
Agriculture 14 01527 g009
Figure 10. Ascending Hierarchical Classification of the individuals. The classification made on individuals reveals three clusters.
Agriculture 14 01527 g010
Table 1. List of the Mediterranean commercial fruit orchards under study belonging to the two geographical areas of Basilicata and Campania Region (Southern Italy). Details on the adopted soil management practices over time are reported. (Pl-BioD: Plum BioDynamic; Pe-Org: Peach Organic; Ap-CT: Apricot Conventional tillage; Ki-CM: Kiwi Conventional Management; Pe-CM: Peach Conventional Management; Pl-CM: Plum Conventional Management).
Pl-BioDBefore 1996: Plum1996–2006: Plum 2006–2014: Plum
TilledOrganic management—spontaneous grass cover mowed and left on the ground, together with shredded pruning material as mulchingBioDynamic management—seeded grass cover mowed and left on the ground, together with shredded pruning material as mulching
Pe-OrgBefore 1999: Peach1999–2008: other Peach2008–2014: other Peach
TilledOrganic management—spontaneous grass cover mowed and left on the ground, together with shredded pruning material as mulchingOrganic management—spontaneous grass cover mowed and left on the ground, together with shredded pruning material as mulching
Ap-CTBefore 2001: Peach2001–2014: Apricot
Tilled (rotary tillers—20–25 cm depth)
Pruning material shredded in the field
Tilled (rotary tillers—20–25 cm depth)
Pruning material shredded in the field
Pe-CM1987–2011: Kiwi2011–2012: Grass2012–2014: Peach
With mulch: spontaneous grass cover between rows—chemical weeding (glyphosate) under the trees in the row TilledConventional Management –soil of inter-rows covered by spontaneous grasses mowed and left on the ground as mulching—chemical weeding (Glyphosate) under the trees on the row—Pruning material shredded in the field and left as mulching
Ki-CMBefore 2013: Peach2013–2014: Kiwi
Conventional Management—soil of inter-rows covered by spontaneous grasses mowed and left on the ground as mulching—chemical weeding (Glyphosate) under the trees on the row—Pruning material shredded in the field and left as mulchingConventional Management –soil of inter-rows covered by spontaneous grasses mowed and left on the ground as mulching—chemical weeding (Glyphosate) under the trees on the row—Pruning material shredded in the field and left as mulching
Pl-CMBefore 1999: Peach1999–2014: Plum
TilledConventional Management -
soil of inter-rows temporary covered by spontaneous grasses and tilled (motor hoe operating at 10 cm depth)—mechanical weeding in the row under the trees—Grass residues and shredded pruning material left on the ground as mulching
Table 2. Agronomical features of the fruit orchard systems under investigation (Pl-BioD: Plum BioDynamic; Pe-Org: Peach Organic; Ap-CT: Apricot Conventional tillage; Ki-CM: Kiwi Conventional Management; Pe-CM: Peach Conventional Management; Pl-CM: Plum Conventional Management).
Fruit Orchard SystemSpeciesRootstock/CultivarPlants Distance
(m)
Fruit Tree Shape
Pl-BioDPlum
(25 years)
Mirabolane/Black diamond4 × 4.5Vase
Pe-OrgPeach
(6 years)
GF677/Sagitaria4.5 × 3.5Delayed vase
Ap-CTApricot
(13 years)
Mirabolane/Ninfa5 × 5Vase
Pl-CM Plum
(20 years)
Mirabolane/Angeleno4.5 × 1.5Y transverse
Pe-CMPeach
(2 years)
Puebla de soto/Sweet4.5 × 1.5Y transverse
Ki-CMKiwi
(2 years)
Bruno/Hayward4.5 × 2T-bar
Table 3. Characteristics of soil samples taken from the two zones identified within each fruit orchard system using the EMI survey and characterized by the highest values of ECa (ECa-max) and the lowest ones (ECa-min). Values are reported in ranges corresponding to ECa-min zone (first number) and ECa-max zone (second number). (Pl-BioD: Plum BioDynamic; Pe-Org: Peach Organic; Ap-CT: Apricot Conventional tillage; Ki-CM: Kiwi Conventional Management; Pe-CM: Peach Conventional Management; Pl-CM: Plum Conventional Management).
ECa
(mS m−1)
SOC
(g kg−1)
pHElectrical Conductivity (mS m−1)Skeleton
(g kg−1)
Sand
(g kg−1)
Silt
(g kg−1)
Clay
(g kg−1)
Orchard System ECa range (ECa-min—ECa-max)
Pl-BioD0.3–40.017.9–18.07.2–7.2301.5–310.514.1–132.2285.4–313.8309.6–326.9261.9–373.8
Pe-Org 9.1–36.415.6–19.57.2–7.2318.5–350.511.3–49.8260.6–333.9326.6–377.5293.3–350.8
Ap-CT 0.5–38.86.1–10.27.2–7.4335.5–615.022.9–272.9316.2–406.4190.9–296.1188.8–365.3
Pl-CM75.6–106.114.5–14.77.1–7.2165.5–166.526.0–41.5371.7–386.4215.9–217.3397.7–411.0
Pe-CM 50.0–89.516.2–19.77.8–8.0160.7–171.315.0–29.0335.1–362.3251.0–275.2362.5–413.9
Ki-CM30.1–94.418.0–18.67.9–8.0110.7–206.0112.0–129.0390.5–394.9181.9–201.1404.4–427.6
Disclaimer/Publisher’s Note: The statements, opinions and data contained in all publications are solely those of the individual author(s) and contributor(s) and not of MDPI and/or the editor(s). MDPI and/or the editor(s) disclaim responsibility for any injury to people or property resulting from any ideas, methods, instructions or products referred to in the content.

