Article

Study on the Characteristics of Residual Film–Soil–Root Stubble Complex in Maize Stubble Fields of the Hexi Corridor and Establishment of a Discrete Element Model

by
Xiaolong Liu
,
Ruijie Shi
,
Wuyun Zhao
*,
Wei Sun
,
Peiwen Li
,
Hui Li
,
Hua Zhang
,
Jiuxin Wang
,
Guanping Wang
and
Fei Dai
College of Mechanical and Electrical Engineering, Gansu Agricultural University, Lanzhou 730070, China
*
Author to whom correspondence should be addressed.
Agriculture 2024, 14(9), 1542; https://doi.org/10.3390/agriculture14091542
Submission received: 29 July 2024 / Revised: 30 August 2024 / Accepted: 5 September 2024 / Published: 6 September 2024
(This article belongs to the Section Agricultural Soils)

Abstract

:
Plastic film mulching is one of the key technologies for improving agricultural productivity in arid and semi-arid regions. However, residual plastic film can severely disrupt the structure of the topsoil in farmland, leading to a decrease in crop yield. The Hexi Corridor, as the largest seed maize production base in the arid regions of Northwest China, is facing an increasingly prominent issue of residual plastic film recovery. This study designed experiments based on the typical maize planting model in the Hexi Corridor. A discrete element simulation model of the residual film–soil–root stubble complex was established using the Bonding-V2 model and API rapid filling technology. The reliability of the simulation model was verified through shear and puncture tests. The study revealed that the soil type in the Hexi Corridor is heavy sandy soil. The differences between the average maximum shear forces in the simulated and actual shear tests for root stubble–soil complexes at depths of 30 mm, 50 mm, and 100 mm were 4.8%, 6.4%, and 6.5%, respectively. Additionally, the differences in the average maximum vertical loading forces in the simulated and actual puncture tests for root stubble–soil complexes at depths of 50 mm and 100 mm were 6.4% and 12.37%, respectively. The small discrepancies between the simulated and actual values, along with the consistency of particle movement trends with real-world conditions, confirmed the reliability and accuracy of the simulation model. This indicates that the established discrete element flexible model can effectively represent actual field conditions, providing discrete element model parameters and theoretical support for optimizing the design of key components in China’s mechanized root stubble handling and residual film recovery machinery.

1. Introduction

Plastic film mulching, as a significant agricultural production technology worldwide, can significantly increase crop yields and improve the crop growing environment. However, the widespread application of this technology has also led to a series of agricultural environmental issues, particularly the severe fragmentation of plastic film after crop harvest and the low recovery rates. Residual plastic film damages the soil structure of the cultivated layer, reducing soil permeability and negatively impacting crop yields [1]. Studies have shown that when the residual film exceeds 240 kg/ha, it severely affects crop yields [2]. Countries like those in the European Union, where the usage of plastic film is low and the agricultural land coverage is smaller, generally do not face significant plastic film residue pollution [3]. In contrast, China, the world’s largest user of plastic film in agriculture, has a plastic film coverage area exceeding 1.73 × 10⁷ hm2 [4]. The Hexi Irrigation District, one of China’s largest seed maize production bases, primarily utilizes plastic film mulching. In recent years, with the expansion of maize planting areas, the issues of root stubble treatment and plastic film residue recovery have become increasingly prominent. These problems not only affect the ecological environment of farmland but also hinder the successful planting of subsequent crops.
In recent years, domestic and international scholars have conducted extensive research on root stubble treatment and plastic film residue recovery. Thidar et al. [5] demonstrated that plastic film could improve soil moisture, root distribution, and maize yield in the Loess Plateau. Zhang et al. [6] analyzed the impact of residual plastic film on the soil ecosystem. Kou et al. [7] designed an integrated machine for root stubble crushing and plastic film residue recovery to address issues such as low recovery rates and high impurity content in recovered plastic film. However, the recovery rate of the plastic film remained low, and the impurity content was high. Guo et al. [8] conducted an analysis of the vibration characteristics and structural optimization of a machine for returning cotton stalks to the field and recovering plastic film residues, providing a reference for straw return and plastic film recovery technology. Jin et al. [9] established models for plastic film residues, soil, and straw using the Bonding model in EDEM 2020 software, verifying the accuracy of the simulation values and providing an important foundation and theoretical basis for key parameters in root stubble treatment and plastic film residue recovery.
However, due to the complex working conditions, high operational difficulty, and incomplete collection of plastic film residues in the Hexi Irrigation District, there is a lack of accurate discrete element model parameters for the plastic film residue–soil–root stubble composite in the design and optimization of key components of plastic film recovery machines. This limitation hinders the ability to conduct efficient simulation experiments and restricts the development of plastic film residue recovery technology in China to some extent. To address the shortcomings in the development of mechanized root stubble and plastic film residue recovery technology, this study focuses on the typical maize planting patterns in the Hexi Irrigation District. It includes soil parameter testing, as well as the establishment of a discrete element model for the plastic film residue–soil–root stubble composite. The accuracy of the simulation model is further validated through actual shear and penetration test designs. This study aims to provide theoretical foundations and parameter support for the mechanized recovery of plastic film residues in China.

2. Materials and Methods

2.1. Agronomic Requirements for Maize in the Hexi Irrigation District

In the Hexi Irrigation District of Gansu Province, the primary maize planting method involves hole sowing on plastic film. The irrigation methods used are subsurface drip irrigation and surface irrigation. The planting format employs plastic film mulching with either wide-narrow row spacing or equal row spacing. The equal row spacing is 550 mm, with narrow rows spaced 400–500 mm apart and wide rows spaced 600–700 mm apart. The planting density is maintained at 6800–7800 plants per mu, ensuring 6500–7500 ears per mu at harvest. The plastic film used has a thickness of 0.01 mm and a width of 1400 mm, with a film surface width of 1200 mm. The planting model is illustrated in Figure 1. Under irrigation conditions, the soil in the Hexi Irrigation District becomes quite compacted in autumn, leading to severe soil hardening [10].

2.2. Experiment on Soil Parameters in Hexi Irrigation District

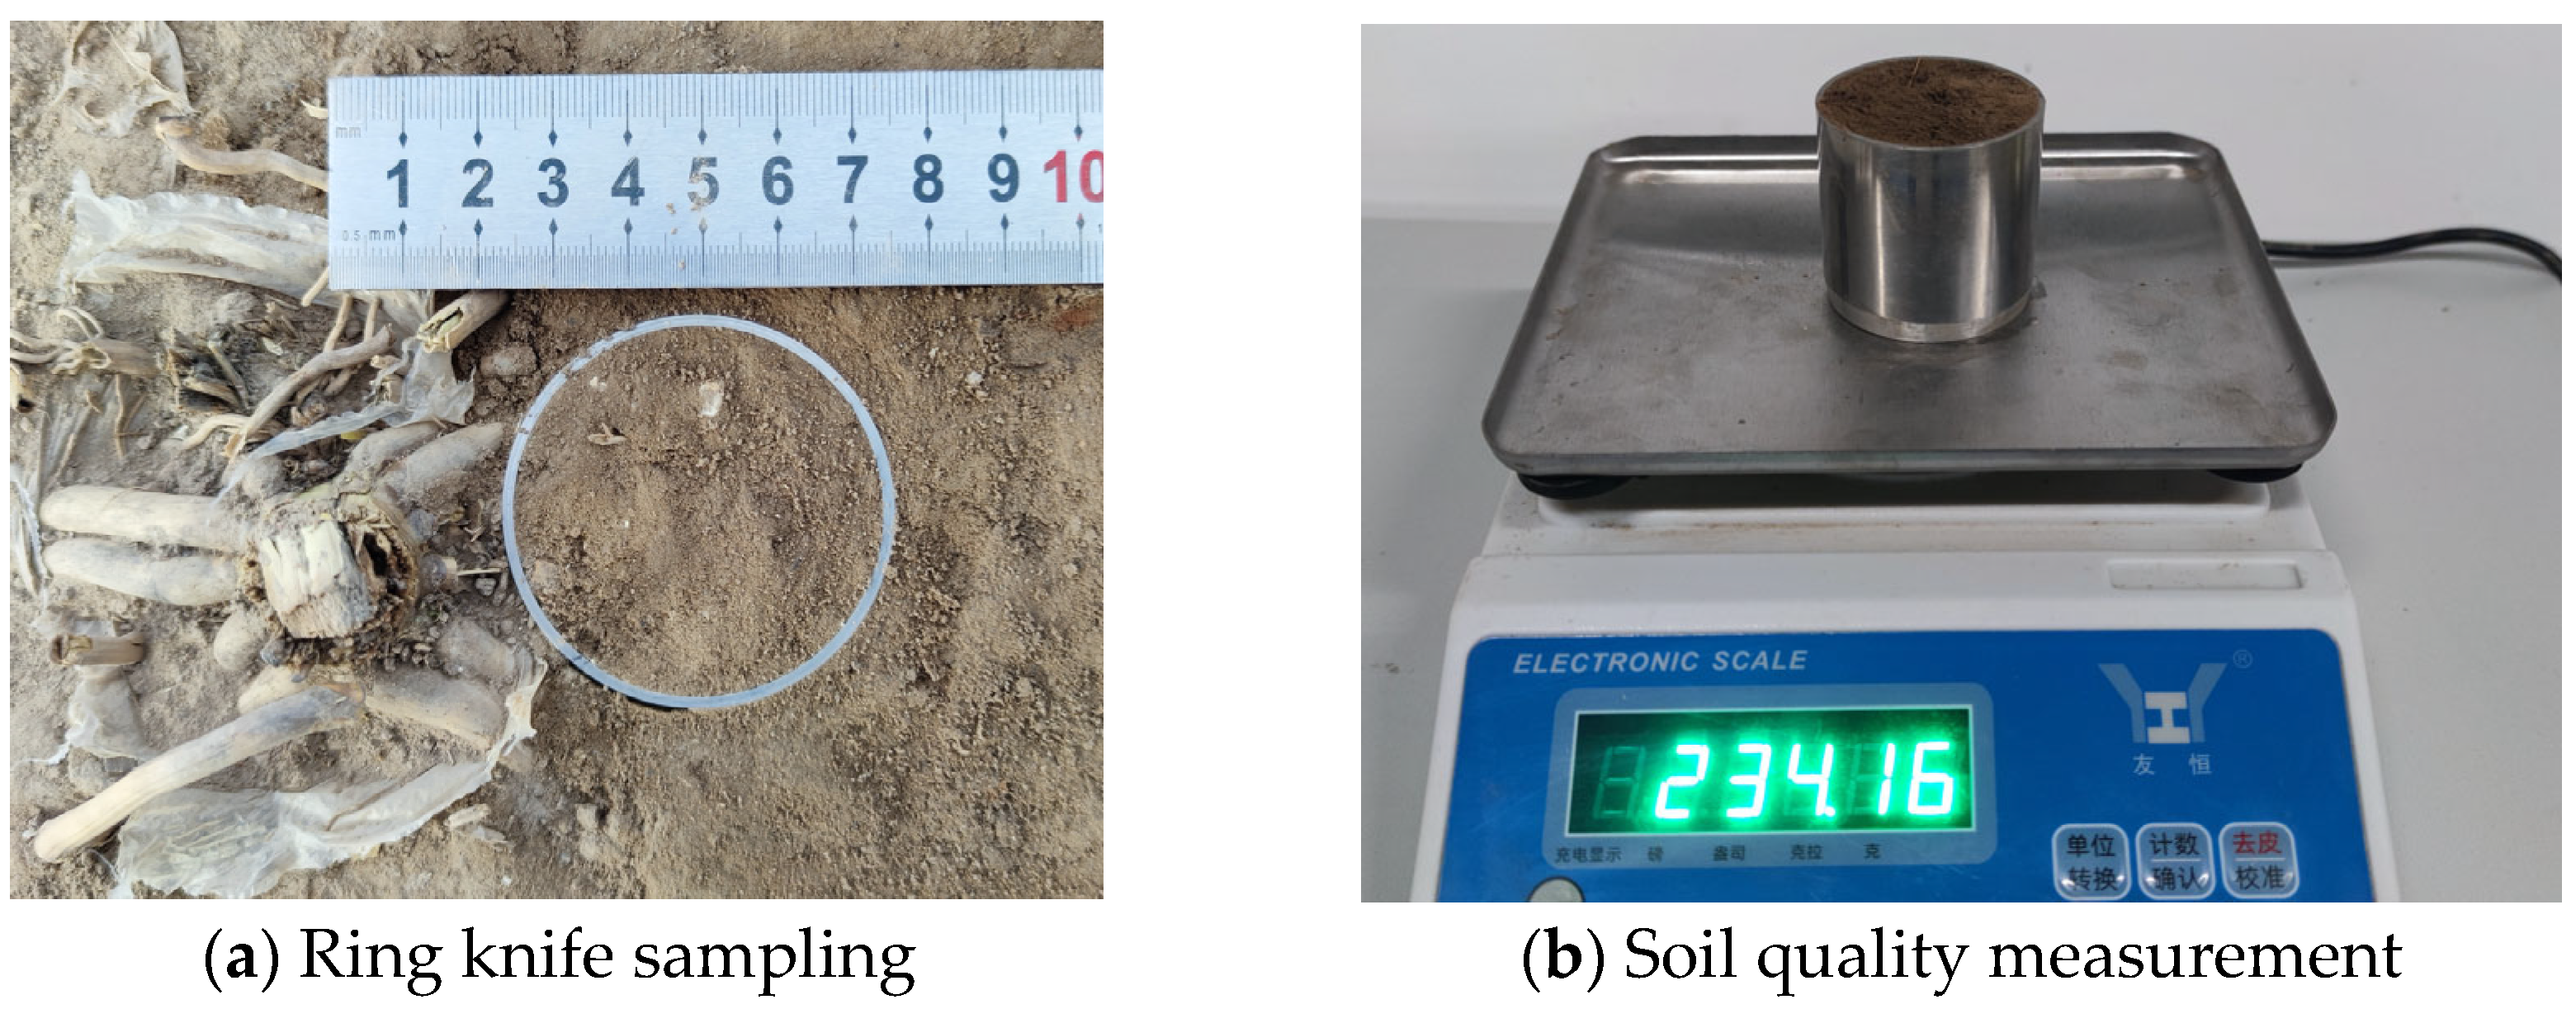
2.2.1. Soil Sample Properties

In Gansu Province, soil types are primarily divided into sandy soil and sandy loam, with sandy soil predominantly found in the Hexi Corridor region. Although sandy soil has poor water and fertilizer retention capabilities, low nutrient content, and rapid soil temperature changes, it has good aeration and permeability, making it easy to cultivate and achieving a utilization rate as high as 92.3%. This study conducted random sampling using the five-point method [11] in the irrigation area of Wuwei City, Hexi Corridor, Gansu Province. The dried soil samples were classified using standard soil sieves (Shaoxing Shangyu Huafeng Hardware Instrument Co., LTD., Shaoxing, China) with different apertures according to the Chinese soil texture classification system [12], as shown in Figure 2. The results of the standard soil sieve test indicate that in the Hexi Irrigation District, 80.69% of the soil mass has a particle size greater than 0.05 mm, and 12.67% has a particle size between 0.05 mm and 0.01 mm, identifying the soil type as very heavy sandy soil (Table 1).

2.2.2. Determination of Soil Moisture Content

Soil moisture content is an important parameter reflecting the state and properties of the soil. Currently, the drying method is one of the most commonly used and accurate methods for determining soil moisture content. Random samples were taken from soil depths of 50 mm, 100 mm, and 150 mm. The samples were placed in weighing boxes, and their total weight was measured. Using a DHG-9030A (Shanghai Whole Zhen Instrument Manufacturing Co., LTD., Shanghai, China) forced air drying oven (Figure 3), the weighing boxes were dried at a constant temperature of 110 °C for 24 h. After drying, the total weight was measured again to calculate the soil moisture content (1) [13]. The results are shown in Table 2.
γ = m 1 m 2 m 2 × 100 %
where
  • m1—wet soil quality, g;
  • m2—dry soil quality, g.
Figure 3. Measurement of soil moisture content by drying method.
Agriculture 14 01542 g003
Table 2. Measurement results of soil water content.
Soil TypesSampling Depth/mmSample NumberWet Soil Quality/gDry Soil Quality/gSample Water Content/gSoil Moisture Content/%Average Value/%
Sandy soil50194.1782.3911.7814.312.93
294.7384.4110.3212.23
3107.3695.6411.7212.25
1001113.1797.8815.2915.6213.55
2100.4489.1111.3312.71
3102.3991.1611.2312.32
1501121.63105.0516.5815.7814.25
2104.6392.1012.5313.6
3116.43102.6913.7413.38

2.2.3. Determination of Soil Density

Soil particle density, as one of the fundamental physical indicators of soil, is closely related to soil texture, structural composition, and organic matter content. The ring knife method is commonly used to measure soil density. Before measurement, the mass of a standard ring knife with a volume of 100 cm3 is weighed. The ring knife is then vertically pressed into the soil with its blade downwards until the soil fills the ring knife, at which point cutting is stopped. Afterwards, the surrounding soil around the ring knife is cut open with a tool and the soil at the bottom of the ring knife is leveled. After cleaning, the ring knife and the total mass of soil are weighed together (Hangzhou Youheng Weighing Equipment Co., LTD., Hangzhou, China). In this study, soil density was measured at different distances horizontally radiating outward from the center of the root stubble: 0 mm, 50 mm, 100 mm, and 150 mm, all at the same depth. Each measurement was repeated three times. The soil particle density was calculated using the formula ρ = m/V, where m is the mass and V is the volume. The experimental process is shown in Figure 4, and the calculation results are presented in Table 3.
It can be seen from Table 3 that the soil density changes with the change of the distance from the center of the root stubble, but it remains in a certain range as a whole. In this study, the sand density is uniformly set at 2490 kg/m3, and the particle density is also 2490 kg/m3.

2.2.4. Determination of Soil Compaction

Soil compaction has significant impacts on agricultural production, soil erosion, root growth, and soil biological activity [14]. In this study, soil compaction was measured on 25 October 2020, in a field at the Hexi Irrigation District experimental base of Gansu Agricultural University using a compaction meter (Shandong Laiyin Optoelectronic Technology Co., LTD., Weifang, China). The previous crop in the test field was maize, the soil type was sandy, and the surface soil moisture content was 13.6%. Measurements were taken from points expanding outward from the periphery of the maize root stubble and averaged after multiple measurements. The results showed that soil compaction decreased from the center of the maize root stubble outward, displaying an interference pattern with the surrounding maize root stubble. Soil compactions at measurement points A and C were relatively close, while point B had a lower soil compaction value. The average soil compaction in the maize stubble field of the Hexi Irrigation District ranged from 2000 to 3000 kPa, as shown in Figure 5.

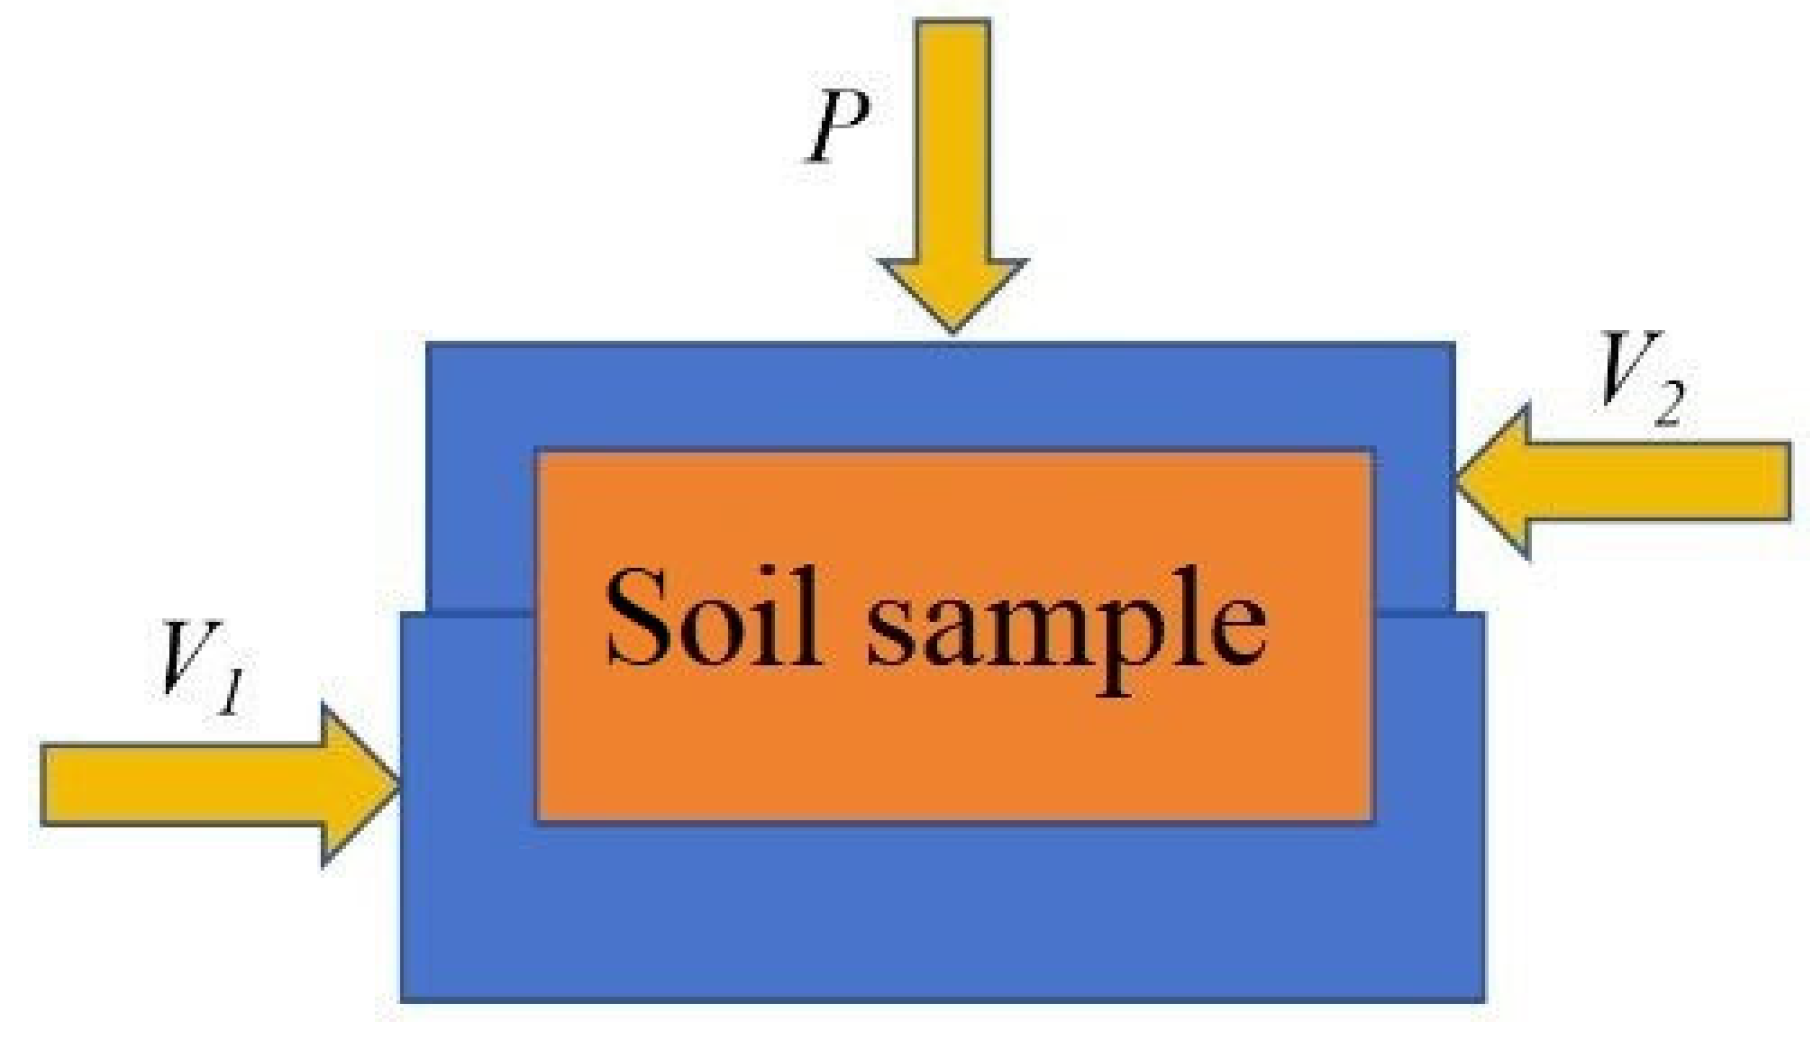
2.3. Stubble–Soil Complex Shear Test

2.3.1. Experimental Method

To ensure the reliability of the discrete element model of the root stubble–soil–residual film composite, the ring knife method was used to sample the root stubble–soil, and the model was simplified by ignoring the residual film parameters to conduct a shear test of the root stubble–soil composite discrete element flexible model. The root stubble–soil composite sample material was collected on 25 October 2020, from the experimental field of Gansu Agricultural University’s Hexi Irrigation District test base. The previous crop in the experimental field was maize, the soil type was sandy soil, the soil firmness was 2800 kPa, and the surface soil moisture content was 13.6% [15,16]. A stainless steel ring knife with an inner diameter of 61 mm and a length of 150 mm was used to take the sample. The center point of the ring knife was aligned with the center point of the root stubble stem, and the ring knife was vertically cut into the root stubble and soil. Once the ring knife edge was completely level with the ground, the surrounding soil was dug out with a shovel, and the ring knife bottom was separated from the soil using a thin-blade knife, resulting in the soil and root stubble composite model [17].
During the experiment, the root stubble–soil composite in the ring knife was placed on top of the soil box. A steel plate with the same diameter as the ring knife was placed on top as a support plate, and a downward force was applied. When the soil–root stubble composite at the bottom of the ring knife entered the shear test box, the force was stopped, and the ring knife bottom was separated from the soil using a thin-blade knife, completing the preparation of the root stubble–soil sample [18]. The shear samples were prepared based on different depths of the root stubble–soil composite, with samples of 30 mm, 50 mm, and 100 mm. The shear test was conducted from shallow to deep on the root stubble–soil composite. At the start of the test, the upper and lower shear boxes were fixed with bolts, and a certain vertical pressure P was applied to the soil in the upper shear box. The lower shear box was fixed, and a certain horizontal force was applied to the upper shear box, which moved horizontally at a certain speed v relative to the lower shear box. The horizontal cross-section of the root stubble–soil composite sample was subjected to shear stress. When the shear stress exceeded a certain value at a certain moment, the root stubble–soil sample was sheared, and the shear stress at this point was the soil’s shear strength [19]. The soil shear strength is caused by soil cohesion and internal friction [20,21]. The principle of soil shear is shown in Figure 6. The friction angle and adhesion strength between soil particles can be calculated using Equation (2).
τ = σ tan φ + c
where
  • τ—shear strength, kPa;
  • δ—vertical pressure, kPa;
  • φ—friction angle, (°);
  • c—adhesion, kPa.
Figure 6. Soil shear principle.
Agriculture 14 01542 g006

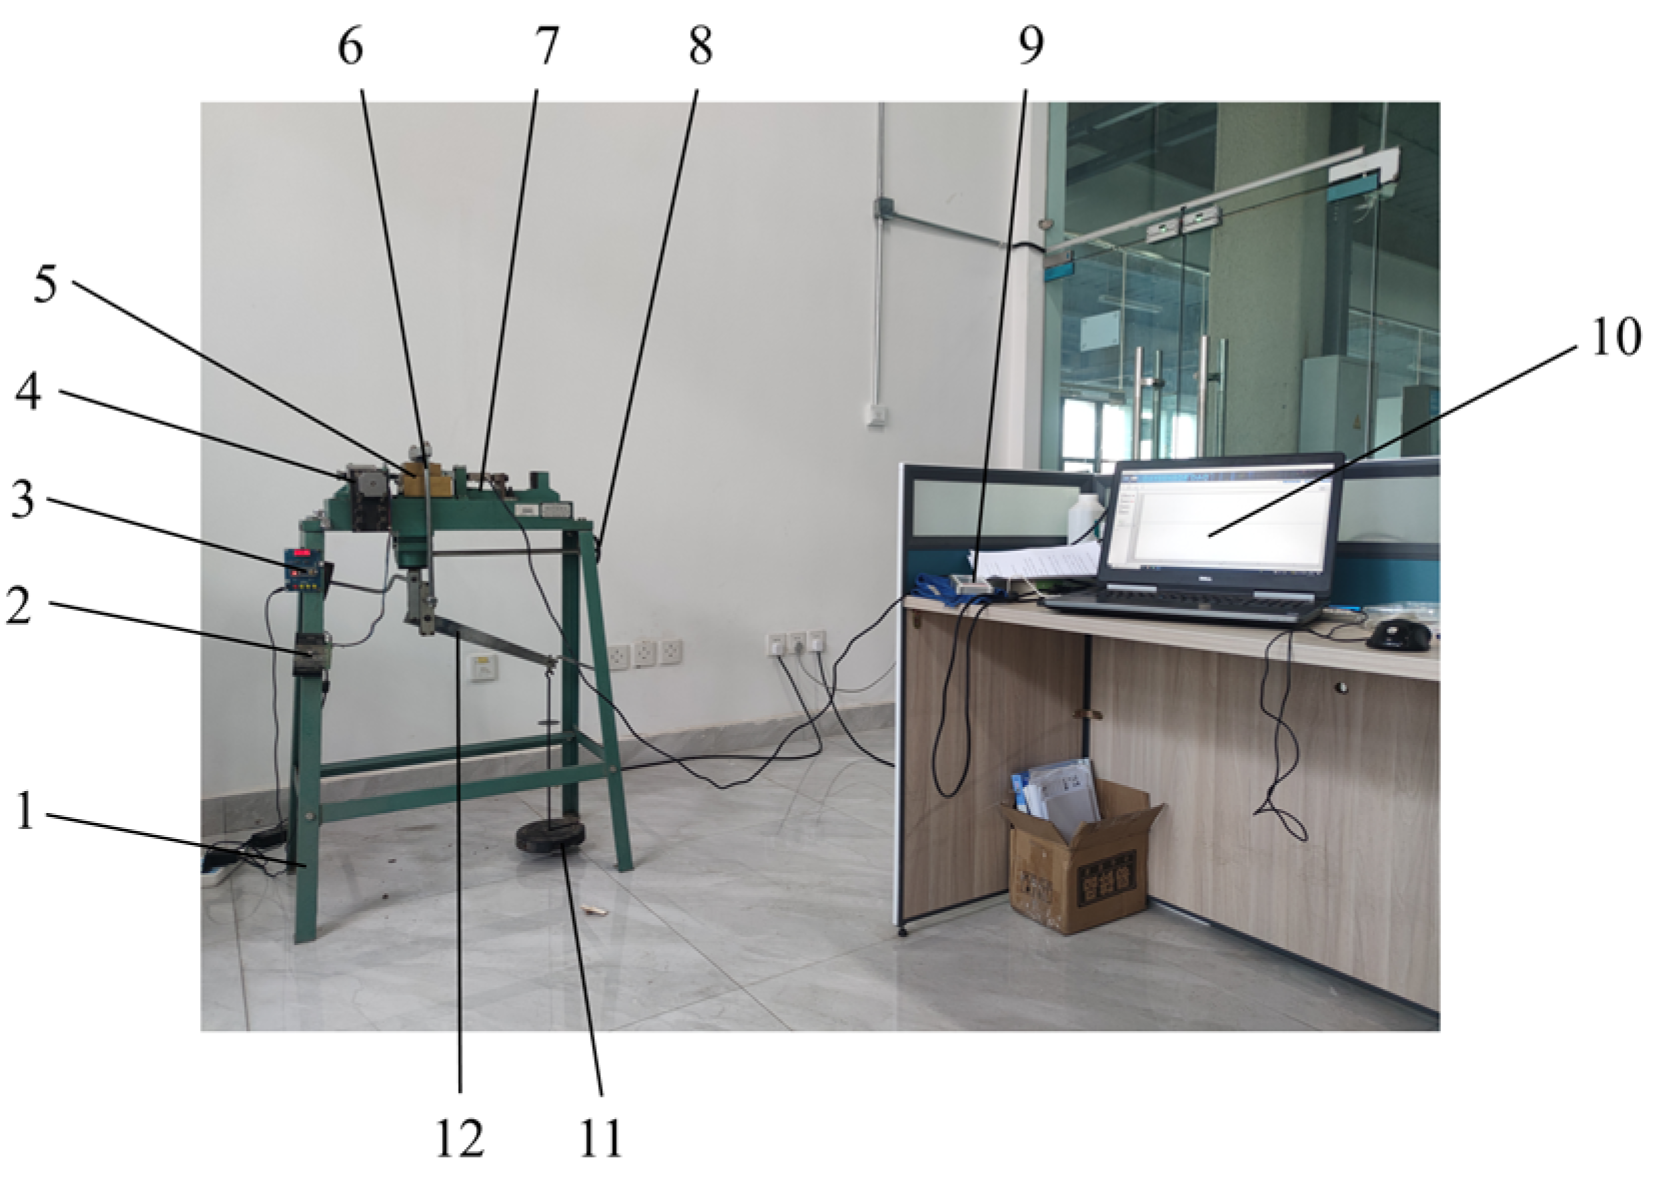
2.3.2. Laboratory Apparatus

The shear test of the root stubble–soil composite was conducted using equipment modified from the ZJ-2-type equal strain direct shear apparatus. This equal strain direct shear apparatus is equipped with an HP-2K digital push–pull force gauge, an HZC-H1 pressure sensor, a permeable stone, a steel ruler, and other components. The ZJ-2-type equal strain direct shear apparatus mainly consists of upper and lower shear boxes, a vertical pressure mechanism, a shear thrust input device, and a frame. The upper shear box is connected to the pressure sensor, and the lower shear box moves laterally on the frame through built-in steel balls in the guide rails. The vertical pressure mechanism applies force to the sample through weights, a lever, a pressure frame, and a pressure transmission plate. The shear thrust input device includes a small stepper motor, a speed control circuit module, a reducer, and a push–pull force gauge. The test process for the root stubble–soil composite is shown in Figure 7.

2.3.3. Test Process

Before the test, a small amount of lubricant should be applied to the guide rails and steel balls at the bottom of the lower shear box, and the position of the steel balls should be adjusted. The upper shear box should be fixed to the lower shear box with bolts, and a clean permeable stone and a pressure transmission plate should be placed on top of the prepared sample. Vertical pressure is applied to the root stubble–soil composite in the shear box using the vertical pressure mechanism, with a uniform vertical pressure of 5 kg applied during the test. The shear samples are prepared based on different depths of the root stubble–soil composite, with samples of 30 mm, 50 mm, and 100 mm. The shear tests are conducted from shallow to deep on the root stubble–soil composite. The digital push–pull force gauge is connected to a computer, and the push sensor is fixed between the upper shear box and the sample. The test data are recorded using the digital force analysis software on the computer. Once everything is ready, the stepper motor power is turned on, and the bolts fixing the upper and lower shear boxes are removed. A command is sent to the stepper motor to operate at a speed of 35 r/min, and the stepper motor drives the worm gear reducer, causing the lower shear box to start moving horizontally. The test is stopped when the values and curves displayed by the computer analysis software reach a peak and begin to decline. The data are saved and exported for analysis. After the test, a reverse signal is sent to the stepper motor, causing the reducer to retract the push rod. The weights, vertical pressure mechanism, pressure transmission plate, upper and lower shear boxes, and permeable stone are sequentially removed. The shear boxes are cleaned before starting the subsequent tests.

2.3.4. Analysis of Test Results

Shear tests on root stubble–soil composite samples at three different depths of 30 mm, 50 mm, and 100 mm were conducted from shallow to deep under the same vertical pressure at a shear rate of 35 r/min using a motor. The test data were exported using digital force analysis software, and the average values were calculated. From the analysis in Table 4, it can be seen that the shear force of the root stubble–soil composite decreased gradually from shallow to deep as the depth increased. The reason for this is that the root stubble–soil composite in the shallow layer has more primary roots and dense fibrous roots of maize, resulting in a tight contact between the soil and root stubble, leading to a higher maximum shear force. In contrast, the root stubble–soil composite in the deeper layer has fewer primary roots and looser fibrous roots, causing a looser contact between the soil and root stubble, resulting in a lower maximum shear force.

2.4. Stubble–Soil Complex Piercing Test

2.4.1. Experimental Method

Similarly, to verify the reliability of the discrete element model of the root stubble–soil–residual film composite, the root stubble–soil samples were collected using the ring knife method, and the model was simplified by ignoring the residual film parameters. This piercing test validates the reliability of the simulation model. The root stubble–soil composite samples were also collected on 25 October 2020, from the maize planting test base of the Hexi Irrigation District at Gansu Agricultural University. A steel ring knife with an inner diameter of 215 mm and a length of 200 mm was used for sampling. The center point of the ring knife was aligned with the center of the root stubble stem and cut vertically into the soil. Once the edge of the ring knife was flush with the ground, a shovel was used to remove the soil around the ring knife, and a thin-bladed knife was used to separate the bottom of the ring knife from the soil, thereby obtaining the soil and root stubble composite model. During sampling, the root stubble–soil composite inside the ring knife was placed on top of a soil box, and a steel plate with the same diameter as the ring knife was placed on top as a support plate. Downward force was applied until the bottom of the root stubble–soil composite in the ring knife entered the shear test box, then the force was stopped. The bottom of the ring knife was then separated from the soil using a thin-bladed knife, thus completing the preparation of the root stubble–soil sample [22].

2.4.2. Laboratory Apparatus

The piercing test of the root stubble–soil composite was conducted in the mechanics laboratory of the College of Mechanical and Electrical Engineering at Gansu Agricultural University. The testing equipment used was the CMT2502 electronic universal testing machine manufactured by Shenzhen SANS Company, as shown in Figure 8. This testing machine was used to perform piercing tests on root stubble–soil composite samples from different parts, measuring the maximum vertical force exerted on the root stubble–soil samples. The parameters of the test, including force and displacement, were measured by a precision force sensor and a displacement sensor located on the testing machine. The maximum load capacity of the machine is 500 N, with an accuracy of ±0.001 N, and the speed range is controlled by a computer within 1 to 500 mm/min.

2.4.3. Test Process

Before the test, check the working condition and operation of the universal testing machine and set the limit device. Replace the shearing platform on the lower fixture platform to lay the root stubble–soil composite sample flat. Secure a custom-made steel needle with a diameter of 6 mm in the upper fixture of the testing machine for the root stubble–soil composite piercing test. Tighten the fixture to its maximum state. Place the root stubble–soil composite sample on the lower shearing platform in the direction of root stubble growth. Set the upper fixture to move downward at a speed of 0.1 m/s for the piercing test, with the piercing depth set to 50 mm and 100 mm. Stop the test and retract the steel needle when it reaches the designated depth in the root stubble–soil composite. Perform five piercing tests along the contour line radiating from the center of the root stubble.

2.4.4. Analysis of Test Results

After the test, use the control software for the tensile pressure sensor on the computer to export the contour data at 50 mm and 100 mm piercing depths along the diffusion direction from the center of the root stubble. Conduct five piercing tests for each group and take the average value. As analyzed in Table 5, the maximum loading force during the piercing of the root stubble–soil composite increases gradually from shallow to deep with varying depths. This is because the shallow root stubble–soil composite has lower soil firmness and looser soil texture, resulting in a smaller maximum loading force. In contrast, the deeper root stubble–soil composite has higher soil firmness and denser soil texture, resulting in a greater maximum loading force [23].

2.5. Simulation Modeling and Experimental Design

To accurately and objectively reflect simulation results, this study employed the discrete element method to simulate the interaction between the film-laying shovel and the plastic film residue–soil–root stubble composite. The simulation model is based on Bonding-JKR and API rapid filling technology. By analyzing the forces and displacements exerted by the film-laying shovel on the plastic film residue–soil–root stubble composite during a single operation cycle, this study investigated their interaction and evaluated the performance of the shovel [24].

2.5.1. Establishment of a Flexible Discrete Element Method Model for Root Stubble

Due to the flood irrigation method used for maize cultivation in the Hexi Irrigation District, coupled with the sandy soil type, the maize root stubble is tightly connected to the soil, leading to severe soil compaction [25,26]. According to preliminary field measurements, the average height of maize root stubble is 10 mm; the maximum diameter of the exposed root stubble circumference is 70 mm; the average number of primary roots is 16, with an average diameter of 4.34 mm; the average number of secondary roots is 10, with an average diameter of 0.36 mm; the average depth of primary root penetration is 79.31 mm; and the average depth of secondary root penetration is 88.23 mm. A simplified three-dimensional model of maize root stubble was established using SolidWorks (Figure 9a), where the maize root diameter is 30 mm, with 16 primary roots of 4 mm in diameter, 10 secondary roots of 4 mm in diameter, and both primary and secondary roots penetrating to a depth of 100 mm. This 3D model of maize root stubble was then imported into EDEM software to create a particle model of maize root stubble with a diameter of 1 mm using the API fast-filling technique and adding bonding model parameters to obtain the discrete element model of maize root stubble (Figure 9b) [27,28]. The characteristic parameters and bonding parameters of maize root stubble particles were calculated using Equation (3), with specific parameters [29,30] shown in Table 6. A total of 36,904 particles and 608,957 bonding bonds were generated, resulting in a good bonding effect.
K n = 4 3 1 ε a 2 E a + 1 ε b 2 E b 1 r a + r b r a r b 1 2 K s = 1 2 2 3 K n σ = F π R 2 γ = c + σ tan φ
where
  • εa, εb—particle Poisson’s ratio;
  • Ea, Eb—elastic modulus of particles, MPa;
  • ra, rb—particle radius, mm;
  • F—critical pressure, N;
  • R—radius of compression surface, mm;
  • c—cohesion of stem, MPa;
  • φ—internal friction angle, (°).
Figure 9. Three-dimensional model of maize root stubble and the discrete element model. 1. Primary root; 2. Secondary root. Note: L1 represents the length of the primary root, mm; L2 represents the stubble height, mm; L3 represents the depth of primary root penetration, mm; D1 represents the diameter of the maize stalk, mm; D2 represents the diameter of the primary root, mm; D3 represents the range of primary root growth diameter when maize stubble is buried 60 mm deep, mm. A is the local enlarged map of discrete element model of maize root stubble.
Agriculture 14 01542 g009
Table 6. Parameters of the maize root stubble discrete element model.
ParameterNumerical Value
Poisson’s ratio0.32
Density/(kg/m3)108
Bonding radius/mm1.3
Shear modulus/Pa6.4 × 106
Recovery coefficientReferences [31,32,33]
Static friction coefficientReferences [31,32,33]
Coefficient of kinetic frictionReferences [31,32,33]
Normal stiffness/(N/m3)References [31,32,33]
Tangential stiffness/(N/m3)References [31,32,33]
Normal critical stress/PaReferences [31,32,33]
Tangential critical stress/PaReferences [31,32,33]

2.5.2. Establishment of the Flexible Discrete Element Model of Soil

The soil within a 0.0375 m2 area surrounding a single maize root stubble was selected as the research subject, and a discrete element model of the soil was established. In SolidWorks, a 3D soil model with dimensions of 250 mm (length) × 150 mm (width) × 100 mm (height) was created, with the space occupied by the buried maize root stubble removed (Figure 10a). A soil particle model with a diameter of 2.5 mm was established in EDEM software, and the discrete element modeling of the soil was completed using the fast-filling technique (Figure 10b). A total of 41,524 particles and 171,046 bonding bonds were generated, resulting in a good bonding effect. The characteristic parameters and bonding parameters of the soil particles are shown in Table 7 [33,34,35].

2.5.3. Discrete Element Flexible Body Modeling of Residual Film

Polyethylene film with a thickness of 0.01 mm is widely used in the Hexi Irrigation District. To accurately represent the characteristics of polyethylene film, the maximum value of 0.5 is used in discrete element simulation [36,37]. Using SolidWorks, a 3D model of polyethylene residual film with dimensions of 250 mm (length) × 150 mm (width) × 3 mm (height) was created, with the space occupied by the buried maize root stubble removed (Figure 11a). In EDEM software, a discrete element model of the polyethylene residual film was obtained by quickly filling with spherical particles with a diameter of 3 mm (Figure 11b). A total of 12,784 particles and 34,655 bonding bonds were generated, resulting in a good bonding effect. The characteristic parameters and bonding parameters of the polyethylene residual film particles are shown in Table 8.

2.5.4. Discrete Element Flexible Body Modeling of the Root Stubble–Soil-Residual Film Composite

Based on the modeling process of root stubble, soil, and residual film in the Hexi Irrigation District, a flexible discrete element model of the root stubble–soil–residual film composite was established. First, a 3D model of the root stubble–soil–residual film composite was drawn in 3D modeling software. Then, a composite mesh model was created through mesh division and other processes. After importing the model into EDEM software, the flexible discrete element model of the root stubble–soil–residual film composite was obtained using the API fast-filling technique and adding bonding model parameters (Figure 12).

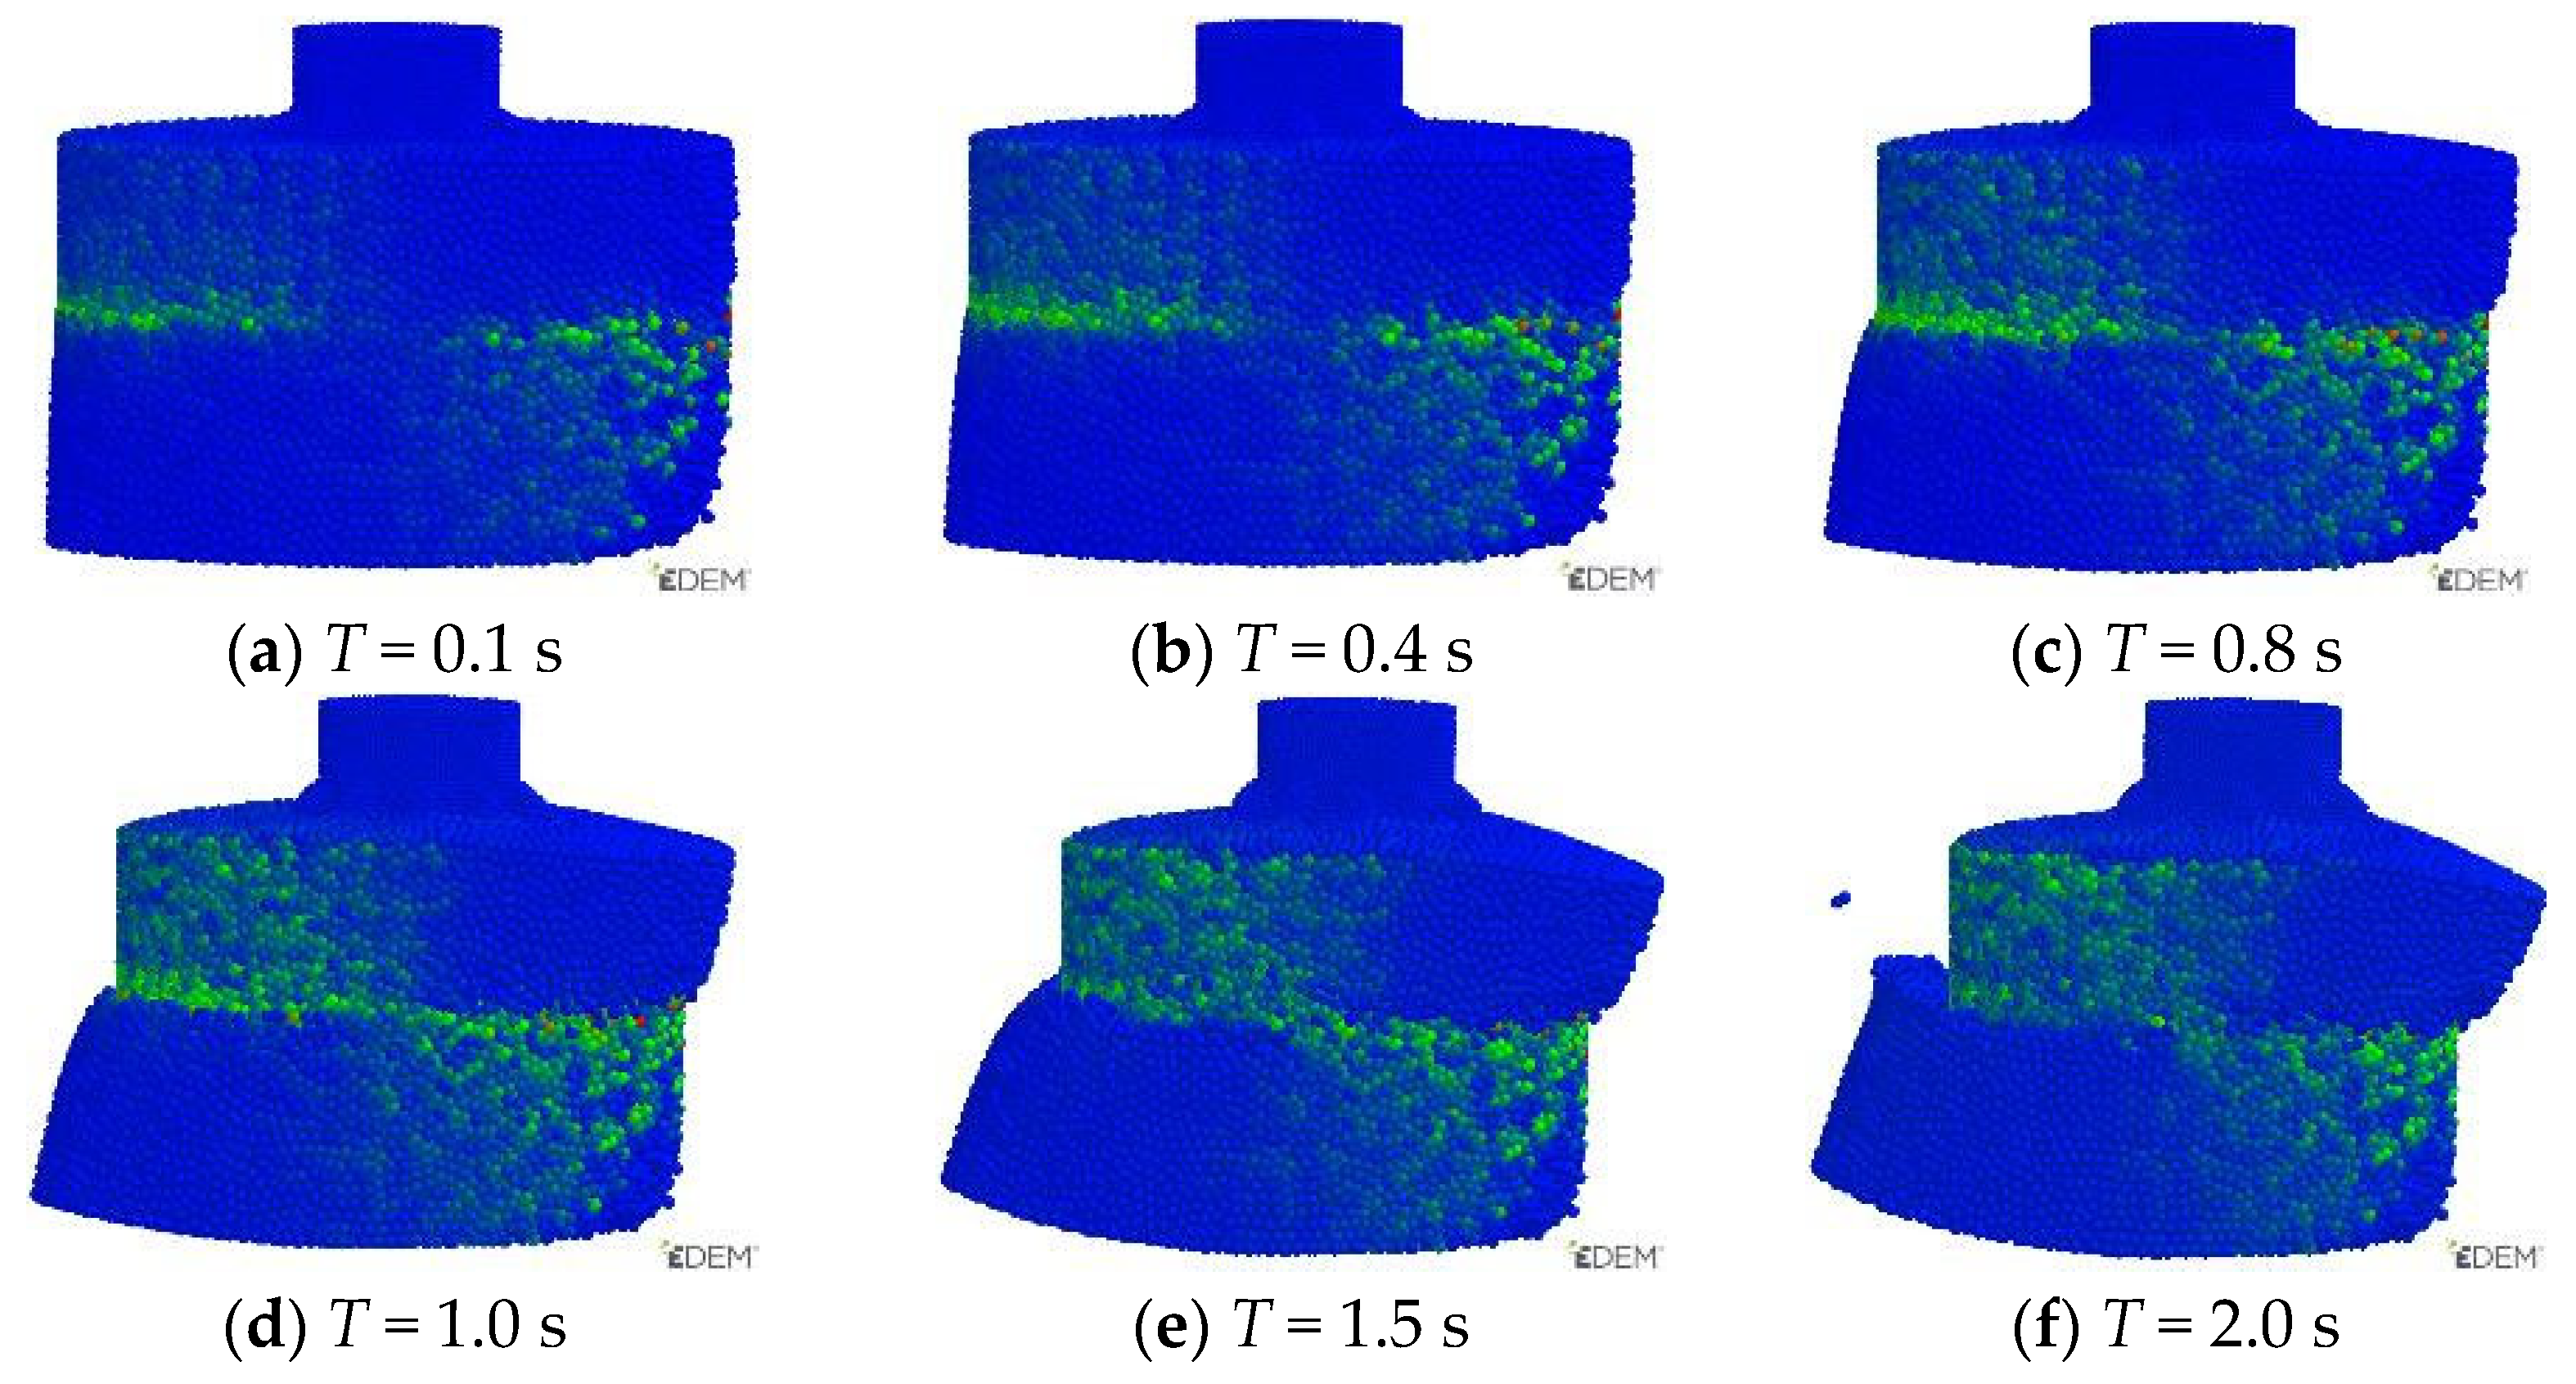
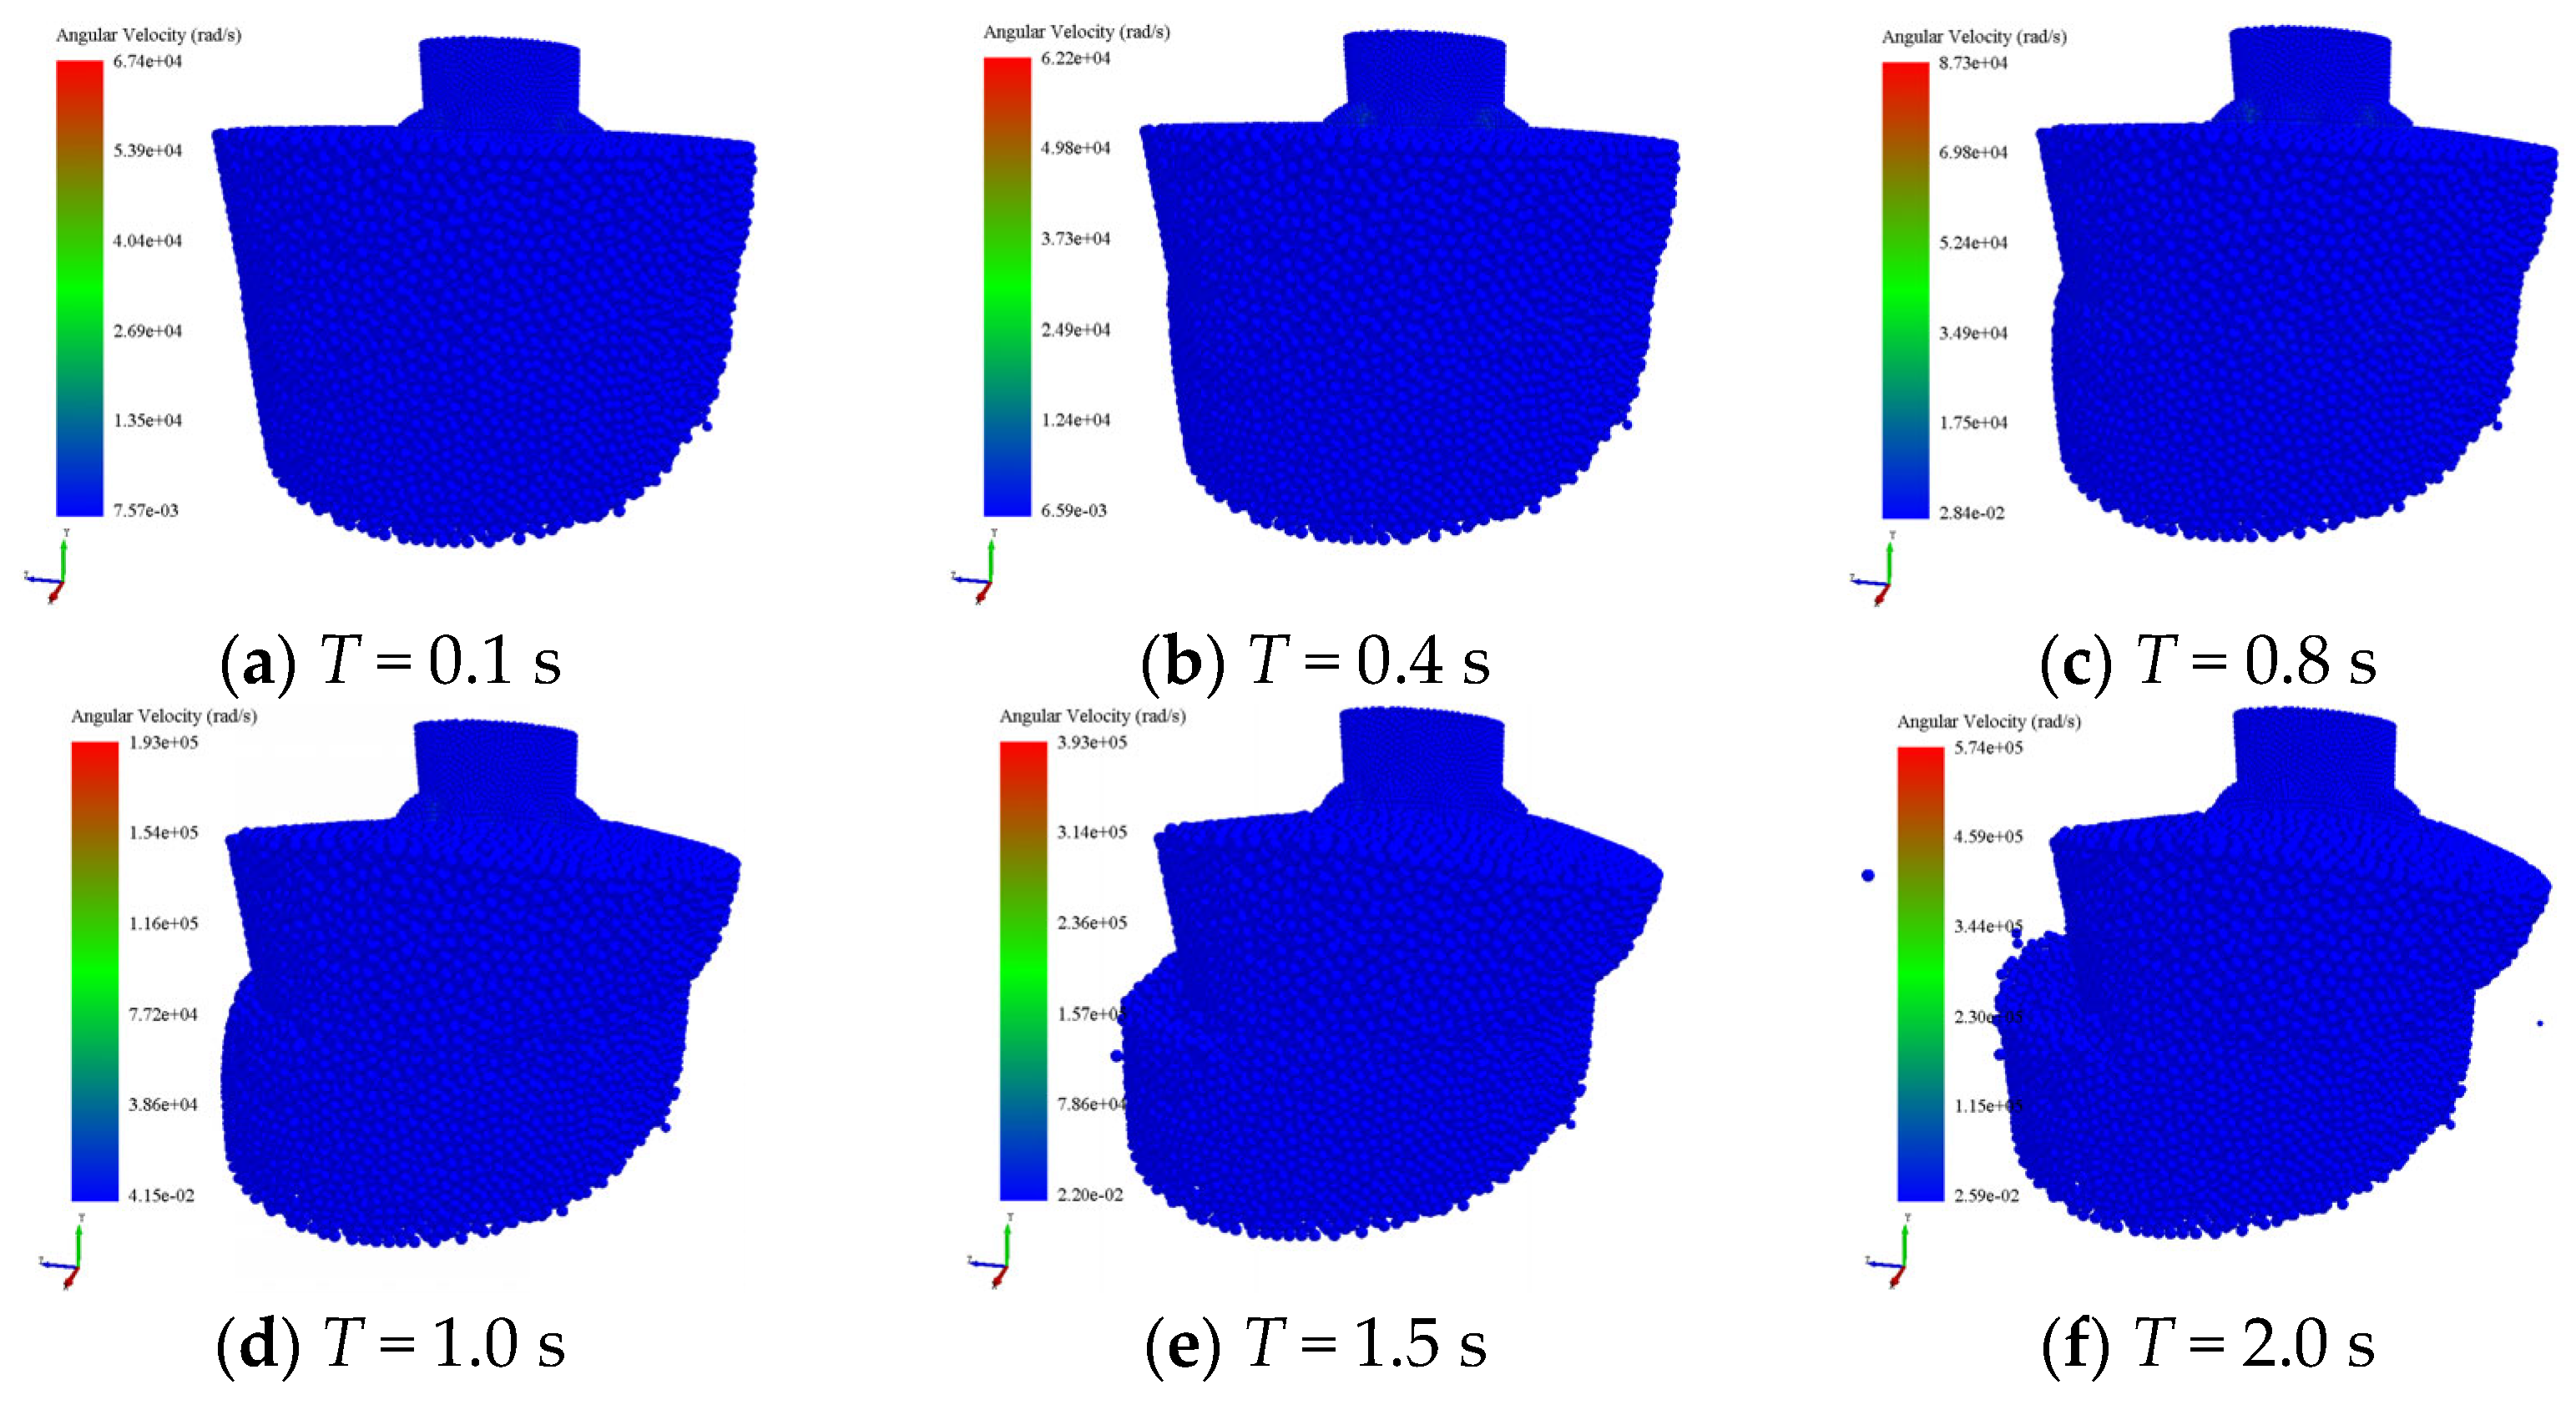
2.5.5. Shear Simulation Test of the Root Stubble–Soil Composite

To verify the reliability of the discrete element model of the root stubble–soil–residual film composite, a shear test of the simplified root stubble–soil composite discrete element model was conducted, based on the flexible model established in Section 2.3.4. The influence of the residual film parameters was neglected. This shear test aimed to validate the model’s reliability [38]. In EDEM software, upper and lower shear box models were established. The contact positions between the upper and lower shear boxes simulated the shear test of the root stubble–soil composite at different depths. Three models with depths of 30 mm, 50 mm, and 100 mm were established to conduct the shear simulation test of the root stubble–soil composite [39], as shown in Figure 13. In the EDEM simulation software, the particles–particles bonding V2 model was used [40], with the time integrator set to Euler, the simulation time step set to 20% of the Rayleigh time, the time step set to 1.39 × 10⁻⁶, and the data saving interval set to 0.01 s, for a total simulation time of 2 s. During the simulation, the upper shear box and root stubble model remained stationary, while the lower shear box’s initial horizontal speed was set to 0.05 m/s. The simulation was stopped when the shear force reached its peak and began to decrease, indicating the maximum shear force.

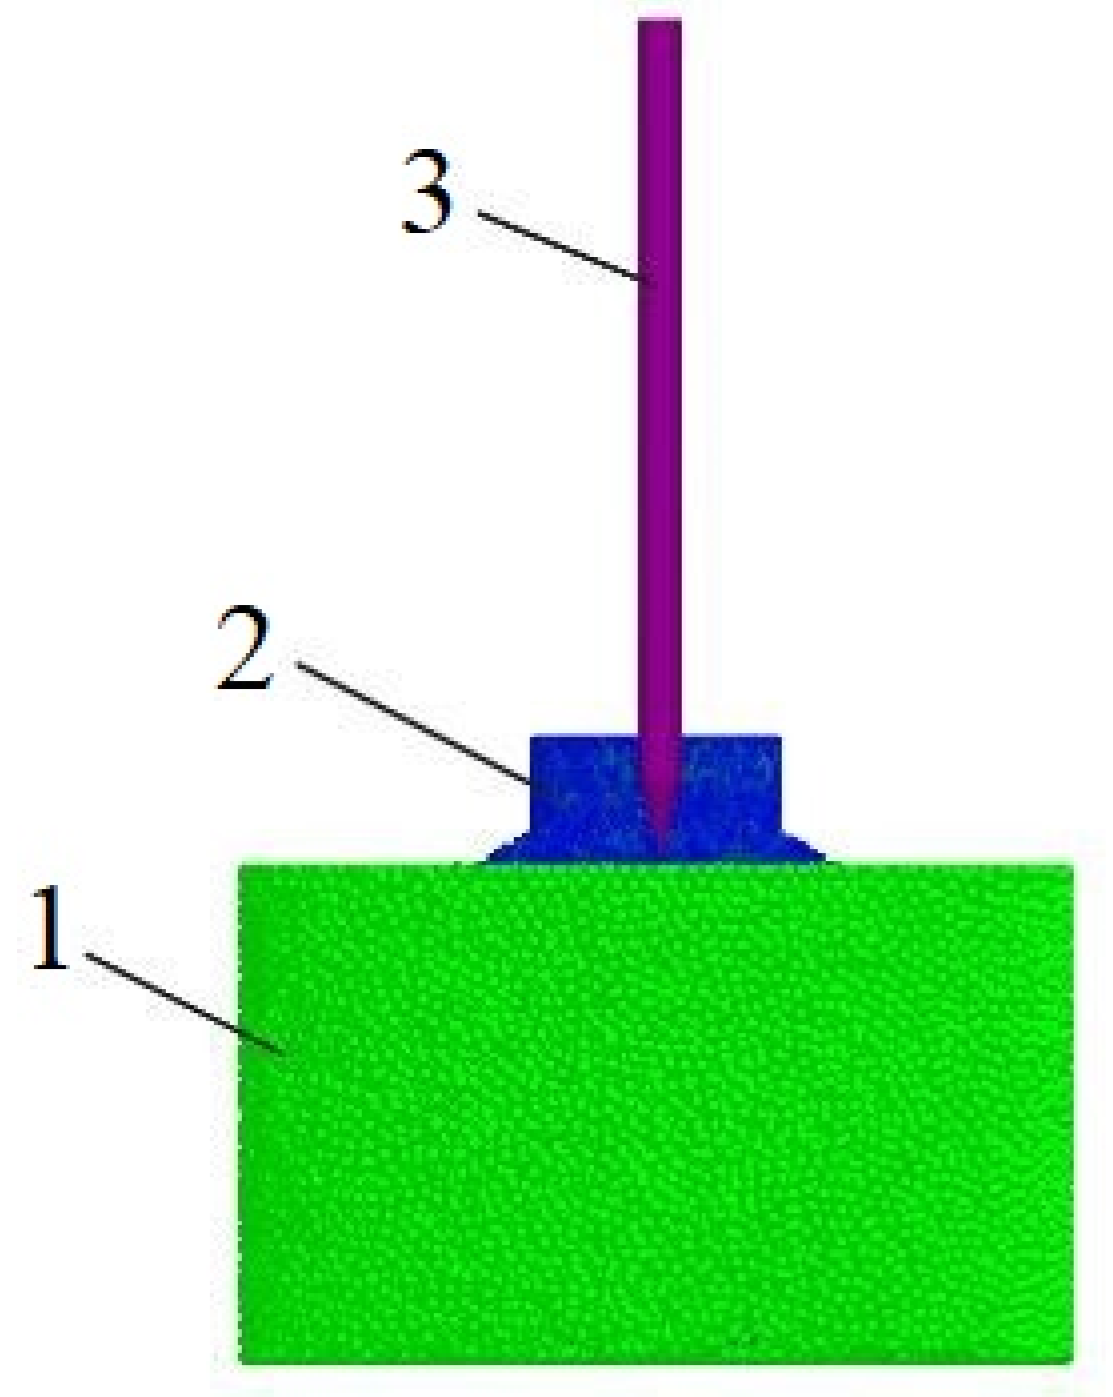
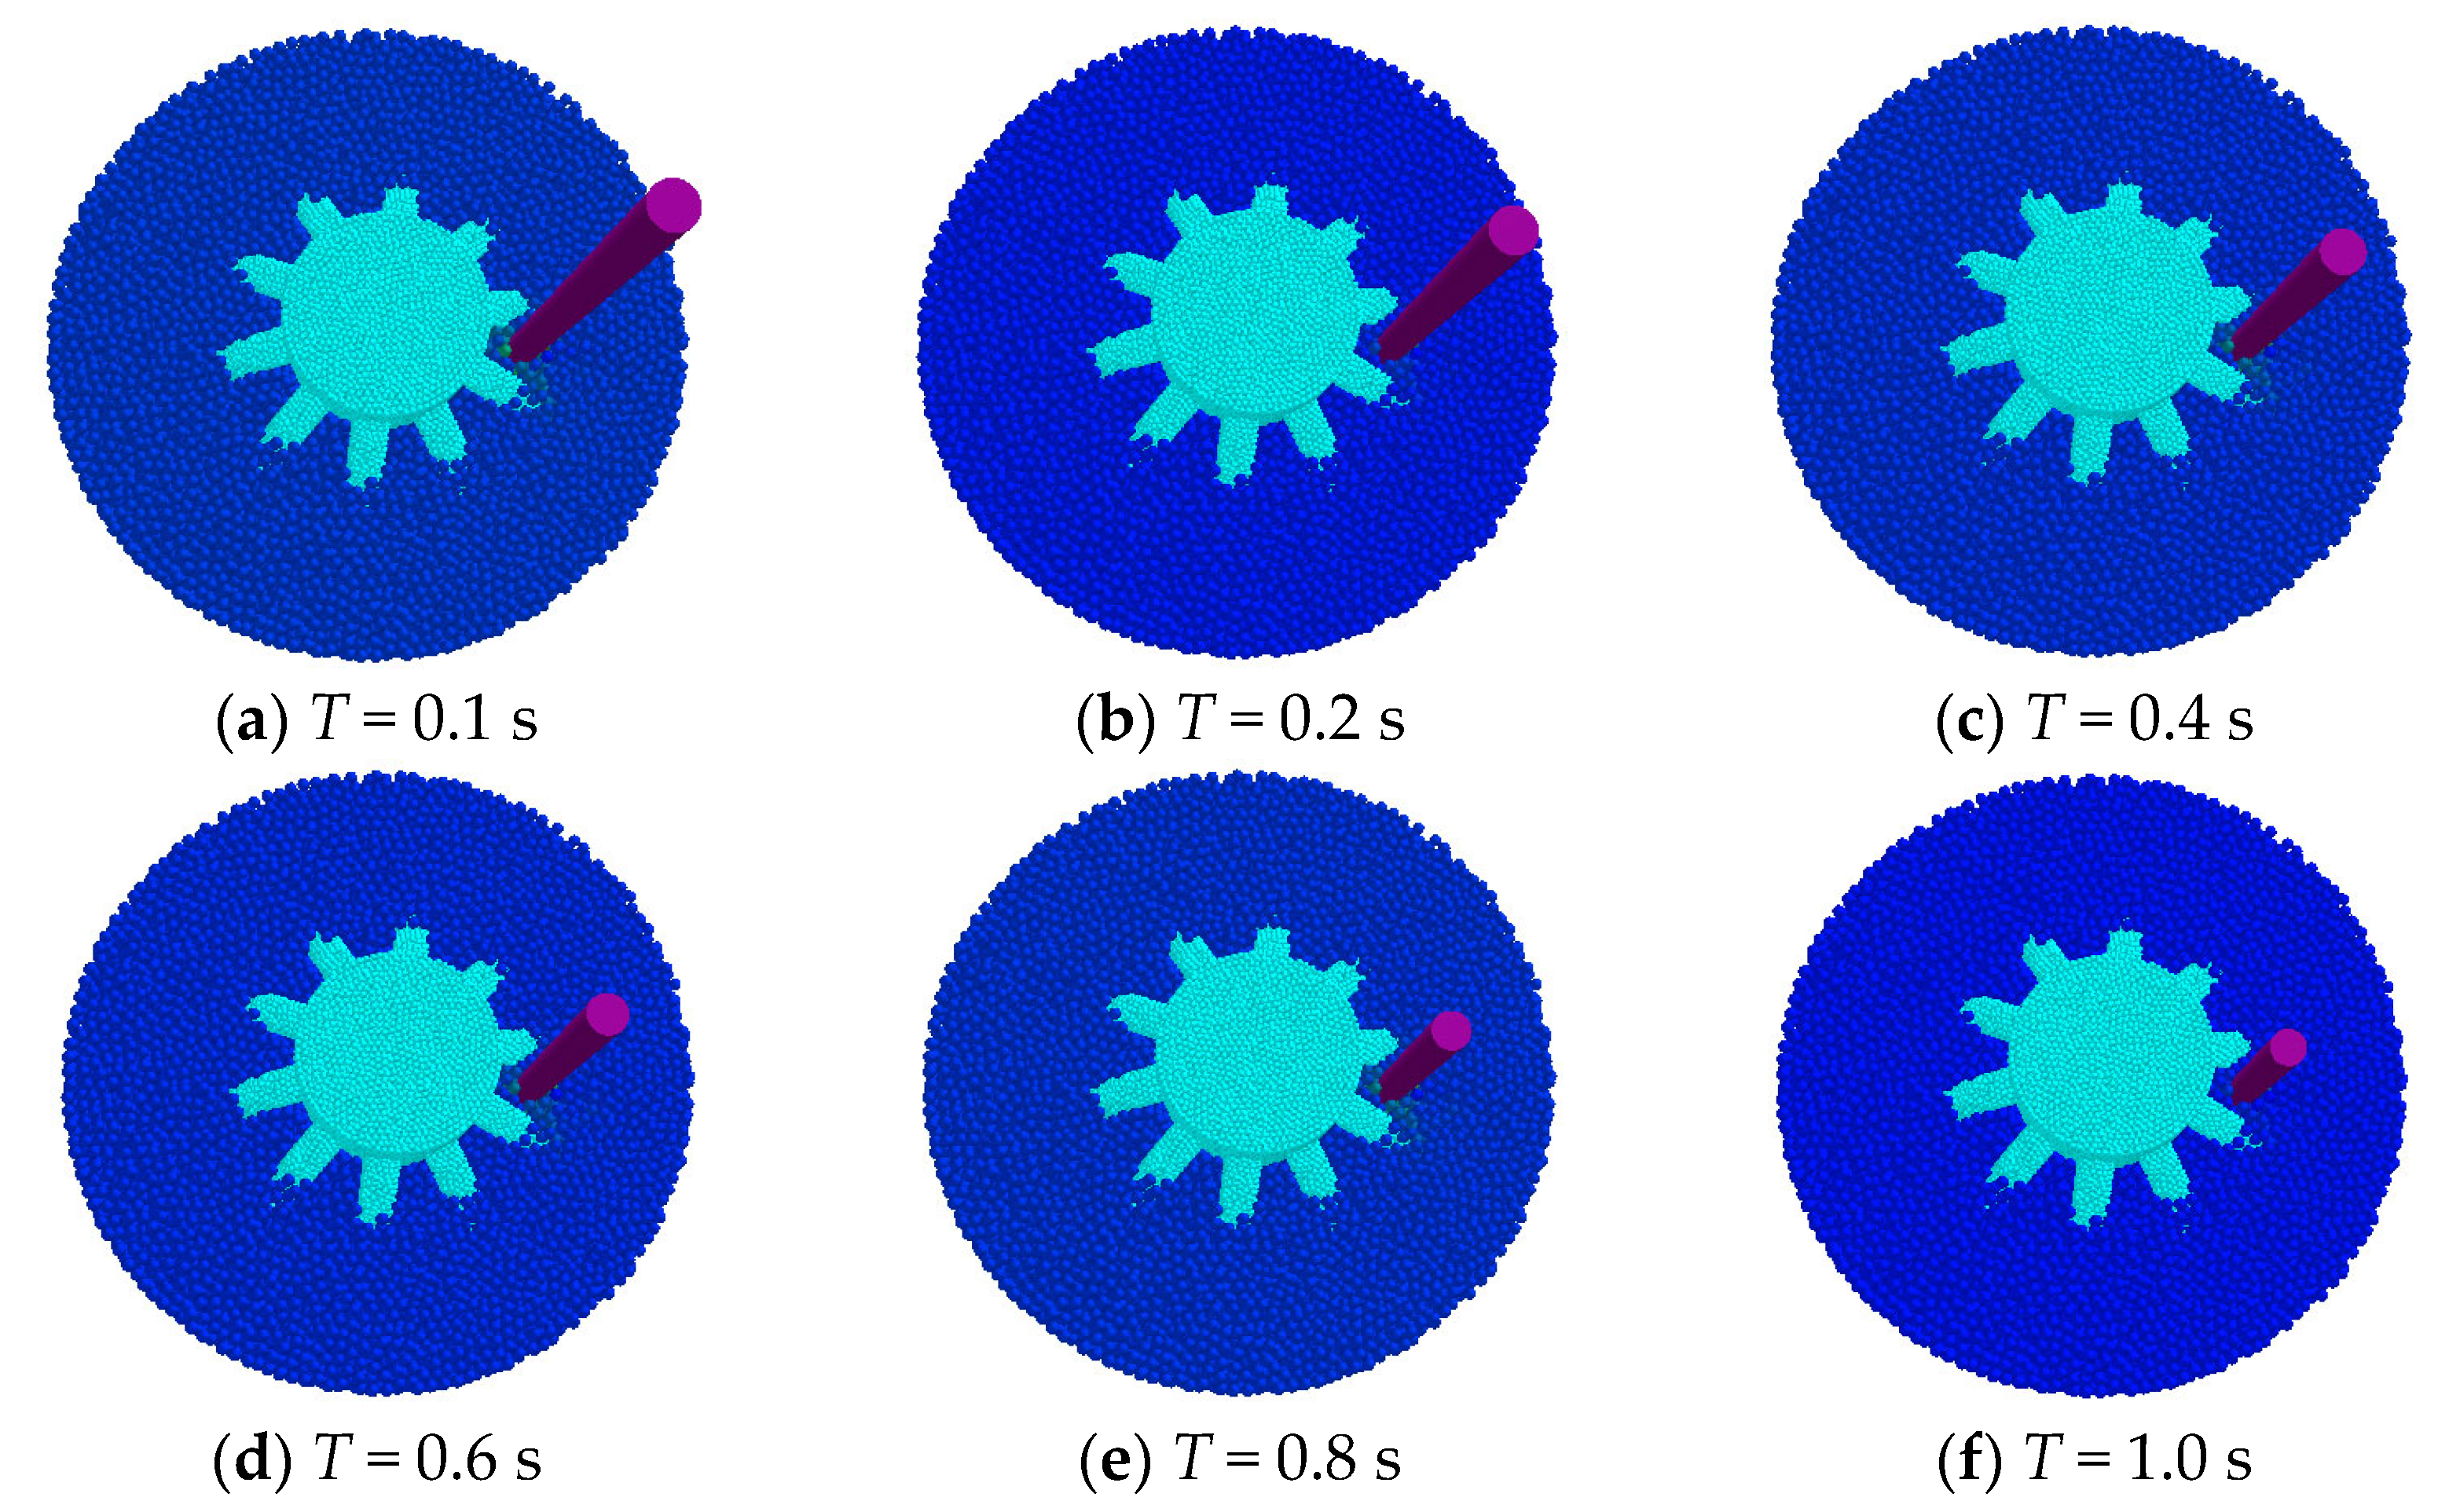
2.5.6. Piercing Simulation Test of the Root Stubble–Soil Composite

Similarly, the discrete element flexible model of the root stubble–soil–residual film composite established in Section 2.3.4 was simplified by ignoring the residual film parameters. A piercing simulation test of the root stubble–soil composite discrete element flexible model was conducted to verify its reliability [41]. In EDEM software, a geometric model of a steel needle was established with a diameter of 6 mm, chamfered at the lower end to form a 60° pointed tip, and brought into contact with the soil particles. The initial downward vertical movement speed of the steel needle was set to 0.1 m/s, using the particles–particles bonding V2 model and the Euler time integrator [42,43]. The simulation time step was set to 20% of the Rayleigh time, with a time step of 1.39 × 10⁻⁶, data saving interval of 0.01 s, and a total simulation time of 1 s. During the simulation, the root stubble–soil composite discrete element flexible model remained stationary, and the steel needle piercing tests were conducted at depths of 50 mm and 100 mm. The simulation was stopped when the steel needle reached the specified depth, and the test data were exported. The simulation process is shown in Figure 14.

3. Results

3.1. Comparison and Verification of Shear Test Results

We exported the maximum shear force data from the EDEM software post-processing interface for the flexible model shear test of the root stubble–soil composite, as well as the angular velocity and velocity contour plots of particles during the shearing process. We compared and analyzed these results with the actual shear test results from Section 2.4.4 [44]. The simulation process is shown in Figure 15. After the simulation, the deformation of the soil and root stubble monoliths, as well as the shear force variation curve of the soil–root stubble composite, were as shown in Figure 16. The velocity and angular velocity contour plots of the soil–root stubble composite particles are shown in Figure 17 and Figure 18, respectively.
Based on the figures above, during the 0–2 s interval of the shear process of the flexible discrete element model of the root stubble–soil composite, soil particles were subjected to compression forces from the movement of the walls. The compression force was transmitted from the shear box walls to the center of the root stubble–soil composite, eventually forming layers at the shear depth along the horizontal plane and decreasing upwards and downwards from this plane. The side of the upper shear box that was under pressure experienced a higher compression force than the opposite side, with the compression force decreasing from the top of the shear box downwards [45]. Similarly, the side of the lower shear box under pressure had a higher compression force than the opposite side, with the force decreasing from the bottom of the shear box upwards [46]. From Figure 16, it can be observed that the maximum shear force during the 50 mm depth shear process of the flexible discrete element model of the root stubble–soil composite was 529.67 N, while in the actual shear test, the maximum shear force was 495.78 N. The difference in maximum shear force was due to the influence of soil voids and moisture content, but the overall shear trend was consistent, aligning with actual conditions. Figure 17 and Figure 18 indicate that the maximum instantaneous angular velocity of the soil particles was 8.73 × 10⁴ rad/s, and the maximum velocity was 64.7 m/s. This shows that during the shear process, the angular velocity and velocity of the soil particles changed dramatically, causing the particles to not only move but also rotate. This movement led to interactions with other contacting particles, transitioning the particle motion from a balanced state to an unbalanced state and back to a balanced state, resulting in changes in the distribution of compression forces among the particles [47].
The comparison between the shear force change curve of the soft discrete element model of the stubble–soil complex simulated by software and the actual shear test shows (Figure 19) that the average maximum shear forces of the stubble–soil complex shear test at different depths of 30 mm, 50 mm, and 100 mm were 669.54 N, 529.67 N, and 293.53 N, respectively. The maximum shear forces of the stubble–soil complex with different depths of 30 mm, 50 mm, and 100 mm were 637.14 N, 495.78 N, and 274.35 N in the flexible discrete element model. The difference values accounted for 4.8%, 6.4%, and 6.5%, respectively. It was found that the EDEM simulation data had little difference from the actual test, and the particle movement trend was consistent with the actual situation, indicating that the stubble–soil discrete element flexible model could represent the field model.

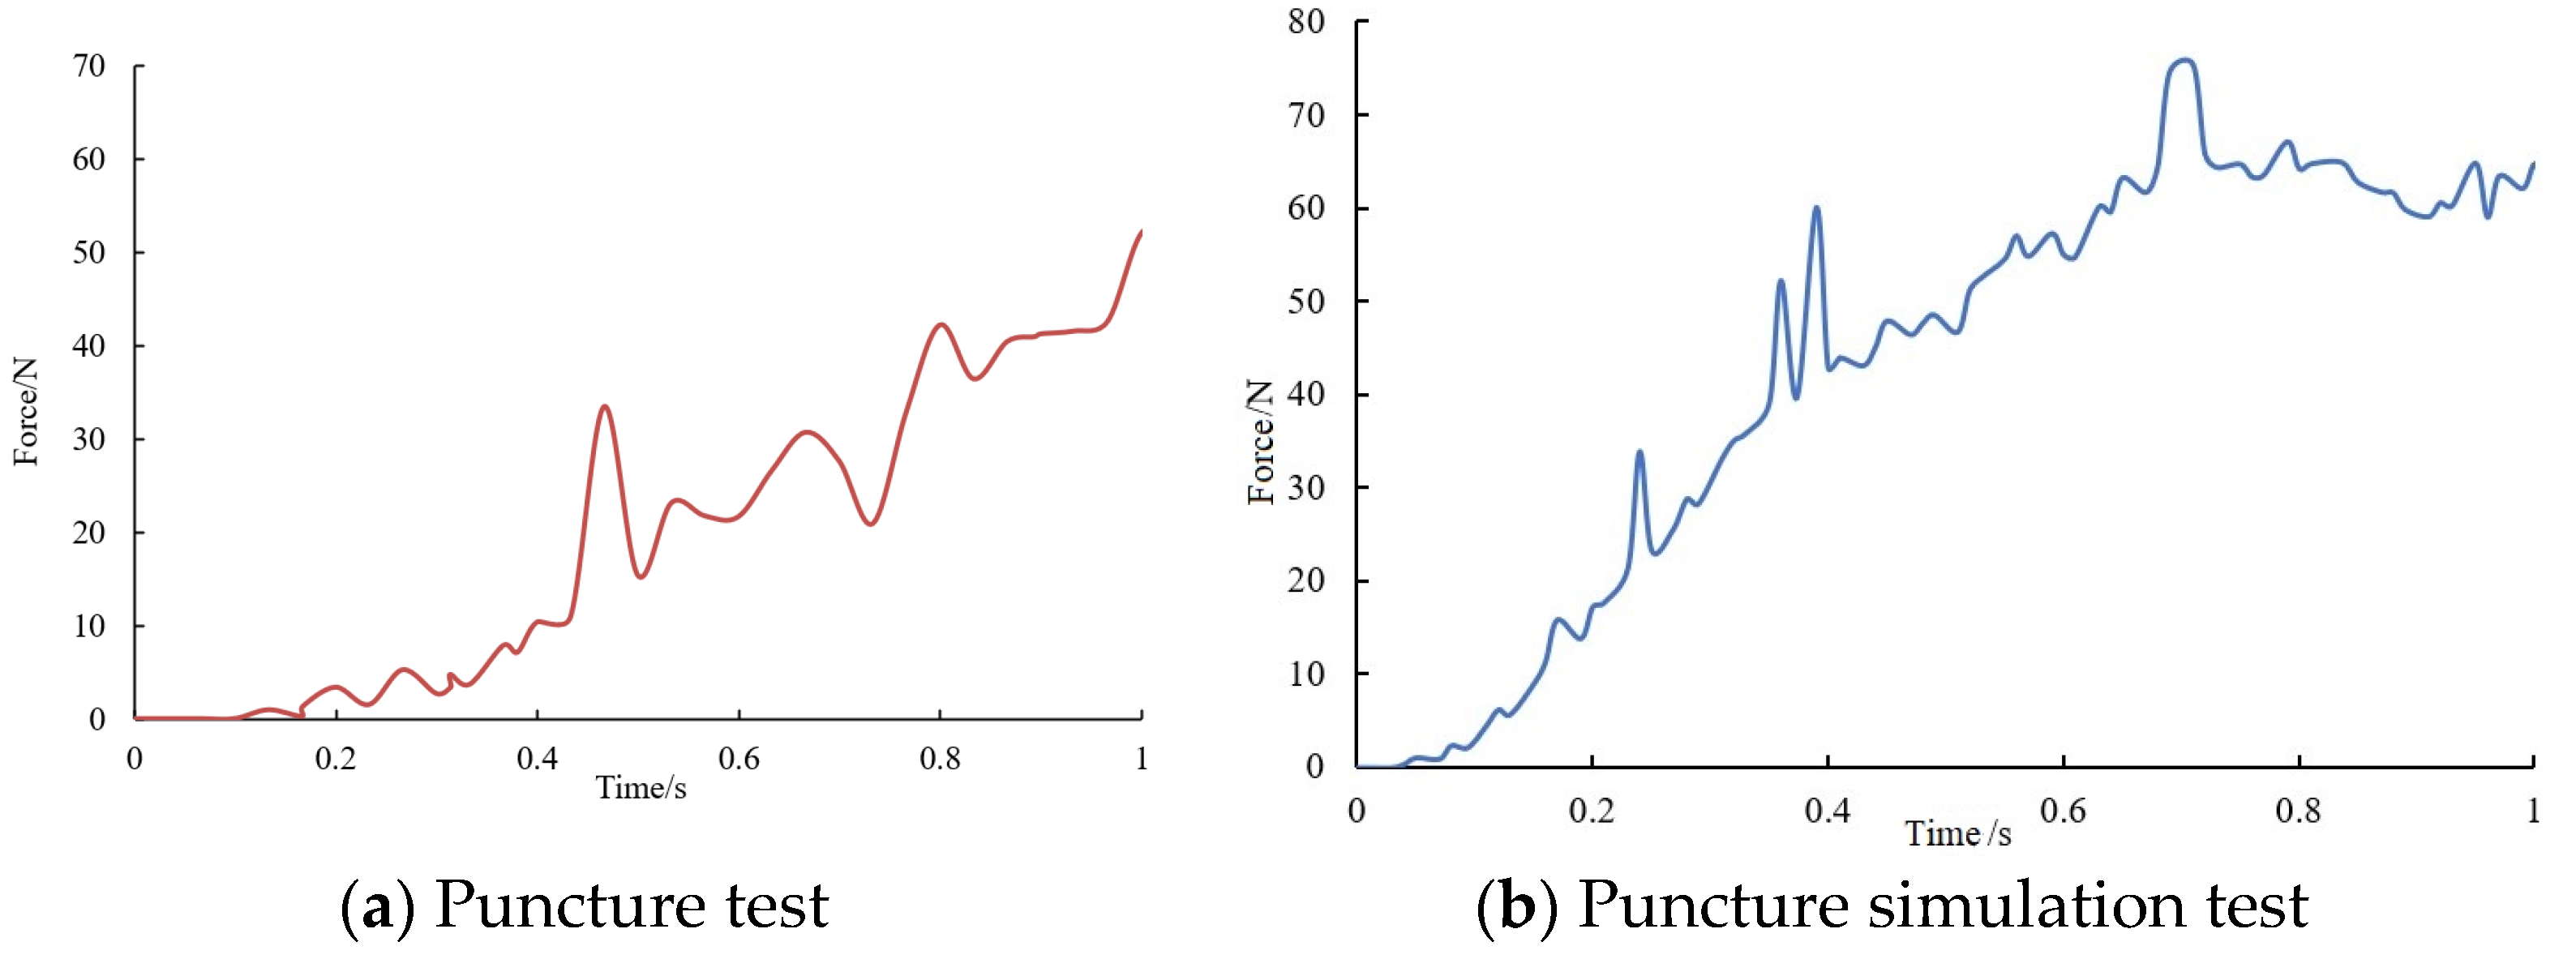
3.2. Analysis and Validation of Puncture Test Results

The maximum load data from the puncture test of the flexible discrete element model of the root stubble–soil complex was exported from the post-processing interface of EDEM software. The angular velocity and velocity contour maps of particles during the puncture process were also exported and compared with the puncture test results in Section 2.5.4. The simulation process is shown in Figure 20.
As shown in Figure 20, during the puncture process of the flexible discrete element model of the root stubble–soil complex, soil particles are subjected to the force exerted by the motion of the steel needle. This force is transmitted from the puncture point to the center of the root stubble–soil complex. Initially, when the tip of the steel needle contacts the particles, the particles experience the maximum impact, with stress highly concentrated, making it easy for the particles to instantaneously release stress and cause model failure. However, subsequent puncture processes show that the particles do not instantaneously release stress leading to model failure but instead transmit stress through contact surfaces and transfer energy to other particles, thereby dissipating the stress exerted by the needle tip [47].
In the post-processing module of EDEM software, the loading force change curve of the steel needle in the puncture test of the flexible discrete element model of the stubble–soil complex was derived and compared with that of the puncture test of the stubble–soil complex. The loading force change curve of the stubble–soil complex is presented in Figure 21. The maximum vertical loading of the steel needle in the stubble–soil complex puncture tests at different depths of 50 mm and 100 mm were 36.26 and 57.76, respectively. The maximum vertical loadings of the steel needle were 38.59 N and 64.93 N in the flexible discrete element model of the stubble–soil complex at different depths of 50 mm and 100 mm, and the difference ratios were −6.4% and −12.37%, respectively. To reduce the computer simulation load during the modeling of the stubble–soil complex, there exists multiple differences between the soil particle diameter and the real soil particle diameter, which increases the porosity of soil particles in the complex. The simulated value is different from the actual value, but the difference is small, indicating that the stubble–soil discrete element flexible model can represent the field model.

4. Discussion

This study explored the mechanical properties of maize root stubble–soil complexes at different depths in the Hexi Corridor through shear and puncture tests, as well as discrete element simulations using EDEM software. The reliability and accuracy of the simulation models were validated. The shear test results indicated significant differences in the maximum shear force of root stubble–soil complexes at various depths. This is primarily attributed to the greater number of primary and fibrous roots in the topsoil, which results in closer contact between the soil and the roots, leading to higher shear forces. Comparison of simulation results with actual test data showed that the trends in shear force variation were consistent across different depths. The differences in maximum shear force were within a reasonable range, and the movement of soil particles under shear force in the simulation matched the actual test phenomena, confirming the reliability and accuracy of the simulation model. The puncture test results demonstrated that the maximum loading force of the root stubble–soil complex increased with depth. This is because the deeper soil is denser and more compact, resulting in higher loading forces. The stress concentration phenomenon and variation trends caused by the steel needle puncture in the simulation were highly consistent with the actual tests, proving that the simulation model can accurately replicate the mechanical behavior of actual puncture tests.
Overall, the simulation model exhibited high accuracy in simulating both shear and puncture tests. Despite some numerical differences, these were mainly due to discrepancies between the particle diameter in the simulations and the actual soil particles, as well as the effects of soil porosity and moisture content. However, the differences between the simulation data and the actual data were within acceptable limits, and the particle movement trends were highly consistent with the actual situation. This indicates that the established flexible discrete element model can effectively represent the actual field model.

5. Conclusions

To effectively address issues related to maize root stubble management and residual film recovery in the Hexi Corridor, this study designed relevant experiments based on the typical maize planting patterns in the region. It established a discrete element simulation model for the residual film–soil–stubble complex in the Hexi Corridor maize fields and validated the reliability of the simulation model through field experiments. This provides parameter support for the design optimization of key components of China’s mechanized residual film recovery machines. The main conclusions of this study are as follows:
(1)
This study conducted relevant research on the soil in the Hexi Corridor and measured related soil indicators. The results showed that the soil type in the Hexi Corridor is extremely sandy, with soil particles larger than 0.05 mm and particles between 0.05 mm and 0.01 mm accounting for 80.69% and 12.67% of the soil mass, respectively. The average soil moisture contents at depths of 50 mm, 100 mm, and 150 mm were 12.93%, 13.55%, and 14.25%, respectively. The soil density was 2490 kg/m3, and the average soil firmness ranged from 2800 to 3000 kPa.
(2)
This study conducted shear and puncture tests on the residual film, soil, and root stubble of maize stubble in the Hexi Irrigation District. The results of the shear tests indicated that the average maximum shear forces of the stubble–soil complex at different depths of 30 mm, 50 mm, and 100 mm were 669.54 N, 529.67 N, and 293.53 N, respectively. The puncture test results revealed that the maximum vertical loadings of the steel needle in the stubble–soil complex puncture test at different depths of 50 mm and 100 mm were 36.26 N and 57.76 N, respectively.
(3)
This study established a discrete element simulation model of the maize stubble residue film–soil–root complex in the Hexi Irrigation District based on the Bonding-V2 and API rapid filling technology, and simulation tests were conducted. The reliability and accuracy of the simulation model were verified through shear and puncture tests. The results demonstrated that the differences between the simulated maximum shear force and the actual shear tests were 4.8%, 6.4%, and 6.5%. The differences between the simulated puncture tests and the actual puncture tests of two different depth stubble–soil complexes were −6.4% and −12.37%. The small difference between the simulated values and the actual values, along with the consistent particle movement trend with the actual situation, indicates that the discrete element flexible model can represent the field model and can provide a theoretical basis and parameter support for mechanized residual film recycling in China.

Author Contributions

Conceptualization, W.Z. and X.L.; methodology, H.Z. and X.L.; software, R.S.; validation, J.W. and W.S.; formal analysis, G.W.; investigation, H.L.; resources, W.S.; data curation, J.W.; writing—original draft preparation, X.L. and R.S.; writing—review and editing, X.L. and P.L.; visualization, X.L.; supervision, W.Z.; project administration, F.D. All authors have read and agreed to the published version of the manuscript.

Funding

This research was supported by the earmarked fund for Gansu Province Science and Technology Plan Major Special Project (23ZDNA005), the Industrial Support Program of Gansu Provincial Colleges and Universities (2021CYZC-25), and National Key R & D Program sub-project (2023YFD170190302).

Institutional Review Board Statement

Not applicable.

Data Availability Statement

The data presented in this study are available on request from the authors.

Acknowledgments

The authors thank the editor for providing helpful suggestions for improving the quality of this manuscript.

Conflicts of Interest

The authors declare no conflicts of interest.

References

  1. Gao, H.; Liu, Q.; Yan, C.; Mancl, K.; Gong, D.; He, J.; Mei, X. Macro-and/or microplastics as an emerging threat effect crop growth and soil health. Resour. Conserv. Recycl. 2022, 186, 106549. [Google Scholar] [CrossRef]
  2. Gao, H.; Yan, C.; Liu, Q.; Ding, W.; Chen, B.; Li, Z. Effects of plastic mulching and plastic residue on agricultural production: A meta-analysis. Sci. Total Environ. 2019, 651, 484–492. [Google Scholar] [CrossRef]
  3. Hann, S.; Fletcher, E.; Sherrington, C.; Molteno, S.; Elliott, L. Conventional and biodegradable plastics in agriculture. Rep. DG Environ. Eur. Comm. 2021. [Google Scholar]
  4. Yan, C.R.; Liu, E.K.; Shu, F.; Liu, Q.; Liu, S.; He, W.Q. Review of agricultural plastic mulching and its residual pollution and prevention measures in China. J. Agric. Res. Environ. 2014, 31, 95–102. [Google Scholar]
  5. Thidar, M.; Gong, D.; Mei, X.; Gao, L.; Li, H.; Hao, W.; Gu, F. Mulching improved soil water, root distribution and yield of maize in the Loess Plateau of Northwest China. Agric. Water Manag. 2020, 241, 106340. [Google Scholar] [CrossRef]
  6. Zhang, J.; Ren, S.; Xu, W.; Liang, C.; Li, J.; Zhang, H.; Wang, K. Effects of plastic residues and microplastics on soil ecosystems: A global meta-analysis. J. Hazard. Mater. 2022, 435, 129065. [Google Scholar] [CrossRef] [PubMed]
  7. Kou, J.L.; Wang, J.K.; Wang, L.; Zhao, Y.M. Integrating clamping finger-chain residual film recycling and straw crushing return to cotton field. Trans. Chin. Soc. Agric. Eng. 2023, 39, 14–22. [Google Scholar]
  8. Guo, J.X.; Liu, Y.C.; Wei, Y.J.; Zhou, J.; Shi, Y. Vibration characteristics analysis of the optimal structure of integrated straw returning and residual film recycling machine. Trans. Chin. Soc. Agric. Eng. 2024, 40, 155–163. [Google Scholar]
  9. Jin, W.; Zhang, X.J.; Ding, Y.C.; Bai, S.H.; Liu, W.P.; Zhou, X.C. Experiment on Suspension Separation of Residual Film and Impurity Based on EDEM Fluent Coupling. Trans. Chin. Soc. Agric. Mach. 2022, 53, 89–98. [Google Scholar]
  10. You, Y.; Wang, D.C.; Wang, G.H. 9QP-830 Soil-gashing and Root-cutting Mechanism. Trans. Chin. Soc. Agric. Mach. 2011, 42, 61–67. [Google Scholar]
  11. Shen, S.L.; Zhang, J.X.; Jiang, Y.X.; Wang, Y.C.; Liu, X.F.; Li, J.M.; Dong, W.H. Research on Tensile Properties of Residual Film in the Tillage Layer Based on Discrete Element Method. Trans. Chin. Soc. Agric. Mach. 2024, 55, 132–141. [Google Scholar]
  12. Zhang, X.L.; Zhao, Y.Y.; Zhang, X.T.; Shi, X.P.; Shi, X.Y.; Li, F.M. Re-used mulching of plastic film is more profitable and environmentally friendly than new mulching. Soil Tillage Res. 2022, 216, 105256. [Google Scholar] [CrossRef]
  13. Su, S.L.; Singh, D.N.; Baghini, M.S. A critical review of soil moisture measurement. Measurement 2014, 54, 92–105. [Google Scholar] [CrossRef]
  14. Li, C.K.; Zhao, D.W.; Lu, X.C. Numerical investigation of terminal residual thickness of the water film and surface flow in the entrainment region in Marangoni drying. Dry. Technol. 2020, 38, 869–878. [Google Scholar] [CrossRef]
  15. Liu, X.L.; Zhao, W.Y.; Zhang, H.; Wang, G.P.; Sun, W.; Dai, F. Design and experiment of an upper-side-discharge straw-returning and bundle self-unloading integrated corn residual film recycling machine. Int. J. Agric. Biol. Eng. 2023, 16, 61–70. [Google Scholar] [CrossRef]
  16. Zhang, Y.; Barrouillet, B.; Skadsem, H.J. Experimental investigation of laminar and turbulent displacement of residual oil film. Sci. Rep. 2023, 13, 21120. [Google Scholar] [CrossRef] [PubMed]
  17. Zhang, Y.J.; Liu, X.F.; Zhang, Q.; Wang, L.G.; Hao, G.L. Influence of Different Herbaceous Roots on Soil Permeability. Res. Soil Water Conserv. 2024, 31, 145–152. [Google Scholar]
  18. Zheng, L.; Luo, X.W.; Zeng, S.; Wang, Z.M.; Liu, C.B.; Qi, X.Y. Shear Characteristics of Rice Root-Soil Composite. Trans. Chin. Soc. Agric. Mach. 2017, 48, 63–71. [Google Scholar]
  19. Xu, S.X.; Zhang, Q.W.; Li, W.L.; Chen, W.J.; Chen, Z.Y.; Zhao, C.L. Comparative Analysis of Soil Shear Strength Measured by Strain-Controlled Direct Shear Apparatus and Micro-Vane Shear Apparatus. Res. Soil Water Conserv. 2024, 31, 205–213. [Google Scholar]
  20. Gao, Z.; Lu, C.Y.; Wei, X.Y.; Li, H.W.; He, J.; Wang, Q.J. Design and Experiment of Co-stirring Combined Corn Strip Straw Cleaning Device. Trans. Chin. Soc. Agric. Mach. 2023, 54, 68–79. [Google Scholar]
  21. Zhou, H.; Che, H.L.; Geng, D.Y.; Chen, M.Z.; Zhang, Y.P. Discrete Element Modeling and Parameter Calibration of Typical Soil in Maize Field Tillage Layer. Trans. Chin. Soc. Agric. Mach. 2023, 54, 49–60, 113. [Google Scholar]
  22. Geng, Y.L. Research on the Design of Press Devices and Control of Compaction Pressure for Small and Medium-Sized Corn No-Till Planter. Master’s Thesis, Shandong University of Technology, Zibo, China, 2023. [Google Scholar]
  23. Li, L.B. Design of the Fertilizing and Subsoiling Cultivator for Conservation Tillage. Master’s Thesis, Shenyang Agricultural University, Shenyang, China, 2023. [Google Scholar]
  24. Chen, P.P.; Gu, X.B.; Li, Y.N.; Qiao, L.; Li, Y.; Fang, H.; Zhou, C. Effects of residual film on maize root distribution, yield and water use efficiency in Northwest China. Agric. Water Manag. 2022, 260, 107289. [Google Scholar] [CrossRef]
  25. Shi, Z.; Zhang, X.; Yan, J.; Jiang, Y.; Yao, J. Experiment and Analysis of Film-Soil Separation Motion Characteristics of a Chain Drive Residual Film Recovery Mechanism for the Tillage Layer. Appl. Sci. 2022, 12, 5884. [Google Scholar] [CrossRef]
  26. Li, J.G.; He, P.R.; Chen, J.; He, Y.F.; Zhong, L.E.; Sun, H. The Effects of Irrigation Water Salinity on Maize Emergence, Yield, Quality and Soil Salt Dynamics. Water-Sav. Irrig. Technol. 2024, 4, 1–10. [Google Scholar]
  27. Zhang, Z.G.; Xu, H.W.; Xue, H.T.; Ni, C.; Wang, C. Calibration and Experiment of Discrete Element Parameters of Panax notoginseng Stem. Trans. Chin. Soc. Agric. Mach. 2023, 54, 61–70, 91. [Google Scholar]
  28. Zhao, Z. Cutter-Straw Interaction Mechanism of the Longitudinal Chopping Device for the Corn Harvester and a Study of the Bionic. Ph.D. Thesis, Shenyang Agricultural University, Shenyang, China, 2023. [Google Scholar]
  29. Chen, J.Z.; Shi, R.J.; Dai, F.; Zhao, W.Y.; Zhao, Y.M.; Xin, S.L. Simulation and Experiment on Interaction Process between Seed Corn and Corn Husking Mechanism. Trans. Chin. Soc. Agric. Mach. 2024, 55, 91–100. [Google Scholar]
  30. Zhao, S.H.; Liu, H.P.; Hou, L.T.; Zhang, X.; Yuan, Y.W.; Yang, Y.Q. Development of deep fertilizing no-tillage segmented maize sowing opener using discrete element method. Trans. Chin. Soc. Agric. Eng. 2021, 37, 1–10. [Google Scholar]
  31. Zhao, S.H.; Gao, L.L.; Yuan, Y.W.; Hou, L.T.; Zhang, X.; Yang, Y.Q. Maize straw motion law in subsoiling operation using discrete element method. Trans. Chin. Soc. Agric. Eng. 2021, 37, 53–62. [Google Scholar]
  32. Zhang, S.; Zhao, H.; Wang, X.; Dong, J.; Zhao, P.; Yang, F.; Huang, Y. Discrete element modeling and shear properties of the maize stubble-soil complex. Comput. Electron. Agric. 2023, 204, 107519. [Google Scholar] [CrossRef]
  33. Shi, L.; Zhao, W.; Hua, C.; Rao, G.; Guo, J.; Wang, Z. Study on the intercropping mechanism and seeding improvement of the cavity planter with vertical insertion using DEM-MBD coupling method. Agriculture 2022, 12, 1567. [Google Scholar] [CrossRef]
  34. Zhang, S.; Tekeste, M.Z.; Li, Y.; Gaul, A.; Zhu, D.; Liao, J. Scaled-up rice grain modelling for DEM calibration and the validation of hopper flow. Biosyst. Eng. 2020, 194, 196–212. [Google Scholar] [CrossRef]
  35. Xie, J.H. Study on Pick-up and Unloading Device for Residual Plastic Film of Bed Planting. Ph.D. Thesis, China Agricultural University, Beijing, China, 2014. [Google Scholar]
  36. Shi, R.J.; Zhao, W.Y.; Dai, F.; Song, X.F.; Zhao, Y.M.; Wang, F. Simulation of Interaction between Air Flow Field and Soil Seedbed Covering on Whole Plastic Film Mulching on Double Ridges. Trans. Chin. Soc. Agric. Mach. 2022, 53, 40–51. [Google Scholar]
  37. Wang, X.B. Design and Experimental Study of Biomimetic Deep Loose Shovel Based on Discrete Element Method. Master’s Thesis, Sichuan Agricultural University, Chengdu, China, 2023. [Google Scholar]
  38. Yang, F.F. Study on the Interaction Mechanism of Straw and Stubble Covered Soil-Winged Subsoiler Based on Discrete Element Method. Master’s Thesis, Northwest A&F University, Yangling, China, 2023. [Google Scholar]
  39. Hao, Z.H.; Zheng, E.L.; Li, X.; Yao, H.P.; Wang, X.C.; Qian, S.Y.; Li, W.X.; Zhu, M. Performance analysis of the soil-contacting parts for no-tillage planters and optimization of blade structure. Trans. Chin. Soc. Agric. Eng. 2023, 39, 1–13. [Google Scholar]
  40. Wang, Z.T. Design and Experiment of Soil Mechanical and Physical Properties and Micro-geomorphic Measuring Device. Master’s Thesis, Huazhong Agricultural University, Wuhan, China, 2022. [Google Scholar]
  41. Liang, R.; Zhang, L.; Jia, R.; Meng, H.; Kan, Z.; Zhang, B.; Li, Y. Study on friction characteristics between cotton stalk-residual film-external contact materials. Ind. Crops Prod. 2024, 209, 118022. [Google Scholar] [CrossRef]
  42. Yang, S.; Chen, X.; Yan, L.; Jiang, D. Performance of Three Different Spades for Residual Plastic Film Recycling Machine. Appl. Eng. Agric. 2020, 36, 187–195. [Google Scholar] [CrossRef]
  43. Lin, J.; Lv, Z.Y.; Li, H.Z.; Wang, X.Y.; Wang, D.R. Design and Experiment of Passive Anti-winding Stubble Breaking and Ridge Cleaning Device for No-tillage Planter. Trans. Chin. Soc. Agric. Mach. 2023, 54, 19–27, 37. [Google Scholar]
  44. Zhang, Z.; Li, J.; Wang, X.; Zhao, Y.; Xue, S.; Su, Z. Parameters optimization and test of an arc-shaped nail-tooth roller-type recovery machine for sowing layer residual film. Agriculture 2022, 12, 660. [Google Scholar] [CrossRef]
  45. Zhang, H.N. Effects of the Biological Soil Crusts Growth on Soil Detachment Process. Master’s Thesis, Northwest A&F University, Yangling, China, 2022. [Google Scholar]
  46. Shi, L.R. Research on the Intercropping Mechanism of Maize Hole Seeding with Vertical Insertion in the Dry Northwest. Ph.D. Thesis, Gansu Agricultural University, Lanzhou, China, 2022. [Google Scholar]
  47. Yuan, X.M.; Li, X.H.; Jiao, H.T.; Zhou, S.L.; Zhang, J.J.; Wu, H.Y. Design and Experiment of Straw Chopping Centralized Full Depth and Returning Machine. Trans. Chin. Soc. Agric. Mach. 2023, 54 (Suppl. S1), 27–35. [Google Scholar]
Figure 1. Typical planting pattern of maize in Hexi Irrigation District.
Agriculture 14 01542 g001
Figure 2. Termination of soil sample properties.
Agriculture 14 01542 g002
Figure 4. Ring knife sampling and soil particle density determination.
Agriculture 14 01542 g004
Figure 5. Measurement and distribution of soil compaction in the Hexi Irrigation District. (a) Measurement of soil compaction in the Hexi Irrigation District. (b) Distribution pattern of soil compaction in the Hexi Irrigation District. In the figure, A is the soil firmness test area near the stubble, B is the soil firmness test area in the middle of two adjacent stubble, and C is the soil firmness test area near the stubble.
Agriculture 14 01542 g005
Figure 7. Soil shear test device. 1. Frame; 2. Speed control circuit module; 3. Control circuit board; 4. Stepper motor; 5. Lower shear box; 6. Upper shear box; 7. Tension pressure sensor; 8. Leveling device; 9. Handheld instrument; 10. Computer; 11. Weight; 12. Scale plate.
Agriculture 14 01542 g007
Figure 8. Piercing test apparatus for root stubble–soil composite. 1. Metal bucket; 2. Soil; 3. Maize root stubble; 4. Instrument; 5. Steel needle; 6. Steel ruler.
Agriculture 14 01542 g008
Figure 10. Soil three-dimensional model and discrete element model. 1. Soil; 2. Space occupied by maize root stubble. Note: L4 is the soil model length, mm; W1 is the width of soil model, mm; H1 is the height of soil model, mm. B is the local enlarged map of soil discrete element model.
Agriculture 14 01542 g010
Figure 11. Three-dimensional model and the discrete element model of the residual film. 1. Residual film 2. Space occupied by maize root stubble. Note: L5 is the residual film model length, mm; W2 is the residual film model width, mm. C is the local enlarged image of discrete element model of residual film.
Agriculture 14 01542 g011
Figure 12. Discrete element model of the root stubble–soil–residual film-mulch lifting and pressing shovel. 1. Mulch lifting and pressing shovel; 2. Maize stubble; 3. Residual film; 4. Soil.
Agriculture 14 01542 g012
Figure 13. Discrete element shear simulation model of the root stubble–soil composite at different depths. 1. Lower shear box; 2. Upper shear box; 3. Root stubble; 4. Pressure plate; 5. Soil.
Agriculture 14 01542 g013
Figure 14. Discrete element piercing simulation model of the root stubble–soil composite. 1. Soil; 2. Maize root stubble; 3. Steel needle.
Agriculture 14 01542 g014
Figure 15. Simulation process of the 50 mm depth shear test for the root stubble–soil composite.
Agriculture 14 01542 g015
Figure 16. Changes of root stubble, soil, and stress after 50 mm depth shear simulation of the root stubble–soil complex.
Agriculture 14 01542 g016
Figure 17. Velocity contour plot of particles during the 50 mm depth shear simulation test for the root stubble–soil composite.
Agriculture 14 01542 g017
Figure 18. Angular velocity contour plot of particles during the 50 mm depth shear simulation test for the root stubble–soil composite.
Agriculture 14 01542 g018
Figure 19. Horizontal shear force variation curves for the root stubble–soil complex at different depths.
Agriculture 14 01542 g019
Figure 20. Simulation process of 100 mm depth puncture test for the root stubble–soil complex.
Agriculture 14 01542 g020
Figure 21. Loading force variation curves for the root stubble–soil complex at 50 mm depth.
Agriculture 14 01542 g021
Table 1. Soil texture classification and determination of sample properties in China.
Sampling LocationSample NumberSize Composition
Grains of Sand
(1–0.05 mm)/g
Coarse Dust
(0.05–0.01 mm)/g
Fine (<0.001 mm)/g
Soil samples in Hexi Irrigation DistrictSample 1168.6427.590
Sample 2165.3828.60
Sample 3167.8526.90
Average
value
167.2927.590
Percentage80.69%12.67%0
Table 3. Measurement results of soil particle density (g/cm3).
Soil TypesCenter Distance/mmSample 1Sample 2Sample 3Average Value
Sandy soil01.671.751.691.70
502.362.622.492.49
1002.462.582.362.47
1502.422.582.532.51
Table 4. Results of the shear test on the root stubble–soil composite.
Serial NumberDepth/mmMaximum Shear Force/NAverage Value/N
130668.9665.16
230652.5
330678.3
430628.6
530697.5
650516.7523.94
750502.3
850499.6
950559.7
1050541.4
11100380.6376.76
12100359.9
13100395.6
14100345.1
15100402.6
Table 5. Results of the stubble–soil complex puncture test.
Serial NumberDepth/mmMaximum Loading Force/NAverage Value/N
15036.6936.26
25032.36
35035.67
45032.54
55044.05
610058.2157.76
710059.36
810057.39
910059.79
1010054.04
Table 7. Parameters of the soil discrete element model.
ParameterNumerical Value
Poisson’s ratio0.3
Density/(kg/m3)2490
Shear modulus/Pa5 × 107
Bonding radius/mm2.8
Recovery coefficientReferences [32,33,34,35]
Static friction coefficientReferences [32,33,34,35]
Coefficient of kinetic frictionReferences [32,33,34,35]
Normal stiffness/(N/m3)References [32,33,34,35]
Tangential stiffness/(N/m3)References [32,33,34,35]
Normal critical stress/PaReferences [32,33,34,35]
Tangential critical stress/PaReferences [32,33,34,35]
Soil–stubble recovery coefficientReferences [32,33,34,35]
Soil–stubble static friction coefficientReferences [32,33,34,35]
Soil–stubble dynamic friction coefficientReferences [32,33,34,35]
Table 8. Parameters of the discrete element model for the residual film.
ParameterNumerical Value
Poisson’s ratio0.5
Density/(kg/m3)950
Shear modulus/Pa6.65 × 107
Recovery coefficientReferences [36,37]
Static friction coefficientReferences [36,37]
Coefficient of kinetic frictionReferences [36,37]
Normal stiffness/(N/m3)3 × 107
Tangential stiffness/(N/m3)3 × 107
Normal critical stress/Pa6 × 106
Tangential critical stress/Pa6 × 106
Bonding radius/mm1.95
Residual film–stubble recovery coefficient0.3
Residual film–stubble static friction coefficient0.2
Residual film–stubble dynamic friction coefficient0.12
Residual film–soil recovery coefficientReferences [36,37]
Residual film–soil static friction coefficientReferences [36,37]
Residual film–soil dynamic friction coefficientReferences [36,37]
Disclaimer/Publisher’s Note: The statements, opinions and data contained in all publications are solely those of the individual author(s) and contributor(s) and not of MDPI and/or the editor(s). MDPI and/or the editor(s) disclaim responsibility for any injury to people or property resulting from any ideas, methods, instructions or products referred to in the content.

