Article

Combined Transcriptome and Metabolome Analysis of Alfalfa Responses to Aphid Infestation

1
College of Grassland Science, Qingdao Agricultural University, Qingdao 266109, China
2
Key Laboratory of National Forestry and Grassland Administration on Grassland Resources and Ecology in the Yellow River Delta, Qingdao 266109, China
*
Author to whom correspondence should be addressed.
These authors contributed equally to this work.
Agriculture 2024, 14(9), 1545; https://doi.org/10.3390/agriculture14091545
Submission received: 27 June 2024 / Revised: 9 August 2024 / Accepted: 23 August 2024 / Published: 6 September 2024
(This article belongs to the Section Crop Genetics, Genomics and Breeding)

Abstract

:
Alfalfa (Medicago sativa L.) is an economically important forage legume. As a result of the extensive and intensive cultivation of alfalfa planting and the gradual expansion of planting areas, pest occurrence has increased in frequency. Aphids are one of the main pests that threaten the growth and productivity of alfalfa. After an aphid outbreak, alfalfa yield and quality are commonly greatly reduced. At present, there are few studies on alfalfa plants infested with aphids, so it is imperative to study the regulatory mechanisms of aphid infestation tolerance in alfalfa. In this study, alfalfa plants from the variety “Wudi” were investigated, and pea aphids were selected for inoculation. The transcriptome and metabolome data were analyzed at three time points (0 d, 1 d, and 4 d), revealing 3458 differentially expressed genes and 358 differential metabolites. Trend analysis of DEGs and DAMs revealed that the former were significantly enriched in three distinct trends, whereas the latter were significantly enriched in only one. Moreover, 117 important hub genes associated with alfalfa response to aphid infestation were screened by WGCNA. By mapping DEGs and DAMs to KEGG pathways, it was found that the “phenylpropanoid biosynthesis”, “flavonoid biosynthesis”, and “isoflavonoid biosynthesis” pathways play an important role in alfalfa responses to aphid infestation. These results further elucidate the regulatory mechanism of alfalfa in response to aphid infestation and provide valuable information for breeding new aphid-resistant plant varieties.

1. Introduction

With the continuous expansion of planting areas for forage crop cultivation, various problems have emerged. At present, primary challenges associated with cultivation of forage grasses are abiotic stresses such as salinity, cold, and drought [1,2,3,4] and biotic stresses such as weeds, pests, and diseases [5,6,7]. Regarding biotic stressors, insect pests are one of the most severe stresses, which do not only cause direct damage to plants but also transmit diseases. Aphids are major pests infesting forage crops [8]. Aphid infestation is mainly concentrated on stems and leaves, primarily young stems and leaves on the upper part of plants. Aphids prefer young tissues as they contain more nutrients, and it is easier for them to penetrate with their mouthparts to extract sap. Aphids cause both direct and indirect damage [9]. Direct damages occur when aphids use piercing–sucking mouthparts to suck the juice of plants from the phloem, which will seriously deplete the nutrients and water of plants and also cause damage to plant tissues, resulting in curling, atrophy, yellowing, and even death of plant leaves [10]. Aphids secrete honeydew with a high sugar concentration while ingesting plant juice, which adheres to leaves and stems and hinders plants’ respiration and photosynthesis [11]. Indirect damages occur due to aphids being the primary vector of many plant virus diseases [12]. While extracting plant sap, they inadvertently ingest viruses into their body and spread them to healthy plants during feeding [13]. This mode of transmission results in rapid virus disease spread in plants, causing major crop losses over large areas [14]. The most common viral diseases transmitted by aphids are potato leafroll virus disease, tobacco mosaic virus disease, and others [15,16]. These viral diseases can seriously affect the growth and yield of crops. Therefore, the indirect damage caused by aphids is much greater than the direct damage [17]. The reason why aphids are so destructive is partly because they have a high reproductive capacity, which is achieved through parthenogenesis. Theoretically, aphids can produce 600 billion offspring in a season [18,19]. Currently, the control and management of aphids mainly depends on the frequent use of insecticides in the field. The reproduction pattern of aphids leads to their resistance to various insecticides, which increases the cost and difficulty of aphid control [20].
In their long-term evolution, plants have developed defense mechanisms against herbivorous insects that are classified as either constitutive or induced defenses [21]. Constitutive defenses correspond to the ability of plants to hinder the feeding of insects through their inherent characteristics [22]. For example, rice can absorb calcium silicate to increase the silicon content in plants and increase plant tissue hardness, thereby reducing the relative growth rate of sugarcane borer larvae and reducing the success rate of sugarcane borer drilling, resulting in improved resistance of rice to the sugarcane borer [23]. The cuticle of some plants is also covered with epidermal wax, which increases the smoothness of the leaves and hinders the reproduction of non-specialized insects on the leaf surface [24]. In poplar, endogenous overexpression of MYB186 can increase trichome density and improve insect resistance [25]. Induced defenses can also be divided into direct and indirect defenses [26]. Direct defense refers to the production of defense-related proteins or toxic secondary metabolites when plants are damaged by pests [27]. Defense-related proteins mainly include phenylpropanoid metabolic pathway enzymes, protease inhibitors, amino acid degrading enzymes, etc. These proteins can hinder the intestinal digestive enzyme activity of herbivorous insects or consume amino acids, thus affecting the growth and development of herbivorous insects [28]. Toxic secondary metabolites include alkaloids, flavonoids, tannins, etc. These compounds have a direct lethal insecticidal effect or affect insect growth and development [29]. Indirect defenses refer to plants attracting natural enemies of pests by releasing volatiles after being attacked by insects to achieve the effect of protecting themselves [24,30]. This study primarily focused on the analysis of induced defenses.
Alfalfa (Medicago sativa L.) is a high-quality leguminous forage widely distributed worldwide and known as the “king of forage”. It has been cultivated, consumed as food or feed, and used for medical purposes in China for more than 2000 years [31,32]. It can improve soil quality and provide high-quality protein, greatly contributing to the development of high-quality and efficient animal husbandry [33,34]. However, as the research on alfalfa has become more extensive in recent years and the cultivation area has continued to grow, the severity of pest infestations has increased. Aphids are the most common pests on alfalfa. The emergence of insecticide resistance and restrictions on insecticides have greatly increased the need for new and sustainable aphid control strategies [35,36]. In order to develop appropriate strategies, a deeper understanding of the molecular mechanisms of plant–aphid interactions is needed. With the continuous advancement of sequencing technologies, it has become feasible to gain a more thorough understanding of the alfalfa response mechanisms to aphid infestation. The aim of this study was to investigate the defense mechanisms of alfalfa plants against infestation with pea aphids. By integrating metabolome analysis with transcriptome data, we identified key genes involved in alfalfa responses to aphid infestation. These findings provide a foundation for further exploration in subsequent studies and will inform the development of insect-resistant varieties.

2. Materials and Methods

2.1. Experimental Material Preparation, Alfalfa Treatment, and Sample Collection

Based on the performance of the various alfalfa varieties available in our laboratory against aphids in the greenhouse and in the field, the ‘Wudi’ alfalfa variety was selected and grown in a walk-in climate room (25 °C, humidity 70%, light and dark conditions 16 h/8 h). After 40 days of cultivation, alfalfa plants with the same growth and development were selected for the experiment. The pea aphids that often broke out in the laboratory were selected, and the adults were selected and reared in isolated leaves. After the first generation of reproduction, the adult aphids were removed, and the 3-day-old instar nymphs were selected for the experiment. Alfalfa plants were divided into 3 groups, with 3 replicates in each group. Each replicate was inoculated with 20 pea aphids. Leaves were collected on 0, 1, and 4 days, respectively. The collected leaf samples were quickly put into liquid nitrogen and stored at −80 °C.

2.2. RNA Extraction, Library Construction, and Sequencing

The total RNA from alfalfa leaves was extracted using the RNAprep Pure Plant Kit (Tiangen, Beijing, China) according to the instructions provided by the manufacturer. RNA concentration and purity were measured using NanoDrop 2000 (Thermo Fisher Scientific, Wilmington, DE, USA). RNA integrity was assessed using the RNA Nano 6000 Assay Kit with the Agilent Bioanalyzer 2100 system (Agilent Technologies, Santa Clara, CA, USA) [37].
A total amount of 1 μg RNA per sample was used as input material for the RNA sample preparations. Sequencing libraries were generated using the Hieff NGS Ultima Dual-mode mRNA Library Prep Kit for Illumina (Yeasen Biotechnology (Shanghai) Co., Ltd., Wuhan, China) following the manufacturer’s recommendations. Index codes were added to attribute sequences in each sample. The quality of the library was assessed using the Agilent Bioanalyzer 2100 system. The libraries were sequenced on an Illumina NovaSeq6000 platform (Illumina, San Diego, CA, USA) to generate 150 bp paired-end reads, according to the manufacturer’s instructions [38].

2.3. Functional Annotation and Differentially Expressed Gene Identification

Raw fastq format data (raw reads) were first processed through in-house perl scripts to obtain clean data (clean reads). Using the Hisat2 tool (2.2.1), we mapped the clean read data to the “Xinjiangdaye” genome [39]. Gene function was annotated by sequence alignment based on the following databases: Nr (NCBI non-redundant protein sequences); pfam (protein family); kOG/COG (Clusters of Orthologous Groups of proteins); swiss-Prot (a manually annotated and reviewed protein sequence database); KO (KEGG Ortholog database); and GO (Gene Ontology).
The quantification of gene expression levels was estimated using fragments per kilobase of transcript per million fragments mapped. Differential expression analysis between the two groups was performed using DESeq2 [40]. DESeq2 provides statistical routines for determining differential expression in digital gene expression data using a model based on the negative binomial distribution. The resulting p-values were adjusted using Benjamini and Hochberg’s approach for controlling the false discovery rate [41]. Genes with an adjusted Fold Change ≥ 2 and FDR < 0.01 identified by DESeq2 were assigned as differentially expressed genes [40]. Gene Ontology (GO) enrichment analysis of the differentially expressed genes was implemented by the clusterProfiler package based on Wallenius non-central hyper-geometric distribution [42]. The KOBAS database and clusterProfiler (4.4.4) software were used to analyze the enrichment of differentially expressed genes in KEGG pathways [43].

2.4. Extraction of Metabolites

Alfalfa leaf samples of 50 mg were weighed, and 1000 μL of extract containing the internal control was added to the sample (methanol/acetonitrile/water = 2:2:1, internal standard concentration: 20 mg/L), and the mixture was vortexed for 30 s. Steel balls were added to the mixture, which was placed in a 45 Hz grinder for ultrasonication for 10 min (in an ice water bath) and left for one hour at minus 20 °C. Next, the samples were centrifuged at 4 °C and 12,000 rpm for 15 min. Furthermore, 500 μL of the supernatant was placed in an Eppendorf tube, and the extract was dried in a vacuum concentrator. Moreover, 160 μL of extract (acetonitrile/water = 1:1) was added to the dried metabolite for re-dissolution. The sample was vortexed for 30 s, sonicated for 10 min under ice water conditions, and centrifuged at 4 °C and 12,000 rpm for 15 min. Finally, the 120 μL supernatant was transferred to a 2 mL injection bottle, and 10 μL of each sample was taken and mixed into the QC sample for on-line detection [44].

2.5. LC-MS/MS Analysis

The LC/MS system for metabolomics analyses comprised the Waters Acquity I-Class PLUS ultra-high performance liquid tandem Waters Xevo G2-XS QTof high-resolution mass spectrometer. The Waters Xevo G2-XS QTOF high-resolution mass spectrometer can collect primary and secondary mass spectrometry data in MSe mode under the control of the acquisition software (MassLynx V4.2, Waters, Milford, MA, USA). In each data acquisition cycle, dual-channel data acquisition was performed on both low collision energy and high collision energy at the same time. The low collision energy was 2 V, the high collision energy range was 10~40 V, and the scanning frequency was 0.2 s for a mass spectrum. The parameters of the ESI ion source were as follows: capillary voltage: 2000 V (positive ion mode) or −1500 V (negative ion mode); cone voltage: 30 V; ion source temperature: 150 °C; desolvent gas temperature: 500 °C; backflush gas flow rate: 50 L/h; and desolventizing gas flow rate: 800 L/h [45].

2.6. Metabolome Data Preprocessing, Annotation, and Analysis

The raw data collected using MassLynx V4.2 were processed by the Progenesis QI (v3.0) software for peak extraction, peak alignment, and other data processing operations based on the Progenesis QI software online METLIN database and Biomark’s self-built library for identification. At the same time, the theoretical fragment identification and mass deviation were all within 100 ppm [44].
A follow-up analysis was performed after normalizing the original peak area information with the total peak area. Principal component analysis and Spearman correlation analysis were performed to assess the homogeneity of the samples within a group and the quality control samples. The identified compounds were examined to obtain classification and pathway information in KEGG, HMDB, and lipidmaps databases. According to their grouping, the fold changes in accumulation were calculated and compared between groups. T-tests were used to calculate the difference in the significance of the p-value of each compound. The R language package ropls was used to perform OPLS-DA modeling, and 200 times permutation tests were performed to verify the model’s reliability. The VIP value of the model was calculated using multiple cross-validations. The differentially accumulated metabolites were screened by combining the fold-change data, the p-values, and the VIP values of the OPLS-DA model. The screening criteria were FC > 1, p-value < 0.05, and VIP > 1. The differential metabolites that were significantly enriched in KEGG pathways were identified using a hypergeometric distribution test [46].

2.7. Comprehensive Analysis of Transcriptome and Metabolome

Differentially expressed genes and differentially accumulated metabolites were simultaneously mapped to the KEGG pathway database. At the same time, the expression patterns of genes contained in each part of the KEGG pathway were analyzed [47].

2.8. Statistical Analysis

Values represent the mean ± SD (standard deviation). Where appropriate, the statistical significance of differences was determined by the t-test or one-way ANOVA with Bonferroni’s post hoc comparisons. Therefore, p-values less than 0.05 were considered significant. SPSS Statistics version 26.0 (IBM Corp., Armonk, NY, USA) was used for statistical analysis.

3. Result

3.1. Analysis of Differentially Expressed Genes in Alfalfa Plants Infested with Aphids

In order to elucidate the responses of alfalfa to aphid infestation, alfalfa plants were inoculated with aphids for different durations (0 d, 1 d, and 4 d), and their transcriptome was analyzed. Expression and annotation of all genes in aphid-infested alfalfa are shown in Table S1. An RNA-Seq analysis of nine samples was performed, and 57.77 Gb of data were obtained. The clean data of all samples reached 6.14 Gb, and the percentage of Q30 bases was greater than 94.64%. More than 93% of the RNA sequences in each sample were highly matched to the alfalfa genome. The total clean read length of each sample ranged from 20,503,500 to 22,698,634, the Q30 value was >91.50%, and the GC content was 41.86–42.86%. |log2 (fold change)| > 1 and FDR < 0.01 were used as the criteria for the identification of differentially expressed genes (Table S2).
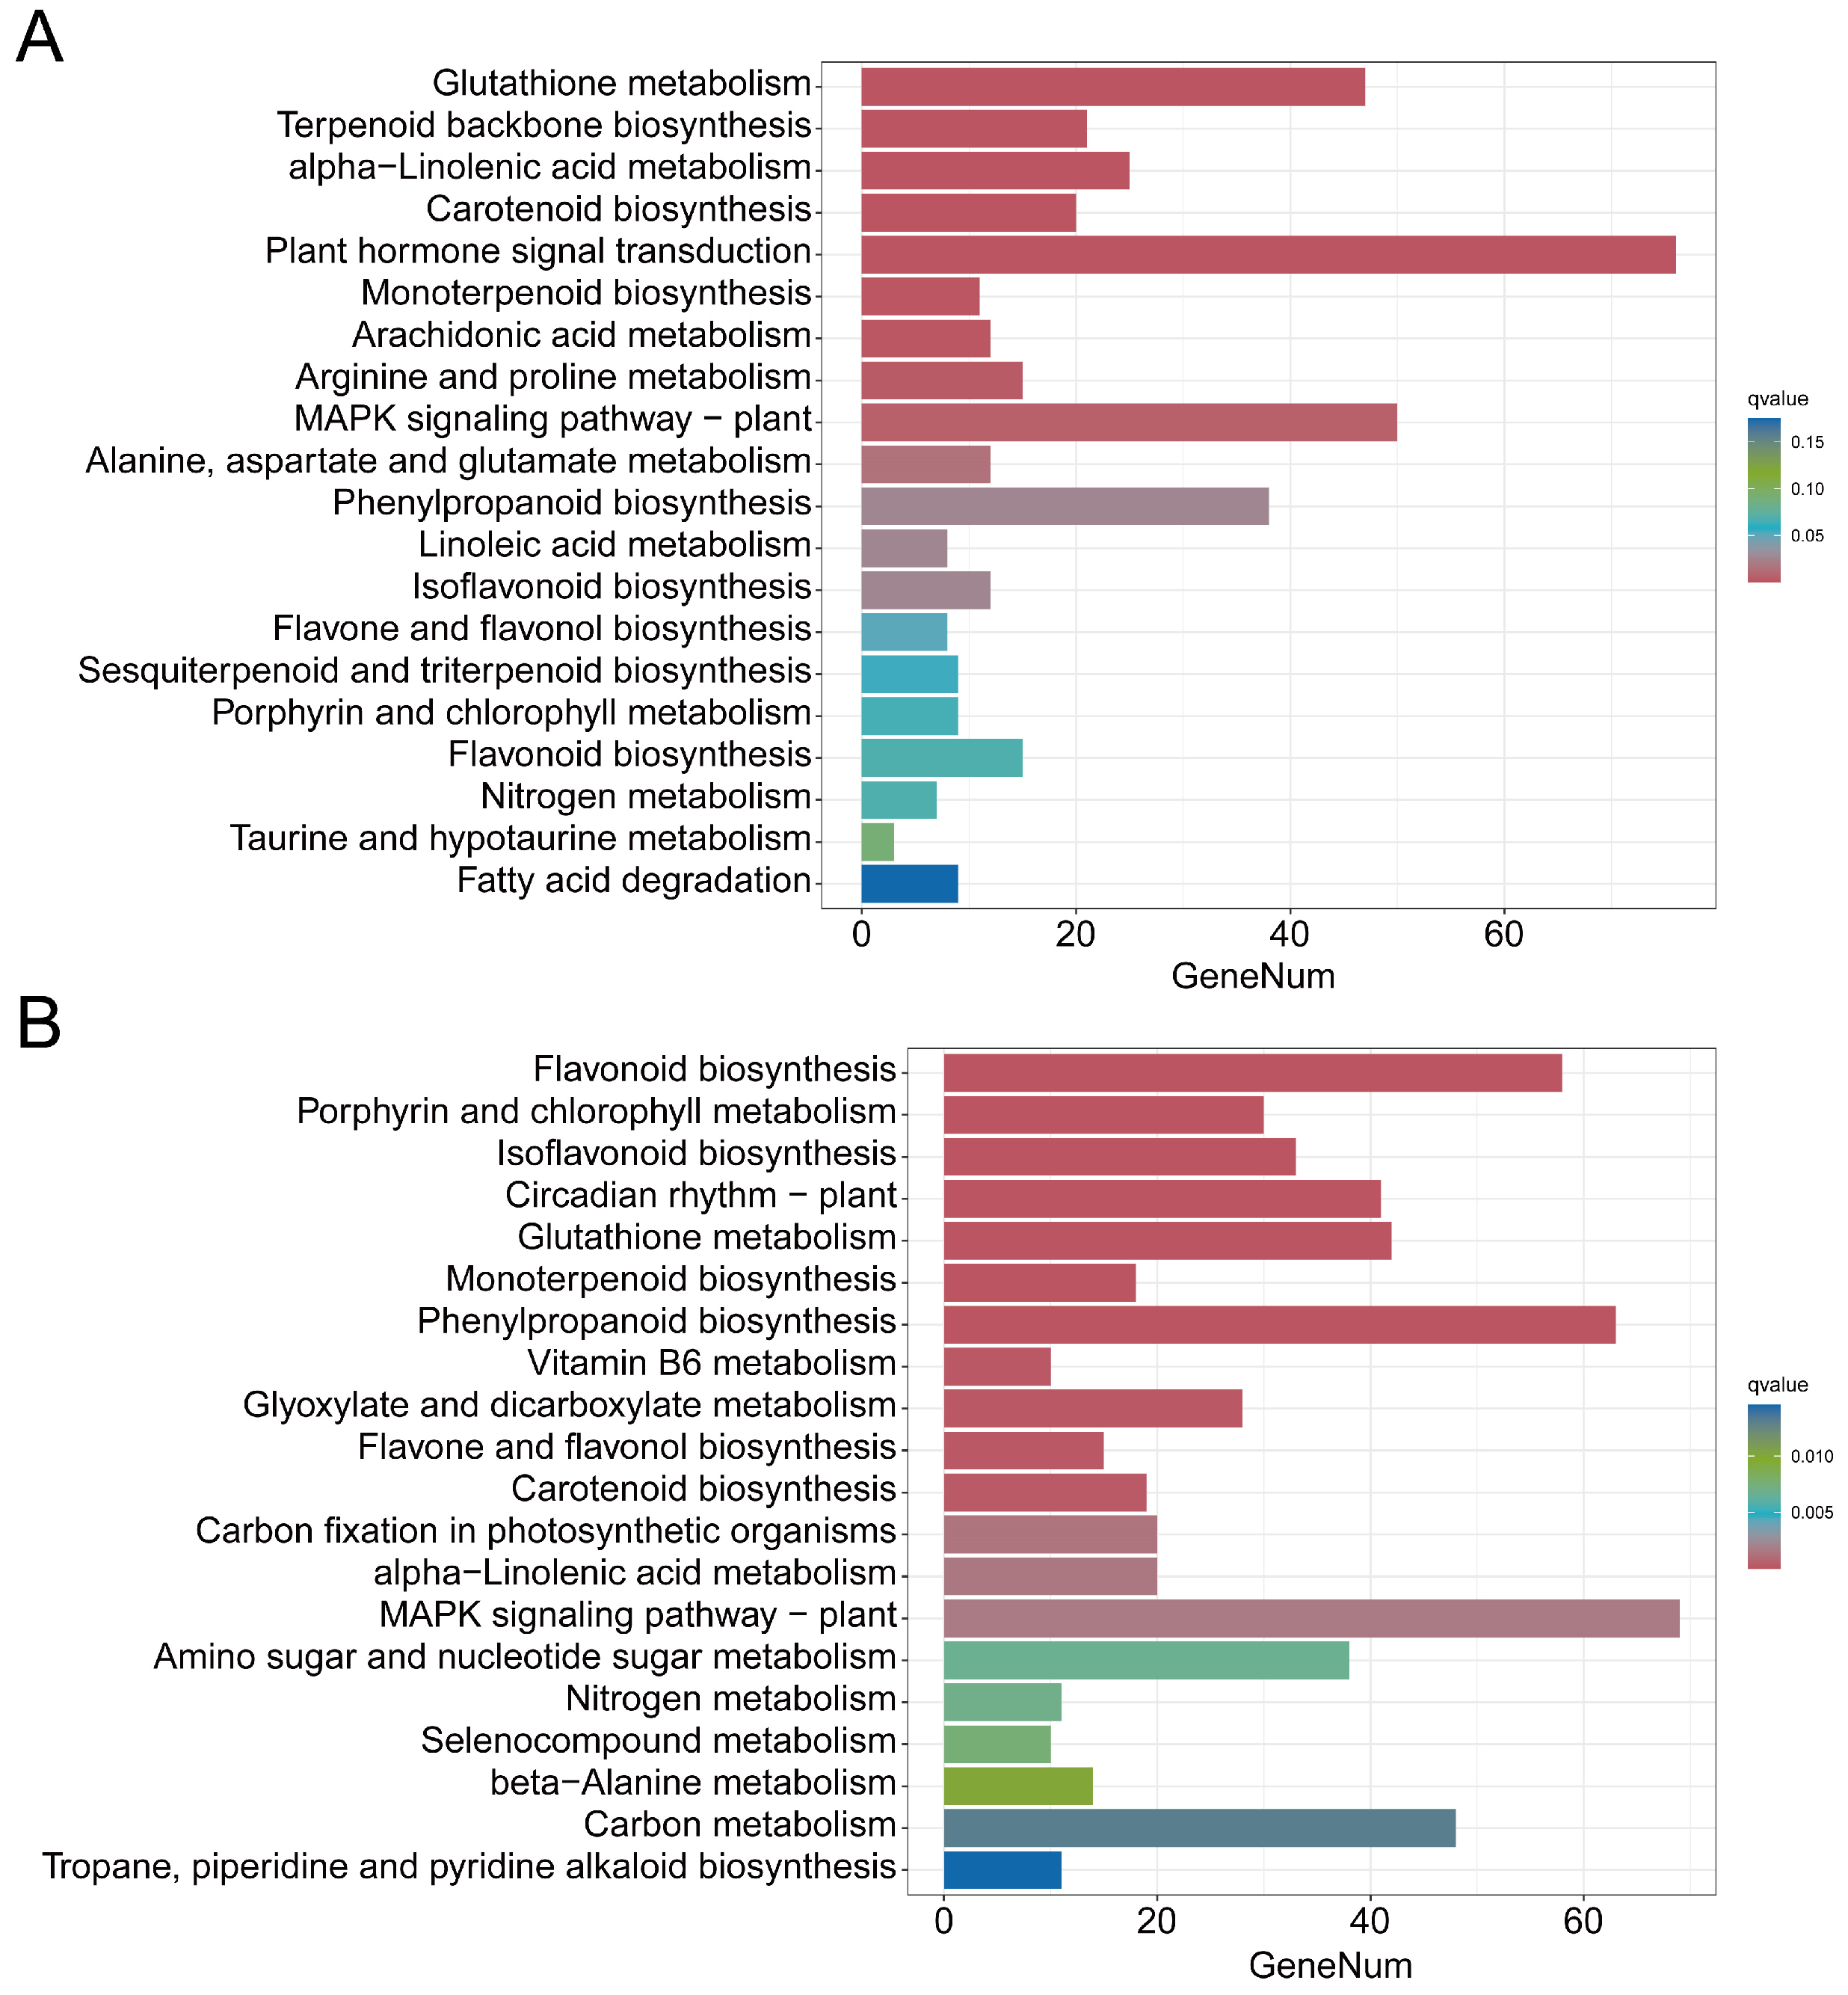
As shown in Figure 1A, 3458 DEGs were identified under different treatment time points, and 1318 and 1878 DEGs were differentially expressed only in the CK vs. T1d and CK vs. T4d comparison groups. Among them, 262 DEGs were differentially expressed in each group. To further investigate the functions of DEGs that exhibited different expression patterns, an expression trend analysis of 3458 DEGs was performed. As shown in Figure 1B, a total of eight expression trends were identified, among which P2, P4, and P7 were significantly enriched (p-value < 0.01), containing 1843 DEGs, accounting for 53.3% of the total. P2 contained 910 DEGs, with their expression levels initially decreasing and subsequently increasing with the treatment time increase. P4 contained 581 DEGs, with their expression levels exhibiting a gradual change initially and then increasing with the treatment time increase. P7 contained 352 DEGs, whose expression levels gradually increased with the treatment time increase. As shown in Figure 1C, in the biological process category, DEGs with distinct expression patterns identified above were most enriched in “single biological process”, in the cellular component category, DEGs were most enriched in “membrane”, and in the molecular function category, DEGs were most enriched in “catalytic activity”. KEGG analysis of DEGs in the 1 d and 4 d treatments revealed that in CK vs. T1d, DEGs were significantly most enriched in “glutathione metabolism” and most enriched in “plant hormone signal transduction”. In CK vs. T4d, DEGs were the most significantly enriched in “flavonoid biosynthesis” and in “MAPK signaling pathway–plant” (Figure 2A,B).

3.2. Weighted Gene Co-Expression Network Analysis (WGCNA)

In order to further screen the genes related to aphid infestation responses, all genes were assessed by WGCNA (Figure 3). As shown in Figure 3A, the genes could be divided into 16 modules according to their expression patterns: blue, midnight blue, tan, pink, black, turquoise, yellow, salmon, gray, magenta, red, green, brown, green–yellow, purple, and cyan. A maximum of 3021 genes (turquoise) and a minimum of 124 genes (midnight blue) were identified in each module, with large differences observed between modules. At the same time, correlation analysis revealed a strong correlation between different modules, which could be further clustered into different sub-families (Figure 3B). In order to explore the relationship between aphid infestation time and each module, their correlation and significance were analyzed. As shown in Figure 3C, the correlation between the salmon and green modules was the highest in T1d, which were positively correlated and negatively correlated, respectively, and the difference is significant. In T4 d, the blue and turquoise modules had the highest correlation and were positively correlated and negatively correlated, respectively, and the difference was significant. It can be speculated that these four modules are closely associated with the responses of alfalfa to aphid infestation. By screening the genes in the four modules (|module membership (MM)| > 0.9 and |gene significance (GS)| > 0.9), 2158 and 211 genes were identified, respectively. Through the combined analysis of the DEGs, 117 key genes were obtained that were closely associated with the responses of alfalfa to aphid infestation (Figure 3D, Table S3).

3.3. Analysis of Differentially Accumulated Metabolites in Alfalfa Infested with Aphids

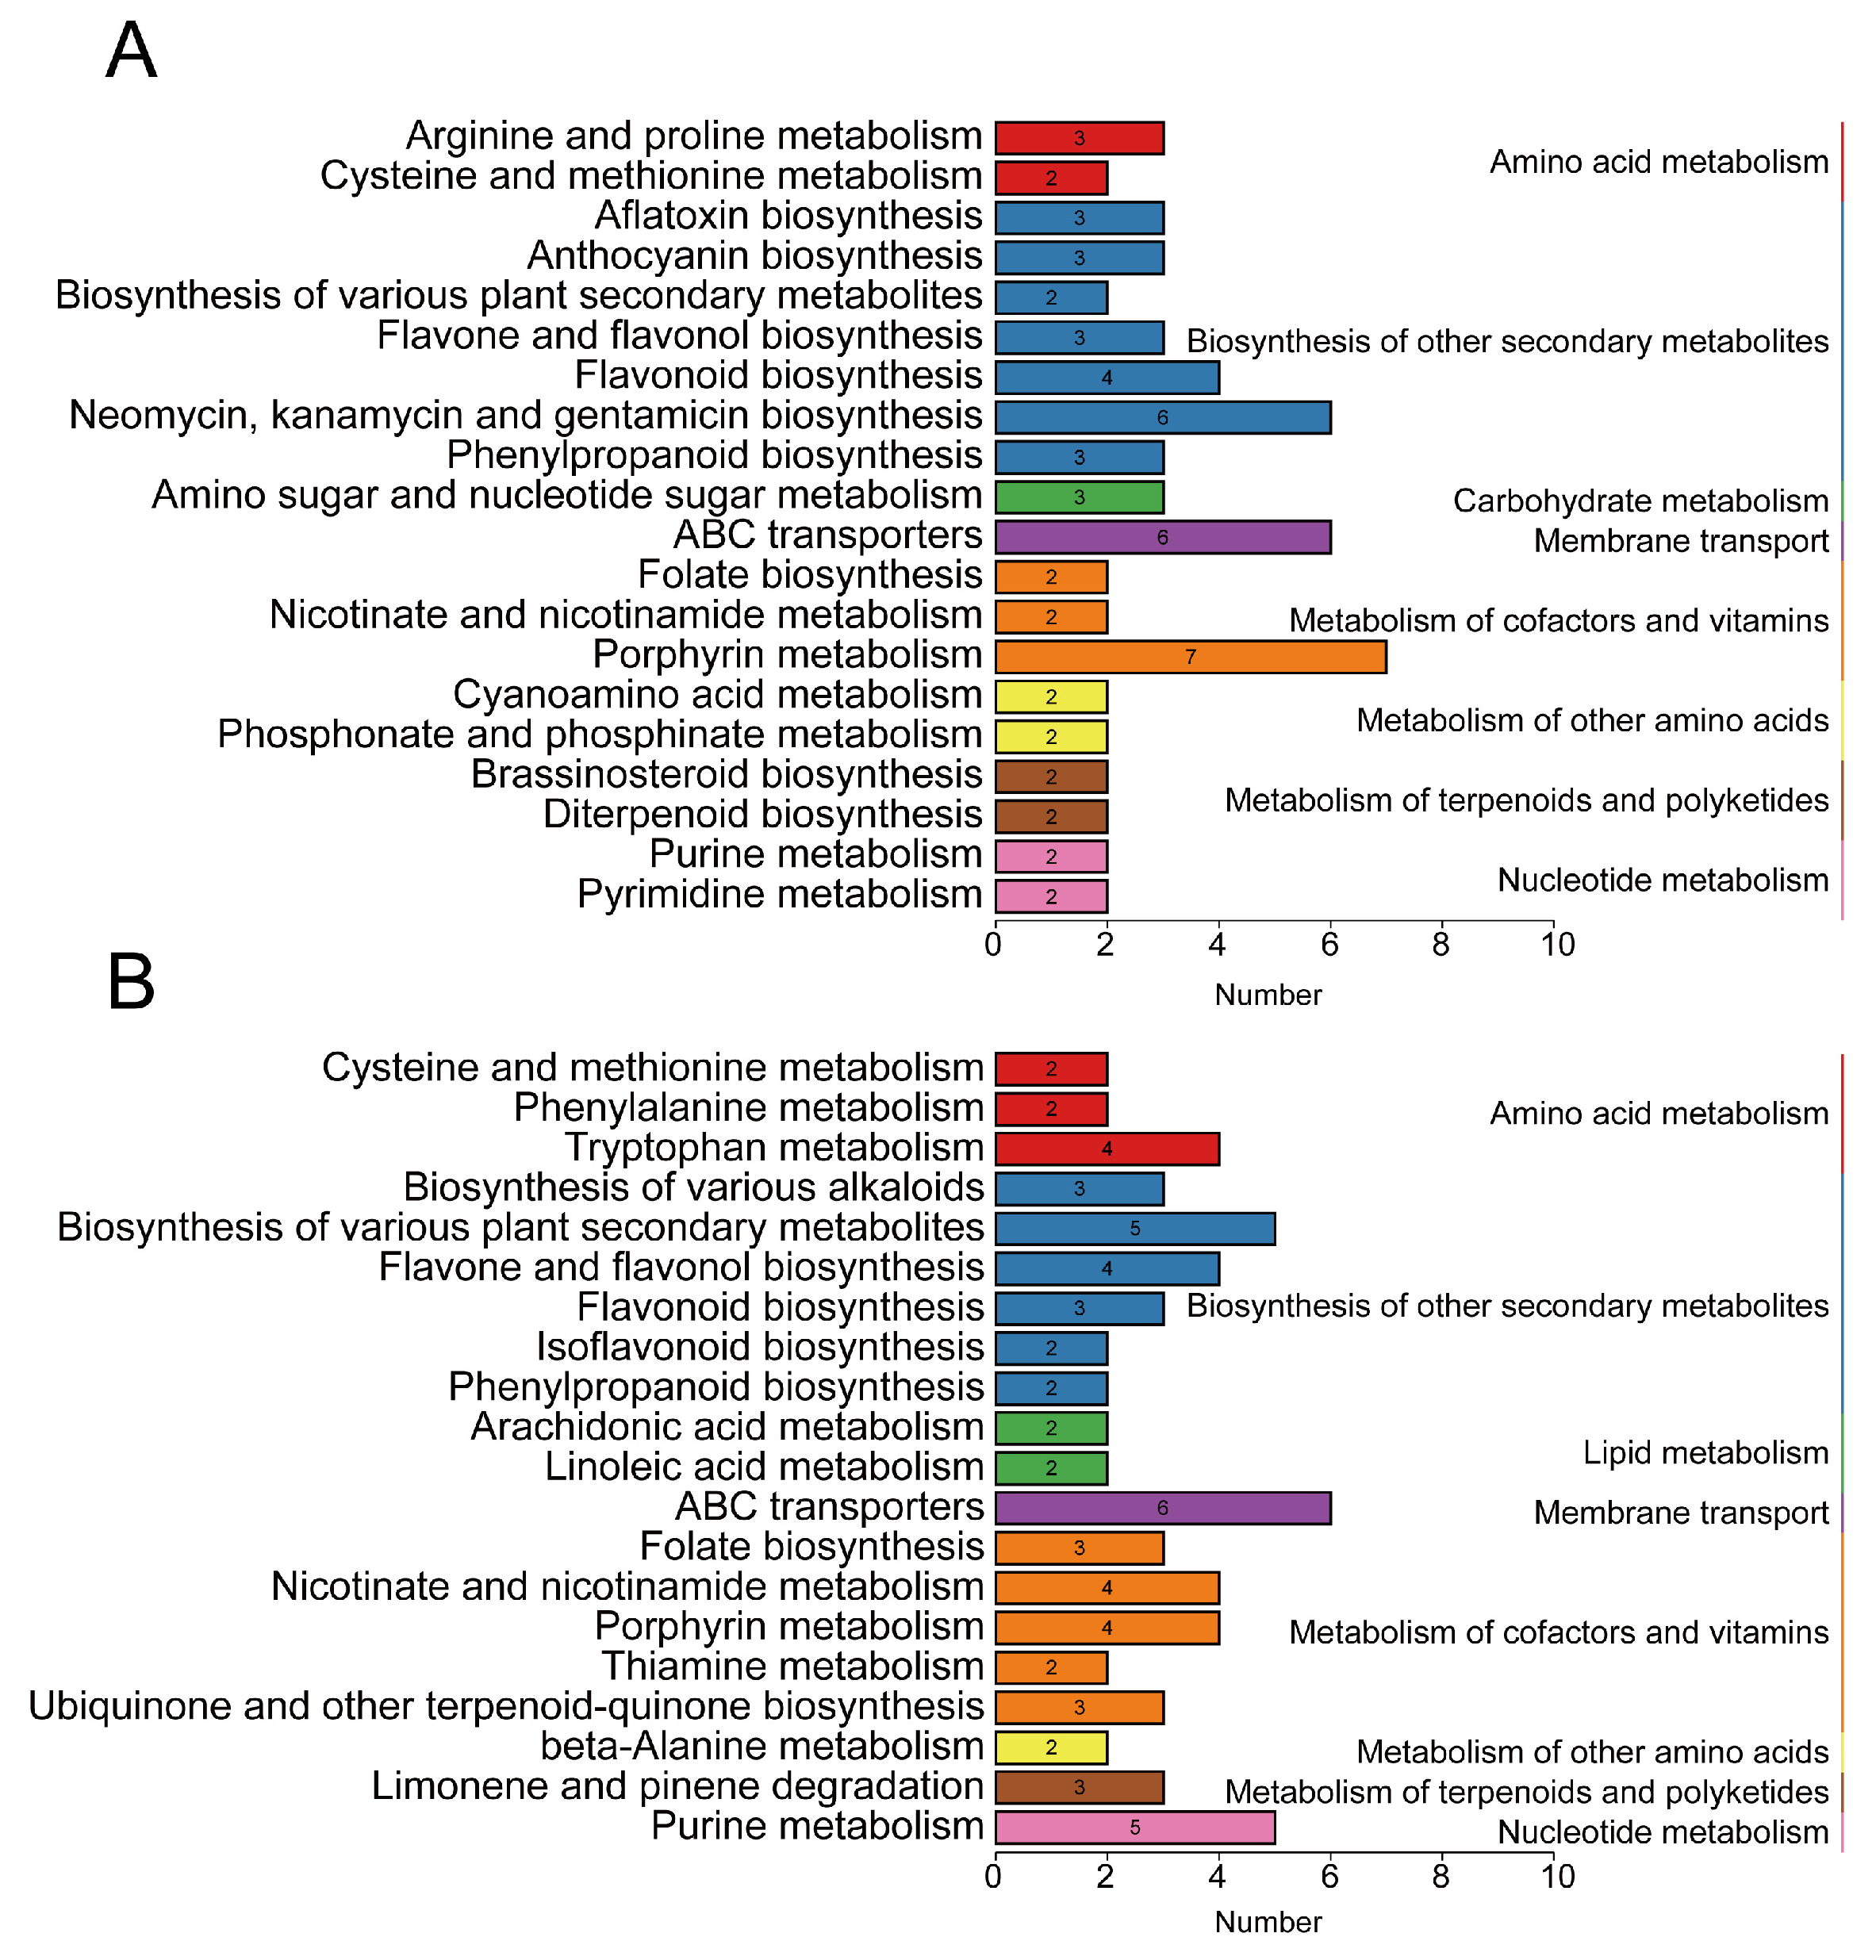
Metabolomics analyses were used to identify the changes in metabolites of alfalfa plants infested by aphids. A total of 4224 metabolites were identified (Table S4), and a total of 358 differentially accumulated metabolites (DAMs) were identified based on certain criteria (VIP > 1.0, FC > 2 or FC < 1/2, p-value < 0.05) (Table S5). Venn diagram analyses of the 358 DAMs revealed that 153 and 182 DAMs were only identified in CK vs. T1d and CK vs. T4d, respectively, and 23 DAMs were identified in two groups (Figure 4A). As shown in Figure 4B, the accumulation of 4 DAMs gradually increased with the treatment time, and the accumulation of 19 DAMs decreased with the treatment time. Next, an analysis of the accumulation trends of all DAMs was carried out. A total of 358 DAMs were enriched into eight accumulation patterns, of which 47 metabolites were significantly enriched in profile 7 (p < 0.05) (Figure 4C). KEGG analysis of all DAMs showed that DAMs in each group were significantly enriched in the “biosynthesis of other secondary metabolites” (Figure 5A,B).

3.4. Analysis of DEGs and DAMs of the Phenylpropanoid Biosynthesis Pathway

In order to further elucidate the responses of alfalfa to aphid infestation, DEGs and DAMs were mapped to KEGG pathways. The results showed that the “phenylpropanoid biosynthesis”, “flavonoid biosynthesis”, and “isoflavonoid biosynthesis” pathways were significantly enriched.
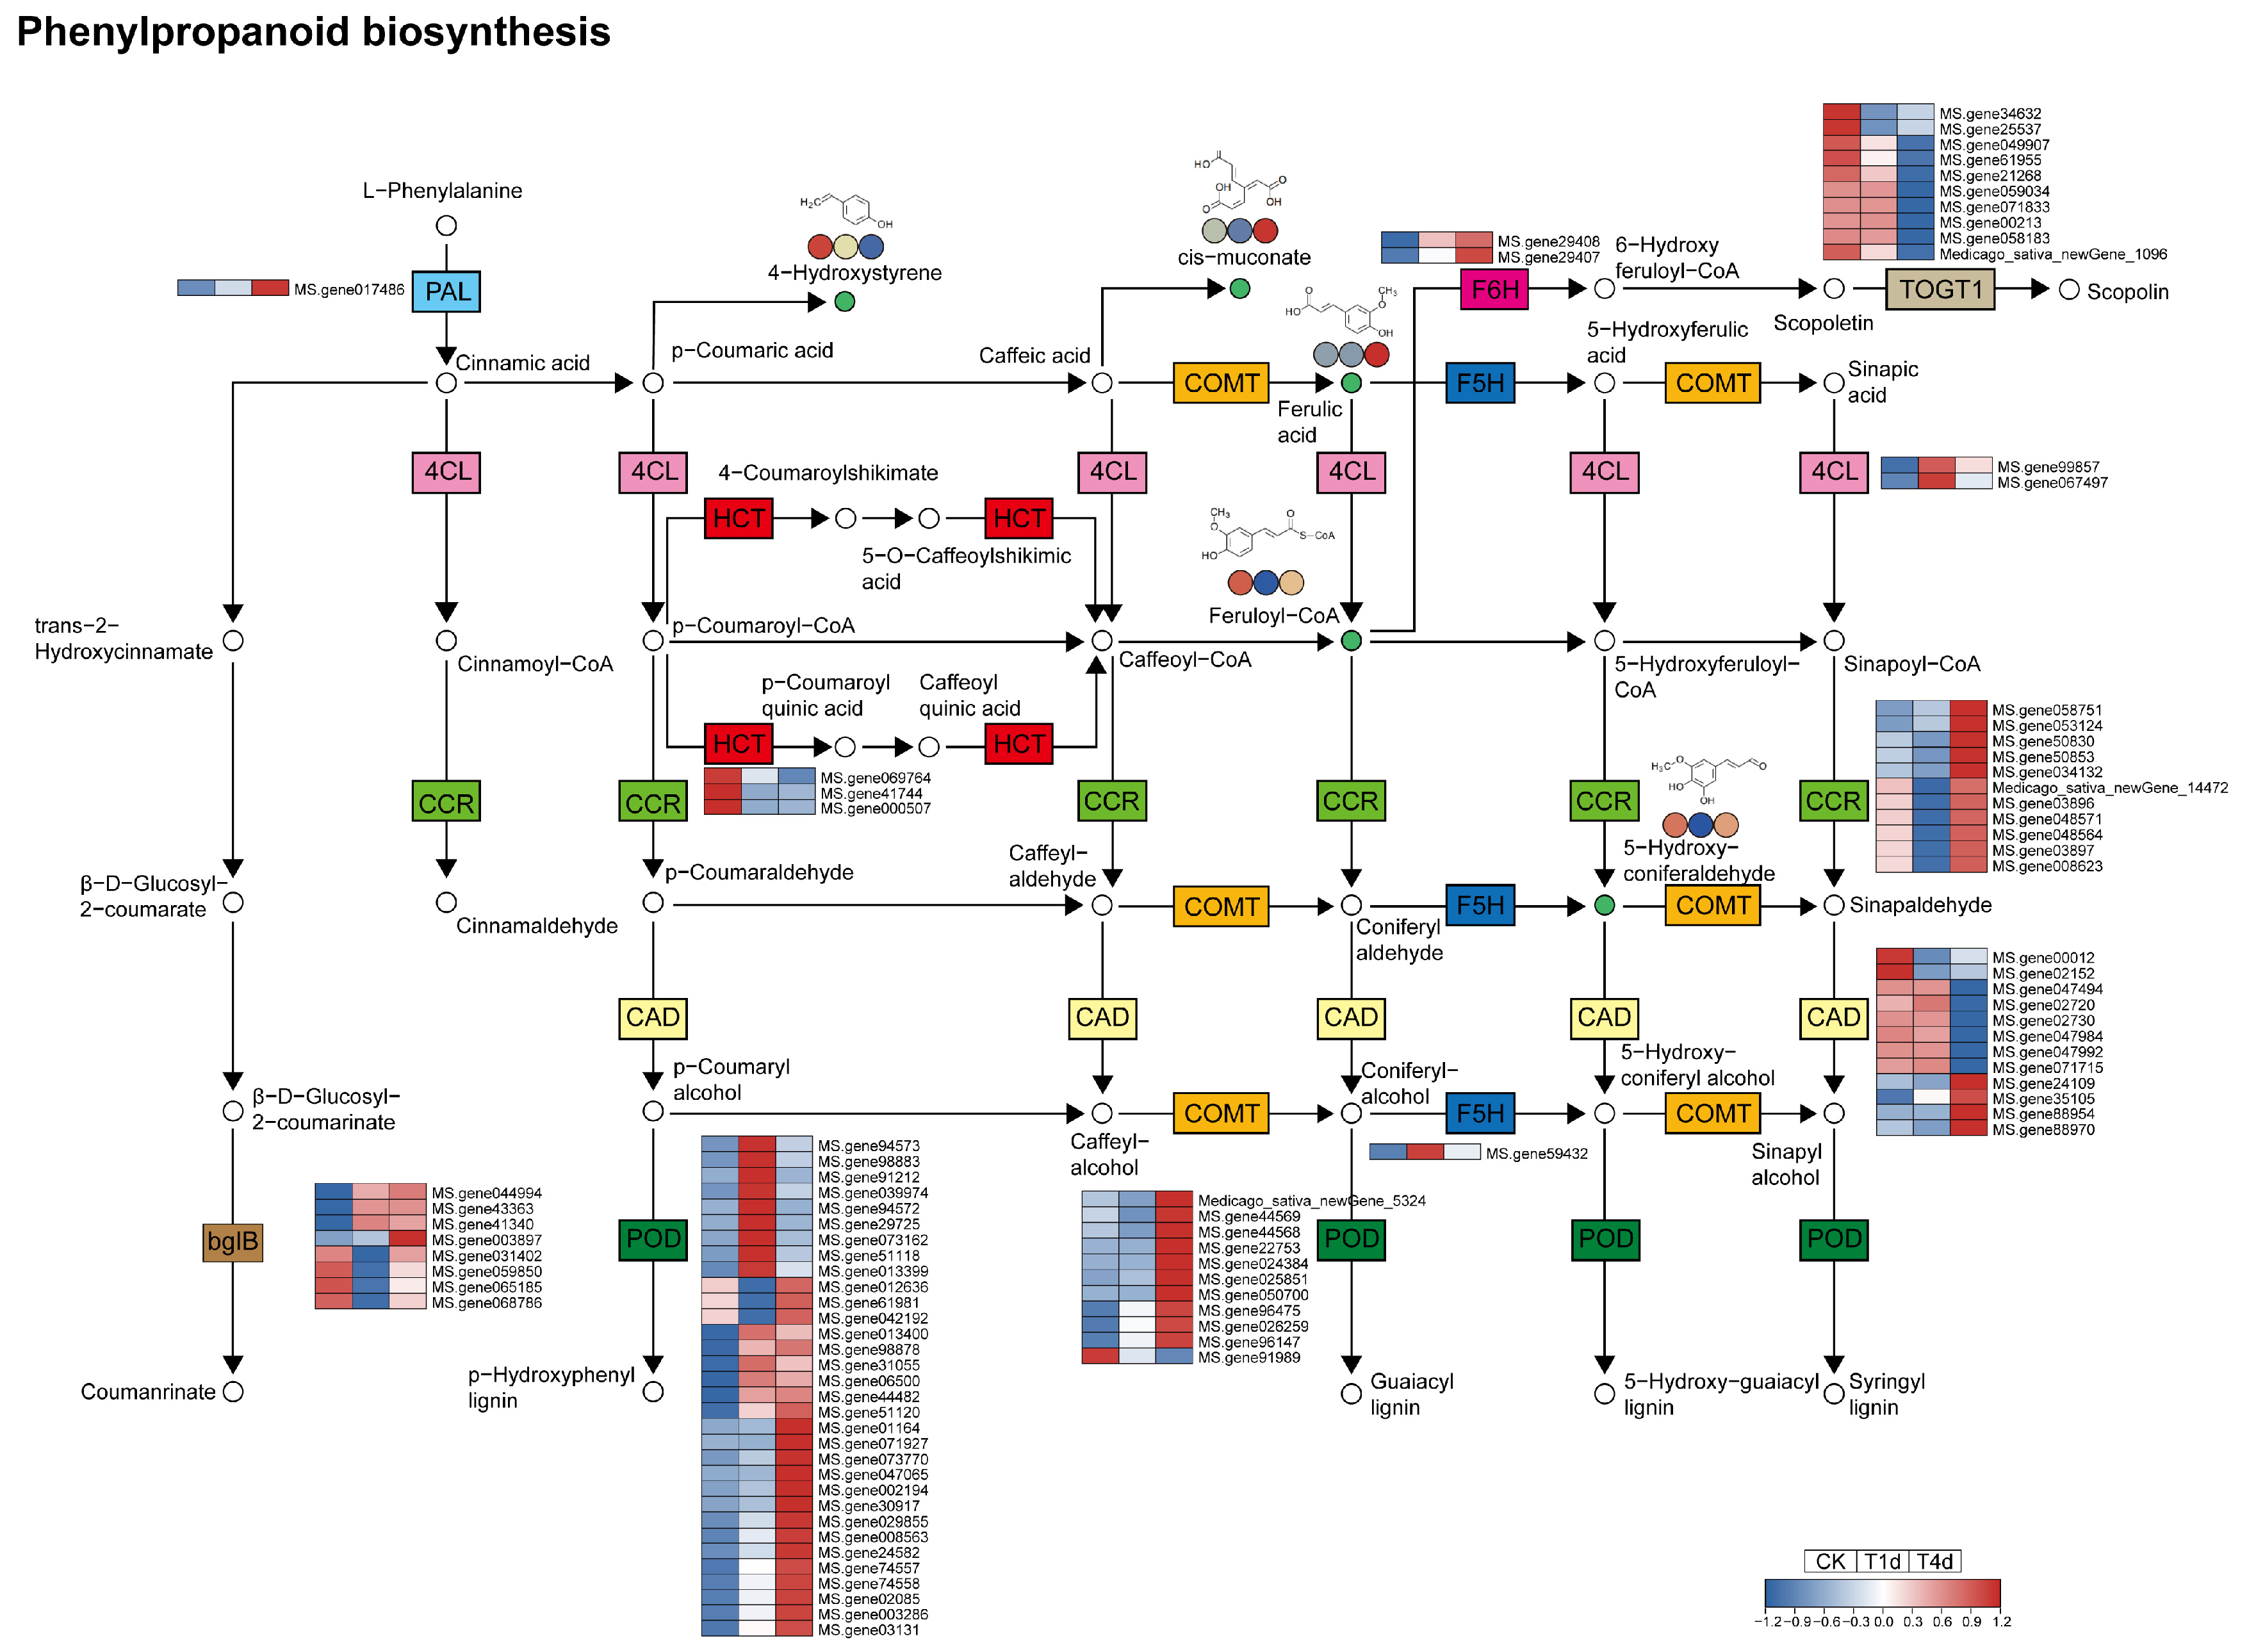
In the phenylpropanoid biosynthesis pathway, 93 DEGs and 5 DAMs were enriched (Figure 6, Table S6). At the gene level, the 93 DEGs could be divided into 11 categories. Among them, phenylalanine ammonia-lyase (PAL) and feruloyl-CoA 6-hydroxylase (F6H), including one DEG and two DEGs, respectively, were up-regulated with the increase in aphid infestation time. Scopoletin glucosyltransferase (TOGT1) and shikimate O-hydroxycinnamoyltransferase (HCT), including 10 and 3 DEGs, respectively, were down-regulated with aphid infestation time. The expression levels of 4-coumarate-CoA ligase (4CL) and ferulate-5-hydroxylase (F5H), including two DEGs and one DEG, respectively, were up-regulated and then down-regulated with aphid infestation time. Eleven DEGs were encoded for cinnamoyl-CoA reductase (CCR), among which five DEGs were up-regulated, and six DEGs were initially down-regulated and subsequently up-regulated as the treatment time progressed. Their expression levels after up-regulation were greater than that at 0 d. Furthermore, 12 DEGs encoded for cinnamyl-alcohol dehydrogenase (CAD), of which 2 DEGs were down-regulated with the increase in aphid infestation time; 6 DEGs had no significant change at 1 d and were only significantly down-regulated at 4 d. Moreover, the expression levels of three DEGs did not change significantly at 1 d. They were up-regulated at 4 d, while 1 DEG was significantly up-regulated with increased aphid infestation time. Eleven DEGs encoded for caffeic acid 3-O-methyltransferase (COMT), of which seven DEGs had no significant difference in expression between 1 d and 0 d, while their expression levels were significantly up-regulated at 4 d. Three DEGs were up-regulated with the increase in aphid infestation time, while one DEG was down-regulated. Moreover, 31 DEGs encoded for Peroxidase (POD), of which 9 DEGs exhibited their highest expression levels at 1 d, 3 DEGs exhibited their lowest expression level at 1 d, and over all their expression levels at 4 d were higher than that at 0 d. The expression level of 12 DEGs increased with the treatment time. β-glucosidase (bgIB) contains eight DEGs, of which three DEGs were up-regulated at 1 d and 4 d. The expression of one DEG was up-regulated with the increase in aphid infestation time, while the expression of four DEGs was the lowest at 1 d. At the metabolite level, the accumulation of 4-hydroxystyrene decreased with the treatment time. Cis-muconate accumulation decreased first and then increased significantly with the treatment time. The accumulation of ferulic acid did not change significantly at 1 d and was significantly increased at 4 d. The accumulation of feruloyl-CoA decreased first and then increased with the increase in aphid infestation time. The accumulation of 5-hydroxyconiferaldehyde decreased first and then increased with the aphid infestation time increase.

3.5. Analysis of DEGs and DAMs Involved in Flavonoid Biosynthesis

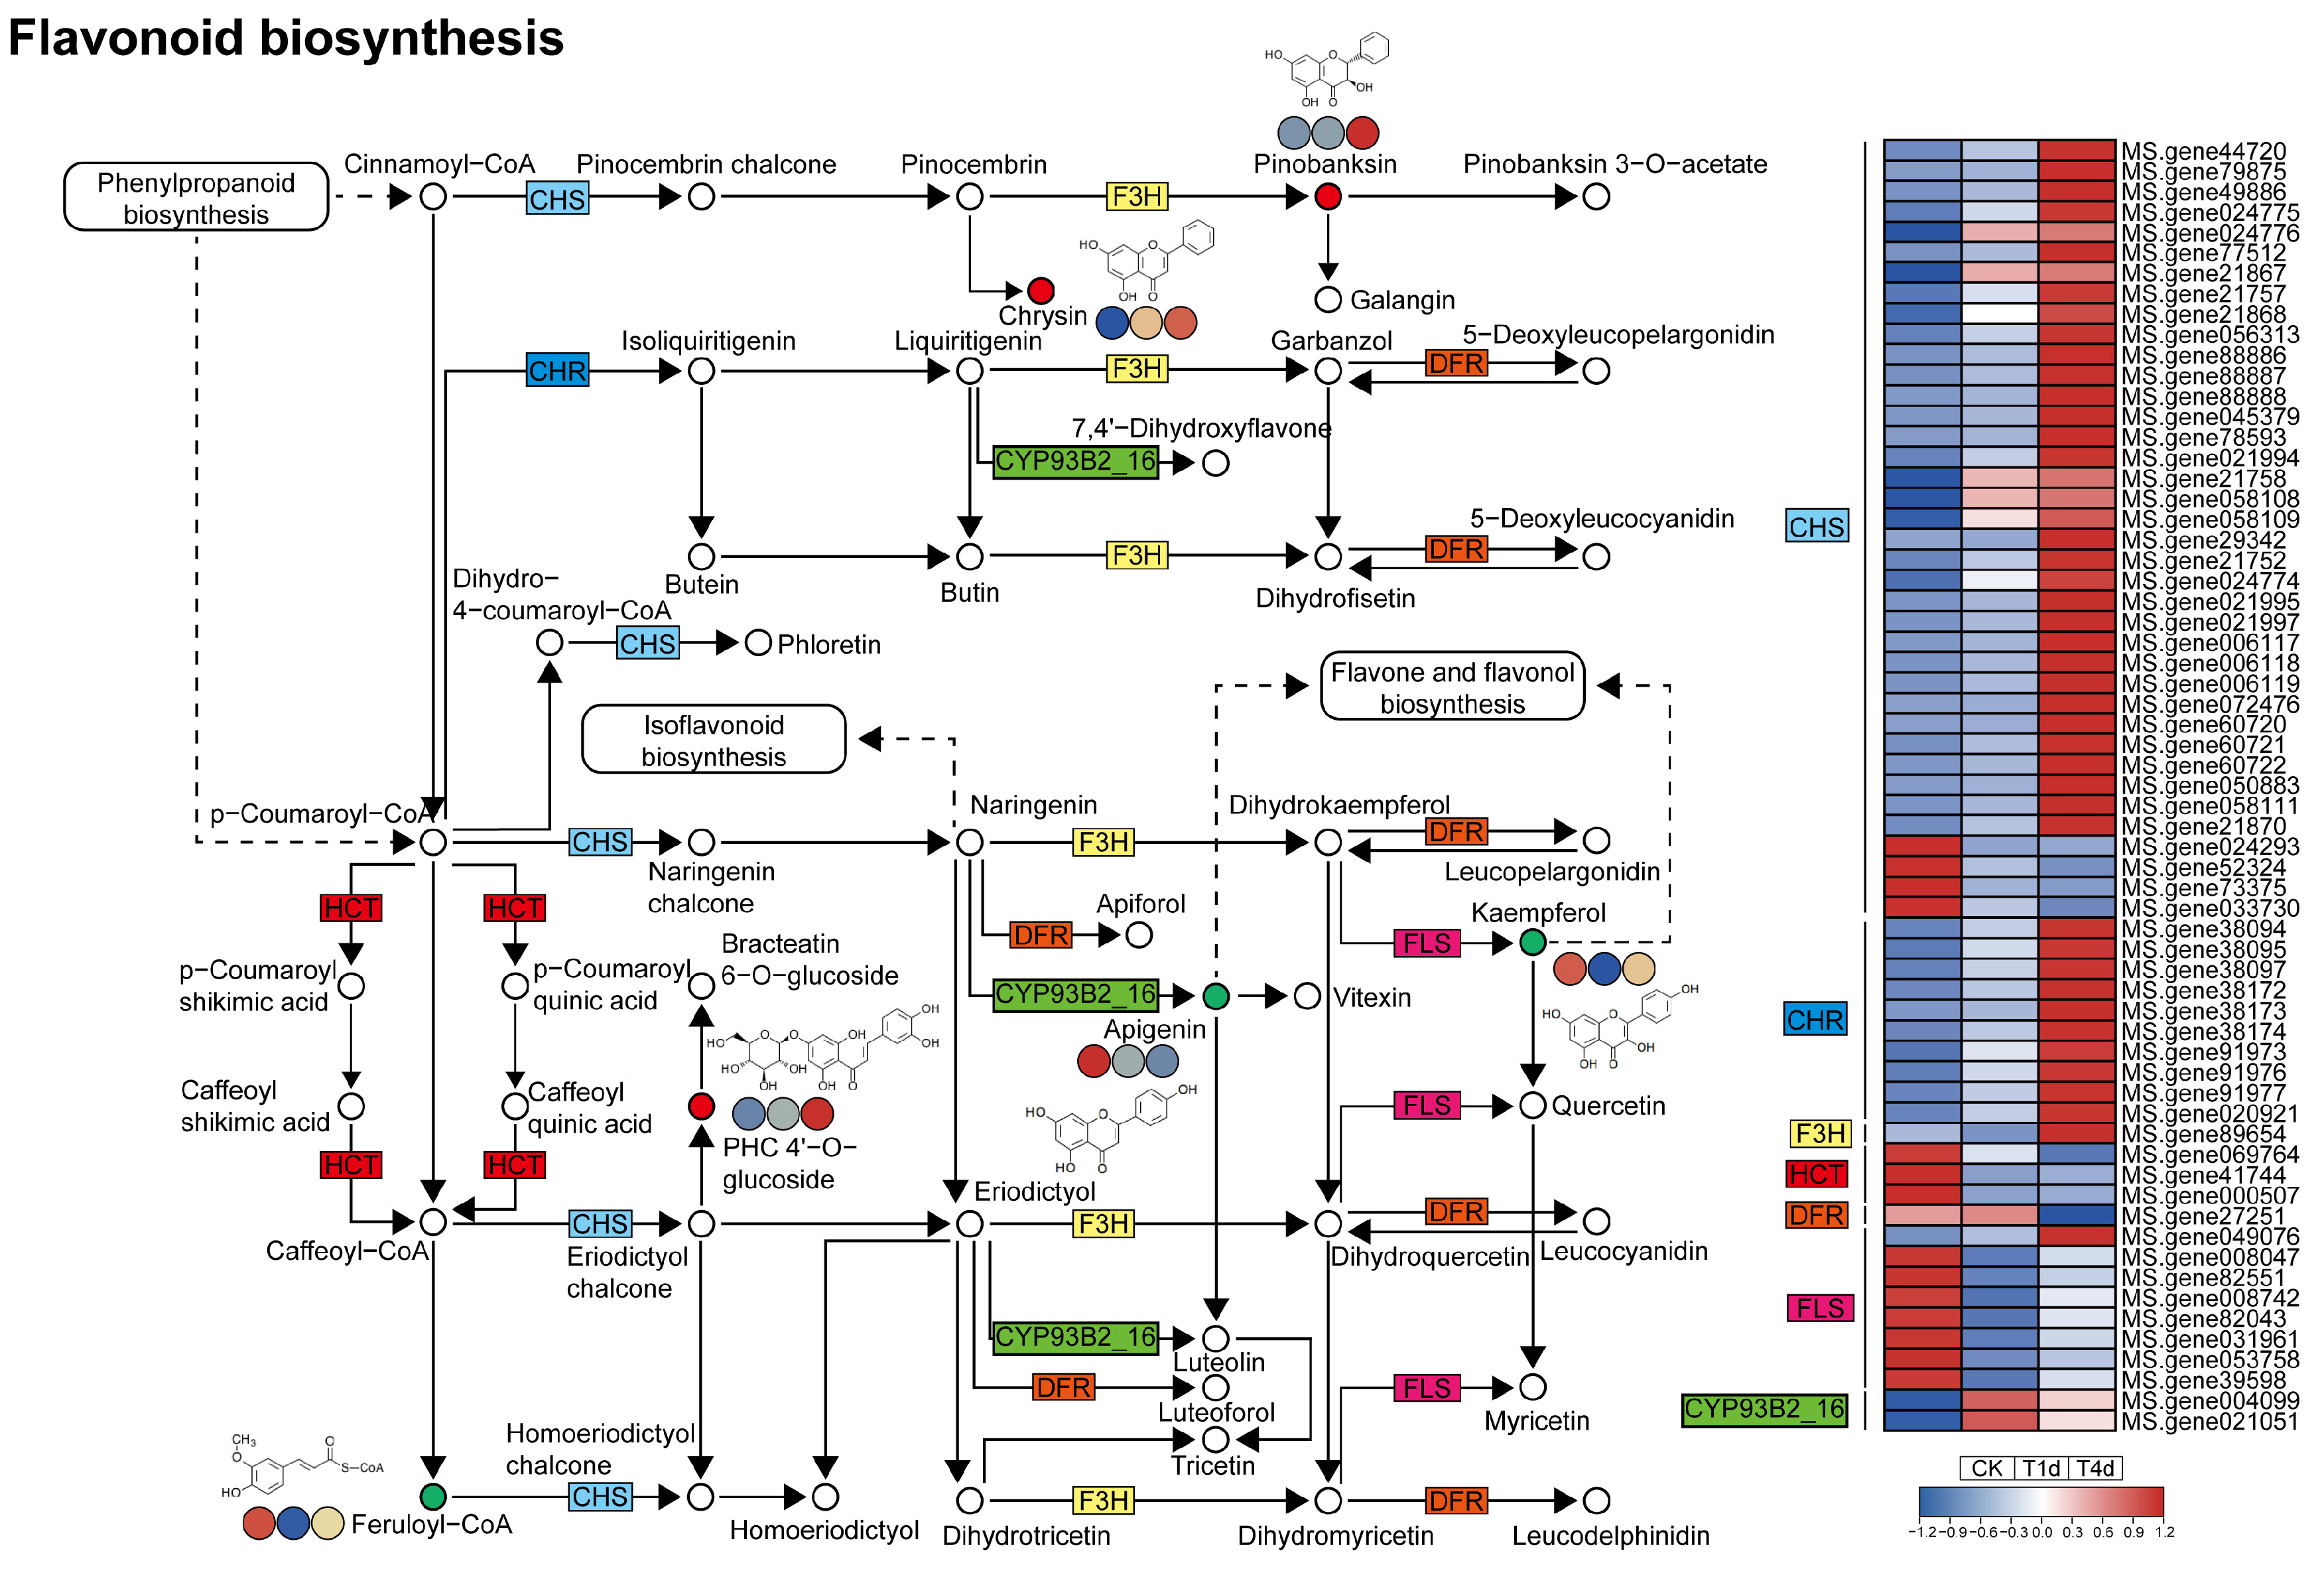
Sixty-three DEGs and six DAMs were enriched in the flavonoid biosynthesis pathway. At the gene level, 63 DEGs were divided into seven categories (Figure 7, Table S7). Chalcone synthase (CHS) contains 38 DEGs, of which 34 DEGs were up-regulated and 4 were down-regulated with aphid infestation time. Chalcone reductase (CHR) expression was up-regulated with aphid infestation time 10 DEGs. The expression of naringenin 3-dioxygenase (F3H) was up-regulated. HTC is located at the junction of the flavonoid biosynthesis pathway and the phenylpropanoid biosynthesis pathway. The expression of flavanone 4-reductase (DFR) increased first and then decreased significantly with the treatment time. Flavonol synthase (FLS) contains eight DEGs, of which one was up-regulated and seven were down-regulated. Flavone synthase II expression (CYP93B2_16) was up-regulated and then down-regulated with aphid infestation time, including two DEGs. At the metabolite level, pinobanksin, chrysin, and PHC 4′-O-glucoside accumulation increased with the aphid infestation time. The accumulation of apigenin decreased. The accumulation of feruloyl-CoA and kaempferol decreased first and then increased with the aphid infestation time.

3.6. Analysis of DEGs and DAMs Involved in Isoflavonoid Biosynthesis

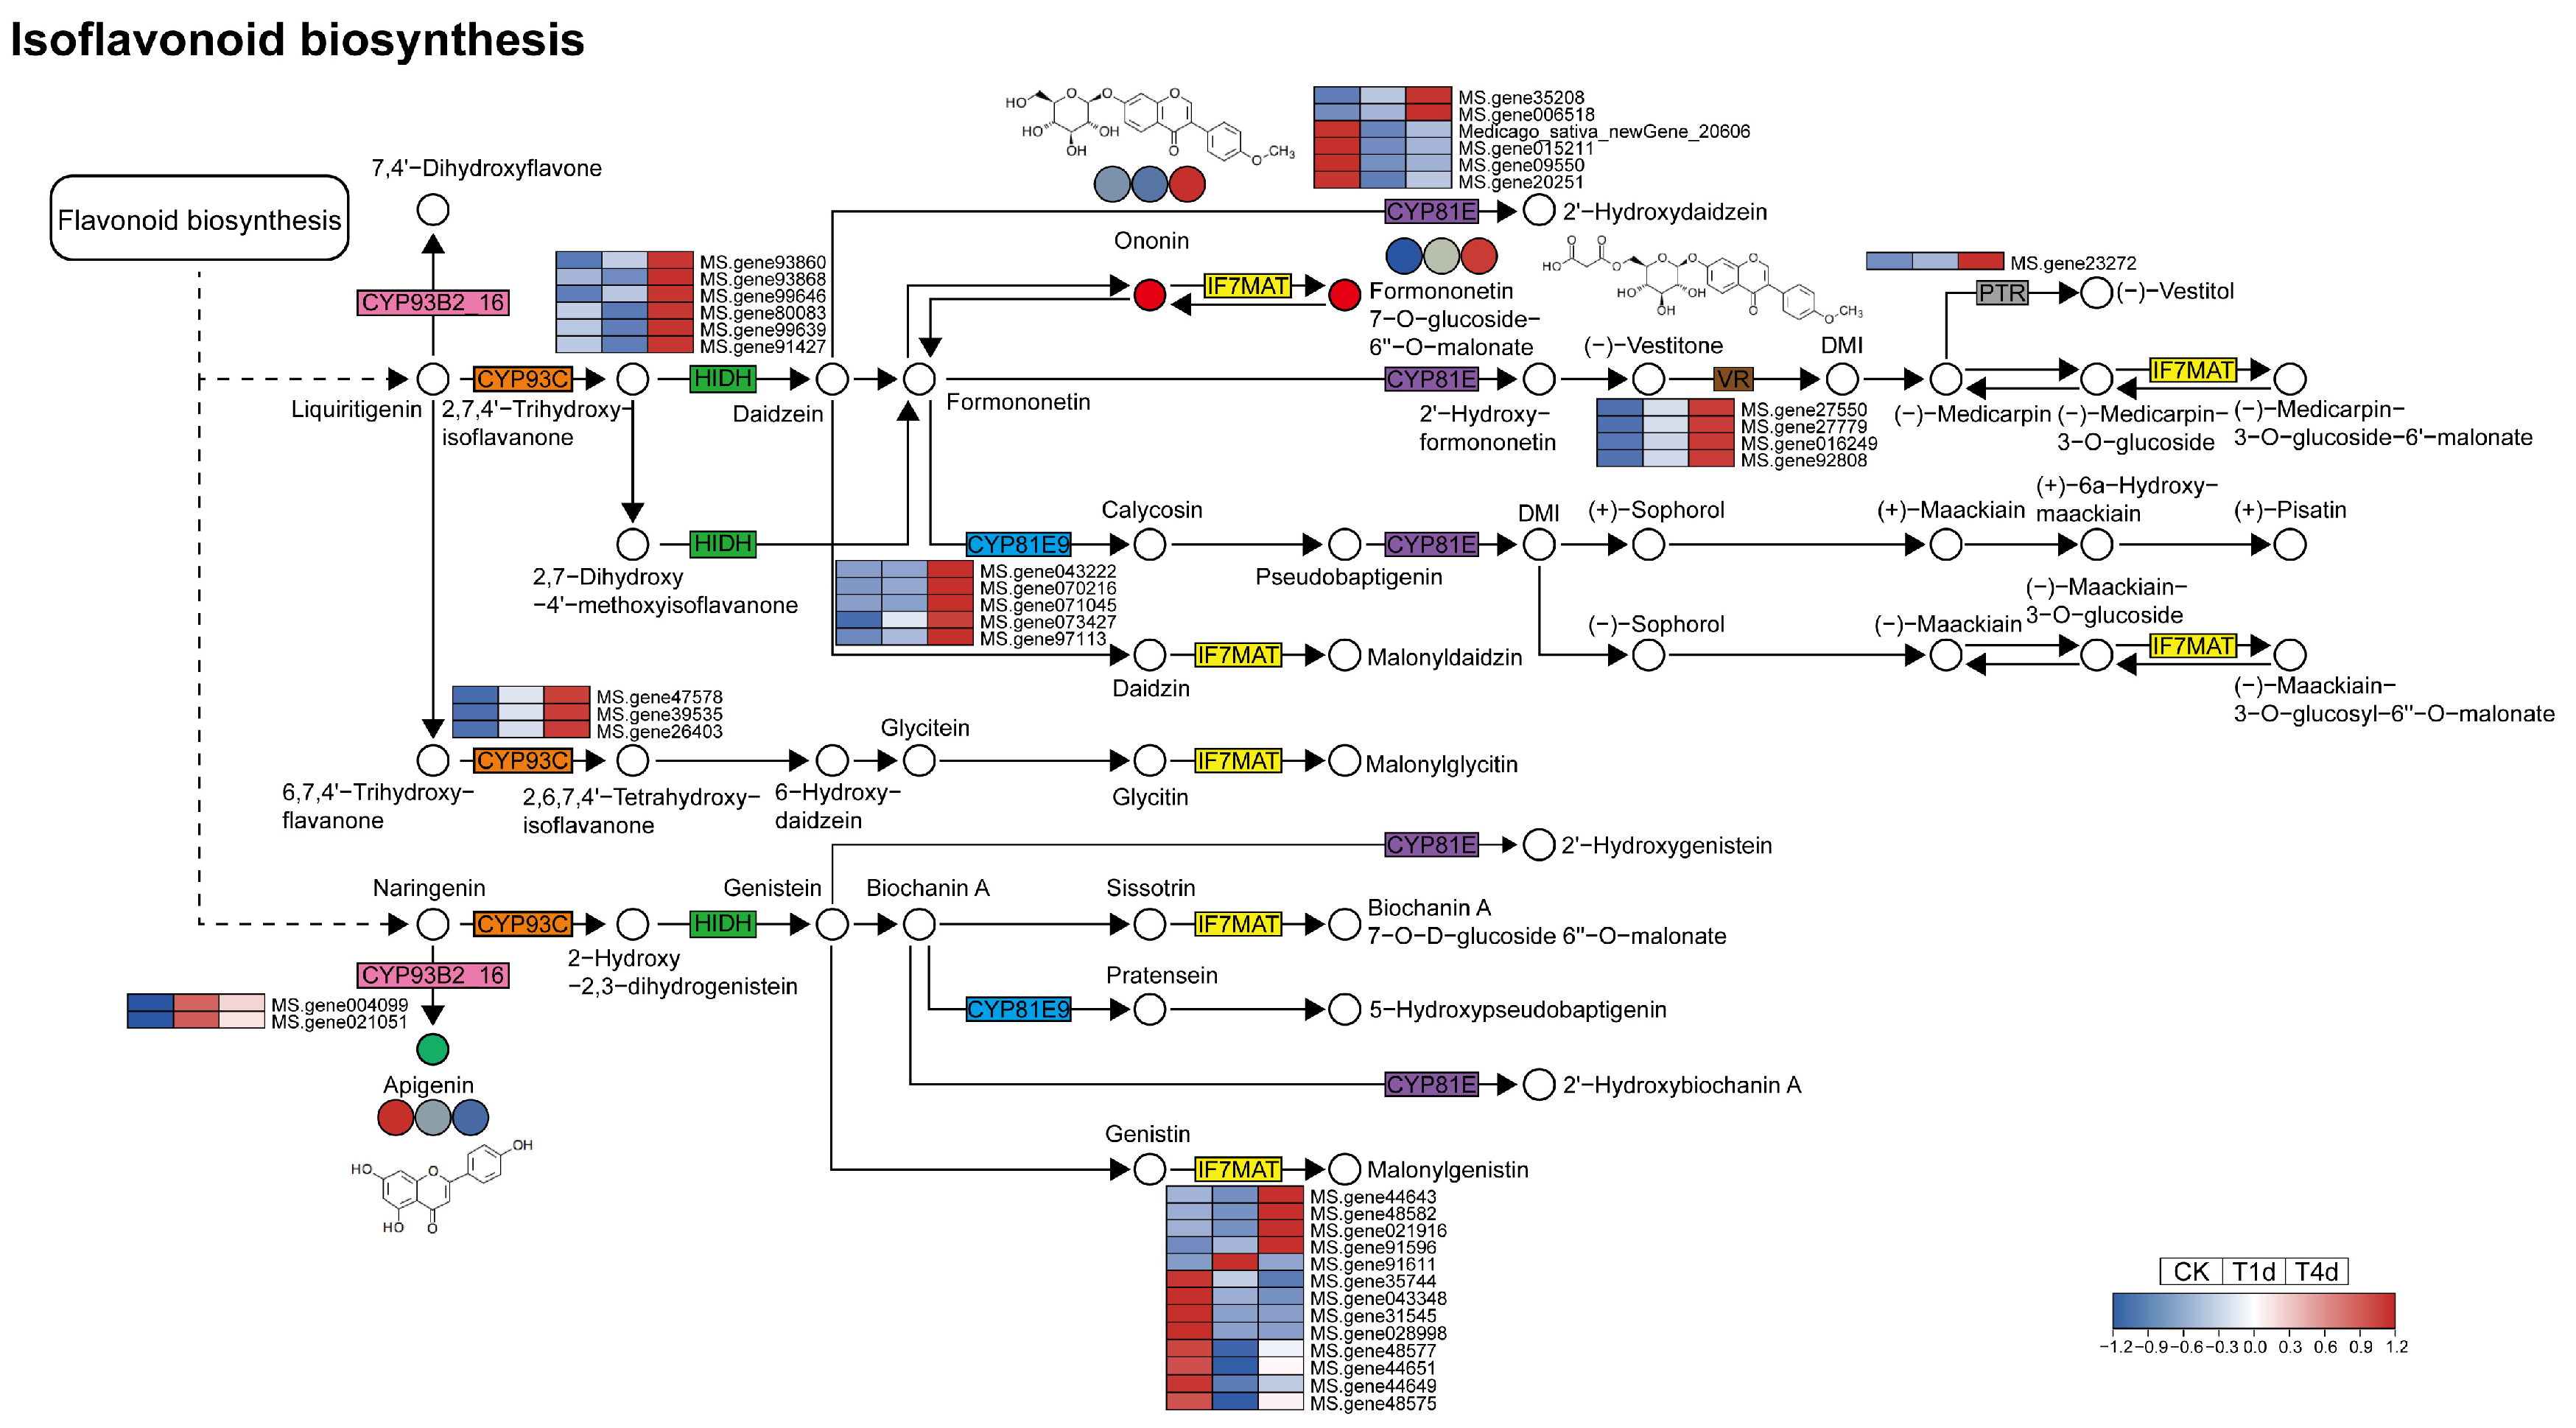
Forty DEGs and three DAMs were enriched in the isoflavonoid biosynthesis pathway (Figure 8, Table S8). Regarding specific genes, flavone synthase II (CYP93B2_16), 2-hydroxyisoflavanone synthase (CYP93C), 2-hydroxyisoflavanone dehydratase (HIDH), isoflavone 3′-hydroxylase (CYP81E9), vestitone reductase (VR), and pterocarpan reductase (PTR) were up-regulated under aphid infestation. They contained 2, 3, 6, 5, 4 DEGs, and 1 DEG, respectively. Isoflavone 7-O-glucoside-6″-O-malonyltransferase (IF7MAT) was represented by 13 DEGs, of which 4 DEGs were up-regulated and 8 were down-regulated under aphid infestation, and 1 DEG was significantly up-regulated at 1 d and down-regulated at 4 d. 4′-Methoxyisoflavone 2′-hydroxylase (CYP81E) was represented by six DEGs, of which two were up-regulated and four were down-regulated under aphid infestation. At the metabolite level, the accumulation of ononin and formononetin 7-O-glucoside-6”-O-malonate was up-regulated under aphid infestation. The accumulation of apigenin decreased with aphid infestation time.

4. Discussion

4.1. Transcriptome Analysis

Through transcriptome analysis of alfalfa leaves infested by aphids, a total of 3458 DEGs were identified, among which 262 DEGs were differentially expressed in CK vs. 1 d and CK vs. 4 d treatments. Through cluster analysis for expression pattern identification and GO analysis of the DEGs, it was found that DEGs were most enriched in the “single biological process” term regarding the biological process category. In the cell component category, “membrane” was enriched with most DEGs. In the molecular function category, “catalytic activity” was enriched with most DEGs. Glutathione plays a key role in the defense response of plants to biotic stress factors [48,49,50]. Rhopalosiphum padi and Sitobion avenae can induce the expression of AsA-GSH cycle-related genes in maize and affect the ascorbic acid and glutathione contents, regulating reduction and oxidation reactions [51]. In this study, DEGs were mapped to the KEGG pathway associated with glutathione metabolism. In CK vs. T1d, the enrichment of DEGs in the “glutathione metabolism” pathway was the most significant. The hormones produced by plants mainly include auxin, gibberellin (GA), cytokinin (CK), abscisic acid (ABA), ethylene (ET), salicylic acid (SA), jasmonic acid (JA), brassinolide (BR), and strigolactones [52]. SA, JA, and ET play important roles in regulating plant defense responses to various pathogens and pests [53]. In CK vs. T1d, most DEGs were enriched in the “plant hormone signal transduction” pathway. As plant antioxidants, flavonoids can scavenge reactive oxygen species (ROS) [54] and protect plants from biotic and abiotic stresses, including ultraviolet radiation, cold stress, pathogen infection, and insect feeding [55]. In CK vs. T4d, the enrichment of DEGs in “flavonoid biosynthesis” was the most significant. MAPK signaling pathway—plants play a critical regulatory role in plants [56]. When pests attack plants, the MAPK signaling pathway can regulate the expression of related insect-resistant defense genes [57,58]. In CK vs. T1d, most DEGs were enriched in the “MAPK signaling pathway–plant” pathway. In recent studies, WGCNA has been used to further identify candidate genes involved in regulatory networks [59]. In apples, WGCNA of DEGs showed that 34 genes were highly correlated with anthocyanin content [60]. In this study, four modules related to response to aphid infestation were identified by WGCNA, and a total of 117 genes related to alfalfa responses to aphids were identified after rigorous screening based on stringent criteria, enabling further functional analyses and investigation.

4.2. Metabolome Analysis

In order to further determine the regulatory network of alfalfa in response to aphid infestation, the metabolome of alfalfa leaves infested by aphids was comprehensively analyzed. A total of 4224 metabolites were identified, and 358 DAMs were screened based on a certain threshold. Primary metabolites in plants mainly refer to carbohydrates, proteins, and fats, and their main role is to carry out energy metabolism and are constituents of structural features of plant cells [61]. Primary metabolites are highly conserved and directly required for plant growth and development [62]. Studies on primary metabolites related to pest resistance mainly focus on carbohydrates and amino acids [63]. As a product of photosynthesis, carbohydrates are plants’ main energy storage. Amino acids are the main form of nitrogen in plants [64] and the precursors of a wide range of plant metabolites related to defense [65]. However, secondary metabolites play more critical roles in plant’s resistance to insects [66]. Compared with primary metabolites, the chemical structure of secondary metabolites is more complex and can vary in different plant tissues and organs. Secondary metabolites include alkaloids, terpenoids, amines, glucosinolates, cyanogenic glycosides, quinones, phenols, peptides, and polyacetylenes [67]. Insect feeding triggers complex reactions, ultimately leading to secondary metabolite synthesis and accumulation. The biosynthesis of these metabolites is regulated by the interactions of signaling molecules containing plant hormones [29]. In recent studies, certain secondary metabolites have been shown to have a significant impact on plant responses and resistance to biotic stress [68], including anthocyanins [69,70], flavones [71], and isoflavonoids [72]. In this study, all DAMs were mapped to KEGG pathways. The “biosynthesis of other secondary metabolites” pathway was the most enriched among the DAMs. It can be subdivided into “aflatoxin biosynthesis”, “anthocyanin biosynthesis”, “biosynthesis of various plant secondary metabolites”, “flavone and flavonol biosynthesis”, “flavonoid biosynthesis”, “neomycin, kanamycin, and gentamicin biosynthesis”, “phenylpropanoid biosynthesis”, and “isoflavonoid biosynthesis”. These findings are consistent with prior research.

4.3. Phenylpropanoid Biosynthesis

Phenylpropanoids facilitate the responses of plants to all aspects of biotic and abiotic stimuli [73]. They are the key mediators for plant resistance to pests [74]. Previous studies have found that sap-sucking herbivorous insects such as aphids [75] can induce the expression of the first key enzyme gene in the phenylpropanoid metabolic pathway, phenylalanine ammonia lyase (PAL). In this study, as shown in Figure 6, the expression of PAL was significantly up-regulated with the increase in aphid infestation time. 4-Coumaric acid-CoA synthetases (4CL) contribute to the flux of different phenylpropanoid biosynthetic pathways [76]. According to previous studies, the level of 4CL increases with the increase in biotic and abiotic stress intensity. It mainly regulates the biosynthesis of lignin, flavonoids, and other secondary metabolites involved in plant stress tolerance. In Arabidopsis, the expression levels of At4CL1 and At4CL2 increased after wounding, while the expression of At4CL3 decreased [77,78]. At4CL1 and At4CL2 are involved in lignin biosynthesis, and At4CL3 is involved in the biosynthesis of flavonoids [78]. In this study, the expression of 4CL was significantly up-regulated compared with CK. Lignin is the most prominent polymer on earth. Lignin is almost entirely based on phenylpropane units derived from the oxidative polymerization of hydroxycinnamyl alcohol derivatives [73]. Multiple genes and metabolites are involved in the process of lignin synthesis, such as shikimate O-hydroxycinnamoyltransferase (HCT), cinnamoyl CoA reductase (CCR), cinnamoyl alcohol dehydrogenase (CAD), Peroxidase (POD), caffeic acid 3-O-methyltransferase (COMT), ferulate-5-hydroxylase (F5H), and others [79,80]. In this study, the above genes were up-regulated or down-regulated under aphid infestation. This suggests that lignin played an important role in alfalfa adaptation to aphid infestation. In summary, phenylpropanoid biosynthesis is a key pathway in alfalfa responses to aphid-induced stress.

4.4. Flavonoid Biosynthesis and Isoflavonoid Biosynthesis

Flavonoids are an important class of secondary metabolites widely present in plants and contribute to plant growth and development. Flavonoids are categorized into various subclasses of compounds such as anthocyanins, flavonoids, flavonols, flavanones, dihydroflavonols, chalcones, orange ketones, flavanones and proanthocyanidins, isoflavones, etc. In previous studies, it has been found that many flavonoids are involved in responses to biotic stresses such as pathogens and pests [81,82,83]. Chalcone synthase (CHS) is a key enzyme that catalyzes the first step in flavonoid biosynthesis [84,85]. Flavone synthase II (CYP93B2_16) belongs to the Cytochrome P450 (CYP) superfamily and is an essential component of flavonoid biosynthesis [86]. It has been reported that CYPs not only protect plants from insects in crops such as soybean [86,87], but also play an important role in drought tolerance in crops such as cotton [88]. Dihydroflavonol-4-reductase (DFR) and naringenin 3-dioxygenase (F3H) play a key role in the production of anthocyanins and proanthocyanidins [89]. Flavonol synthase (FLS) is a key enzyme in the formation of flavonols [90]. In this study, CHS, CHR, F3H, and CYP93B2_16, involved in flavonoid biosynthesis, were significantly up-regulated under aphid-induced stress, while HCT, DFR, and FLS were down-regulated. At the same time, the expression levels of three CYP subfamily members, CYP93B2_16, CYP93C, and CYP81E9, involved in isoflavone biosynthesis, were significantly increased. CYP81E was up-regulated and down-regulated with the increase in aphid infestation time. The expression levels of 2-hydroxyisoflavanone dehydratase (HIDH), vestitone reductase (VR), and pterocarpan reductase (PTR) were up-regulated with the increase in aphid infestation time. Flavonoid biosynthesis can be associated with isoflavonoid biosynthesis through naringenin and liquiritigenin. In summary, flavonoid biosynthesis and isoflavonoid biosynthesis potentially play important roles in the responses of alfalfa to aphids.

5. Conclusions

In this study, alfalfa plant responses were assessed at the transcriptome and metabolome levels after pea aphid inoculation. Alfalfa was subjected to aphid infestation for different time durations, and the transcriptome and metabolome data were subsequently analyzed. Genome-wide analyses revealed 3458 differentially expressed genes and 358 differential metabolites. A total of 117 DEGs related to alfalfa responses to aphid infestation were screened by WGCNA. By mapping DEGs and DAMs to KEGG pathways, it was found that “phenylpropanoid biosynthesis”, “flavonoid biosynthesis”, and “isoflavonoid biosynthesis” play key roles in the responses of alfalfa to aphid infestation. The results further elucidated the regulatory mechanism of alfalfa under aphid infestation and provided valuable information for breeding new aphid-resistant plant varieties.

Supplementary Materials

The following supporting information can be downloaded at: https://www.mdpi.com/article/10.3390/agriculture14091545/s1, Table S1: Gene expression and annotation of alfalfa after aphid infestation; Table S2: Detailed information on differentially expressed genes in “Wudi” alfalfa after 1 and 4 days of aphid infestation; Table S3: Detailed information of 117 hub genes derived from screening of differentially expressed genes by GS (>0.9) and MM (>0.9); Table S4: Metabolite accumulation and annotation of alfalfa after aphid infestation; Table S5: Detailed information of differentially accumulated metabolites in “Wudi” alfalfa after 1 and 4 days of aphid infestation; Table S6: Differentially expressed genes and differentially accumulated metabolites in the phenylpropanoid biosynthesis pathway in “Wudi” alfalfa after 1 and 4 days of aphid infestation; Table S7: Differentially expressed genes and differentially accumulated metabolites in the flavonoid biosynthesis pathway in “Wudi” alfalfa after 1 and 4 days of aphid infestation; Table S8: Differentially expressed genes and differentially accumulated metabolites in the isoflavonoid biosynthesis pathway in “Wudi” alfalfa after 1 and 4 days of aphid infestation.

Author Contributions

Conceptualization, L.J., L.C. and M.X.; formal analysis, A.Y.; investigation, C.L.; methodology, S.J.; resources, J.Z.; software, Z.D.; supervision, L.C.; validation, X.L.; visualization, Y.G.; writing—original draft, H.L.; writing—review and editing, M.X. and L.C.; data curation, M.X. All authors have read and agreed to the published version of the manuscript.

Funding

This research was funded by the Key Laboratory of Grassland Resources, Ministry of Education Open Topics (RC1900004958).

Institutional Review Board Statement

Not applicable.

Data Availability Statement

The original contributions presented in this study are included in the Supplementary Materials; further inquiries can be directed to the corresponding author.

Conflicts of Interest

The authors declare no conflicts of interest.

References

  1. Al-Farsi, S.M.; Nadaf, S.K.; Al-Sadi, A.M.; Ullah, A.; Farooq, M. Evaluation of indigenous Omani alfalfa landraces for morphology and forage yield under different levels of salt stress. Physiol. Mol. Biol. Plants 2020, 26, 1763–1772. [Google Scholar] [CrossRef]
  2. Ling, L.; An, Y.; Wang, D.; Lu, T.; Du, B.; Shu, Y.; Bai, Y.; Guo, C. Proteomic analysis reveals responsive mechanisms for saline–alkali stress in alfalfa. Plant Physiol. Biochem. 2022, 170, 146–159. [Google Scholar] [CrossRef]
  3. Zhang, C.; Shi, S.; Liu, Z.; Yang, F.; Yin, G. Drought tolerance in alfalfa (Medicago sativa L.) varieties is associated with enhanced antioxidative protection and declined lipid peroxidation. J. Plant Physiol. 2019, 232, 226–240. [Google Scholar] [CrossRef]
  4. Ma, Y.J.; Yang, G.Z.; Duan, R.J.; Li, X.A.; Zeng, S.H.; Yan, Y.J.; Zheng, C.; Hu, Y.M. Transcriptome analysis of alfalfa (Medicago sativa L.) roots reveals overwintering changes in different varieties. Czech J. Genet. Plant Breed. 2024, 60, 97–104. [Google Scholar] [CrossRef]
  5. De Matos, C.d.; Monteiro, L.C.P.; Gallo, S.A.D.; Costa, M.D.; da Silva, A.A. Changes in soil microbial communities modulate interactions between maize and weeds. Plant Soil 2019, 440, 249–264. [Google Scholar] [CrossRef]
  6. Yang, B.; Zhao, Y.; Guo, Z. Research progress and prospect of alfalfa resistance to pathogens and pests. Plants 2022, 11, 2008. [Google Scholar] [CrossRef] [PubMed]
  7. Dan, Z.; Xu, M.; Zhang, L.; Li, H.; Wang, Z.; Guo, Y.; Yang, G.; Li, Z.; Cong, L. First report of alfalfa root rot caused by Trichothecium roseum in China. Plant Dis. 2023, 107, 1941. [Google Scholar] [CrossRef]
  8. Ryalls, J.M.W.; Riegler, M.; Moore, B.D.; Johnson, S.N. Biology and trophic interactions of lucerne aphids. Agric. For. Entomol. 2013, 15, 335–350. [Google Scholar] [CrossRef]
  9. Züst, T.; Agrawal, A.A. Mechanisms and evolution of plant resistance to aphids. Nat. Plants 2012, 2, 15206. [Google Scholar] [CrossRef]
  10. Dedryver, C.A.; Le Ralec, A.; Fabre, F. The conflicting relationships between aphids and men: A review of aphid damage and control strategies. C. R. Biol. 2010, 333, 539–553. [Google Scholar] [CrossRef]
  11. Michaud, J.P. The ecological significance of aphid cornicles and their secretions. Annu. Rev. Entomol. 2022, 67, 65–81. [Google Scholar] [CrossRef]
  12. Wang, X.W.; Blanc, S. Insect transmission of plant single-stranded DNA viruses. Annu. Rev. Entomol. 2021, 66, 389–405. [Google Scholar] [CrossRef] [PubMed]
  13. Gallet, R.; Michalakis, Y.; Blanc, S. Vector-transmission of plant viruses and constraints imposed by virus-vector interactions. Curr. Opin. Virol. 2018, 33, 144–150. [Google Scholar] [CrossRef]
  14. Carr, J.P.; Tungadi, T.; Donnelly, R.; Bravo-Cazar, A.; Rhee, S.J.; Watt, L.G.; Mutuku, J.M.; Wamonje, F.O.; Murphy, A.M.; Arinaitwe, W.; et al. Modelling and manipulation of aphid-mediated spread of non-persistently transmitted viruses. Virus Res. 2020, 277, 197845. [Google Scholar] [CrossRef] [PubMed]
  15. Mondal, S.; Wenninger, E.J.; Hutchinson, P.J.S.; Whitworth, J.L.; Shrestha, D.; Eigenbrode, S.D.; Bosque-Pérez, N.A.; Snyder, W.E. Responses of aphid vectors of potato leaf roll virus to potato varieties. Plant Dis. 2017, 101, 1812–1818. [Google Scholar] [CrossRef] [PubMed]
  16. Lojek, J.S.; Orlob, G.B. Aphid transmission of tobacco mosaic virus. Science 1969, 164, 1407–1408. [Google Scholar] [CrossRef]
  17. Irwin, M.E.; Kampmeier, G.; Weisser, W. Aphid movement: Process and consequences. In Aphids as Crop Pests; Van Emden, H.F., Harrington, R., Eds.; CABI: Wallingford, UK, 2007; pp. 153–186. [Google Scholar]
  18. Marshall, S.A. Insects: Their Natural History and Diversity: With a Photographic Guide to Insects of Eastern North America; Firefly Books Inc.: Buffalo, NY, USA, 2007; p. 736. [Google Scholar]
  19. Bass, C.; Nauen, R. The molecular mechanisms of insecticide resistance in aphid crop pests. Insect Biochem. Mol. Biol. 2023, 156, 103937. [Google Scholar] [CrossRef] [PubMed]
  20. Loxdale, H.D.; Balog, A. Aphid specialism as an example of ecological-evolutionary divergence. Biol. Rev. Camb. Philos. Soc. 2018, 93, 642–657. [Google Scholar] [CrossRef]
  21. Howe, G.A.; Jander, G. Plant immunity to insect herbivores. Annu. Rev. Plant Biol. 2008, 59, 41–66. [Google Scholar] [CrossRef]
  22. Fürstenberg-Hägg, J.; Zagrobelny, M.; Bak, S. Plant defense against insect herbivores. Int. J. Mol. Sci. 2013, 14, 10242–10297. [Google Scholar] [CrossRef]
  23. Sidhu, J.K.; Stout, M.J.; Blouin, D.C.; Datnoff, L.E. Effect of silicon soil amendment on performance of sugarcane borer, Diatraea saccharalis (Lepidoptera: Crambidae) on rice. Bull. Entomol. Res. 2013, 103, 656–664. [Google Scholar] [CrossRef] [PubMed]
  24. Aljbory, Z.; Chen, M.S. Indirect plant defense against insect herbivores: A review. Insect Sci. 2018, 25, 2–23. [Google Scholar] [CrossRef]
  25. Plett, J.M.; Wilkins, O.; Campbell, M.M.; Ralph, S.G.; Regan, S. Endogenous overexpression of Populus MYB186 increases trichome density, improves insect pest resistance, and impacts plant growth. Plant J. 2010, 64, 419–432. [Google Scholar] [CrossRef] [PubMed]
  26. War, A.R.; Paulraj, M.G.; Ahmad, T.; Buhroo, A.A.; Hussain, B.; Ignacimuthu, S.; Sharma, H.C. Mechanisms of plant defense against insect herbivores. Plant Signal. Behav. 2012, 7, 1306–1320. [Google Scholar] [CrossRef]
  27. Lou, Y.; Baldwin, I.T. Manduca sexta recognition and resistance among allopolyploid Nicotiana host plants. Proc. Natl. Acad. Sci. USA 2003, 100, 14581–14586. [Google Scholar] [CrossRef] [PubMed]
  28. Chen, H.; Wilkerson, C.G.; Kuchar, J.A.; Phinney, B.S.; Howe, G.A. Jasmonate-inducible plant enzymes degrade essential amino acids in the herbivore midgut. Proc. Natl. Acad. Sci. USA 2005, 102, 19237–19242. [Google Scholar] [CrossRef]
  29. Divekar, P.A.; Narayana, S.; Divekar, B.A.; Kumar, R.; Gadratagi, B.G.; Ray, A.; Singh, A.K.; Rani, V.; Singh, V.; Singh, A.K.; et al. Plant secondary metabolites as defense tools against herbivores for sustainable crop protection. Int. J. Mol. Sci. 2022, 23, 2690. [Google Scholar] [CrossRef]
  30. Dicke, M.; Baldwin, I.T. The evolutionary context for herbivore-induced plant volatiles: Beyond the ‘cry for help’. Trends Plant Sci. 2010, 15, 167–175. [Google Scholar] [CrossRef]
  31. Chen, L.; He, F.; Long, R.; Zhang, F.; Li, M.; Wang, Z.; Kang, J.; Yang, Q. A global alfalfa diversity panel reveals genomic selection signatures in Chinese varieties and genomic associations with root development. J. Integr. Plant Biol. 2021, 63, 1937–1951. [Google Scholar] [CrossRef]
  32. Sun, Q.Z.; Xu, L.J.; Tang, X.J.; Ma, J.T.; Wang, D.; Li, D.; Liu, Q.; Tao, Y.; Li, F. Investigating the origin of the Chinese name for alfalfa. IOP Conf. Ser. Earth Environ. Sci. 2017, 57, 012053. [Google Scholar] [CrossRef]
  33. Mei, L.; Zhang, N.; Wei, Q.; Cao, Y.; Li, D.; Cui, G. Alfalfa modified the effects of degraded black soil cultivated land on the soil microbial community. Front Plant Sci. 2022, 13, 938187. [Google Scholar] [CrossRef] [PubMed]
  34. Peng, Y.L.; Gao, Z.W.; Gao, Y.; Liu, G.F.; Sheng, L.X.; Wang, D.L. Eco-physiological characteristics of alfalfa seedlings in response to various mixed salt-alkaline stresses. J. Integr. Plant Biol. 2008, 50, 29–39. [Google Scholar] [CrossRef]
  35. Brogdon, W.G.; McAllister, J.C. Insecticide resistance and vector control. Emerg. Infect. Dis. 1998, 4, 605–613. [Google Scholar] [CrossRef] [PubMed]
  36. Guo, K.; Yang, P.; Chen, J.; Lu, H.; Cui, F. Transcriptomic responses of three aphid species to chemical insecticide stress. Sci. China Life Sci. 2017, 60, 931–934. [Google Scholar] [CrossRef]
  37. Liu, C.; Pan, J.; Yin, Z.G.; Feng, T.; Zhao, J.; Dong, X.; Zhou, Y. Integrated transcriptome and metabolome analyses revealed regulatory mechanisms of flavonoid biosynthesis in Radix Ardisia. PeerJ 2022, 10, e13670. [Google Scholar] [CrossRef]
  38. Modi, A.; Vai, S.; Caramelli, D.; Lari, M. The illumina sequencing protocol and the NovaSeq 6000 system. Methods Mol. Biol. 2021, 2242, 15–42. [Google Scholar]
  39. Chen, H.; Zeng, Y.; Yang, Y.; Huang, L.; Tang, B.; Zhang, H.; Hao, F.; Liu, W.; Li, Y.; Liu, Y.; et al. Allele-aware chromosome-level genome assembly and efficient transgene-free genome editing for the autotetraploid cultivated alfalfa. Nat. Commun. 2020, 11, 2494. [Google Scholar] [CrossRef]
  40. Love, M.I.; Huber, W.; Anders, S. Moderated estimation of fold change and dispersion for RNA-seq data with DESeq2. Genome Biol. 2014, 15, 550. [Google Scholar] [CrossRef] [PubMed]
  41. Yang, L.; Wang, P.; Chen, J. 2dGBH: Two-dimensional group Benjamini-Hochberg procedure for false discovery rate control in two-way multiple testing of genomic data. Bioinformatics 2024, 40, btae035. [Google Scholar] [CrossRef]
  42. Young, M.D.; Wakefield, M.J.; Smyth, G.K.; Oshlack, A. Gene ontology analysis for RNA-seq: Accounting for selection bias. Genome Biol. 2010, 11, R14. [Google Scholar] [CrossRef]
  43. Mao, X.; Cai, T.; Olyarchuk, J.G.; Wei, L. Automated genome annotation and pathway identification using the KEGG Orthology (KO) as a controlled vocabulary. Bioinformatics 2005, 21, 3787–3793. [Google Scholar] [CrossRef] [PubMed]
  44. Li, Z.; An, M.; Hong, D.; Chang, D.; Wang, K.; Fan, H. Transcriptomic and metabolomic analyses reveal the differential regulatory mechanisms of compound material on the responses of Brassica campestris to saline and alkaline stresses. Front. Plant Sci. 2022, 13, 820540. [Google Scholar] [CrossRef]
  45. Wang, J.; Zhang, T.; Shen, X.; Liu, J.; Zhao, D.; Sun, Y.; Wang, L.; Liu, Y.; Gong, X.; Liu, Y.; et al. Serum metabolomics for early diagnosis of esophageal squamous cell carcinoma by UHPLC-QTOF/MS. Metabolomics 2016, 12, 116. [Google Scholar] [CrossRef]
  46. Yang, C.; Wu, P.; Yao, X.; Sheng, Y.; Zhang, C.; Lin, P.; Wang, K. Integrated transcriptome and metabolome analysis reveals key metabolites involved in Camellia oleifera defense against anthracnose. Int. J. Mol. Sci. 2022, 23, 536. [Google Scholar] [CrossRef]
  47. Zhang, Z.; Chen, Q.; Tan, Y.; Shuang, S.; Dai, R.; Jiang, X.; Temuer, B. Combined transcriptome and metabolome analysis of alfalfa response to thrips infection. Genes 2021, 12, 1967. [Google Scholar] [CrossRef] [PubMed]
  48. Łukasik, I.; Wołoch, A.; Sytykiewicz, H.; Sprawka, I.; Goławska, S. Changes in the content of thiol compounds and the activity of glutathione s-transferase in maize seedlings in response to a rose-grass aphid infestation. PLoS ONE 2019, 14, e0221160. [Google Scholar] [CrossRef]
  49. Dampc, J.; Kula-Maximenko, M.; Molon, M.; Durak, R. Enzymatic defense response of apple aphid aphis pomi to increased temperature. Insects 2020, 11, 436. [Google Scholar] [CrossRef]
  50. Gao, P.; Zhang, H.; Yan, H.; Zhou, N.; Yan, B.; Fan, Y.; Tang, K.; Qiu, X. Transcriptomic and metabolomic changes triggered by Macrosiphum rosivorum in rose (Rosa longicuspis). BMC Genom. 2021, 22, 885. [Google Scholar] [CrossRef]
  51. Sytykiewicz, H. Expression patterns of genes involved in ascorbate-glutathione cycle in aphid-infested maize (Zea mays L.) Seedlings. Int. J. Mol. Sci. 2016, 17, 268. [Google Scholar] [CrossRef]
  52. Verma, V.; Ravindran, P.; Kumar, P.P. Plant hormone-mediated regulation of stress responses. BMC Plant Biol. 2016, 16, 86. [Google Scholar] [CrossRef]
  53. Bari, R.; Jones, J.D. Role of plant hormones in plant defence responses. Plant Mol. Biol. 2009, 69, 473–488. [Google Scholar] [CrossRef] [PubMed]
  54. Cavaiuolo, M.; Cocetta, G.; Ferrante, A. The antioxidants changes in ornamental flowers during development and senescence. Antioxidants 2013, 2, 132–155. [Google Scholar] [CrossRef]
  55. Iwashina, T. Flavonoid function and activity to plants and other organisms. Biol. Sci. Space 2003, 17, 24–44. [Google Scholar] [CrossRef]
  56. Danquah, A.; de Zelicourt, A.; Colcombet, J.; Hirt, H. The role of ABA and MAPK signaling pathways in plant abiotic stress responses. Biotechnol. Adv. 2014, 32, 40–52. [Google Scholar] [CrossRef] [PubMed]
  57. Hettenhausen, C.; Schuman, M.C.; Wu, J. MAPK signaling: A key element in plant defense response to insects. Insect Sci. 2015, 22, 157–164. [Google Scholar] [CrossRef]
  58. Rodriguez, M.C.; Petersen, M.; Mundy, J. Mitogen-activated protein kinase signaling in plants. Annu. Rev. Plant Biol. 2010, 61, 621–649. [Google Scholar]
  59. Zhang, B.; Horvath, S. A general framework for weighted gene co-expression network analysis. Stat. Appl. Genet. Mol. Biol. 2005, 4, 17. [Google Scholar] [CrossRef] [PubMed]
  60. El-Sharkawy, I.; Liang, D.; Xu, K. Transcriptome analysis of an apple (Malus × domestica) yellow fruit somatic mutation identifies a gene network module highly associated with anthocyanin and epigenetic regulation. J. Exp. Bot. 2015, 66, 7359–7376. [Google Scholar] [CrossRef]
  61. Wang, S.; Li, Y.; He, L.; Yang, J.; Fernie, A.R.; Luo, J. Natural variance at the interface of plant primary and specialized metabolism. Curr. Opin. Plant Biol. 2022, 67, 102201. [Google Scholar] [CrossRef]
  62. Fernie, A.R.; Pichersky, E. Focus issue on metabolism: Metabolites, metabolites everywhere. Plant Physiol. 2015, 169, 1421–1423. [Google Scholar] [CrossRef]
  63. Zhou, S.; Lou, Y.R.; Tzin, V.; Jander, G. Alteration of plant primary metabolism in response to insect herbivory. Plant Physiol. 2015, 169, 1488–1498. [Google Scholar] [CrossRef] [PubMed]
  64. O’Connell, T.C. ‘Trophic’ and ‘source’ amino acids in trophic estimation: A likely metabolic explanation. Oecologia 2017, 184, 317–326. [Google Scholar] [CrossRef] [PubMed]
  65. Tegeder, M. Transporters for amino acids in plant cells: Some functions and many unknowns. Curr. Opin. Plant Biol. 2012, 15, 315–321. [Google Scholar] [CrossRef]
  66. Erb, M.; Kliebenstein, D.J. Plant secondary metabolites as defenses, regulators, and primary metabolites: The blurred functional trichotomy. Plant Physiol. 2020, 184, 39–52. [Google Scholar] [CrossRef]
  67. Jamwal, K.; Bhattacharya, S.; Puri, S. Plant growth regulator mediated consequences of secondary metabolites in medicinal plants. J. Appl. Res. Med. Aromat. Plants 2018, 9, 26–38. [Google Scholar] [CrossRef]
  68. Al-Khayri, J.M.; Rashmi, R.; Toppo, V.; Chole, P.B.; Banadka, A.; Sudheer, W.N.; Nagella, P.; Shehata, W.F.; Al-Mssallem, M.Q.; Alessa, F.M.; et al. Plant secondary metabolites: The weapons for biotic stress management. Metabolites 2023, 13, 716. [Google Scholar] [CrossRef]
  69. Li, X.; Ouyang, X.; Zhang, Z.; He, L.; Wang, Y.; Li, Y.; Zhao, J.; Chen, Z.; Wang, C.; Ding, L.; et al. Over-expression of the red plant gene R1 enhances anthocyanin production and resistance to bollworm and spider mite in cotton. Mol. Genet. Genom. 2019, 294, 469–478. [Google Scholar] [CrossRef] [PubMed]
  70. Tanaka, Y.; Sasaki, N.; Ohmiya, A. Biosynthesis of plant pigments: Anthocyanins, betalains and carotenoids. Plant J. 2008, 54, 733–749. [Google Scholar] [CrossRef]
  71. Deng, Z.; Zhang, Y.; Fang, L.; Zhang, M.; Wang, L.; Ni, X.; Li, X. Identification of the flavone-inducible counter-defense genes and their cis-elements in Helicoverpa armigera. Toxins 2023, 15, 365. [Google Scholar] [CrossRef]
  72. Lane, G.A.; Sutherland, O.R.; Skipp, R.A. Isoflavonoids as insect feeding deterrents and antifungal components from root of Lupinus angustifolius. J. Chem. Ecol. 1987, 13, 771–783. [Google Scholar] [CrossRef]
  73. Vogt, T. Phenylpropanoid biosynthesis. Mol. Plant 2010, 3, 2–20. [Google Scholar] [CrossRef]
  74. La Camera, S.; Gouzerh, G.; Dhondt, S.; Hoffmann, L.; Fritig, B.; Legrand, M.; Heitz, T. Metabolic reprogramming in plant innate immunity: The contributions of phenylpropanoid and oxylipin pathways. Immunol. Rev. 2004, 198, 267–284. [Google Scholar] [CrossRef] [PubMed]
  75. Chaman, M.E.; Copaja, S.V.; Argandoña, V.H. Relationships between salicylic acid content, phenylalanine ammonia-lyase (PAL) activity, and resistance of barley to aphid infestation. J. Agric. Food Chem. 2003, 51, 2227–2231. [Google Scholar] [CrossRef] [PubMed]
  76. Lavhale, S.G.; Kalunke, R.M.; Giri, A.P. Structural, functional and evolutionary diversity of 4-coumarate-CoA ligase in plants. Planta 2018, 248, 1063–1078. [Google Scholar] [CrossRef]
  77. Lee, D.; Douglas, C.J. Two divergent members of a tobacco 4-coumarate: Coenzyme A ligase (4CL) gene family. cDNA structure, gene inheritance and expression, and properties of recombinant proteins. Plant Physiol. 1996, 112, 193–205. [Google Scholar] [CrossRef]
  78. Ehlting, J.; Büttner, D.; Wang, Q.; Douglas, C.J.; Somssich, I.E.; Kombrink, E. Three 4-coumarate: Coenzyme A ligases in Arabidopsis thaliana represent two evolutionarily divergent classes in angiosperms. Plant J. 1999, 19, 9–20. [Google Scholar] [CrossRef] [PubMed]
  79. Humphreys, J.M.; Chapple, C. Rewriting the lignin roadmap. Curr. Opin. Plant Biol. 2002, 5, 224–229. [Google Scholar] [CrossRef]
  80. Wang, M.; Wang, Y.; Li, X.; Zhang, Y.; Chen, X.; Liu, J.; Qiua, Y.; Wang, A. Integration of metabolomics and transcriptomics reveals the regulation mechanism of the phenylpropanoid biosynthesis pathway in insect resistance traits in Solanum habrochaites. Hortic. Res. 2024, 11, 277. [Google Scholar] [CrossRef]
  81. Kaur, S.; Tiwar, V.; Kumari, A.; Chaudhary, E.; Sharma, A.; Ali, U.; Garg, M. Protective and defensive role of anthocyanins under plant abiotic and biotic stresses: An emerging application in sustainable agriculture. J. Biotechnol. 2023, 361, 12–29. [Google Scholar] [CrossRef]
  82. Zhuang, W.B.; Li, Y.H.; Shu, X.C.; Pu, Y.T.; Wang, X.J.; Wang, T.; Wang, Z. The classification, molecular structure and biological biosynthesis of flavonoids, and their roles in biotic and abiotic stresses. Molecules 2023, 28, 3599. [Google Scholar] [CrossRef] [PubMed]
  83. Singh, P.; Arif, Y.; Bajguz, A.; Hayat, S. The role of quercetin in plants. Plant Physiol. Biochem. 2021, 166, 10–19. [Google Scholar] [CrossRef] [PubMed]
  84. Lewinsohn, E.; Britsch, L.; Mazu, Y.; Gressel, J. Flavanone glycoside biosynthesis in citrus: Chalcone synthase, UDP-Glucose: Flavanone-7-o-glucosyl-transferase and -rhamnosyl-transferase activities in cell-free extracts. Plant Physiol. 1989, 91, 1323–1328. [Google Scholar] [CrossRef] [PubMed]
  85. Richard, S.; Lapointe, G.; Rutledge, R.G.; Séguin, A. Induction of chalcone synthase expression in white spruce by wounding and jasmonate. Plant Cell Physiol. 2000, 41, 982–987. [Google Scholar] [CrossRef] [PubMed]
  86. Fliegmann, J.; Furtwängler, K.; Malterer, G.; Cantarello, C.; Schüler, G.; Ebel, J.; Mithöfer, A. Flavone synthase II (CYP93B16) from soybean (Glycine max L.). Phytochemistry 2010, 71, 508–514. [Google Scholar] [CrossRef]
  87. Schuler, M.A. The role of cytochrome P450 monooxygenases in plant-insect interactions. Plant Physiol. 1996, 112, 1411–1419. [Google Scholar] [CrossRef]
  88. Gu, L.; Chen, P.; Yu, S. The cytochrome P450 gene GhCYP94C1 is involved in drought stress in upland cotton (Gossypium hirsutum L.). Czech J. Genet. Plant Breed. 2023, 59, 189–195. [Google Scholar] [CrossRef]
  89. Diharce, J.; Bignon, E.; Fiorucci, S.; Antonczak, S. Exploring dihydroflavonol-4-reductase reactivity and selectivity by QM/MM-MD simulations. Chembiochem 2022, 23, e202100553. [Google Scholar] [CrossRef]
  90. Schilbert, H.M.; Schöne, M.; Baier, T.; Busche, M.; Viehöver, P.; Weisshaar, B.; Holtgräwe, D. Characterization of the brassica napus flavonol synthase gene family reveals bifunctional flavonol synthases. Front. Plant Sci. 2021, 12, 733762. [Google Scholar] [CrossRef]
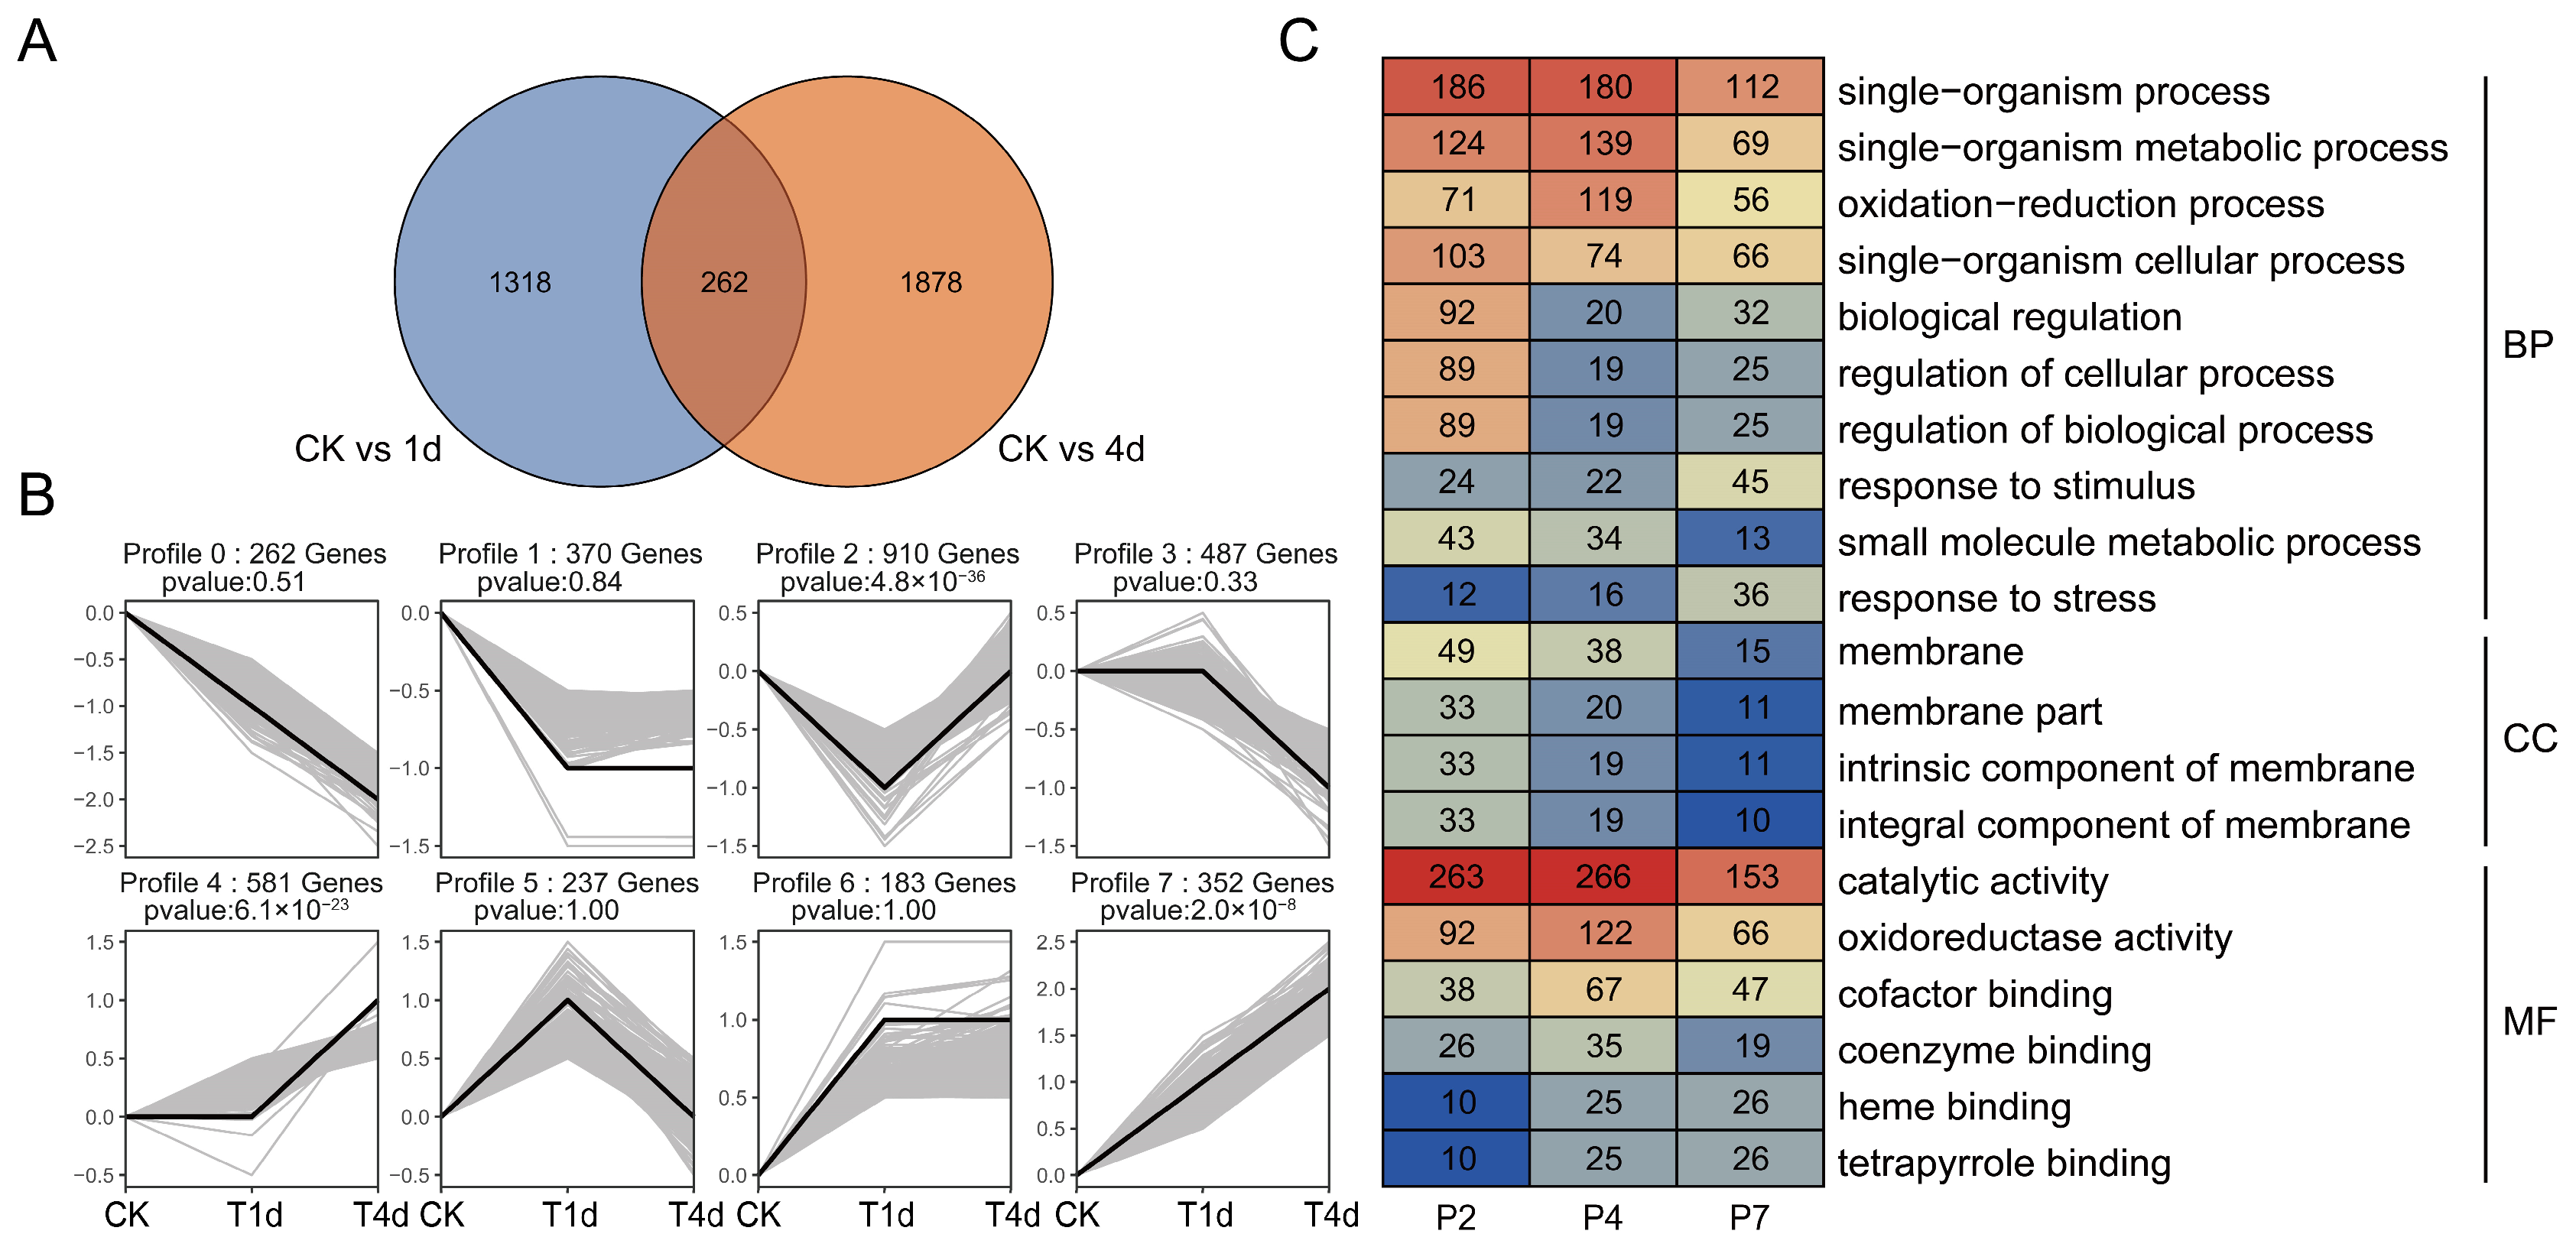
Figure 1. DEGs of alfalfa under different aphid infestation timepoints. (A) Venn diagram of DEGs under different aphid infestation timepoints. (B) Expression trend analysis of DEGs. Black lines represent template trends, gray lines represent gene expression trends. (C) GO analysis of DEGs that exhibited significant expression trends. BP: biological process. CC: cellular component. MF: molecular function.
Agriculture 14 01545 g001
Figure 2. KEGG analysis of DEGs. (A) KEGG analysis of DEGs in CK vs. T1d. (B) KEGG analysis of DEGs in CK vs. T4d.
Agriculture 14 01545 g002
Figure 3. WGCNA of alfalfa transcriptome in response to aphid infestation (A) Cluster dendrogram. Cluster dendrogram of the top 10,000 genes with the greatest variation among all genes. Each vertical line in the dendrogram represents a gene. All the genes are clustered into 16 modules, marked with different colors. (B) Heatmap illustrating module correlations. (C) Correlation heatmap between 16 modules and treatment durations. The upper numbers in each table correspond to the correlations, and the lower parentheses indicate the significance. Positive and negative correlations are indicated in purple and red, respectively. (D). Venn diagram illustrating the hub genes. MM: module membership. GS: gene significance.
Agriculture 14 01545 g003
Figure 4. DAMs of alfalfa under different aphid infestation timepoints. (A) DAM Venn diagram analysis in CK vs. T1d and CK vs. T4d. (B) Heatmap of the 23 DAMs shared in two infestation time points. (C) Accumulation trend analysis of DAMs. Black lines represent template trends, gray lines represent gene expression trends.
Agriculture 14 01545 g004
Figure 5. KEGG analysis of DAMs. (A) KEGG analysis of DAMs in CK vs. T1d. (B) KEGG analysis of DAMs in CK vs. T4d.
Agriculture 14 01545 g005
Figure 6. The phenylpropanoid biosynthesis pathway. PAL (lightskyblue): phenylalanine ammonia-lyase. F6H (deeppink): feruloyl-CoA 6-hydroxylase. TOGT1 (wheat): scopoletin glucosyltransferase. HCT (red): shikimate O-hydroxycinnamoyltransferase. 4CL (pink): 4-coumarate-CoA ligase. F5H (dodgerblue): ferulate-5-hydroxylase. CCR (lightgreen): cinnamoyl-CoA reductase. CAD (lightyellow): cinnamyl-alcohol dehydrogenase. COMT (orange): caffeic acid 3-O-methyltransferase. POD (deepgreen): Peroxidase. BgIB (tan): β-glucosidase.
Agriculture 14 01545 g006
Figure 7. The flavonoid biosynthesis pathway. CHS (lightskyblue): chalcone synthase. CHR (dodgerblue): chalcone reductase. F3H (yellow): naringenin 3-dioxygenase. DFR (darkorange): flavanone 4-reductase. HCT (red): shikimate O-hydroxycinnamoyltransferase. FLS (deeppink): flavonol synthase. CYP93B2_16 (lightgreen): flavone synthase II.
Agriculture 14 01545 g007
Figure 8. Isoflavonoid biosynthesis pathway. CYP93B2_16 (pink): flavone synthase II. CYP93C (orange): 2-hydroxyisoflavanone synthase. HIDH (green): 2-hydroxyisoflavanone dehydratase. CYP81E9 (blue): isoflavone 3’-hydroxylase. VR (tan): vestitone reductase. PTR (grey): pterocarpan reductase. IF7MAT (yellow): isoflavone 7-O-glucoside-6”-O-malonyltransferase. CYP81E (purple): 4’-methoxyisoflavone 2’-hydroxylase.
Agriculture 14 01545 g008
Disclaimer/Publisher’s Note: The statements, opinions and data contained in all publications are solely those of the individual author(s) and contributor(s) and not of MDPI and/or the editor(s). MDPI and/or the editor(s) disclaim responsibility for any injury to people or property resulting from any ideas, methods, instructions or products referred to in the content.