Abstract
In response to the current low work efficiency of soil ridge-working machinery, as well as its poor stability, passability, and adaptability, this paper designs an independent leg-type working platform that can autonomously adjust its vehicle attitude through LiDAR scanning in a soil ridge-working environment. The platform, in terms of its mechanism and structural design, adopts dual parallelogram mechanisms, dual lead screw mechanisms, and independent column leg mechanisms, with a maximum adjustable ground clearance of 107 mm and a maximum wheelbase adjustment of 150 mm. A gyroscope is mounted at the center of the platform for attitude adjustment, ensuring the accurate data collection of the ultrasonic ranging module. Moreover, the platform adopts an adaptive adjustment method based on vehicle attitude and soil ridge shape parameters, obtaining soil ridge parameters through LiDAR and combining ultrasonic ranging module data with stepper motor pulse signals to obtain the absolute vehicle attitude parameters, using first and second linear regression methods to adjust the vehicle attitude and other working parameters. A prototype was also created, and the test data from the soil obtained through experiments show that, after leveling with the gyroscope leveling algorithm, the average value of the pitch angle is up to 0.6154°, and the average value of the roll angle is up to 0.9989°, with the maximum variance of the pitch angle being 0.0474° and the maximum variance of the tilt angle being 0.1320°. After the ultrasonic ranging module data are filtered by the Kalman filter, the maximum variance is 0.0304, and after applying the final fusion algorithm, the maximum variance is only 0.0085. The LiDAR measurement width value deviates from the actual width value by no more than 1.0 cm, and the LiDAR measurement height value deviates from the actual height value by no more than 1.0 cm. The platform’s actual adjusted width deviates from the actual soil ridge width by no more than 2.0 cm, and the platform’s actual adjusted height deviates from the actual soil ridge height by no more than 1.2 cm. This platform can improve the passability, adaptability, and stability of agricultural machinery in soil ridge work and provide technical references for subsequent related research.
1. Introduction
Most of the arable land in Southern China is located in the hilly and mountainous areas with complex terrain and large changes in slope, which makes the agricultural mechanization rate low and the land leveling degree low. Soil ridge planting has the advantages of regulating the soil moisture status in the root zone of plants and improving the utilization rate of soil nitrogen, among others [1,2,3,4], which has a good effect on increasing the yield and efficiency of crops and is widely used in the field cultivation of vegetables, cereals, and tubers [5,6,7]. However, the current work efficiency of agricultural machinery on soil ridges in the hilly areas of the south is low, and the passability, stability, and adaptability are poor. Therefore, it is of great significance to design a working platform that can autonomously level the vehicle and adjust the vehicle parameters adaptively in the soil ridge-working environment.
The platform adopts an independent leg-type structure, and the leg-type chassis has the advantages of both a wheel-type chassis and a legged-type chassis. It has the advantages of high mobility efficiency of the wheel-type chassis, and at the same time, it has strong terrain adaptability and obstacle-crossing performance like the legged-type chassis [8,9,10]. The current research on leveling based on the independent leg chassis mainly focuses on the relationship between the platform and the geometric parameters of the hydraulic cylinder, leveling by adjusting the stroke of the hydraulic cylinder [11,12,13]. At the same time, to improve the leveling accuracy, scholars will use more sensors to obtain information, establish a spatial attitude model, and use the PID algorithm when researching leveling, such as Akira Mizushima and others who have developed a low-cost attitude sensor for agricultural vehicles composed of three vibrating gyroscopes and two inclinometers, the technology of which will help develop advanced agricultural applications [2,14,15,16,17,18]. Laser radar detection methods are known for their fast measurement speed, compact space requirements, comprehensive information acquisition, and high detection accuracy, which have led to their widespread application in the field of non-contact measurement. Korbinian T. et al. designed a furrow recognition system based on three-dimensional light detection and ranging (LiDAR) data, which detect the edges of furrows in each layer by identifying the characteristic steps and applies Euclidean clustering and linear least squares line fitting to approximate the unplowed surface. Subsequently, redundant branches are merged into a guiding line through RANSAC line fitting, and experiments have proven its accuracy and stability under actual field conditions [19]. Shezhou Luo et al. used an unmanned aerial vehicle (UAV) LiDAR system to acquire vegetation structure information rapidly, accurately, and at a low cost, based on a LiDAR-derived canopy height model and LiDAR-based variables, and successfully estimated the heights of corn and soybeans [20]. Wenwu Hu et al. used LiDAR for data collection to construct a three-dimensional point cloud image and designed a clustering algorithm based on slope virtualization, iterative regional clustering, and linearized mean shift clustering. The analysis of the point cloud data collected from actual paddy fields showed that the parallelism between the measured trajectory line and the actual trajectory was of less than 45 mm within a forward distance of 2 to 3 m, and the maximum deviation at the median position of 2.5 m was controlled within 7 mm, with experiments verifying the good performance of the algorithm [21]. Manpreet Singh et al. conducted field research using a new type of automatic terrain measurement based on laser scanning and found that it is more precise and cost-effective than traditional manual terrain measurements. The newly developed automatic measurement system is superior to traditional manual measurement methods in terms of land-leveling accuracy and economic benefits [22]. Lili Yang et al. proposed a method for the real-time extraction of free space on field roads for the autonomous driving of agricultural machinery based on LiDAR. This method is based on the low curvature of road free space formed by line segments. The proposed RFS extraction method includes a road point cloud correction module based on the sudden change in the local distance ratio (dratio) around the boundary and a boundary point smoothing strategy based on the small variability in the y-axis distance [23]. Therefore, this platform uses LiDAR scanning data for the calculation of the soil ridge parameters.
Currently, ultrasonic sensors are widely accepted for quantifying plant heights. For example, Thomas Fricke et al. measured the height of alfalfa using ultrasonic distance sensors and combined ultrasonic height with vegetation indices to overcome the limitations of ultrasonic sensors in obtaining the actual canopy structure [24]. Qamar Uz Zamana et al. developed an automatic prototype variable rate (VR) sprayer that relies on ultrasonic sensors to provide real-time weed detection information for the correct allocation of agricultural chemicals to weeds. Tests have shown that the ultrasonic sensor’s ranging function is responsive and accurate [25]. Thus, the platform uses an ultrasonic ranging module for measuring the platform’s ground clearance.
Through the above analysis, although there has been some research on independent leg-type chassis leveling, there is still a gap in the research direction of platform self-adaptive adjustment based on comprehensive soil ridge parameters. This paper designs an independent leg-type working platform that can autonomously adjust the vehicle posture on soil ridges through LiDAR scanning in the soil ridge working environment. The platform is equipped with a gyroscope at its center for posture adjustment, ensuring the accurate data collection of the ultrasonic ranging module. It adopts a self-adaptive adjustment method based on vehicle posture and the soil ridge shape parameters, obtains soil ridge parameters through LiDAR, and combines ultrasonic ranging module data with stepper motor pulse signals to obtain the absolute parameters of the machine posture. It uses the first and second linear regression methods to adjust the machine posture and other working parameters. Experiments have verified that the platform’s LiDAR scanning data are relatively accurate and can be used to adjust the vehicle parameters. The platform can meet the working requirements on soil ridges and help in the development of agricultural mechanization in China’s hilly and mountainous areas.
2. Working Principle
2.1. Structure and Principle of the Whole Machine
The platform mainly consists of dual parallelogram linkage mechanisms, electric push rods, independent legs, LiDAR, gyroscopes, and ultrasonic ranging modules. As shown in Figure 1, one end of the dual parallelogram linkage mechanism is articulated with the leg through a leg fixed seat, and the other end is articulated with the chassis through a chassis fixed seat. The electric push rod is installed in the middle of the parallelogram mechanism, with the lower end articulated with the chassis through a fixed support and the upper end articulated with the fixed support in the middle of the parallelogram mechanism. Table 1 lists the parameters of the machine.
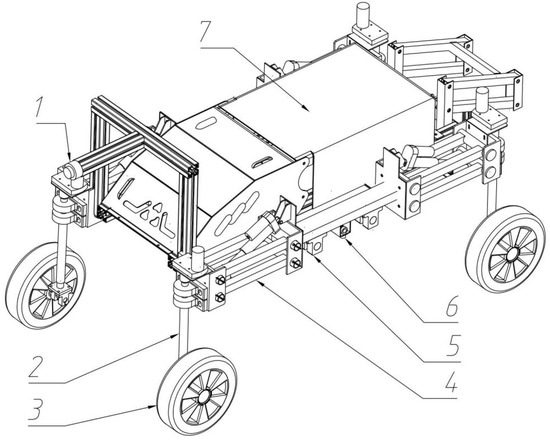
Figure 1.
Axonometric drawing of the independent leg-type adaptive platform. 1. LiDAR; 2. steering leg; 3. wheel hub motor; 4. parallelogram linkage mechanism; 5. double lead screw mechanism; 6. ultrasonic ranging module; 7. gyroscope.

Table 1.
Whole machine parameters.
The platform uses a dual parallelogram linkage mechanism for ground clearance adjustment. The majority of the machine’s forces are on this mechanism, which has two working states, as shown in Figure 2. The left side of this dual parallelogram linkage mechanism is connected to a fixed independent steering mechanism, and the right side is connected to the working platform. Thus, the solid line represents the highest ground clearance state, where F1 represents the force when the ground clearance is at its highest, and it is clear that F1 = G. F2 represents the force when the ground clearance is at its lowest, so F2 = Gcos45.
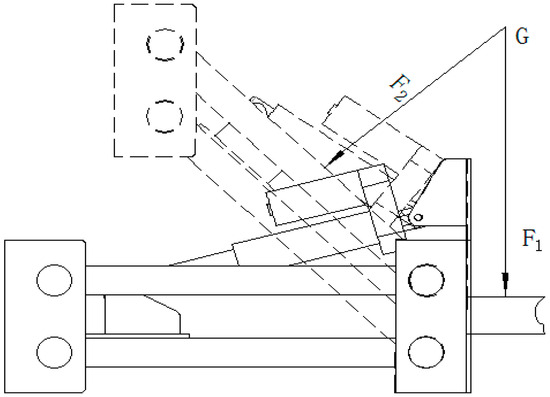
Figure 2.
Dual parallelogram linkage mechanism. G for gravity; F1 indicates the force on the connecting rod when the platform clearance is maximum; F2 represents the force on the connecting rod when the platform clearance is at its minimum.
The platform’s independent leg mechanism includes a steering servo module, a coupler, a steering shaft, and a wheel hub motor, which can be driven and steered independently, as shown in Figure 3.

Figure 3.
Independent pillar leg mechanism.
The platform uses a dual lead screw mechanism to achieve symmetrical wheelbase adjustment. The lead screw mechanism is composed of a lead screw, a lead screw nut, and bearings. To ensure the consistent adjustment of the wheelbase on both sides, a gear transmission is used to move both lead screws, ensuring that the movement distance of both sides is consistent, as shown in Figure 4.
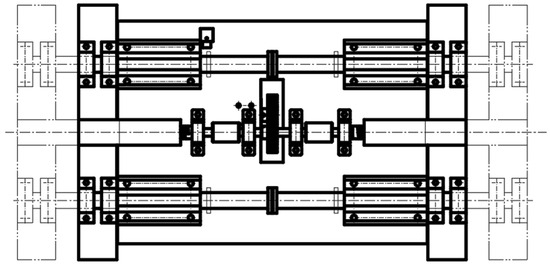
Figure 4.
Wheelbase adjustment mechanism. The thick solid line represents the state of the platform when the wheelbase is at its shortest; The thin dotted line represents the state when the platform wheelbase is widest.
2.2. Control Principle of the Whole Machine
The overall software and hardware architecture of the platform’s control system is designed with an object-oriented approach, and the communication methods and functions implemented are as follows: The main control system with the STM32F103 microcontroller produced by STMicroelectronics Group as the control core issues pulse width modulation (PWM) pulse signals to drive brushless motors, steering servos, and stepper motors, achieving the functions of device movement, steering, and chassis width adjustment. The universal asynchronous receiver-transmitter (UART) communication method is used to obtain data from the gyroscope module and the LiDAR module, and the platform’s automatic leveling and soil ridge plane data measurement functions are realized through self-developed algorithms. The chassis height adjustment system mainly includes an electric push rod device, a LiDAR module, and a HC-SR04 module. During the platform’s movement, the LiDAR module obtains the height data of the platform from the soil ridge, and the HC-SR04 module obtains the data of the platform chassis from the soil ridge ditch, which are fed back to the main control chip. The main control chip then issues command signals to control the driver to drive the electric push rod device, thereby controlling the platform to always maintain a reasonable height and vehicle attitude, as shown in Figure 5.
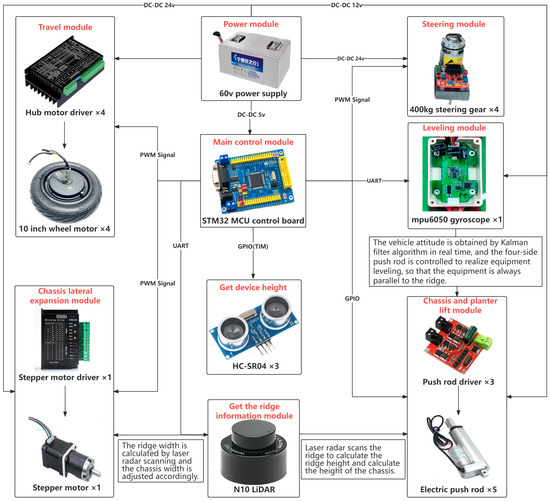
Figure 5.
Electrical control hardware structure.
3. Key Control Principle Analysis
3.1. Selection of Working Components
The N10 LiDAR sensor, as one of the key components of this platform, was selected with the performance parameters shown in the following Table 2.

Table 2.
LiDAR parameters.
3.2. LiDAR Scanning Data and Data Preprocessing
Due to the limited scanning range of the LiDAR sensor itself, and according to the platform’s need to scan only a fixed range of ground terrain data during movement, the scanning range of the LiDAR sensor is cropped, and threshold processing is performed to narrow down the judgment range. The precision of the LiDAR sensor is ±3 cm. It is installed at a height of 850 mm from the platform. Based on theoretical data and actual usage, the judgment range of the LiDAR sensor is set to 160° directly below.
The data transmitted by the LiDAR are a fixed number of point cloud distances and the rotated angles. It is necessary to evenly process the angle data, convert them into the angle of each point cloud, and, based on each point cloud angle and point cloud distance, use algorithms to determine the target point’s coordinates relative to the LiDAR sensor’s horizontal and vertical axes, as shown in Equations (1) and (2). Assuming the installation coordinates of the LiDAR sensor are (0,0), this is used as the relative coordinate to calculate the coordinate positions of points within the scanning range, as shown in Figure 6.
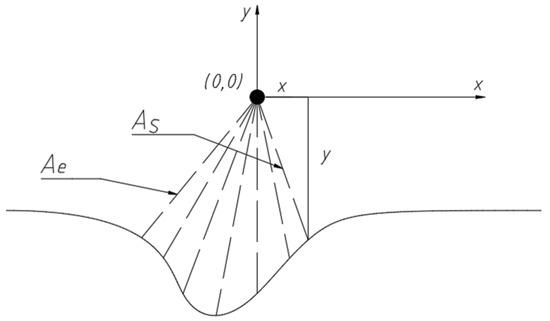
Figure 6.
LiDAR scanning diagram.
In the formulas:
As is the starting angle of a frame of LiDAR;
Ae is the ending angle of a frame of LiDAR;
n is the number of point clouds in a frame of LiDAR;
x is the distance of the LiDAR sensor from the target point along the x-axis;
y is the distance of the LiDAR sensor from the target point along the y-axis.
In practical situations, due to the light intensity and external environmental factors, interference data may be generated, necessitating the filtering of LiDAR data. The platform employs a sliding window filter [26], creating a window of fixed length to analyze the characteristics of the most recent five-point cloud data points. As the window moves forward, the newly entered point cloud data are added to the calculation, while the data that move out of the window are discarded. This significantly reduces memory usage and rapidly responds to changes in the latest point cloud data, as shown in Figure 7.
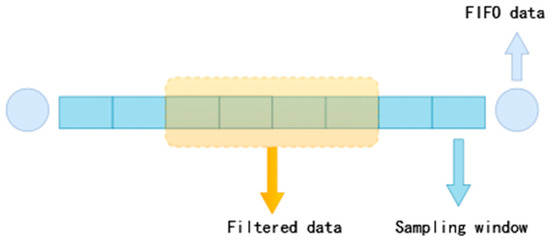
Figure 7.
Sliding window filtering flowchart.
For historical data and current data, a buffer area is created for the calculations, and the data in the buffer area are sorted to filter out the maximum, minimum, and peak values, followed by mean processing to obtain the output data, as shown in Figure 8.
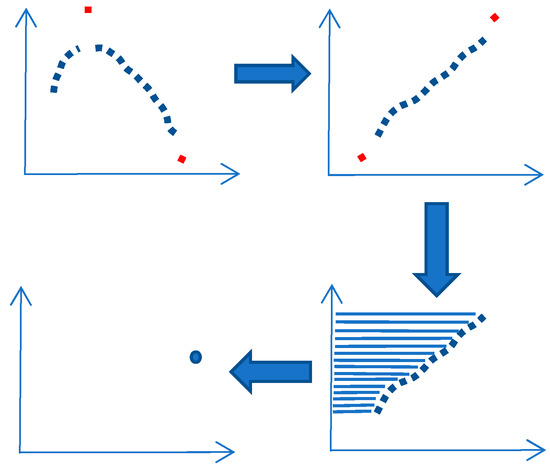
Figure 8.
Sliding window filtering schematic.
For actual field soil ridge data collection, the MATLAB processing of unfiltered and filtered data by the LiDAR sensor shows that sliding window filtering significantly reduces the impact of noise, effectively suppresses sudden changes in individual data points, and makes the overall trend of the signal smoother, as shown in Figure 9.
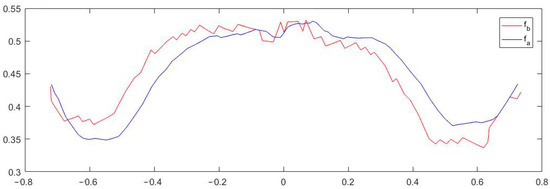
Figure 9.
Sliding window filtering effect diagram.
In the figure, fb is before sliding window filtering and fa is after sliding window filtering.
Based on the values of the data after sliding window filtering, as shown in Figure 9, a linear regression algorithm is applied to fit the LiDAR scanning data values and to assess the depth and width of the field ridges. A linear regression can effectively reflect the trend of each point cloud data from the LiDAR sensor, as shown in Equation (3).
To ensure the real-time performance of the overall system, conserve system resources, reduce the number of times the linear regression algorithm is executed, and ensure the efficiency of the linear regression algorithm, a fixed-length FIFO (First-In-First-Out) buffer is used to perform dynamic linear regression on the current and historical data. The regression is refreshed and judged with each new data input, and the data are stored in the cache, as shown in Figure 10.
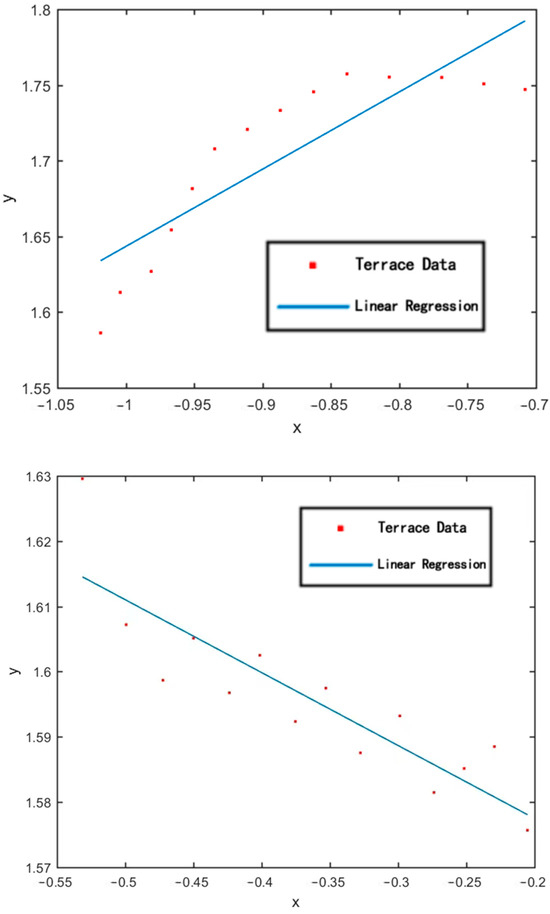
Figure 10.
Schematic diagram of the linear regression algorithm.
For the cached data, a quadratic regression analysis is conducted. When the soil ridge data show a significant curvilinear change, the quadratic regression can reflect the concave and convex curvilinear relationships of the terrain and efficiently make judgments for chassis data adjustment, as shown in Figure 11.
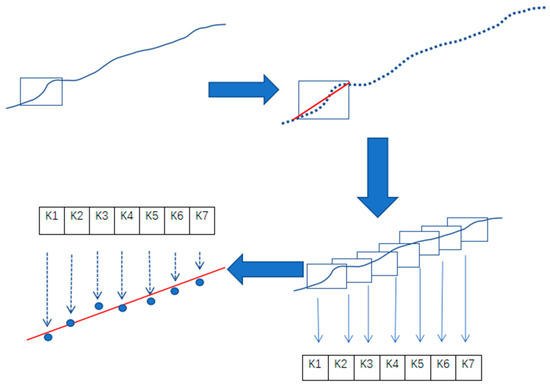
Figure 11.
Flowchart of the quadratic regression process. The solid blue line indicates a schematic of the lidar scanning of the contour of the mound; The red line in the blue dotted line indicates a primary linear regression was performed; K1–K7 indicates data acquisition; The blue solid dots together with the red line indicate that quadratic linear regression was performed.
As shown in Figure 11, after data processing from LiDAR scanning, values h1 and h2 are obtained. The absolute values of the horizontal coordinates of h1 and h2 are added together to obtain the soil ridge width data X = |X2| + |X1|. To determine the height of the soil ridge, the data obtained from the LiDAR scanning and processing are analyzed. The two points adjacent to the peak value of the upper surface of the soil ridge and the lower surface are filtered using an average value filter to obtain n1 and n2. By performing a difference analysis on n1 and n2, the height of the soil ridge H is determined as H = n2 −n1, as shown in Figure 12.
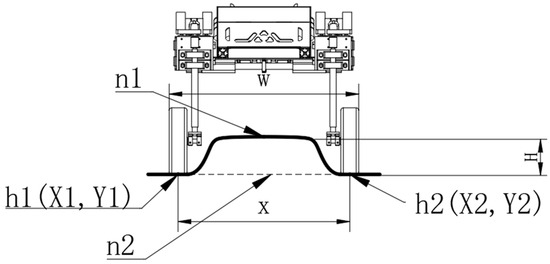
Figure 12.
Schematic diagram of the ridge width calculation.
3.3. Stepper Motor Width Measurement Principle
In this platform, the wheelbase adjustment mechanism is located under the platform, and due to layout issues, the stepper motor is located above the platform. Therefore, the stepper motor is connected to the lead screw through a gear set and a coupler. To ensure the synchronous transmission of both sides of the wheelbase adjustment, both lead screws are driven by the same gear. In this platform’s wheelbase adjustment mechanism, each pulse of the stepper motor rotates by 1.8°. When the lead screw is at 0 rotation, the wheelbase of the platform is 700 mm. From this, the platform’s wheelbase can be calculated.
The formula is as follows in Equation (4):
where n = number of pulses.
By comparing the adjusted platform width W with the soil ridge width data X, the sowing machine width W is adjusted to meet the sowing conditions of multiple rows on a single soil ridge.
3.4. Platform Ground Clearance Adjustment Technology Principle
This platform uses an ultrasonic ranging module for measurement and installs the ultrasonic ranging module on both sides of the platform. The Kalman filter fusion algorithm is used for data processing to ultimately determine the platform’s ground clearance. The performance parameters are as shown in Table 3.

Table 3.
Ultrasonic ranging module parameters.
Kalman filtering and data fusion can estimate the system’s state from a series of incomplete and noisy measurement data. Since only the latest measurement data are calculated in each iteration, the processing efficiency is extremely high [27]. This technology is widely used in engineering technology and agricultural machinery. In this platform, to obtain a more accurate ground clearance result, ultrasonic ranging modules at both ends are used simultaneously to measure the ground clearance, and the Kalman fusion algorithm is used to fully integrate the data from both sides to derive the final result, as shown in Figure 13.
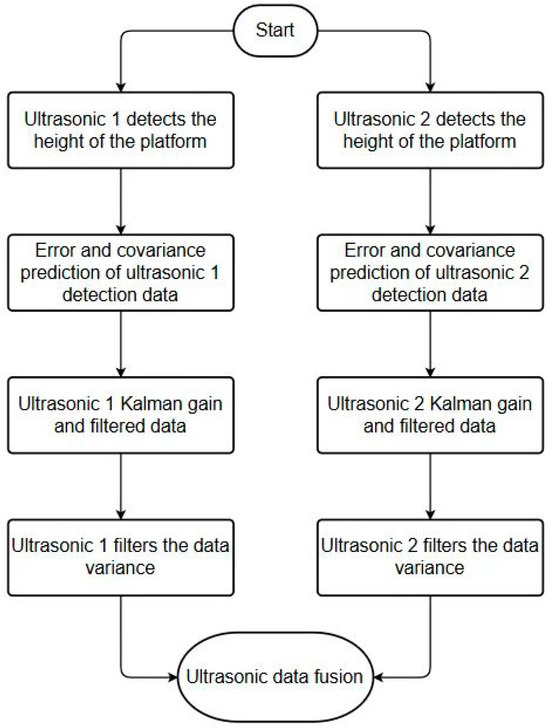
Figure 13.
Workflow diagram of the Kalman filtering fusion algorithm.
The ultrasonic ranging modules of this platform simultaneously measure on both the left and right sides. The specific principle of the Kalman filtering fusion algorithm used is as follows in Equations (5)–(13):
In the formulas:
Kn is the Kalman gain;
Pn,n−1 is the estimation uncertainty of this moment from the last moment;
rn is the measurement uncertainty;
Zn is the current measurement value;
Pn,n is the estimation uncertainty of this moment;
is the control gain;
is the Kalman filter output value;
is the predicted ground clearance value.
3.5. Platform Leveling Technology Principle
During field operations, there may be situations wherein one or more legs are suspended while the body remains level. This phenomenon of leg suspension is known as the “phantom leg” effect. If the “phantom leg” effect is not addressed in time, it may lead to the sudden instability and overturning of the machine. The appearance of the “phantom leg” means the disappearance of the driving force of the corresponding wheel, which weakens the platform’s driving capability. Simultaneously, when this platform is operating, it is necessary to apply the Kalman fusion algorithm to the ultrasonic ranging modules. If the platform has not been leveled, the results obtained from the ultrasonic ranging modules are not reference-worthy.
When leveling the platform using a gyroscope, factors such as the pitch angle, roll angle, “phantom leg”, and center of gravity height must be considered comprehensively. The system control logic is shown in the following figure. The gyroscope monitors the pitch and roll angles of the body in real time. When the body angle reaches the leveling threshold, the gyroscope adjusts the body based on the input information. At the same time, the PID controls the phase current of the platform legs in real time.
When the phase current is less than 0.23 A, it is determined that the corresponding leg is suspended, and “phantom leg” compensation is then made.
If the outputs of the four legs’ electric push rod adjustments are close to zero in the next certain period, it is determined that the platform is not in the leveling and “phantom leg” compensation state. The platform obtains the change in the platform’s ground clearance by the ultrasonic ranging module, changing the center of gravity height to the operating target height, keeping the platform at a fixed ground clearance to improve the driving stability, as shown in Figure 14.
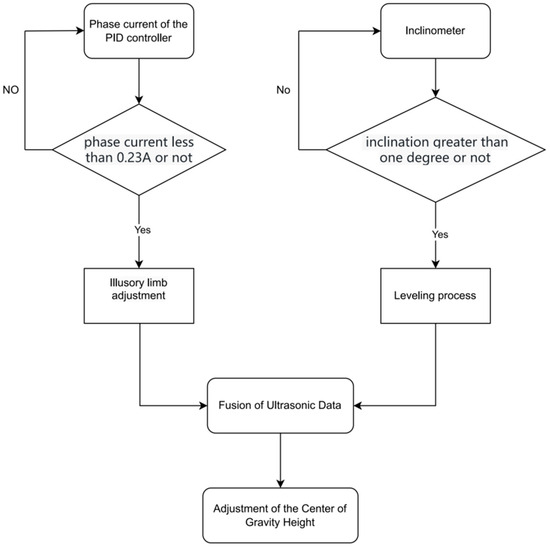
Figure 14.
Leveling workflow.
4. Field Experiments
4.1. Platform-Leveling Experiments
The main working environment of this platform is the soil ridges in the hilly regions of the south. When working, it often faces uphill scenarios and prepares for platform height measurement. The platform chassis is an independent legged type, which can level the platform by controlling the adjustment amount of the four electric push rods. To test the actual working effect of the platform’s gyroscope, the team conducted actual field experiments, and for the platform-leveling experiments, the team conducted experiments on single-leg and double-leg driving on slopes of 30° and 60° to explore the platform-leveling effect, as shown in Figure 15.
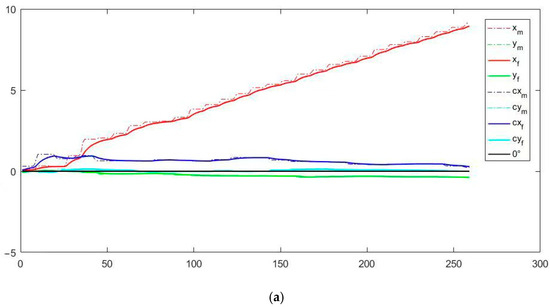
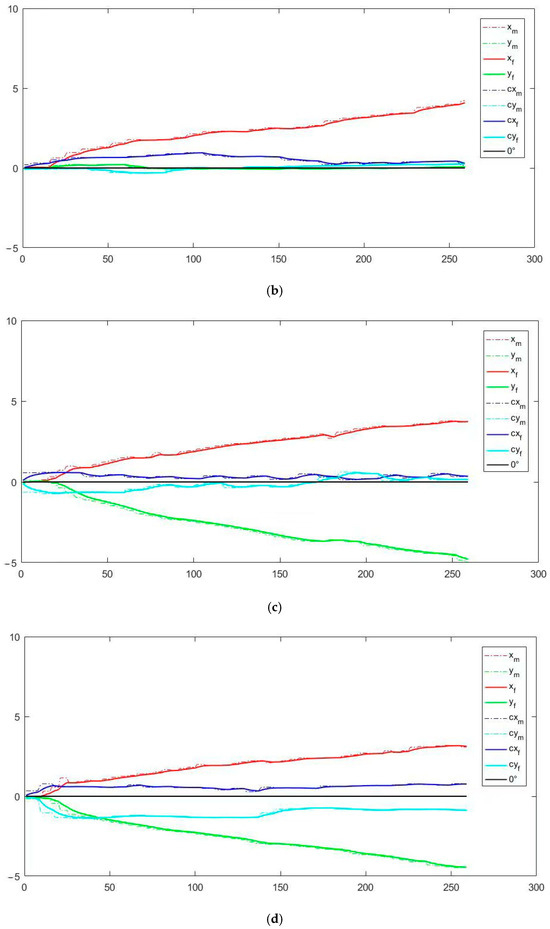
Figure 15.
Leg-leveling experiments. (a) Dual-leg 60° slope leveling. (b) Dual-leg 30° slope leveling. (c) Single-leg 60° slope leveling. (d) Single-leg 30° slope leveling.
In the figure:
Xm is the pitch angle observation value, and Ym is the roll angle observation value;
Xf is the pitch angle filtered value, and Yf is the roll angle filtered value;
CXm is the pitch angle observation value for the leveling algorithm;
CYm is the roll angle observation value for the leveling algorithm;
CXf is the pitch angle filtered value for the leveling algorithm;
CYf is the roll angle filtered value for the leveling algorithm.
It can be observed from Figure 15 that, when traveling on slopes of 30° and 60° with single and dual legs, comparing the Xf, Yf without the leveling algorithm to the CXf, CYf after applying the leveling algorithm, a significant leveling effect can be seen. After leveling with the gyroscope, the pitch and roll angles are essentially controlled within 1°, providing a good foundation for subsequent work by the ultrasonic ranging module. Table 4 is the leveling data analysis by our team for the platform: Through the following four sets of experimental data, we analyzed the mean, variance, and standard deviation of the unleveled pitch angle, leveled pitch angle, unleveled roll angle, and leveled roll angle. From the following data, it can be concluded that the maximum average value of the unleveled pitch angle reached up to 4.5543°, while the maximum average value of the leveled pitch angle was 0.6154°. The maximum average value of the unleveled roll angle was 2.6676°, and the maximum average value of the leveled roll angle was 0.9989°. The maximum variance of the unleveled pitch angle reached 6.9937°, while the maximum variance after leveling was 0.474°. The maximum variance of the unleveled roll angle was 1.9282°, and the maximum variance after leveling was 0.1320°. From the above, it can be concluded that, after using the leveling algorithm, the pitch angle has a maximum variance of 0.0474°, and the roll angle has a maximum variance of 0.1320°.

Table 4.
Leg-leveling data.
4.2. Platform Ultrasonic Ranging Experiment
The platform utilizes ultrasonic ranging modules to measure the clearance from the ground. These modules are installed on both sides of the platform to conduct measurements. By incorporating the Kalman filter and the Kalman filter fusion algorithm, the platform can effectively integrate the data from both sides, bringing them closer to the actual measurements, as shown in Figure 16.
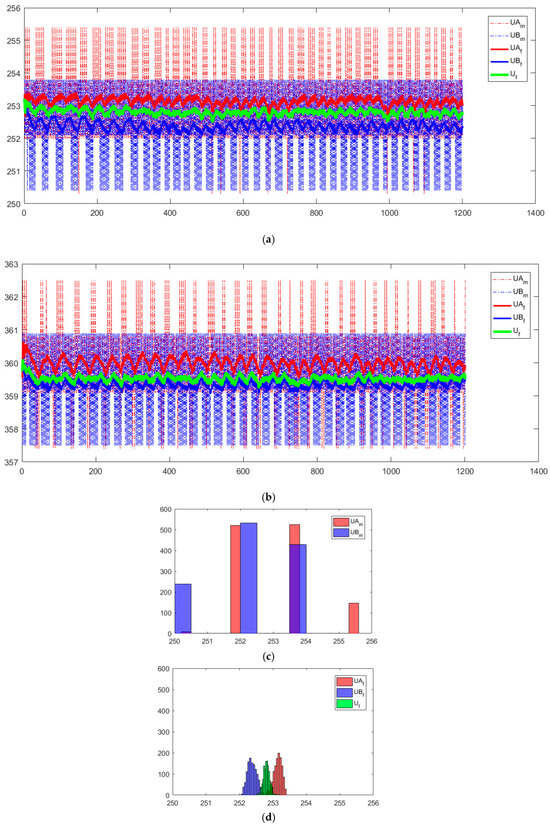
Figure 16.
Kalman filter fusion algorithm experiment. (a) Minimum ground clearance measurement after Kalman filter fusion. (b) Maximum ground clearance measurement after Kalman filter fusion. (c) Convergence test of ultrasonic sensor 1. (d) Convergence test of ultrasonic sensor 2.
In the diagram,
UAm represents the actual measurement curve of ultrasonic sensor 1;
UBm represents the actual measurement curve of ultrasonic sensor 2;
UAf represents the measurement curve of ultrasonic sensor 1 after Kalman filtering;
UBf represents the measurement curve of ultrasonic sensor 2 after Kalman filtering;
Uf represents the measurement curve after Kalman filter fusion of both ultrasonic sensors 1 and 2.
It can be observed from Figure 16 that the ultrasonic ranging modules exhibit significant fluctuations during actual measurements, with jitter values exceeding 5 mm. After applying the Kalman filtering algorithm, the fluctuations are reduced to around 1 mm. Our team conducted a convergence analysis using MATLAB, and the data after Kalman filtering for both ultrasonic sensors 1 and 2 converged within the range of 359–360, demonstrating a clear effect.
By employing the Kalman filter fusion algorithm, the platform can adjust the data based on the discrepancies between the sensor measurements and the set clearance, resulting in data that more closely reflect the actual ground clearance. The following Table 5 illustrates that the maximum variance before filtering the ultrasonic ranging module was 1.5983, which was reduced to 0.0304 after Kalman filtering, and further minimized to only 0.0085 after applying the fusion algorithm. These data indicate that the use of the Kalman filter fusion algorithm significantly reduces noise interference, yielding more accurate measurements.

Table 5.
Ultrasonic ranging module measurement data.
4.3. LiDAR Scanning Experiment
The platform employs the N10 LiDAR sensor for scanning soil ridges in the field, using algorithms to determine the parameters of the soil ridges. Initially, LiDAR scanning is conducted, followed by a linear regression analysis that clearly reflects the variations in the soil ridges, amplifying their characteristics. By examining the fluctuations in the curve, the parameters of the soil ridges can be discerned with clarity, as shown in Figure 17.
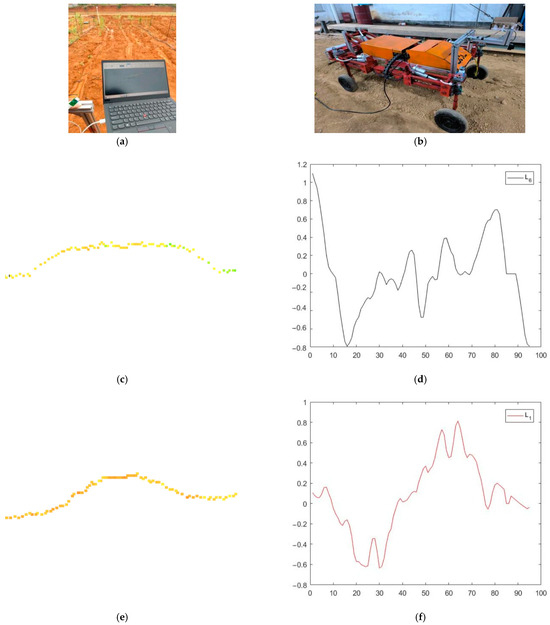

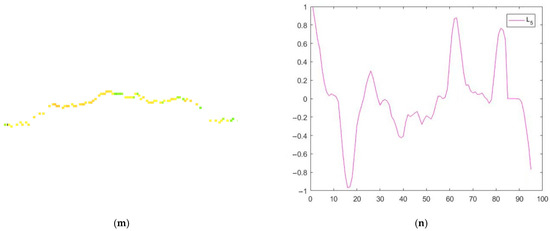
Figure 17.
Schematic of LiDAR scanning. (a) Field LiDAR scanning test diagram. (b) Platform test diagram. (c) Soil ridge scanning group 1. (d) Linear regression diagram for scanning group 1. (e) Soil ridge scanning group 2. (f) Linear regression diagram for scanning group 2. (g) Soil ridge scanning group 3. (h) Linear regression diagram for scanning group 3. (i) Soil ridge scanning group 4. (j) Linear regression diagram for scanning group 4. (k) Soil ridge scanning group 5. (l) Linear regression diagram for scanning group 5. (m) Soil ridge scanning group 6. (n) Linear regression diagram for scanning group 6.
4.4. Platform Adjustment Experiment (Continued)
Due to the slope inclination angle of southern ridges ranging from 120° to 150°, experimental environments for ridges with 120°, 135°, and 150° inclinations were constructed. Additionally, considering the platform’s adjustment range and the actual width of the ridges, ridges with varying widths were also constructed, as shown in Figure 18.
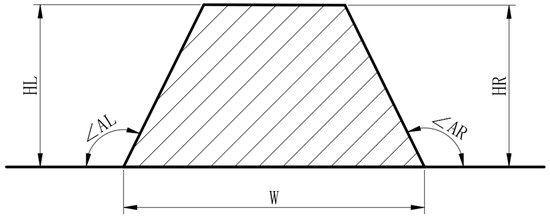
Figure 18.
Soil ridge scanning cross-section schematic.
This platform uses the N10 LiDAR sensor for scanning field ridges and calculates the width and height of the ridges through algorithms. Concurrently, the ultrasonic ranging module determines the platform’s ground clearance at the time, and the stepper motor and gear set determine the platform’s width, allowing for a comparison that facilitates fully autonomous posture adjustment. To ensure that the independently supported leg-type chassis can pass over the ridges smoothly while minimizing the platform’s height to enhance stability, the team designed the platform to be 20 cm wider than the ridge width when adjusted and 5 cm higher than the ridge height. The team experimented with ridges of different widths and slopes and concluded that the deviation of the LiDAR-measured width from the actual width does not exceed 1.0 cm, and the deviation of the LiDAR-measured height from the actual height does not exceed 1.0 cm. The actual adjusted width of the platform deviates from the actual ridge width by no more than 2.0 cm, and the actual adjusted height deviates from the actual ridge height by no more than 1.2 cm, as shown in Table 6, Table 7, Table 8, Table 9, Table 10 and Table 11.

Table 6.
LiDAR scanning dataset one.

Table 7.
LiDAR scanning dataset two.

Table 8.
LiDAR scanning dataset three.

Table 9.
LiDAR scanning dataset four.

Table 10.
LiDAR scanning dataset five.

Table 11.
Platform adjustment deviation.
In the table, RW is the actual ridge width; DW is the platform width adjustment deviation; AL is the actual left slope of the ridge; DH is the platform height adjustment deviation; AR is the actual right slope of the ridge; JW is the LiDAR-scanned ridge width; HL is the actual left height of the ridge; JH is the LiDAR-scanned ridge height; HR is the actual right height of the ridge; SH is the height after platform adjustment; SW is the width after platform adjustment.
5. Conclusions
- (1)
- This study designed a parameter-adaptive platform based on an independent pillar leg type, using dual parallelogram mechanisms to achieve the synchronous adjustment of the chassis ground clearance and wheelbase, using dual lead screw mechanisms to achieve the symmetrical adjustment of the wheelbase and using a leg pillar design to achieve the independent driving and steering of all four wheels. The results show that the platform has a maximum ground clearance adjustment range of 252–359 mm, a maximum wheelbase adjustment range of 700–850 mm, and strong obstacle-crossing capabilities based on soil ridges.
- (2)
- This study derived a set of algorithms for calculating soil ridge parameters based on LiDAR scanning, and the platform combines absolute vehicle parameters for adaptive adjustment. The algorithm uses a sliding window filter and processes the filtered buffer zone data with a mean value, which not only reduces memory size but also makes the overall trend of the signal smoother. Then, the algorithm performs first and second linear regression on the filtered data to obtain soil ridge parameters. Experimental data show that the deviation of the LiDAR measured width from the actual width does not exceed 1.0 cm, and the deviation of the LiDAR measured height from the actual height does not exceed 1.0 cm. The platform’s actual adjusted width deviates from the actual soil ridge width by no more than 2.0 cm, and the platform’s actual adjusted height deviates from the actual soil ridge height by no more than 1.2 cm.
- (3)
- To obtain the absolute parameters of the platform’s body, this study derived a set of platform-leveling algorithms, as well as Kalman filtering and Kalman filter fusion algorithms, based on the ultrasonic ranging modules on both sides. Experimental data show that, after platform leveling, the maximum variance of the pitch angle is 0.0474°, and the maximum variance in the roll angle is 0.1320°. After the ultrasonic ranging module is processed with the Kalman fusion algorithm, the maximum variance is only 0.0085.
Additionally, the soil ridges in this study were relatively standard, and the experimental environment was ideal. There are other uncertain factors in actual applications, and further in-depth research can be conducted for this system.
Author Contributions
Methodology, Y.S.; writing—original draft preparation, C.L. and S.X.; project administration, C.Z.; data curation and analysis, K.Y.; X.L., and J.L. All authors have read and agreed to the published version of the manuscript.
Funding
This work was supported by the Hunan Province Key R&D Program Project [grant number 2023NK2010 and 2024JK2031] and Hunan Province Intelligent Agricultural Machinery Equipment Innovation R&D Project “Research and Development, Manufacturing, Promotion and Application of Southern Paddy Field Green Fertilizer Ditch Machine”.
Institutional Review Board Statement
Not applicable.
Data Availability Statement
The original contributions presented in the study are included in the article, and further inquiries can be directed to the corresponding author/s.
Acknowledgments
We would like to thank the reviewers for their constructive feedback to improve the quality of this paper.
Conflicts of Interest
The authors declare that they have no competing financial interests or personal relationships that may have influenced the work reported in this paper.
References
- Yang, H.; Ma, W.; Liu, T.; Li, W. Assessing farmland suitability for agricultural machinery in land consolidation schemes in hilly terrain in China: A machine learning approach. Front. Plant Sci. 2023, 14, 1084886. [Google Scholar] [CrossRef] [PubMed]
- Wang, L.; Zhu, J.; Liu, F.; He, Z.; Lai, Q.; Zhu, Z.; Song, Z.; Li, Z. Algorithm and scale experiment of gyro-based tractor rollover control towards hilly farmland application. Comput. Electron. Agric. 2024, 220, 108925. [Google Scholar] [CrossRef]
- Niu, P.; Chen, J.; Zhao, J.; Luo, Z. Analysis and evaluation of vibration characteristics of a new type of electric mini-tiller based on vibration test. Int. J. Agr. Biol. Eng. 2019, 12, 106–110. [Google Scholar] [CrossRef]
- Qin, C.; Wright, A.L.; Ma, L.; He, X.; Xie, D.; Jiang, X. Improving nitrogen-use efficiency by using ridge tillage in rice paddy soils. Soil. Use Manag. 2022, 38, 528–536. [Google Scholar] [CrossRef]
- Ren, B.; Dong, S.; Liu, P.; Zhao, B.; Zhang, J. Ridge tillage improves plant growth and grain yield of waterlogged summer maize. Agr. Water Manag. 2016, 177, 392–399. [Google Scholar] [CrossRef]
- Hu, Y.; Ma, P.; Wu, S.; Sun, B.; Feng, H.; Pan, X.; Zhang, B.; Chen, G.; Duan, C.; Lei, Q.; et al. Spatial-temporal distribution of winter wheat (Triticum aestivum L.) roots and water use efficiency under ridge—Furrow dual mulching. Agr. Water Manag. 2020, 240, 106301. [Google Scholar] [CrossRef]
- Henriksen, C.B.; Rasmussen, J.; Molgaard, J.P. Potato tuber yield and quality and soil inorganic nitrogen as affected by timing of ridging with and without catch crops. Soil. Till Res. 2007, 94, 36–46. [Google Scholar] [CrossRef]
- Chao, L.; Xicen, T.; Yanan, Y.; Zhiyang, F. Design and Analysis of a Novel Deformable Wheel-legged Robot. Trans. Chin. Soc. Agric. Mach. 2022, 58, 65–74. [Google Scholar]
- Li, Z.L.; Liu, J.H.; Sun, Z.B.; Yu, C.Z. Dynamic research and analysis for a wheel-legged harvester chassis during tilting process. Adv. Mech. Eng. 2019, 11, 1687814019855453. [Google Scholar] [CrossRef]
- Sun, Z.; Zhang, D.; Li, Z.; Shi, Y.; Wang, N. Optimum Design and Trafficability Analysis for an Articulated Wheel-Legged Forestry Chassis. J. Mech. Design 2022, 144, 013301. [Google Scholar] [CrossRef]
- Sun, Y.; Xu, L.; Jing, B.; Chai, X.; Li, Y. Development of a four-point adjustable lifting crawler chassis and experiments in a combine harvester. Comput. Electron. Agric. 2020, 173, 105416. [Google Scholar] [CrossRef]
- Wang, Z.; Xia, Y. Model establishment of body attitude adjustment system based on Backstepping control algorithm and automatic leveling technology. Clust. Comput. 2019, 22, 14327–14337. [Google Scholar] [CrossRef]
- Xiaoyan, W.; Bo, D.; Dingyang, T.; Yunpeng, J.; Hongwen, L.; Qingjie, W. Design and Experiment of Undriven Soil Puddling Machine with lmproved Auto-leveling and Straw-burying Design for Paddy Field. Trans. Chin. Soc. Agric. Mach. 2022, 53, 20–31. [Google Scholar]
- Qing, Z.; Kaoxin, P.; Zhenyu, W.; Shaojiong, H.; Yong, Y.; Decheng, W. Pose Control of Biomimetic Wheel-legged Robots in Complex Terrain. Trans. Chin. Soc. Agric. Mach. 2024, 55, 380–391. [Google Scholar]
- Jiang, Y.; Sun, Z.; Wang, R.; Ding, R.; Ye, Q. Design and control of a new omnidirectional levelling system for hilly crawler work machines. Comput. Electron. Agr. 2024, 218, 108661. [Google Scholar] [CrossRef]
- Zeyu, S.; Changgao, X.; Yu, J.; Yifan, G.; Ruochen, W. Omnidirectional Leveling Control of Crawler Machine Based on QBP-PlD. Trans. Chin. Soc. Agric. Mach. 2023, 54, 397–406. [Google Scholar]
- Wang, Z.; Yang, J.; Liu, P.; Long, X.; Li, H.; Wei, W. Development of an agricultural vehicle levelling system based on rapid active levelling. Biosyst. Eng. 2019, 186, 337–348. [Google Scholar] [CrossRef]
- Mizushima, A.; Ishii, K.; Noguchi, N.; Matsuo, Y.; Lu, R. Development of a low-cost attitude sensor for agricultural vehicles. Comput. Electron. Agric. 2011, 76, 198–204. [Google Scholar] [CrossRef]
- Goetz, K.T.; Soitinaho, R.; Oksanen, T. Ploughing furrow recognition for onland ploughing using a 3D-LiDAR sensor. Comput. Electron. Agric. 2023, 210, 107941. [Google Scholar] [CrossRef]
- Luo, S.; Liu, W.; Zhang, Y.; Wang, C.; Xi, X.; Nie, S.; Ma, D.; Lin, Y.; Zhou, G. Maize and soybean heights estimation from unmanned aerial vehicle (UAV) LiDAR data. Comput. Electron. Agric. 2021, 182, 106005. [Google Scholar] [CrossRef]
- Hu, W.; Jiang, P.; Xiao, F.; Jin, S.; Luo, Y.; Liu, Q.; Long, L.; Shi, Y. Identifying rice seedling bands based on slope virtualization clustering. Comput. Electron. Agric. 2020, 175, 105470. [Google Scholar] [CrossRef]
- Manpreet-Singh; Sidhu, H.S.; Yadvinder-Singh; Singh, S.K.; Pandey, H.S. Performance evaluation of automatic vis-a-vis manual topographic survey for precision land levelling. Precis. Agric. 2020, 21, 300–310. [Google Scholar] [CrossRef]
- Yang, L.; Xu, Y.; Li, Y.; Chang, M.; Chen, Z.; Lan, Y.; Wu, C. Real-Time field road freespace extraction for agricultural machinery autonomous driving based on LiDAR. Comput. Electron. Agric. 2023, 211, 108028. [Google Scholar] [CrossRef]
- Fricke, T.; Wachendorf, M. Combining ultrasonic sward height and spectral signatures to assess the biomass of legume—Grass swards. Comput. Electron. Agric. 2013, 99, 236–247. [Google Scholar] [CrossRef]
- Zaman, Q.U.; Esau, T.J.; Schumann, A.W.; Percival, D.C.; Chang, Y.K.; Read, S.M.; Farooque, A.A. Development of prototype automated variable rate sprayer for real-time spot-application of agrochemicals in wild blueberry fields. Comput. Electron. Agric. 2011, 76, 175–182. [Google Scholar] [CrossRef]
- Ma, T.; Zhang, D.; Zhuang, J.; You, C.; Yin, G.; Tang, S. TDOA-based UWB indoor 1D localization via weighted sliding window filtering. Digit. Signal Process 2024, 151, 104544. [Google Scholar] [CrossRef]
- Xiaohu, J.; Jin, T.; Yunhai, M.; Jinguang, L.; Baoguang, W.; Jiyu, S. Study of Tillage Depth Detecting Device Based on Kalman Filter and Fusion Algorithm. Trans. Chin. Soc. Agric. Mach. 2020, 51, 53–60. [Google Scholar]
Disclaimer/Publisher’s Note: The statements, opinions and data contained in all publications are solely those of the individual author(s) and contributor(s) and not of MDPI and/or the editor(s). MDPI and/or the editor(s) disclaim responsibility for any injury to people or property resulting from any ideas, methods, instructions or products referred to in the content. |
© 2024 by the authors. Licensee MDPI, Basel, Switzerland. This article is an open access article distributed under the terms and conditions of the Creative Commons Attribution (CC BY) license (https://creativecommons.org/licenses/by/4.0/).