Article

Impact of Linking Livelihood Resilience of Smallholder Households and the Risk Management Strategies: The Case of China from Socioeconomic Perspectives

1
School of Public Administration, Xi’an University of Architecture and Technology, Xi’an 710055, China
2
School of Public Administration, Xi’an University of Finance and Economics, Xi’an 710100, China
3
School of Economics, Management and Law, Hubei Normal University, Huangshi 435002, China
4
Northwest Center for Rural Vitalization Research, Xi’an University of Architecture and Technology, Xi’an 710055, China
*
Authors to whom correspondence should be addressed.
Agriculture 2024, 14(9), 1599; https://doi.org/10.3390/agriculture14091599
Submission received: 16 July 2024 / Revised: 27 August 2024 / Accepted: 12 September 2024 / Published: 13 September 2024
(This article belongs to the Section Agricultural Economics, Policies and Rural Management)

Abstract

:
The government of China has implemented the Southern Shaanxi Disaster Resettlement program since 2011, which aims to address the problems of reduced livelihood resilience, increased livelihood risks, and single-risk management strategies caused by the frequent occurrence of natural disasters. This study considers the specific situation of disaster resettlement in Ankang Prefecture, southern Shaanxi Province, and draws on Quandt’s measurement idea to quantify livelihood resilience at the household scale in terms of five types of capital assets: natural, physical, human, financial, and social. A coarsened exact matching model was used to control confounding factors in the observational data to reduce sample selection bias, and then multinomial logit regression models were used to examine how livelihood resilience affects risk management strategies; moreover, the effects of different indicators of livelihood resilience, relocation characteristics, and follow-up support measures on risk management strategies were analyzed. Results show that livelihood resilience is higher among new-stage relocation, voluntary relocation, and centralized resettlement households, and working outside of the home accounts for the largest proportion of risk management strategies chosen by the sample households. In addition, livelihood resilience and its dimensions and indicators, relocation characteristics, and follow-up support measures have different impacts on risk management strategies. These results have considerable significance in guiding research on risk management strategies at the household scale and can serve as a reference for disaster resettlement in other developing nations and regions.

1. Introduction

To mitigate ecological degradation, strengthen livelihood resilience, and achieve sustainable development, the Chinese government has implemented the Southern Shaanxi Disaster Resettlement (SSDR) program since 2011, which aims to relocate rural poor people living in remote areas under poor living conditions to more habitable urban areas [1,2]. These people live in steep mountainous areas that are prone to disasters such as landslides, floods, and mudslides. The SSDR program aims to address the problems of reduced livelihood resilience, increased livelihood risks, and single-risk management strategies caused by the frequent occurrence of natural disasters [3,4]. In Asia, especially in developing countries, disaster resettlement is often the result of infrastructure construction such as reservoirs and roads, and land planning such as nature reserves [5]. Globally, disaster resettlement is mainly caused by environmental issues (environmental carrying capacity, water quality, and geological instability) and population issues (health risks, food security, and income instability) [6]. Existing research does not focus on the socioecological impacts of disaster resettlement [5,6,7,8]. Although disaster resettlement programs have been implemented globally, research on rebuilding livelihoods and improving livelihood resilience of households in this particular context has been limited [9,10]. Households in developing nations usually choose different livelihood strategies to reduce livelihood risks and increase livelihood resilience [11]; however, selecting livelihood behaviors or patterns and adopting appropriate strategies to manage livelihood risks can be challenging. Livelihood has been proven to be an essential perspective in disaster resettlement research [11,12]. Although some studies have discussed the livelihood activities of households in the context of disaster resettlement [12,13,14], they have paid insufficient attention to the relationship between livelihood resilience and choice of risk management strategies. Therefore, this study attempts to deepen and expand our understanding of disaster resettlement at the household scale.
The concept of resilience is relatively broad, and an increasing number of scholars are studying the resilience of socioecological systems [15,16,17]. Livelihood resilience refers to the ability of an individual, organization, or socioecological system to deal with change and recover from adverse consequences in the face of stress or disturbance [18,19,20]. Currently, livelihood resilience has been widely used in various research contexts. For example, Sina, Speranza, and Tebboth, respectively, studied livelihood resilience against the background of climate disturbance, agroforestry cultivation, and disaster management [20,21,22]. Existing studies measuring livelihood resilience have failed to develop a consistent standard, and some scholars have quantified and assessed livelihood resilience by building an empirical analysis framework [23]. For example, Fang et al. [24] developed a framework to explore how livelihood resilience can be enhanced to mitigate the threat of natural disasters from the four aspects of livelihood quality, livelihood promotion, livelihood provision, and disaster stress. Most scholars have measured livelihood resilience using objective frameworks and indicator measures, and a few studies have used subjective self-assessment methods to score the characteristics and attributes of livelihood resilience [25]. Both methods have their advantages and disadvantages; currently, the objective-oriented index method remains the predominant method for measuring livelihood resilience. This study holistically considers disaster resettlement in southern Shaanxi and draws on Quandt’s household livelihood resilience approach (HLRA) [17] to quantify livelihood resilience at the household scale in terms of five types of capital assets—natural, physical, human, financial, and social; finally, it links these assets to risk management strategies.
Risk management refers to appropriate alternative tools chosen to reduce the impact of risks in households’ activities, realize risk transfer, or strengthen households’ ability to cope with risks [26,27]. To increase livelihood resilience, promote diversification of income sources, and, thereby, reduce livelihood risks, households in developing nations often choose various livelihood activities or strategies rather than single strategies according to livelihood capital assets [11]. The livelihood activities adopted by such groups are called risk management strategies. Owing to the scarcity of livelihood capital and weak adaptive capacity [28,29], households often fail to determine the optimal risk management strategies, thus facing livelihood risks and suffering losses [30,31]. Several empirical studies have shown that households should choose appropriate risk management strategies to cope with external risks and shocks [32,33,34,35,36,37]. For example, Babulo et al. [34] argued that households give priority to reducing consumption and drawing on their savings to ease livelihood difficulties; furthermore, households are gradually increasingly choosing to work outside of the home as the predominant way to manage risk and sustain their livelihood [38]. Current studies on risk management strategies have focused mainly on the contexts of agricultural expansion, land use, and livelihood transfer [39,40,41]; few studies have quantitatively explored households’ choice of risk management strategies in the context of disaster resettlement, which is the focus of this empirical analysis.
Although some studies have examined the connection between livelihood capital or risk and livelihood adaptation strategies or risk management strategies [35,42,43,44,45], research on the relationship between livelihood resilience and risk management strategies in the context of disaster resettlement in rural China remains lacking. Therefore, this study attempts to link livelihood resilience and risk management strategies to supplement the current research on disaster resettlement at the household scale. The potential contributions of this study are as follows: (1) the impact of livelihood resilience and its dimensions and indicators; different relocation characteristics and follow-up support measures on risk management strategies is discussed, which is crucial for studying risk management strategies at the household scale. (2) Taking Ankang Prefecture in southern Shaanxi, China, as the study site, the research findings can serve as reference for disaster resettlement in other developing countries and regions. This study aims to address the following two essential questions. (1) What is the livelihood resilience level of disaster resettlement households in southern Shaanxi, China?; (2) How does livelihood resilience affect households’ choice of risk management strategies? The innovations of this study are summarized as follows: (1) In terms of methodology, this article adopts quantitative analysis approach, draws on Quandt’s calculations on household livelihood resilience [17], adopts the coarsened exact matching model to reduce sample selection bias, and uses multinomial logit regression models to empirically analyze the impact of livelihood resilience on risk management strategies. (2) In terms of content and scope, this study divides risk management strategies into five categories in detail, and combines livelihood resilience of smallholder households with risk management strategies from a micro perspective. (3) In terms of objectives, on the basis of previous studies, this study is committed to supplementing the research on disaster resettlement at the scale of households, and the research results can provide reference for disaster resettlement research in developing countries.
The rest of this paper is organized as follows: Section 2 discusses the research materials and methods. Section 3 outlines the descriptive statistical analysis of households’ livelihood resilience and risk management strategies. Section 4 analyzes the study results and influencing factors. Section 5 presents the discussion and summary.

2. Materials and Methods

2.1. Research Area

Ankang Prefecture is situated in the south of Shaanxi Province, and the study area is shown in Figure 1. This region has complex terrain, a fragile ecological environment, and frequent natural disasters. Its landform is characterized by the north and south mountains and the intermediate basins. Mountainous areas account for 92.5% of the total land area. Most households are located in the middle and high mountain areas, and the safety of their life and property is seriously threatened; moreover, the livelihoods of households are based on agriculture and forestry. However, with the restriction of cultivated land area and the introduction of forestry protection policies, the region is characterized by a lagging economy [46,47]. Thus, in 2011, the provincial government of Shaanxi initiated a massive SSDR program in southern Shaanxi [25], aiming to help poor people living in remote mountainous areas relocate to convenient communities, improve the living conditions of these households, enhance their quality of life, boost livelihood resilience, and promote economic development.

2.2. Data Sources

This study analyzed data obtained from the household livelihood survey performed by our team in Ankang Prefecture of Shaanxi Province. This survey used the random convenience sampling method, randomly selecting family members or other local residents between the ages of 18 and 65 years for survey. The survey mainly collected basic information about rural households such as land use, household livelihoods, production and consumption behavior, and follow-up support. To enhance the representativeness and feasibility of the samples, we selected three typical case study sites in Hanbin District, Ningshan County, and Ziyang County for research. These areas not only participated in disaster resettlement projects but also had households that urgently needed to adopt suitable risk management strategies to improve their livelihood resilience and cope with economic difficulties. The survey received 657 valid responses from 459 relocated households and 198 nonrelocated households. Because this study is regarding the relationship between livelihood resilience and risk management strategies of relocated households, only the 459 relocated samples are analyzed herein.

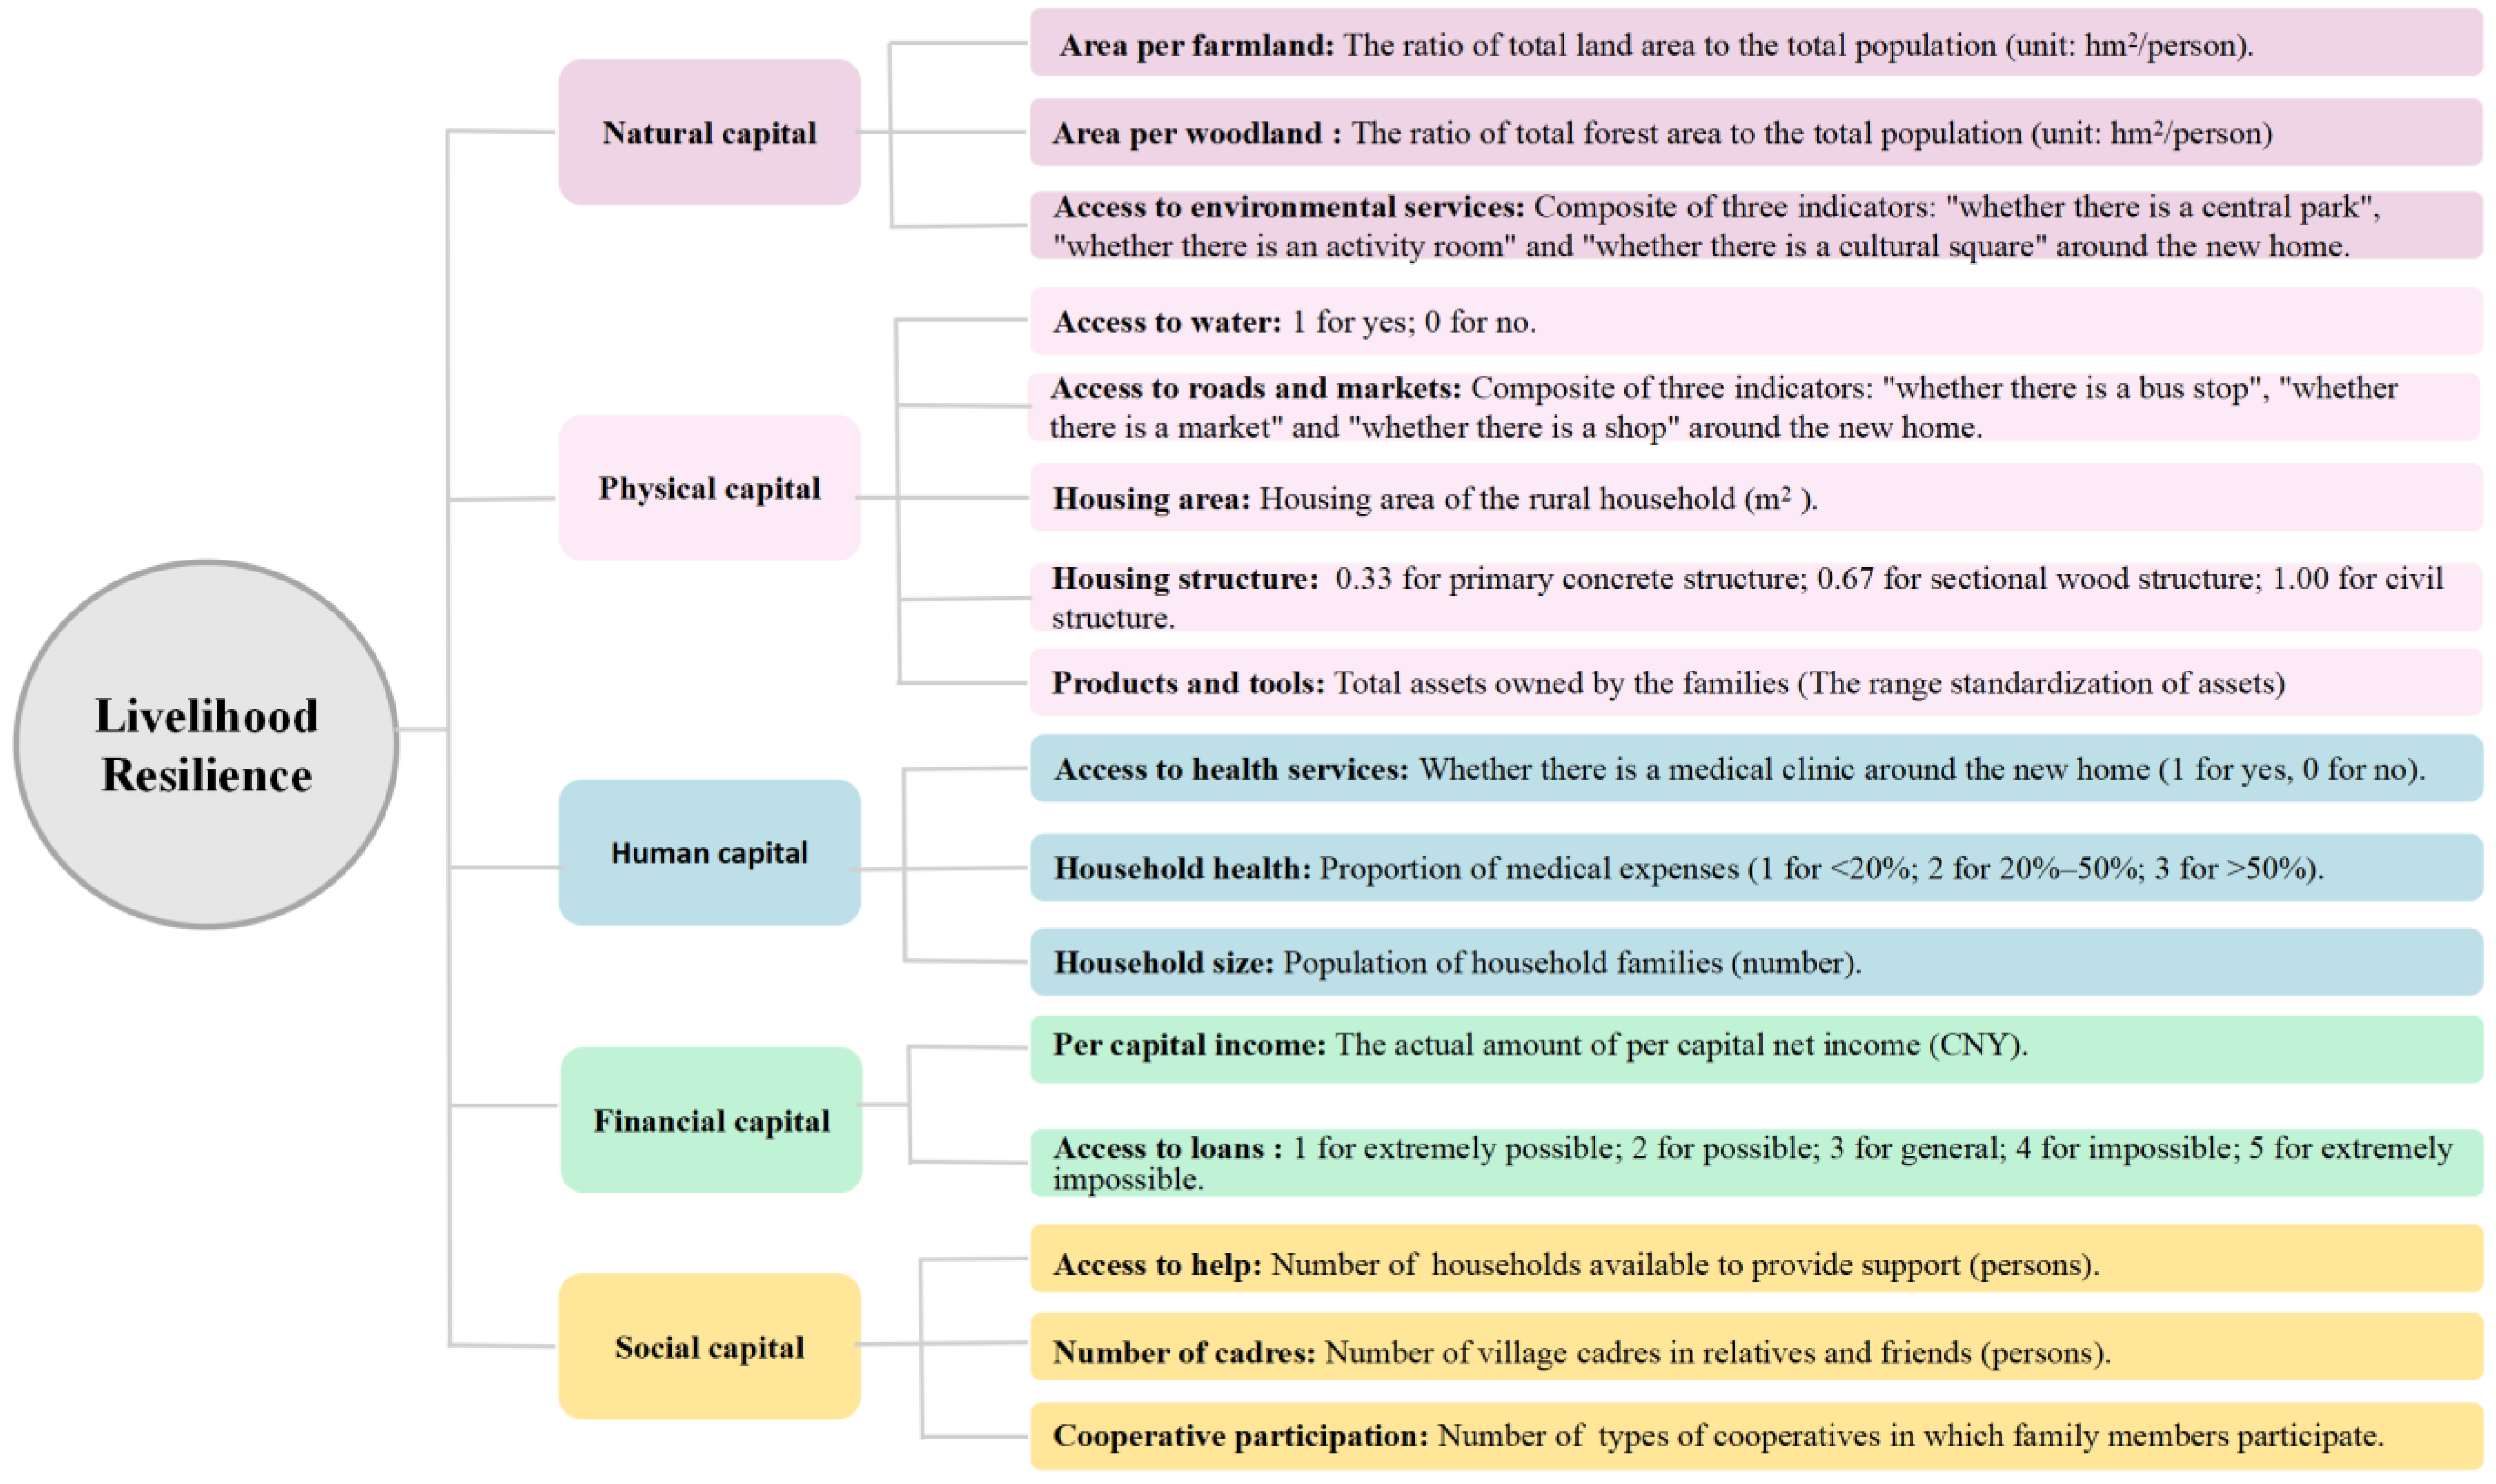
2.3. Indicator Construction

This study focused on the connection between the livelihood resilience of smallholder households and risk management strategies. First, the direct addition method was used to construct the indicator system of livelihood resilience evaluation based on the five types of capital assets. Second, taking livelihood resilience as an independent variable and risk management strategies as a dependent variable, multinomial logit regression models were used to explore how livelihood resilience affects risk management strategies. Finally, to more thoroughly examine the essential elements influencing risk management strategies, capital assets and detailed indicators of livelihood resilience, relocation characteristics, and follow-up support measures were used as independent variables to conduct multinomial logit regressions for risk management strategies.
  • Livelihood resilience capital assets and detailed indicators
This study draws on Quandt’s HLRA [17], assesses the relevant literature [19,48,49,50,51,52,53,54] and current status of the research area, and adheres to the scientific and systematic principles of indicator selection. The livelihood resilience evaluation indicator system shown in Figure 2 was constructed based on the five types of capital assets of relocated households. To eliminate the impact of the original data with different scales and orders of magnitude, this study standardized each evaluation indicator. Subsequently, the direct addition method was used to add the indicators representing each of the five capital assets of the relocated households; finally, the values of the five capital assets and the total value of livelihood resilience were calculated.
Natural capital assets refer to the natural resources and ecological environment services that households require for survival. This study used three indicators—area per farmland, area per woodland, and access to environmental services [47]—to represent natural capital assets. Physical capital assets refer to materialized capital that supports households’ livelihood and improves productivity. This study used the following five indicators of physical assets: access to water, access to roads and markets, housing area, housing structure, and products and tools [17,47]. Human capital assets are the most basic livelihood capital assets; the three indicators used in this study were access to health services, household health, and household size [25]. Financial capital assets refer to the financial resources that relocated households depend on for their production and life; the two indicators used herein were per capital income and access to loans [17,25]. Social capital assets refer to the social resources owned by relocated households to maintain social relations, realize information sharing, and maintain reciprocity of benefits. This study used three indicators of social capital assets: access to help, number of cadres, and cooperative participation [17,39,47].
2.
Relocation characteristics
The relocation characteristics selected in this study include three variables: relocation time, relocation nature, and settlement approach. A small number of data are missing due to some households are not very clear about their own relocation characteristics or there are omissions in filling in the questionnaire, resulting in inconsistent sample sizes after classification according to different relocation characteristics in Table 1. In addition, a small number of data are merged and inevitably missing as a result of the cluster analysis of livelihood resilience, which explains the inconsistent sample sizes in Table 2. These small numbers of missing data have a small and negligible impact on the results. According to relocation time, households can be divided into early-stage and new-stage relocation. Early-stage relocation refers to relocation before 2011, the year in which the SSDR was implemented, and new-stage relocation refers to relocation after 2011 [39]. According to relocation nature, households can be divided into voluntary and involuntary relocation. Survey results indicate that 395 households were voluntary relocation, and most of them opted for voluntary relocation owing to poor economic conditions or serious natural disasters. According to the settlement approach, households can be classified as centralized and noncentralized resettlement [6,25]. Centralized resettlement communities are under the unified leadership of the government, and the resettled residents are managed centrally. Noncentralized resettlement refers to the distribution of resettled residents into smaller zones and their decentralized management [14,38].
3.
Follow-up support measures
This study selects the three variables of industry support, employment support, and training to analyze the impact of follow-up support measures on households’ risk management strategies. These three variables were set consistently: 0 indicates that households do not benefit from the policy, and 1, 2, 3, 4, and 5 indicate that the policy is very favorable to the economic conditions of households, relatively favorable, indifferent or unclear, relatively unfavorable, and very unfavorable, respectively. Follow-up support measures refer to policies and measures formulated and implemented by the government after the completion of disaster resettlement to enable the relocated households to integrate into the new environment, stabilize their lives, and promote economic development [46,47]. Industrial support refers to the economic measures that provide employment opportunities to relocated households and promote the economic development of the resettlement areas through industrial development [46]. Employment support refers to the support measures that help relocated households gain stable employment. Training refers to policy measures that provide free employment training to relocated households to improve their skills and achieve stable poverty alleviation [53].
4.
Risk management strategy
A risk management strategy encompasses the behavioural decisions made by households to improve their livelihood resilience when facing livelihood risks. Referring to the studies by Cooper et al. [55], Sina et al. [56], and Merritt et al. [57] and considering the current status of the surveyed areas, this study divides households’ risk management strategies into five categories: working outside of the home, selling assets, reducing consumption, borrowing money, and drawing on savings.
5.
Covariates for Coarsened Exact Matching
In this study, age, average years of education and livelihood diversification are selected as covariables of coarsened exact matching. Age refers to the age of the household head. Average years of education refers to the average level of education of the household [6]. Livelihood diversification refers to number of types of activities in which households are involved to sustain their livelihoods [25].

2.4. Research Methods

2.4.1. Coarsened Exact Matching

The coarsened exact matching method was proposed by Lacus et al. [58,59]. The purpose of matching is to enhance comparability by balancing covariates of two sets of data, thus reducing dependence on the model and reducing sample selection bias. CEM matching allows the maximum imbalance between the treated and untreated groups to be selected in advance by the users, and adjusting the imbalance on one variable does not affect the imbalance on other variables [58]. Specifically, before CEM matching, each covariate is first stratified according to each covariate, after which the CEM performs exact matching based on this stratification, ensuring that the treated group (relocated households) and the untreated group (nonrelocated households) match at each stratification.
The matching effect of CEM mainly depends on the size of the L1 value of the variable, which ranges from [0, 1]. If L1 = 0, the two sets of data are completely balanced, and if L1 = 1, the two sets of data are completely unbalanced. If the L1 after matching decreases from the L1 before matching, then the matching is more effective. The weight variable (Weight) generated by CEM during the matching process balances the sample sizes of relocated and nonrelocated households in each stratum. Before analyzing the impact of livelihood resilience on risk management strategies, this study selected age, average years of education, and livelihood diversification as covariables of the CEM method to match the relocated households and nonrelocated households. After matching, the value of L1 decreases from 0.479 to 0.209, indicating that the matching effect is good (if necessary, contact the author for more information).

2.4.2. Multinomial Logit Regression Model

When using a multinomial logit regression model, it is usually necessary to select one of the categories from the dependent variables as the reference group of the model, compare the results of the reference group with those of other categories in pairs, and construct multiple equations for regression analysis [60]. In this study, the independent variable was livelihood resilience and the dependent variable was risk management strategy. Risk management strategies are divided into five categories: (1) work outside of the home, (2) sell assets, (3) reduce consumption, (4) borrow money, and (5) draw on savings.
L o g i t P j P 4 = I n p Y = j X p Y = 4 X = α j + k = 1 6 β j k x k , j = 1,2 , 3,5
In the formula, Pj represents the probability of households choosing the jth risk management strategy, P4 denotes the probability of households choosing the risk management strategy of borrowing money, and Logit(Pj/P4) represents the natural logarithm of the ratio between the probability of selecting the jth risk management strategy and the probability of choosing the risk management strategy of borrowing money. The dependent variable Y is the risk management strategy; the independent variable X represents the factors influencing the choice of risk management strategies, that is, the predictor variables influencing the choice of risk management strategies; and xk is used to denote the kth factor influencing the choice of risk management strategies, including livelihood resilience and its dimensions and indicators, relocation characteristics, and follow-up support measures. αj is the intercept under the jth risk management strategy choice. βjk is the regression coefficient under the kth influence factor of the jth risk management strategy choice. The regression coefficient βjk can be interpreted as the rate of change of Logit(Pj/P4) for a one-factor change in impact factor xk, with other influencing factors unchanged.

3. Results and Analysis

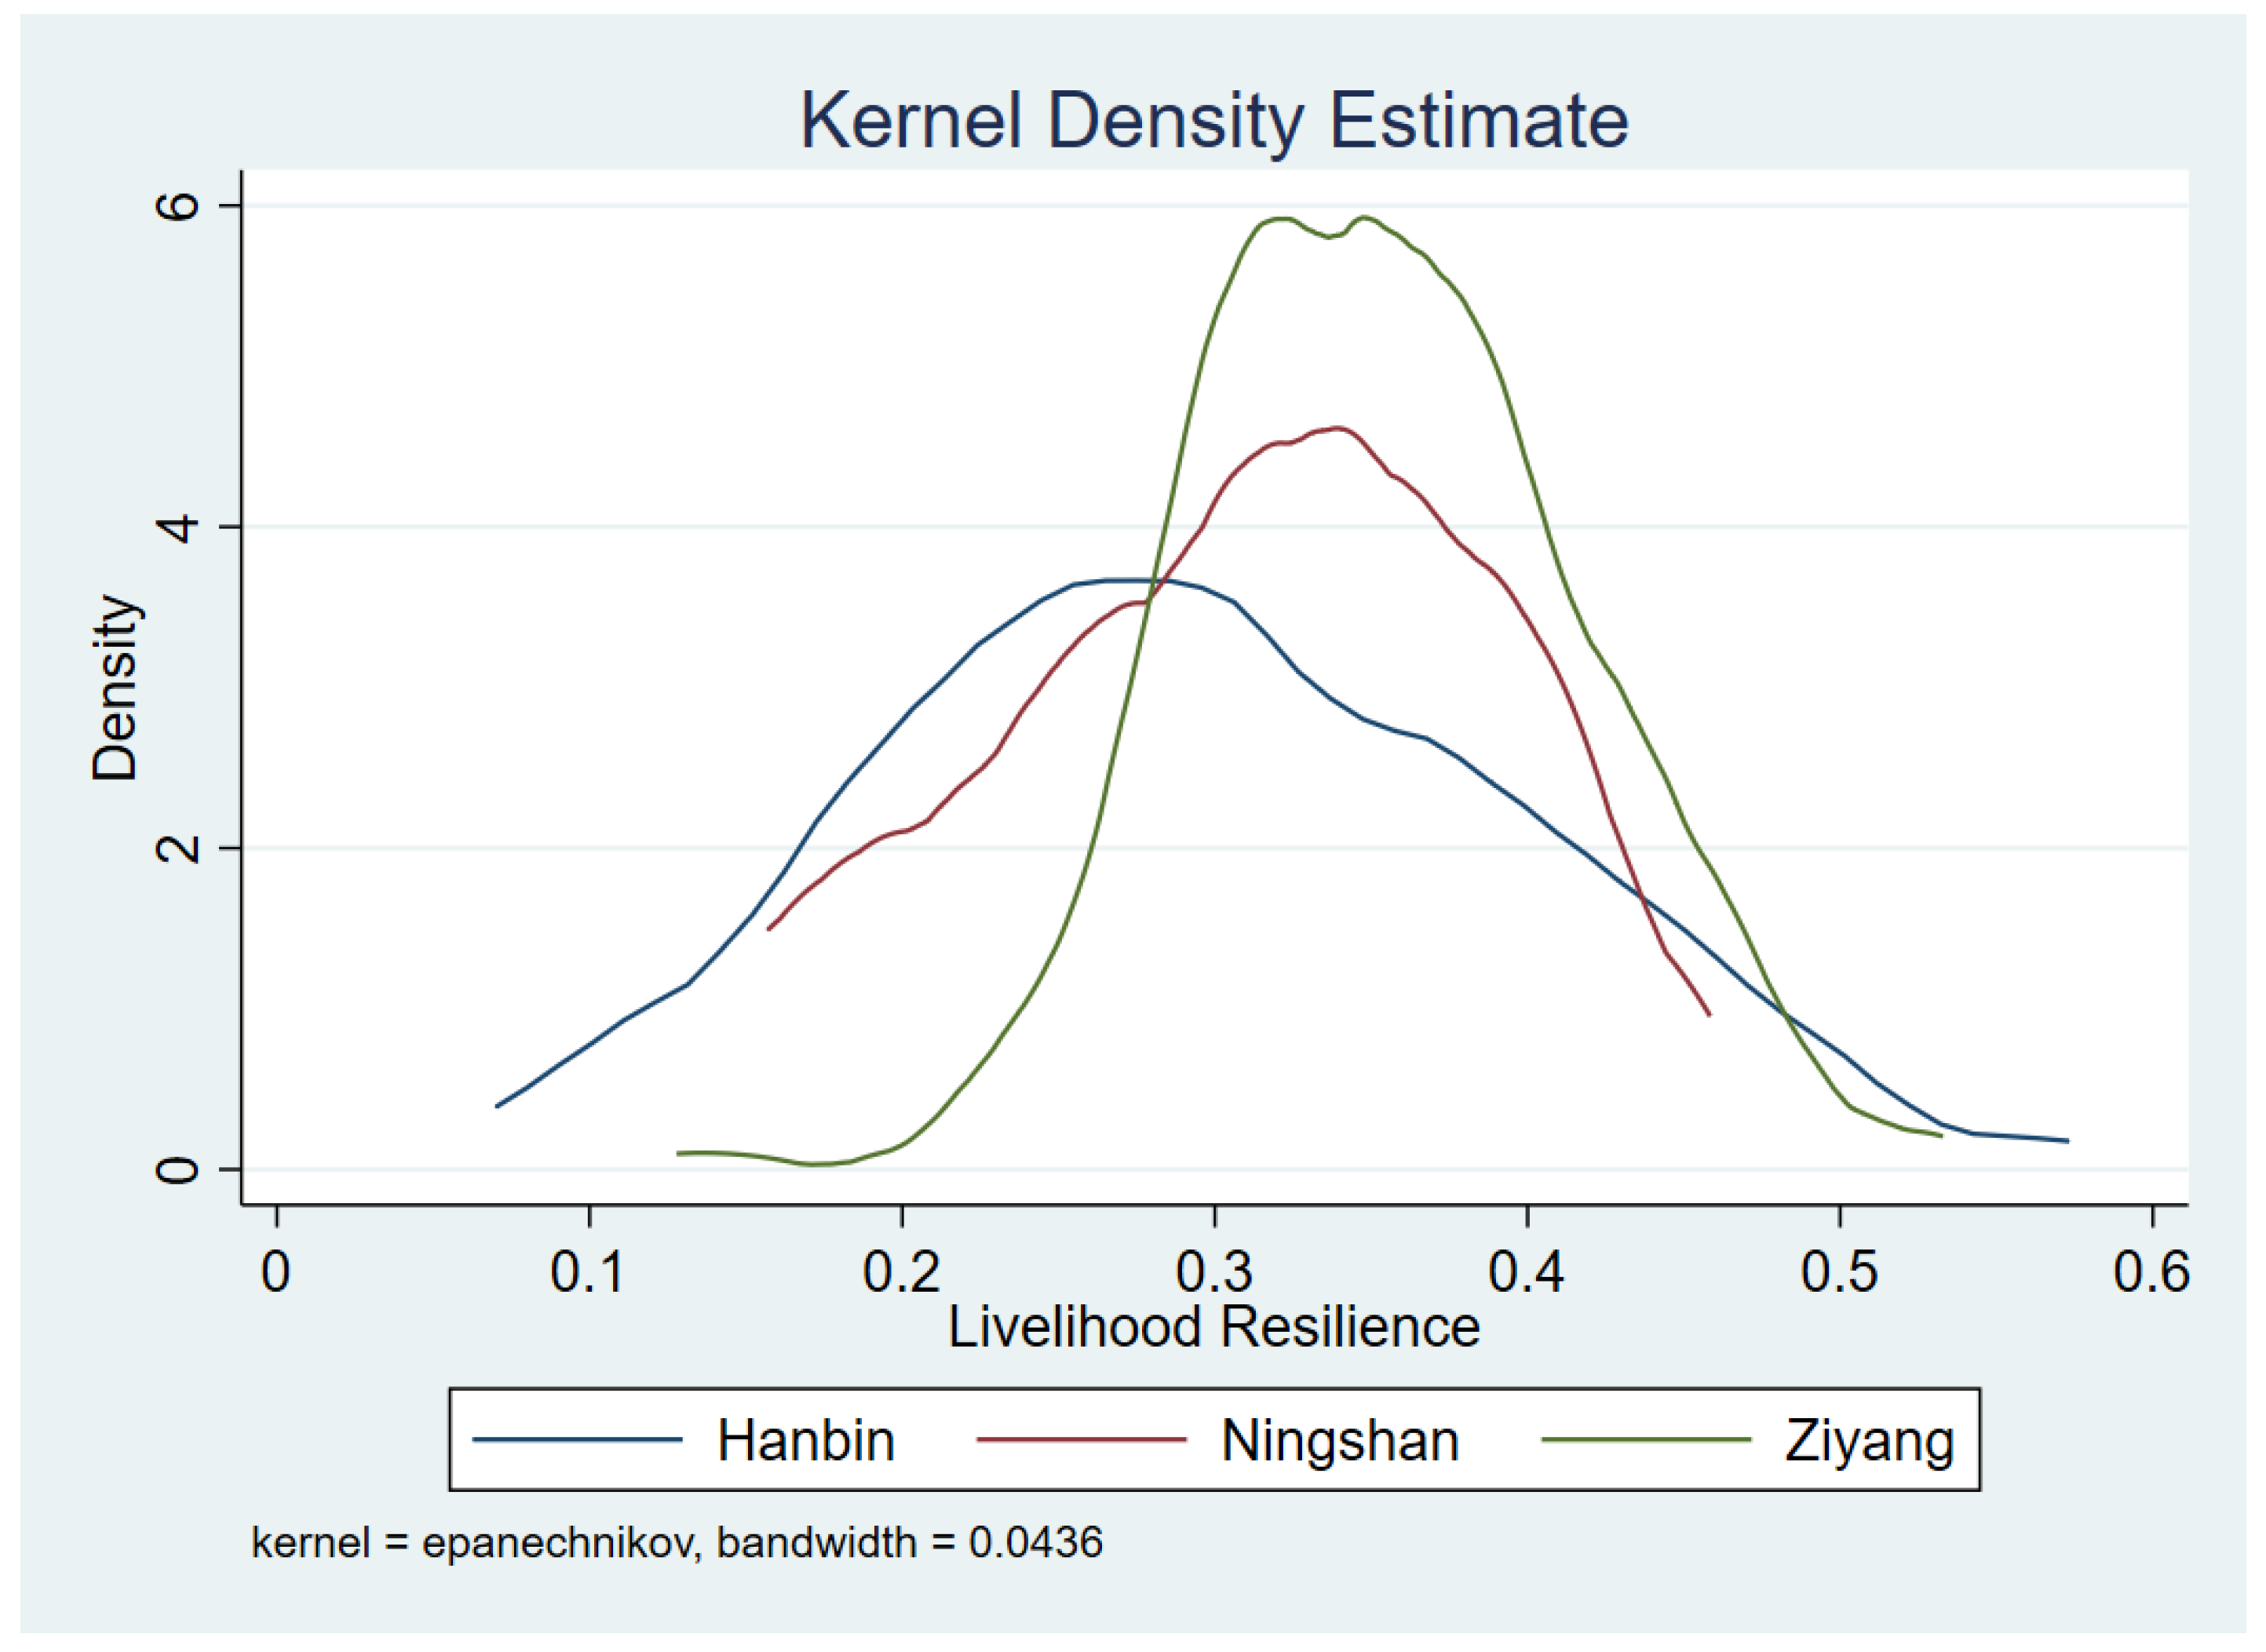
3.1. Descriptive Statistical Analysis of Livelihood Resilience of Households with Different Characteristics

Figure 3 shows a rose diagram of the distribution of the indicators of livelihood resilience of the sample households. From the above analysis, it is clear that the livelihood resilience of the households consists of 16 indicators, and the 10 indicators with larger mean values are shown in the rose diagram in Figure 3. Overall, “access to water”, “housing structure”, and “access to health services” had the highest mean values, indicating that households are richer in these three aspects of livelihood resilience. Next, “access to roads and markets”, “household health”, and “access to environmental services” had medium mean values. Finally, four indicators had the lowest mean values: “household size”, “access to loans”, “products and tools”, and “housing area”. This leads to the conclusion that the distribution of the indicators of livelihood resilience among households is generally stable.
In this study, the T-test method was used to analyze the livelihood resilience capital assets of and systematic differences between centralized and noncentralized resettlement households as well as new-stage and early-stage relocation households. The results are shown in Table 1. The distribution of natural, physical, financial, and social capital assets was uneven, and different relocation times and settlement approaches had varying effects on households’ livelihood resilience.
This study used violin plots to describe the livelihood resilience of different household sizes (Figure 4a) and education levels of household heads (Figure 4b). As demonstrated in Figure 4a, the upper quartile, lower quartile, and median of the violin chart shows a gradual upwards trend, indicating that the larger the household size, the higher the level of livelihood resilience. Similarly, the result of the violin chart in Figure 4b shows that the higher the education levels of the household head, the higher the level of livelihood resilience of the households.
Similarly, this study used violin plots to analyze the livelihood resilience of different risk management strategies. As shown in Figure 5, the upper quartile, lower quartile, and median of the violin plot corresponding to the livelihood resilience of households that adopt the strategy of drawing on savings are the highest. In contrast, the upper quartile, lower quartile, and median of the violin plot corresponding to the livelihood resilience of households that adopt the strategy of selling assets are the lowest. The upper quartile, lower quartile, and median of the violin plots corresponding to the remaining three risk management strategies are intermediate and similar to the previous plots. These results indicate that livelihood resilience values are generally higher and more concentrated for households that adopt the strategy of drawing on savings and are lower and more dispersed for those that adopt the strategy of selling assets.
Figure 6 uses kernel density estimation to estimate livelihood resilience in different surveyed districts and counties. The figure shows that the density distribution curves of livelihood resilience in the three districts and counties are similar in shape, but the kernel density values differ significantly. The curve for livelihood resilience in Ziyang County has the largest fluctuation and the highest kernel density value in the convex part, which indicates that the fluctuation of households’ livelihood resilience in this area is more obvious. Conversely, the livelihood resilience of households fluctuates less in Hanbin District.
This study used k-means cluster analysis to classify livelihood resilience into three types: high household livelihood resilience (High-HLR), medium household livelihood resilience (Medium-HLR), and low household livelihood resilience (Low-HLR). Table 2 compares the number and percentage of households with different relocation characteristics at different livelihood resilience levels. It can be found that regardless of the livelihood resilience level, the number and percentage of households in new-stage relocation, voluntary relocation, and centralized resettlement were much larger than those in early-stage relocation, involuntary relocation, and noncentralized resettlement. In the survey, many households said that in recent years, centralized resettlement can help them form a good social network, and borrowing money from acquaintances or key information provided by acquaintances can be of great help in case of emergencies.
Table 3 uses the T-test to compare the total livelihood resilience and the five capital assets of households under different relocation characteristics. For relocation time, the livelihood resilience of early-stage relocation was lower than that of new-stage relocation, but the difference was not significant. For relocation nature, compared with voluntary relocation households, involuntary relocation households had significantly weaker livelihood resilience. For settlement approach, compared with centralized resettlement households, noncentralized resettlement households had significantly weaker livelihood resilience. The results above show that the livelihood resilience of new-stage relocation, voluntary relocation, and centralized resettlement households is high and the livelihood resilience of early-stage relocation, involuntary relocation, and noncentralized resettlement households requires further improvement.

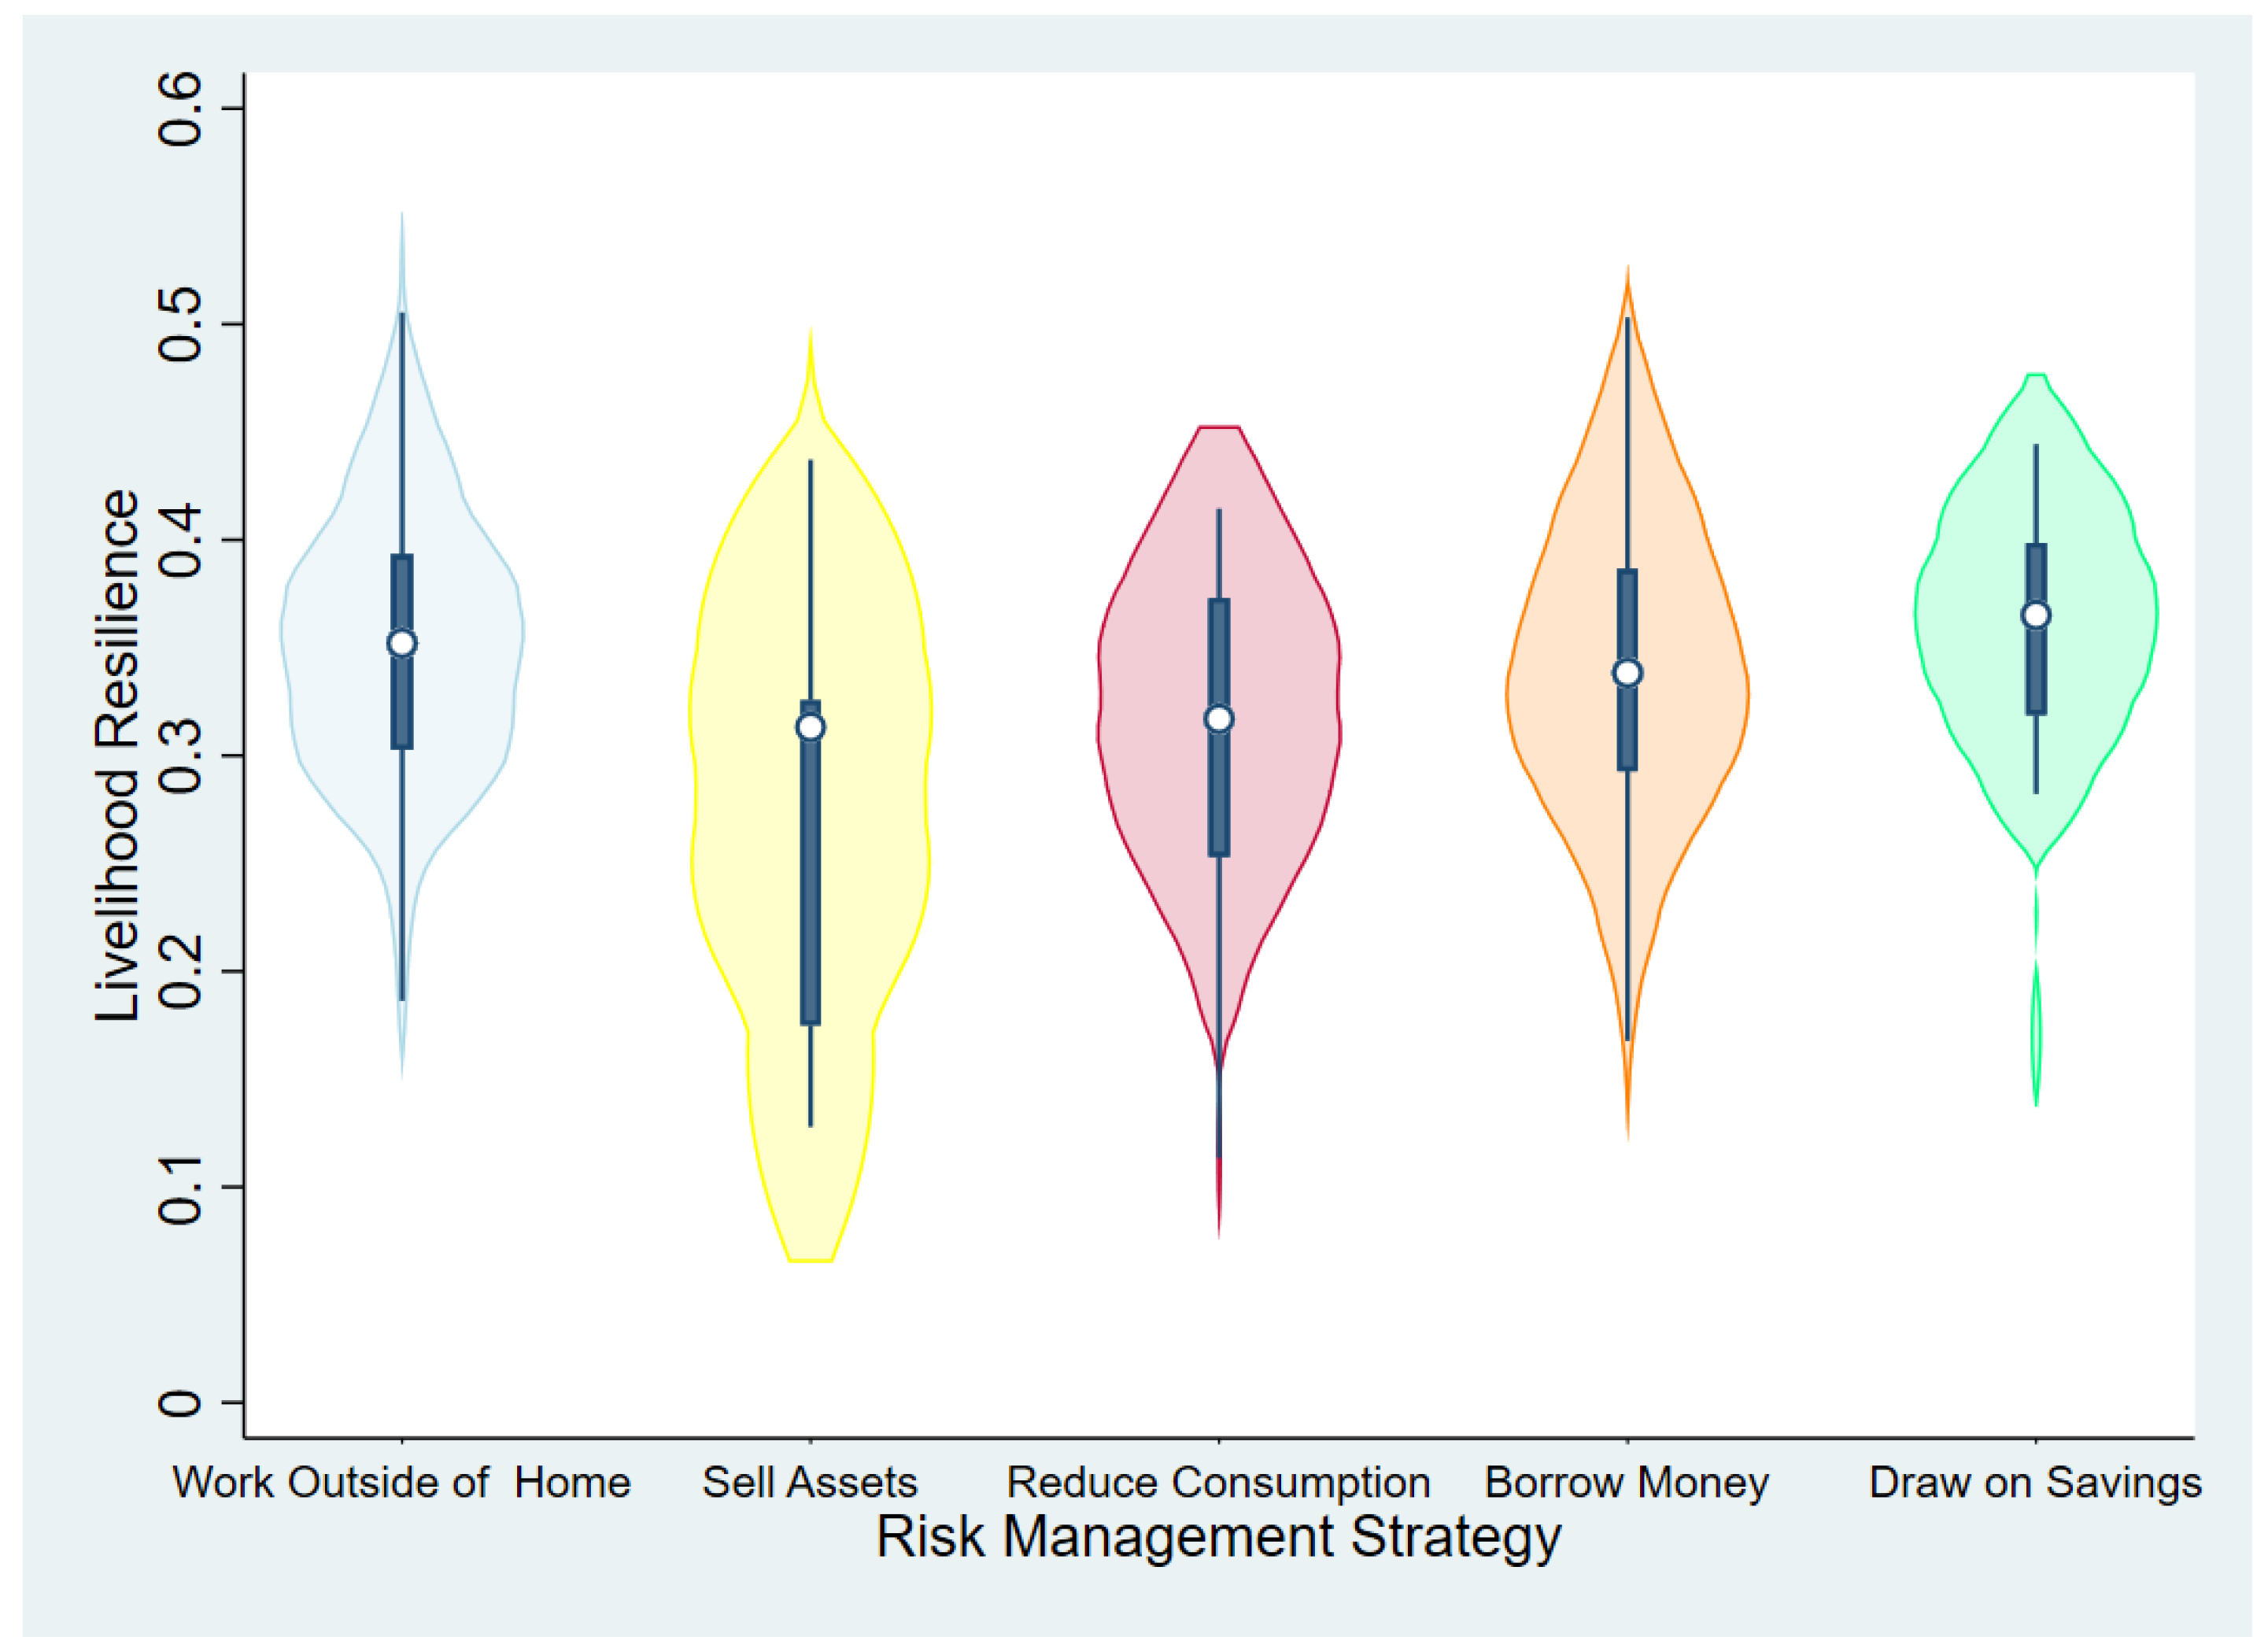
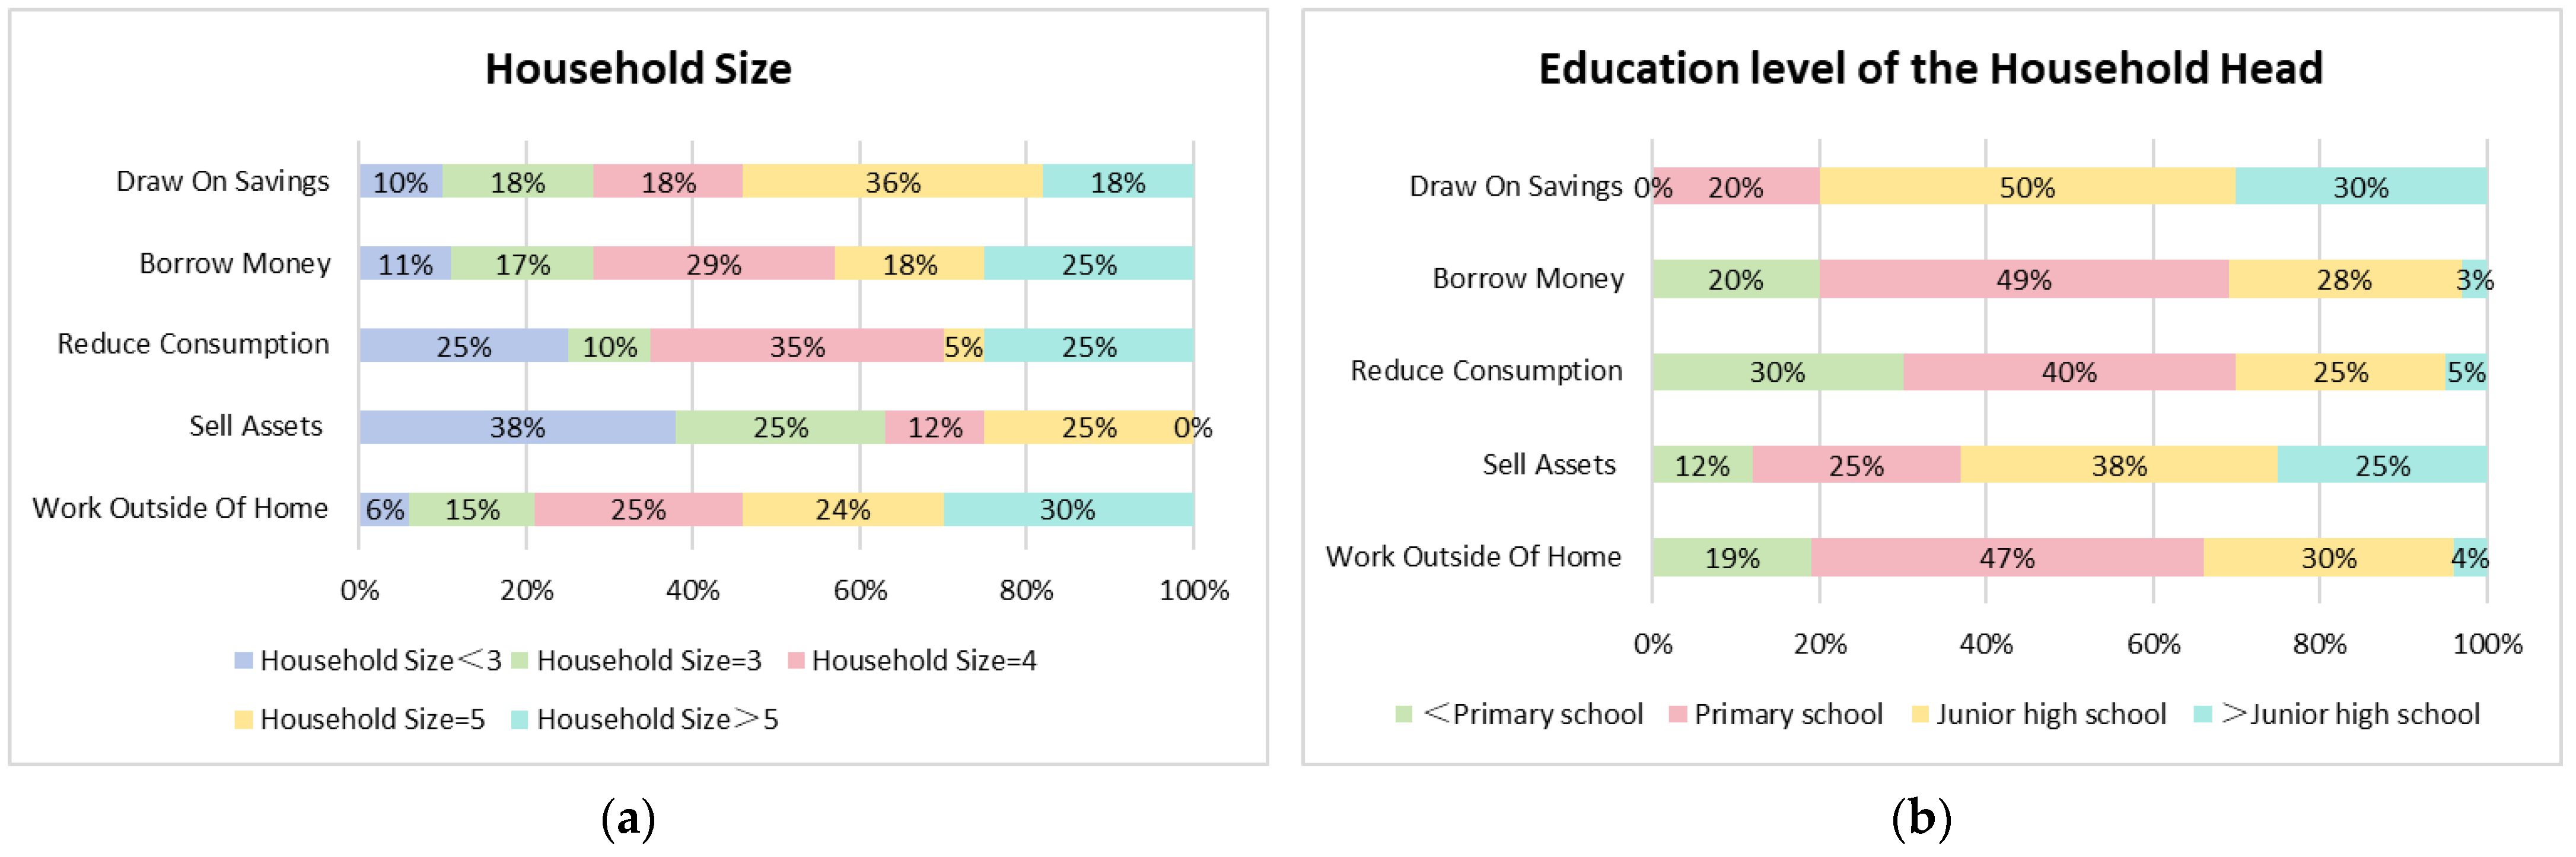
3.2. Analysis of the Choice of Risk Management Strategies with Different Family Characteristics

Figure 7a,b, respectively, show the choice of risk management strategies of households under different household sizes and the education levels of the household head. As shown in Figure 7a, a high proportion (30%) of households that choose the strategy of working outside of the home have a household size of >5. For households that choose the strategy of selling assets, the highest proportion (38%) of households have a household size of <3. As shown in Figure 7b, for households that choose the strategies of working outside of the home, reducing consumption and borrowing money, the highest proportion was that of households with heads having primary school education, accounting for 47%, 40%, and 49%, respectively. Thus, households’ choice of risk management strategies is not evenly distributed under different household sizes and education levels of the household head.
Table 4 displays the risk management strategies of households at different livelihood resilience levels. At different livelihood resilience levels, the use of working outside of the home as a strategy accounts for the largest proportion. In the interview process, it was found that in recent years, those relocated households who have fewer family members or older people no longer chose farming, but chose the strategy of working outside of the home to make a living. Moreover, the large number of elderly population is a common characteristic of relocated households, so working outside of the home has become one of the important ways to maintain their livelihoods. Compared with households with High-HLR and Low-HLR, households with Medium-HLR account for the largest proportion among the five risk management strategies.

4. Analysis of Factors Influencing the Choice of Risk Management Strategies for Disaster Resettlement Households

4.1. Analysis of the Impact of Households’ Livelihood Resilience and Its Dimensions on Risk Management Strategies

Table 5 uses multinomial logit regression models to discuss how livelihood resilience and the five capital assets affect risk management strategies. In this study, the strategy of borrowing money is selected as the reference group and compared with the other four risk management strategies. It should be noted that this study does not deny that households can adopt multiple strategies and diversified livelihood activities at the same time. When two strategies are compared, households are more inclined to adopt one of the strategies, then they will use this strategy as the main strategy and the other strategy as the secondary strategy. In addition, households can adopt other strategies, such as working outside of the home, borrowing money, and drawing on savings. The survey found that more than two-thirds of the children of relocated households have a strong need to purchase a house for their marriage, which is also an important reason for local households to choose relocation. A large part of the money for these households to achieve relocation came from parents and adult children who had been working outside of the home for many years, and a small part came from borrowing and drawing on savings.
The results of the comparison between working outside of the home and borrowing money show that the total livelihood resilience, physical capital assets, and human capital assets all promote the conversion of risk management strategies from borrowing money to working outside of the home. The results of the comparison between selling assets and borrowing money show that the total livelihood resilience has a substantial negative influence on the conversion of risk management strategies from borrowing money to selling assets. The results of the comparison between reducing consumption and borrowing money show that the total livelihood resilience and physical capital assets have a substantial negative influence on the conversion of risk management strategies from borrowing money to reducing consumption, respectively. The results of the comparison between drawing on savings and borrowing money show that the total livelihood resilience and physical capital assets are critical in the conversion of risk management strategies from borrowing money to drawing on savings. Natural capital assets have a substantial negative effect on the abovementioned conversion.

4.2. Analysis of the Impact of Households’ Livelihood Resilience Indicators on Risk Management Strategies

Table 6 further analyzes the impact of households’ livelihood resilience indicators, relocation characteristics, and follow-up support measures on the choice of risk management strategies. Specifically, when working outside of the home is compared with borrowing money, households with large farmland areas are more likely to borrow money; however, households with large woodland areas are more likely to work outside of the home. These results show that in the natural capital assets, when other factors remain unchanged, for each one-unit increase in farmland area, the probability of choosing to work outside of the home decreases by 5.658 times. However, for each one-unit increase in woodland area, the probability of choosing to work outside of the home increases by 64.004 times. In addition, households with complete products and tools or large household size are more willing to choose the strategy of working outside of the home. These results clearly show that, when other factors remain unchanged, for each one-unit increase in products and tools, the probability of choosing to work outside of the home increases by 5.243 times. In terms of human capital assets, when other factors remain unchanged, for each one-unit increase in household size, the probability of choosing to work outside of the home increases by 2.331 times. In addition, the later the relocation time, the more likely households are to choose the strategy of working outside of the home. This shows that in the relocation characteristics, when other factors remain unchanged, for each one-unit increase in relocation time, the probability of choosing to work outside of the home increases by 0.950 times.
Furthermore, when reducing consumption is compared with borrowing money, we find that households with large woodland areas or products and tools are more likely to choose the strategy of reducing consumption, while households with larger household size or training skills are more likely to choose the risk management strategy of borrowing money. Moreover, when drawing on savings are compared with borrowing money, we find that households with large farmland areas or woodland areas are more likely to choose the strategy of drawing on savings. Households with more products and tools are also more likely to choose the strategy of drawing on savings. However, households with higher levels of environmental services in their communities are more likely to choose the strategy of borrowing money. Similarly, voluntary relocation households are more likely to choose the strategy of drawing on savings.

5. Discussion and Conclusions

This study discusses and analyzes the influence of livelihood resilience and its dimensions and indicators, relocation characteristics, and follow-up support measures on risk management strategies. The results showed the following: (1) the distribution of the natural, physical, financial, and social capital assets of relocated households was unbalanced, and different relocation time and settlement approaches had different influence on livelihood resilience; (2) the risk management strategy of working outside of the home had the largest proportion at different livelihood resilience levels; (3) the livelihood resilience of households in new-stage of relocation, voluntary relocation, and centralized resettlement was higher; and (4) livelihood resilience and its dimensions and indicators, relocation characteristics, and follow-up support measures had different impacts on the selection of risk management strategies.
Livelihood resilience and its dimensions and indicators have different effects on households’ choice of risk management strategies. This is consistent with the conclusions of Babulo et al. [34], Fang et al. [39], Wan et al. [41], and Xu et al. [38]. First, the total livelihood resilience, physical capital assets, and human capital assets are critical in the conversion of risk management strategies from borrowing money to working outside of the home. This is possibly because supporting healthcare services in the relocated communities is conducive to improving the physical quality of relocated households [16], thus affecting their choice of the strategy of working outside of the home. In addition, many relocated households have large household size and heavy family burdens, so the labor force in the household chooses to work outside of the home to relieve the economic pressure, thus contributing to the improvement of livelihood resilience [39]. Second, the total livelihood resilience has a substantial negative influence on the conversion of risk management strategies from borrowing money to selling assets. This is likely because land is the predominant and most essential natural capital asset of households in China [61]. In general, households do not choose to sell their land to resist risks. Third, the total livelihood resilience and physical capital assets in livelihood resilience have a substantial negative influence on the conversion of risk management strategies from borrowing money to reducing consumption. This may be because, rather than reducing consumption of the material goods that are essential to agricultural production, such as products and tools, transportation, and water, households choose to borrow money to protect themselves against risks and boost their livelihood resilience [28,29,32]. Finally, the total livelihood resilience is critical in the conversion of risk management strategies from borrowing money to drawing on savings, which is contrary to the findings of Zhang et al. [62]. This may be because in the long term, the economic conditions of the relocated households will remain generally weak owing to the lack of sustained government subsidies [28]; moreover, households will find it difficult to seek assistance from relatives and friends, prompting them to choose the risk management strategy of drawing on savings. In addition, natural capital assets of livelihood resilience have a substantial negative influence on the conversion of risk management strategies from borrowing money to drawing on savings. This may be because when the natural assets of households are affected by environmental risks such as extreme weather [39,40,41], households’ savings are no longer sufficient in the face of risks. Thus, they need to borrow money to tackle difficulties as soon as possible.
Relocation characteristics and follow-up support measures also have different effects on the choice of risk management strategies. In the analysis of the influence of relocation characteristics on the choice of risk management strategies, relocation time is found to be critical in the conversion of risk management strategies from borrowing money to working outside of the home. This may be because the proportion of agricultural income in total household income has decreased over the years [63]. Therefore, households relocated after 2011 are more likely to choose the strategy of working outside of the home to maintain their livelihood and improve their resilience [38]. In addition, relocation nature is critical in the conversion of risk management strategies from borrowing money to drawing on savings, as demonstrated in the study by Liu et al. [6]. In order to improve living conditions, many households voluntarily choose to relocate. However, due to the relocation time of the relocated households being relatively short, households can only survive temporarily by drawing on savings [64]. In the analysis of the impact of follow-up support measures on the choice of risk management strategies, training measures have a substantial negative influence on the conversion of risk management strategy from borrowing money to reducing consumption. This may be because training policies are not yet well developed and there is a time lag in the implementation of these policies [34,65]. When households face such problems and want to continue to participate in training to improve their skills, they will choose to borrow money from relatives and friends.
However, our findings have a certain impact on the formulation and enhancement of follow-up support measures in disaster resettlement areas. The implications of our study are as follows: (1) establishing a fair and equitable distribution mechanism and realizing the reasonable allocation of livelihood resilience and the five capital assets; (2) building employment platforms and increasing employment opportunities; (3) improving livelihood resilience of relocated households and promoting diversification of livelihood sources; and (4) improving the follow-up support measures for disaster resettlement areas and enhancing the quality and standard of living of households.
This study has the following limitations. First, our study uses cross-sectional data to quantitatively examine the relationship between the livelihood resilience of smallholder households and risk management strategies, and lacks analysis of the dynamic changes of such livelihood resilience and choice of risk management strategies. Therefore, follow-up surveys are being planned to track the dynamics of disaster resettlement households. Second, the selection of indicators for livelihood resilience, namely, the five capital assets, may not be sufficient to represent essential variables (for example, area per farmland, area per woodland, and access to environmental services cannot fully represent natural capital assets). Therefore, the applicability of the selection of indicators for livelihood resilience needs to be further verified. Third, the findings of this study may be more applicable to developing countries and may not be generalizable to other countries.

Author Contributions

Overall planning, data processing, and model development: W.L. and W.F.; software: X.L. and Z.S.; formal analysis: X.L. and J.X.; writing—original draft preparation: X.L.; writing—review and editing: W.L. and X.L.; project administration: W.L.; funding acquisition: W.L. All authors have read and agreed to the published version of the manuscript.

Funding

This research was funded by the National Natural Science Foundation of China (Grant Nos. 71803149, 72022014, 723B2019, and 72474173), the Ministry of Education Humanities and Social Science Research Youth Fund Project (Grant No. 22YJCZH110 and No. 22XJC630007), the China Postdoctoral Science Foundation (Grant No. 2022M721904), the Natural Science Foundation of Shaanxi Province (Grant No. 2023JCYB607 and No. 2024JC-YBQN-0758), the Social Science Foundation of Shaanxi Province (Grant No. 2023R290), and the Scientific Research Program Funded by The research institute of new urbanization and human settlement in Shaanxi Province of XAUAT (Grant No. 2023SCZH14).

Institutional Review Board Statement

Not applicable.

Data Availability Statement

Data are available on request due to privacy/ethical restrictions.

Acknowledgments

The authors gratefully acknowledge the support of the local government and the patient cooperation of the interviewees during the data collection.

Conflicts of Interest

The authors declare no conflicts of interest.

References

  1. Lo, K.; Wang, M. How voluntary is poverty alleviation resettlement in China. Habitat Int. 2018, 73, 34–42. [Google Scholar] [CrossRef]
  2. Zhou, Y.; Guo, Y.; Liu, Y.; Wu, W.; Li, Y. Targeted poverty alleviation and land policy innovation: Some practice and policy implications from China. Land Use Policy 2018, 74, 53–65. [Google Scholar] [CrossRef]
  3. Vanclay, F. Project-induced displacement and resettlement: From impoverishment risks to an opportunity for development? Impact Assess. Proj. Apprais. 2017, 35, 3–21. [Google Scholar] [CrossRef]
  4. Chen, Y.; Tan, Y.; Luo, Y. Post-disaster resettlement and livelihood vulnerability in rural China. Disaster Prev. Manag. 2017, 26, 65–78. [Google Scholar] [CrossRef]
  5. Maldonado, J.K. A new path forward: Researching and reflecting on forced displacement and resettlement: Report on the international resettlement conference: Economics, social justice, and ethics in development-caused involuntary migration, the Hague, 4–8 October 2010. J. Refug. Stud. 2012, 25, 193–220. [Google Scholar] [CrossRef]
  6. Liu, W.; Xu, J.; Li, J.; Li, S.Z. Rural Households’ Poverty and Relocation and Settlement: Evidence from Western China. Int. J. Environ. Res. Public Health 2019, 16, 2609. [Google Scholar] [CrossRef]
  7. Wilmsen, B. After the deluge: A longitudinal study of resettlement at the Three Gorges Dam, China. World Dev. 2016, 84, 41–54. [Google Scholar] [CrossRef]
  8. Guo, X.; Kapucu, N. Examining livelihood risk perceptions in disaster resettlement. Disaster Prev. Manag. 2017, 26, 565–581. [Google Scholar] [CrossRef]
  9. Guo, X.; Kapucu, N. Examining the impacts of disaster resettlement from a livelihood perspective: A case study of Qinling Mountains, China. Disasters 2018, 42, 251–274. [Google Scholar] [CrossRef]
  10. Miani, A.M.; Dehkordi, M.K.; Siamian, N.; Lassois, L.; Tan, R.; Azadi, H. Toward sustainable rural livelihoods approach: Application of grounded theory in Ghazni province, Afghanistan. Appl Geogr. 2023, 154, 102915. [Google Scholar] [CrossRef]
  11. Jiao, X.; Pouliot, M.; Walelign, S.Z. Livelihood strategies and dynamics in rural Cambodia. World Dev. 2017, 97, 266–278. [Google Scholar] [CrossRef]
  12. Arnall, A.; Thomas, D.S.; Twyman, C.; Liverman, D. Flooding, resettlement, and change in livelihoods: Evidence from rural Mozambique. Disasters 2013, 37, 468–488. [Google Scholar] [CrossRef] [PubMed]
  13. Usamah, M.; Haynes, K. An examination of the resettlement program at Mayon Volcano: What can we learn for sustainable volcanic risk reduction? Bull. Volcanol. 2012, 74, 839–859. [Google Scholar] [CrossRef]
  14. Li, C.; Zheng, H.; Li, S.Z.; Chen, X.S.; Li, J.; Zeng, W.H.; Liang, Y.C.; Polasky, S.; Feldman, M.W.; Ruckelshaus, M.; et al. Impacts of conservation and human development policy across stakeholders and scales. Sustain. Sci. 2015, 112, 7396–7401. [Google Scholar] [CrossRef] [PubMed]
  15. Holling, C.S. Resilience and stability of ecological systems. Annu. Rev. Ecol. Evol. Syst. 1973, 17–19. [Google Scholar] [CrossRef]
  16. Brown, K. Global environmental change I: A social turn for resilience? Prog. Hum. Geog. 2014, 38, 107–117. [Google Scholar] [CrossRef]
  17. Quandt, A. Measuring livelihood resilience: The household livelihood resilience approach (HLRA). World Dev. 2018, 107, 253–263. [Google Scholar] [CrossRef]
  18. Tanner, T.; Lewis, D.; Wrathall, D.; Bronen, R.; Cradock-Henry, N.; Huq, S.; Lawless, C.; Nawrotzki, R.; Prasad, V.; Rahman, M.A.; et al. Livelihood resilience in the face of climate change. Nat. Clim. Chang. 2015, 5, 23–26. [Google Scholar] [CrossRef]
  19. Thulstrup, A.W. Livelihood resilience and adaptive capacity: Tracing changes in household access to capital in Central Vietnam. World Dev. 2015, 74, 352–362. [Google Scholar] [CrossRef]
  20. Sina, D.; Chang-Richards, A.Y.; Wilkinson, S.; Potangaroa, R. A conceptual framework for measuring livelihood resilience: Relocation experience from Aceh, Indonesia. World Dev. 2019, 117, 253–265. [Google Scholar] [CrossRef]
  21. Speranza, C.I.; Wiesmann, U.; Rist, S. An indicator framework for assessing livelihood resilience in the context of social–ecological dynamics. Global. Environ. Chang. 2014, 28, 109–119. [Google Scholar] [CrossRef]
  22. Tebboth, M.G.L.; Conway, D.; Adger, W.N. Mobility endowment and entitlements mediate resilience in rural livelihood systems. Glob. Environ. Chang. 2019, 54, 172–183. [Google Scholar] [CrossRef]
  23. Nyamwanza, A.M. Livelihood resilience and adaptive capacity: A critical conceptual review. Jamba-J. Disaster Risk Stud. 2012, 4, 1–6. Available online: https://hdl.handle.net/10520/EJC128737 (accessed on 27 May 2024). [CrossRef]
  24. Fang, Y.P.; Zhu, F.B.; Qiu, X.P.; Zhao, S. Effects of natural disasters on livelihood resilience of rural residents in Sichuan. Habitat Int. 2018, 76, 19–28. [Google Scholar] [CrossRef]
  25. Liu, W.; Li, J.; Xu, J. Effects of disaster-related resettlement on the livelihood resilience of rural households in China. Int. J. Disaster Risk Reduct. 2020, 49, 101649. [Google Scholar] [CrossRef]
  26. Harwood, J.L. Managing Risk in Farming: Concepts, Research, and Analysis; US Department of Agriculture, ERS: Washington, DC, USA, 1999.
  27. OECD. Managing Risk in Agriculture: A Holistic Approach; OECD: Paris, France, 2009. [Google Scholar]
  28. Li, Y.; Fan, P.; Liu, Y. What makes better village development in traditional agricultural areas of China? Evidence from long-term observation of typical villages. Habitat Int. 2019, 83, 111–124. [Google Scholar] [CrossRef]
  29. Jezeer, R.E.; Verweij, P.A.; Boot, R.G.; Junginger, M.; Santos, M.J. Influence of livelihood assets, experienced shocks and perceived risks on smallholder coffee farming practices in Peru. J. Environ. Manag. 2019, 242, 496–506. [Google Scholar] [CrossRef]
  30. Das, U.; Ansari, M.A.; Ghosh, S. Measures of livelihoods and their effect on vulnerability of farmers to climate change: Evidence from coastal and non-coastal regions in India. Environ. Dev. Sustain. 2023, 26, 4801–4836. [Google Scholar] [CrossRef]
  31. Quaglio, G.; Karapiperis, T.; Van Woensel, L.; Arnold, E.; McDaid, D. Austerity and health in Europe. Health Policy 2013, 113, 13–19. [Google Scholar] [CrossRef]
  32. Sannigrahi, S.; Zhang, Q.; Joshi, P.K.; Sutton, P.C.; Keesstra, S.; Roy, P.S.; Pilla, F.; Basu, B.; Wang, Y.; Jha, S.; et al. Examining effects of climate change and land use dynamic on biophysical and economic values of ecosystem services of a natural reserve region. J. Clean. Prod. 2020, 257, 120424. [Google Scholar] [CrossRef]
  33. Savari, M.; Amghani, M.S. SWOT-FAHP-TOWS analysis for adaptation strategies development among small-scale farmers in drought conditions. Int. J. Disaster Risk Reduct. 2022, 67, 102695. [Google Scholar] [CrossRef]
  34. Babulo, B.; Muys, B.; Nega, F.; Tollens, E.; Nyssen, J.; Deckers, J.; Mathijs, E. Household livelihood strategies and forest dependence in the highlands of Tigray, Northern Ethiopia. Agric. Syst. 2008, 98, 147–155. [Google Scholar] [CrossRef]
  35. Khan, M.A.; Hasan, K.; Kabir, K.H. Determinants of households’ livelihood vulnerability due to climate induced disaster in southwest coastal region of Bangladesh. Prog. Disaster Sci. 2022, 15, 100243. [Google Scholar] [CrossRef]
  36. Pagnani, T.; Gotor, E.; Caracciolo, F. Adaptive strategies enhance smallholders’ livelihood resilience in Bihar, India. Food Secur. 2021, 13, 419–437. [Google Scholar] [CrossRef]
  37. Azad, M.J.; Pritchard, B. Financial capital as a shaper of households’ adaptive capabilities to flood risk in northern Bangladesh. Ecol. Econ. 2022, 195, 107381. [Google Scholar] [CrossRef]
  38. Xu, D.; Deng, X.; Guo, S.; Liu, S. Sensitivity of livelihood strategy to livelihood capital: An empirical investigation using nationally representative survey data from rural China. Soc. Indic. Res. 2019, 144, 113–131. [Google Scholar] [CrossRef]
  39. Fang, Y.P.; Fan, J.; Shen, M.Y.; Song, M.Q. Sensitivity of livelihood strategy to livelihood capital in mountain areas: Empirical analysis based on different settlements in the upper reaches of the Minjiang River, China. Ecol. Indic. 2014, 38, 225–235. [Google Scholar] [CrossRef]
  40. Martin, S.M.; Lorenzen, K.A.I. Livelihood diversification in rural Laos. World Dev. 2016, 83, 231–243. [Google Scholar] [CrossRef]
  41. Wan, J.; Deng, W.; Song, X.; Liu, Y.; Zhang, S.; Su, Y.; Lu, Y. Spatio-temporal impact of rural livelihood capital on labor migration in Panxi, southwestern mountainous region of China. Chin. Geogr. Sci. 2018, 28, 153–166. [Google Scholar] [CrossRef]
  42. Su, F.; Tian, X.; Zheng, Y.P. Analysis of the impact of livelihood risk on farmers’ coping strategies. J. China Agric. Univ. 2018, 23, 226–240. (In Chinese) [Google Scholar]
  43. Xu, D.; Qing, C.; Deng, X.; Yong, Z.L.; Zhou, W.F.; Ma, Z.X. Disaster Risk Perception, Sense of Pace, Evacuation Willingness, and Relocation Willingness of Rural Households in Earthquake-Stricken Areas: Evidence from Sichuan Province, China. Int. J. Disaster Risk Reduct. 2020, 17, 602. [Google Scholar] [CrossRef] [PubMed]
  44. Cerda, A.; Rodrigo-Comino, J.; Gimenez-Morera, A.; Keesstra, S.D. An economic, perception and biophysical approach to the use of oat straw as mulch in Mediterranean rainfed agriculture land. Ecol. Eng. 2017, 108, 162–171. [Google Scholar] [CrossRef]
  45. Cerda, A.; Rodrigo-Comino, J.; Gimenez-Morera, A.; Keesstra, S.D. Hydrological and erosional impact and farmer’s perception on catch crops and weeds in citrus organic farming in Canyoles river watershed, Eastern Spain. Agric. Ecosyst. Environ. 2018, 258, 49–58. [Google Scholar] [CrossRef]
  46. Liu, W.; Li, J.; Ren, L.J.; Xu, J.; Li, C.; Li, S.Z. Exploring livelihood resilience and its impact on livelihood strategy in rural China. Soc. Indic. Res. 2020, 150, 977–998. [Google Scholar] [CrossRef]
  47. Liu, W.; Cheng, Y.; Li, J.; Feldman, M. Livelihood adaptive capacities and adaptation strategies of relocated households in rural China. Front. Sustain. Food Syst. 2022, 6, 1067649. [Google Scholar] [CrossRef]
  48. Galarza-Villamar, J.A.; Leeuwis, C.; Pila-Quinga, G.M.; Cecchi, F.; Parraga-Lema, C.M. Local understanding of disaster risk and livelihood resilience: The case of rice smallholders and floods in Ecuador. Int. J. Disaster Risk Reduct. 2018, 31, 1107–1120. [Google Scholar] [CrossRef]
  49. Choden, K.; Keenan, R.J.; Nitschke, C.R. An approach for assessing adaptive capacity to climate change in resource dependent communities in the Nikachu watershed, Bhutan. Ecol. Indic. 2020, 114, 106293. [Google Scholar] [CrossRef]
  50. Zhou, W.; Guo, S.; Deng, X.; Xu, D. Livelihood resilience and strategies of rural residents of earthquake-threatened areas in Sichuan Province, China. Nat. Hazards 2021, 106, 255–275. [Google Scholar] [CrossRef]
  51. Nadeem, A.M.; Rafique, M.Z.; Bakhsh, K.; Makhdum, M.S.A.; Huang, S. Impact of socio-economic and water access conditions on life satisfaction of rural farmers in Faisalabad district of Pakistan. Water Policy 2020, 22, 686–701. [Google Scholar] [CrossRef]
  52. Kuang, F.; Jin, J.; He, R.; Ning, J.; Wan, X. Farmers’ livelihood risks, livelihood assets and adaptation strategies in Rugao City, China. J. Environ. Manag. 2020, 264, 110463. [Google Scholar] [CrossRef]
  53. Li, J. Livelihood adaptation strategy and perceived adaptive capacity of rural relocated households in Southern Shaanxi Province, China. China Popul. Resour. Environ. 2016, 26, 44–52. [Google Scholar]
  54. Mutabazi, K.D.; Amjath-Babu, T.S.; Sieber, S. Influence of livelihood resources on adaptive strategies to enhance climatic resilience of farm households in Morogoro, Tanzania: An indicator-based analysis. Reg. Environ. Chang. 2015, 15, 1259–1268. [Google Scholar] [CrossRef]
  55. Cooper, S.J.; Wheeler, T. Adaptive governance: Livelihood innovation for climate resilience in Uganda. Geoforum 2015, 65, 96–107. [Google Scholar] [CrossRef]
  56. Sina, D.; Chang-Richards, A.Y.; Wilkinson, S.; Potangaroa, R. What does the future hold for relocated communities post-disaster? Factors affecting livelihood resilience. Int. J. Environ. Res. 2019, 34, 173–183. [Google Scholar] [CrossRef]
  57. Merritt, W.S.; Patch, B.; Reddy, V.R.; Syme, G.J. Modelling livelihoods and household resilience to droughts using Bayesian networks. Environ. Dev. Sustain. 2016, 18, 315–346. [Google Scholar] [CrossRef]
  58. Lacus, S.M.; King, G.; Porro, G. Causal inference without balance checking: Coarsened exact matching. Political Anal. 2012, 20, 1–24. [Google Scholar] [CrossRef]
  59. Lacus, S.M.; King, G.; Porro, G. Multivariate matching methods that are monotonic imbalance bounding. J. Am. Stat. Assoc. 2011, 106, 345–361. [Google Scholar] [CrossRef]
  60. Shankar, V.; Mannering, F. An exploratory multinomial logit analysis of single-vehicle motorcycle accident severity. J. Safety Res. 1996, 27, 183–194. [Google Scholar] [CrossRef]
  61. Zhang, Q. Land use and adaptive governance under climate change: Analysis of four cases in pastoral areas of China. Front. Environ. Sci. 2023, 11, 922417. [Google Scholar] [CrossRef]
  62. Zhang, Q.; Xue, H.; Zhao, X.; Tang, H. Linking livelihood assets of smallholder households to risk management strategies: An empirical study in China. Environ. Hazards 2019, 18, 191–211. [Google Scholar] [CrossRef]
  63. Liu, J.; Lu, Y.; Xu, Q.; Yang, Q. Public health insurance, non-farm labor supply, and farmers’ income: Evidence from New Rural Cooperative Medical Scheme. Int. J. Environ. Res. Public Health 2019, 16, 4865. [Google Scholar] [CrossRef] [PubMed]
  64. Mukul, S.A.; Rashid, A.Z.M.; Uddin, M.B.; Khan, N.A. Role of non-timber forest products in sustaining forest-based livelihoods and rural households’ resilience capacity in and around the protected area: A Bangladesh study. J. Environ. Plan Manag. 2016, 59, 628–642. [Google Scholar] [CrossRef]
  65. Guo, H.; Rogers, S.; Li, J.; Li, C. Farmers to urban citizens? Understanding resettled households’ adaptation to urban life in Shaanxi, China. Cities 2024, 145, 104667. [Google Scholar] [CrossRef]
Figure 1. The location of the study area.
Agriculture 14 01599 g001
Figure 2. The livelihood resilience evaluation indicator system.
Agriculture 14 01599 g002
Figure 3. Distribution of indicators of livelihood resilience of sample households. Note: The numbers in brackets represent the mean value of indicators of livelihood resilience of the sample households, and the blue circle represents the mean of the ten indicators.
Agriculture 14 01599 g003
Figure 4. (a) Livelihood resilience of different household sizes. (b) Livelihood resilience of different education levels of household heads. Note: In (a), the horizontal coordinates “<3, 3, 4, 5 and >5” indicate that the household sizes of the household are less than 3, 3, 4, 5, and more than 5 people, respectively.
Agriculture 14 01599 g004
Figure 5. Livelihood resilience for different risk management strategies.
Agriculture 14 01599 g005
Figure 6. Kernel density estimates of livelihood resilience in three districts and counties.
Agriculture 14 01599 g006
Figure 7. (a) Choice of risk management strategies for households with different household sizes. (b) Choice of risk management strategies for households with different education levels of the household head.
Agriculture 14 01599 g007
Table 1. Comparison of household livelihood resilience indicators for disaster resettlement households.
IndicatorsNew-StageEarly-StageCentralizedNoncentralizedT1-TestT2-Test
MeanStd. Dev.MeanStd. Dev.MeanStd. Dev.MeanStd. Dev.
Area per farmland0.0940.2230.0440.0950.0830.2120.0630.107−2.573−0.933
Area per woodland0.2591.6050.2931.2890.1770.4580.5833.0500.2212.356
Access to environmental services0.5520.3500.5440.3700.5890.3440.4050.354−0.219−4.781
Access to water0.9970.0560.9290.2580.9720.1660.9900.098−4.4291.087
Access to roads and markets0.8380.2600.7540.3420.8550.2560.6550.346−2.877−6.431
Housing area149.71375.268168.19994.196152.66171.863163.409108.5152.2351.184
Housing structure0.9700.1210.9050.2090.9600.1430.9170.189−4.139−2.505
Products and tools0.3310.1230.3550.1140.3310.1140.3610.1371.9762.265
Access to health services0.9300.2560.9220.2690.9600.1950.8180.387−0.293−5.077
Household health2.3690.7692.2690.7662.3490.7922.3210.686−1.094−0.288
Household size4.5191.5464.4331.6494.5061.5594.5331.704−0.5400.156
Per capital income5786.4626206.8175344.2236309.8735242.7685963.6976960.5386954.015−0.6992.492
Access to loans2.4211.3132.4931.3442.3741.3252.6891.2850.5332.154
Access to help4.0114.8503.3864.9844.0125.2333.1393.355−1.260−1.613
Number of cadres0.3581.1090.3691.0650.4071.1670.2360.8110.096−1.408
Cooperative participation0.0190.1370.0850.4850.0290.1970.1050.5362.2132.223
Sample size314141354105
Table 2. Comparison of livelihood resilience levels of households with different relocation characteristics.
Relocation
Characteristics
Relocation TimeRelocation NatureSettlement Approach
New-StageEarly-StageVoluntaryInvoluntaryCentralizedNoncentralized
High-HLR783510589320
(26.441%)(25.362%)(28.000%)(13.333%)(27.596%)(20.408%)
Medium-HLR138571732315145
(46.780%)(41.304%)(46.133%)(38.333%)(44.807%)(45.918%)
Low-HLR794697299333
(26.780%)(33.333%)(25.867%)(48.333%)(27.596%)(33.673%)
Total2951383756033798
Note: “High-HLR” means high household livelihood resilience; “Medium-HLR” means medium household livelihood resilience; “Low-HLR” means low household livelihood resilience.
Table 3. Comparison of livelihood resilience and five capital assets of households with different relocation characteristics.
Relocation
Characteristics
Relocation TimeRelocation NatureSettlement Approach
New-StageEarly-Staget-TestVoluntaryInvoluntaryt-TestCentralizedNoncentralizedt-Test
Livelihood resilience 0.3480.338−1.2720.3510.3025.180 ***0.3490.330−2.390 **
Natural capital assets 0.0400.038−0.9430.0420.0264.759 ***0.0420.030−4.635 ***
Physical capital assets0.1370.1303.565 ***0.1370.1215.973 ***0.1360.129−3.314 ***
Human capital assets0.1160.1170.3070.1180.1053.269 ***0.1180.109−2.723 ***
Financial capital assets0.0460.0470.2770.0470.043−0.8500.0440.0542.762 ***
Social capital assets0.0070.0070.2360.0070.006−0.8610.0080.006−0.920
Note: **, and *** indicate significance at the level of 5%, and 1%, respectively.
Table 4. Comparison of risk management strategies of households with different levels of livelihood resilience.
Risk Management StrategyHigh-HLRMedium-HLRLow-HLRTotal
Work outside of home6311565243
(16.406%)(29.948%)(16.927%)(63.281%)
Sell assets1438
(0.260%)(1.042%)(0.781%)(2.083%)
Reduce consumption28818
(0.521%)(2.083%)(2.083%)(4.688%)
Borrow money254633104
(6.510%)(11.979%)(8.594%)(27.083%)
Draw on savings45211
(1.042%)(1.302%)(0.521%)(2.865%)
Total95178111384
(24.740%)(46.354%)(28.906%)(100%)
Note: “High-HLR” means high household livelihood resilience; “Medium-HLR” means medium household livelihood resilience; “Low-HLR” means low household livelihood resilience.
Table 5. Regression results of the impact of households’ livelihood resilience and its dimensions on the choice of risk management strategies after CEM.
VariablesWork Outside of HomeSell AssetsReduce ConsumptionDraw on Savings
Whether relocated−1.348 **2.844 *2.996 **−2.439 **
(−2.55)(1.85)(2.20)(−2.42)
Livelihood resilience8.185 ***−16.940 **−9.460 *11.823 **
(3.01)(−2.42)(−1.69)(2.20)
Age−0.506 *0.3100.247−0.088
(−1.85)(0.35)(0.41)(−0.18)
Average years of education0.227 **0.215−0.2240.586 ***
(2.44)(0.76)(−1.22)(2.80)
Livelihood diversification0.350 *−0.5740.2650.440
(1.89)(−0.93)(0.70)(1.16)
Pseudo R20.1259
Whether relocated−1.755 **3.274 **3.362 **−1.878
(−2.44)(2.02)(2.05)(−1.43)
Natural capital assets−1.348−22.859−9.567−28.052 *
(−0.18)(−1.30)(−0.74)(−1.95)
Physical capital assets25.740 **−24.941−34.664 *53.543 **
(2.32)(−0.93)(−1.93)(2.11)
Human capital assets9.737 *−15.2739.5899.398
(1.75)(−1.05)(0.85)(0.92)
Financial capital assets7.9353.082−18.90416.765
(1.30)(0.15)(−1.13)(1.31)
Social capital assets−18.0257.359−43.16519.439
(−1.08)(0.17)(−0.61)(0.77)
Age−0.495 *0.0470.233−0.169
(−1.76)(0.05)(0.37)(−0.33)
Average years of education0.226 **0.190−0.1980.541
(2.37)(0.66)(−1.04)(2.51)
Livelihood diversification0.309−0.6890.2070.336
(1.61)(−0.92)(0.50)(0.84)
Pseudo R20.1680
Note: *, **, and *** indicate significance at the level of 10%, 5%, and 1%, respectively.
Table 6. Regression results on the impact of households’ livelihood resilience indicators on the choice of risk management strategies after CEM.
VariablesWork Outside
of Home
Sell AssetsReduce
Consumption
Draw on
Savings
Whether relocated−2.450 **0.0401.927−4.704
(−1.98)(0.00)(0.54)(−1.54)
Livelihood
resilience
Area per farmland−5.658 *−6.637−30.5428.743 **
(−1.76)(−0.00)(−1.43)(2.28)
Area per woodland 64.004 *−8.69480.433 **86.674 **
(1.89)(−0.00)(2.23)(2.42)
Access to environmental services−0.227−0.985−1.560−3.694 **
(−0.36)(−0.01)(−1.10)(−2.10)
Access to water1.306−0.112−1.6412.422
(1.58)(−0.00)(−0.88)(0.79)
Access to roads and markets0.8571.031−4.5031.166
(0.67)(0.00)(−1.45)(0.41)
Housing area−1.524−3.588−17.0901.670
(−0.82)(−0.00)(−1.54)(0.40)
Housing structure−1.675−0.415−1.8041.193
(−1.02)(−0.00)(−0.36)(0.26)
Products and tools5.243 ***3.4899.110 *11.016 ***
(2.95)(0.01)(1.70)(2.71)
Access to health services1.239−0.8645.917−2.433
(1.33)(−0.00)(1.47)(−0.98)
Household health−0.4181.543−1.157−0.395
(−0.52)(0.01)(−0.56)(−0.19)
Household size2.331 **−5.597−7.327 *4.621
(2.08)(−0.01)(−1.85)(1.60)
Per capital income2.1715.3188.0920.119
(0.32)(0.00)(0.78)(0.02)
Access to loans0.9080.041−3.8931.002
(1.26)(0.00)(−1.49)(0.53)
Access to help−4.350−7.846−2.3980.857
(−1.57)(−0.00)(−0.23)(0.21)
Number of cadres1.237−0.231−4.8426.235
(0.37)(−0.00)(−0.28)(1.31)
Cooperative
participation
−2.5001.591−112.1211.004
(−1.12)(0.00)(−0.00)(0.24)
Relocation
characteristics
Relocation time0.950 **−0.336−0.3280.958
(2.03)(−0.00)(−0.26)(0.52)
Relocation nature0.186−0.163−0.2826.065 **
(0.28)(−0.00)(−0.14)(2.25)
Settlement approach−0.1160.9361.0991.351
(−0.20)(0.00)(0.67)(0.68)
Follow-up
support measures
Industrial support0.206−0.0061.775−0.984
(0.56)(−0.00)(1.61)(−0.67)
Employment support−0.1180.1211.4320.389
(−0.31)(0.00)(1.11)(0.31)
Training−0.453−0.659−3.710 **0.518
(−1.55)(−0.00)(−2.19)(0.71)
Age−0.575 *−0.223−0.1350.077
(−1.83)(−0.00)(−0.13)(0.12)
Average years of education0.242 **−0.153−0.2510.701 **
(2.13)(0.00)(−0.92)(2.30)
Livelihood Diversification0.031−0.7320.101−0.503
(0.13)(−0.01)(0.13)(−0.75)
Pseudo R20.4076
Note: *, **, and *** indicate significance at the level of 10%, 5%, and 1%, respectively.
Disclaimer/Publisher’s Note: The statements, opinions and data contained in all publications are solely those of the individual author(s) and contributor(s) and not of MDPI and/or the editor(s). MDPI and/or the editor(s) disclaim responsibility for any injury to people or property resulting from any ideas, methods, instructions or products referred to in the content.

