Article

Current Framework of Italian Agriculture and Changes between the 2010 and 2020 Censuses

Department of Agricultural, Food and Forestry Sciences, Università Degli Studi di Palermo, 90123 Palermo, Italy
*
Author to whom correspondence should be addressed.
Agriculture 2024, 14(9), 1603; https://doi.org/10.3390/agriculture14091603
Submission received: 10 May 2024 / Revised: 31 August 2024 / Accepted: 9 September 2024 / Published: 13 September 2024
(This article belongs to the Section Agricultural Economics, Policies and Rural Management)

Abstract

:
This study aims to describe the current framework of the Italian agricultural sector and the changes that occurred in the decade between the two general censuses of agriculture of 2010 and 2020, and the EU Common Agricultural Policy (CAP) programming period 2014–2020. The General Census of Agriculture is an economic census carried out to fulfill international and EU legislation requirements, but also to meet national information needs. It consists in counting farms and identifying their characteristics. For this study, the official data of the 7th Italian General Census of Agriculture (GCA) of 2020 were collected, analyzed, and compared to those of the previous 6th GCA of 2010. Farms’ type of activities, structure, digitalization/computerization, innovation, and workforces’ characteristics were analyzed. Correlations between farms with investments in innovation and other variables like the age and the educational qualification of entrepreneurs and the farm’s size (agricultural used area) were calculated. Groups of similar Italian regions for types of farm and types of farming (segmenting the sector into subsets of regions that share common characteristics), and groups of similar farming characteristics in the entire agricultural sector, were highlighted. The results showed a notable positive correlation between farms’ investment in innovation and farms’ size, and a medium but positive correlation also with other two variables, the entrepreneur’s range of age and educational qualification. Results found groups of regions that are similar in terms of types of farm and farming types, highlighting that the agricultural sector in Italy is not homogeneous among all the regions of north, center, and south. Moreover, the discovered different groups of farming characteristics highlighted the Italian “farm profiles”, i.e., descriptions of key information about different specific types of farm. The overall analysis of all the results of this study provided the current situation of the Italian agricultural sector and discussion about its characteristics and changes during the last ten years. Based on our knowledge, this study is the first one with such a level of comprehensiveness. Findings are of high interest to academics in agriculture economics and policy maker, because they contribute to identifying the farms’ and territories’ strategic elements that require strengthening to foster economic and social development. Moreover these findings may provide food for thought on the effectiveness of the development strategy of the EU CAP 2023–2027 (through greening and digitization) at the regional and European levels, starting from the baseline situation of this country, which is certainly one, but which is among the most relevant ones in the European agri-food system and also globally.

1. Introduction

This paper aims to present the current framework of the agricultural sector in Italy, highlighting interesting insights into the current situation of the Italian agro-food system, in the context of the European Union (EU)’s Common Agricultural Policy (CAP) and in consideration of the new opening scenario of the EU CAP 2023–2027 [1].
The General Census of Agriculture is an economic census which consists in counting farms in Europe and identifying their characteristics. The agricultural census is carried out not only to fulfill international and EU legislation requirements, but also, and more importantly, to meet national information needs [2,3].
There are just over 9 million farms in Europe with a utilized agricultural area (UAA) of 157,415,700 ha and a total agricultural area of 190,382,400. The European farm census program was implemented in 1966 to determine changes in farm structure and to provide a statistical knowledge base which is essential for monitoring and evaluating the Common Agricultural Policy (CAP).
Agricultural statistics for 2020 were defined in November 2015 by the European Statistical System Committee (ESS) and involve the adoption of two framework regulations covering aspects of agricultural statistics, with the exception of economic accounts for agriculture. These two regulations define the statistical framework within which the census is conducted and the definitions of the variables to be used.
The main objectives of the Census of Agriculture have remained largely unchanged over the past decades. In order to contribute to the common effort of all United Nations agencies to monitor progress in achieving the Millennium Development Goals (MDGs), an additional goal concerning food security was added in the most recent program to the traditional goals. The objectives of the World Programme for the Census of Agriculture 2010 are as follows:
  • To provide detailed statistical information on the structure of the primary sector for smaller administrative units;
  • To validate the information collected in periodic sample surveys characterized by a limited sample size and consequently non-negligible sampling error;
  • To provide an indispensable information base for the preparation and updating of farm records to be used in order to obtain an efficient sample design in the execution of the various thematic surveys conducted in intercensal years;
  • To monitor countries’ progress in reducing the proportion of the population living in extreme poverty (<$1.25 a day) and who are malnourished (Goal 1 of the MDGs).
Censuses of agriculture are very important because knowledge and evaluation of the profound structural changes, which have occurred over time, are of enormous interest to agricultural economists (scholars and researchers). Indeed, agricultural economists analyze the economic data and provide insights for policy makers, farms, and stakeholders at the national and European levels.
Italy is one of the largest agricultural producers and processors of food in the EU, with a highly diversified agricultural sector. Agriculture occupies more than half of the Italian land area, but more importantly it performs crucial functions for society as a whole. As a result, the economic, social, and environmental dynamics within it are relevant to the present and the future, and also with regard to the international debate on the growing and glaring territorial disparities.
In view of the above rationales, this study is not intended to provide a report of all the plentiful variables detected by the Italian GCA [4,5,6,7]. Rather, it aims to bridge the gap in the existing scientific literature providing an analysis of data of the seventh census of agriculture, it aims to describe the most important characteristics of the Italian primary sector during the 2014–2020 programming period, and it aims to highlight important information for academics (agricultural economists), policy makers, farmers, and stakeholders at the national and international levels.
To the best of our knowledge, this is the first scientific study of this type conducted on the 2020 census at the Italian level with this level of detail [8,9], and the first study at the European level that provides the framework of Italian agriculture and the changes that occurred during the 2014–2020 programming period.
Studies based on agricultural census data have always been useful for providing interesting insights into the changes taking place in this sector in different countries around the world [10,11,12,13,14,15]. Therefore, we believe that this study not only fills the existing gap in the literature but can also provide information of high interest to contribute to the political and economic reflections of agricultural economists (scholars and researchers), policy makers, stakeholders in the EU, and domestic farmers.
Particularly, the objective of this study is to know:
  • What changes occurred from 2010 to 2020 in Italian agriculture;
  • Whether the Common Agricultural Policy of the past 10 years influenced the changes that occurred in Italian agriculture.
Therefore, this study was schematized around four specific research questions (RQs) that are as follows:
RQ1: What are the changes that occurred in the structure of Italian farms from 2010 to 2020?
RQ2: What is the actual situation of Italian farms with regard to their workforce?
RQ3: What is the actual situation of Italian farms with regard to innovation and digitalization/computerization?
RQ4: Is there a relation, like a statistical correlation, between some selected variables, i.e., the number of “innovative farms” and the age of the entrepreneur, his/her education level, and the extension of the farm’s land (Utilized Agricultural Area—UAA)? Which Italian regions are similar on the basis of some selected variables, and which characteristics of farms are similar in terms of number of farms, across all regions of Italy (searching for latent structures that summarize the overall situation in order to deduce the most likely partition).
Following the research questions, this study was structured in four sections in order to provide results (R) schematically in a clear way:
  • R1: “Analysis of Farms’ Structure”, providing information regarding the structural characteristics of the Italian farms and the changes from 2010 to 2020;
  • R2: “Characteristics of Farms’ Workforce” to provide information about the human resources working in the farms;
  • R3: “Analysis of farms’ digitalization/computerization and innovation”, which provides information about the investment in modern technology and innovative products or processes, also considering the level of digitalization/computerization of the farms;
  • R4: “Analysis of relations among census variables and analysis of similarities among Italian regions and among farm’s characteristics”.

2. Theoretical Framework: The General Agricultural Census in the Context of the EU Common Agricultural Policy

The role of the agricultural sector, within the economic system, has changed much more in the 2010–2020 decade than before, and nowadays it has become basic other than for the production of food, and also for providing services to citizens, so much so that a different way of classifying the same businesses had also to be considered [10].
Established in 1962, from its earliest beginnings by the six founding countries of the European Community (Germany, France, Italy, the Netherlands, Belgium, and Luxembourg), the EU “Common Agricultural Policy” (CAP) is the oldest Union’s policy still in force. The CAP’s goals are to provide affordable, high-quality food, ensure a fair standard of living for farmers and support rural areas, and protect natural resources and respect the environment [1].
With more than 386 billion euros allocated for the five-year period 2023–2027, the EU CAP represents the largest proportion, about one third, of the total EU budget [1]. The CAP 2023/2027 is a set of environmental, climate, and plant and animal health and welfare rules that farmers are required to accept in order to access public support [1]. This component of the CAP is now universally known by the term “cross-compliance”, which from 2023 became stricter and more rigorous, changing its name to “reinforced cross-compliance” in deference to the more deeply rooted environmental awareness that pervades the European Union. The backbone is still the direct payment scheme, which absorbs just under 60% of CAP public expenditure [1]. Moreover, there is a package of sectoral interventions, which sees the confirmation of the traditional approach for productions such as fruit and vegetables, wine, olive oil, table olives, and, finally, beekeeping, to which is added a dash of novelty, with the possibility given to Member States to activate sectoral interventions for productions other than those mentioned. To finance the new sectoral interventions, the Member State may use up to 5 percent of the annual envelope for direct payments. For Italy, this implies a maximum revenue of 180 million euro per year.
The CAP includes the Rural Development policy, which in this programming cycle has the substantial novelty of providing for only eight general interventions, which replace the multitude of measures and sub-measures of the previous programming period.
Rural development is the “second pillar” of the Common Agricultural Policy, which reinforces the “first pillar” of income support and market measures by promoting the social, environmental, and economic sustainability of rural areas. The CAP contributes to the sustainable development of rural areas through three long-term objectives: increasing the competitiveness of the agricultural and forestry sector; ensuring the sustainable management of natural resources and climate action; and achieving balanced territorial development of rural economies and communities, including job creation and retention.
Multifunctional Agriculture (MA) is at the heart of rural development [1,11,12,13]. The concept of Multifunctional Agriculture was first introduced at the Rio Earth Summit in 1992 [12,13]. On this basis, the European Union is targeting multifunctionality as part of Rural Development Programs through specific measures to support farmers. In addition, the FAO also looks at multifunctionality as a model that can intervene in developing countries, where it also includes contributions to development challenges such as food security, poverty reduction, social welfare, and cultural heritage. The multifunctional farm, in general, also engages in tourist accommodation and offer/sales of its products to guests (direct sales), as well as other educational activities (educational agriculture, agrotourism, and social agriculture), and can be defined in one term as agrotourism activities [12,13]. In addition, a multifunctional farm also has other tasks, including the maintenance of public greenery, the preservation of the rural/agricultural landscape and the local environment, the use of alternative energy, and, in general, the contribution to the general rural development of the area, also increasing its tourism potential [1,11,12,13].
Like the previous census, carried out in 2010, the seventh general census of agriculture was carried out during a complex historical period for Italian agriculture. This is because of the economic recession, further worsened by the COVID-19 pandemic, which influenced the price volatility of most agricultural products [14,15], and by the new directions and challenges of the European Union related to environmental, economic, and social sustainability [16,17]. Moreover, the decade between the sixth and seventh censuses (2010–2020) was certainly full of events of interest to policy makers during the complex process of drafting the new EU common agricultural policy. These include the institution of a single common organization of the markets (CMO) as a consequence of the elimination of the 21 sectoral CMOs, the convergence of direct payments and the unbundling of them under the Reg. 1307/2013, the introduction of enhanced cross-compliance (obligatory for farmers), and the formulation of the European Green Deal in December 2019, which also incorporated the policies for the agri-food system [1,16]. In addition, during the last decade, the adoption of more sophisticated market practices and the access to new business opportunities have encouraged farmers to diversify agricultural products and integrate into the global agro-food value chain [12,13]. This includes both the production of a wide range of differentiated quality products, such as organic or protected designation of origin (PDO) produces, and the provision of contract services with digitalization and innovations aimed to optimize agricultural operations [18,19].
During these decades, EU agriculture was strongly influenced by the Common Agricultural Policy. Since the 1960s there have been strong impacts from both market policies, including the withdrawal of surplus products and structural measures. With regards to Italy, for example, a large part of the greenhouses in Pescia, the Ligurian Riviera, and many parts of Italy were built with the first structural programs of the EAGGF (European Agricultural Guidance and Guarantee Fund). European support for agricultural production in the countries of the Union takes the form of aid, subsidies, and premiums to producers.
The impact of the CAP has grown over the years as there is now no activity in the agricultural sector that does not have a regulatory reference of a European nature, be it financing or regulatory. The issue, in both cases, is that the rules are inspired by a homogeneous type of agriculture and territory (certainly prevalent, but not exclusive) which are ill-suited to complex agriculture and territories such as most of those in Italy, but we could say the entire Mediterranean area.
The main objectives being pursued in Europe by the new Common Agricultural Policy (CAP) 2023–2027 are ensuring the stable supply of food at affordable prices, safeguarding farmers’ incomes, protecting the environment, and preserving rural territories [1]. In fact, the bottom-up and participatory system on which the recent agricultural policy programming has been based has allowed agricultural enterprises to operate within the territory with a different approach [17] aiming for a greater product differentiation and also better co-operation with the processing sector, the services sector, the handicraft production sector, and finally the consumer [16]. In the new CAP 2023–2027, there is also the novelty of keeping to a minimum the rules established at the European level. In fact, the devolution of competences entails entrusting the national authorities with decisions on aspects hitherto formulated in European regulations, such as beneficiaries, the type of eligible expenditure, the approach to interventions, the allocation of financial resources, the definition of requirements and conditions for access to public subsidies, and the calibration of interventions according to the needs of the territory.
This study aims to describe the current picture of the Italian agricultural sector and analyze the changes that occurred in the decade between the two general censuses of agriculture of 2010 and 2020, which have also been influenced by the implementation of the CAP, in consideration of the new opening scenario of the EU CAP 2023–2027 [1].
In this study, a specific focus on the Sicilian region was provided, based on the rationale that Sicily is one of the most important Italian regions for agriculture, particularly for some specific supply chains such as that of cereals, citrus, olive-oil, and wine.
Particularly with regard to wine, Sicily is the Italian region with the vastest area cultivated with grapevines (besides the Veneto region) [18,19]. Moreover, with regard to olives [20,21], Sicily occupies the third place in Italy for the quantity of oil produced (about 10% of the entire national production) with 700 mills surveyed annually; its cultivation extends to 64% in hilly areas and 19% in mountainous areas, while the remaining 17% of the surface area is on the plain. Olive trees and oil are symbols of Sicily [21], more than 100 thousand holdings produce around 500 quintals of oil annually, a real wealth for the country’s economy. Moreover, Sicily has numerous genotypes of olive trees and contains eight well-known and extensively grown cultivars, and seventeen minor or neglected cultivars [20].
Despite Sicily being one of the EU regions that are still less technologically and economically advanced compared to the other EU regions with a similar importance for agriculture [21] (Sicily is still among the EU regions of “convergence” objective for the Reg. UE n. 1083/2006, i.e., a region that has not yet reached the level of development of the average of other European regions), it is the epicenter of high quality products with a highly diversified value-added production. Therefore, a special focus on the Sicilian region was provided in this study.

3. Materials and Methods

For this study, similar to the previous literature [6,8,22], the starting database was that of the Seventh General Census of Agriculture (GCA). It is interesting to note that the census is a complex operation that costs lots of money and time, but the result is a complete and huge database that collects information about a vast number of variables and characteristics regarding the phenomenon object of study. The seventh Italian census of agriculture was the last decennial census; in the future, it will be replaced by a so-called “perennial census” created by periodical surveys of clusters of farms.
An interesting and similar study on the overview of production and trade of the U.S. fresh fruit and vegetable industry was carried out by Huang, K.-M. et al. (2022) [22]. This study provided a comprehensive review and analysis of fresh fruit and vegetable production, harvesting windows, and trade between the United States and Mexico.
Similarly, in this study, the aim is to show the current situation of the Italian agriculture sector and what changes occurred from 2010 to 2020. Particularly, the figures regarding some topics or variables the Seventh General Census of Agriculture (2020) were analyzed and compared to those of the sixth census (2010), with the aim of highlighting significant changes; for this analysis, percentage variations between the two censuses 2010 and 2020 were calculated (RQ1, RQ2, RQ3).
Subsequently, some of the variables of the seventh GCA were analyzed to answer the RQ4, and highlight if there was a relation that connected some selected variables in order to better explain some existing cause–effect phenomena. Particularly, the existence of a relation, like a statistical correlation, between the number of “innovative farms” was investigated, and the age of the entrepreneurs, their education level, and the extension of the farm’s Utilized Agricultural Area (UAA) were used. Moreover, the existence of Italian regions similar to one another on the basis of some selected variables was investigated, as were those variables similar in terms of number of farms across all regions of Italy.
Another previous study with the Italian seventh CGA was carried out by Fanelli, R.M. (2023) [23] who used Pearson’s correlation to identify factors that affect “generational renewal” in the Italian agricultural sector in positive and negative ways. In our study, in addition to the analysis and discussion of the census data collected by the authors, Pearson’s correlation and multivariate statistics like cluster analysis were applied [23,24]. The first analysis was performed to detect correlations between some variables of interest by use of the Pearson’s correlation coefficient. The second analysis was carried out to search for latent structures and synthetize the general situation in order to infer the most likely partition of data by the use of cluster analysis.
Data were performed using statistical software IBM SPSS v.21.

3.1. Analysis of Relationship between Couple of Variables (Pearson’s Correlation)

The Pearson’s correlation coefficient was applied to detect the relationship between a couple of variables of interest for this study, following the previous literature [23]. Specifically, it seemed interesting to correlate the variable “investment in innovation” with other variables in order to discover any possible variation of these variables simultaneously and the sign of these variations. So, having chosen “investment in innovation” as the variable of interest, the variables that were chosen to calculate the correlation coefficient were as follows: “Range of age of the entrepreneur”, “Education level of entrepreneurs”, and “Farm’s size (UAA)” [22]. The selected variables, among those of the census, for the Pearson’s correlations are shown in the first table of Section 4.4.1.

3.2. Identification of More Likely Latent Distributions (Cluster Analysis)

According to some authors of scientific and educational publications on methodological statistics [24], cluster analysis allows to achieve the following goals:
  • “Generation of research hypotheses”—to perform a cluster analysis it is not necessary to have any interpretative model in mind;
  • “Reduction of data” in such a form (including graphics) as to make it easy to read the information found and parsimonious in the presentation of the results;
  • “Typological research” to identify groups of statistical units with distinctive characteristics that make the physiognomy of the observed system stand out;
  • “Search for homogeneous classes”, within which members can be assumed to be mutually surrogate.
The aim of applying cluster analysis in this study is not a “reduction of data” in such a form, as it is in some other research studies. Rather, in this study, the aim is to bring together units that are heterogeneous among themselves into several subsets (clusters) that tend to be homogeneous and mutually exhaustive (search for homogeneous classes and identify groups of statistical units with distinctive characteristics that make the physiognomy of the observed system stand out). The goal was the identification of more likely latent distributions (groups) not easily detected by a mere combined analysis of the observed data. Therefore, statistical units were clustered into a number of groups according to their level of “similarity” assessed from the values that a set of chosen variables assumed in each unit, by the Average-Linkage within groups grouping method, and by the measurement of distance made by the method of Euclidean distance.
Interestingly, cluster analysis, unlike other multivariate statistical techniques (e.g., discriminant analysis), does not make any “a priori” assumption about the existing fundamental types that may characterize the collective studied. Therefore, in this study, the technique had an exploratory role of searching for latent structures in order to infer the most likely partition. Cluster analysis, in fact, is an empirical method of classification, and, as such, primarily an inductive technique, which appeared very suitable for the research question 4 of this study.
In particular, cluster analysis was chosen to answer to the RQ4 and identify groups of regions and variables (units) that were “similar” to each other with respect to a set of features taken into consideration (variables selected), and according to a specific criterion, which, in this study, is the number of farms having the selected characteristics. The selected variables among those of the census for the cluster analysis are shown in the first table of Section 4.4.2.
Specifically, cluster analysis was used, firstly, to highlight a “sector segmentation”, which is the process of dividing the agricultural sector into subset of regions that have similar characteristics of farms, farmers, and farming practices (like in marketing studies it is the process of dividing the market into subsets of customers who share common characteristics) [24]. Additionally, it was performed to discover “farm profiles”, as a farm profile is a description that contains key information about a specific type of farm (based on farming characteristics) [24]. In marketing studies, cluster analysis is used similarly to obtain a market segmentation and a customer profile (also known as key information about the ideal customer) [24].

4. Results

The following paragraph shows the results deriving from the census data elaboration. Particularly, this section describes three different focuses on the main branches and topics of the agricultural system in Italy, with details on the Sicilian region (Southern Italy). The specific analyses were carried out on farm structure, characteristics of workforce, and the levels of digitalization/computerization and innovation adopted by farmers. Moreover, the data from the seventh census were compared to those of the sixth one in order to highlight the substantial changes that occurred in the Italian agriculture sector during the period of analysis. For all the topics analyzed, Italian data were displayed and compared to those of the Sicilian region.

4.1. Analysis of Farms Structure—Italy and Sicily

Relating to the farm structure, the seventh census of Italian agriculture states that in Italy in 2020 there were 1,133,023 farms, i.e., 30.1% fewer that in 2010. From this finding it is evident that, numerically, there were 488,000 fewer farms in the national territory. This observed phenomenon could represent a potential contraction of the agricultural sector. However, there is almost a stable Utilized Agricultural Area (UAA) in the decade of analysis (−2.5%). Subsequently, with further analysis, it will be possible to identify the causes of this significant reduction in the number of farms observed. As shown in Table 1, in the period between the two census surveys, the average farm UAA grows with an increase of 39.5% for the Italian territory, with an average UAA of 11.06 hectares in 2020. These data delineate a consolidation of the more structured farms, which, in view of the cessation of the activity of the small farms, incorporate their agricultural areas with a consequent increase in average UAA.
Results show a reduction in the number of farms for all the range of UAA, except for the farms without UAA which carry out support activities to agriculture and post-harvest crop activities, to maintain agricultural land in good agricultural and environmental condition (this group of farms refers to the EU Regulation (EC)N.2018/1091) that increased by 136.1%, +7205 in 2020. Despite this, these farms are only a very small percentage of the total number of farms (1.1%). An interesting phenomenon to observe is the increase in large farms (Table 2 and Figure 1) in the agricultural area range from 50 hectares and up of 6015 farms from 2010 to 2020, equal to +28.9%. Particularly, farms belonging to the UAA range above 100 hectares show a higher increase in percentage variation of +17.7% than those of a smaller size (50 to 99.99 hectares), which increased by 11.2%.
Conversely (see Table 2 and Figure 1), farms with UAA of up to 49.99 hectares reduced more consistently compared to in 2010. Specifically, it is possible to observe (Table 2) a reduction of 501.081 farms in 2020 from 2010 overall −136,6% (Figure 1).
The distribution of the number of farms by range of UAA shows a heterogeneous situation, with a main group of smaller farms of up to 4.99 hectares, which constitute 63% of the total Italian farms (equal to 1,620,884), and only 4.5% of the total Italian farms have an UAA over 50 hectares.

4.1.1. Changes in the Area of Main Cultivation and Concentration of Main Groups of Livestock—Italy

It is of interest to focus on the specific agricultural branches so that we can investigate how the previously observed phenomena have affected annual and perennial crops and livestock farming. Table 3 shows the contraction in the number of farms, observed in Table 1, and its distribution among the various branches of activity, characterizing all the sectors by negative changes between the two censuses; the only agricultural branch that grew was that of fruit plants, the number of farms of which increased by 19.2%.
In relation to the farm UAA, there is an increase in the area used as arable crops on the national territory, and this is the only positive value (+2.7%). On the other hand, the area invested in tree crops decreased by 8.2%.
The annual (arable) and perennial (tree) crops shows reductions in terms of number of farms (Table 3); this does not imply a reconversion to other types of farms, but in general an abandonment of the agricultural activity. This phenomenon does not influence significantly the total Italian extension of cultivated lands as it is possible to see in Table 3.
With regard to livestock, Table 4 shows changes in 2020 compared to 2010. Overall, in 2020 the livestock farms were 213,984, down 1.6% from 2010. In terms of Livestock Units (LU: Livestock units, i.e., standard unit of measurement determined according to the calculation coefficients for individual livestock categories in Annex I of Regulation (EU) 2018/1091), data from the latest census indicate more than 9 million units (ISTAT data [2]).
In particular, Table 4 shows a decrease in the number of farms with cattle of 23.5% and buffalo of 21.7%, respectively. Interestingly, further census data (ISTAT data [2]) show a reduction in the number of dairy cattle farms only in the center and the south of Italy, while in the northern Italy this number was on the rise (ISTAT data [2]). Northern Italy is actually the area with most of the medium-large livestock farms, which are certainly more resilient to the problems of the dairy sector compared to small-sized farms.
The opposite scenario occurs for farms with buffalo, which reduced in number in northern Italy and grew in southern Italy. At the same time, there is growth in the number of buffalo heads by 15.3%, thus outlining an interest in this animal species due to milk production for the dairy industry and for the production of “mozzarella di bufala”. In fact, growing demand for buffalo mozzarella in domestic and international markets led to a 25% increase in mozzarella exports in 2011 [25,26]. In this case, the typicality of the product, such as “buffalo mozzarella”, enhanced by the PDO quality certification that links it to the Campania region, has certainly played a key role in shifting the balance to southern Italy, consolidating a leading sector for the south of Italy.
The sheep and goat sector grew from 2010, both in terms of number of farms and of heads.
The pig sector, on the other hand, shows an unusual trend, with a great growth in the number of farms (45.6%) and a reduction in the number of heads (−6.5%).
The poultry sector reports a marked growth, with the number of farms growing by 138.1% since 2010, counting more than 57,000 poultry houses by 2020; the number of heads should be interpreted with a more critical eye because poultry farms perform several production cycles during the year.

4.1.2. Changes in the Area of Main Cultivation and Concentration of Main Groups of Livestock—Sicily

The same trend of a reduction in the number of farms observed for Italy occurred in the Sicilian region (Table 5 and Figure 2). In particular, compared to 2010, there was a reduction of 35.2% of farms, totaling 142.416 in 2020 and 77,261 fewer farms. Smaller farms were decreasing, and the number of farms with UAA larger than 20 hectares increased, confirming the phenomenon of expansion of the farm structure and the closure of micro-farms with very small UAA.
Sicily follows the same trend as Italy for the farms without UAA also (which carry out support activities to agriculture and post-harvest crop activities, to maintain agricultural land in good agricultural and environmental condition), that refer to the EU Regulation (EC)N. 2018/1091) and increased by 15.3%, +96 firms in 2020 (Table 5 and Figure 2).
Moreover, it is possible to see an increase in larger farms in the range of 20 hectares to 100 hectares and above by 30.3% overall, but consisting of 1024 farms.
Similar to Italy, there is an opposite trend for farms with UAA up to 19.99 hectares (Table 5 and Figure 2). Besides this phenomenon, the UAA does not change substantially in terms of size, with 1.342 thousand hectares in 2020, and a slight decrease (−3.3%) over the decade was observed. Nevertheless, the average UAA of Sicilian farms increased by 49.2% since 2010, totaling an extension of 9.42 hectares.
Therefore, it is possible to observe that in Sicily, in addition to a reduction in the number of farms, there was a simultaneous increase in the average area used for agriculture. This is a positive phenomenon for a region like Sicily where the overt fragmentation and pulverization of farms have always been a negative characteristic influencing the sector negatively.
Because of the observed noticeable reduction in the number of farms in Sicily, results also show a general reduction in the number of farms for each of the main agricultural activities carried out in Sicily (Table 3), although with some differences.
In particular, the citrus farms showed a reduction of 42.1%. Citrus fruits represent, along with the prickly pear, the species most intimately linked to Sicily, characterizing the international collective imagination [27]. In Sicily, average citrus production stands at about 1.3 mL tons, about two-thirds of national production occurs in Sicily and about a quarter in Calabria [28]. In Sicily, citrus fruits are of great importance, both in terms of species and cultivars grown, which take on characters of excellence in many production areas [29]. In these contexts, these peculiarities have been recognized through the activation of European Union quality designations. Among these, the most important is undoubtedly the “blood orange of Sicily PGI”, whose production areas include much of the provinces of Catania and Siracusa, and some municipalities in the provinces of Enna and Ragusa. The PGI was obtained under EC Reg. nr. 1107 of 12/06/1996. Another high quality product is the “blond oranges of Ribera PDO”, produced in the territory of the municipality of the same name in the province of Agrigento, on about 4000 hectares in total. The PDO was obtained with EU recognition in 2011 with Re. EU nr. 95/2011.
In terms of UAA, over the 2010–2020 period, there was a decrease in the hectares devoted to perennial crops (−14.7%), while the area devoted to arable crops shows a stable positive trend (+1%). Table 5 and Figure 2 show that the increase in Sicilian farms without any area used for agriculture is more limited, but still positive (+15.29%). Farms with UAA below 19.99 hectares have negative variations that intensify for smaller cultivated land dimensions. In fact, the smallest Sicilian farms, with UAA of less than 1 hectare, experience a major reduction of −61.43% (Figure 2—from 10 to 10.99, −5.3%; from 2 to 4.99, −24%; and a smaller one up to 0.99, −61.4%). On the contrary, farms with UAA of 20 hectares upward increased, particularly those with UAA over 100 hectares (+13.68%) with the highest positive increase observed.
A reduction in UAA was also observed for Sicily, particularly regarding perennial crops, higher than those observed for the Italian territory (−14.7%). This reduction is observed in addition to the increase in investments in complementary activities (see the second figure of Section 4.3.1) compared to purely agricultural ones, particularly those of the Multifunctional Agriculture (MA), which include a range of activities closely related to agricultural production, the most important of which, in Sicily, is the agritourism activity [12].
A light reduction of farms with arable crops of 7.9% was also observed, and this crop is one of the traditional Sicilian types of agricultural activity.
All these reductions of UAA for traditional types of growing may have given rise to new types of produce, like tropical fruit (213 farms and 2968 UAA), that had not even been surveyed in 2010 and that today is becoming a high interest reality for producers because they are fruit in high demand by consumers and with high added value, or similar complementary activities connected to agriculture, like hospitality (for visitors and tourists) through, e.g., agritourism, enotourism, etc. [12].
Regarding the Sicilian livestock branch, a total reduction of 14,754 livestock farms was observed, that is −3.6% from 2010 (ISTAT data [2]). However, also in this agricultural branch it was observed that, in addition to a decrease to 1.724 (Table 4) of the number of farms with cattle (−6.7%), the number of dairy cattle was 49.9 thousand heads (+5.1%).
In particular, it is interesting to note that the Sicilian buffalo branch, which consists of only 19 farms, increased the number of buffaloes by +92.4% from 2010 to 2020, with 2.116 buffaloes in 2020.
The number of pig breeding farms increased by 51% and the number of heads by 30.4%. The goat sector, on the other hand, saw a growth in the number of farms, but with a reduction of 15% in the number of heads. Also for Sicily, as observed for Italy, the poultry sector shows high growth, in fact the number of poultry houses increased by 162%.

4.2. Characteristics of Farms’ Workforce—Italy

Most of the Italian farm’s entrepreneurs (57.5%) are over 60 years old (Table 6), and only 2.2% of entrepreneurs are younger than 29 years old. In terms of period of farm management by the entrepreneur, further ISTAT data [2] show that 4.9% of Italian entrepreneurs managed their farm for less than 3 years, and 19.8% of entrepreneurs for a period between 3 and 10 years. It is possible that the older generations are gradually giving way to the newer ones, but this phenomenon is still very limited and even decreasing compared to 2010 [30].
The data elaborated in Table 7 show that in 2020 the farms’ heads had a higher education level than in 2010. In particular, the data show that Italian farm heads with a specific diploma in “agricultural sciences” increased by 49% compared to 2010. Furthermore, farms’ heads with a bachelor’s or master’s degree in “agricultural sciences” grew in the 2010–2020 period by 35.1% and now they number 17,680. There was also a slight increase in the number of farm heads with a bachelor’s or master’s degree in “non-agricultural sciences” (+4.6%), showing an interest in farming from people with different cultural backgrounds. The presence of farms led by graduates in “non-agricultural sciences” is higher in the northern Italy than in the south, but it increased by +41.3% in 2020 compared to 2010. However, further ISTAT data [2] show that also in the south there was a slight increase of +7.6% compared to 2010.
The farm’s workforce was initially divided into two large groups—family members and non-family members (Table 8) [30,31]. Results show a slight preponderance for family workers, i.e., 1,459,588 people are family workers compared to 1,295,753 people who are non-family workers (Table 8) [30,31].
By analyzing the characteristics of the workforce in Table 8, it is interesting to observe that the entrepreneur personally performs 76.3% of the total work carried out by all family members together. The other family workforce account for 345,457 units, including the entrepreneur’s wife and relatives. By observing the number of farm entrepreneurs who work on their farms (Table 8) compared to the number of farms with the legal form of “Entrepreneur/sole proprietor or family farm” (Table 9), it appears that these numbers are very similar. This confirms that entrepreneurs always work at their own farms, which can be either an individual/family farm, or other corporate form of farms (Table 9). Moreover, the number of individual farms or farms with family workers is 98.3% of the total number of farms observed. This figure is in line with the number of farms with a non-family workforce (187,476), which is small in number compared to the total number of farms.
These findings confirm the picture of the structure of the Italian farm enterprises highlighted in Section 4.1 (see Table 2), which is mainly made up of small farms, where the head is predominantly a family member or very often the entrepreneur itself (Table 8).
Among the non-family workforce, a prevalence of non-EU foreign workers (251,685) was highlighted (Table 8) compared to European workers (174,642), and this result is in line with previous studies [30,31]. Moreover, some other ISTAT data [2] highlight that family workers, and particularly farm entrepreneurs, work a number of hours higher than those of non-family workers [2]. Additionally, further ISTAT data [2] show that, in terms of working days, the burden is predominantly borne by family members, with 145 million labor days, compared to 68 million by non-family members.
The titles of ownership of agricultural land were studied in order to obtain more information about the type of conduct of the entrepreneur. Table 10 shows a reduction in the number of farms with the entrepreneur ownership (−44.5% for the Italian territory); additionally, there is an increase in farmland rental (+53.8%). This phenomenon can be traced back to what was highlighted in Section 4.1, i.e., the process of structural consolidation that led farms to increase their average UAA from 2010 to 2020 (as shown in Table 1) with a potential increase in rented areas.
The most important data are the percentage of “free commodate” that almost doubled in the observed decade (110.7%).
In terms of used area, the ownership reduced by 29.9%, the farmland rental increased by 56.9% (Table 10), and the farmland rental plus free commodate increased considerably (+188.2%).

Characteristics of Farms’ Workforce—Sicily

In terms of the percentage of agricultural enterprises by range of age of the farm’s head, the observed data show that the situation in the Sicilian region is very similar to that of the Italian territory, and no substantial differences were discovered (Table 6).
With regard to the type of education of the farm’s head in Sicily (Table 7), results show an increase in the number of heads with specific education in agriculture, specifically 57.6% for those who attended an “agricultural high school”, and of 11.9% for those with a specific bachelor’s/master’s degree in “agricultural sciences”. On the other hand, the number of farm heads with a non-agricultural high school education and with a non-agricultural bachelor’s/master’s degree decreased from 2010 to 2010. Nevertheless, this category has 14.2 thousand farms, much more than those in the category “Agricultural bachelor’s/master’s degree”. In particular, the highest number of farms managed by entrepreneurs with non-specific degrees in agricultural sciences is in the Italian Mezzogiorno (southern Italy and islands), with 52,775 farms (8.1% of total farms in the Mezzogiorno and 4.7% of total Italian farms).
As far as workforces in the agricultural sector are concerned, the trend in the Sicilian region is similar to the one observed for Italy (Table 8). In particular, the percentage related to the number of entrepreneurs in relation to the total number of family workers stands at 84%, higher than that observed for Italy. Moreover, confirming this, there are only 26.6 thousand Sicilian farms with non-family workers, out of a total of 142.4 thousand farms surveyed.
Analyzing the number of farms and the UAA by land ownership for Sicily (Table 10), there is a reduction in the number of owned farms (−46.5%) and in the related UAA (−29.2%); conversely, both leased farms (23.8%) and the related areas (22.9%) increased. It is also interesting to note that the number of farms with “ownership plus farmland rental” shows considerable differences between Italy and Sicily, both for number of farms and UAA (Table 9). In fact, farms with mixed title were up by 18.5%, with an increase in used hectares by 20.5%, confirming the observed phenomenon. Farms in rent and free use grew in large numbers, numbering 997 farms as of 2020, covering 29 thousand hectares, and UAA more than doubled in size, since the sixth census survey. This result shows that some landowners, probably those with smaller farms, preferred to lease cultivated land rather than continue farming activity (See Section 4.1, Table 1).

4.3. Analysis of Farms’ Digitalization/Computerization and Innovation—Italy

The seventh agricultural census studies the progression towards the adoption of digitalized management systems and the implementation of innovations for farms.
In particular, for the interviews of the Seventh General Census of Agriculture in Italy, the ISTAT defined as “computerized/digitalized” those farms that implemented digital management systems (such as management software) to manage their activities. In particular, the degree of digitalization of a farm is linked to the hardware equipment and the use of the Internet [32]. The areas of farm application like crop management, animal husbandry, related activities, and accounting were investigated. The use of the Internet for the marketing of products and/or services or for company advertising was also investigated [32]. Additionally, for the first time in this census the concept of the “innovative” farm was introduced as the farms that made investments for improving products/processes or means of production [32]. Particularly, “innovation” is defined as the tendency (over the last three years) to invest in modernizing production techniques and/or management: product/service, process, and marketing innovations. The areas of application that were investigated included, for example, irrigation, milking, and mechanization, which are typical of precision animal farming, but also multifunctional agriculture was included [32].
According to results from the seventh Italian GCA, data shows] that 15.8% of the Italian farms are “digitalized” and 11% are “innovative”, according to the ISTAT definition. In relation to the total number of farms by district, 33.1% of the farms in northern Italy turn out to be digitalized (ISTAT data [2]) and 22.1% innovative (ISTAT data [2]).
In this study, the extent of the propensity for digitalization and innovation by classes of annual work units (AWU) (Table 11) was analyzed, and it is possible to note that although companies with AWU ranges lower than one are more numerous, while the farms with AWU ranges higher than 10 are more digitalized/computerized (78.1%) or declared to be innovative (58%) (these percentages were calculated as the total of digitalized farms divided by total farms for each AWU range). However, 80.6% of the Italian farms are characterized by an AWU < 1, and this means that during the year there are no permanent employees on the farm (this is in agreement with what was observed earlier in Table 8) and this can be compared to data from the recent literature [30,31]. These farms are generally micro-farms, wherein the permanent employee is often only the farm entrepreneur, with no additional permanent employees. The 49.7% of farms with AWU < 1 are in the south of Italy, where there is a higher presence of small farms (ISTAT data [2]), this is in line with the results at national level shown earlier (Table 2).
In general, the data show that f with more employees have a greater propensity toward the digitalization of processes, investment, and/or the adoption of innovative systems of the company. Recent studies have highlighted that the adoption of new technologies and digitalization in agriculture requires more skilled workers [31], and this is interesting if compared to results regarding the education level of the farm’s head who always works at his/her company.
In relation to digitalized companies, a focus regarding the specific activity on which a computerization process has been carried out in the company is shown in Table 12. More than half of the companies carried out a computerization process with regard to corporate accounting. While digitalization in the field of accounting is basic and therefore expected, interested numbers are observed with regard to the management of livestock farms, a sector which, over the years, is catching up technologically and is increasingly witnessing the implementation of digitalized tools in its management.
The farm areas of innovation were analyzed, and those where farms invested more to improve general production processes were heterogeneous (Figure 3). Figure 3 shows that farm mechanization is the most preferred, with 69,454 investing farms. Important investments have been made toward crop management methodologies, such as agricultural practices of planting, seeding, and/or tillage. A good number of farms undertook investment in soil working (21,792 farms) and irrigation (20,619 farms), considering that today, the water resource is scarce and limited, particularly in some regions of the country like Sicily. Results confirm that water management is considered crucial according to farmers because it helps to obtain satisfactory production with limited resources and to preserve the water resource itself [33,34], and they can meet the requirements of the EU CAP [35,36].
It is interesting to note the limited investment in the waste management sector by only 2296 Italian companies; this is an unexpected result considering the importance of this topic in the actual CAP [35,36].
The analysis highlighted an increase in the activities related to the strictly agricultural activities, i.e., the so-called MA [37]. Nevertheless, these activities remain secondary to the main agricultural ones, even in terms of revenues. In particular, agriculture, in addition to its main role of food production, can also have several other functions, such as managing renewable natural resources, landscape, conserving biodiversity and contributing to the socio-economic vitality of rural areas, which can promote the modernization of agricultural structures and the enhancement of territorial resources (environmental, tourism, social, etc.) while fully respecting the environment [38]. Moreover, agriculture also takes on a community service function through the protection of the environment and natural resources, seeking the integration of people with nature and the land [12]. Thus, MA not only benefits users and the environment, but also represents a diversification of income sources for farmers, enabling them to reduce income risks by relying on complementary activities [12,35,36,37,38].

4.3.1. Analysis of Farms’ Digitalization/Computerization and Innovation—Sicily

In relation to the adoption/implementation of digital technologies, data show that only 7.5% (total digitalized farms divided by total Sicilian farms) of Sicilian farms have implemented digital/computer technologies. In terms of the percentage of total AWU range, mainly the largest companies (AWU > 10) implemented digital/computer technologies (66.8%) (this percentage was calculated as the total of digitalized farms divided by total farms for each AWU range). Looking specifically at the types of technological activity implemented in the farm (Table 12), similar percentages to those of Italy were observed for Sicily; in particular, most digitalization/computerization was made for accounting purposes (7978 farms equal 74.5% of the overall digital farms).
With regard to investments for farm innovation, the data show that only 5.7% of the total farms surveyed (Table 11, total digitalized farms divided by total Sicilian farms) declared having made them.
However, the main areas of investment were agricultural mechanization (3405 farms) and agro-technics such as planting, seeding, and irrigation (Figure 4). These results are in line with what has been observed for Italy. However, farms that invested in improved mechanization with application of innovative means and tools in Sicily (the so-called agriculture 4.0) are numerically lower than the national average (2.4% in Sicily and 6.1% in Italy).
Figure 5 shows the types of activities connected to agriculture for Sicilian farms that are specifically those of the Multifunctional Agriculture (MA) that include a range of activities closely related to agricultural production. As can be observed in Figure 4, the main type of investment of Sicilian farms is agritourism [12]. The results are in line with previous studies that highlighted the cultural, social, and educational purposes of multifunctional farming in Sicily (Figure 4) [12]. The high added value generated by the combination of agriculture, gastronomy, and tourism is now well established [12,39]. The Italian model of MA, which is always a case of success in the international rural development scene, has been able to adapt rapidly to the changes taking place thanks to the many forms and activities that have gradually developed around farm resources [12].
Investments in food processing, such as fresh-cut products, that aim to increase the value of agricultural products, were among those preferred by entrepreneurs. With regard to multifunctional activities, there is also renewable energy production, now increasingly incentivized by European policies [37,38,40]. In this sense, in Sicily, a positive trend toward solar-type renewable energy production was observed.

4.4. Analysis or Relations among Census Variables and Similarities among Italian Regions and Variables

This further analysis was carried out with the aim of answering research question number 4 (RQ4), i.e., to detect the existence of a relation like a statistical correlation between some selected variables that appeared to be of interest, based on the objective of this study and the previous literature [23]. The selected variables are number of innovative farms, age of the entrepreneurs, their education level, and the extension of the farm’s Utilized Agricultural Area (UAA)—Section 4.4.1.
Moreover, starting from the big picture of the characteristics of the Italian farms, another aim was to highlight which Italian regions are similar on the basis of some selected variables, and discover a “sector segmentation”. It is the process of dividing the agricultural sector into a subset of regions that have similar characteristics of farms, farmers, and farming practices (like in marketing studies it is the process of dividing the market into subsets of customers who share common characteristics) [24]. Additionally groups of similar variables in terms of number of farms, across all regions of Italy, were discovered, highlighting groups of farms and farming types which constitute “farm profiles”, i.e., a description that contains key information about a specific type of farm (based on farming characteristics)—Section 4.4.2.

4.4.1. Results of Correlations between Innovative Farms’, Other Farms’, and Farm Entrepreneurs’ Characteristics

Some variables were observed with the aim of answering research question number 4 (RQ4) regarding the detection of a possible relation like a statistical correlation between the number of farms that declared as having invested in innovation, defined as “innovative farms”, and other variables considered of interest for this analysis, which were: the age of the entrepreneurs, their education level, and the extension of the farm’s Utilized Agricultural Area (UAA).
Table 13 shows some descriptive statistics for the selected variables. Mean values and standard deviation were calculated because, as is well known, the standard deviation (SD) is a statistical measure of dispersion around the mean that indicates how large, over a certain time period, the variation in a variable has been. Descriptive statistics (Table 13) show that for some variables the population variability is higher, and this is particularly noted for the variables where the number of farms is higher; on the other hand, for the other variables, the Italian regions are more homogeneous.
According to the census data [2] and previous studies [23], almost 91% of Italian farms are run by entrepreneurs 40 years old or more, and Table 6 shows that 86.5% are between 45 years old and 60 years old. From the calculation of Pearson’s correlation coefficient (Table 14), results shows that all the correlations are positive, therefore the values of the two variables tend to increase simultaneously. Particularly, the highest correlation was found between Innovative_farms and Up_to_50_hectars (64%), and between Innovative_farms and Up_to_20_hectars (61.8%). A good correlation was found between Innovative_farms and High_school (54.8%), and also between Innovative_farms and Age_below_40 (50.5%). A modest correlation resulted between Innovative_farms and Age_above_40 (46.6%), Bachelor’s/master’s degree (44.5%), and Middle_school (43.7%).
The results of the Pearson’s correlation highlight that the farm’s size is a variable strongly related to “innovative farms”, i.e., the entrepreneur’s choice to make capital investments for farm innovation. Instead, the low educational qualification of the farm’s head (middle school), and bachelor’s/master’s degree, are variables with a modest linear correlation to the choice to make investments to innovate the farm. High-school education level and age below 40 years show stronger relations with “innovative farms” but still modest (54.8% and 50.4%). However, results show that for all the selected variables there are good correlations but not very high ones, and this means that all the observed variables contribute but the strongest relation is with the farmland size up to 50 hectares (64%).
This shows that companies that have made more investments in innovation are more correlated with the age of those leading the company being under 40, so it is more young people who have more frequently initiated the company’s innovation process. It should be noted that the age group of under 40 also includes entrepreneurs over 60 years old. In addition, a targeted education also greatly affects business innovation, in particular, most entrepreneurs have an upper secondary education qualification and an agricultural technician diploma, i.e., someone who has studied the field of agriculture and specializes in agricultural subjects.

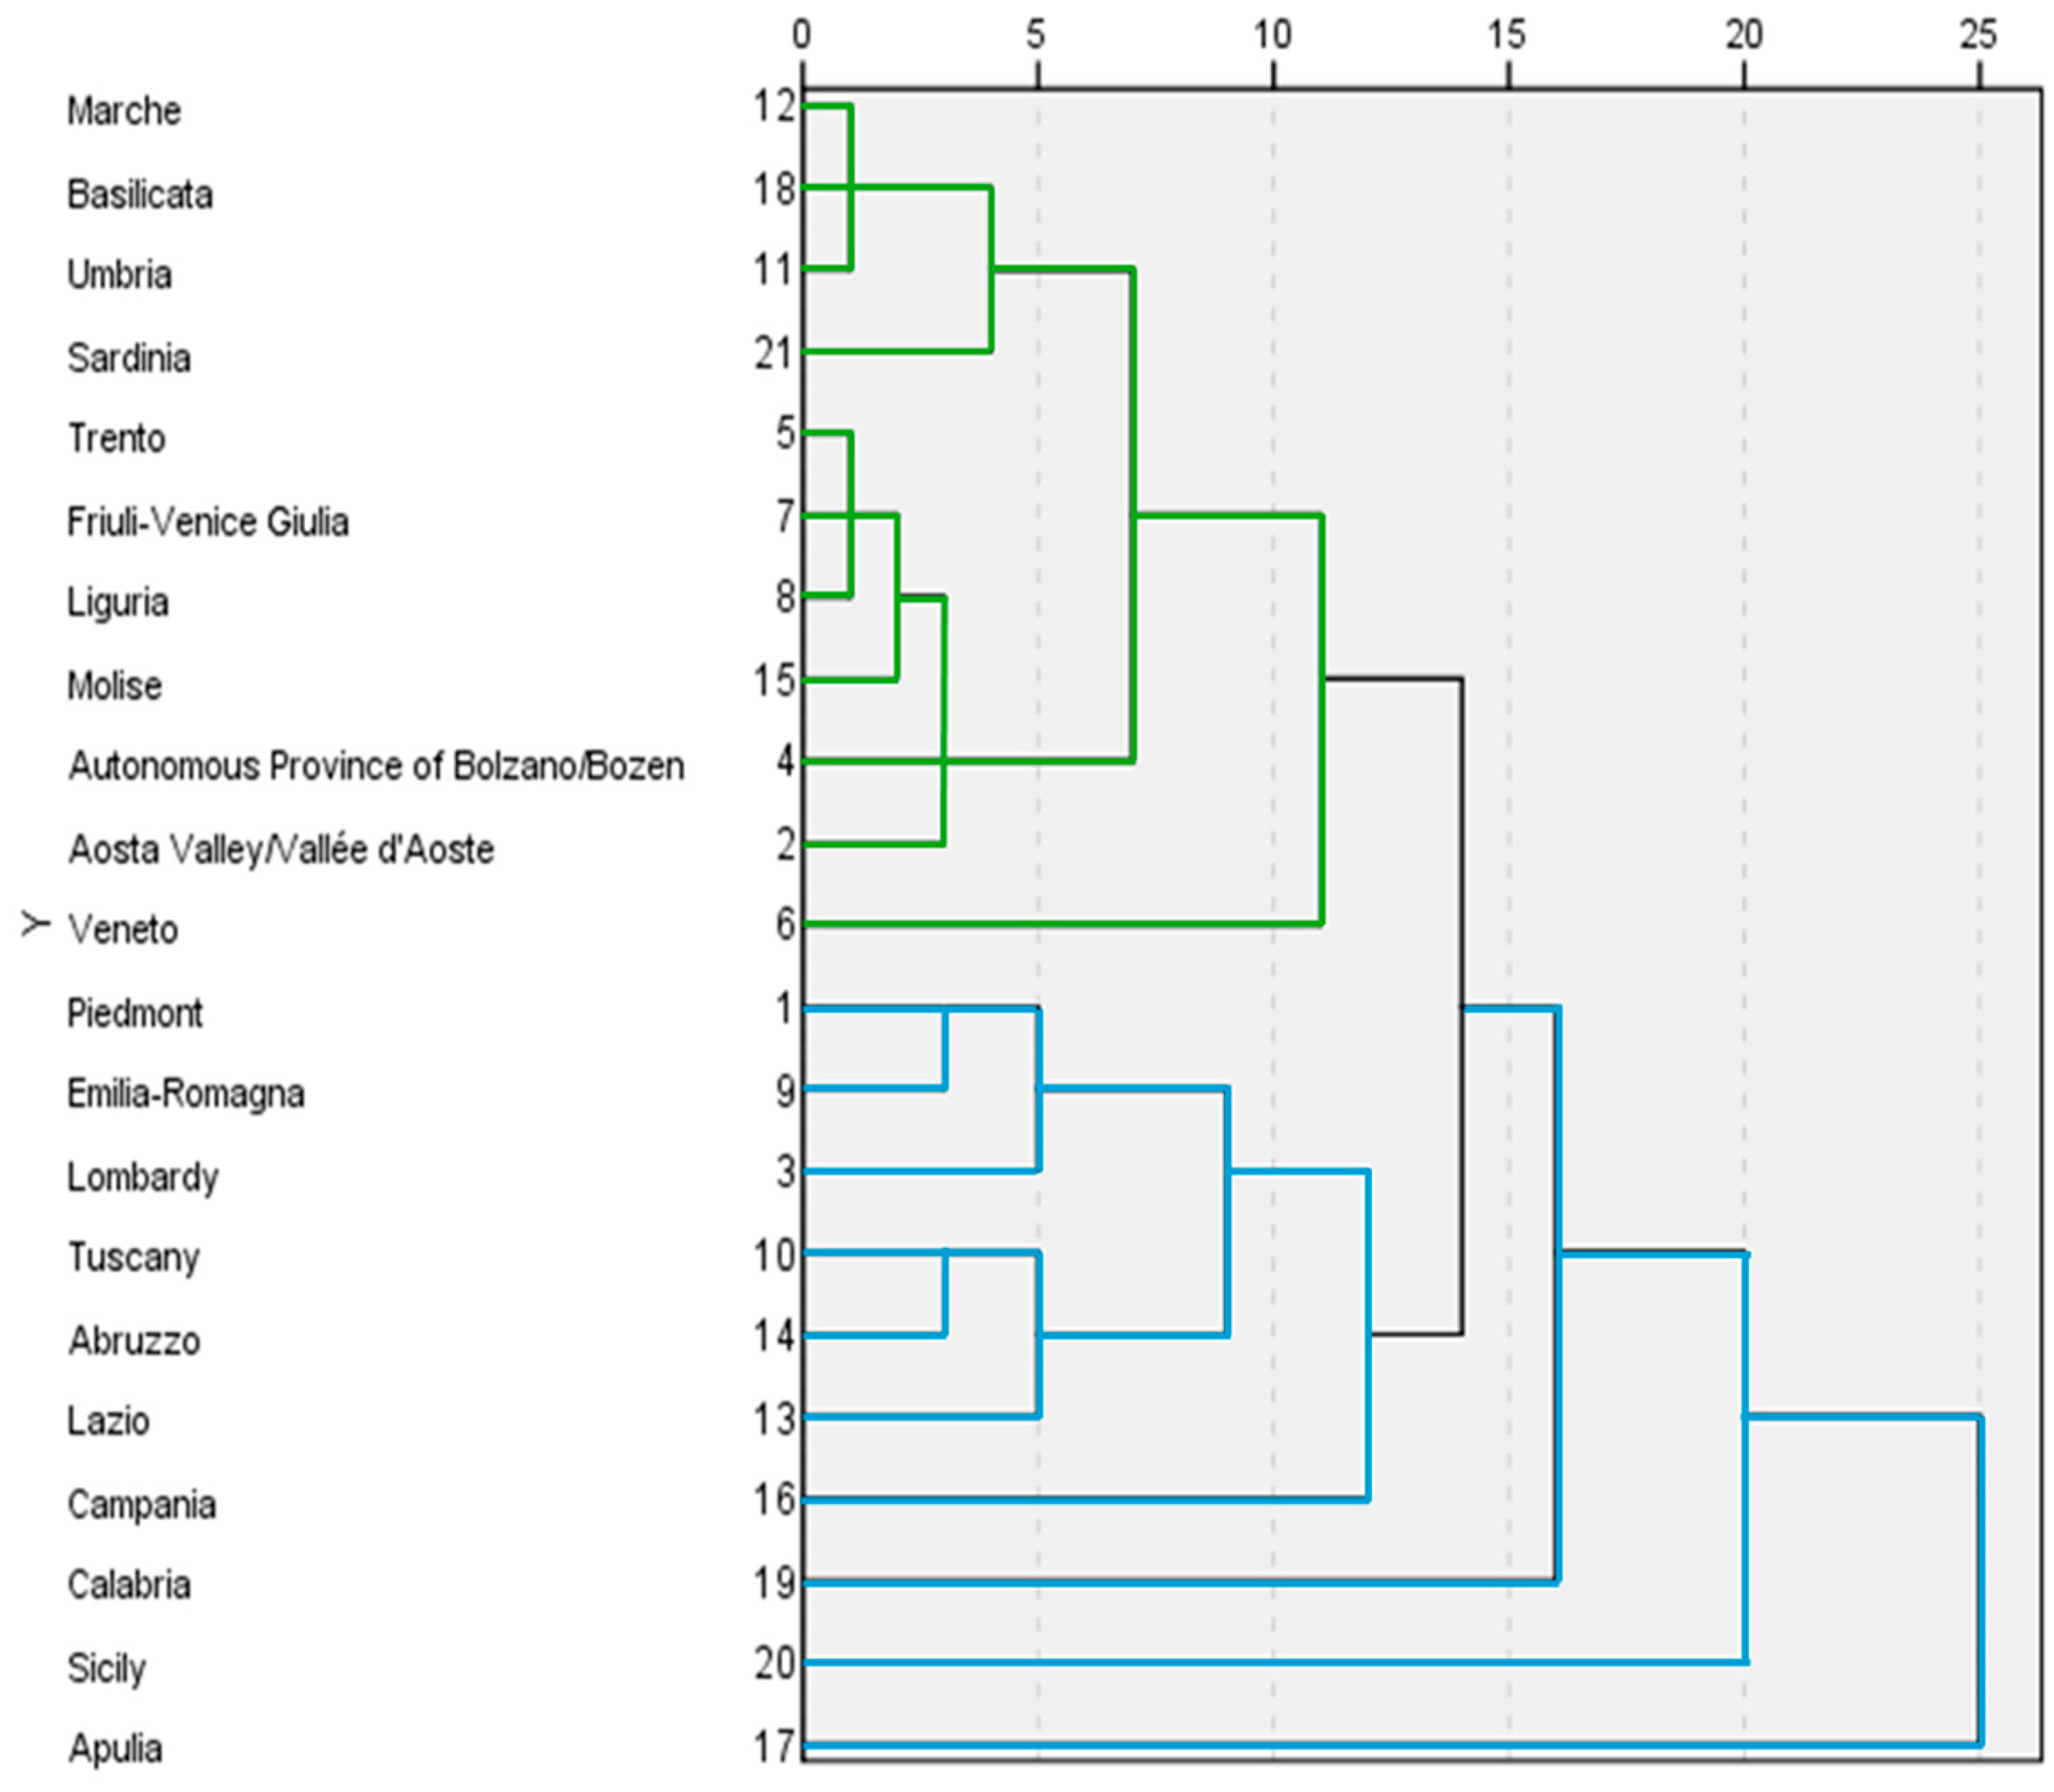
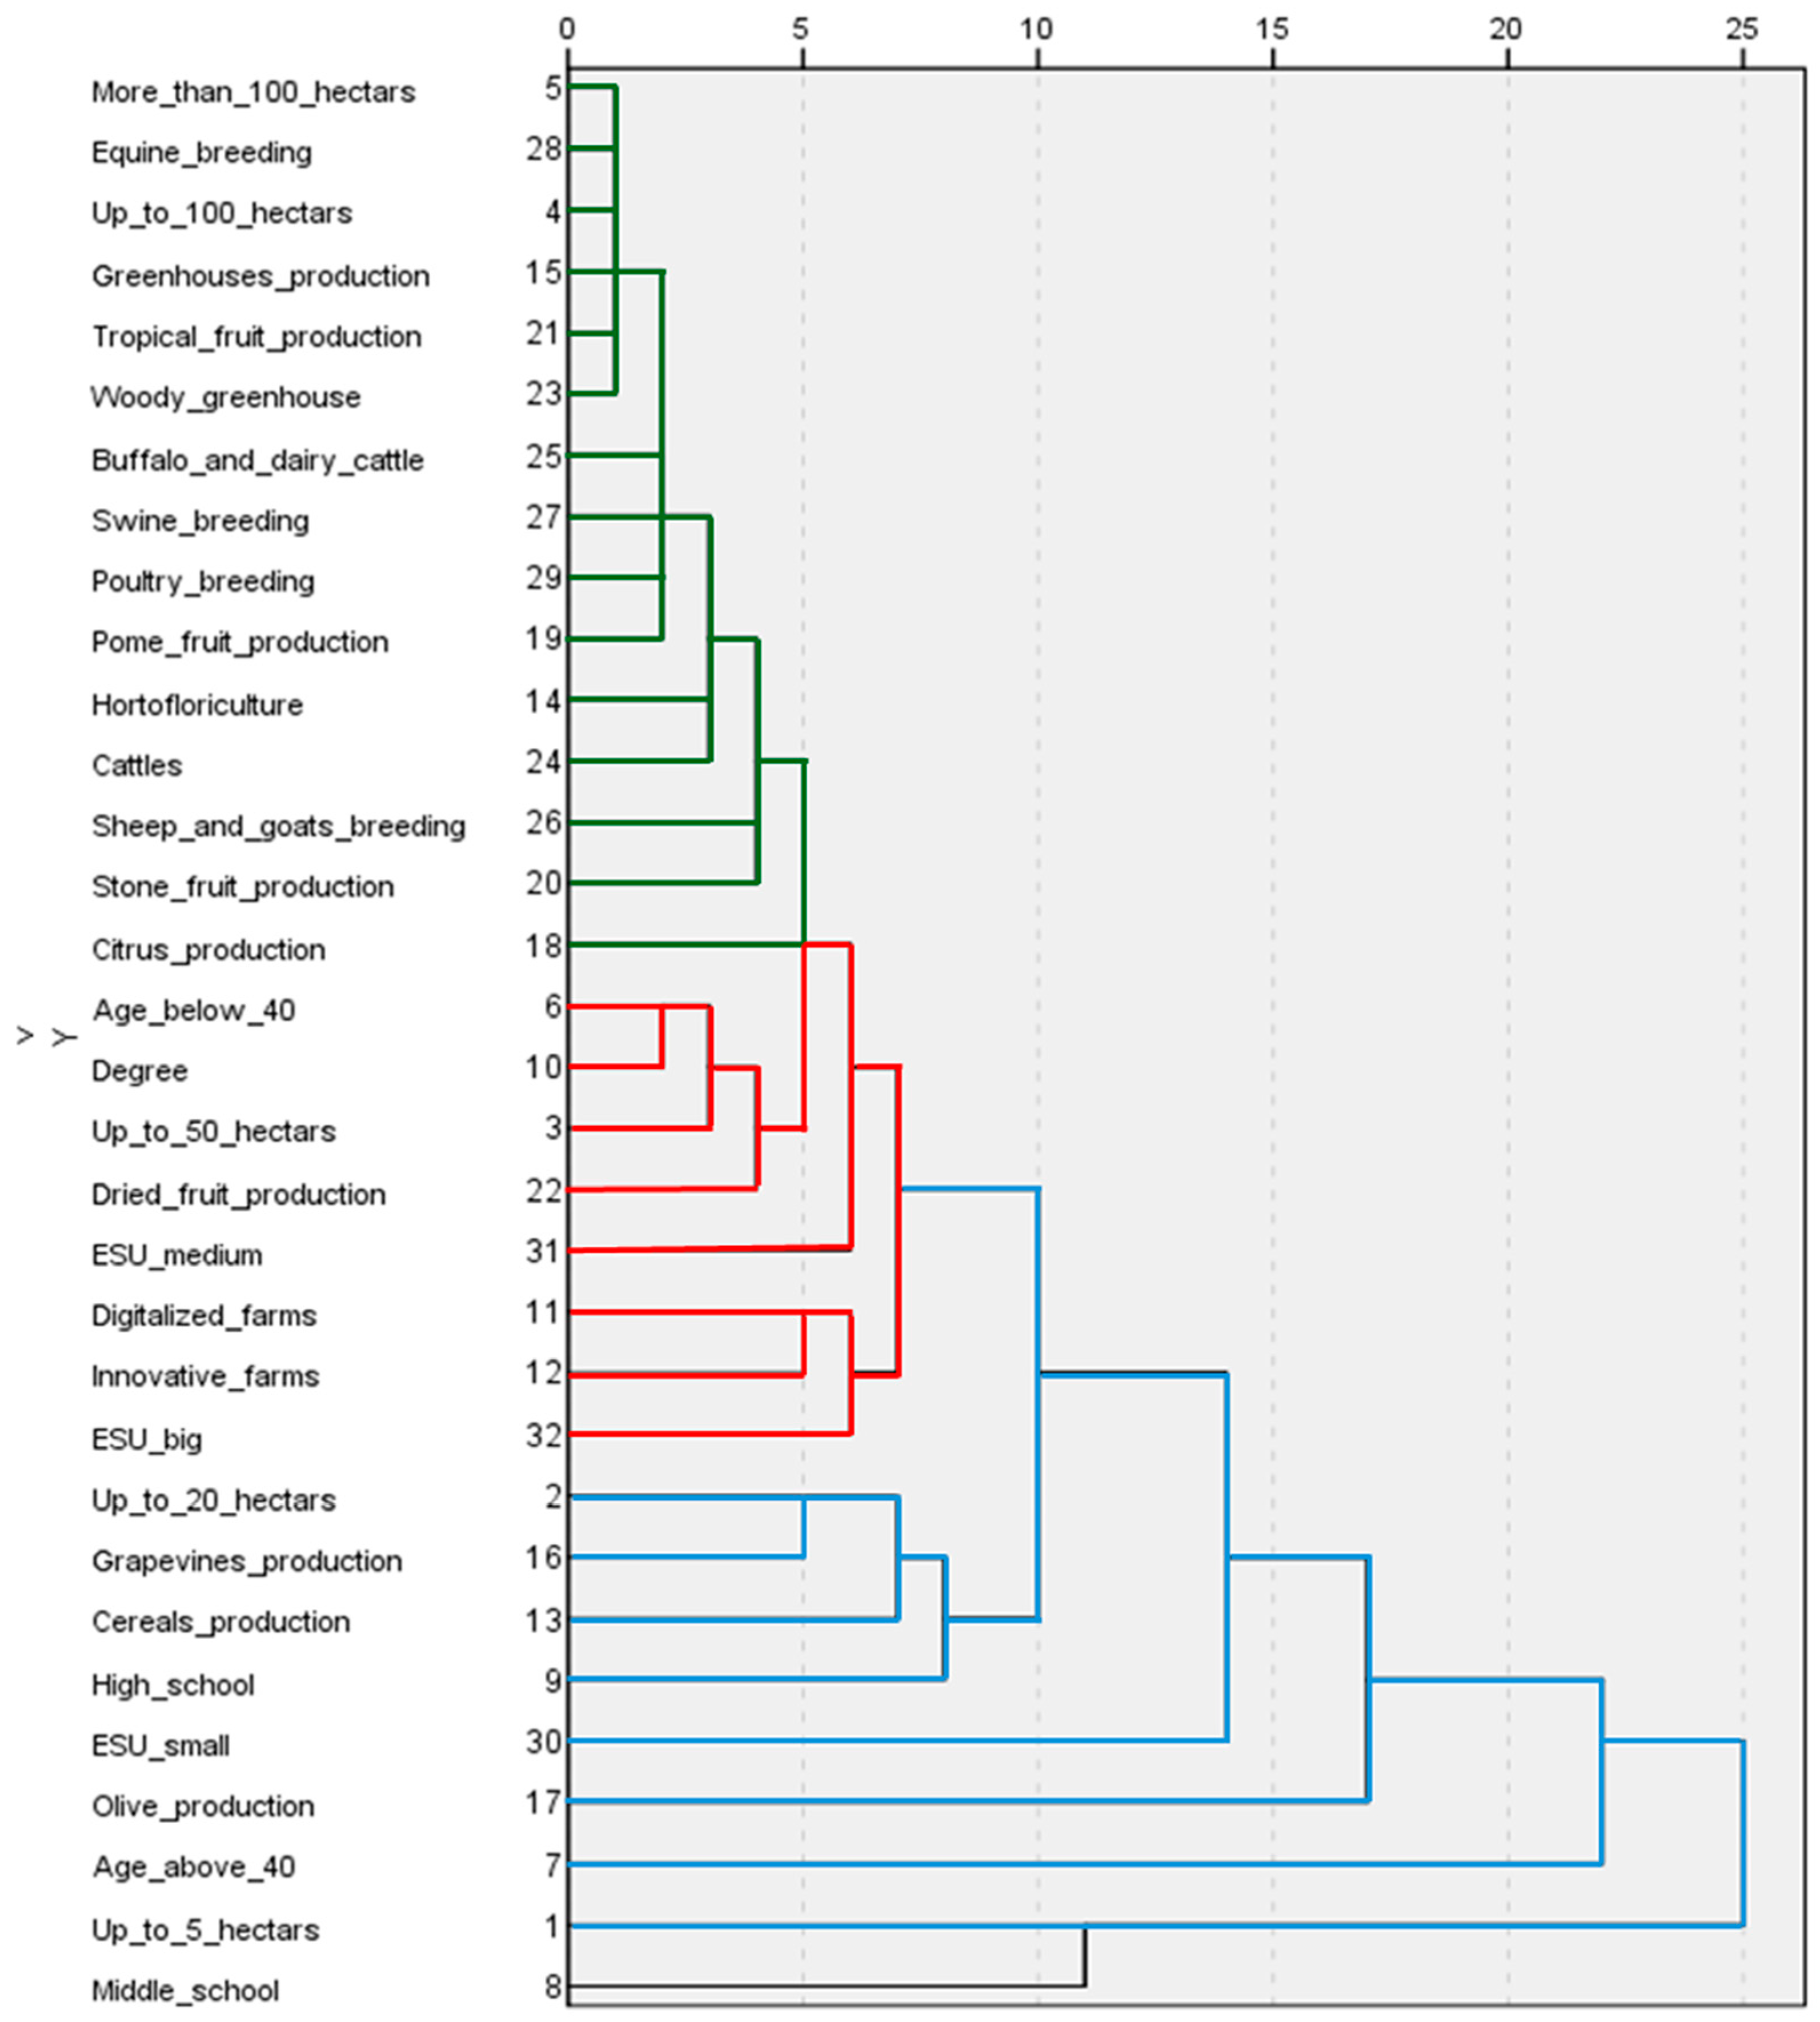
4.4.2. Results of Cluster Analysis-Identification of Groups of Regions That Are Similar Because of Farms with Similar Characteristics, and of Groups of Farms and Types of Existing Farming Practices

As described in Section 3, the cluster analysis was applied for the identification of more likely latent distributions (groups) not easily detected by a mere combined analysis of the observed data. In particular, cluster analysis was chosen to answer to the RQ4 and identify groups of regions and of variables that are “similar” to each other with respect to a set of characters (the selected variables) taken into consideration, and according to the number of farms having the selected characteristics.
Cluster analysis was applied first on aggregated data for the N = 21 regions (N = 19 Italian regions plus the autonomous provinces of Trento and Bolzano were considered) in order to detect if there were similarities among some specific regions based on the number of farms with the selected characteristics. The selected characteristics chosen for this analysis were 32 qualitative variables. The variables for the cluster analysis were selected among those of the census, and are shown in Table 15.
First case—cluster analysis for regions: in this first case, cluster analysis was used to highlight a “sector segmentation”.
Results revealed two main homogenous groups. Looking at the results of the agglomeration program (Table 16) it is possible to observe the stage of cluster creation and agglomeration in the subsequent stage. Moreover, agglomeration coefficients provide a measure of the strength of the linkage among clusters. The clusters at Stage 1 are more homogeneous than those at the last stage.
The use of the dendrogram (Figure 6) facilitates the comprehension of the clustering process clearly showing the hierarchies among the subsequent clusters. In particular, it is interesting to note that two main clusters were highlighted.
This result shows that Marche, Basilicata, Umbria, and Sardinia were found to be very similar (Table 16 and Figure 6) in terms of the number of farms for each variable observed. It should be kept in mind that all the chosen variables were considered simultaneously in this type of analysis. Thus, the similarities do not concern a specific area of interest, as could be, for example, the number of investments in innovation and the age of the entrepreneur, but rather all variables were considered together simultaneously. This type of processing revealed different segments of agriculture throughout the country (Group 1 green color and Group 2 blue color). Particularly, Group 1, indicated with green color (Figure 6), shows is the similarity found between the regions of Trento, Friuli Venezia Giulia, and Liguria (Table 16 and Figure 6), but also a high similarity was highlighted for Piedmont, Emilia Romagna, and Lombardy, or Tuscany and Latium (Table 16 and Figure 6, Group 2 blue color). The similarities among regions were based on types of agriculture practiced, number of agricultural firms, types of grown crops or animals reared, and especially farm size (UAA). However, it is possible to note that these similarities are also related to the geographical location of the regions, and consequently to the soil and climate conditions.
The regions of Campania, Apulia, Calabria, and Sicily deserve special attention. These regions are part of southern Italy and show a level of technological (Figure 3) and economic backwardness compared to other regions of Italy (Figure 3) and Europe, so much so that, as we mentioned in the first paragraphs, they are also part of the EU’s “convergence” objective (regions that have not yet reached the average level of development of European regions). Although these regions have similar socio-economic issues and similar types of agriculture, they do not constitute a separate cluster, nor are they an integral part of other clusters. Rather, they individually link to larger clusters through the region that initiated the branching of this cluster (that is Piedmont). This linkage highlights not only the differences between these regions but also between them and all others in the entire cluster.
Second case—cluster analysis for variables: in this second case, cluster analysis was processed by variables. In particular, thanks to this technique, it was possible to discover “farm profiles”.
This clusterization pointed out different types (similar among groups) of existing farms and farming practices and characteristics. Table 17 shows the results of the agglomeration stages.
Three large clusters highlighted represented different profiles of farms existing in Italy (Figure 7). These profiles are characterized by a number of variables or features which, together, delineate a type of farm or farming type.
In this case, hierarchic cluster analysis revealed a very interesting outcome, i.e., that the size of the utilized agricultural area has a significant influence on the generation of clusters. In fact, since from the first cluster the UAA began the creation of groups, in particular the clusters are similar based on the number of farms. The first cluster concerns the farms with more than 100 hectares of UAA and horse breeding (Group 1 green color). Horse breeding in Italy represents the starting point of the national horse industry. In fact, there are more than 600,000 hectares of land used for this activity, and this land is by no means marginal, but is fully utilized for the cultivation of direct feed for animals (hay, oats, alfalfa, silage, straw, etc.), which in large part is then sent for industrial processing for the production of feed, supplements, and complementary products (indirect processing feed—feed industry).
The horse industry is not only an agricultural and livestock issue, but also a “social issue” because it involves and engages a wide base of subjects and operators (breeders, owners, trainers, riders/fanters, racetracks, etc.), varying among themselves, but fundamental in economic and productive terms, to the benefit of “Made in Italy” as well.
Agricultural enterprises with cereal, grapevines, and olive trees are more fragmented and thus characterized by smaller farm sizes; up to 20 hectares of extension farms’ characteristics are grouped together (blue cluster). Conversely, farms growing tree crops such as apple and pear, typical northern Italian crops, have extensions ranging from 50 to 100 hectares (Group 1 green color).
The age of entrepreneurs is another variable that contributed to create the clusters (Table 17). In particular, an age below 40 years old is strictly linked with the university degree level of education of the entrepreneur (Group 2 red color). Instead, an age above 40 years old is linked with farms of up to 20 hectares. Moreover, an age below 40 years old is linked with medium and big ESU, digitalized and innovative farms, and an extension of up to 50 hectares (Group 2 red color). Almost all types of farming activity practiced are not closely related to a particular age of the entrepreneur, which does not affect these variables.
Instead, farm size, as shown in Table 17, is the variable that mainly determines the clusters’ generation, highlighting the importance of this variable in determining the farming types and the farm’s characteristics, composed by the various variables that have been observed and discussed for the agriculture sector in the previous Section 4.1, Section 4.2 and Section 4.3.
The middle school education (Group 4 black color) is a variable that links only to the variable of farm size up to 5 hectares at one of the last stages of agglomeration; this means that there are only very few enterprises with marginal characteristics (Figure 7).

5. Discussion

The elaboration and combination of the data from the seventh Italian GCA and the subsequent analyses applied allowed us to highlight the changes that occurred in the Italian agricultural sector in the period 2010–2020, and the possible interconnections between them.
The most important finding was the large reduction in the number of farms, both nationally and in all regions of Italy, including in Sicily (Table 1). This sharp numerical reduction of farms confirms a trend that started as early as 50 years ago and has never stopped or changed direction.
However, from the analysis carried out, we were able to draw several elements that led to a conclusion regarding the observed reduction of farms.
  • The first element to note is that the utilized agricultural area (UUA) did not reduce significantly. The Italian UAA decreased by 2.5% in the last 10 years, while farms have decreased by about half a million in the same period (Table 1).
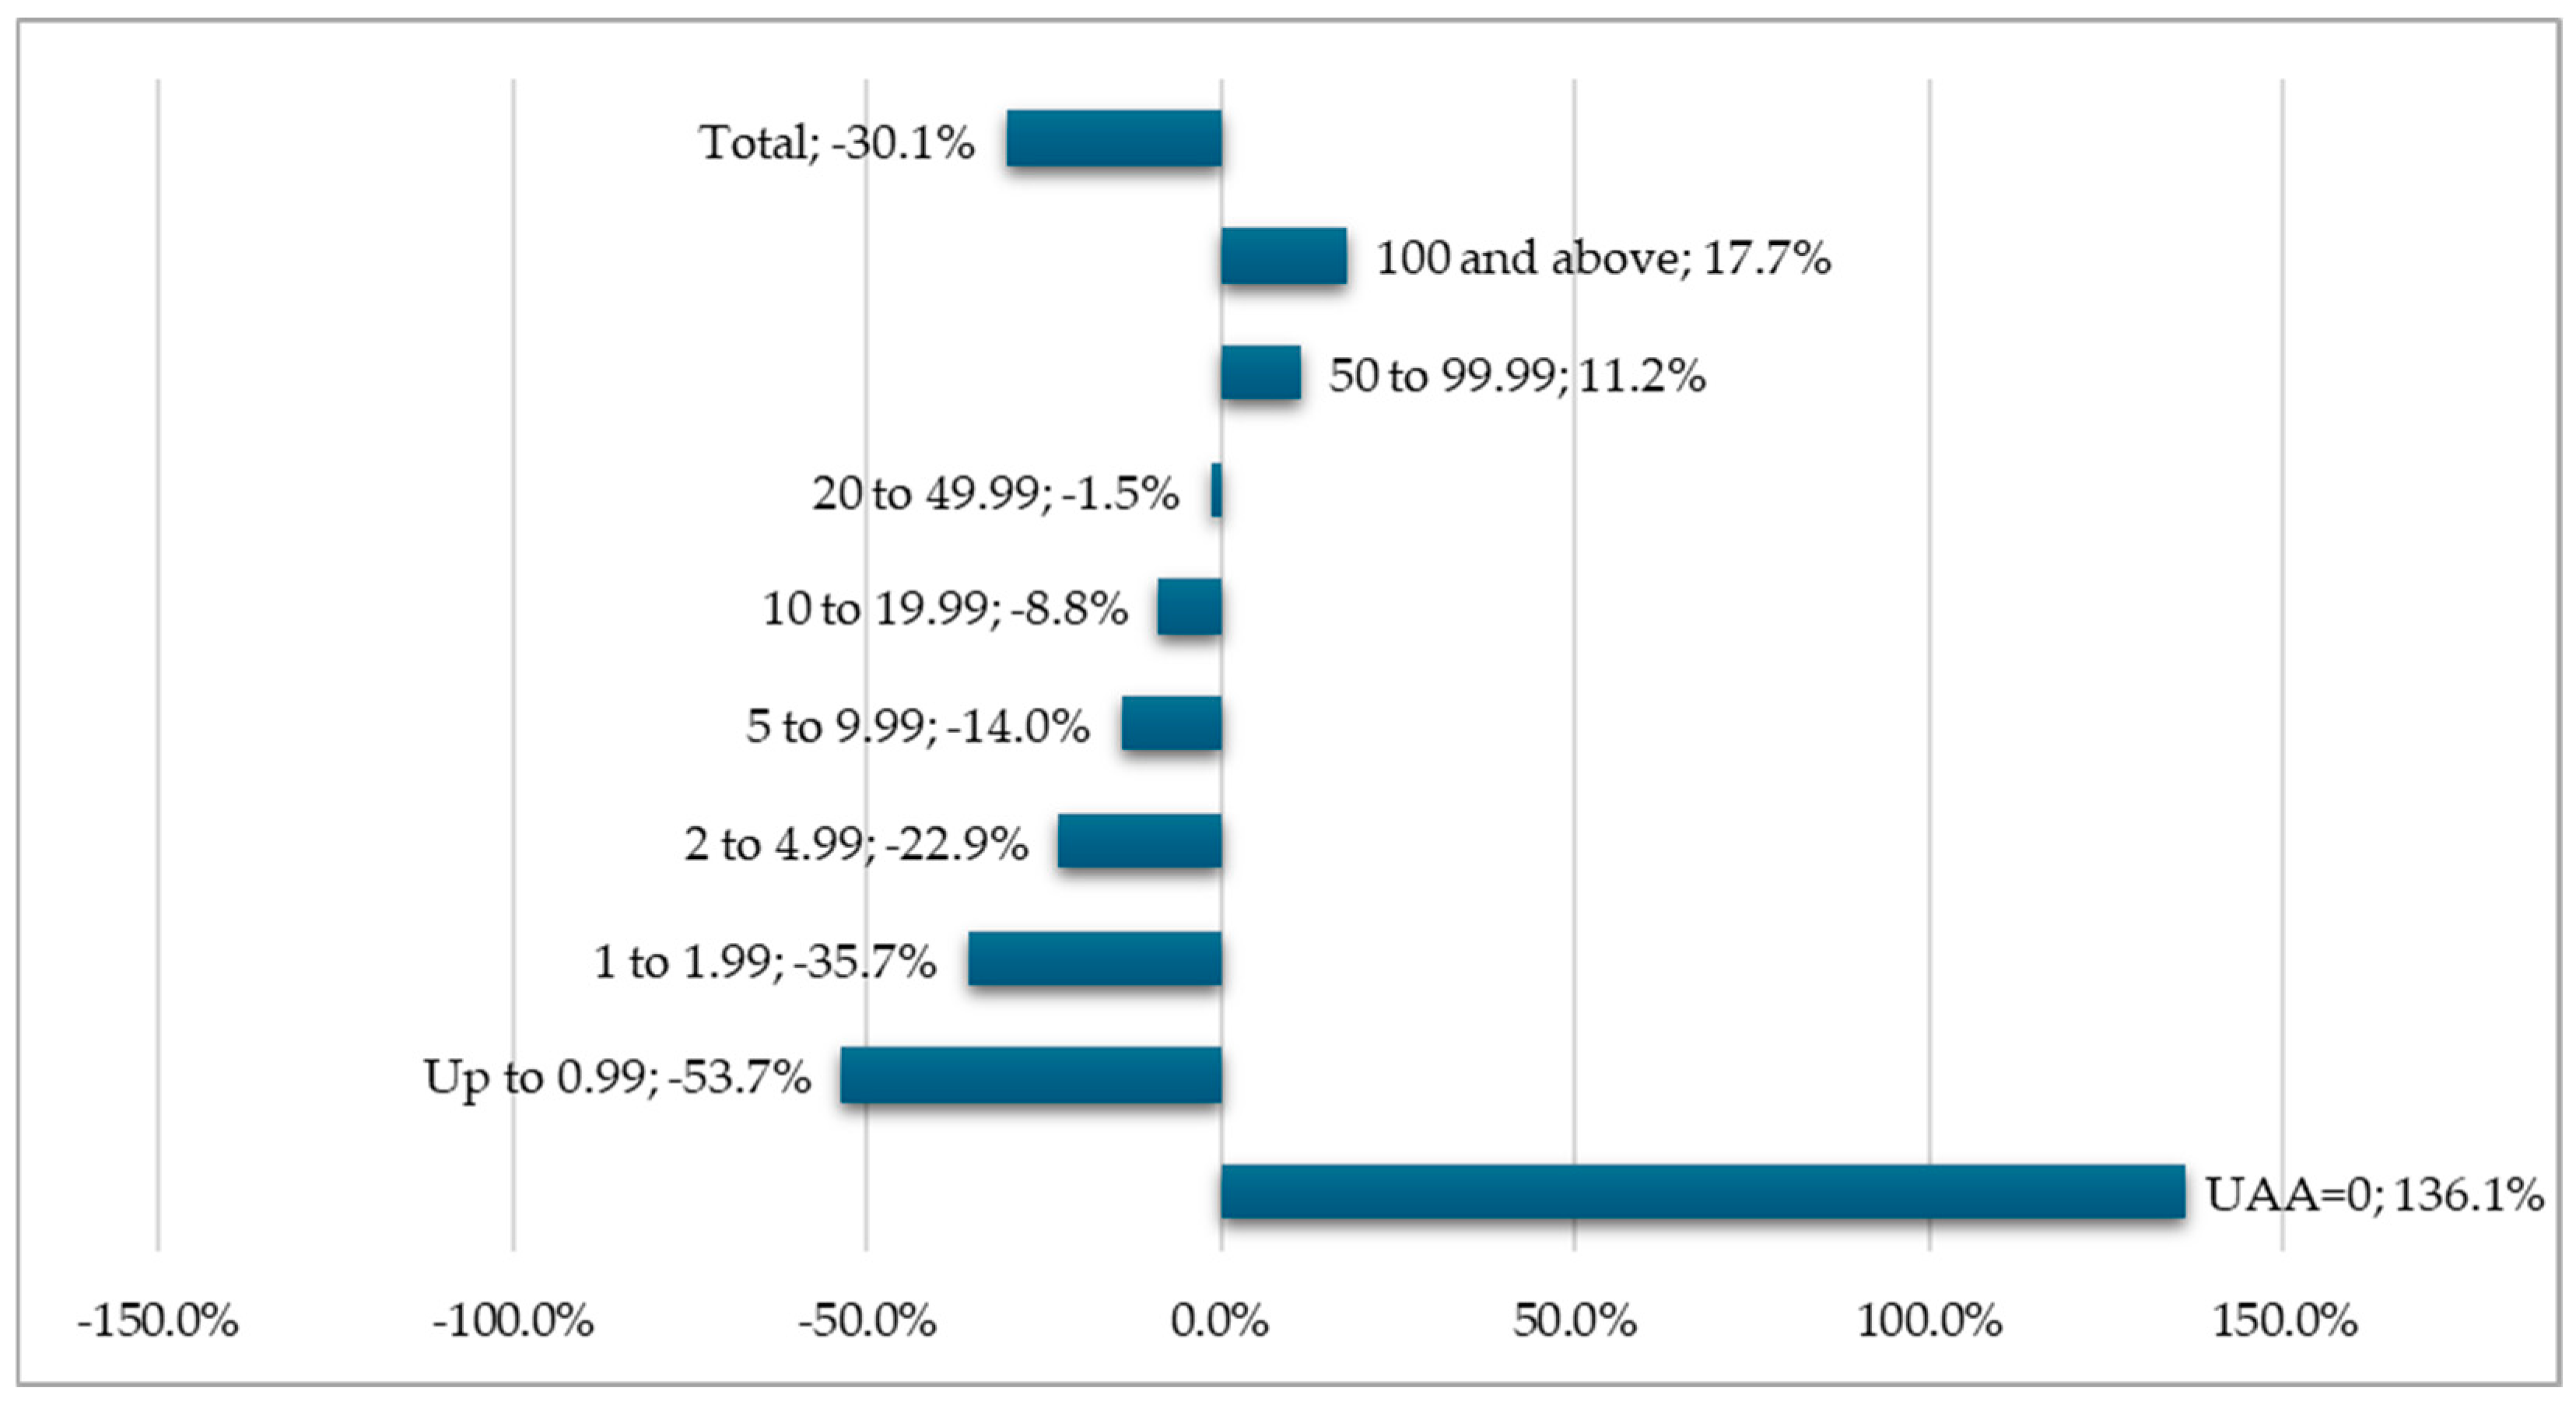
  • A second element to note is that smaller companies showed a greater decrease than medium ones (farms smaller than 4.99 hectares decreased by 39.4% over the analyzed period), and large-sized companies (at national and regional levels) even increased (Figure 1). Therefore, besides the fact that small farms ceased their activity, the total utilized agricultural area remained almost unchanged.
  • Moreover, the cessation of activity of small farms stands alongside the increase in the number of farms with UAA over 50 hectares, which also increased their agricultural cultivated area and consolidated their structure (Figure 1).
  • Certainly, it should be noted that during the last ten years, Italian agriculture had to face the challenges of the international markets and had to change marketing and production strategies to survive [14,17,22,41]. Moreover, farms had to address environmental challenges and ensure a contribution to climate change adaptation and mitigation [23]. In this context, bigger farms would have easily adapted to these changes, being able to cover production costs more easily than micro-farms, while maintaining product quality, for the positioning of Italian food products in a specific market segment [42,43]. In fact, findings of this study show that many micro- farms have closed down their agricultural activity, and rent or sell the land unused to other entrepreneurs, probably with farms of vaster UAA.
  • It cannot be underestimated that the seventh GCA in Italy was carried out during the COVID-19 pandemic, and so there is also the possibility that the quality of the census might have been affected by the difficulty of very small enterprises (micro-enterprises) being reached by the surveyors, which is credible at the national level. However, it seems unacceptable to confine the main cause of this decrease to the COVID-19 pandemic, given the large number of farms that were missing from the census list used as a starting point for the seventh census, which started with the farms surveyed in 2010. In addition, in the 2020 Census, the regions carried out control activities on the monitoring of the survey and the quality of the data collected (as well as any additional activities). During the previous GCA in 2010, the ISTAT started a collaboration with the Regional Statistic Office and with the Regional Consortium for Applied Research and Experimentation (CORERAS), an important regional research center for agriculture. Thanks to this collaboration, the CORERAS carried out checks on the aggregate data tables received from ISTAT during the census survey, and constantly monitored the results of the surveyors’ activities to ensure a high level of quality of the surveys. Unlike the previous experience of 2010, for the seventh census, the interviews to entrepreneurs were not carried out at farms, but, according to the general census plan, through telephone survey channels, or at appointed peripheral regional offices, or through the website (voluntary compilation) and managed by the ISTAT, despite the reconfirmed collaboration with Regional Statistic Office and the CORERAS, whose collaboration was limited to monitoring the quality of aggregated data and providing reports. It also happened, however, that the face-to-face interviews carried out by the surveyors at the peripheral regional offices were mainly dedicated to the larger enterprises, leaving the micro-enterprises to answer the questionnaire through telephone or web interviews.
As for the reduction in the number of farms by specific agricultural activity practices, it is clear that this reflects the general reduction in the number of farms (Table 1). It is interesting to note that this reduction occurred for some of the most important crops (Table 3, Figure 1). A decrease in farms in areas with agrarian tree produce, perennial crops, as well as a planting of innovative crops was observed, as was an increase in farms in the area of arable crops (Table 3). It is well known that in the Italian regions with a high agricultural vocation, like Sicily for example, it is difficult to abandon certain quality productions, on which the economy of entire territories is based. However, the increase in the number of farms in the branch of annual crops, in contrast to the slight reductions of those cultivating perennial crops (Table 3), indicates a process of reconversion started by farmers. It is possible that in order to face the increasingly severe climate change and less productive agricultural plantations, a period of reconversion with temporary annual crops was chosen to select and replant more resistant and productive perennial plantations for today’s climatic contexts [44], able to adapt to the new climatic environment. Moreover, the CAP has been able to influence Italian agriculture (and also that of other EU countries) with the per-hectare contribution for some specific crops.
With regard to the workforce at farms, findings revealed an increase from 2010 to 2020, of younger entrepreneurs, despite the high number of firms with entrepreneurs aged over 40 years old (Table 6) [32]. Similarly, despite the high number of entrepreneurs with a high-school diploma or lower, there was an increase in the number of farm holders with a university degree, both in the agricultural sciences and other academic sciences (Table 7). This highlights that nowadays the owner of a farm, particularly if the farm is not very small, does not need to have specific “agricultural” education, but that these skills must be held by those who materially work at the farm, like farmworkers, agronomists, and technicians. In fact, with regard to technicians, the adoption of new technologies and digitalization/computerization in agriculture is leading to a growing demand for “digitally” skilled workers [45]. Other authors have studied in depth the CAP instruments that influence the recruitment of the workforce in the Italian agricultural sector, and findings have highlighted that often the workers with high skills remain dissatisfied at firms due to the poor conditions offered [31,46]. Another interesting issue is that of the employment of foreign labor in European agriculture and in Italy as well. Other authors suggested that this should also become an area of focus for CAP, as this labor force is a structural component of the EU agricultural sector [31,46]. In this context, the objectives of the policies involved should aim to build a mutually beneficial framework to counter illegal labor, helping farm owners to easily hire foreign workers when they need them and, in a broader perspective beyond the agricultural sector, integrating these workers into the (mostly) rural economies in which they live.
Another interesting phenomenon is the change in the structure of the livestock sector. In particular, it is possible that the consumers’ change in eating habits [47] has led to a more diverse and varied demand for alternative protein sources to red meat [48], and this change has influenced the increase in the number of enterprises farming poultry and pigs, both at national and regional levels (Table 4). These types of white meat can also be processed into products with a higher economic value (like minimally processed food) [48]. Moreover, pigs and poultry can exert an important synergy in supporting the harmonious development of a farm [41]. According to the literature, a major issue in this context might be to find ways to better integrate pig and poultry production into overall land use [49] but it would also contribute to the overall increase in organic production [49]. Therefore, it emerges that Italy is also moving toward this type of breeding.
Among the farm’s sources of revenues there are farm products, related activities, and public subsidies, and in Italy, according to the ISTAT census data, the majority of farms’ revenues come from the sale of farm products (ISTAT data [2]). In addition, with regard to public subsidies, census data show that 25.4% of farms do not receive subsidies, and northern Italy has the lowest number of farms receiving public subsides, reaching 16% of the total (ISTAT data [2]). Comparing public subsidies to the total revenues, ISTAT census data (ISTAT data [2]) show that in northern Italy they are 27.5% of the farm’s total revenues, in southern Italy, instead, they are 56.7% of the farm’s total revenues. Results of this study also show the adherence of Italian farms to EU aid measures to supplement farm income, particularly of those in the south. These aid measures are partially aimed at investments to favor innovation in agriculture.
Investments in innovation for developing the farm do not only cover areas like mechanization or digitalization/computerization, but also other areas directly related to multifunctional agriculture (MA), including those in renewable energy or waste management. Several studies have shown that MA and its related activities play a strategic role to improve the farm’s competitiveness [50]. In particular, MA has become crucial for a variety of side activities with social, ethical, and environmental aims both in Italy and in Sicily [12,50], like in other foreign agricultural territories [51]. In fact, through MA, a two-fold purpose is achieved: diversifying farmers’ income with activities complementary to agriculture and ensuring the maintenance of rural areas through the enhancement of endogenous resources. Therefore, these types of investment in innovation help farms to differentiate in the market, add complementary incomes, become resilient, and the EU aid measures may help farms to achieve these goals [52].
Regarding waste management, despite being increasingly important for European policies [1], there are few initiatives undertaken by Italian farms to fulfil good ecological practices. Perhaps public institutions might improve communication with farmers, and information provided on these issues [12,35,40,42,53]. In addition, facilitating operations toward proper and functional waste management by farms could contribute substantially to green transition and implementation of environmentally sustainable practices [35].
The cluster analysis highlighted two different primary sector’s segments (Figure 6, Group 1 green color and Group 2 blue color)consisting of regions with similar characteristics within, but different characteristics between, segments. This result demonstrates the variety of Italian agriculture and its consequent complexity in terms of both management and development policies that respond to the needs of agricultural territories that are also profoundly different in social and economic terms [54]. For example, agricultural enterprises in northern Italy for pedoclimatic reasons practice different agricultural activities from those practiced by enterprises in central or southern Italy. Consequently, they have different structural characteristics. Such structural characteristics between northern and southern enterprises (e.g., farm size, level of mechanization, type of business innovation, governance structure, etc.), however, depend not only on the type of agriculture practiced but also on historical and political reasons that have influenced the culture of entrepreneurs and their ability to develop economically and socially.
The cluster analysis also allowed the identification of well-delineated farm profiles, that is, profiles of farms with specific characteristics. Three main farm profiles were identified, and the variables that contributed most to the three profiles were farm size and age of the holder. This result is important, not only because it highlights the specific characteristics of each type of farm and farming activity in Italy but also how and how much they are related to farm structure and the age of the farmer, once again highlighting the multiplicity of characteristics that distinguish Italian agricultural enterprises [54,55].
The CAP guidelines defined in the past two decades can be summarized as enhancing the competitiveness of agriculture in international markets, promoting the quality of agricultural products, environmental respect and protection, food safety, animal welfare, good agronomic and environmental conditions, and strengthening rural development.
We should take into consideration that the process of economic and social development in the area of industrialized countries and advanced economies has induced, with the evolution of the spending capacity and sociocultural level reached by the populations, a food demand with connotations that go beyond the satisfaction of primary or basic needs, involving cultural, ethical, and environmental values [39]. The evolution of food demand, in the context of globalization, has in turn induced production, distribution, and industrial processing organization processes of international importance. In this context, the consumer with his behavior has realized two coexisting forms of consumption—massification, but with the connotation of the assumption of food safety, and personalization, also with the assumption of health and cultural and social enjoyment. Therefore, the consumer has succeeded in changing the competitive relationships between companies with his changing behavior and has linked their competitive advantages to the territory (products with designation of origin, typical, historical, organic, agritourism, food and wine tourism, etc.), the country (Made in Italy, Mediterranean Diet), and the region (especially in wines) [39]. In modern agribusiness systems, therefore, the position that the agricultural (and/or industrial) producer is the one who chooses (controls) the distributor is outmoded, but rather the producer must relate to the modern distribution system for two main reasons—the effects of globalization and the modern distribution system. Therefore, agricultural, agribusiness, and food enterprises, in order to be on the market must have structures, organization, and behavioral and strategic modes consistent with and appropriate to those dictated by marketing policies [56].

Focus on Sicilian Agriculture

Particularly with regard to agriculture in Sicily, a modern vision of the sector and the system could be a significant strategic resource for Italy, producing income and employment, especially for young people. It is a creator of landscape, environmental protection, development for gastronomy, culture, tertiary economy (e.g., tourism), and more. In fact, Sicilian agriculture already is in some cases: territorial, compartmental, farm, and family. These cases, however, are insufficient to push regional economic development (product per capita) above the average of European or at least Italian regions (the product per capita in Sicily is equivalent to 64–66% of the average Italian product and 48–50% of that of the Lombardy region). Sicily is always a developing region, just note that in the last 25 years it has not managed to get out of the ambit of the European Objective 1 regions or the “convergence” objective. The EU “convergence” objective regions are the group of European regions lagging behind in terms of income, employment, productive structures, infrastructure, and with less than 75% of the average EU GDP per capita. This feature, of course, assures the Sicilian region more resources and financial aid from the EU within the framework of European structural programming, but on the other hand it continues to relegate it to the last place in the economic ranking of European regions, and also of Italian regions, having as “historical companions” some regions of the Meridione (Campania, Puglia, and Calabria regions). Also, this result was highlighted by the cluster analysis.
It is true, however, that in the economy and society all components condition each other, and these conditionings are of very different natures, some are uncontrollable, e.g., the climate, world international policies, and events of whatever nature, others are more controllable, such as European events, and others are quite controllable such as national and regional policies and events more so. And it is precisely the latter that should serve to adapt and adjust the regional agricultural system (since it is a productive sector) to the pattern of European and international competitiveness. Instead, the situation of Sicilian agriculture, and of its broader agribusiness and rural system, in recent decades is one of de-growth or minimal growth, in the sense that when it grows the rate is insufficient to bridge the traditional socioeconomic gaps with Italian and central-northern regions and with European ones in an EU international context. In fact, the EU over the past thirty years has greatly transformed economic, social, and cultural relations among geo-economic areas, among countries, and among enterprises. The consequent situation for Sicily is that of a strong incidence of incomes below the poverty line, of heavy unemployment, especially youth (57%), of emigration of young, professionally, and culturally more productive forces.
The census data (ISTAT data [2]) confirm that in southern Italy, public subsidies are a consistent part of the farms’ revenues, which are predominantly small. This phenomenon is also connected to the particular type of agricultural activities carried out by the farms in the Mezzogiorno of Italy, which are mainly cereal-livestock farms, almost all of which are organic, e.g., organic livestock meadows and pastures, organic arable land, organic olive groves, and for Sicily the citrus and wine branches. Regarding the type of revenues of Sicilian farms, data from the seventh census report show that 73.1% of farmers receive subsidies, and public subsidies account for 47% of the total revenue of Sicilian farms.
Organic farming and other environmentally friendly measures currently provide annual support to farmers that have implemented sustainable practices to produce organic products [2,29,57]. Specifically with regard to Sicily, data provided by the Regional Department of Agriculture and Forestry report that, in the last decade, the number of producers of organic products has remained almost identical to that of the previous decade, signifying an expansion in farm size. This is in line with the results provided by this study regarding the change in farm size.
The culture of the quality of agri-food products in Sicily, by now, is a widespread phenomenon and is often connected with the activity of local tourism, as evidenced by several hundred events (festivals, fairs, markets, festinal, kermesse, etc.) dedicated to agri-food, typical products, and taste [58]. These events are distributed throughout the year with a concentration in the autumn, involving municipal, provincial, and regional public administrations, professional organizations, local authorities, chambers of commerce, etc., not excluding spontaneous committees and private initiatives in the organization.
For an observer who seeks to identify evolutionary lines in the Sicilian agricultural reality through reading census data and the findings of the surveys that may arise from them, the task is hampered by the variety of contexts in which productive activity is exercised and their complexity [9,23,29,31,37,43,54,55]. This has been clearly highlighted by cluster analysis.
The growth in average farm size, which seems to bring Sicily closer to more professional agriculture than other very different territorial contexts, such as those in northern Italy and certain European countries, is made more credible by a higher incidence of farms with wage earners and an increase in rented land. Not forgetting the increasing use of passive farm contracting and the adoption of more efficient irrigation systems.
In addition, the strong increase in more sustainable and professional livestock farming and the spread of organic crops are the benchmark data for rural development involving even the most marginal areas of agricultural land [57]. However, these changes seem to reflect specific CAP measures rather than a spontaneous trend toward strengthening the production structure [29]. Indeed, it should not be overlooked that the aforementioned trends occur in a general context in which most of the work days are carried out by owner–entrepreneurs and in which the age of the holders is advanced—even an increase in young graduates has been noted. Moreover, consideration must be given to the still inadequate prevailing modes of selling production (marketing and delivery to association structures), which point to the other well-known economic difficulties in the sector [29].
Finally, the Sicilian region also still lags behind in terms of the level of innovation of agricultural enterprises, as shown in Section 4, this denotes a lack of understanding of the close link between agricultural resources and territorial resources [59,60,61].
To conclude, the current agricultural set-up is, therefore, considerably different from that of previous decades, and it has also changed progressively through the application of the measures provided for in the CAP, including the policy of quality, typicality, and organic farming, which aroused immediate interest in Italian and especially Sicilian farmers [2,29]. From the analysis of the processed data from the census universe of the Italian farms, it is possible to conclude that today’s farms are very different from those of the past in terms of dimensions, innovation (agriculture 4.0), and skills needed to manage the future agriculture also in view of the increasing application of Multifunctionality [37,38].
At the end of this study, the question that comes to the attention of agricultural economists and all those who are in any way interested in the development of the agricultural sector is what is the most suitable model of development for agricultural territories, such as the Italian and Sicilian ones more particularly profoundly different from the rest of Europe. Agriculture in Italy, and even more so in Sicily, has a high value not only for the production of food, and today more and more quality food, but also because it is the social and cultural link between cities and rural territories [62]. Italian agriculture keeps alive rural territories that would otherwise suffer even more from depopulation and economic and demographic impoverishment.
Certainly, precision agriculture, innovation, and greening policies are elements that foster development [63]. However, elements of rural development that are extremely important to this country, such as those related to tourism, gastronomy, and quality production, cannot and should not be left out [39,58]. This is because, above all, many Italian agricultural contexts, such as that of Sicily, for example, can never be transformed into others typical of extremely intensive and mechanized agriculture, precisely because of the intrinsic physical, biodiversity, and pedoclimatic characteristics that distinguish them [39,58].
And, thus, if the high heritage of these territories is to be enhanced, perhaps more attention will have to be given to their profound differences from others in the formulation of CAP policies and measures [60,61]. Therefore, the model of agriculture that the EU will want to outline for the next programming period 2020–2023 should also take into account these deep differences between the various agricultural regions of the EU [64,65] and apply the financial and regulatory instruments in a way that is more in line with the needs of the different territories in the various EU countries in order to enhance their specific strengths [53].

6. Limitations and Future Research

The analyses carried out do not consider all the huge quantity of data provided by the seventh Italian census [2]. Clearly, given the enormous amount of data provided at national, but also regional and provincial levels, by the agriculture census, it is not possible to make a combined analysis in just one scientific article or volume. However, this was not the aim of this study. The study aimed to highlight the most important characteristics of the Italian farms and the changes that occurred in the Italian agriculture sector between the census of 2010 and that of 2020. The results are of great interest to agricultural economics scholars and policy makers because they help identify the strategic elements of farms and land that need to be strengthened to foster economic and social development, and can provide insights into the effectiveness of the EU’s 2023–2027 CAP development strategy.
In fact, the new CAP will influence EU agriculture with its strong goals of digitalization, sustainability, and the preservation of agro-biodiversity. Nevertheless, in light of these findings, the new CAP’s objectives may be very difficult to meet for Italian and particularly Sicilian farmers, as well as other farmers in other similar territories of the EU. Therefore, the EU CAP needs to consider the differences between different agricultural territories and apply the financial and regulatory instruments able to satisfy the needs of the different territories in the various EU countries [49]. However, these issues are complex and require a more in-depth analysis and separate treatment. Future research is going to be carried out by the authors to provide more in-depth analyses of branches of activity or focusing on specific topics, with particular reference to the environmental sustainability of Italian farms.

7. Conclusions

This study aimed to provide a scientific analysis of the significant changes that occurred in the Italian agriculture sector during the seven-year programming period of the EU CAP 2014–2020, and in the decade between the two censuses of 2010 and 2020. During this decade, Italy certainly underwent profound changes and substantial rearrangements of the agricultural sector, generated by several micro- and macro-factors that occurred. This study highlighted the current framework of Italian agriculture and outlined the characteristics of Italian farms. One interesting finding was the reduction in number of small and micro-farms, at both the Italian and Sicilian levels. This is a confirmation of the trend started during the previous decade, in which small farms ceased their activities and the remaining farms became larger and consolidated their structures. Instead, the agricultural area changed in terms of cultivated species, but the extension of the cultivated area remained unchanged over the years. Another interesting finding is the increase in farms with vaster dimensions in all the agricultural branches.
Moreover the study highlighted positive correlations between “innovative farms” and other variables, i.e., the age of the entrepreneurs, their education level, and the extension of the farm’s Utilized Agricultural Area (UAA). And finally, it provided a “sector segmentation” (subset of regions that have similar characteristics of farms, farmers, and farming practices) and the Italian “farm profiles”, i.e., a description that contains key information about a specific type of farm and farming practices.
All these results delineated the framework of Italian agriculture, its differences, and its peculiarities. Results help to bridge the gap in the existing scientific literature, providing important information for academics (agricultural economists in particular), policy makers, farmers, and stakeholders at national and international levels.
The EU CAP, which was created to overcome territorial and sectoral socio-economic disparities using subsidies, has resulted in a massive disbursement based on farm size. Thus, in over 50 years, the CAP has not produced the desired effects [49]. On the contrary, it has deepened, sometimes, the gap between strong and weaker farms, and between unrestricted and marginal territories. The reason is to be found in the fact that it was conceived in a one-way direction without being articulated and differentiated in the different regions, without real planning in and with the territories, even with important national and regional responsibilities and goals of cohesion [49]. Knowledge of the actual situation of an important agricultural context in the EU, such as that of Italy, in view of prospects and challenges of the new CAP 2020–2023, with the outcome of having highlighted different farm typologies and types of farming practiced, can contribute to the design of targeted and tailored agricultural policy instruments. By improving the policies, taking into account the specific differences of all the agricultural regions of the EU, it will be possible to increase their acceptance and perceived fairness. More equity for farmers would improve the effectiveness and efficiency of the CAP, which is urgently needed for a successful transition of the agricultural sector towards sustainability, both environmental and economic.

Author Contributions

Conceptualization, L.A. and M.I.; methodology, M.I.; software, P.C. and M.I.; validation, S.B., S.C. and M.I.; formal analysis, L.A., P.C., S.B., S.C. and M.I.; investigation, P.C. and M.I.; resources, P.C. and M.I.; data curation, P.C. and M.I.; writing—original draft preparation, P.C. and M.I.; writing—review and editing, M.I.; visualization, S.B., S.C. and M.I.; supervision, M.I.; project administration, M.I.; funding acquisition, S.C. and M.I. All authors have read and agreed to the published version of the manuscript.

Funding

This research was funded by FFR2024 Stefania Chironi (FFR: Fondo finalizzato alla ricercar di Ateneo, Fund holder: Stefania Chironi) and FFR2024 Marzia Ingrassia (FFR: Fondo finalizzato alla ricercar di Ateneo, Fund holder: Marzia Ingrassia).

Institutional Review Board Statement

Not applicable.

Data Availability Statement

Data will be provided by authors on request.

Acknowledgments

We thank the Consorzio Regionale per la Ricerca Applicata e la Sperimentazione (CORERAS) for its co-operation.

Conflicts of Interest

The authors declare no conflicts of interest.

References

  1. European Commission. Agriculture and Rural Development. Common Agricultural Policy. Available online: https://agriculture.ec.europa.eu/common-agricultural-policy_en#:~:text=The%20common%20agricultural%20policy%20(CAP,and%20keeps%20rural%20areas%20vibrant (accessed on 15 January 2024).
  2. ISTAT. 7° Censimento Generale dell’Agricoltura. Istituto Nazionale di Statistica—ISTAT. (The General Census of Agriculture); ISTAT: Rome, Italy, 2020; Available online: https://7censimentoagricoltura.it/ (accessed on 9 May 2024).
  3. Istituto Nazionale di Statistica (ISTAT). Available online: https://www.istat.it/ (accessed on 9 May 2024).
  4. Series, G.A. Census of Agriculture; US Bureau of the Census, Department of Commerce: Washington, DC, USA, 1992.
  5. Austin, W.L. The census of agriculture. J. Am. Stat. Assoc. 1930, 25, 130–134. [Google Scholar]
  6. Rogus, S.; Dimitri, C. Agriculture in urban and peri-urban areas in the United States: Highlights from the Census of Agriculture. Renew. Agric. Food Syst. 2015, 30, 64–78. [Google Scholar] [CrossRef]
  7. Young, L.J.; Lamas, A.C.; Abreu, D.A. The 2012 Census of Agriculture: A capture–recapture analysis. J. Agric. Biol. Environ. Stat. 2017, 22, 523–539. [Google Scholar] [CrossRef]
  8. Henke, R.; Sardone, R. The 7th Italian Agricultural Census: New directions and legacies of the past. Ital. Rev. Agric. Econ. (REA) 2022, 77, 67–75. [Google Scholar] [CrossRef]
  9. Licciardo, F.; Tarangioli, S.; Gargano, G.; Tomassini, S.; Zanetti, B. The 7th Census of Italian agriculture: Characteristics, structures and dynamics of generational renewal. Ital. Rev. Agric. Econ. 2023, 78, 109–118. [Google Scholar] [CrossRef]
  10. Frolking, S.; Qiu, J.; Boles, S.; Xiao, X.; Liu, J.; Zhuang, Y.; Li, C.; Qin, X. Combining remote sensing and ground census data to develop new maps of the distribution of rice agriculture in China. Glob. Biogeochem. Cycles 2002, 16, 38–41. [Google Scholar] [CrossRef]
  11. European Commission. The Future of Food and Farming–For a Flexible, Fair and Sustainable Common Agricultural Policy; EU Publications Office: Luxembourg, 2007; Available online: https://ec.europa.eu/commission/presscorner/detail/en/IP_17_4841 (accessed on 10 November 2020).
  12. Ingrassia, M.; Bacarella, S.; Bellia, C.; Columba, P.; Adamo, M.M.; Altamore, L.; Chironi, S. Circular Economy and Agritourism: A Sustainable Behavioral Model for Tourists and Farmers in the Post-COVID Era. Front. Sustain. Food Syst. 2023, 7, 1174623. [Google Scholar] [CrossRef]
  13. Cardillo, C.; Cimino, O.; De Rosa, M.; Francescone, M. The Evolution of Multifunctional Agriculture in Italy. Sustainability 2023, 15, 11403. [Google Scholar] [CrossRef]
  14. Rapporto Completo. Speciale Emergenza COVID-19—n. 3; Istituto di Servizi per il Mercato Agricolo Alimentare (ISMEA): Rome, Italy, 2020; Available online: https://www.ismeamercati.it/flex/cm/pages/ServeBLOB.php/L/IT/IDPagina/10600 (accessed on 14 February 2024).
  15. Istituto di Servizi per il Mercato Agricolo Alimentare (ISMEA). Available online: https://www.ismea.it/flex/cm/pages/ServeBLOB.php/L/IT/IDPagina/9427 (accessed on 14 February 2024).
  16. European Commission. The European Green Deal. Available online: https://commission.europa.eu/strategy-and-policy/priorities-2019-2024/european-green-deal_en (accessed on 14 February 2024).
  17. Miranda, D.O.; Alegre, E.V.A.; Faus, A.M.M. Agriculture in Mediterranean Europe: Between Old and New Paradigms; Emerald Group Publishing: Leeds, UK, 2013. [Google Scholar]
  18. Ingrassia, M.; Chironi, S.; Lo Grasso, G.; Gristina, L.; Francesca, N.; Bacarella, S.; Columba, P.; Altamore, L. Is Environmental Sustainability Also “Economically Efficient”? The Case of the “SOStain” Certification for Sicilian Sparkling Wines. Sustainability 2022, 14, 7359. [Google Scholar] [CrossRef]
  19. Ingrassia, M.; Altamore, L.; Bacarella, S.; Bellia, C.; Columba, P.; Chironi, S. Influence of Coherent Context for Positioning Distinctive and Iconic Sicilian Sparkling Wines: Effect of a Sensorial Experience on a Gulet. J. Int. Food Agribus. Mark. 2022, 34, 144–175. [Google Scholar] [CrossRef]
  20. Caruso, T.; Marra, F.P.; Costa, F.; Campisi, G.; Macaluso, L.; Marchese, A. Genetic Diversity and Clonal Variation within the Main Sicilian Olive Cultivars Based on Morphological Traits and Microsatellite Markers. Sci. Hortic. 2014, 180, 130–138. [Google Scholar] [CrossRef]
  21. Sgroi, F.; Piraino, F.; Garifo, G.; Modica, F.; Ingrassia, M. Information Asymmetry in the Agri-Food Sector and Territorial Marks: The Case of the Olive Oil Val Di Mazara PDO. J. Agric. Food Res. 2022, 9, 100337. [Google Scholar] [CrossRef]
  22. Huang, K.-M.; Guan, Z.; Hammami, A. The U.S. Fresh Fruit and Vegetable Industry: An Overview of Production and Trade. Agriculture 2022, 12, 1719. [Google Scholar] [CrossRef]
  23. Fanelli, R.M. Barriers and Drivers Underpinning Newcomers in Agriculture: Evidence from Italian Census Data. Sustainability 2023, 15, 10755. [Google Scholar] [CrossRef]
  24. De Lillo, A.; Argentin, G.; Lucchini, M.; Sarti, S.; Terraneo, M. Analisi Multivariata per le Scienze Sociali; Pearson Education: London, UK, 2007. [Google Scholar]
  25. Trapanese, L.; Petrocchi Jasinski, F.; Bifulco, G.; Pasquino, N.; Bernabucci, U.; Salzano, A. Buffalo Welfare: A Literature Review from 1992 to 2023 with a Text Mining and Topic Analysis Approach. Ital. J. Anim. Sci. 2024, 23, 570–584. [Google Scholar] [CrossRef]
  26. Salari, F.; Altomonte, I.; Martini, M. Buffalo milk: A case study of some parameters related to milk production. Large Anim. Rev. 2013, 19, 17–20. [Google Scholar]
  27. Ingrassia, M.; Sgroi, F.; Tudisca, S.; Chironi, S. Study of consumer preferences in regard to the blonde orange Cv. Washington navel “Arancia Di Ribera PDO”. J. Food Prod. Mark. 2017, 23, 799–816. [Google Scholar] [CrossRef]
  28. ISMEA. Available online: https://www.ismeamercati.it/flex/cm/pages/ServeAttachment.php/L/IT/D/1%252F0%252F6%252FD.3ce511943daed55749dc/P/BLOB%3AID%3D12513/E/pdf?mode=download (accessed on 14 February 2023).
  29. ISTAT. Le Statistiche per L’agricoltura Siciliana: Informazioni per le Analisi e le Politiche. 6° In Censimento Dell’agricoltura 2010; Rapporto sui dati Definitivi della Sicilia; Edizioni LEIMA: Palermo, Italy, 2016; ISBN 978-88-98395-55-2. [Google Scholar]
  30. Coderoni, S.; Cardillo, C.; Macrì, M.C.; Perito, M.A. Farms Employing Foreign Workers in Italy: An Analysis with Census Micro Data. Ger. J. Agric. Econ. 2018, 67, 185–202. [Google Scholar] [CrossRef]
  31. Macrì, M.C.; Orsini, S. Policy Instruments to Improve Foreign Workforce’s Position and Social Sustainability of the Agriculture in Italy. Sustainability 2024, 16, 4998. [Google Scholar] [CrossRef]
  32. Istituto Nazionale di Statistica (ISTAT). Digitalizzazione e Innovazione Delle Aziende Agricole Italiane. Available online: https://www.istat.it/wp-content/uploads/2022/06/censimento_agricoltura_gnesi.pdf (accessed on 3 June 2024).
  33. Liuzzo, L.; Noto, L.V.; Arnone, E.; Caracciolo, D.; La Loggia, G. Modifications in Water Resources Availability under Climate Changes: A Case Study in a Sicilian Basin. Water Resour. Manag. 2015, 29, 1117–1135. [Google Scholar] [CrossRef]
  34. Wang, M.; Bodirsky, B.L.; Rijneveld, R.; Beier, F.; Bak, M.P.; Batool, M.; Droppers, B.; Popp, A.; Van Vliet, M.T.H.; Strokal, M. A Triple Increase in Global River Basins with Water Scarcity Due to Future Pollution. Nat. Commun. 2024, 15, 880. [Google Scholar] [CrossRef] [PubMed]
  35. Blanke, M. Challenges of Reducing Fresh Produce Waste in Europe—From Farm to Fork. Agriculture 2015, 5, 389–399. [Google Scholar] [CrossRef]
  36. Buglione, A.; Ottaviani, L. Analisi sull’attuazione fisica e finanziaria delle misure. In Report di Chiusura della Programmazione 2007–2013, Feasr 2007–2013; Programma Rete Rurale Nazionale: Rome, Italy, 2016. [Google Scholar]
  37. Lankauskienė, R.; Gedminaitė-Raudonė, Ž.; Micka, R. Business Model Innovation for Sustainable Multifunctional Land Management in Abandoned Rural Areas: A Case Study. Land 2024, 13, 791. [Google Scholar] [CrossRef]
  38. Wu, T.-C.E.; Chen, C.-P.; Hsu, A.Y.; Wall, G. Farm Diversification through Agritourism: Innovation Synergies. Int. Food Agribus. Manag. Rev. 2024, 1, 1–17. [Google Scholar] [CrossRef]
  39. Ingrassia, M.; Altamore, L.; Columba, P.; Raffermati, S.; Lo Grasso, G.; Bacarella, S.; Chironi, S. Mediterranean Diet, Sustainability, and Tourism—A Study of the Market’s Demand and Knowledge. Foods 2023, 12, 2463. [Google Scholar] [CrossRef]
  40. Wang, Y.; Qian, Y. Driving Factors to Agriculture Total Factor Productivity and Its Contribution to Just Energy Transition. Environ. Impact Assess. Rev. 2024, 105, 107369. [Google Scholar] [CrossRef]
  41. Rodríguez Del Valle, A.; Fernández-Vázquez, E. Analyzing Market Power of the Agricultural Industry in Asia. Econ. Anal. Policy 2024, 81, 652–669. [Google Scholar] [CrossRef]
  42. De Chiara, A. Sustainable Business Model Innovation vs. “Made in” for International Performance of Italian Food Companies. Agriculture 2021, 11, 17. [Google Scholar] [CrossRef]
  43. Bellia, C.; Columba, P.; Ingrassia, M. The Brand–Land Identity of Etna Volcano Valley Wines: A Policy Delphi Study. Agriculture 2022, 12, 811. [Google Scholar] [CrossRef]
  44. Agriculture and Rural Development. Available online: https://agriculture.ec.europa.eu/common-agricultural-policy/financing-cap/new-delivery-model_en (accessed on 6 March 2024).
  45. Christiaensen, L.; Rutledge, Z.; Taylor, J.E. The Future of Work in Agriculture: Some Reflections; World Bank Policy Research Working Paper (9193); World Bank: Washington, DC, USA, 2020. [Google Scholar]
  46. Macrì, M.C. (Ed.) Rural Social ACT Rapporto di Progetto. CREA. 2023. Available online: https://www.ruralsocialact.eu/wpcontent/uploads/2023/06/RuralSocialACT_rapporto-di-progetto.pdf (accessed on 10 August 2024).
  47. Godfray, H.C.J.; Aveyard, P.; Garnett, T.; Hall, J.W.; Key, T.J.; Lorimer, J.; Pierrehumbert, R.T.; Scarborough, P.; Springmann, M.; Jebb, S.A. Meat Consumption, Health, and the Environment. Science 2018, 361, eaam5324. [Google Scholar] [CrossRef]
  48. Arnaudova, M.; Brunner, T.A.; Götze, F. Examination of students’ willingness to change behaviour regarding meat consumption. Meat Sci. 2022, 184, 108695. [Google Scholar] [CrossRef] [PubMed]
  49. Hermansen, J.E.; Strudsholm, K.; Horsted, K. Integration of organic animal production into land use with special reference to swine and poultry. Livest. Prod. Sci. 2024, 90, 11–26. [Google Scholar] [CrossRef]
  50. Gargano, G.; Licciardo, F.; Verrascina, M.; Zanetti, B. The Agroecological Approach as a Model for Multifunctional Agriculture and Farming towards the European Green Deal 2030—Some Evidence from the Italian Experience. Sustainability 2021, 13, 2215. [Google Scholar] [CrossRef]
  51. Nowack, W.; Schmid, J.C.; Grethe, H. Social dimensions of multifunctional agriculture in Europe-towards an interdisciplinary framework. Int. J. Agric. Sustain. 2022, 20, 758–773. [Google Scholar] [CrossRef]
  52. Sgroi, F. Cooperation and innovation in Italian agribusiness between theoretical analysis and empirical evidence. J. Agric. Food Res. 2022, 10, 100406. [Google Scholar] [CrossRef]
  53. Fallah Shayan, N.; Mohabbati-Kalejahi, N.; Alavi, S.; Zahed, M.A. Sustainable Development Goals (SDGs) as a Framework for Corporate Social Responsibility (CSR). Sustainability 2022, 14, 1222. [Google Scholar] [CrossRef]
  54. Pawlak, K.; Smutka, L.; Kotyza, P. Agricultural potential of the EU countries: How far are they from the USA? Agriculture 2021, 11, 282. [Google Scholar] [CrossRef]
  55. Yanbykh, R.; Saraikin, V.; Lerman, Z. Changes in Russia’s agrarian structure: What can we learn from agricultural census? Russ. J. Econ. 2020, 6, 26–41. [Google Scholar] [CrossRef]
  56. Avolio, G.; Blasi, E.; Cicatiello, C.; Franco, S. The drivers of innovation diffusion in agriculture: Evidence from Italian census data. J. Chain. Netw. Sci. 2014, 14, 231–246. [Google Scholar] [CrossRef]
  57. Schoolman, E.D. Do direct market farms use fewer agricultural chemicals? Evidence from the US census of agriculture. Renew. Agric. Food Syst. 2019, 34, 415–429. [Google Scholar] [CrossRef]
  58. Ingrassia, M.; Altamore, L.; Bellia, C.; Grasso, G.L.; Silva, P.; Bacarella, S.; Columba, P.; Chironi, S. Visitor’s Motivational Framework and Wine Routes’ Contribution to Sustainable Agriculture and Tourism. Sustainability 2022, 14, 12082. [Google Scholar] [CrossRef]
  59. Davidescu, A.A.; Nae, T.M.; Florescu, M.-S. From Policy to Impact: Advancing Economic Development and Tackling Social Inequities in Central and Eastern Europe. Economies 2024, 12, 28. [Google Scholar] [CrossRef]
  60. D’Amico, M.; Coppola, A.; Chinnici, G.; Di Vita, G.; Pappalardo, G. Agricultural systems in the European Union: An analysis of regional differences. New Medit. 2013, 12, 28–34. [Google Scholar]
  61. Wang, T.; Wu, J.; Liu, J. Regional Differences, Dynamic Evolution, and Convergence of Global Agricultural Energy Efficiency. Agriculture 2024, 14, 1429. [Google Scholar] [CrossRef]
  62. Pandey, B.; Seto, K.C. Urbanization and agricultural land loss in India: Comparing satellite estimates with census data. J. Environ. Manag. 2015, 148, 53–66. [Google Scholar] [CrossRef]
  63. Sharma, R.; Peshin, R.; Khar, S.; Ishar, A.K. Agriculture innovation system approach for sustainable agriculture development: A review. Agro-Economist 2014, 1, 1–7. [Google Scholar]
  64. Grohmann, P.; Feindt, P.H. The importance of calibration in policy mixes: Environmental policy integration in the implementation of the European Union’s Common Agricultural Policy in Germany (2014–2022). Environ. Policy Gov. 2024, 34, 16–30. [Google Scholar] [CrossRef]
  65. Huber, R.; Bartkowski, B.; Brown, C.; El Benni, N.; Feil, J.H.; Grohmann, P.; Joormann, I.; Leonhardt, H.; Mitter, H.; Müller, B. Farm typologies for understanding farm systems and improving agricultural policy. Agric. Syst. 2024, 213, 103800. [Google Scholar]
Figure 1. Percentage variation between the two censuses 2010 and 2020 of farms by range of UAA (Italy, 2010 to 2020). Source: Authors’ elaboration of ISTAT data.
Agriculture 14 01603 g001
Figure 2. Percentage variation between the two censuses from 2010 and 2020 of farms by range of UAA (Sicily, 2010 to 2020). Source: Authors’ elaboration of ISTAT data.
Agriculture 14 01603 g002
Figure 3. Number of Italian farms that made investments for farm innovation (Italy, year 2020). Source: Authors’ elaboration of ISTAT data.
Agriculture 14 01603 g003
Figure 4. Number of Sicilian farms that made investments for farm innovation (Sicily, year 2020). Source: Authors’ elaboration of ISTAT data.
Agriculture 14 01603 g004
Figure 5. Types of activity connected to agriculture for Sicilian farms (Sicily, year 2020). Source: Authors’ elaboration of ISTAT data.
Agriculture 14 01603 g005
Figure 6. Dendrogram—similarities among regions: sector segmentation (Group 1 green color, Group 2 blue color). Source: Authors’ elaboration of SPSS output.
Agriculture 14 01603 g006
Figure 7. Dendrogram—similarities among variables: farms’ and farming profiles (Group 1 green color, Group 2 red color, Group 3 blue color, Group 4 black color). Source: Authors’ elaboration of SPSS output.
Agriculture 14 01603 g007
Table 1. Number of farms, total utilized agricultural area (UAA), average UAA (Italy and Sicily, years 2010, 2020, and 2010 to 2020).
AreaFarms
(Number)
UAA
(Hectares/000)
Average UAA
(Hectares)
201020202010 to 2020 *
(%)
201020202010 to 2020 *
(%)
201020202010 to 2020 *
(%)
Italy1,620,8841,133,023−30.1%12,85612,535−2.5%7.9311.0639.5%
Sicily219,677142,416−35.2%13881342−3.3%6.329.4249.2%
* Percentage variation between the two censuses 2010 and 2020. Source: Authors’ elaboration of ISTAT data.
Table 2. Number of farms for ranges of utilized agricultural area (UAA) and variation from 2010 to 2020 (Italy, years 2010, 2020, and 2010 to 2020).
UAA RangesNumbers of Farms at 2010Numbers of Farms at 2020Variation from 2010 to 2020 (Values)
UAA = 0 *529412,499+7205
Up to 0.99493,326228,481−264,845
1 to 1.99326,032209,662−116,370
2 to 4.99357,668275,701−81,967
5 to 9.99186,145160,133−26,012
10 to 19.99120,115109,545−10,570
20 to 49.9987,60286,285−1317
50 to 99.9929,21432,487+3273
100 and above15,48818,230+2742
Total1,620,8841,133,023−487,861
* These farms carry out activities of the primary sector but do not have agricultural land. Source: Authors’ elaboration of ISTAT data.
Table 3. Number of farms and utilized agricultural area (UAA) by types of crops (with detail of specific produce, e.g., grapevines, olive trees, etc.), (Italy and Sicily, years 2020, and 2010 to 2020).
Type of CropsNumber of FarmsUAA (Hectares)
Italy 20202010 to 2020 *Sicily 20202010 to 2020 *Italy 20202010 to 2020 *Sicily 20202010 to 2020 *
(%)(%)(%)(%)
Arable crops721,618−12.9%91,301−7.9%7,199,4142.7%687,6151.0%
Tree crops800,596−32.8%115,453−35.4%2,185,156−8.2%327,953−14.7%
Grapevines255,520−34.3%30,467−25.0%635,952−4.3%89,625−21.6%
Olive trees619,378−31.3%96,176−31.4%994,320−11.5%125,890−11.2%
Citrus49,087−38.3%21,423−42.1%112,040−13.1%61,067−14.2%
Fruit plants281,53219.2%32,044−11.1%392,489−7.5%47,738−12.1%
Tropical plants (kiwi and other tropical plants)12,323−13.8%213- **31,64710.7%2968- **
* Percentage variation between the two censuses 2010 and 2020. ** 2010 data not available. Source: Authors’ elaboration of ISTAT data.
Table 4. Number of livestock farms by animal species and number of animals by animal species (Italy and Sicily, years 2020, and 2010 to 2020).
Number of FarmsNumber of Animals
Animal
Species
Italy 20202010 to 2020 *
(%)
Sicily 20202010 to 2020 *
(%)
Italy 20202010 to 2020 *
(%)
Sicily 20202010 to 2020 *
(%)
Cattle95,020−23.5%8540−6.7%5,693,4511.8%341,4981.6%
including dairy cattle34,794-**1724-**1,636,6232.3%49,8995.1%
Buffaloes1906−21.7%19−9.5%415,50215.3%211692.4%
Goats30,72435.0%246819.1%953,11710.6%99,759−15.0%
Sheep56,45610.5%638113.3%6,994,8973.1%817,45211.6%
Pigs38,14945.6%111951.0%8,727,449−6.5%60,37330.4%
Poultry57,035138.1%1543162.0%173,380,5443.5%4,102,355−9.9%
* Percentage variation between the two censuses 2010 to 2020. ** 2010 data not available. Source: Authors’ elaboration of ISTAT data.
Table 5. Number of farms for ranges of utilized agricultural area (UAA) and variation from 2010 to 2020. (Sicily, years 2010, 2020, and 2010 to 2020).
UAA RangesNumber of Farms at 2010Number of Farms at 2020Variation from 2010 to 2020 (Values)
UAA = 0 *628724+96
Up to 0.9971,63027,626−44,004
1 to 1.9944,90125,787−19,114
2 to 4.9949,60137,698−11,903
5 to 9.9923,52620,934−2592
10 to 19.9914,56913,801−768
20 to 49.9910,27510,725+450
50 to 99.9931583542+384
100 and above13891579+190
Total219,677142,416−77,261
* These farms carry out activities of the primary sector but do not have agricultural land. Source: Authors’ elaboration of ISTAT data.
Table 6. Percentage of farms for range of age of the farm’s head, excluding collective properties (Italy and Sicily, year 2020).
Farms (%)
AreaUp to 29 Years Old30 to 44 Years Old45 to 59 Years OldFrom 60 Onwards
Italy2.2%11.2%29.0%57.5%
Sicily2.2%11.7%28.1%58.0%
Source: Authors’ elaboration of ISTAT data.
Table 7. Number of farms by education level of the farm head (Italy and Sicily, years 2020, and 2010 to 2020).
Farms by Head’s Education Level
Head’s Education LevelItalySicily
20202010 to 2020 *
(%)
20202010 to 2020 *
(%)
No qualification26,238−67.4%4751−68.8%
Primary School247,784−55.7%30,718−56.8%
Junior high school391,268−24.6%48,229−28.4%
Professionalizing diplomas (2–3 years)76,4225.2%55514.1%
Agricultural high school59,05649.0%671357.6%
Non-agricultural high school220,159−11.6%29,491−20.5%
Agricultural bachelor’s/master’s degree17,68035.1%262211.9%
Non-agricultural bachelor’s/master’s degree91,9214.6%14,255−16.5%
Total1,130,528 142,330
* Percentage variation between the two censuses 2010 to 2020. Source: Authors’ elaboration of ISTAT data.
Table 8. Number of family and non-family workforces (Italy and Sicily, year 2020).
AreaNumber of Family Workers
Farm Entrepreneur/Head *Other Family Members **Total Family Workforce
Italy1,114,131345,4571,459,588
Sicily139,99726,714166,711
AreaNumber of Non-Family Workers
EU WorkersNon-EU Foreign WorkersTotal Non-Family Workforce
Italy174,642251,6851,295,753
Sicily13,76024,320161,762
Source: Authors’ elaboration of ISTAT data. * Only the entrepreneur. ** All family members of the entrepreneur including relatives to various degrees of relationship.
Table 9. Number of farms and UAA for legal form (Italy and Sicily, 2020).
AreaNumber of Farms
Entrepreneur/Sole Proprietor or Family FarmPartnershipsIncorporated CompaniesCo-Operative SocietyCollective PropertiesOther Legal FormTotal
Italy1,059,20454,92711,0113160249522261,133,023
Sicily136,6983299124284486247142,416
UAA (Hectares)
Entrepreneur/Sole Proprietor or Family FarmPartnershipsIncorporated CompaniesCo-Operative societyCollective PropertiesOther Legal FormTotal
Italy9,110,6022,282,879457,037119,315482,31683,20812,535,357
Sicily1,159,933111,85431,19819,21812,11578071,342,125
Source: Authors’ elaboration of ISTAT data.
Table 10. Number of farms and UAA by land’s title of ownership (Italy and Sicily, year 2020 and 2010 to 2020).
Title to Land
Ownership
Number of FarmsUAA (Hectares)
ItalySicilyItalySicily
20202010 to 2020 *
(%)
20202010 to 2020 *
(%)
20202010 to 2020 *
(%)
20202010 to 2020 *
(%)
Ownership658,827−44.5%94,056−46.5%4,177,110−29.9%522,626−29.2%
Farmland rental118,04253.8%12,10223.8%2,336,67656.9%214,30522.9%
Free commodate68,93413.2%87974.8%484,591−6.6%81,42131.5%
Ownership plus farmland rental137,770−12.9%12,68018.5%3,432,0461.5%301,92920.5%
Ownership plus free commodate94,9874.7%11,000−11.6%745,82619.7%121,12410.4%
Farmland rental plus free commodate13,808110.7%99794.3%459,161188.2%28,969156.7%
Ownership plus farmland rental, plus free commodate28,156−26.6%206011.9%899,95124.0%71,75272.0%
* Percentage variation between the two censuses 2010 to 2020. Source: Authors’ elaboration of ISTAT data.
Table 11. Number of digitalized and innovative farms for annual work units (AWU) ranges (Italy and Sicily, year 2020).
Farms by Range of AWU
Total Farms
0 < AWU <= 11 < AWU <= 10AWU > 10Total Farms
Italy912,938214,11734731,133,023
Sicily123,56318,409358142,416
Digitalized Farms
0 < AWU <= 11 < AWU <= 10AWU > 10Total Farms
Italy80,52795,7412714178,982
Sicily5762470123910,702
Innovative Farms
0 < AWU <= 11 < AWU <= 10AWU > 10Total Farms
Italy55,99566,8952014124,904
Sicily479231741488114
Source: Authors’ elaboration of ISTAT data.
Table 12. Number of digitalized farms for branches of activities (Italy and Sicily, year 2020).
AreaBranches of Activities of Digitalized Farms
AccountingCrop ManagementLivestock ManagementManagement of Related ActivitiesOtherTotal Digitalized Farms
Italy130,43950,46531,14828,62126,297178,982
Sicily7978358712681434113810,702
Source: Authors’ elaboration of ISTAT data.
Table 13. Descriptive statistics of some selected variables for all the 20 Italian regions *.
VariablesSub-VariablesNMean Value of Number of FarmsSD
1Innovative_farmsInnovative_farms215947.813824.05
2Range of age of the entrepreneurAge_below_40214994.573617.87
Age_above_402148,840.1042,196.34
3Education level of the entrepreneurBachelor’s or master’s degree215219.104550.26
High_school2116,935.1012,500.04
Middle_school2131,680.4828,897.72
4Farm’s size (UAA)Up_to_20_hectars2112,841.819045.21
Up_to_50_hectars214108.813157.55
Up_to_100_hectars211547.001350.89
* N = 21—the 19 Italian regions plus the autonomous provinces of Trento and Bolzano (Trentino Alto Adige) were considered. Source: Authors’ elaboration of SPSS output.
Table 14. Correlations among sub-variables *.
Sub-VariablesNPearson’s
Coefficient *
Innovative_farms; Age_below_40210.505
Innovative_farms; Age_above_40210.466
Innovative_farms; Bachelor’s/master’s degree210.445
Innovative_farms; High_school 210.548
Innovative_farms; Middle_school 210.437
Innovative_farms; Up_to_20_hectars 210.618
Innovative_farms; Up_to_50_hectars 210.640
Innovative_farms; Up_to_100_hectars 210.579
* Correlations were calculated by using Pearson’s correlation coefficient. No need to calculate the statistical significance test because data used are the Statistical Population. Source: Authors’ elaboration of SPSS output.
Table 15. Variables used for the cluster analysis and variable group.
VariableVariable Group
1Up_to_5_hectaresUAA Farm size
2Up_to_20_hectares
3Up_to_50_hectares
4Up_to_100_hectares
5More_than_100_hectares
6Age_below_40Age of entrepreneur
7Age_above_40
8Middle_schoolEducation level
9High_school
10Degree
11Digitized_farmsDigitized/innovative farms
12Innovative_farms
13Cereals_productionType of activity
14Hortofloriculture
15Greenhouses_production
16Grapevines_production
17Olive_production
18Citrus_production
19Pome_fruit_production
20Stone_fruit_production
21Tropical_fruit_production
22Dried_fruit_production
23Woody_greenhouse
24Cattles
25Buffalo_and_dairy_cattle
26Sheep_and_goats_breeding
27Pig_breeding
28Equine_breeding
29Poultry_breeding
30ESU_smallESU Units of economic size
31ESU_medium
32ESU_big
Source: Authors’ elaboration.
Table 16. Agglomeration Program a,b. Regions’ clustering.
StageCluster UnificationAgglomeration CoefficientsCluster Formation StageSubsequent Stage
Cluster 1Cluster 2Cluster 1Cluster 2
1121810,600.860004
25711,154.199003
35813,189.145205
4111213,629.7660110
551515,372.593306
64517,607.608059
7101417,806.1850012
81919,926.8300011
92419,954.5430613
10112123,170.0254013
111323,794.4308014
12101325,693.9477014
1321131,807.46291015
1411039,145.768111216
152644,676.04613017
1611646,588.50514017
171255,016.732161518
1811961,726.60517019
1912073,714.85318020
2011791,734.7171900
Source: Authors’ elaboration of SPSS output. a Average-linkage (within groups) grouping method. b Distance measurement: Euclidean distance.
Table 17. Agglomeration Program a,b. Variables’ clustering.
StageCluster UnificationAgglomeration
Coefficients
Cluster Formation StageSubsequent Stage
Cluster 1Cluster 2 Cluster 1Cluster 2
15283014.455002
2453911.725014
321234121.064005
44154430.053205
54215352.980436
64256208.942507
74277014.317609
86107720.9910011
94297966.1827010
104198888.2369012
113610,251.3320815
1241410,590.77010013
1342411,898.15112014
1442612,950.60113016
1532213,150.42811020
1642014,435.29914019
17111215,470.2740022
1821615,558.1440024
1941815,854.87816020
203417,659.627151921
2133119,782.67720023
22113220,572.05817023
2331123,133.821212226
2421323,577.83918025
252927,506.57824026
262334,049.067252328
271835,938.1350031
2823044,414.71026029
2921755,164.19028030
302768,509.48329031
311280,860.99027300
Source: Authors’ elaboration of SPSS output. a Average-linkage (within groups) grouping method. b Distance measurement: Euclidean distance.
Disclaimer/Publisher’s Note: The statements, opinions and data contained in all publications are solely those of the individual author(s) and contributor(s) and not of MDPI and/or the editor(s). MDPI and/or the editor(s) disclaim responsibility for any injury to people or property resulting from any ideas, methods, instructions or products referred to in the content.

