Article

Assessment of Physiological Traits of Fragaria vesca Genotypes Under Water Deficit Conditions

Department of Bioengineering, Faculty of Environmental Management and Agriculture, West Pomeranian University of Technology in Szczecin, Słowackiego 17, 71-434 Szczecin, Poland
*
Author to whom correspondence should be addressed.
Agriculture 2025, 15(1), 70; https://doi.org/10.3390/agriculture15010070
Submission received: 14 November 2024 / Revised: 23 December 2024 / Accepted: 27 December 2024 / Published: 30 December 2024

Abstract

:
Drought is one of the key challenges of climate change. The basic global problem related to the increasing water deficit is that the vast majority of crops are species and varieties that are the result of breeding work that did not anticipate such a rapid decrease in water availability in the soil. The main objective of the conducted research was to compare the physiological and biochemical response to water deficit of plants of the species Fragaria vesca—two cultivated varieties, and one collected from the natural environment. A two-year pot experiment was conducted in a polyethylene tunnel. The substrate moisture level was monitored using tensiometer readings. Measurements of gas exchange parameters, chlorophyll “a” fluorescence, content of photosynthetic pigments in leaves, index of relative water content in leaves, total fruit yield, single fruit mass and content of K, Ca, Mg, Na, Cu, Zn, Mn, Mo and the ratio of mono- to divalent cations in leaves, roots and plant crowns were taken three times each year during the experiments. Based on one-way and two-way analysis of variance, statistically significant differences were observed between wild-growing plants and cultivated varieties under control conditions, particularly in terms of chlorophyll fluorescence values and the content of photosynthetic pigments. A significant main effect of the soil moisture level was identified for most measured parameters across the majority of assessment time points. However, a significant interaction effect between soil moisture level and genotype was less frequently observed. Significant changes in response to water deficit varied depending on the parameter and genotype, ranging from 2.5% to 106.1%. For the content of chemical elements, the changes reached up to 157.1%. The results suggest that plants obtained from natural environments exhibit better adaptation to water deficit conditions, making them suitable for use in breeding programs aimed at developing varieties resistant to soil water deficits. However, the study’s limitations, particularly the absence of molecular analyses regarding the plants’ adaptive mechanisms, should be taken into consideration.

1. Introduction

Phenomena of drought and desertification, exacerbated by climate change, adversely impact global food security and human health and may even pose a threat to global peace [1,2,3]. Climate models project that drought severity could double across 30% of the global land area under rigorous mitigation scenarios, leading to substantial implications for water supply and demand deficits [4]. Water deficit stress poses a significant challenge to agriculture, making plant resilience to water scarcity of critical economic importance [5]. In Poland’s climate, periodic meteorological droughts [6] disrupt the water balance of affected areas, leading to soil droughts that impair crop productivity [7]. In temperate climates, drought is among the primary factors limiting crop yields [4,8]. A fundamental global challenge associated with the increasing water deficit is that the majority of cultivated crops, including those of the Fragaria genus, consist of species and varieties developed through selective breeding, often without adequate consideration for the current significant reductions in soil water availability [9].
The economically most significant species of the Fragaria genus is the cultivated strawberry (Fragaria × ananassa Duch.), whose fruits are among the most widely consumed globally [10,11]. In Poland, plants of the Fragaria genus also hold considerable economic importance [8,12]. In 2020, the share of Fragaria plants in the total fruit yield from fruit bushes and berry plantations reached 26.0% [13]. The wild strawberry (Fragaria vesca L.) is primarily cultivated on an amateur scale. Although F. vesca is not commercially grown, its valuable traits as a research model have been extensively highlighted, particularly due to its short generation time, well-defined cycles of seasonal flowering and vegetative growth, and single-gene traits controlling aspects such as flowering and fruit color [14].
Plants of the Fragaria genus are highly sensitive to water deficiency due to their large leaf surface area, high water content in fruits, and shallow root systems. This sensitivity has been highlighted in numerous studies, which report a decline in physiological parameters in plants exposed to water deficit conditions [3,15,16,17,18,19,20,21]. However, this trait is undesirable in commercial cultivation, as even minor deviations from optimal irrigation levels can result in reduced yields, diminished fruit quality, decreased profitability of crops, and failure to meet consumer and market demands. Consequently, a key objective for breeders is to develop varieties with enhanced tolerance to water deficits in the soil.
An essential preliminary step in breeding programs aimed at enhancing plant resistance to water deficit through improved water-use efficiency is to assess the degree of adaptation of various genotypes (cultivars) to limited water availability. For example, the development of drought-resistant wheat and cotton varieties has shown promise in maintaining agricultural productivity despite environmental stress [22,23]. Differences in physiological, morphological, and morphogenetic traits at the cultivar level have been documented in numerous studies [3,11,24,25,26,27]. Wild plant varieties possess genetic resources that enhance their resilience to abiotic stresses, as demonstrated in studies on species such as potato [28] and barley [29]. However, there is a lack of studies evaluating the differences in physiological traits and responses to soil water deficit between cultivated and wild Fragaria species.
Therefore, the aim of this study was to compare the physiological responses of Fragaria vesca plants—two cultivars (‘Rugia’ and ‘Baron von Solemacher’) and a wild strawberry specimen obtained from a natural habitat, to identify the genotypes with greater resistance. This will enable the determination of whether wild-growing plants exhibit lower sensitivity to drought stress, and consequently, whether their use in breeding programs aimed at developing water deficit-resistant varieties is justified. This objective was achieved by testing the following hypotheses: (1) there are physiological differences between cultivated varieties and wild-growing plants, (2) water deficit negatively affects the physiological traits of Fragaria vesca plants, and (3) wild-growing plants exhibit lower sensitivity to water deficit in the substrate compared to cultivated varieties.

2. Materials and Methods

2.1. Materials

The plants used in this study included Fragaria vesca cultivars ‘Rugia’ and ‘Baron von Solemacher’ (seedlings obtained from TOP-PLANT, Szczecin, Poland) as well as wild strawberry seedlings collected from a natural habitat in a forested area near the village of Ciemnik, close to Ińsko, Poland (53°23′ N, 15°34′ E; 105 m a.s.l.). The cultivated varieties used in the study are popular in Poland. Both varieties are high-yielding and produce fruit from June to September. However, ‘Baron von Solemacher’ exhibits lower frost resistance and greater susceptibility to diseases compared to ‘Rugia’ [30]. These characteristics made them suitable candidates for experimental analysis.

2.2. Methods

A two-year pot experiment was conducted during the period of 2018–2019, employing a completely randomized design with 15 replications (one plant per replication). The study was carried out in the vegetation hall of the Faculty of Environmental Management and Agriculture at the West Pomeranian University of Technology in Szczecin, Poland (53°25′ N, 14°32′ E; 25 m a.s.l.). Plastic containers with a capacity of 10 dm3 were used, filled with a substrate consisting of a 1:1 mixture (by volume) of sandy silty clay soil, collected from the arable humus horizon (0–30 cm) at the Agricultural Experimental Station of the West Pomeranian University of Technology in Szczecin, located in Lipnik (Poland), and sand. The physicochemical properties of the soil used in the experiment are presented in Table 1. To allow for acclimatization to the new conditions, the plants were planted one year prior to the start of measurements (in June) of 3 plants per pot. The seedlings had three fully developed leaves.
Water potential was maintained at −10 kPa to −15 kPa under control conditions (Ctrl) and −30 kPa to −35 kPa under water deficit conditions (Def) in the substrate. Each pot was watered using individual drippers when the water potential in the substrate increased above −15 kPa under control conditions or above −35 kPa under water deficit conditions. Irrigation was carried out to a value of −10 kPa in the control variant and to −30 kPa under water deficit conditions. The adopted water potential range of −30 to −35 kPa was considered as stress conditions for the studied species, based on the findings of various authors [3]. The need for irrigation was determined based on readings from contact soil tensiometers placed at a depth of 20 cm in the pots of each experimental variant. Tensiometric measurements have been successfully employed in other studies investigating water deficit in plants [31,32,33,34,35].
During the vegetation period (from May to October), the pots were placed in the covered section of the vegetation hall. In the remaining months, they were kept in an unheated greenhouse, with a temperature maintained above 0 °C.
Fertilization was carried out twice during the growing season: prior to planting the plants, during pot filling, and after the plants had finished fruiting. In the second year of the study, fertilization took place in early spring, before the start of vegetation, and after the completion of fruiting. A multi-component fertilizer specifically designed for strawberries was used, which, according to the manufacturer (Agrecol Sp. z o.o., Mesznary 2, Poland), contains the following: 15.0% N (6.5% nitrate N, 8.5% ammonium N), 6.0% P2O5 (soluble in neutral ammonium citrate and in water, including 5.2% water-soluble P2O5), 11.0% water-soluble K2O, 0.04% total B, 0.1% total Cu, 0.2% total Fe, 0.17% total Mn, 0.01% total Mo, and 0.035% total Zn. The fertilizer was applied at a rate of 4 g per pot each time.
Morphological observations of the plants were conducted systematically throughout the growing season, and emerging stolons were removed. Additionally, plants were regularly inspected for the presence of pests. When pest populations exceeded the economic threshold, chemical treatments were applied as follows:
  • Decis Mega 50 EW, targeting aphids (Aphidoidea) at a dosage of 0.25 L/ha.
  • Mospilan 20 SP, targeting thrips (Thysanoptera, aphids (Aphidoidea), and greenhouse whitefly (Trialeurodes vaporariorum) at a concentration of 4 g per 10 L of water, applied at 3 L per 100 m2.

2.3. Measurements

In each year of the study, three times during the plant growing season, in the second ten days of July, August, and September, the following measurements and analyses were conducted:
  • the content of photosynthetic pigments was assessed by the method of Arnon et al. [36] modified by Lichtenthaler and Wellburn [37] for chlorophyll “a”, “b” and total chlorophyll, and the method of Hager and Mayer-Berthenrath [38] for carotenoids;
  • the relative leaf water content index (RWC) by the method of Yamasaki and Dillenburg [39];
  • the gas exchange parameters, i.e., assimilation intensity CO2 net (Pn), transpiration intensity (E), stomatal conductivity H2O (gs) and substomatal CO2 concentration (ci), were measured using a TPS-2 portable gas analyzer with a PLC-4 (PP Systems, Amesbury, MA, USA); the photosynthetic water utilization factor (WUE) was determined on the basis of the Pn/E quotient;
  • the fluorescence parameters of chlorophyll “a” were determined using a Handy PEA spectrofluorometer (Hansatech Ltd., Kings Lynn, UK), based on the standard procedure of the apparatus (3 × 650 nm LED, maximum actinic light intensity 3000 μmol m−2 s−1). The measurement was carried out in each variant on 15 randomly selected, fully grown bean leaves (the repetition was the measurement on one leaf), in a place previously darkened for 20 min, using factory-made clips (the irradiation area was 4 mm). The following parameters were measured: initial (zero) fluorescence, index of excitation energy loss in power antennas (F0), maximum fluorescence, after reduction of acceptors in PS II and after darkroom adaptation (FM), variable fluorescence, determined after dark adaptation (the parameter depends on maximum quantum efficiency of PS II) (FV = FM − F0), maximum potential efficiency of the photochemical reaction in PS II, determined after dark adaptation, after reduction of acceptors in PS II (FV/FM), chlorophyll fluorescence growth time from the beginning of the measurement to reaching maximum (TFM), and the area above the fluorescence induction curve of chlorophyll “a” between points F0 and FM proportional to the size of the pool of reduced plastoquinone electron acceptors in PSII (AM (Area)).
In each growing season, the total yield of fresh strawberry fruit was determined by weight, expressed in grams per pot, as well as the weight of a single fruit. Due to the fact that wild strawberries produce fruit throughout almost the entire growing season, harvesting was carried out successively as the fruit reached collective maturity, spanning the period from June to August each year of experiment.
After each experiment, the fresh and dry mass of the root system was determined. The content of K, Ca, Mg, Na, Cu, Zn, Mn, and Mo, as well as the ratio of monovalent to divalent elements in the leaves, roots, and plant crowns, was also measured. The content of calcium, magnesium, sodium, and microelements in plant tissues was determined by atomic absorption spectrometry (AAS) using an iCE 3000 series spectrophotometer (ThermoScientific, Waltham, MA, USA) in wet mineralized material, prepared with a mixture of nitric acid (HNO3) and hydrochloric acid (HCl) in a 1:1 ratio. Phosphorus content was determined colorimetrically using a Marcel Mini spectrophotometer. Based on the obtained results, the equivalent ratio of monovalent to divalent elements, i.e., K: (Ca + Mg), was additionally calculated.

2.4. Meteorological Data

Szczecin is located in a sub-Atlantic climate zone, where the primary influencing factors include latitude, topography, distance from the sea, and the presence of large industrial and production facilities. These factors result in relatively high annual average air temperatures and a low annual temperature amplitude. Additionally, Szczecin typically experiences mild winters and cool summers.
The key meteorological elements relevant to the conducted research, along with comparisons to multi-year averages, are presented in Table 2. The data used in this study were sourced from the nearest meteorological station, IMGW Szczecin-Dąbie (Przestrzenna 10 Street).
In the first year of the study (2017), the average air temperature during the growing season was 0.2 °C lower than the multi-year average. The coldest month in the analyzed period was April (7.4 °C), while the warmest was August (18.2 °C). Sunshine duration during the growing season in 2017 was 21.9% below the multi-year average. No month recorded sunshine levels above the average values.
In the second year of the study (2018), the average air temperature during the growing season was 1.8 °C higher than the multi-year average. The lowest average temperature was observed in October (10.3 °C), while the highest was recorded in July and August (20.0 °C). Sunshine duration during the growing season was 27.0% above the multi-year average, with all months exceeding average values.
The third year of the study (2019) was characterized by an average air temperature during the growing season that was 1.0 °C higher than the multi-year average. The coldest month was April (10.1 °C), and the warmest was June (21.5 °C). Sunshine duration during the analyzed period was 2.6% above the multi-year average. April, June, August, and September recorded higher sunshine values compared to the same months in the multi-year period, while the remaining months had sunshine levels below the long-term average.

2.5. Statistical Analysis
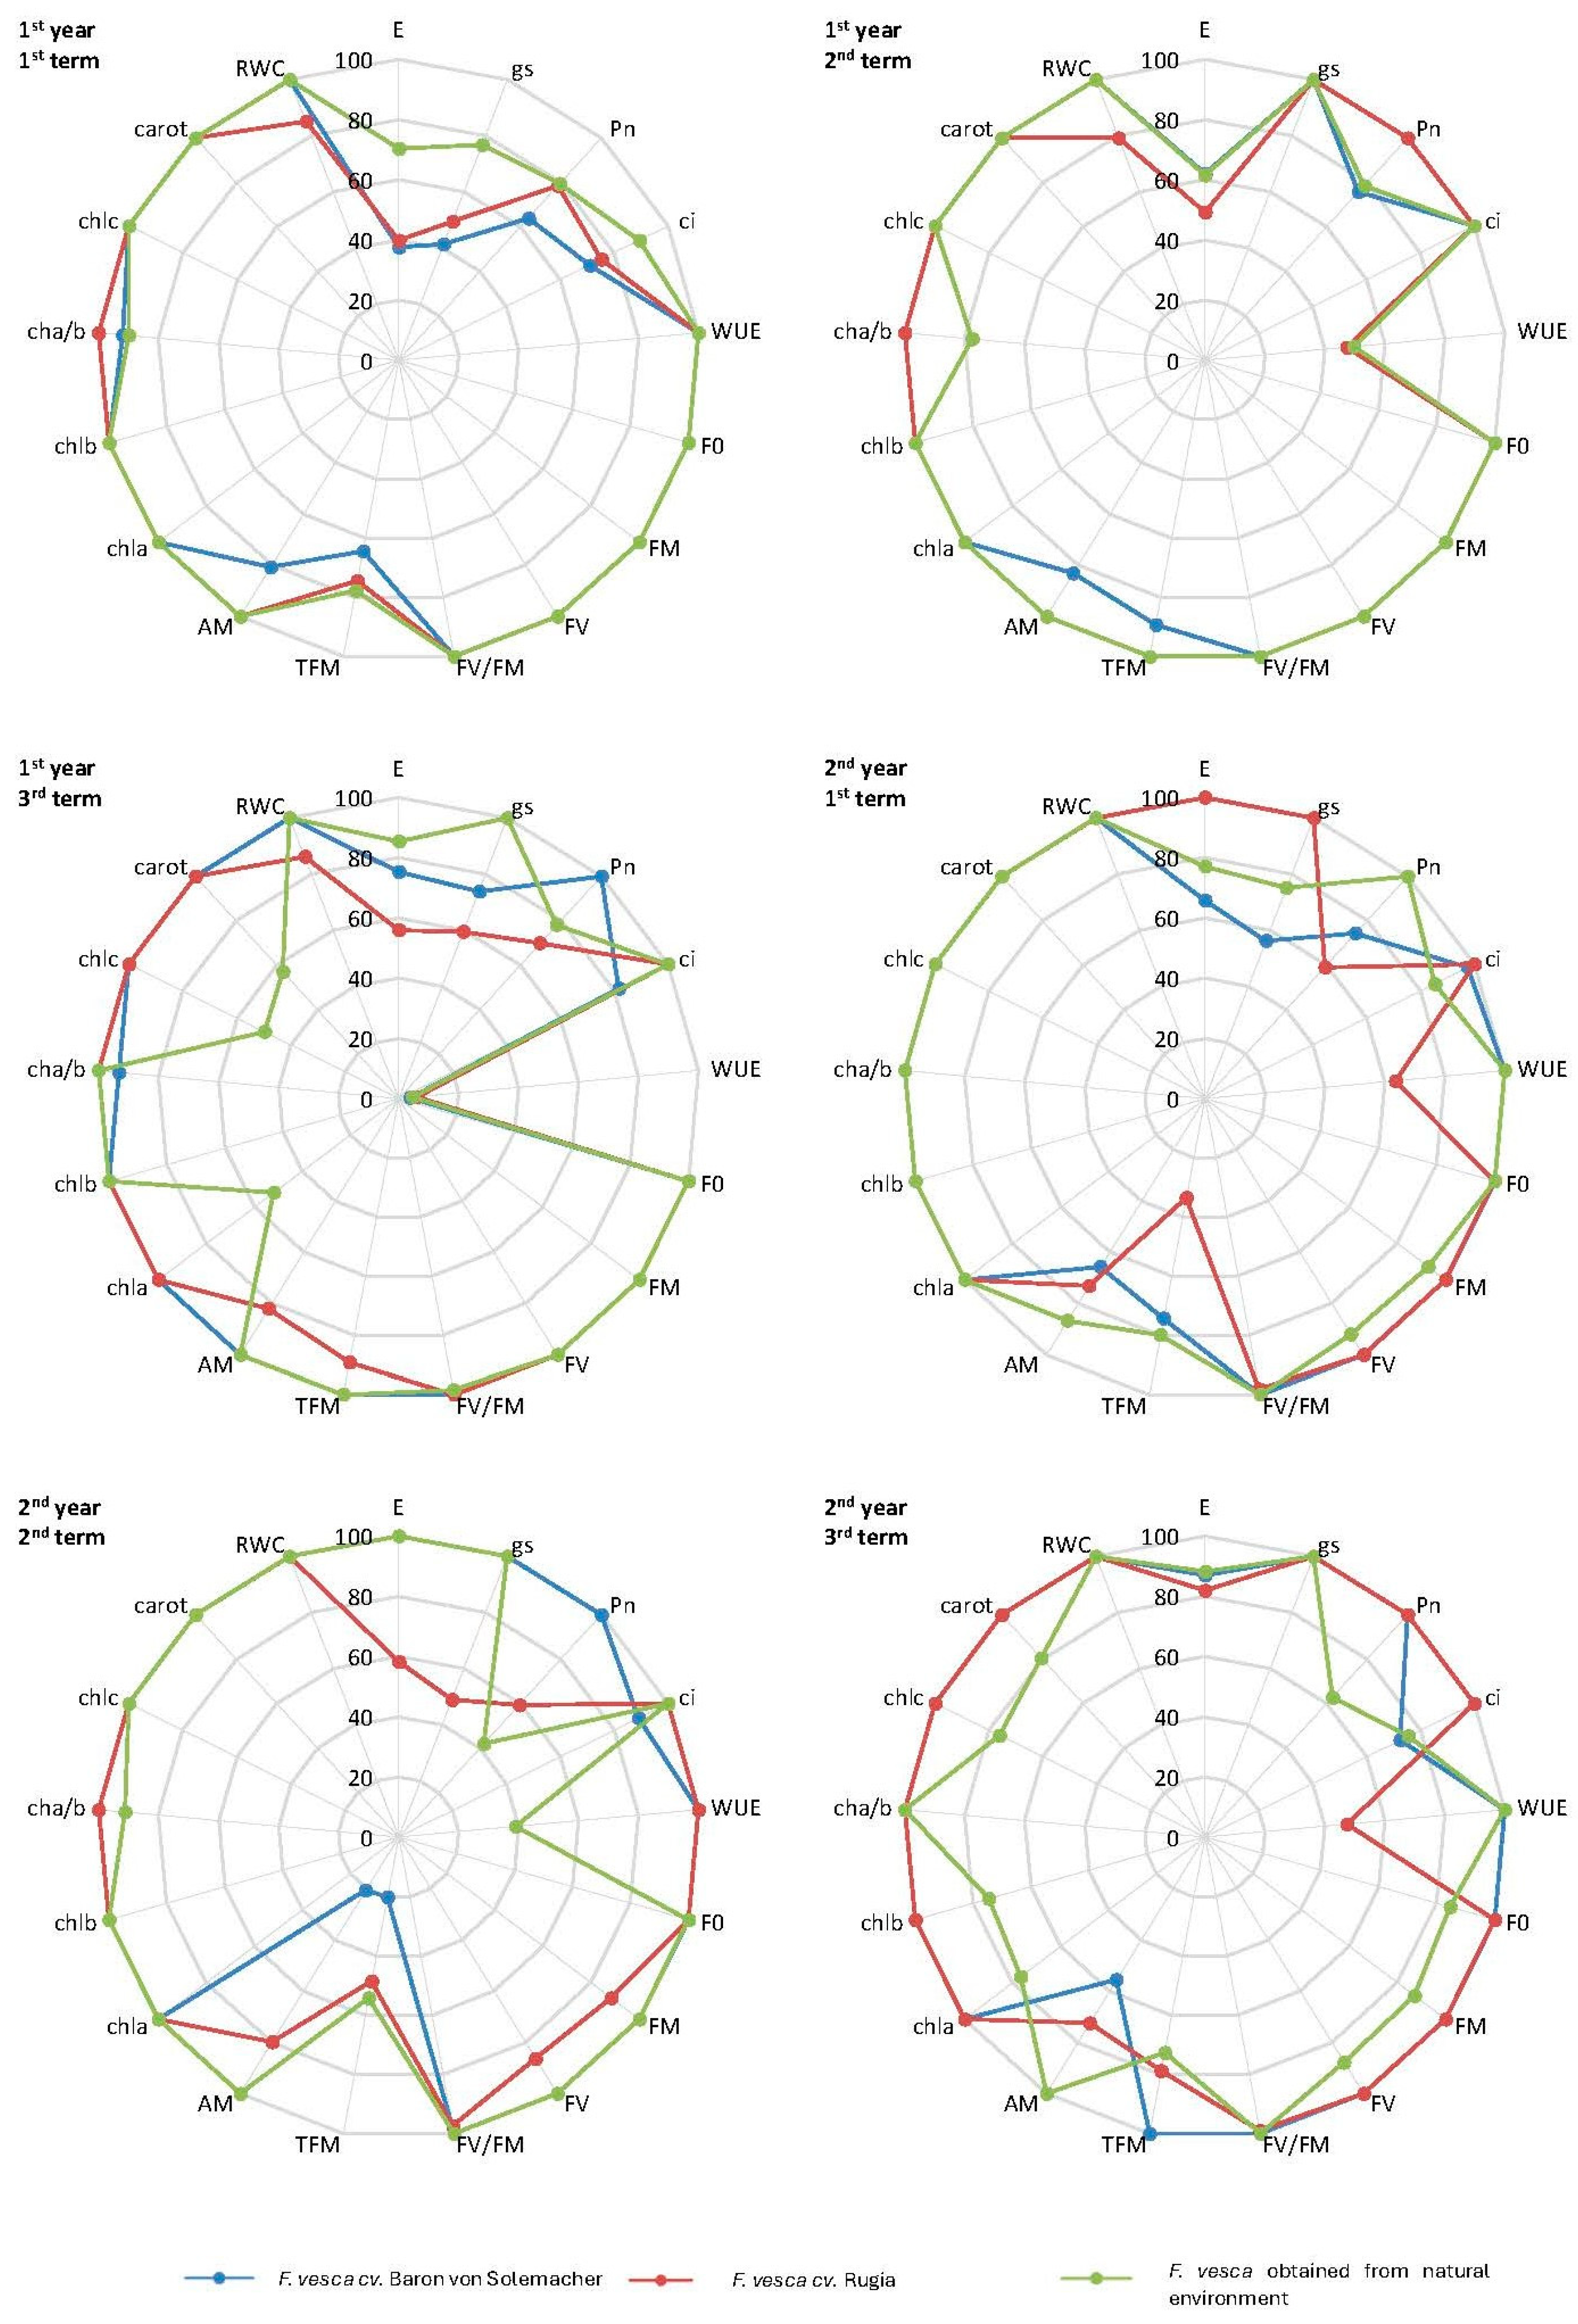
The results of the study were statistically analyzed in STATISTICA version 13.3 (StatSoft, Poland). A one-way analysis of variance (ANOVA) was employed to compare genotypes grown under control conditions, while a two-way ANOVA was used to evaluate genotype × substrate moisture interactions in a completely randomized design. The significance of differences between means was determined using Duncan’s multiple range test at a significance level of α = 0.05. Identical single-letter labels were assigned to means that did not differ statistically. The analyses were conducted separately for each measurement period.
In the case of two-factor analysis of variance, means denoted by the same lowercase letter did not differ significantly within the context of a significant interaction effect. Similarly, means denoted by the same uppercase letter showed no significant differences with respect to the significant main effect (substrate moisture level; SML). The main effect of genotype (G) was not analyzed in the two-factor analysis due to the assumption that responses to water stress vary among genotypes and may follow different directions of change. Comparisons of genotype values were performed using one-way analysis of variance exclusively under control conditions.

2.6. Radar Charts

The radar charts present the values of selected analyzed parameters. The differences between the values for plants grown under control and water-deficient soil moisture conditions were used to calculate the parameter values shown in the charts.
For the S parameters—i.e., those for which a smaller decrease under water deficit conditions, compared to controlmoisture conditions, indicated better adaptation to stress (E, gs, Pn, ci, WUE, F0, FM, FV, FV/FM, chla, chlb, chl total, carot, RWC, fruit fresh mass yield, single fruit mass)—the following formula was used:
S = S D e f × 100 S C t r l
where:
  • SDef—parameter value in conditions of deficit soil moisture;
  • SCtrl—parameter value in conditions of control soil moisture.
For the D parameters—i.e., those for which a smaller increase under water deficit conditions, compared to control moisture conditions, indicated better adaptation to stress (TFM, AM)—the following formula was used:
D = 100 (   D D e f × 100 D C t r l 100 )
where:
  • DDef—parameter value in conditions of deficit soil moisture;
  • DCtrl—parameter value in conditions of control soil moisture.
The charts were constructed based on a series of analyses testing the significance of differences between means for individual object types, using one-way analysis of variance (ANOVA). For means that did not differ significantly from each other, as well as for values showing trends divergent from the general patterns—i.e., for S parameters, where values under deficit conditions were significantly higher than those under control conditions, and for D parameters, where values under deficit conditions were significantly lower than under control conditions—a value of 100 was assigned on the radar graphs.
Comparisons of the studied objects were made by calculating the area of the polygon formed by the chart line.

3. Results

3.1. Evaluation of Differences in Physiological Traits, Chemical Composition, and Yield Among Genotypes

3.1.1. Gas Exchange Parameters

The results showed that, for each measurement term, the highest values of transpiration intensity (E) under control substrate moisture conditions were characteristic of different varieties (Table 3). On the first measurement date of each study year, the ‘Rugia’ variety exhibited a significantly lower E value compared to the ‘Baron von Solemacher’ variety (by an average of 13.6%) and plants obtained from the natural environment (by an average of 13.0%). For the remaining dates, except for the third measurement date of the second study year, the ‘Rugia’ variety most frequently exhibited the highest E value (by an average of 35.3%). On the final measurement date of the experiment, this variety again had the lowest E value among the tested genotypes (by 8.4% lower than ‘Baron von Solemacher’ and by 42.1% lower than wild plants).
Similar differences were observed for the stomatal conductance of H2O (gs). In the first term of the first year of the study, no significant differences were found between the genotypes. The ‘Rugia’ cultivar exhibited the lowest gs value in the second term of the first year (by an average of 25.3%), the first term of the second year (by an average of 22.5%), and, together with the ‘Baron von Solemacher’ cultivar, in the third term of the second year (by an average of 53.3%). However, in the second term of the second year, the highest gs value was observed for the ‘Rugia’ cultivar among the analyzed genotypes (by an average of 23.6%).
A significant differentiation between the analyzed genotypes, depending on the measurement date, was also observed for net CO2 assimilation intensity (Pn). On the first measurement date of each year, no differences in Pn values were found among the genotypes. Plants collected from the natural environment exhibited the highest Pn value on the second measurement date of the first year (by an average of 38.8%), and, along with the ‘Rugia’ cultivar, on the second and third measurement dates of the second year (by an average of 53.1%).
Similar to other gas exchange parameters, the substomatal CO2 concentration (ci) also varied across the individual measurement dates. Across all dates, the ‘Baron von Solemacher’ cultivar most frequently exhibited the highest ci value among the tested genotypes, particularly in the second term of the second year of the study, where the value was 18.6% higher than that of ‘Rugia’ and 31.3% higher than that of wild plants.
No differences were observed between the studied genotypes in terms of the photosynthetic water use efficiency (WUE) in the first and third terms of the first year, and in the first term of the second year of the study. In the remaining terms, the highest WUE values were observed in plants collected from the natural habitat (by an average of 53.2%).

3.1.2. Chlorophyll “a” Fluorescence Parameters

In most of the measurement terms, no differences were observed in the initial (zero) fluorescence value (F0) between the tested genotypes (Table 4). The exception occurred on the second measurement term of the second year, when the lowest F0 value was observed in plants collected from the natural environment (by an average of 14.0%).
For maximum fluorescence (FM), no differences were observed between the tested genotypes during the first term of the first year and the third term of the second year of the study. For the remaining measurements, the highest FM values were most frequently observed in plants collected from the natural environment (e.g., in the second term of the first year, where the value was 9.3% higher than that of ‘Baron von Solemacher’ and the first term of the second year—6.5%); however, these results were not consistent.
Similar to FM, no differences in variable fluorescence (FV) were observed between the tested genotypes in the first term of the first year and the third term of the second year of the study. In the remaining terms, the ‘Baron von Solemacher’ cultivar was most frequently characterized by the lowest FV value, in comparison with the ‘Rugia’ cultivar and plants collected from the natural environment, particularly in the first term of the second year of the study, where the value was 8.4% lower than that of ‘Rugia’ and 8.1% lower than that of wild plants.
No differences were found between the compared genotypes in terms of the ratio of variable to maximum fluorescence (FV/FM) during the first term of both the first and the second years of the study. Although the results in the other terms were not consistent, it can be concluded that the ‘Baron von Solemacher’ cultivar most frequently exhibited the lowest FV/FM values (e.g., in the second term of the first year the value was 3.2% lower than that of wild plants, and in the second term of the second year the value was 2.4% lower than that of ‘Rugia’), while plants collected from the natural environment were characterized by the highest values (e.g., in the third term of the second year the value was 3.6% higher than that of ‘Rugia’).
In all measurement terms, except for the second and third terms of the second year, where no significant differences were observed, the highest fluorescence growth time (TFM) was recorded in plants collected from the natural environment (by an average of 17.5%). However, it should be noted that during the third term of the first year, the results did not indicate this unambiguously.
For the area above the fluorescence induction curve (AM), the highest values were most frequently observed in plants collected from the natural habitat (by an average of 25.3%). The exceptions were the second term of the first year, where the results were ambiguous, and the second term of the second year, when the highest AM value was recorded for the ‘Rugia’ cultivar (by an average of 27.2%).

3.1.3. Content of Photosynthetic Pigments

In most measurement terms during both years of the study, the highest chlorophyll “a” content in the leaves was observed in strawberries collected from the natural environment—by an average of 29.8% (Table 5). In contrast, the lowest values were typically recorded for the ‘Rugia’ cultivar (e.g., in the third term of the first year the value was 27.0% lower than that of ‘Baron von Solemacher’ and 41.4% lower than that of wild plants).
In all three measurement periods, no statistically significant differences were found between the studied genotypes regarding chlorophyll “b” content in the leaves. In the third term of the first year, the highest chlorophyll “b” content was observed in the leaves of wild strawberry plants collected from the natural environment (by an average of 31.5%). In the second term of the second year, the ‘Baron von Solemacher’ cultivar exhibited a higher chlorophyll “b” content compared to the ‘Rugia’ cultivar (by 22.5%). In the third term of the same year, the leaves of wild strawberry plants from the natural environment had a higher chlorophyll “b” content, by 18.0%, than those of the ‘Rugia’ cultivar.
In the first and third terms of the first year, as well as in the first term of the second year of the study, no differences were observed between the compared genotypes regarding the ratio of chlorophyll “a” to chlorophyll “b”. For the remaining measurement terms, the highest values of this parameter were found in plants collected from the natural environment (e.g., in the second term of the second year the value was 11.2% higher than that of ‘Baron von Solemacher’, and 10.0% higher than that of ‘Rugia’).
The content of total chlorophyll in the leaves of the tested F. vesca genotypes exhibited similar trends to those observed for the previously discussed assimilation pigments. In all measurement terms, except for the first term of the first year and second term of the second year, the highest total chlorophyll content was found in the leaves of plants collected from a natural environment (by an average of 30.3%). In the first term of the first year, the ‘Baron von Solemacher’ cultivar also showed a similarly high value of this parameter.
Additionally, the content of carotenoids in the leaves of the studied genotypes was highest in plants collected from the natural environment in most measurement terms (by an average of 30.3%). The exception was the first measurement term of the first year, where the ‘Baron von Solemacher’ cultivar exhibited an equally high carotenoid content, and the second measurement term of the second year, when this cultivar surpassed by 20.1% the wild strawberry collected from a natural environment in carotenoid content.

3.1.4. Relative Water Content in Leaves (RWC)

In the first term of the second year of the study, no significant differences in relative water content (RWC) were observed among the genotypes studied. Additionally, the results obtained in the other terms did not allow for a clear identification of plants with the highest or lowest RWC values (Table 6). Only in the second term of the first year was the highest RWC observed in the leaves of wild strawberry plants collected from the natural environment (15.8% greater than ‘Baron von Solemacher’, and 15.2% greater than ‘Rugia’).

3.1.5. Fruit Yield and Weight of a Single Wild Strawberry Fruit

Throughout the two-year experiment, flowering, which was absent in plants collected from their natural habitats, led to the production of fruit yield. In the second year, the ‘Baron von Solemacher’ cultivar produced 29.7% higher yield of fresh fruit mass than the ‘Rugia’ cultivar. However, in both years of the study, no significant differences were observed between the ‘Rugia’ and ‘Baron von Solemacher’ cultivars in terms of single fruit mass (Table 7).

3.1.6. Fresh and Dry Mass of the Root System

Upon completion of the two-year experiment, the fresh and dry mass of the root system was measured. No significant differences were observed among the tested F. vesca genotypes regarding both fresh and dry root mass (Table 8).

3.1.7. Chemical Composition

Analysis of the average elemental content in the tested F. vesca genotypes revealed no significant differences in the concentrations of K, Ca, Mg, Na, Zn, Mn, and Fe (Table 9). However, the ‘Rugia’ cultivar exhibited 25.7% lower Mo content compared to the other genotypes and 31.7% higher Cu content than plants collected from the natural environment.
An analysis of element content within specific plant organs revealed that wild strawberries collected from the natural environment exhibited lower concentrations of Ca (by an average of 24.0%), Mn (by 31.6%), and Fe (by 62.1%) in the leaves compared to the ‘Rugia’ and ‘Baron von Solemacher’ cultivars, as well as 37.9% lower Zn concentration than the ‘Rugia’ cultivar. The Baron von Solemacher variety showed the lowest Mg content in the leaves (by an average of 17.8%), while ‘Rugia’ had the lowest Mo content (by an average of 46.0%). No significant differences were observed among the genotypes in terms of K, Na, and Cu content in the leaves.
The genotypes studied showed no significant differences in Mo and Fe content within the crowns. However, plants collected from the natural environment exhibited higher concentrations of Ca (by an average of 35.2%), Mg (by 32.4%), Zn (by 30.4%), and Mn (by 49.7%) in the crowns compared to both cultivars, as well as lower levels of Na (by 274%) and Cu (by 57.4%) relative to the ‘Rugia’ cultivar. Additionally, these wild-sourced plants contained lower levels of K in the crowns than the other genotypes (by an average of 48.8%).
In the roots, the genotypes did not differ in Ca, Na, and Mo content. Nonetheless, plants from the natural environment displayed lower levels of K (by an average of 48.8%) and Mg (by 26.9%) but higher levels of Mn (by 147.2%) and Fe (by 115.8%) in the roots compared to the cultivars. These wild plants also had 30.4% higher Zn content in the roots than the ‘Rugia’ cultivar, while exhibiting the lowest Cu content (by an average of 29.0%), in contrast to the ‘Rugia’ cultivar, which showed the highest Cu concentration in the roots.

3.2. Evaluation of Differences in Physiological Traits, Chemical Composition, and Yield Among Genotypes in Various Soil Moisture Conditions

3.2.1. Gas Exchange Parameters

The two-factor analysis of variance (ANOVA) revealed a significant main effect of the substrate moisture level (SML) factor on various physiological parameters. Specifically, transpiration intensity (E) showed significant effects during the first four measurement terms, stomatal conductivity to H2O (gs) during the first five measurement terms, net CO2 assimilation intensity (Pn) across all measurement terms, substomatal CO2 concentration (ci) during the first four and the final measurement dates, and the photosynthetic water use efficiency (WUE) during the first three and the fifth measurement dates (Table S1). In general, these parameters exhibited a decline under water deficit conditions, with the exception of gs and ci on the second measurement date, as well as WUE on the first measurement date, where an increase in values was observed (respectively, by 88.5%, 4.1% and 66.4%). The average decrease was 36.7% for E, 30.0% for gs, 23.7% for Pn, 18.2% for ci, and 57.6% for WUE (Table 10).
A significant effect of the Genotype × SML interaction on transpiration intensity (E) was observed in all measurement terms except the second. For stomatal conductivity to H2O (gs) and substomatal CO2 concentration (ci), significant effects were detected in the first, fourth, and fifth terms; for net CO2 assimilation intensity (Pn), in the last three terms; and for photosynthetic water use efficiency (WUE), in the first and last three measurement terms (Table S1). Post hoc analysis revealed a more pronounced reduction in E under water deficit conditions in the cultivars ‘Rugia’ and ‘Baron von Solemacher’ (respectively, by an average of 48.7% and 40.4%, while in wild plants, it was 26.2%). For gs, the cultivars exhibited a greater reduction in the first measurement term (58.5% in ‘Baron von Solemacher’, 50.6%—‘Rugia’, and 23.3%—wild plants). However, in the fourth term, ‘Rugia’ demonstrated a smaller change compared to plants from the natural environment (no statistically significant change compared to a 25.0% reduction), while in the fifth term, ‘Baron von Solemacher’ exhibited a smaller reduction compared to other plants (50.9% and no statistically significant change). In the case of Pn, the results were relatively inconsistent. For example, in ‘Baron von Solemacher’, an increase in Pn was observed in the last two measurement terms (by 106.1% and 79.6%). However, in the remaining terms, Pn values generally decreased, with the greatest reductions occurring in plants from the natural environment (by an average of 47.6%). Regarding ci, plants from the natural environment exhibited the smallest decrease in value in the first measurement term (10.7% compared to an average of 26.9%). In the fourth term, ci values increased in ‘Rugia’ by 14.0% similarly to the fifth term in plants from the natural environment (by 30.6%). In contrast, ‘Baron von Solemacher’ showed a 2.5% decrease in ci values in the fourth term. Summarizing the changes in WUE values across the measurement terms, the most unfavorable changes were observed in ‘Rugia’, which predominantly responded to water deficit by decreasing this parameter (by an average of 44.5%) (Table 10).

3.2.2. Chlorophyll “a” Fluorescence Parameters

A significant main effect of the SML factor on F0 was observed exclusively on the fourth measurement date. For FM and Fᵥ, significant effects were noted in the second and last three measurement terms, while for TFM, they were observed during the first two and last three terms. Similarly, AM demonstrated significant effects on the last three dates. However, no significant differences were found for FV/FM in relation to the SML factor on any measurement date (Table S2). A general decrease in the values of F0 (by 3.8%), FV (by an average of 7.5%), and FM (by an average of 12.1%) was observed across the analyzed dates, with the exception of the second measurement date, where FV and FM values were higher under water deficit conditions (respectively, by 6.6% and 5.1%). In contrast, TFM and AM values increased under water deficit conditions (respectively, by an average of 29.7% and 27.8%) (Table 11).
A significant effect of the genotype × SML interaction on F0 was observed exclusively in the last measurement term. For FM and FV, significant effects were noted in the fourth and fifth measurement term, while for FV/FM and TFM, they were observed in the fourth term. Significant effects for AM were found in the third, fifth, and sixth measurement terms (Table S2). Regarding F0, the most pronounced changes under water deficit conditions occurred in plants obtained from the natural environment (reduction of 15.4%). For FM and FV, the greatest decreases on the fourth and fifth measurement dates were observed in the ‘Rugia’ cultivar (respectively, by an average of 11.1% and 13.1%). A similar trend was evident for FV/FM, where a more substantial decrease was noted in ‘Rugia’ (by 1.9%). In the case of TFM, the most adverse changes under water deficit conditions were recorded in ‘Rugia’ (an increase of 66.4%), but in the case of AM it was ‘Baron von Solemacher’ (an increase of 79.3%) (Table 11).

3.2.3. Content of Photosynthetic Pigments

A significant main effect of the SML factor on chlorophyll “a” content was observed in the second, third, fourth, and fifth measurement terms. For chlorophyll “b,” significant effects were found in the first three and fifth terms. The chlorophyll “a” to “b” ratio showed significant effects in the second and fifth terms, while total chlorophyll content was significantly affected in the second, third, and fifth terms. Carotenoid content exhibited significant effects in the first five measurement terms (Table S3). The results, however, demonstrated notable variability. In the first, second, fourth, and fifth measurement terms, under water deficit conditions, an increase was observed in the contents of chlorophyll “a” (by an average of 23.5%), chlorophyll “b” (by an average of 28.2%), total chlorophyll (by an average of 27.5%), and carotenoids (by an average of 21.3%), accompanied by a decrease in the chlorophyll “a” to “b” ratio (by an average of 7.8%). Conversely, on the third measurement date, decreases were recorded for chlorophyll “a” (by 11.2%), chlorophyll “b” (by 19.3%), total chlorophyll (by 13.7%), and carotenoid content (by 9.0%) (Table 12).
A significant effect of the genotype × SML interaction on the content of chlorophyll “a” and chlorophyll “b” was observed in the second, third, and final measurement terms. For the chlorophyll “a” to “b” ratio, significant effects were noted in the second, fifth, and sixth terms, while for total chlorophyll and carotenoid content, significant effects were recorded in the third and sixth terms (Table S3). For chlorophyll “a,” all genotypes responded to water deficit on the second measurement date with an increase in its content, with the most pronounced change observed in the ‘Baron von Solemacher’ cultivar (by 65.6%). However, in the third and sixth terms, plants from the natural environment exhibited a decrease in chlorophyll “a” content (by an average of 35.8%). A similar pattern was observed for chlorophyll “b,” where an increase in content was noted in the earlier terms (by an average of 64.9%), but a 25.5% decrease occurred in wild plants in the final term. Consequently, the largest reductions in total chlorophyll content were recorded in wild plants (by an average of 37.1%). For the chlorophyll “a” to “b” ratio, a 30.0% increase was observed in cultivated plants in the second measurement term, while a 22.4% decrease occurred in wild plants. In the fifth term, the most substantial reduction in this ratio was recorded in wild plants (by 8.8%), whereas in the sixth term, the greatest decrease was observed in the ‘Baron von Solemacher’ cultivar (by 7.9%). Regarding carotenoids, a decrease in content was observed exclusively in wild plants during the third and sixth terms (by an average of 31.2%), whereas the ‘Rugia’ cultivar demonstrated the most significant increase in carotenoid content (by an average of 29.7%) (Table 12).

3.2.4. Relative Water Content in Leaves (RWC)

A significant main effect of the SML factor on relative water content (RWC) was observed in the first, second, and fifth measurement terms (Table S4). In all instances, RWC values decreased under water deficit conditions by an average of 14.4% (Table 13).
A significant effect of the genotype × SML interaction on RWC was observed only in the first measurement term (Table S4). During this time, the most substantial decrease in RWC was recorded in the ‘Rugia’ plants (by 14.8%) (Table 13).

3.2.5. Fruit Yield and Weight of a Single Wild Strawberry Fruit

In plants obtained from the natural environment, flowering was not observed, and consequently, they were excluded from the analysis of fruit mass as they did not produce any fruits. A significant main effect of the SML factor was identified across all study years for both Fresh Fruit Mass Yield and Single Fruit Mass (Table S5). In each case, plants subjected to water deficit conditions produced fruits with lower mass. This represented an average decrease of 62.9% in Fresh Fruit Mass Yield and an average decrease of 35.6% in Single Fruit Mass (Table 14).
However, no significant effect of the SML × genotype interaction was observed in any year of the study for either Fresh Fruit Mass Yield or Single Fruit Mass (Table S5).

3.2.6. Fresh and Dry Mass of the Root System

Neither the main effect of SML nor the SML × genotype interaction was significant for the fresh and dry mass of the root system of F. vesca (Table S6 and Table 15).

3.2.7. Chemical Composition

For the content of individual elements in leaves, a significant main effect of the SML factor was observed for potassium (K), magnesium (Mg), zinc (Zn), and manganese (Mn) (Table S7). In each case, the content of these elements increased under drought conditions (respectively, by 8.5%, 10.9%, 32.8% and 20.6%) (Table 15). A significant effect of the SML × genotype interaction was detected for calcium (Ca), manganese (Mn), and iron (Fe) (Table S7). The most pronounced changes were observed in plants obtained from the natural environment, which exhibited higher contents of Zn (by 96.3%), Mn (by 62.2%), and Fe (by 157.1%) (Table 16).
For the element content in the crowns, a significant main effect of the SML factor was observed for sodium (Na) and iron (Fe) (Table S7), with the content of both elements increasing under drought conditions (respectively, by 68.9% and 50.0%) (Table 16). A significant effect of the SML × genotype interaction was identified only for calcium (Ca) (Table S7). A significant decrease in Ca content was observed exclusively in plants collected from the natural environment (by 18.5%). In contrast, cultivated varieties showed an increase in Ca content (by an average of 21.9%); however, this increase was not statistically significant.
For the element content in roots, a significant main effect of the SML factor was observed for Ca, Na, Zn, and copper (Cu) (Table S7), with the content of each element increasing under drought conditions (respectively, by 34.8%, 50.0%, 22.2% and 17.8%) (Table 15). A significant effect of the SML × genotype interaction was identified for Mg, Cu, and Zn (Table S7). A significant increase in Mg content in roots under water deficit conditions was observed exclusively in plants obtained from the natural environment (by 31.6%). These plants, along with the ‘Rugia’ cultivar, also showed the most pronounced increase in Zn content (by 34.7% in ‘Rugia’ and by 39.4% in wild plants). In contrast, an increase in Cu content was observed in the ‘Baron von Solemacher’ cultivar (by 31.0%) and in plants obtained from the natural environment (by 29.5%) (Table 16).

3.2.8. Radar Charts

Figure 1 illustrates an analysis of changes in the mean values of parameters used to assess the physiological characteristics of F. vesca plants, grouped by specific measurement dates and genotypes. Based on the graph’s surface area, the ‘Baron von Solemacher’ cultivar showed the lowest adaptation to water deficit conditions in the substrate and the strongest adverse reaction to drought stress (as indicated by the smallest area under the curve) during the first and second terms of the first study year. The ‘Rugia’ cultivar exhibited the smallest adaptation in the third measurement terms of both study years, while plants collected from the natural environment showed the least adaptation in the first and second terms of the second year.
Conversely, the Baron von Solemacher variety demonstrated the highest level of adaptation to drought conditions (reflected by the largest area under the curve) on the third date of the first study year and on the second and third dates of the second study year. Plants obtained from the natural environment exhibited the greatest adaptation on the first measurement date of both years, while the Rugia variety showed the greatest adaptation on the second date of the first study year.

4. Discussion

Physiological traits of cultivated plant varieties, including those within the Fragaria genus, exhibit substantial variability due to both genetic and environmental factors. Research indicates that differences in gas exchange parameters, chlorophyll fluorescence, and yield are pronounced across Fragaria species and varieties, highlighting the critical role of genetic diversity in these traits [40,41,42]. These findings align with the results of our study. While differences in physiological traits among Fragaria varieties are well documented, it is essential to consider that environmental factors can also profoundly influence these characteristics, sometimes overshadowing genetic effects. This complexity underscores the need for continued research into genotype–environment interactions that shape plant physiological responses.
Physiological characteristics of F. vesca plants growing in natural environments, including chlorophyll fluorescence and assimilation pigment content, surpassed those observed in cultivated varieties in our study, likely reflecting their adaptation to natural conditions. These plants thrive in diverse and often challenging habitats, which enhances their capacity for physiological adaptation [43,44]. The mechanisms of drought stress adaptation in plants, both cultivated and wild-growing, share fundamental similarities. However, the scope and effectiveness of these mechanisms can vary significantly due to the distinct environmental pressures experienced by wild plants [45]. Wild plants exhibited a less pronounced reduction in transpiration in response to the same drought stress compared to cultivated plant varieties, suggesting a lower sensitivity to this type of stress.
The observed differences in gas exchange parameters between wild and cultivated F. vesca plants under water stress conditions can be attributed to the inherent genetic diversity and adaptive traits present in wild varieties. Wild F. vesca evolved in natural environments where water stress is a common challenge, leading to the development of physiological and biochemical mechanisms that enhance drought tolerance. In contrast, cultivated varieties have been selectively bred for traits that may not prioritize drought resistance, resulting in a more pronounced reduction in gas exchange under similar stress conditions [46,47]. The greater genetic variability present in natural populations, due to uncontrolled interbreeding and mutations, compared to cultivated varieties, results in a broader range of adaptive responses to environmental stressors [48]. This genetic variability is crucial for the expression of drought-responsive genes, which facilitate improved gas exchange under water-limited conditions. For example, studies on wild relatives of other crops, such as peanut (Arachis hypogaea L.), have shown that they possess alleles that confer resistance to abiotic stresses, including drought, which can be leveraged to improve cultivated varieties [49].
Cultivated varieties of F. vesca are often subjected to agricultural practices that prioritize yield over stress tolerance. Such selective breeding may reduce the expression of genes associated with drought tolerance, rendering these plants more susceptible to water stress. Consequently, cultivated varieties may show more pronounced declines in gas exchange parameters under water stress, as they lack the robust adaptive traits present in their wild counterparts [50].
Similar treatments may trigger opposite changes in other adaptive mechanisms. The observed greater reduction in leaf photosynthetic pigment content in F. vesca plants from natural environments under soil moisture deficit, as compared to cultivated varieties, may result from selective breeding practices favoring higher yields. Cultivated varieties may possess enhanced mechanisms for maintaining pigment levels under stress, such as improved water use efficiency and osmotic regulation [51,52,53]. Although plants may initially increase photosynthetic pigment production under mild stress, severe water deficits can inhibit this response, ultimately leading to a net reduction in pigment content [51,52]. Wild F. vesca plants, frequently exposed to fluctuating moisture levels and other abiotic stresses, may exhibit a more pronounced physiological response to additional stressors, such as drought [54]. In contrast, cultivated varieties, typically grown in more controlled environments, can better withstand water stress without a significant reduction in pigment content [54].
The analysis of mineral composition indicated that wild plants exhibited more substantial variation in the content of specific elements depending on soil moisture conditions, suggesting greater adaptive flexibility. Under control conditions, these plants had a higher calcium content, while under moisture deficit, levels of elements such as potassium and manganese increased. The increase in potassium content is associated with plant survival mechanisms during drought stress [55]. Elevated potassium levels may also function as a tolerance mechanism, limiting the absorption of toxic ions by the roots [56,57]. Manganese, a critical component of photosynthetic proteins and enzymes, plays a central role in the water-splitting reaction that supplies electrons for subsequent stages of photosynthesis. Its deficiency can significantly impair the activity of photosystem II (PSII) [58]. Therefore, the observed increase in manganese content in tissues of plants exposed to drought conditions likely reflects the activation of physiological processes aimed at mitigating the adverse effects of water deficit on plant metabolism.
In contrast, cultivated varieties exhibited fewer or less pronounced differences in mineral content under varying moisture conditions, affecting only select elements. For instance, the ‘Baron von Solemacher’ cultivar showed increased sodium and copper content under drought stress, whereas the ‘Rugia’ displayed greater stability in its mineral composition regardless of soil moisture levels. Sodium contributes to osmotic adjustment in plant tissues under conditions of low external water potential. In C4 species, sodium also plays a role in both the light and dark phases of photosynthesis; for example, it aids in the transport of pyruvate to the chloroplast mesophyll and supports the structural integrity of chloroplast granules [59]. Copper, meanwhile, is crucial at the cellular level, influencing transcriptional and protein transport mechanisms, oxidative phosphorylation, and iron accumulation, all of which significantly shape the plant’s response to drought stress [60].
Other research indicates that wild plants develop more versatile adaptation mechanisms to changing and challenging environmental conditions, a trait supported by their greater genetic diversity. Studies on various plant genotypes, for instance, reveal that wild plants produce higher levels of antioxidant enzymes and osmoprotectants, which enhance their survival under stress [61]. Wild plants also demonstrated more marked differences in elemental content depending on substrate moisture levels. Their leaves, grown under control conditions, contained more calcium (Ca), whereas under drought conditions, they showed elevated concentrations of potassium (K), sodium, manganese, and iron. This suggests an ability to dynamically adjust the internal transport and allocation of minerals in response to drought [62], a response characteristic of wild plants that must adapt to naturally fluctuating environmental conditions where water availability varies. In comparison, cultivated varieties, which have been selectively bred primarily for high yield efficiency and uniformity, may not exhibit such a broad range of adaptive responses under stress [63].
Elemental content differences between the roots of wild plants and cultivated varieties were even more pronounced. The roots of wild plants displayed higher concentrations of potassium, magnesium, sodium, copper, and zinc, indicating an enhanced ability to effectively absorb and store minerals under deficit conditions. While increased sodium and copper accumulation was observed in the roots of the ‘Baron von Solemacher’ cultivar and increased sodium and zinc in the roots of the ‘Rugia’, this response to water deficiency was more extensive in wild plants, with a broader range of mineral accumulation and redistribution [64]. Natural populations exhibit greater genetic diversity, enabling a wider spectrum of responses to environmental stressors, such as low soil moisture. This genetic variability is critical for the efficient uptake and translocation of essential minerals, as demonstrated in studies emphasizing the role of genetic biofortification in wild crop relatives [65]. Furthermore, wild plants frequently display considerable phenotypic plasticity, allowing them to modify root and leaf characteristics in response to fluctuating moisture levels, as shown in research on Plantago lanceolata [66]. Species adapted to low-nutrient soils also develop specialized root morphologies and nutrient acquisition strategies that enhance mineral uptake under stress conditions [67].
Cultivars have likely been selectively bred with an emphasis on yield rather than resilience to environmental variability, which may limit their capacity to adapt to low soil moisture conditions. This focus on yield can lead to reduced genetic diversity and a narrower range of functional traits, potentially impairing their ability to accumulate essential minerals in challenging environments.
Under conditions of water deficiency (drought stress), numerous physiological and molecular processes are either activated or inhibited to adjust plant growth and development, thereby enhancing stress tolerance. The terms “water deficiency” or “water stress” refer to a state in which a plant’s water content is reduced to levels that impair its physiological functions, such as growth, stomatal conductance, and photosynthesis rate. Determining water deficit in absolute terms is challenging due to the complex interplay among atmospheric, plant, and soil factors. Furthermore, a plant’s response to stress can be influenced by conditions preceding the stress event itself. Jacques et al. [68] highlight the concept of “stress memory,” suggesting that plants possess mechanisms to retain information from drought-related stress, potentially leading to enhanced tolerance in subsequent growing seasons. This phenomenon was also observed in our study, where the plant response to drought stress was less pronounced in the second year of the experiment.
The physiological advantages of wild Fragaria vesca result from evolutionary adaptations, extensive genetic diversity, and complex metabolic profiles, which are often diminished in cultivated forms. While cultivated varieties may display characteristics advantageous for commercial production, such as uniformity and increased fruit yield, they frequently lack the resilience and metabolic diversity inherent to wild populations. This trade-off underscores the significance of wild species in breeding programs, as they offer genetic material that can enhance stress tolerance and nutritional quality in cultivated varieties.
Although wild F. vesca demonstrates superior drought tolerance, it is important to recognize that cultivated varieties may possess other valuable traits, such as higher yield and improved fruit quality. This highlights the value of integrating wild genetic resources into breeding efforts to increase the resilience of cultivated strawberries while preserving desirable agronomic characteristics. Evidence suggests that naturally occurring plants exhibit considerable heritable genetic variability for traits associated with stress resistance, implying that wild F. vesca may contain untapped genetic resources valuable for improving cultivated varieties [69]. Balancing drought tolerance with other agronomic traits remains a crucial focus for future research and development in Fragaria breeding.
Our study, however, has several notable limitations. First, as the experiments were conducted under controlled pot conditions, the results may not fully translate to field conditions, where numerous additional factors influence physiological responses. Despite this, our aim was to isolate and examine a single factor, minimizing the influence of others as much as possible. Second, the absence of molecular and proteomic analyses prevented us from definitively identifying the mechanisms underlying plant adaptation to stress. Such analyses would have provided more detailed insights and likely corroborated our findings. Third, the lack of evapotranspiration data means we cannot unequivocally quantify total water loss by the plants and their environment, which includes both transpiration (water loss through stomata) and soil surface evaporation. Nonetheless, tensiometric measurements are widely regarded as a reliable method with high accuracy, offering an efficient alternative to the more labor-intensive gravimetric method. Finally, some measurements may appear slightly inconsistent due to the extended duration of the study and the influence of uncontrolled factors, such as wind, pests, and humidity, which were not accounted for in our analyses.

5. Conclusions

  • This study enabled a comparative analysis of the physiological responses of Fragaria vesca plants, including two cultivated varieties (‘Rugia’ and ‘Baron von Solemacher’) and a wild strawberry population obtained from a natural habitat. The key findings are as follows:
  • F. vesca genotypes exhibit differences in physiological traits. Wild plants display distinct physiological patterns compared to cultivated varieties, including higher chlorophyll fluorescence values and greater assimilation pigment content.
  • Water deficiency in the substrate significantly impacts the physiological characteristics of F. vesca plants. Drought conditions lead to reductions in gas exchange parameters, water use efficiency, chlorophyll “a” fluorescence parameters, relative water content in leaves, and the mass of fruits. Conversely, drought increases the content of elements such as K, Ca, Mg, Na, Cu, Zn, and Mn in various plant organs.
  • F. vesca genotypes differ in their physiological responses to water deficit in the substrate. Plants from the natural environment demonstrate lower sensitivity, in terms of physiological responses, to water deficit compared to cultivated varieties.

Supplementary Materials

The following supporting information can be downloaded at: https://www.mdpi.com/article/10.3390/agriculture15010070/s1, Table S1: Results of two-factor analysis of variance for gas exchange parameters, Table S2: Results of two-factor analysis of variance for chlorophyll “a” fluorescence parameters, Table S3: Results of two-factor analysis of variance for content of photosynthetic pigments, Table S4: Results of two-factor analysis of variance for relative water content (RWC), Table S5: Results of two-factor analysis of variance for total fruit yield from one plant and weight of a single fruit, Table S6: Results of two-factor analysis of variance for fresh and dry mass of the root system, Table S7: Results of two-factor analysis of variance for chemical composition of leaves, crowns and roots,

Author Contributions

Conceptualization, M.R. and M.M.; methodology, M.R. and M.M.; software, M.R. and P.P.; validation, M.R. and M.M.; formal analysis, M.R.; investigation, M.R. and P.P.; resources, M.R., M.M. and P.P.; data curation, M.R.; writing—original draft preparation, M.R. and M.M.; writing—review and editing, M.R. and M.M.; visualization, M.R.; supervision, M.M.; project administration, M.R. and M.M.; funding acquisition, M.R. and M.M. All authors have read and agreed to the published version of the manuscript.

Funding

This research received no external funding.

Institutional Review Board Statement

Not applicable.

Informed Consent Statement

Not applicable.

Data Availability Statement

The datasets used and analyzed during the current study are available from the corresponding author on reasonable request.

Conflicts of Interest

The authors declare no conflicts of interest.

References

  1. Hamdan, M.; Shafar, J. Effect of water irrigation techniques on growth and yield of rock melon (Cucumis melo Linn cv. Glamour). Adv. Plant Sci. Technol. 2017, 24, 80–84. [Google Scholar]
  2. Ghaderi, N.; Normohammadi, S.; Javadi, T. Morpho-physiological responses of strawberry (Fragaria × ananassa) to exogenous salicylic acid application under drought stress. J. Agric. Sci. Technol. 2015, 17, 167–178. [Google Scholar]
  3. Klamkowski, K.; Treder, W.; Wójcik, K. Effects of long-term water stress on leaf gas exchange, growth and yield of three strawberry cultivars. J. Agric. Sci. Technol. 2015, 17, 167–178. [Google Scholar]
  4. Naumann, G.; Alfieri, L.; Wyser, K.; Mentaschi, L.; Betts, R.A.; Carrao, H.; Spinoni, J.; Vogt, J.; Feyen, L. Global Changes in Drought Conditions Under Different Levels of Warming. Geophys. Res. Lett. 2018, 45, 3285–3296. [Google Scholar] [CrossRef]
  5. Shao, H.-B.; Bu, L.-Y.; Jaleel, C.; Zhao, C.-X. Water-deficit stress-induced anatomical changes in higher plants. Comptes Rendus Biol. 2008, 331, 215–225. [Google Scholar] [CrossRef] [PubMed]
  6. Doroszewski, A.; Jadczyszyn, J.; Kozyra, J.; Pudełko, R.; Stuczyński, T.; Mizak, K.; Łopatka, A.; Koza, P.; Górski, T.; Wróblewska, E. Podstawy systemu monitoringu suszy rolniczej (Fundamentals of the agricultural drought monitoring system). Water Environ. Rural Areas 2015, 2, 77–91. [Google Scholar]
  7. Boczoń, A.; Wróbel, M. Wpływ suszy na pobór wody przez sosnę zwyczajną (Pinus sylvestris L.) o różnej pozycji w drzewostanie (The influence of drought on the water uptake by Scots pines (Pinus sylvestris L.) at different positions in the tree stand). For. Res. Work 2015, 76, 370–376. [Google Scholar]
  8. Treder, W.; Wójcik, K.; Tryngiel-Grać, A.; Krzewińska, D.; Klamkowski, K. Rozwój nawodnień roślin sadowniczych w świetle badań ankietowych (Development of irrigation of orchard plants reflected by survey investigations). Infrastruct. Ecol. Rural Areas 2011, 5, 61–69. [Google Scholar]
  9. Dietz, K.; Zörb, C.; Geilfus, C. Drought and crop yield. Plan Biol. 2021, 23, 881–893. [Google Scholar] [CrossRef]
  10. Liu, F.; Savic, S.; Jensen, C.; Shahnazari, A.; Jacobsen, S.; Stikic, R.; Andersen, M. Water relations and yield of lysimeter-grown strawberries under limited irrigation. Sci. Hortic. 2007, 111, 128–132. [Google Scholar] [CrossRef]
  11. Żebrowska, J.; Dyduch, M. Quantitative assessment of the morphogenetic efficiency in strawberry Fragaria × ananassa Duch. Folia Hortic. 2009, 21, 53–64. [Google Scholar] [CrossRef]
  12. Statistics Poland, Agriculture Department. Crop Production in 2016; Statistical Publishing Establishment: Warsaw, Poland, 2017.
  13. Statistics Poland, Agriculture Department. Production of Agricultural and Horticultural Crops in 2020; Statistical Publishing Establishment: Warsaw, Poland, 2021.
  14. Alsheikh, M.; Suso, H.; Robson, M.; Battey, N.; Wetten, A. Appropriate choice of antibiotic and Agrobacterium strain improves transformation of antibiotic-sensitive Fragaria vesca and F. v. semperflorens. Plant Cell Rep. 2002, 20, 1173–1180. [Google Scholar] [CrossRef]
  15. Caulet, R.-P.; Gradinariu, G.; Iurea, D.; Morariu, A. Influence of furostanol glycosides treatments on strawberry (Fragaria × ananassa Duch.) growth and photosynthetic characteristics under drought conditions. Sci. Hort. 2014, 169, 179–188. [Google Scholar] [CrossRef]
  16. Klamkowski, K.; Treder, K. wpływ deficytu wody na wymianę gazową liści, wzrost i plonowanie dwóch odmian truskawki uprawianych pod osłonami (Effect of water deficit on gas exchange parameters, growth and yield of two strawberry cultivars grown under greenhouse conditions). Infrastruct. Ecol. Rural Areas 2011, 5, 105–113. [Google Scholar]
  17. Sun, C.; Li, X.; Hu, Y.; Zhao, P.; Xu, T.; Sun, J.; Gao, X. Proline, sugars, and antioxidant enzymes respond to drought stress in the leaves of strawberry plants. Hortic. Sci. Technol. 2015, 33, 625–632. [Google Scholar] [CrossRef]
  18. Yin, B.; Wang, Y.; Liu, P.; Hu, J.; Zhen, W. Effects of vesicular-arbuscular mycorrhiza on the protective system in strawberry leaves under drought stress. Front. Agric. China 2010, 4, 165–169. [Google Scholar] [CrossRef]
  19. Ibrahim, M.H.; Nulit, R.; Sakimin, S.Z. Influence of drought stress on growth, biochemical changes and leaf gas exchange of strawberry (Fragaria × ananassa Duch.) in Indonesia. AIMS Agric. Food. 2022, 7, 37–60. [Google Scholar]
  20. Jiang, L.; Song, R.; Wang, X.; Wang, J.; Wu, C. Transcriptomic and Metabolomic Analyses Provide New Insights into the Response of Strawberry (Fragaria × ananassa Duch.) to Drought Stress. Horticulturae 2024, 10, 734. [Google Scholar] [CrossRef]
  21. Mikiciuk, G.; Mikiciuk, M.; Hawrot-Paw, M. Influence of superabsorbent polymers on the chemical composition of strawberry (Fragaria × ananassa Duch.) and biological activity in the soil. Folia Hortic. 2015, 27, 63–69. [Google Scholar] [CrossRef]
  22. Krishna, K.V.; Manasa, N.; Krishna, N.V. Drought Resistance in Wheat (Triticum aestivum L.). J. Adv. Biol. Biotechnol. 2024, 27, 409–415. [Google Scholar] [CrossRef]
  23. Sun, F.; Chen, Q.; Chen, Q.; Jiang, M.; Qu, Y. Yield-based drought tolerance index evaluates the drought tolerance of cotton germplasm lines in the interaction of genotype-by-environment. PeerJ 2023, 11, e14367. [Google Scholar] [CrossRef] [PubMed]
  24. Bartczak, M.; Lisiecka, J.; Knaflewski, M. Correlation between selected parameters of planting material and strawberry yield. Folia Hortic. 2010, 22, 9–12. [Google Scholar] [CrossRef]
  25. Błaszczyk, J. Influence of harvest date and storage conditions on the content of chlorophyll pigments in pear peels. Folia Hortic. 2012, 24, 91–95. [Google Scholar] [CrossRef]
  26. Ghaderi, N.; Siosemardeh, A. Response to drought stress of two strawberry cultivars (cv. Kurdistan and Selva). Hortic. Environ. Biotechnol. 2011, 52, 6–12. [Google Scholar] [CrossRef]
  27. Zahedi, S.M.; Hosseini, M.S.; Fahadi Hoveizeh, N.; Kadkhodaei, S.; Vaculík, M. Physiological and biochemical responses of commercial strawberry cultivars under optimal and drought stress conditions. Plants 2023, 12, 496. [Google Scholar] [CrossRef]
  28. Docimo, T.; Paesano, A.; D’Agostino, N.; D’Amelia, V.; Garramone, R.; Carputo, D.; Aversano, R. Exploring CDF gene family in wild potato under salinity stress unveils promising candidates for developing climate-resilient crops. Sci. Rep. 2024, 14, 24619. [Google Scholar] [CrossRef] [PubMed]
  29. Najafipour, B.; Mirlohi, A.; Majidi, M.M.; Saeidi, G.; Abtahi, M. Wild barley genomic resources for drought adaptability and quality improvement. J. Cereal Sci. 2023, 114, 103802. [Google Scholar] [CrossRef]
  30. Żurawicz, E. Truskawka i Poziomka (Strawberry and Wild Strawberry); Państwowe Wydawnictwo Rolnicze i Leśne: Warsaw, Poland, 2005. [Google Scholar]
  31. Kaya, C.; Şenbayram, M.; Akram, N.A.; Ashraf, M.; Alyemeni, M.N.; Ahmad, P. Sulfur-enriched leonardite and humic acid soil amendments enhance tolerance to drought and phosphorus deficiency stress in maize (Zea mays L.). Sci. Rep. 2020, 10, 6432. [Google Scholar] [CrossRef]
  32. Wang, X.; Fu, J.; Min, Z.; Zou, D.; Liu, H.; Wang, J.; Zheng, H.; Jia, L.; Yang, L.; Xin, W.; et al. Response of rice with overlapping growth stages to water stress by assimilates accumulation and transport and starch synthesis of superior and inferior grains. Int. J. Mol. Sci. 2022, 23, 11157. [Google Scholar] [CrossRef] [PubMed]
  33. Frost, C.J.; Nyamdari, B.; Tsai, C.J.; Harding, S.A. The tonoplast-localized sucrose transporter in Populus (PtaSUT4) regulates whole-plant water relations, responses to water stress, and photosynthesis. PLoS ONE 2012, 7, e44467. [Google Scholar] [CrossRef]
  34. Küçükyumuk, C.; Yıldız, H.; Meriç, M.K. The response of Braeburn apple to regulated deficit irrigation. J. Agric. Sci. 2020, 26, 154–163. [Google Scholar] [CrossRef]
  35. Jones, H.G. Monitoring plant and soil water status: Established and novel methods revisited and their relevance to studies of drought tolerance. J. Exp. Bot. 2007, 58, 119–130. [Google Scholar] [CrossRef] [PubMed]
  36. Arnon, D.I.; Allen, M.B.; Whatley, F.R. Photosynthesis by isolated chloroplasts. IV. General concept and comparison of three photochemical reactions. Biochim. Biophys. Acta 1956, 20, 449–461. [Google Scholar] [CrossRef]
  37. Lichtenthaler, H.; Wellburn, A. Determinations of total carotenoids and chlorophyll a and b of leaf extracts in different solvents. Biochem. Soc. Trans. 1966, 11, 591–592. [Google Scholar] [CrossRef]
  38. Hager, A.; Mayer-Berthenrath, T. Die Isolierung und quantative Bestimung der Carotenoide und Chlorophyll von Blatern, Algen und isolierten Chloroplasten mit Hilfe Dunnschichtchromatographischer Methoden. Planta 1966, 69, 198–217. [Google Scholar] [CrossRef] [PubMed]
  39. Yamasaki, S.; Rebello Dillenburg, I. Measurements of leaf relative water content in Araucaria angustifolia. Rev. Bras. Fisiol. Veg. 1999, 11, 69–75. [Google Scholar]
  40. Cameron, J.S.; Hartley, C.A. Gas exchange characteristics of Fragaria chiloensis genotypes. Hort. Sci. 1990, 25, 327–329. [Google Scholar] [CrossRef]
  41. Gao, S.; Yan, Q.; Chen, L.; Song, Y.; Li, J.; Fu, C.; Dong, M. Effects of ploidy level and haplotype on variation of photosynthetic traits: Novel evidence from two Fragaria species. PLoS ONE 2017, 12, e0179899. [Google Scholar] [CrossRef]
  42. Lapshin, V.I.; Yakovenko, V.V.; Shcheglov, S.N.; Podorojny, V.N. A methodical approach for evaluating the variability of productivity and fruit quality in the genetic collections of strawberry (Fragaria × ananassa Duch.). Vavilovskij Žurnal Genet. I Sel. 2019, 23, 675–682. [Google Scholar] [CrossRef]
  43. Kiprono, D.; Thagun, C.; Kodama, Y. Light-dependent chloroplast relocation in wild strawberry (Fragaria vesca). Plant Signal. Behav. 2024, 19, 2342744. [Google Scholar] [CrossRef]
  44. Na, Y.W.; Jeong, H.J.; Lee, S.Y.; Choi, H.G.; Kim, S.H.; Rho, I.R. Chlorophyll fluorescence as a diagnostic tool for abiotic stress tolerance in wild and cultivated strawberry species. Hortic. Environ. Biotechnol. 2014, 55, 280–286. [Google Scholar] [CrossRef]
  45. Malambane, G.; Madumane, K.; Sewelo, L.T.; Batlang, U. Drought stress tolerance mechanisms and their potential common indicators to salinity, insights from the wild watermelon (Citrullus lanatus): A review. Front. Plant Sci. 2023, 13, 1074395. [Google Scholar] [CrossRef]
  46. Skender, A.; Ajdinović, T.; Bećirspahić, D. The comparison of phenotypic characteristics of current varieties and wild species of Fragaria. Genetika 2015, 47, 45–52. [Google Scholar] [CrossRef]
  47. Ulrich, D.; Olbricht, K. Diversity of metabolite patterns and sensory characters in wild and cultivated strawberries 1. J. Berry Res. 2014, 4, 11–17. [Google Scholar] [CrossRef]
  48. Wei, Y.; Kong, Y.; Li, H.; Yao, A.; Han, J.; Zhang, W.; Li, X.; Han, D. Genome-Wide Characterization and Expression Profiling of the AP2/ERF Gene Family in Fragaria vesca L. Int. J. Mol. Sci. 2024, 25, 7614. [Google Scholar] [CrossRef] [PubMed]
  49. Brasileiro, A.; Morgante, C.; Araujo, A.; Leal-Bertioli, S.; Silva, A.; Martins, A.; Vinson, C.; Santos, C.; Bonfim, O.; Togawa, R.; et al. Transcriptome profiling of wild Arachis from water-limited environments uncovers drought tolerance candidate genes. Plant Mol. Biol. Rep. 2015, 33, 1876–1892. [Google Scholar] [CrossRef]
  50. Schulze, J.; Erhardt, A.; Stoll, P. Reduced clonal reproduction indicates low potential for establishment of hybrids between wild and cultivated strawberries (Fragaria vesca × F. × ananassa). Ecol. Res. 2013, 28, 43–52. [Google Scholar] [CrossRef]
  51. Rugienius, R.; Bendokas, V.; Siksnianas, T.; Stanys, V.; Sasnauskas, A.; Kazanaviciute, V. Characteristics of Fragaria vesca yield parameters and anthocyanin accumulation under water deficit stress. Plants 2021, 10, 557. [Google Scholar] [CrossRef]
  52. Rokosa, M.; Mikiciuk, M. Assessment of physiological and morphological traits of plants of the genus Fragaria under conditions of water deficit-a study review. Acta Sci. Pol. Hortorum Cultus 2020, 19, 21–39. [Google Scholar] [CrossRef]
  53. Vinskienė, J.; Bendokas, V.; Stanys, V.; Sasnauskas, A.; Rugienius, R. The effect of osmotic stress, lighting spectrum and temperature on growth and gene expression related to anthocyanin biosynthetic pathway in wild strawberry (L.). Folia Hortic. 2023, 35, 419–431. [Google Scholar] [CrossRef]
  54. Nezhadahmadi, A.; Faruq, G.; Rashid, K. The impact of drought stress on morphological and physiological parameters of three strawberry varieties in different growing conditions. Pak. J. Agric. Sci. 2015, 52, 79–92. [Google Scholar]
  55. Al-Yasi, H.; Attia, H.; Alamer, K.; Hassan, F.; Ali, E.; Elshazly, S.; Siddique, K.; Hessini, K. Impact of drought on growth, photosynthesis, osmotic adjustment, and cell wall elasticity in Damask rose. Plant Physiol. Biochem. 2020, 150, 133–139. [Google Scholar] [CrossRef] [PubMed]
  56. Perin, E.; Messias, R.; Galli, V.; Borowski, J.; Souza, E.; Avila, L.; Bamberg, A.; Rombaldi, C. Mineral content and antioxidant compounds in strawberry fruit submitted to drough stress. Food Sci. Technol. Int. 2019, 39, 245–254. [Google Scholar] [CrossRef]
  57. Keutgen, A.J.; Pawelzik, E. Quality and nutritional value of strawberry fruit under long term salt stress. Food Chem. 2008, 107, 1413–1420. [Google Scholar] [CrossRef]
  58. Buchanan, B.; Gruissem, W.; Jones, R. Photosynthesis. In Biochemistry and Molecular Biology of Plants; Wiley Blackwell: Hoboken, NJ, USA; American Society of Plants Biologists: Rockville, MD, USA, 2000; pp. 568–629. ISBN 978-0-470-71421-8. [Google Scholar]
  59. Martinez, J.P.; Ledent, J.F.; Bajji, M.; Kinet, J.M.; Lutts, S. Effect of water stress on growth, Na+ and K+ accumulation and water use efficiency in relation to osmotic adjustment in two populations of Atriplex halimus L. Plant Growth Regul. 2003, 41, 63–73. [Google Scholar] [CrossRef]
  60. Yurela, I. Copper in plants. Braz. J. Plant Physiol. 2005, 17, 145–156. [Google Scholar] [CrossRef]
  61. Gupta, B.; Shrestha, J. Abiotic stress adaptation and tolerance mechanisms in crop plants. Front. Plant Sci. 2023, 14, 1278895. [Google Scholar] [CrossRef]
  62. Munné-Bosch, S. Vitamin E function in stress sensing and signaling in plants. Dev. Cell 2019, 48, 290–292. [Google Scholar] [CrossRef] [PubMed]
  63. Lata, C.; Prasad, M. Role of DREBs in regulation of abiotic stress responses in plants. J. Exp. Bot. 2011, 62, 4731–4748. [Google Scholar] [CrossRef]
  64. Craine, J.M.; Nippert, J.B.; Elmore, A.J.; Skibbe, A.M.; Hutchinson, S.L.; Brunsell, N.A. Timing of climate variability and grassland productivity. Proc. Natl. Acad. Sci. USA 2012, 09, 3401–3405. [Google Scholar] [CrossRef]
  65. Maqbool, A.; Bakhsh, A.; Aksoy, E. Effects of natural variations on biofortification. In Wild Germplasm for Genetic Improvement in Crop Plants; Academic Press: Cambridge, MA, USA, 2021; pp. 115–138. [Google Scholar]
  66. Dawson, W.; Bòdis, J.; Bucharova, A.; Catford, J.; Duncan, R.; Fraser, L.; Groenteman, R.; Kelly, R.; Moore, J.; Pärtel, M.; et al. Root traits vary as much as leaf traits and have consistent phenotypic plasticity among 14 populations of a globally widespread herb. Funct. Ecol. 2024, 4, 926–941. [Google Scholar] [CrossRef]
  67. Bowsher, A.W.; Miller, B.J.; Donovan, L.A. Evolutionary divergences in root system morphology, allocation, and nitrogen uptake in species from high-versus low-fertility soils. Funct. Plant Biol. 2015, 43, 129–140. [Google Scholar] [CrossRef] [PubMed]
  68. Jacques, C.; Salon, C.; Barnard, R.L.; Vernoud, V.; Prudent, M. Drought stress memory at the plant cycle level: A review. Plants 2021, 10, 1873. [Google Scholar] [CrossRef] [PubMed]
  69. Omondi, E.O.; Lin, C.Y.; Huang, S.M.; Liao, C.A.; Lin, Y.P.; Oliva, R.; van Zonneveld, M. Landscape genomics reveals genetic signals of environmental adaptation of African wild eggplants. Ecol. Evol. 2024, 14, e11662. [Google Scholar] [CrossRef]
Figure 1. Changes in the mean values of selected physiological parameters of F. vesca genotypes under water deficit conditions in the substrate compared to mean values under controlmoisture conditions. Explanations: E—H2O transpiration rate, gs—stomatal H2O conductance, Pn—net CO2 assimilation rate, ci—substomatal CO2 concentration, WUE—photosynthetic water use coefficient, F0—initial fluorescence, FM—maximum fluorescence, FV—variable fluorescence, FV/FM—maximum, potential efficiency of the photochemical reaction in PS II, TFM—chlorophyll fluorescence growth time, AM—area above the chlorophyll fluorescence induction curve, chla—chlorophyll “a” content, chlb—chlorophyll “b” content, chla/b—chlorophyll “a” to “b” content ratio, chlc—total chlorophyll content, carot—carotenoid content, RWC—relative leaf water content index.
Agriculture 15 00070 g001
Table 1. The physicochemical properties of the soil used in the experiment.
pHFine Soil Fractions [%]S0
[g·cm−3]
Content of PContent of KContent of MgSalinity
[g·NaCl·dm−3]
Wtv
H2OKCl[mg · 100 g−1]
6.705.9821.001.255.8712.665.980.4537.10
Explanations: S0—bulk density, Wtv—total water capacity volume.
Table 2. Meteorological conditions during the growing seasons of the studied plants from 2017 to 2019, compared to multi-year averages for the Szczecin-Dąbie Meteorological Station.
YearsMonthsAverage/Sum
IVVVIVIIVIIIIXX
Mean air temperature (°C)
20177.414.117.217.718.213.611.214.2
Deviation−1.80.50.4−1.2−0.3−0.71.7−0.2
201812.316.618.520.020.015.410.316.2
Deviation3.13.01.71.11.51.10.81.8
201910.112.121.518.820.114.510.715.4
Deviation0.9−1.54.7−0.11.60.21.21.0
1991–20209.213.616.818.918.514.39.514.4
Sunshine duration (h)
2017143.2240.3215.5197.1229.1130.696.411,252.2
% of the norm71.998.389.080.199.581.696.888.1
2018257.6349.8253.6301.0269.2204.0170.361805.8
% of the norm129.3143.1104.7122.3116.9127.5171.3127.0
2019285.7198.2345.5222.3239.1168.5-1459.3
% of the norm143.481.1142.790.3103.8105.3x102.6
1991–2020199.3244.5242.2246.2230.3160.099.61422.1
Total precipitation (mm)
201742.290.8132.7192.543.830.493.9626.3
% of the norm135.3162.7224.5252.672.663.7215.9167.5
201826.822.515.092.821.416.320.2215.0
% of the norm85.940.325.4121.835.534.246.457.5
201910.768.770.823.541.863.246.1324.8
% of the norm34.3123.1119.830.869.3132.5106.086.9
1991–202031.255.859.176.260.347.143.5373.8
Relative air humidity (%)
201773.870.974.579.476.582.185.677.5
Deviation3.0−0.61.65.00.60.90.11.5
201869.363.766.471.567.874.279.170.3
Deviation−1.5−7.8−6.5−2.9−8.1−7.0−6.4−5.7
201960.071.265.570.069.778.284.371.3
Deviation−10.8−0.3−7.4−4.4−6.2−3.0−1.2−4.8
1991–202070.871.572.974.475.981.285.576.0
-—no data available; x—irrelevant data. Source: IMGW Station in Szczecin-Dąbie.
Table 3. Gas exchange parameters in leaves of F. vesca genotypes.
ParametersGenotypesMeasurement Terms
1st Year2nd Year
JulyAugustSeptemberJulyAugustSeptember
E
[mmol H2O∙m−2∙s−1]
B1.105 a*0.502 b0.967 a0.707 a0.841 ab0.573 b
R1.017 b0.645 a1.036 a0.571 b0.992 a0.525 c
N1.120 a0.653 a0.726 b0.687 a0.737 b0.907 a
gs
[mol H2O∙m−2∙s−1]
B0.094 a0.137 a0.061 ab0.064 a0.043 b0.063 b
R0.087 a0.107 b0.064 a0.048 b0.053 a0.049 b
N0.086 a0.150 a0.050 b0.060 a0.038 b0.120 a
Pn
[mmol H2O∙m−2∙s−1]
B6.747 a2.200 b4.727 a3.760 a1.520 b2.513 b
R6.847 a1.780 b3.740 ab3.487 a3.873 a4.107 a
N7.307 a3.253 a3.427 b3.760 a4.260 a4.893 a
ci
[μmol CO2∙mol−1]
B311.00 a421.33 ab315.00 a298.20 a355.73 a498.47 a
R299.93 a426.20 a302.53 a280.87 a289.40 b371.47 b
N279.80 b411.73 b304.53 a298.87 a244.33 c449.80 a
WUEB6.201 a3.484 b5.167 a5.409 a1.922 c4.656 b
R6.747 a3.812 b3.799 a6.253 a4.028 b5.432 b
N6.519 a5.168 a5.173 a5.328 a6.533 a20.713 a
Explanations: B—‘Baron von Solemacher’ cultivar; R—‘Rugia’ cultivar; N—plants obtained from a natural habitat. *—means marked with the same letters do not differ significantly at the significance level of α = 0.05.
Table 4. Chlorophyll “a” fluorescence parameters in leaves of F. vesca genotypes.
ParametersGenotypesMeasurement Terms
1st Year2nd Year
JulyAugustSeptemberJulyAugustSeptember
F0B600.786 a*616.857 a587.429 a259.143 a261.857 a266.857 a
R594.375 a612.857 a598.250 a268.625 a273.125 a278.188 a
N600.429 a594.000 a582.929 a258.571 a229.857 b250.643 a
FMB2804.571 a2523.143 b2917.929 ab1246.571 b1222.714 b1270.500 a
R2795.000 a2680.688 ab2821.563 b1346.688 a1398.500 a1323.500 a
N2998.429 a2782.643 a3067.071 a1333.143 a992.571 c1258.643 a
FVB2203.786 a1906.286 b2330.500 ab987.429 b960.857 b1003.643 a
R2200.625 a2068.250 ab2223.313 b1078.063 a1125.375 a954.313 a
N2398.000 a2188.643 a2484.143 a1074.571 a762.714 c1008.000 a
FV/FMB0.782 a0.754 b0.796 ab0.792 a0.785 b0.780 ab
R0.784 a0.771 ab0.785 b0.799 a0.804 a0.772 b
N0.793 a0.779 a0.809 a0.805 a0.743 ab0.801 a
TFMB373.571 b240.714 b305.000 ab578.571 b277.857 a535.000 a
R404.375 b236.875 b279.375 b493.751 c324.375 a518.750 a
N507.143 a273.571 a339.286 a671.429 a317.144 a560.000 a
AMB52,530.786 b31,023.786 b45,809.500 b28,356.286 b16,458.857 b22,092.714 b
R54,069.125 b35,609.250 ab42,670.813 b30,417.688 b23,104.000 a23,176.813 b
N68,608.929 a39,444.500 a57,824.214 a40,694.786 a17,188.714 b32,145.643 a
Explanations: B—‘Baron von Solemacher’ cultivar; R—‘Rugia’ cultivar; N—plants obtained from a natural habitat. *—means marked with the same letters do not differ significantly at the significance level of α = 0.05.
Table 5. Content of photosynthetic pigments in leaves of F. vesca genotypes [mg · g−1 FM].
ParametersGenotypesMeasurement Terms
1st Year2nd Year
JulyAugustSeptemberJulyAugustSeptember
Chlorophyll “a”B1.711 ab*0.851 b1.427 b1.327 b1.952 a1.857 b
R1.360 b1.090 b1.042 c1.355 b1.528 b1.641 b
N1.995 a1.420 a1.777 a2.116 a1.780 ab2.201 a
Chlorophyll “b”B0.622 a0.565 a0.531 b0.564 a0.627 a0.627 ab
R0.523 a0.562 a0.523 b0.654 a0.486 b0.591 b
N0.702 a0.700 a0.855 a0.846 a0.508 ab0.721 a
Chlorophyll “a” to chlorophyll “b” ratioB2.747 a1.528 b2.684 a2.385 a3.113 b2.963 a
R2.632 a1.932 a2.074 a2.208 a3.154 b2.780 b
N2.839 a2.028 a2.107 a2.523 a3.504 a3.056 a
Total chlorophyllB2.333 ab1.415 b1.958 b2.333 ab1.415 b1.958 b
R1.882 b1.652 b1.565 c1.882 b1.652 b1.565 c
N2.697 a2.119 a2.631 a2.697 a2.119 a2.631 a
CarotenoidsB0.959 ab0.672 b0.866 b0.683 b0.966 a0.933 b
R0.728 b0.748 b0.639 c0.696 b0.902 ab0.825 b
N1.179 a1.009 a1.170 a1.050 a0.772 b1.120 a
Explanations: B—‘Baron von Solemacher’ cultivar; R—‘Rugia’ cultivar; N—plants obtained from a natural habitat. *—means marked with the same letters do not differ significantly at the significance level of α = 0.05.
Table 6. Relative water content (RWC) in leaves of F. vesca genotypes [%].
GenotypesMeasurement Terms
1st Year2nd Year
JulyAugustSeptemberJulyAugustSeptember
B54.445 b*54.765 b56.308 ab45.247 a42.064 a46.258 b
R62.644 a55.159 b61.177 a39.875 a40.545 ab58.035 a
N58.285 ab65.073 a54.813 b37.150 a30.509 b52.958 ab
Explanations: B—‘Baron von Solemacher’ cultivar; R—‘Rugia’ cultivar; N—plants obtained from a natural habitat. *—means marked with the same letters do not differ significantly at the significance level of α = 0.05.
Table 7. Total fruit yield from one plant and weight of a single fruit during the vegetation period (June–September) in F. vesca genotypes [g].
ParametersGenotypes1st Year2nd Year
Fresh Fruit Mass YieldB23.79 a*33.11 a
R22.20 a23.27 b
N--
Single Fruit MassB0.65 a0.55 a
R0.59 a0.54 a
N--
Explanations: B—‘Baron von Solemacher’ cultivar; R—‘Rugia’ cultivar; N—plants obtained from a natural habitat. *—means marked with the same letters do not differ significantly at the significance level of α = 0.05.
Table 8. Fresh and dry mass of the root system of F. vesca genotypes [g].
GenotypesFresh Mass of the Root SystemDry Mass of the Root System
B11.81 a*6.83 a
R13.30 a6.83 a
N17.80 a10.47 a
Explanations: B—‘Baron von Solemacher’ cultivar; R—‘Rugia’ cultivar; N—plants obtained from a natural habitat. *—means marked with the same letters do not differ significantly at the significance level of α = 0.05.
Table 9. Chemical composition of leaves, crowns and roots of F. vesca genotypes.
Plant OrganGenotypesK
[g‧kg−1]
Ca
[g‧kg−1]
Mg
[g‧kg−1]
Na
[g‧kg−1]
Cu
[mg‧kg−1]
Zn
[mg‧kg−1]
Mn
[mg‧kg−1]
Mo
[mg‧kg−1]
Fe
[mg‧kg−1]
LeavesB97.6 a*66.9 a13.5 b4.8 a37.3 a172.5 ab201.8 a11.7 a1.9 a
R106.9 a69.7 a15.7 a2.8 a52.2 a236.4 a205.4 a6.6 b1.8 a
N96.5 a51.9 b17.2 a2.7 a45.6 a146.8 b139.2 b12.8 a0.7 b
CrownsB82.9 a115.6 b3.9 b28.0 ab87.9 ab155.2 b31.4 b17.6 a0.2 a
R92.2 a91.4 b3.4 b37.4 a117.1 a141.3 b30.8 b16.4 a0.2 a
N50.4 b159.7 a5.4 a10.0 b74.4 b212.9 a61.8 a17.3 a0.2 a
RootsB25.9 a80.7 a13.4 a6.1 a92.5 b853.5 ab373.3 b12.4 a6.3 b
R24.5 a63.4 a13.4 a5.9 a111.4 a677.8 b388.0 b9.4 a6.4 b
N12.9 b60.2 a9.8 b5.9 a71.8 c883.8 a940.8 a14.6 a13.7 a
AverageB69.9 a89.9 a9.8 a32.6 a73.7 ab375.4 a189.0 a14.2 a2.6 a
R74.5 a74.8 a10.8 a15.4 a93.6 a351.8 a208.1 a10.8 b2.8 a
N53.3 a90.6 a10.8 a6.2 a63.9 b414.5 a380.6 a14.9 a4.9 a
Explanations: B—‘Baron von Solemacher’ cultivar; R—‘Rugia’ cultivar; N—plants obtained from a natural habitat. *—means marked with the same letters do not differ significantly at the significance level of α = 0.05.
Table 10. Gas exchange parameters in leaves of F. vesca genotypes in various soil moisture conditions.
ParametersGenotypesSMLMeasurement Terms
1st Year2nd year
JulyAugustSeptemberJulyAugustSeptember
E
[mmol H2O∙m−2∙s−1]
BCtrl1.105 ab1.041 a0.967 a0.707 a0.841 bc0.573 c
Def0.417 d0.645 a0.727 b0.465 c1.097 a0.499 cd
RCtrl1.017 b1.021 a1.036 a0.571 b0.992 ab0.252 e
Def0.405 d0.502 a0.579 b0.565 b0.578 d0.431 d
NCtrl1.120 a1.059 a0.726 b0.687 a0.735 cd0.907 a
Def0.789 c0.653 a0.619 b0.530 bc0.733 cd0.801 b
AverageCtrl1.081 A1.040 A0.910 A0.655 A0.856 A0.577 A
Def0.537 B0.600 B0.642 B0.520 B0.803 A0.574 A
gs
[mol H2O∙m−2∙s−1]
BCtrl0.094 a0.137 a0.061 a0.064 a0.043 bc0.063 a
Def0.039 c0.254 a0.045 a0.036 c0.050 ab0.082 a
RCtrl0.087 a0.107 a0.064 a0.048 b0.053 a0.055 a
Def0.043 c0.182 a0.038 a0.046 b0.026 e0.049 a
NCtrl0.086 a0.150 a0.050 a0.060 a0.038 cd0.113 a
Def0.066 b0.305 a0.042 a0.045 b0.032 de0.120 a
AverageCtrl0.089 A0.131 B0.058 A0.058 A0.045 A0.083 A
Def0.049 B0.247 A0.042 B0.042 B0.036 B0.077 A
Pn
[mmol H2O∙m−2∙s−1]
BCtrl6.747 a2.200 a4.727 a3.760 a1.520 d2.513 c
Def4.313 a1.667 a3.873 a2.787 b3.133 bc4.513 b
RCtrl6.847 a1.780 a3.740 a3.487 a3.873 ab4.107 bc
Def5.380 a1.773 a2.607 a2.060 c2.300 cd3.667 bc
NCtrl7.307 a3.253 a3.427 a3.533 a4.260 a7.780 a
Def5.800 a2.553 a2.673 a3.840 a1.787 d4.893 b
AverageCtrl6.697 A2.411 A3.964 A3.593 A3.218 A5.320 A
Def5.164 B1.998 A3.051 B2.896 B2.407 B3.838 B
ci
[μmol CO2∙mol−1]
BCtrl311.000 a421.333 a315.000 a298.200 ab355.733 a498.467 a
Def220.667 c441.600 a257.133 a290.800 c316.133 ab361.333 a
RCtrl299.933 ab426.200 a302.533 a280.867 bc289.400 bc371.467 a
Def225.933 c434.200 a282.533 a320.133 a300.533 b323.800 a
NCtrl279.800 b411.733 a304.533 a298.867 ab244.333 c449.800 a
Def250.000 c434.733 a286.467 a255.400 c319.000 ab339.800 a
AverageCtrl296.911 A419.756 B307.356 A292.644 A296.489 A439.911 A
Def232.200 B436.844 A275.378 B278.778 A311.889 A341.644 B
WUEBCtrl6.201 c3.484 a5.167 a5.409 bc1.922 c4.656 c
Def11.071 b1.668 a0.196 a6.593 b2.938 bc9.285 bc
RCtrl6.747 c3.812 a3.799 a6.253 ab4.028 b20.713 a
Def13.763 a1.806 a0.231 a3.979 c3.760 b9.805 b
NCtrl6.519 c5.168 a5.173 a5.328 bc6.533 a5.432 bc
Def7.561 c2.569 a0.243 a7.685 a2.554 bc9.967 b
AverageCtrl6.489 B4.155 A4.713 A5.663 A4.161 A10.267 A
Def10.798 A2.014 B0.223 B6.089 A3.084 B9.686 A
Explanations: SML—substrate moisture level; Ctrl—control, Def—deficit; B—‘Baron von Solemacher’ cultivar; R—‘Rugia’ cultivar; N—plants obtained from a natural habitat. Uppercase letters indicate means that significantly differ in the presence of a significant main effect of the SML factor, while lowercase letters denote means that significantly differ in the presence of a significant interaction effect (SML × genotype).
Table 11. Chlorophyll “a” fluorescence parameters in leaves of F. vesca genotypes in various soil moisture conditions.
ParametersGenotypesSMLMeasurement Terms
1st Year2nd Year
JulyAugustSeptemberJulyAugustSeptember
F0BCtrl600.786 a616.857 a587.429 a259.143 a261.857 a266.857 ab
Def598.333 a620.000 a585.933 a252.200 a266.733 a274.867 ab
RCtrl594.375 a610.143 a598.250 a268.625 a273.125 a278.188 a
Def608.929 a612.438 a594.000 a258.214 a267.500 a271.857 ab
NCtrl600.429 a594.000 a582.929 a258.571 a229.857 a250.643 b
Def603.867 a593.200 a593.600 a247.200 a223.067 a211.933 c
AverageCtrl598.341 A607.977 A589.932 A262.409 A255.773 A265.818 A
Def603.591 A907.727 A591.114 A252.409 B252.091 A252.455 A
FMBCtrl2804.571 a2523.143 a2917.929 a1246.571 c1222.714 b1270.500 a
Def2936.867 a2729.667 a2959.667 a1272.400 bc1305.333 ab1179.800 a
RCtrl2701.214 a2680.688 a2821.563 a1346.688 a1398.500 a1232.500 a
Def2795.000 a2733.000 a2998.643 a1201.357 c1237.857 b1162.857 a
NCtrl2998.429 a2782.643 a3067.071 a1333.143 ab992.571 c1258.643 a
Def3005.067 a2928.533 a2922.600 a1237.867 c887.333 d1097.000 a
AverageCtrl2862.773 A2663.000 B2930.341 A1310.523 A1213.409 A1525.909 A
Def2885.136 A2798.523 A2959.432 A1238.023 B1141.364 B1146.182 B
FVBCtrl2203.786 a1906.286 a2330.500 a987.429 cb960.857 b1003.643 a
Def2338.533 a2109.667 a2373.733 a1020.200 ab1038.600 ab904.933 a
RCtrl2200.625 a2068.250 a2223.313 a1078.063 a1125.375 a954.313 a
Def2092.286 a2122.857 a2404.643 a943.143 c970.357 b891.000 a
NCtrl2398.000 a2188.643 a2484.143 a1074.571 a762.714 c1008.000 a
Def2401.200 a2335.333 a2329.000 a990.667 bc664.267 d885.067 a
AverageCtrl2264.432 A2055.023 B2340.409 A1048.114 A957.636 A987.091 A
Def2281.545 A2190.795 A2368.318 A985.614 B889.273 B893.727 B
FV/FMBCtrl0.782 a0.754 a0.796 a0.792 ab0.785 a0.780 a
Def0.796 a0.769 a0.800 a0.801 a0.795 a0.765 a
RCtrl0.784 a0.771 a0.785 a0.799 a0.804 a0.772 a
Def0.765 a0.775 a0.800 a0.784 b0.783 a0.764 a
NCtrl0.793 a0.779 a0.809 a0.805 a0.743 a0.801 a
Def0.797 a0.796 a0.796 a0.800 a0.737 a0.805 a
AverageCtrl0.786 A0.768 A0.796 A0.799 A0.779 A0.783 A
Def0.787 A0.780 A0.798 A0.795 A0.772 A0.778 A
TFMBCtrl373.571 a240.714 a305.000 a578.571 d277.857 a535.000 a
Def506.667 a266.667 a341.333 a726.667 b500.000 a611.333 a
RCtrl404.375 a236.875 a279.375 a493.751 e324.375 a518.750 a
Def507.143 a251.429 a309.286 a821.429 a491.429 a628.571 a
NCtrl507.143 a273.571 a339.286 a671.429 c317.144 a560.000 a
Def620.000 a276.000 a356.667 a806.667 a462.000 a713.333 a
AverageCtrl427.273 B249.773 B306.591 A577.273 B307.273 B537.045 B
Def545.455 A265.000 A336.364 A784.091 A484.318 A651.591 A
AMBCtrl52,530.79 a31,023.79 a45,809.50 bc28,356.29 a16,458.86 c22,092.71 a
Def62,576.73 a36,214.73 a52,129.73 ab38,018.53 a29,509.93 a31,889.93 a
RCtrl54,069.13 a35,609.25 a42,670.81 c30,417.69 a23,104.00 b23,176.81 a
Def52,151.14 a34,992.36 a50,287.57 abc38,595.50 a27,784.21 a29,535.43 a
NCtrl68,608.93 a39,444.50 a57,824.21 a40,694.79 a17,188.72 c32,145.64 a
Def73,210.20 a43,184.27 a50,782.27 abc46,048.60 a19,009.80 c36,060.13 a
AverageCtrl58,205.96 A35,370.55 A48,491.02 A33,031.77 B19,107.50 B25,685.59 B
Def62,884.55 A38,201.77 A51,084.02 A40,939.64 A25,381.25 A32,562.43 A
Explanations: SML—substrate moisture level; Ctrl—control, Def—deficit; B—‘Baron von Solemacher’ cultivar; R—‘Rugia’ cultivar; N—plants obtained from a natural habitat. Uppercase letters indicate means that significantly differ in the presence of a significant main effect of the SML factor, while lowercase letters denote means that significantly differ in the presence of a significant interaction effect (SML × genotype).
Table 12. Content of photosynthetic pigments in leaves of F. vesca genotypes in various soil moisture conditions [mg · g−1 FM].
ParametersGenotypesSMLMeasurement Terms
1st Year2nd Year
JulyAugustSeptemberJulyAugustSeptember
Chlorophyll “a”BCtrl1.711 a0.851 d1.427 b1.327 a1.952 a1.857 bc
Def1.727 a1.409 b1.386 b1.852 a2.372 a1.717 bc
RCtrl1.360 a1.090 c1.042 c1.355 a1.528 a1.641 bc
Def1.629 a1.274 bc1.460 b1.553 a2.143 a2.009 ab
NCtrl1.995 a1.420 b1.777 a2.116 a1.780 a2.201 a
Def2.194 a1.629 a0.923 d2.250 a2.034 a1.685 bc
AverageCtrl1.689 A1.120 B1.415 A1.599 B1.754 B1.900 A
Def1.850 A1.437 A1.256 B1.885 A2.183 A1.804 A
Chlorophyll “b”BCtrl0.622 a0.565 c0.531 b0.564 a0.627 a0.627 abc
Def0.685 a0.709 b0.553 b0.705 a0.768 a0.627 abc
RCtrl0.523 a0.562 c0.523 b0.606 a0.486 a0.591 bc
Def0.741 a0.652 bc0.601 b0.654 a0.695 a0.693 ab
NCtrl0.702 a0.700 b0.387 c0.846 a0.508 a0.721 a
Def0.860 a1.037 a0.855 a0.824 a0.637 a0.537 c
AverageCtrl0.616 B0.609 B0.637 A0.688 A0.541 B0.646 A
Def0.762 A0.800 A0.514 B0.712 A0.700 A0.619 A
Chlorophyll “a” to chlorophyll “b” ratioBCtrl2.747 a1.528 b2.684 a2.385 a3.113 bc2.963 ab
Def2.525 a1.986 a2.506 a2.607 a3.091 bc2.730 c
RCtrl2.632 a1.932 a2.074 a2.208 a3.154 bc2.780 c
Def2.190 a1.950 a2.429 a2.565 a3.083 c2.898 bc
NCtrl2.839 a2.028 a2.107 a2.523 a3.504 a3.056 ab
Def2.557 a1.573 b2.386 a2.732 a3.196 b3.136 a
AverageCtrl2.739 A1.829 A2.288 A2.372 A3.257 A2.933 A
Def2.424 B1.836 A2.440 A2.635 A3.123 B2.921 A
Total chlorophyllBCtrl2.333 a1.415 a1.958 b1.890 a2.579 a2.483 abc
Def2.411 a2.117 a1.938 b2.556 a3.139 a2.343 abc
RCtrl1.882 a1.652 a1.565 c2.008 a2.014 a2.231 c
Def2.369 a1.926 a2.061 b2.159 a2.837 a2.701 ab
NCtrl2.697 a2.119 a2.631 a2.962 a2.288 a2.921 a
Def3.053 a2.666 a1.309 d3.073 a2.670 a2.222 c
AverageCtrl2.304 A1.729 B2.051 A2.286 A2.294 B2.545 A
Def2.611 A2.236 A1.769 B2.596 A2.882 A2.422 A
CarotenoidsBCtrl0.959 a0.672 a0.866 b0.683 a0.966 a0.933 bc
Def1.023 a0.983 a0.920 b0.917 a1.155 a0.912 bc
RCtrl0.728 a0.748 a0.639 c0.696 a0.772 a0.825 c
Def0.992 a0.866 a0.846 b0.808 a1.058 a1.047 ab
NCtrl1.179 a1.009 a1.170 a1.050 a0.902 a1.120 a
Def1.403 a1.204 a0.667 c1.108 a1.047 a0.902 bc
AverageCtrl0.955 B0.810 B0.891 A0.810 B0.880 B0.959 A
Def1.139 A1.018 A0.811 B0.944 A1.087 A0.954 A
Explanations: SML—substrate moisture level; Ctrl—control, Def—deficit; B—‘Baron von Solemacher’ cultivar; R—‘Rugia’ cultivar; N—plants obtained from a natural habitat. Uppercase letters indicate means that significantly differ in the presence of a significant main effect of the SML factor, while lowercase letters denote means that significantly differ in the presence of a significant interaction effect (SML × genotype).
Table 13. Relative water content (RWC) in leaves of F. vesca genotypes in various soil moisture conditions [%].
GenotypesSMLMeasurement Terms
1st Year2nd Year
JulyAugustSeptemberJulyAugustSeptember
BCtrl54.445 bc54.765 a56.308 a45.245 a42.064 a46.258 a
Def57.062 bc55.160 a63.152 a45.247 a29.790 a42.738 a
RCtrl62.644 a55.159 a61.177 a39.875 a40.545 a58.035 a
Def53.366 c43.781 a52.717 a38.022 a31.226 a50.866 a
NCtrl58.285 b65.073 a54.813 a37.150 a30.509 a52.958 a
Def56.126 bc60.660 a56.865 a35.471 a18.812 a47.108 a
AverageCtrl58.458 A58.332 A57.432 A40.757 A37.706 A52.417 A
Def55.518 B53.200 B57.578 A37.285 A26.609 B46.904 A
Explanations: SML—substrate moisture level; ctrl—Control, Def—deficit; B—‘Baron von Solemacher’ cultivar; R—‘Rugia’ cultivar; N—plants obtained from a natural habitat. Uppercase letters indicate means that significantly differ in the presence of a significant main effect of the SML factor, while lowercase letters denote means that significantly differ in the presence of a significant interaction effect (SML × genotype).
Table 14. Total fruit yield from one plant and weight of a single fruit during the vegetation period (June–September) in F. vesca genotypes in various soil moisture conditions [g].
ParametersGenotypesSML1st Year2nd Year
Fresh Fruit Mass YieldBCtrl23.79 a33.11 a
Def5.29 a14.83 a
RCtrl22.20 a23.27 a
Def5.64 a14.62 a
NCtrl--
Def--
AverageCtrl23.00 A29.19 A
Def5.46 B14.72 B
Single Fruit MassBCtrl0.65 a0.55 a
Def0.36 a0.38 a
RCtrl0.59 a0.54 a
Def0.39 a0.38 a
NCtrl--
Def--
AverageCtrl0.62 A0.55 A
Def0.37 B0.38 B
Explanations: SML—substrate moisture level; Ctrl—control, Def—deficit; B—‘Baron von Solemacher’ cultivar; R—‘Rugia’ cultivar; N—plants obtained from a natural habitat. Uppercase letters indicate means that significantly differ in the presence of a significant main effect of the SML factor, while lowercase letters denote means that significantly differ in the presence of a significant interaction effect (SML × genotype).
Table 15. Fresh and dry mass of the root system of F. vesca genotypes in various soil moisture conditions [g].
GenotypesSMLFresh Mass of the Root SystemDry Mass of the Root System
BCtrl11.81 a6.83 a
Def6.74 a4.40 a
RCtrl12.30 a6.53 a
Def8.26 a4.40 a
NCtrl17.80 a10.47 a
Def23.80 a15.31 a
AverageCtrl13.64 a7.66 a
Def16.61 a10.46 a
Explanations: SML—substrate moisture level; Ctrl—control, Def—deficit; B—‘Baron von Solemacher’ cultivar; R—‘Rugia’ cultivar; N—plants obtained from a natural habitat. Uppercase letters indicate means that significantly differ in the presence of a significant main effect of the SML factor, while lowercase letters denote means that significantly differ in the presence of a significant interaction effect (SML × genotype).
Table 16. Chemical composition of leaves, crowns and roots of F. vesca genotypes in various soil moisture conditions.
Plant OrganGenotypesSMLK
[g‧kg−1]
Ca
[g‧kg−1]
Mg
[g‧kg−1]
Na
[g‧kg−1]
Cu
[mg‧kg−1]
Zn
[mg‧kg−1]
Mn
[mg‧kg−1]
Mo
[mg‧kg−1]
Fe
[mg‧kg−1]
LeavesBCtrl97.6 a66.9 ab13.5 a64.8 a37.3 a172.5 bc201.8 ab11.7 a1.9 b
Def100.4 a70.2 a16.6 a4.9 a53.4 a225.0 ab241.8 a12.8 a2.6 a
RCtrl106.9 a69.7 a15.7 a2.8 a52.2 a236.4 ab205.4 ab6.6 a1.8 b
Def118.0 a68.4 a17.0 a5.5 a56.0 a228.0 ab186.4 b6.7 a1.2 bc
NCtrl96.5 a51.9 bc17.2 a2.7 a45.6 a146.8 c139.2 c12.8 a0.7 c
Def108.7 a42.2 c18.2 a4.6 a46.0 a288.2 a225.8 ab12.4 a1.8 b
AverageCtrl100.5 B62.5 A15.6 B20.5 A45.6 A186.1 B180.7 B10.3 A1.4 A
Def109.0 A60.6 A17.3 A5.0 A51.8 A247.1 A218.0 A10.6 A1.8 A
CrownsBCtrl82.9 a115.6 bc3.9 a28.0 a87.9 a155.2 a31.4 a17.6 a0.2 a
Def92.2 a129.7 b4.2 a49.8 a84.1 a160.8 a49.8 a14.6 a0.5 a
RCtrl92.2 a91.4 c3.4 a37.4 a117.1 a141.3 a30.8 a16.4 a0.2 a
Def104.3 a120.3 bc3.9 a56.6 a85.6 a164.1 a34.5 a13.9 a0.3 a
NCtrl50.4 a159.7 a5.4 a10.0 a74.4 a212.9 a61.8 a17.3 a0.2 a
Def54.9 a130.2 b5.1 a20.8 a64.0 a245.6 a77.2 a18.6 a0.3 a
AverageCtrl75.2 A122.2 A4.3 A25.1 B93.1 A169.8 A41.3 A17.1 A0.2 B
Def83.8 A126.7 A4.4 A42.4 A77.9 A190.2 A53.8 A15.7 A0.3 A
RootsBCtrl25.9 a80.7 a13.4 a6.1 a92.5 bc853.5 bc373.3 a12.4 a6.3 a
Def26.9 a88.3 a12.1 a8.6 a121.2 a844.4 b422.2 a19.0 a7.5 a
RCtrl24.5 a63.4 a13.4 a5.9 a111.4 a677.8 c388.0 a9.4 a6.4 a
Def29.0 a103.3 a13.1 a8.9 a107.6 ab913.2 b309.0 a14.0 a7.3 a
NCtrl12.9 a60.2 a9.8 b5.9 a71.8 d883.8 b940.8 a14.6 a13.7 a
Def20.9 a77.6 a12.9 a9.6 a93.0 c1232.3 a926.8 a12.4 a12.6 a
AverageCtrl20.7 A67.2 B12.1 A6.0 B91.9 B801.6 B581.2 A12.1 A9.0 A
Def25.9 A90.6 A12.7 A9.0 A108.3 A979.8 A525.9 A15.3 A8.9 A
Explanations: SML—substrate moisture level; Ctrl—control, Def—deficit; B—‘Baron von Solemacher’ cultivar; R—‘Rugia’ cultivar; N—plants obtained from a natural habitat. Uppercase letters indicate means that significantly differ in the presence of a significant main effect of the SML factor, while lowercase letters denote means that significantly differ in the presence of a significant interaction effect (SML × genotype).
Disclaimer/Publisher’s Note: The statements, opinions and data contained in all publications are solely those of the individual author(s) and contributor(s) and not of MDPI and/or the editor(s). MDPI and/or the editor(s) disclaim responsibility for any injury to people or property resulting from any ideas, methods, instructions or products referred to in the content.

