Long-Term Global Trends in Vineyard Coverage and Fresh Grape Production
Abstract
1. Introduction
- Quantify long-term trends in key factors of vineyard coverage and fresh grape production at the country level.
- Assess global variations in vineyard coverage and fresh grape production indicators over time.
- Analyze the underlying factors driving trends in area harvested (i.e., vineyard coverage) and the patterns of their influence.
2. Materials and Methods
2.1. Data Collection
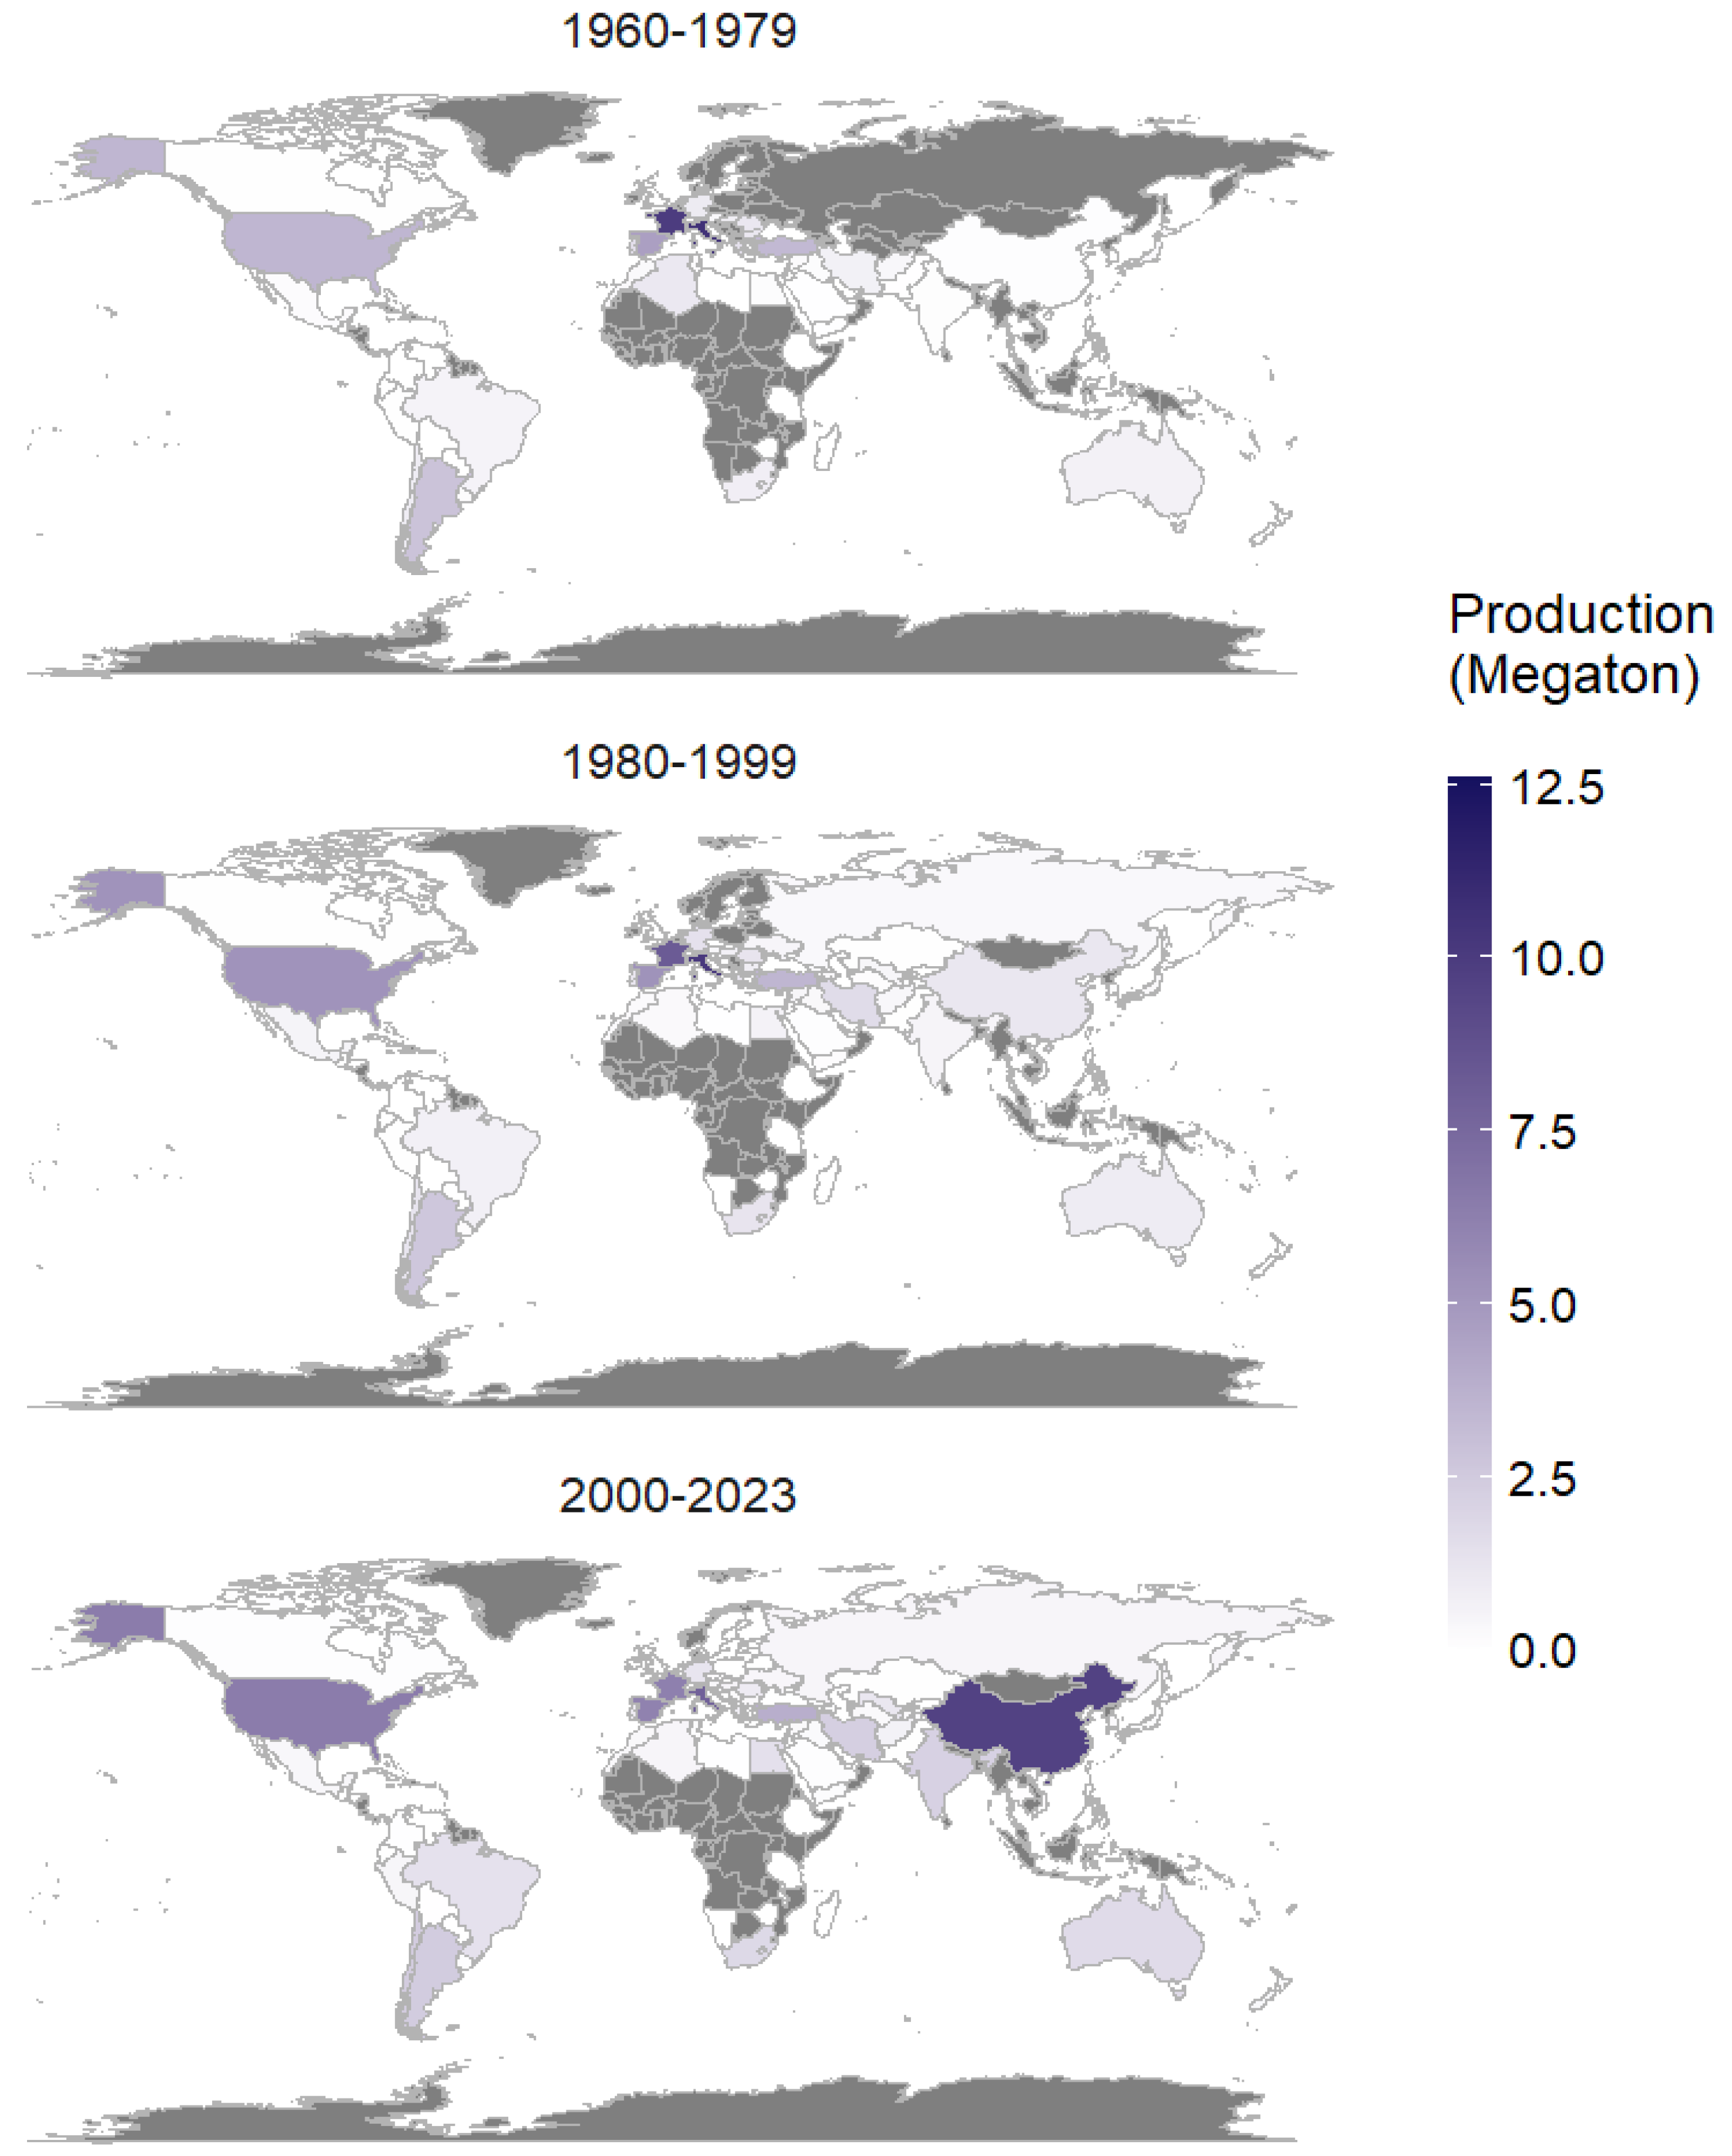
- Production: this factor represents the annual fresh-grape production for each country, measured in Megaton. A series of world maps with averaged values every two decades can be seen in Appendix A, Figure A1.
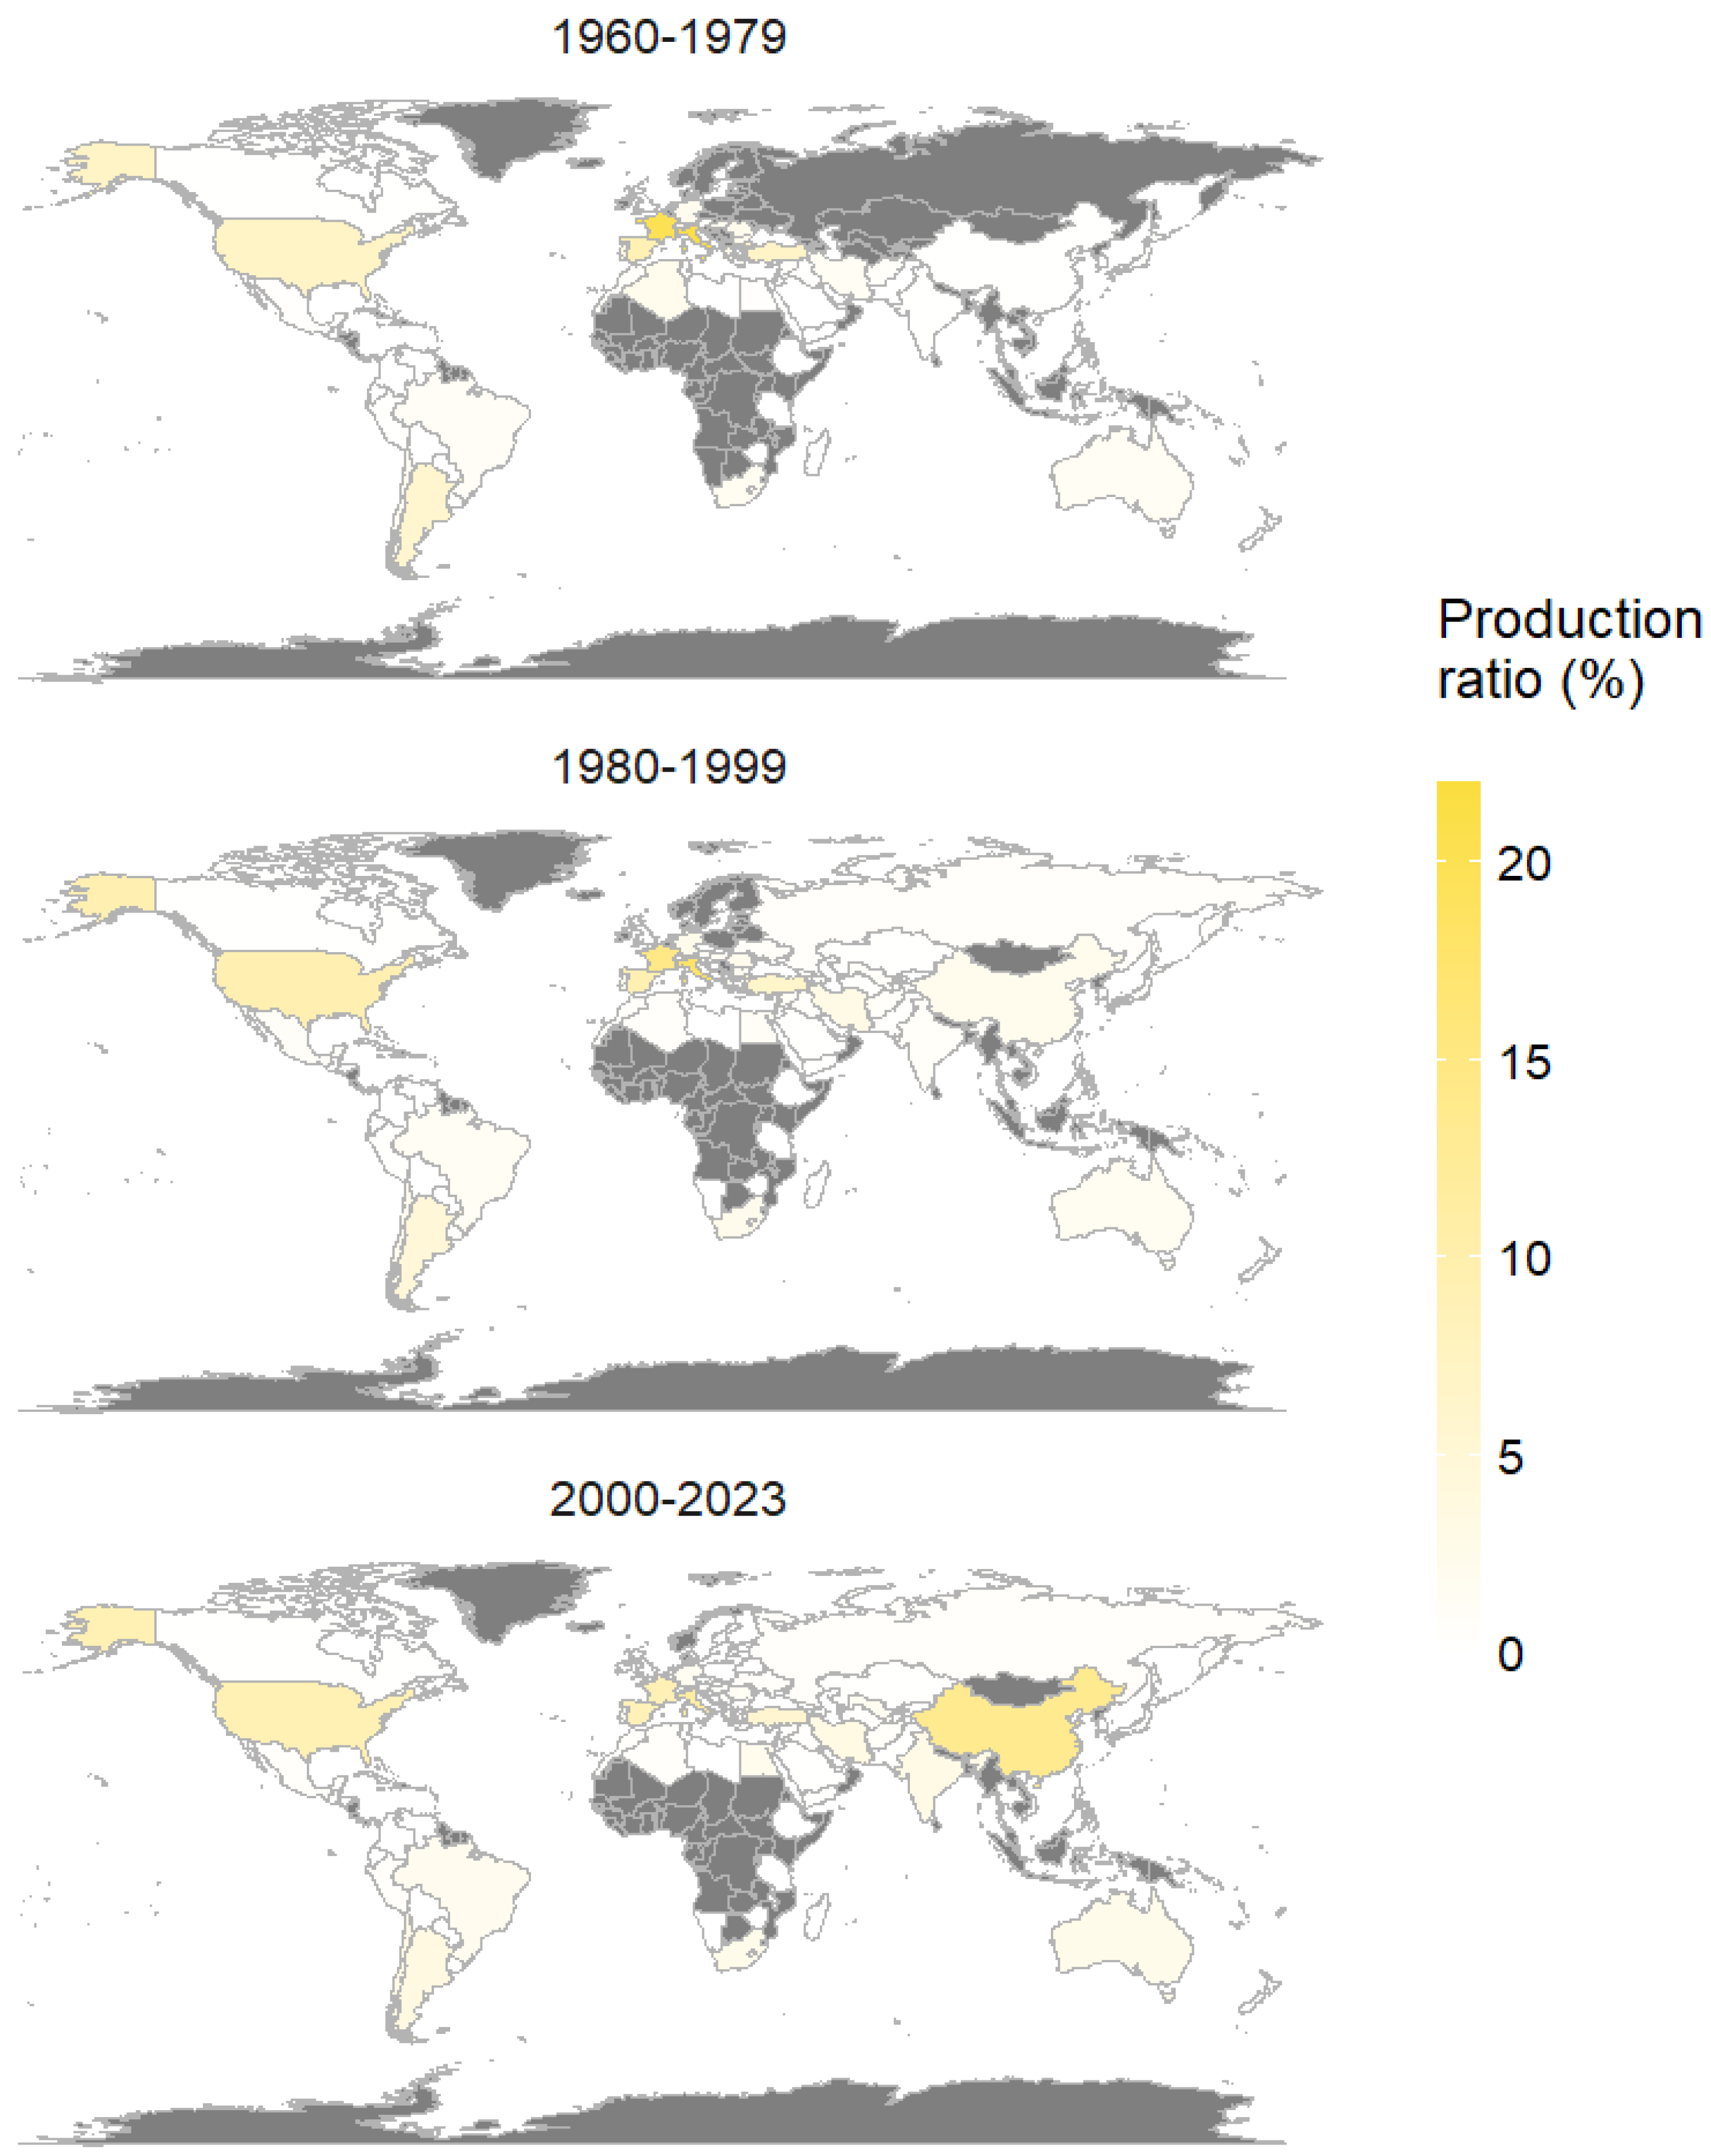
- Production ratio: all production records were summed to achieve global annual production, then the percentage of each country’s production relative to the global total was calculated for each year. Three world maps of averaged values at 20-year intervals are available in Appendix A, Figure A2.
- Area harvested: This indicates the area coverage of fresh-grape cultivation in each country every year, expressed in million hectares. It signifies the amount of land dedicated to vineyards each year. A series of world maps illustrating the logarithmic representation of averaged values every two decades can be found in Appendix A, Figure A3.
- Vineyard to cropland ratio: Derived by comparing harvested area to total cropland area (also obtained from the FAO database). This factor represents the proportion of cropland used for annual grape cultivation in each country. Figure A4 in Appendix A presents a series of world maps showing the logarithmic distribution of 20-year average values.
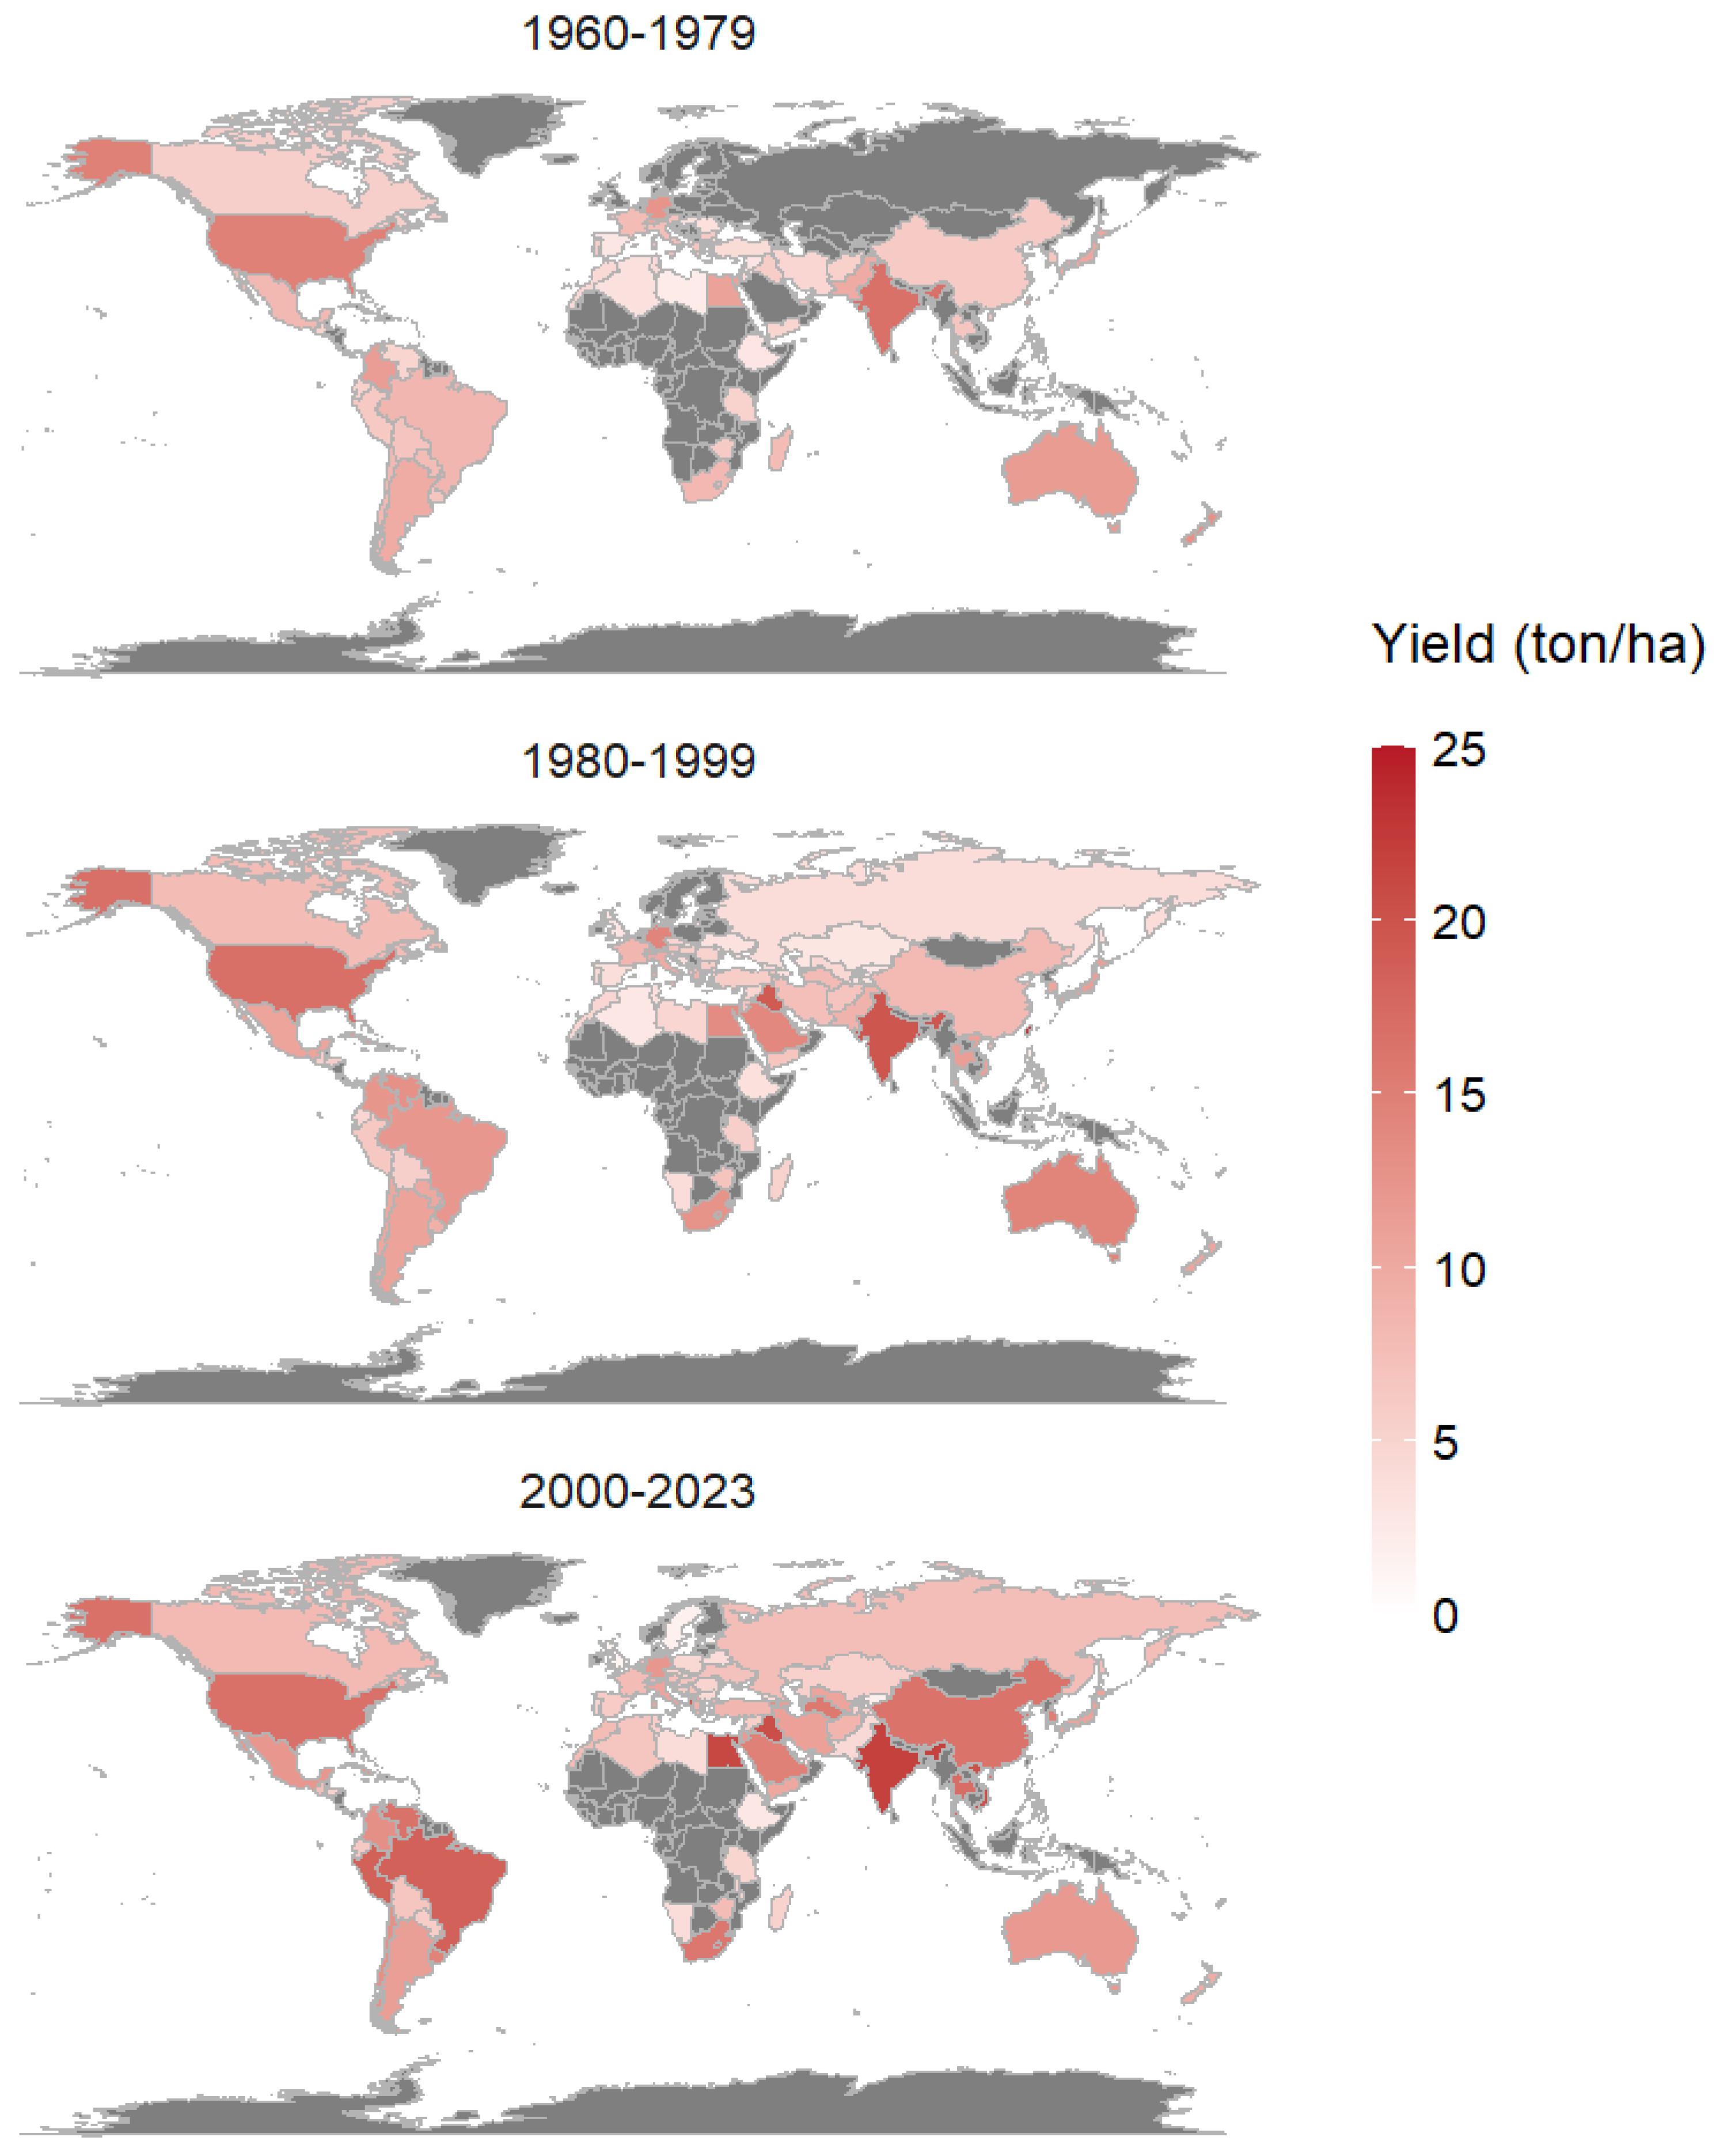
- Yield: this factor reflects the weight of fresh grapes produced per unit of land, represented in tons per hectare. It indicates the efficiency of vineyard land use, with higher yields signifying better land utilization. The spatial distribution of 20-year average values is shown in the world maps available in Appendix A, Figure A5.
- Temperature change: This variable represents the deviation in temperature (°C) from a baseline climatology computed for the period 1951–1980. Data were acquired from the FAO database, and the temperature change was calculated relative to this baseline. Mean 20-year maps illustrating these changes are presented in Appendix A, Figure A6.
- Temperature: Mean temperature values (°C) for each country were obtained from the World Bank Group portal (https://climateknowledgeportal.worldbank.org/download-data, accessed on 8 March 2025). These values were derived from the CMIP6 climate model [40] at a spatial resolution of 0.25 degrees.
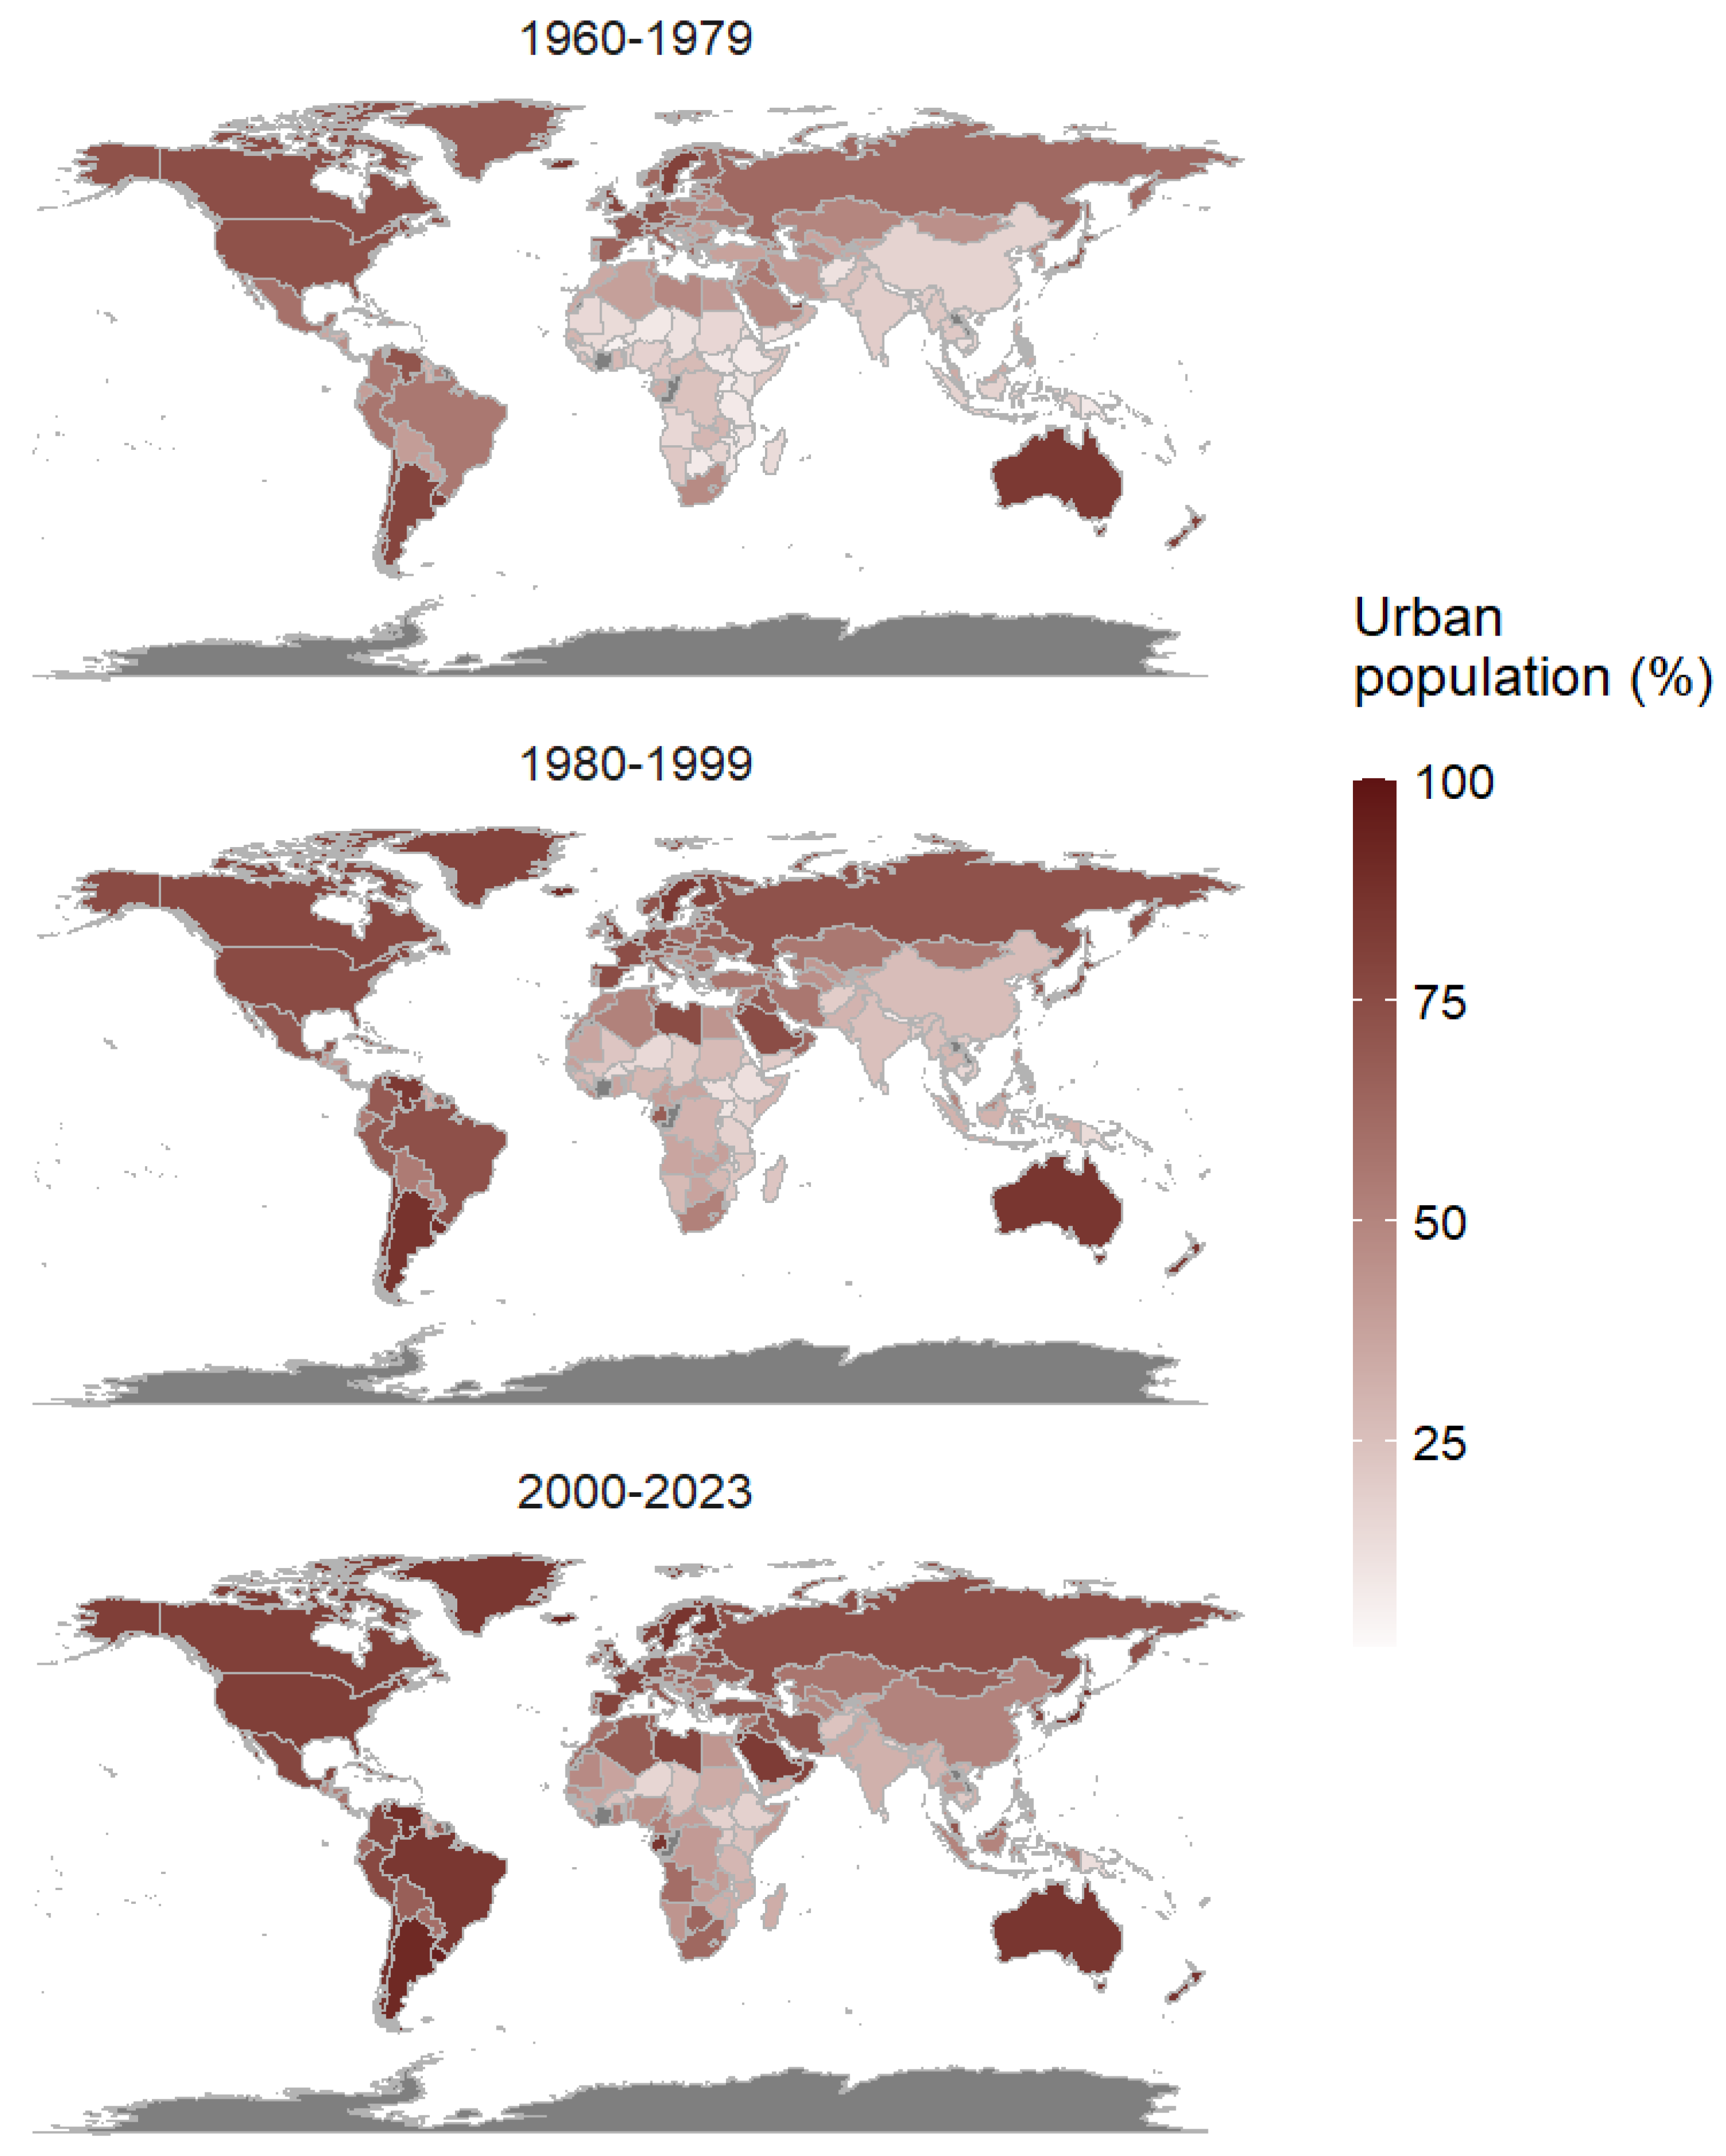
- Urban population: reflects the annual percentage of each country’s population living in urban areas. Data were acquired from the World Bank Group portal (https://climateknowledgeportal.worldbank.org/download-data, accessed on 8 March 2025). Average 20-year maps for urban population percentages are presented in Appendix A, Figure A7.
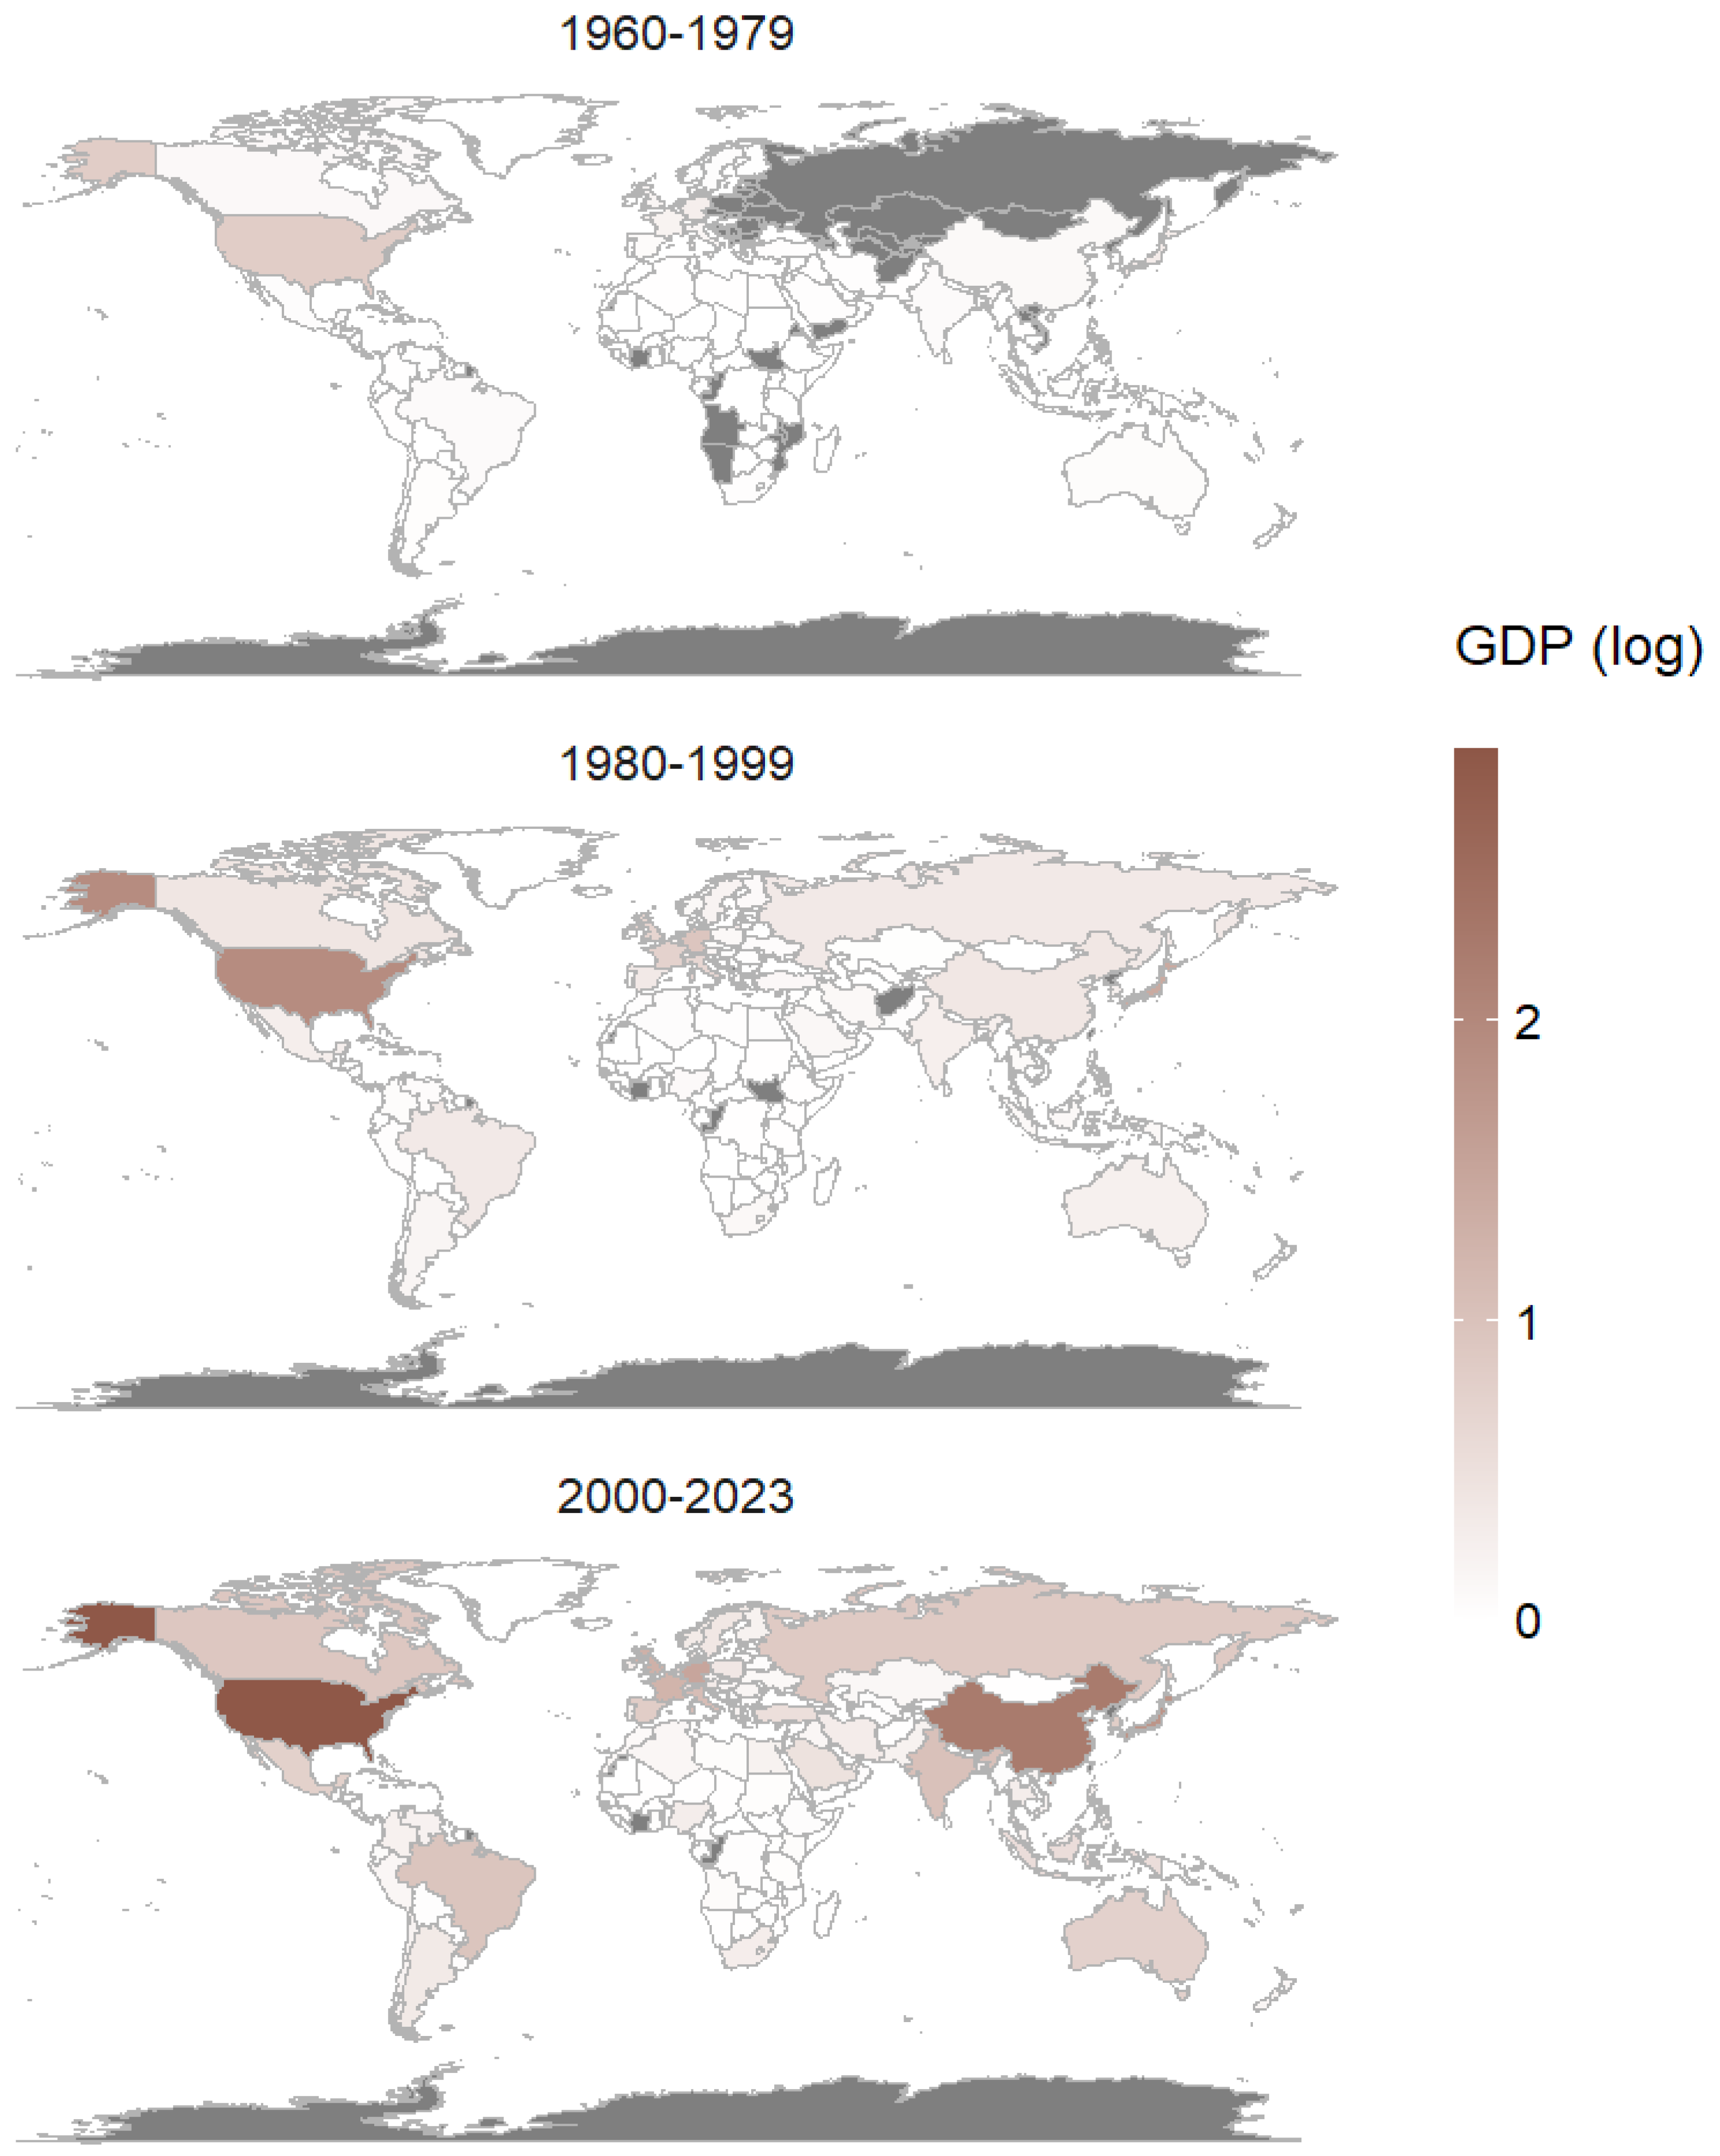
- Gross Domestic Product (GDP): This represents the total monetary value of all the goods and services produced within a country, serving as an indicator of economic activity and national wealth. The data were acquired from the World Bank Group portal (https://climateknowledgeportal.worldbank.org/download-data, accessed on 6 September 2025) and are given in current US dollars. Three maps averaging every two decades of long-transformed GDP are available in Appendix A, Figure A8.
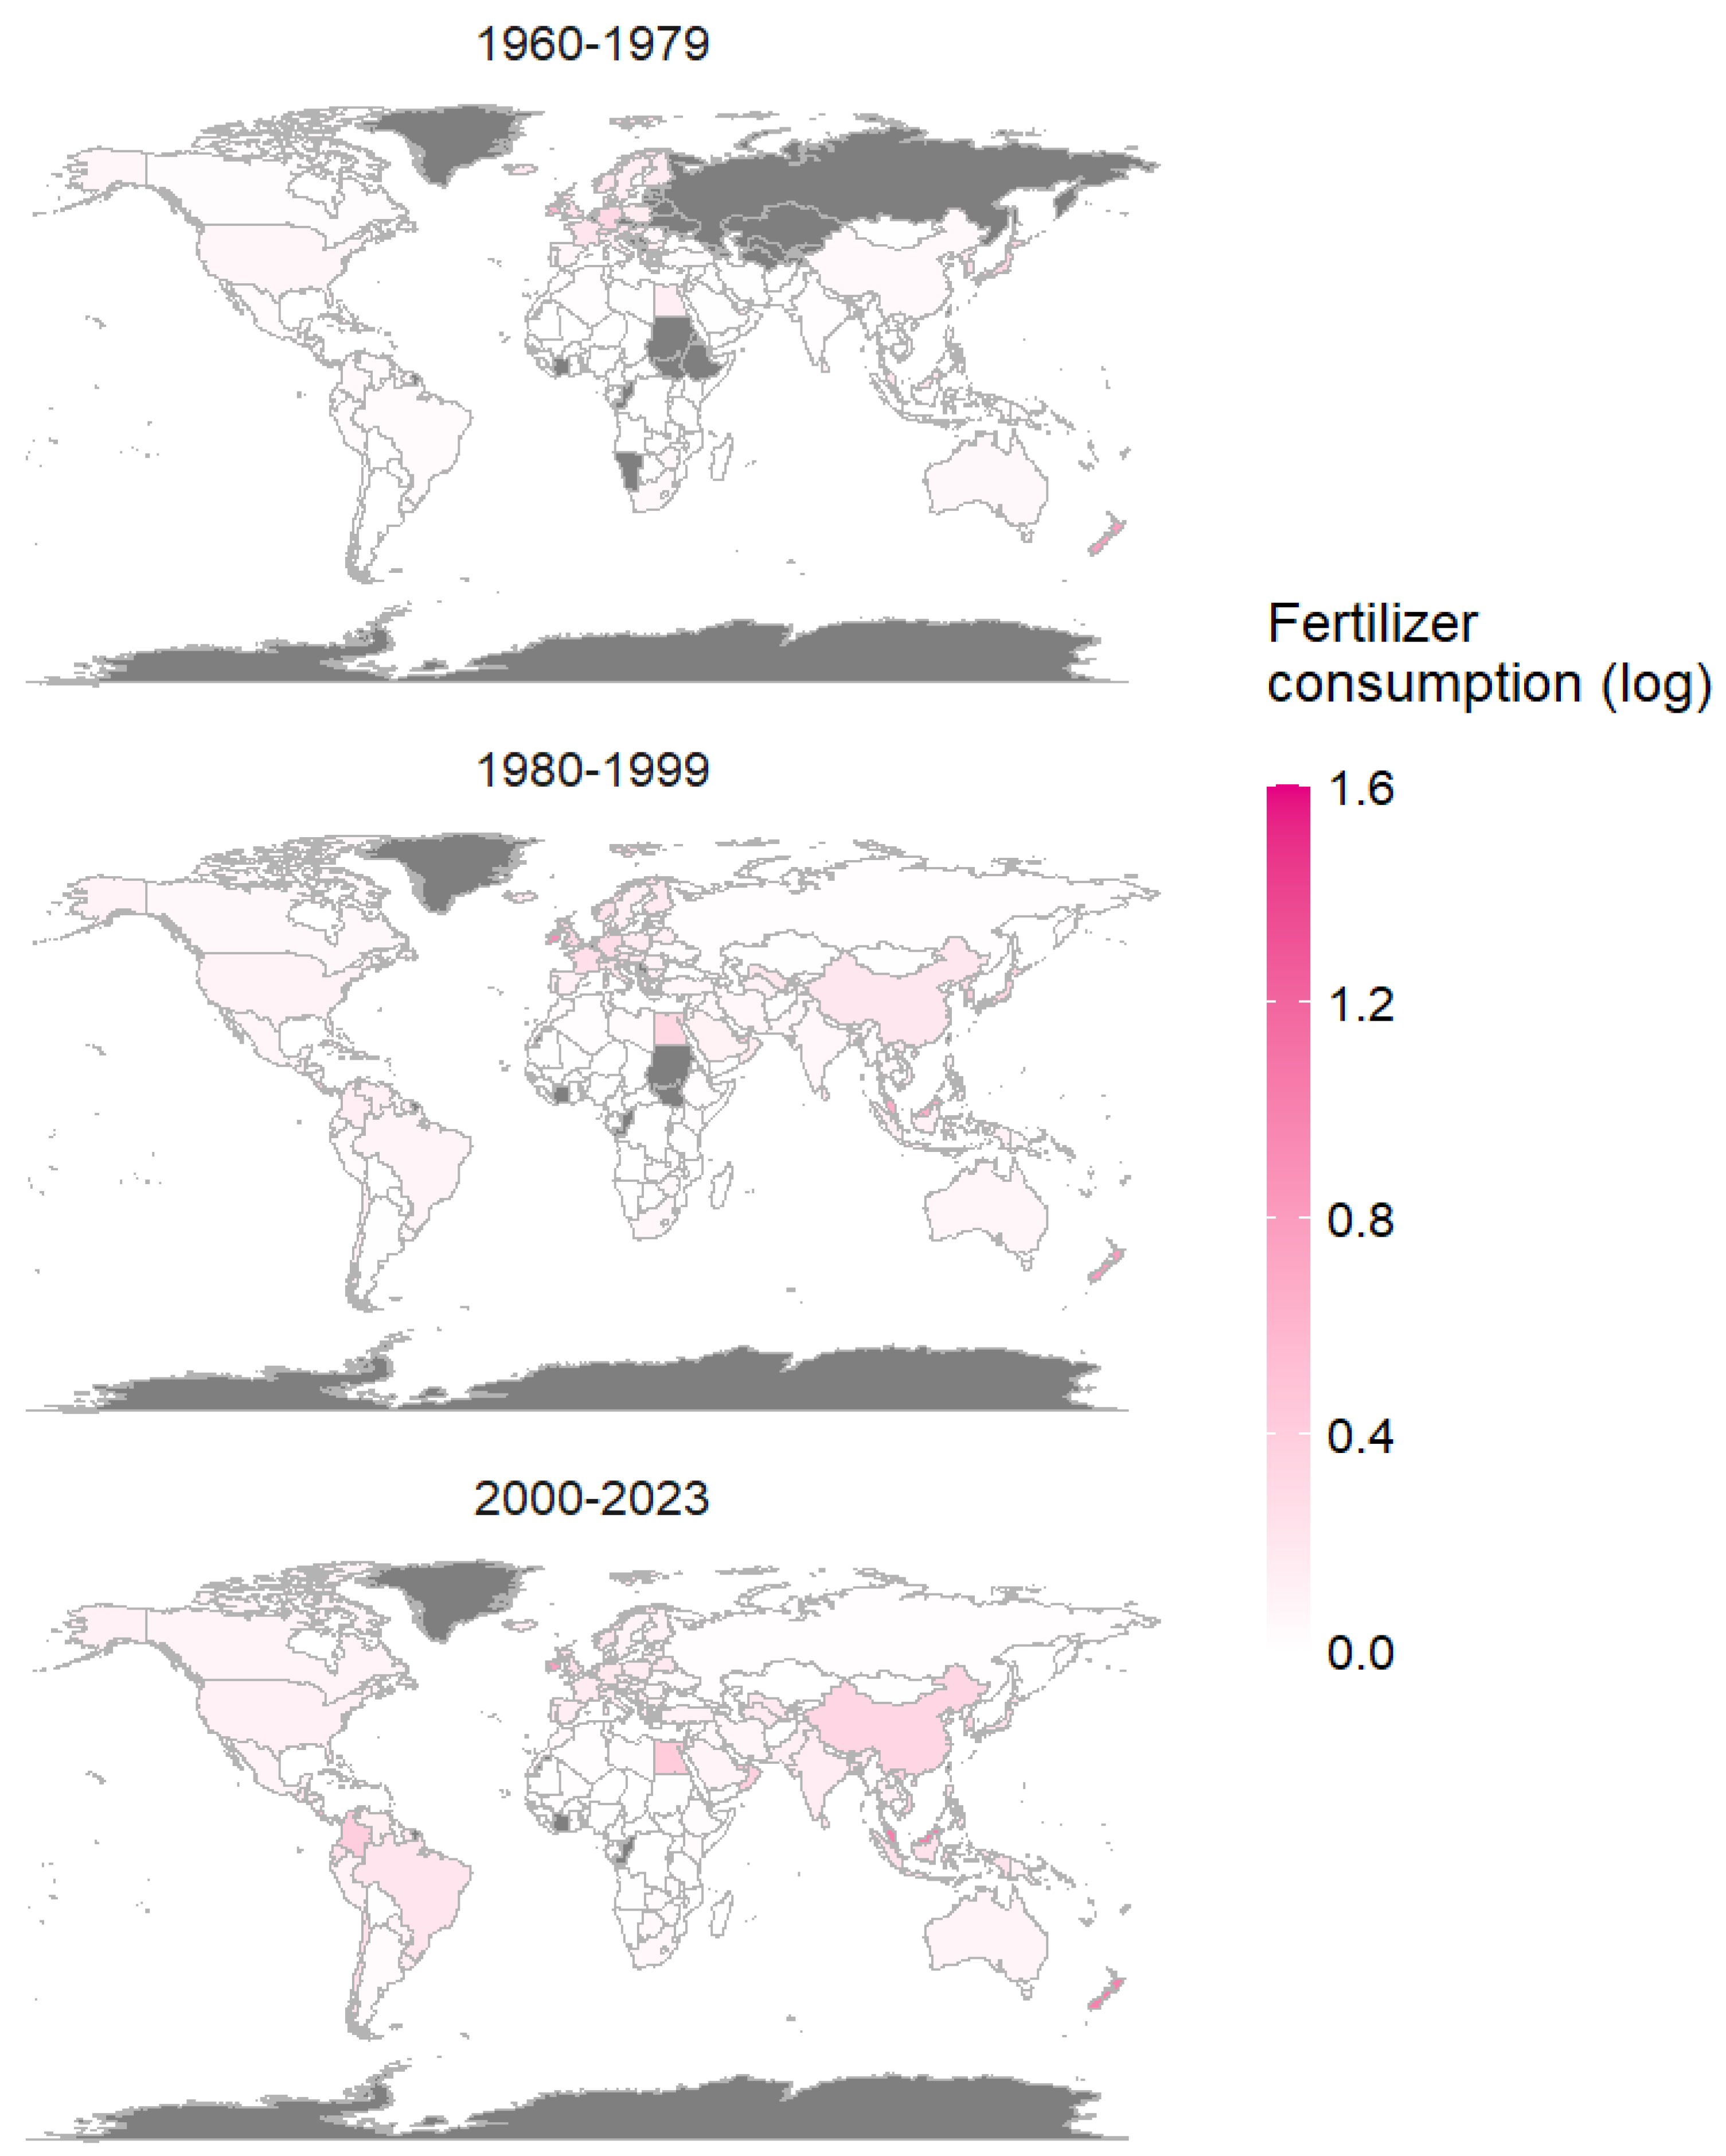
- Fertilizer consumption: This measures the average intensity of fertilizer use across arable land. It is calculated by dividing the total annual fertilizer consumption by hectares of arable land and is provided in kg/ha per arable land. Fertilizer data at the country scale were acquired from the World Bank Group portal (https://climateknowledgeportal.worldbank.org/download-data, accessed on 6 September 2025). A visual representation of 20-year means is available as maps in Appendix A, Figure A9.
2.2. Long-Term Trends of Area Harvested and Production Factors
2.3. Factors Affecting Area Harvested—Rank and Patterns
- -
- Pearson’s correlation coefficient (r): This statistic measures the strength and direction of the linear association between the model’s predictions and the corresponding actual values. A higher absolute value of r indicates a stronger linear relationship.
- -
- Paired t-test (t): This test was used to test a statistically significant difference between the mean of the predicted vs. actual values of Area harvested within the test set.
- -
- Kolmogorov–Smirnov statistic (D): This metric was used to compare the cumulative distribution functions of the predicted and observed Area harvested values in the test set, assessing whether the two distributions are statistically distinct.
- -
- Mean absolute error (MAE): The average absolute difference between actual and estimated Area harvested values. To facilitate interpretation, the MAE was normalized to the range of the actual values in the test set, expressing the error in percent. The MAE calculation was performed using the ‘Metrics’ library in R [54].
2.4. Temporal Global Variations in Area Harvested and Production Factors
3. Results
3.1. Long-Term Trends of Area Harvested and Production Factors
3.2. Factors Affecting the Area Harvested—Rank and Patterns
3.3. Temporal Global Variations in Production and Area Harvested Factors
4. Discussion
4.1. Long-Term Reallocation of Vineyard Area
4.2. Decoupling of Production from Land Use
4.3. Intensification and Technological Gains
4.4. Polarization and Convergence Among Countries
5. Summary and Conclusions
Author Contributions
Funding
Data Availability Statement
Acknowledgments
Conflicts of Interest
Abbreviations
| FAO | Food and Agriculture Organization |
| MK | Mann–Kendall |
| RF | Random Forest |
| PDP | Partial Dependence Plots |
| MAE | Mean Absolute Error |
| CCF | Cross-Correlation Function |
| CV | Coefficient of Variation |
Appendix A



Appendix B
| Country | Area Harvested | Production | Production Ratio | Vineyard to Cropland Ratio | Yield |
| Afghanistan | 1.87 | 4.37 | 1.49 | 1.55 | 6.68 |
| Albania | −1.49 | 8.29 | 7.01 | −2.5 | 7.37 |
| Algeria | −8.27 | −2.43 | −3.82 | −8.36 | 5.25 |
| Argentina | −3.96 | −2.98 | −7.16 | −9.55 | 2.38 |
| Armenia | −0.92 | 4.04 | 2.61 | −1.02 | 5.11 |
| Australia | 7.32 | 8.34 | 6.95 | 4.92 | 0.2 |
| Austria | −1.84 | −0.85 | −4.25 | 3.16 | 0.46 |
| Azerbaijan | −0.31 | 1.54 | 0.89 | −1.09 | 5.46 |
| Bahrain | 5.13 | 8.26 | 2.33 | 8.54 | −2.06 |
| Bolivia | 6.35 | 6.55 | 3.06 | −4.23 | 1.23 |
| Bosnia and Herzegovina | 1.09 | 5.27 | 4.39 | 1.09 | 5.82 |
| Brazil | 3.93 | 9.61 | 7.97 | −1.77 | 9.62 |
| Bulgaria | −9.89 | −8.87 | −9.56 | −7.75 | −3.01 |
| Canada | 0.4 | 5.29 | 0.87 | 0.11 | 6.01 |
| Chile | 8.46 | 9.06 | 7.49 | 8.42 | 7.62 |
| China | 10.81 | 11.08 | 11.09 | 10.85 | 7.59 |
| Colombia | 7.81 | 7.91 | 6.71 | 8.58 | 1.93 |
| Croatia | −5.43 | −5.3 | −5.95 | −5.23 | −4.23 |
| Cyprus | −9.75 | −6.39 | −7.15 | −5.3 | −0.56 |
| Czech Republic | 5.61 | 3.5 | 0.82 | 6.42 | −0.24 |
| Ecuador | −2.77 | 1.36 | −1.73 | −2.42 | 3.87 |
| Egypt | 10.86 | 10.44 | 9.76 | 9.06 | 7.5 |
| Ethiopia | 8.28 | 7.13 | 4.48 | 7.95 | −2.64 |
| France | −10.94 | −7.62 | −9.61 | −10.63 | −0.51 |
| Georgia | −0.79 | −1.15 | −2.29 | 4.76 | −1.88 |
| Germany | 8.43 | 2.21 | −1.74 | 8.24 | −0.64 |
| Greece | −9.31 | −5.41 | −7.83 | −8.65 | 5.09 |
| Guatemala | 11.03 | 11.11 | 10.2 | 9.26 | 7.91 |
| Honduras | 6.79 | 6.79 | −2.21 | 6.27 | −6.34 |
| Hungary | −10.91 | −5.58 | −7.41 | −10.57 | 7.05 |
| India | 11.03 | 10.85 | 10.59 | 10.9 | 5.49 |
| Iran | 4.85 | 7.86 | 5.74 | 3.74 | 10.32 |
| Iraq | −4.2 | 2.53 | 1.4 | −4.68 | 4.84 |
| Israel | −1.42 | 0.88 | −2.7 | −1.7 | 2.05 |
| Italy | −10.17 | −6.55 | −9.24 | −8.39 | 7.16 |
| Japan | −7.02 | −5.56 | −7.12 | −4.02 | 1.22 |
| Jordan | −4.44 | 2.05 | 0.26 | −4.35 | 6.94 |
| Kazakhstan | 0.18 | 4.46 | 3.62 | 1.94 | 4.43 |
| Kuwait | 0.88 | 6.25 | 5.86 | −0.93 | 8.08 |
| Kyrgyzstan | −5.24 | −4.36 | −4.98 | −4.39 | −3.49 |
| Lebanon | −5.63 | −1.2 | −3.53 | −4.95 | 7.3 |
| Libya | 8.76 | 6.4 | 4.22 | 8.5 | 3.39 |
| Madagascar | 10.14 | 9.93 | 3.91 | 9.18 | −3.27 |
| Malta | −0.87 | −0.78 | −3.68 | 1.91 | −1 |
| Mexico | 1.4 | 3.04 | 1.6 | 0.24 | 8.02 |
| Moldova | −7.22 | −1.38 | −2.94 | −5.54 | 2.19 |
| Morocco | −8.43 | 3.54 | −0.89 | −8.55 | 6.97 |
| Netherlands | −2.11 | −5.28 | −5.79 | −3.18 | −6.85 |
| New Zealand | 10.59 | 10.52 | 10.2 | 10.11 | −2.27 |
| North Macedonia | −4.09 | 2.12 | −1.83 | 3.16 | 3.81 |
| Pakistan | 9.96 | 8.98 | 7.49 | 9.38 | −4.98 |
| Paraguay | −6.54 | −5.25 | −6.35 | −10.23 | −2.66 |
| Peru | 7.73 | 7.34 | 6.7 | 0.56 | 6.56 |
| Philippines | 6.85 | 4 | 3.6 | 6.18 | −2.23 |
| Portugal | −6.61 | −6.14 | −8.07 | 8.16 | −2.29 |
| Qatar | 0.33 | −0.89 | −1.1 | −1.04 | −4.25 |
| Reunion | 0.75 | −2.56 | −3.88 | 5.68 | −3.35 |
| Romania | −9.09 | −2.35 | −5.8 | −7.91 | 4.18 |
| Russia | −0.58 | 4.01 | 3 | −0.87 | 6.02 |
| Saudi Arabia | 5.87 | 6.92 | 5.11 | 3.79 | −3.69 |
| Slovakia | −6.66 | −4.83 | −5.88 | −6.53 | 3.81 |
| Slovenia | −6.86 | −3.32 | −5.53 | −4.96 | −1.67 |
| South Africa | 6.6 | 10.18 | 8.29 | 5.08 | 9.05 |
| South Korea | 5.14 | 6.8 | 5.77 | 6.5 | 7.72 |
| Spain | −9.11 | 4.32 | −2.29 | −7.91 | 8.43 |
| Switzerland | 6.04 | −1.22 | −5.15 | 7.05 | −3.96 |
| Syria | −5.11 | 0.38 | −2.04 | −3.63 | 6.69 |
| Taiwan | 2.89 | 5.56 | 3.97 | 3.71 | 7.88 |
| Tajikistan | 4.06 | 5.95 | 5.53 | 0.85 | 5.69 |
| Tanzania | 6.92 | 6.53 | 5.18 | 5.22 | 2.08 |
| Thailand | 9.91 | 10.69 | 9.66 | 9.21 | 9.13 |
| Tunisia | −9.4 | −0.26 | −4.9 | −9.43 | 4.79 |
| Turkey | −10.19 | 5.46 | −5.84 | −10.33 | 9.95 |
| Turkmenistan | 1.85 | 6.5 | 4.69 | −0.07 | 4.56 |
| Ukraine | −7.83 | −1.93 | −3.84 | −7.68 | 5.63 |
| United Arab Emirates | 2.43 | 0.11 | −0.33 | −0.87 | −2.23 |
| United Kingdom | 4.15 | 3.01 | 2.86 | 4.65 | −6.92 |
| Uruguay | −9.26 | −3.28 | −6.76 | −6.79 | 7.88 |
| USA | 8.73 | 8.15 | 3.72 | 9.68 | 2.3 |
| Uzbekistan | 5.34 | 6.7 | 6.37 | 5.81 | 6.37 |
| Venezuela | 8.85 | 10.31 | 9.18 | 8.97 | 7.33 |
| Yemen | 4.84 | 7.67 | 5.55 | 5.09 | 7.64 |
| Zimbabwe | 10.28 | 10.26 | 8.42 | 4.32 | 8.42 |
References
- Rafique, R.; Ahmad, T.; Kalsoom, T.; Khan, M.A.; Ahmed, M. Climatic Challenge for Global Viticulture and Adaptation Strategies. In Global Agricultural Production: Resilience to Climate Change; Springer: Cham, Switzerland, 2022; pp. 611–634. [Google Scholar] [CrossRef]
- Alston, J.M.; Sambucci, O. Grapes in the World Economy. In The Grape Genome; Springer: Cham, Switzerland, 2019; pp. 1–24. [Google Scholar] [CrossRef]
- Ohana-Levi, N.; Netzer, Y. Long-Term Trends of Global Wine Market. Agriculture 2023, 13, 224. [Google Scholar] [CrossRef]
- Pisciotta, A.; Barone, E.; Di Lorenzo, R. Table-Grape Cultivation in Soil-Less Systems: A Review. Horticulturae 2022, 8, 553. [Google Scholar] [CrossRef]
- Fraga, H.; Freitas, T.R.; Fonseca, A.; Fernandes, A.; Santos, J.A. Climate change implications on the viticulture geography. Adv. Bot. Res. 2024, 110, 27–69. [Google Scholar] [CrossRef]
- Banks, G.; Overton, J. Old World, New World, Third World? Reconceptualising the Worlds of Wine. J. Wine Res. 2010, 21, 57–75. [Google Scholar] [CrossRef]
- Mariani, A.; Pomarici, E.; Boatto, V. The international wine trade: Recent trends and critical issues. Wine Econ. Policy 2012, 1, 24–40. [Google Scholar] [CrossRef]
- Mariani, A.; Pomarici, E. Barriers to Wine trade. In The Palgrave Handbook of Wine Industry Economics; Palgrave Macmillan: London, UK, 2019; pp. 291–315. [Google Scholar] [CrossRef]
- Ruiz del Castillo, M.L. Table grapes: Health implications and approaches to improve the quality during the cultivation. Adv. Bot. Res. 2025, 113, 179–210. [Google Scholar] [CrossRef]
- Chang, J.; Jiang, H. Spatio-Temporal Differentiations and Influence Factors in China’s Grain Supply Chain Resilience. Sustainability 2023, 15, 8074. [Google Scholar] [CrossRef]
- Han, Y.; Goetz, S.J.; Schmidt, C. Visualizing Spatial Economic Supply Chains to Enhance Sustainability and Resilience. Sustainability 2021, 13, 1512. [Google Scholar] [CrossRef]
- Sweeney, S.; Steigerwald, D.G.; Davenport, F.; Eakin, H. Mexican maize production: Evolving organizational and spatial structures since 1980. Appl. Geogr. 2013, 39, 78–92. [Google Scholar] [CrossRef]
- van Leeuwen, C.; Sgubin, G.; Bois, B.; Ollat, N.; Swingedouw, D.; Zito, S.; Gambetta, G.A. Climate change impacts and adaptations of wine production. Nat. Rev. Earth Environ. 2024, 5, 258–275. [Google Scholar] [CrossRef]
- Naulleau, A.; Gary, C.; Prévot, L.; Hossard, L. Evaluating Strategies for Adaptation to Climate Change in Grapevine Production–A Systematic Review. Front. Plant Sci. 2021, 11, 607859. [Google Scholar] [CrossRef] [PubMed]
- van Leeuwen, C.; Destrac-Irvine, A.; Dubernet, M.; Duchêne, E.; Gowdy, M.; Marguerit, E.; Pieri, P.; Parker, A.; de Rességuier, L.; Ollat, N. An Update on the Impact of Climate Change in Viticulture and Potential Adaptations. Agronomy 2019, 9, 514. [Google Scholar] [CrossRef]
- Sgubin, G.; Swingedouw, D.; Mignot, J.; Gambetta, G.A.; Bois, B.; Loukos, H.; Noël, T.; Pieri, P.; de Cortázar-Atauri, I.G.; Ollat, N.; et al. Non-linear loss of suitable wine regions over Europe in response to increasing global warming. Glob. Change Biol. 2023, 29, 808–826. [Google Scholar] [CrossRef]
- Wang, S.; Deng, O.; Reis, S.; Zhu, Y.-G.; Xu, J.; Gu, B. Global urbanization benefits food security and nature restoration. Resour. Conserv. Recycl. 2025, 216, 108174. [Google Scholar] [CrossRef]
- Ohana-Levi, N.; Givati, A.; Alfasi, N.; Peeters, A.; Karnieli, A. Predicting the effects of urbanization on runoff after frequent rainfall events. J. Land Use Sci. 2017, 13, 81–101. [Google Scholar] [CrossRef]
- Jackson, L.; Haden, V.R.; Wheeler, S.M.; Hollander, A.D.; Perlman, J.; O’Green, T.; Mehta, V.K.; Clark, V.; Williams, J. Vulnerability and Adaptation to Climate Change in California Agriculture. Davis, California. 2012. Available online: https://escholarship.org/uc/item/1bs0h6pk (accessed on 22 April 2025).
- Di Chiara, V.; Battistella, A.; Boatto, V.; Furlan, S.; Giavi, L.; Liggieri, S.; Paiola, A.; Pomarici, E.; Stefanucci, S. Collaborative Approach for Achieving Ambitious Sustainability Goals: The Prosecco Sustainability Project. Sustainability 2024, 16, 583. [Google Scholar] [CrossRef]
- Sánchez-Hernández, J.L.; Aparicio-Amador, J.; Alonso-Santos, J.L. The shift between worlds of production as an innovative process in the wine industry in Castile and Leon (Spain). Geoforum 2010, 41, 469–478. [Google Scholar] [CrossRef]
- Ferro, M.V.; Catania, P. Technologies and Innovative Methods for Precision Viticulture: A Comprehensive Review. Horticulturae 2023, 9, 399. [Google Scholar] [CrossRef]
- Ohana-Levi, N.; Knipper, K.; Kustas, W.P.; Anderson, M.C.; Netzer, Y.; Gao, F.; Alsina, M.d.M.; Sanchez, L.A.; Karnieli, A. Using satellite thermal-based evapotranspiration time series for defining management zones and spatial association to local attributes in a vineyard. Remote Sens. 2020, 12, 2436. [Google Scholar] [CrossRef]
- Cameron, W.; Petrie, P.R.; Bonada, M. Effects of Vineyard Management Practices on Winegrape Yield Components. A Review Using Meta-analysis. Am. J. Enol. Vitic. 2024, 75, 0750007. [Google Scholar] [CrossRef]
- Arrobas, M.; Ferreira, I.Q.; Freitas, S.; Verdial, J.; Rodrigues, M.Â. Guidelines for fertilizer use in vineyards based on nutrient content of grapevine parts. Sci. Hortic. 2014, 172, 191–198. [Google Scholar] [CrossRef]
- Netzer, Y.; Suued, Y.; Harel, M.; Ferman-Mintz, D.; Drori, E.; Munitz, S.; Stanevsky, M.; Grünzweig, J.M.; Fait, A.; Ohana-Levi, N.; et al. Forever Young? Late Shoot Pruning Affects Phenological Development, Physiology, Yield and Wine Quality of Vitis vinifera cv. Malbec. Agriculture 2022, 12, 605. [Google Scholar] [CrossRef]
- Romero, P.; Navarro, J.M.; Ordaz, P.B. Towards a sustainable viticulture: The combination of deficit irrigation strategies and agroecological practices in Mediterranean vineyards. A review and update. Agric. Water Manag. 2022, 259, 107216. [Google Scholar] [CrossRef]
- Peeters, A.; Cohen, Y.; Bahat, I.; Ohana-Levi, N.; Goldshtein, E.; Netzer, Y.; Tenreiro, T.R.; Alchanatis, V.; Ben-Gal, A. A spatial machine-learning model for predicting crop water stress index for precision irrigation of vineyards. Comput. Electron. Agric. 2024, 227, 109578. [Google Scholar] [CrossRef]
- Paschen, J.; Wilson, M.; Nehajowich, J.; Prpić, J. Fine wine through time: A review of the Journal of Wine Research. J. Wine Res. 2016, 27, 91–104. [Google Scholar] [CrossRef]
- Aleixandre, J.L.; Aleixandre-Tudó, J.L.; Bolaños-Pizarro, M.; Aleixandre-Benavent, R. Viticulture and oenology scientific research: The Old World versus the New World wine-producing countries. Int. J. Inf. Manag. 2016, 36, 389–396. [Google Scholar] [CrossRef]
- Jamali, H.R.; Steel, C.C.; Mohammadi, E. Wine research and its relationship with wine production: A scientometric analysis of global trends. Aust. J. Grape Wine Res. 2020, 26, 130–138. [Google Scholar] [CrossRef]
- Holland, T.; Smit, B. Climate Change and the Wine Industry: Current Research Themes and New Directions. J. Wine Res. 2010, 21, 125–136. [Google Scholar] [CrossRef]
- Ollat, N.; Touzard, J.-M.; van Leeuwen, C. Climate Change Impacts and Adaptations: New Challenges for the Wine Industry. J. Wine Econ. 2016, 11, 139–149. [Google Scholar] [CrossRef]
- Fraga, H.; Malheiro, A.C.; Moutinho-Pereira, J.; Santos, J.A. An overview of climate change impacts on European viticulture. Food Energy Secur. 2012, 1, 94–110. [Google Scholar] [CrossRef]
- Alba, V.; Russi, A.; Caputo, A.R.; Gentilesco, G. Climate Change and Viticulture in Italy: Historical Trends and Future Scenarios. Atmosphere 2024, 15, 885. [Google Scholar] [CrossRef]
- Parker, L.E.; Zhang, N.; Abatzoglou, J.T.; Kisekka, I.; McElrone, A.J.; Ostoja, S.M. A variety-specific analysis of climate change effects on California winegrapes. Int. J. Biometeorol. 2024, 68, 1559–1571. [Google Scholar] [CrossRef]
- Seccia, A.; Santeramo, F.G.; Nardone, G. Trade Competitiveness in Table Grapes: A Global View. Outlook Agric. 2015, 44, 127–134. [Google Scholar] [CrossRef]
- Cholette, S.; Castaldi, R.M.; Frederick, A. The globalization of the wine industry: Implications for old and new world producers. In Proceedings of the Fourth International Business and Economy Conference Proceedings, Honolulu, HI, USA, 6–9 January 2005. [Google Scholar]
- Anderson, K.; Norman, D.; Wittwer, G. Globalisation of the world’s wine markets. World Econ. 2003, 26, 659–687. [Google Scholar] [CrossRef]
- Eyring, V.; Bony, S.; Meehl, G.A.; Senior, C.A.; Stevens, B.; Stouffer, R.J.; Taylor, K.E. Overview of the Coupled Model Intercomparison Project Phase 6 (CMIP6) experimental design and organization. Geosci. Model Dev. 2016, 9, 1937–1958. [Google Scholar] [CrossRef]
- Mann, H.B. Nonparametric Tests Against Trend. Econometrica 1945, 13, 245. [Google Scholar] [CrossRef]
- Das, S. Profitability Trend Analysis—An Empirical Study on the FMCG Sector of India. J. Supply Chain. Manag. Syst. 2022, 11, 14–23. Available online: http://publishingindia.com/jscms/41/profitability-trend-analysis-an-empirical-study-on-the-fmcg-sector-of-india/32000/76715/ (accessed on 27 March 2025).
- Simhayov, R.; Ohana-Levi, N.; Shenker, M.; Netzer, Y. Effect of long-term treated wastewater irrigation on soil sodium levels and table grapevines’ health. Agric. Water Manag. 2023, 275, 108002. [Google Scholar] [CrossRef]
- Tong, L.; Kang, S.; Zhang, L. Temporal and spatial variations of evapotranspiration for spring wheat in the Shiyang river basin in northwest China. Agric. Water Manag. 2007, 87, 241–250. [Google Scholar] [CrossRef]
- Noy, K.; Ohana-Levi, N.; Panov, N.; Silver, M.; Karnieli, A. A long-term spatiotemporal analysis of biocrusts across a diverse arid environment: The case of the Israeli-Egyptian sandfield. Sci. Total Environ. 2021, 774, 145154. [Google Scholar] [CrossRef] [PubMed]
- Yadav, R.; Tripathi, S.K.; Pranuthi, G.; Dubey, S.K. Trend analysis by Mann-Kendall test for precipitation and temperature for thirteen districts of Uttarakhand. J. Agrometeorol. 2014, 16, 164–171. [Google Scholar] [CrossRef]
- Jiqin, H.; Gelata, F.T.; Gemeda, S.C. Application of MK trend and test of Sen’s slope estimator to measure impact of climate change on the adoption of conservation agriculture in Ethiopia. J. Water Clim. Change 2023, 14, 977–988. [Google Scholar] [CrossRef]
- Pohlert, T. Trend: Non-Parametric Trend Tests and Change-Point Detection. R Package Version 1.1.6. 2023. Available online: https://cran.r-project.org/package=trend (accessed on 17 September 2025).
- Breiman, L. Random forests. Mach. Learn. 2001, 45, 5–32. [Google Scholar] [CrossRef]
- Mitra, M.; Roy, S. Comparative Analysis of Predictive Models for Carbon Emission in Major Countries: A Focus on Linear Regression and Random Forest. Int. J. Sci. Res. (IJSR) 2017, 6, 2295–2302. [Google Scholar] [CrossRef]
- Wu, X.; Denise, B.B.; Zhan, F.B.; Zhang, J. Determining Association between Lung Cancer Mortality Worldwide and Risk Factors Using Fuzzy Inference Modeling and Random Forest Modeling. Int. J. Environ. Res. Public Health 2022, 19, 14161. [Google Scholar] [CrossRef] [PubMed]
- Wright, M.N.; Ziegler, A. ranger: A Fast Implementation of Random Forests for High Dimensional Data in C++ and R. J. Stat. Softw. 2017, 77, 1–17. [Google Scholar] [CrossRef]
- Greenwell, B.M. pdp: An R package for constructing partial dependence plots. R J. 2017, 9, 421–436. [Google Scholar] [CrossRef]
- Hamner, B.; Frasco, M.; Ledell, E. Package ‘Metrics’—Evaluation Metrics for Machine Learning. 2018. Available online: https://cran.r-project.org/web/packages/Metrics/Metrics.pdf (accessed on 30 April 2019).
- Usoro, A.E. Some basic properties of cross-correlation functions of n-dimensional vector time series. J. Stat. Econom. Methods 2015, 4, 63–71. [Google Scholar]
- Cao, G.; Cao, J.; Xu, L.; He, L. Detrended cross-correlation analysis approach for assessing asymmetric multifractal detrended cross-correlations and their application to the Chinese financial market. Phys. A Stat. Mech. Its Appl. 2014, 393, 460–469. [Google Scholar] [CrossRef]
- Borysov, S.S.; Balatsky, A.V. Cross-Correlation Asymmetries and Causal Relationships between Stock and Market Risk. PLoS ONE 2014, 9, e105874. [Google Scholar] [CrossRef]
- Martin, J.; Aburto, J.M.; Permanyer, I. Dynamics of the coefficient of variation of the age at death distribution. Demogr. Res. 2023, 49, 1063–1086. [Google Scholar] [CrossRef]
- Evans, P. Using cross-country variances to evaluate growth theories. J. Econ. Dyn. Control 1996, 20, 1027–1049. [Google Scholar] [CrossRef]
- R Core Team. R: A Language and Environment for Statistical Computing; R Foundation for Statistical Computing: Vienna, Austria, 2025; Available online: http://www.R-project.org/ (accessed on 17 September 2025).
- Schultz, H.R. Global Climate Change, Sustainability, and Some Challenges for Grape and Wine Production. J. Wine Econ. 2016, 11, 181–200. [Google Scholar] [CrossRef]
- Balogh, J.M.; Jámbor, A. The global competitiveness of European wine producers. Br. Food J. 2017, 119, 2076–2088. [Google Scholar] [CrossRef]
- Meloni, G.; Swinnen, J. The Political and Economic History of Vineyard Planting Rights in Europe: From Montesquieu to the European Union. J. Wine Econ. 2016, 11, 379–413. [Google Scholar] [CrossRef]
- Marie-Noelle, J. Highlights of Romanian and French Wine Markets: The Example of French Champagne Market. Ann. Fac. Econ. 2014, 1, 95–105. Available online: https://ideas.repec.org/a/ora/journl/v2y2014i2p95-105.html (accessed on 11 April 2025).
- Anderson, K.; Pinilla, V. Wine Globalization: A New Comparative History; Cambridge University Press: Cambridge, UK, 2018; pp. 1–546. [Google Scholar] [CrossRef]
- Yu, Z.; Li, Z.; Yang, H.; Wang, Y.; Cui, Y.; Lei, G.; Ye, S. Contrasting responses of spatiotemporal patterns of cropland to climate change in Northeast China. Food Secur. 2023, 15, 1197–1214. [Google Scholar] [CrossRef]
- Yin, F.; Sun, Z.; You, L.; Müller, D. Determinants of changes in harvested area and yields of major crops in China. Food Secur. 2024, 16, 339–351. [Google Scholar] [CrossRef]
- Bhagat, A.A.; Jadhav, D.S. A Study on Growth, Instability and Forecasting of Grape Export from India. J. Sci. Res. 2021, 65, 1–6. [Google Scholar] [CrossRef]
- de C. Teixeira, A.H.; Bastiaanssen, W.G.M.; Bassoi, L.H. Crop water parameters of irrigated wine and table grapes to support water productivity analysis in the São Francisco river basin, Brazil. Agric. Water Manag. 2007, 94, 31–42. [Google Scholar] [CrossRef]
- Fader, M.; Von Bloh, W.; Shi, S.; Bondeau, A.; Cramer, W. Modelling Mediterranean agro-ecosystems by including agricultural trees in the LPJmL model. Geosci. Model Dev. 2015, 8, 3545–3561. [Google Scholar] [CrossRef]
- Tian, D.; Zhao, F.; Mu, W.; Kanianska, R.; Feng, J. Environmental Efficiency of Chinese Open-Field Grape Production: An Evaluation Using Data Envelopment Analysis and Spatial Autocorrelation. Sustainability 2016, 8, 1246. [Google Scholar] [CrossRef]
- Fukase, E.; Martin, W. Economic growth, convergence, and world food demand and supply. World Dev. 2020, 132, 104954. [Google Scholar] [CrossRef]
- Ohana-Levi, N.; Karnieli, A.; Egozi, R.; Givati, A.; Peeters, A. Modeling the Effects of Land-Cover Change on Rainfall-Runoff Relationships in a Semiarid, Eastern Mediterranean Watershed. Adv. Meteorol. 2015, 2015, 838070. [Google Scholar] [CrossRef]
- van Vliet, J.; Eitelberg, D.A.; Verburg, P.H. A global analysis of land take in cropland areas and production displacement from urbanization. Glob. Environ. Change 2017, 43, 107–115. [Google Scholar] [CrossRef]
- Deng, X.; Huang, J.; Rozelle, S.; Zhang, J.; Li, Z. Impact of urbanization on cultivated land changes in China. Land Use Policy 2015, 45, 1–7. [Google Scholar] [CrossRef]
- Zambon, I.; Ferrara, A.; Salvia, R.; Mosconi, E.; Fici, L.; Turco, R.; Salvati, L. Rural Districts between Urbanization and Land Abandonment: Undermining Long-Term Changes in Mediterranean Landscapes. Sustainability 2018, 10, 1159. [Google Scholar] [CrossRef]
- Choithani, C.; CP, A.J.; Rajan, S.I. Rural-urban transition and food security in India. Glob. Food Sec. 2024, 42, 100780. [Google Scholar] [CrossRef]
- Hannah, L.; Roehrdanz, P.R.; Ikegami, M.; Shepard, A.V.; Shaw, M.R.; Tabor, G.; Zhi, L.; Marquet, P.A.; Hijmans, R.J. Climate change, wine, and conservation. Proc. Natl. Acad. Sci. USA 2013, 110, 6907–6912. [Google Scholar] [CrossRef]
- Moriondo, M.; Jones, G.V.; Bois, B.; Dibari, C.; Ferrise, R.; Trombi, G.; Bindi, M. Projected shifts of wine regions in response to climate change. Clim. Change 2013, 119, 825–839. [Google Scholar] [CrossRef]
- Cossart, E.; Pic, J.; Le Guen, Y.; Fressard, M. Spatial Patterns of Vineyard Abandonment and Related Land Use Transitions in Beaujolais (France): A Multiscale Approach. Sustainability 2020, 12, 4695. [Google Scholar] [CrossRef]
- Khan, N.; Fahad, S.; Naushad, M.; Faisal, S. Grape Production Critical Review in the World; Elsevier BV: Amsterdam, The Netherlands, 2020. [Google Scholar] [CrossRef]
- Wang, Z.; Zhou, J.; Xu, X.; Perl, A.; Chen, S.; Ma, H. Adoption of table grape cultivars: An attribute preference study on Chinese grape growers. Sci. Hortic. 2017, 216, 66–75. [Google Scholar] [CrossRef]
- Cramer, W.; Guiot, J.; Fader, M.; Garrabou, J.; Gattuso, J.-P.; Iglesias, A.; Lange, M.A.; Lionello, P.; Llasat, M.C.; Paz, S.; et al. Climate change and interconnected risks to sustainable development in the Mediterranean. Nat. Clim. Change 2018, 8, 972–980. [Google Scholar] [CrossRef]
- Liu, X.; Zhu, P.; Liu, S.; Yu, L.; Wang, Y.; Du, Z.; Peng, D.; Aksoy, E.; Lu, H.; Gong, P. Global cropland expansion enhances cropping potential and reduces its inequality among countries. Earth Syst. Dyn. 2024, 15, 817–828. [Google Scholar] [CrossRef]
- Wegerif, M.C.A.; Guereña, A. Land Inequality Trends and Drivers. Land 2020, 9, 101. [Google Scholar] [CrossRef]
- Poudel, D.; Gopinath, M. Exploring the disparity in global food security indicators. Glob. Food Sec. 2021, 29, 100549. [Google Scholar] [CrossRef]




| Metric | Value |
|---|---|
| Training set | n = 3138 |
| Test set | n = 1345 |
| Pearson correlation | r = 0.99 |
| t-test, p-value, (predicted mean, actual mean) | t = −0.07, p = 0.95 (0.1101 t ha−1, 0.1108 t ha−1) |
| Kolmogorov–Smirnov test | D = 0.053, p = 0.06 |
| Mean absolute error (MAE normalized to the range) | MAE = 0.005 t ha−1 (0.31%) |
| Global Factor | r | p-Value |
|---|---|---|
| Production | 0.91 | p < 0.001 |
| Area harvested | −0.91 | p < 0.001 |
| Vineyard to crop ratio | −0.36 | p = 0.004 |
| Yield | 0.93 | p < 0.001 |
Disclaimer/Publisher’s Note: The statements, opinions and data contained in all publications are solely those of the individual author(s) and contributor(s) and not of MDPI and/or the editor(s). MDPI and/or the editor(s) disclaim responsibility for any injury to people or property resulting from any ideas, methods, instructions or products referred to in the content. |
© 2025 by the authors. Licensee MDPI, Basel, Switzerland. This article is an open access article distributed under the terms and conditions of the Creative Commons Attribution (CC BY) license (https://creativecommons.org/licenses/by/4.0/).
Share and Cite
Ohana-Levi, N.; Netzer, Y. Long-Term Global Trends in Vineyard Coverage and Fresh Grape Production. Agriculture 2025, 15, 1976. https://doi.org/10.3390/agriculture15181976
Ohana-Levi N, Netzer Y. Long-Term Global Trends in Vineyard Coverage and Fresh Grape Production. Agriculture. 2025; 15(18):1976. https://doi.org/10.3390/agriculture15181976
Chicago/Turabian StyleOhana-Levi, Noa, and Yishai Netzer. 2025. "Long-Term Global Trends in Vineyard Coverage and Fresh Grape Production" Agriculture 15, no. 18: 1976. https://doi.org/10.3390/agriculture15181976
APA StyleOhana-Levi, N., & Netzer, Y. (2025). Long-Term Global Trends in Vineyard Coverage and Fresh Grape Production. Agriculture, 15(18), 1976. https://doi.org/10.3390/agriculture15181976


