Article

Integrated Metabolomic and Transcriptomic Analysis of Antimony (Sb) Stress Response in Common Bermudagrass (Cynodon dactylon [L.] Pers.)

1
College of Animal Science and Technology, Yangzhou University, Yangzhou 225009, China
2
State Environmental Protection Key Laboratory of Soil Environmental Management and Pollution Control, Nanjing Institute of Environmental Sciences, Ministry of Ecology and Environment of China, Nanjing 210042, China
3
Faculty of Medicine and Health, The University of Sydney, Sydney, NSW 2006, Australia
*
Authors to whom correspondence should be addressed.
These authors contributed equally to this work.
Agriculture 2025, 15(21), 2221; https://doi.org/10.3390/agriculture15212221
Submission received: 8 July 2025 / Revised: 23 October 2025 / Accepted: 23 October 2025 / Published: 24 October 2025
(This article belongs to the Special Issue Molecular Mechanisms and Breeding Techniques of Forage Crops)

Abstract

Antimony (Sb) is a toxic metalloid and has become an increasingly prevalent contaminant in ecosystems. Previous studies have reported that Sb has severe toxic effects on plant growth. However, the molecular mechanisms of the response to Sb stress in plants still remain unclear. In the present study, common bermudagrass (Cynodon dactylon [L.] Pers.), ‘Yangjiang’ cultivar, was treated with 200 mg/mL of antimony potassium tartrate solution. Integrated metabolomic and transcriptomic analysis was conducted to investigate the mechanisms of the Sb stress response of bermudagrass. The results showed that, after Sb stress treatment, soluble protein content, malondialdehyde (MDA) content, and catalase (CAT) activity increased by 180.56%, 280%, and 112.61%, respectively, compared to the control. Meanwhile, transcriptomic and metabolomic analyses identified numerous differentially expressed genes (DEGs) and differentially accumulated metabolites (DAMs) that were involved in the Sb stress response of bermudagrass, and many pathways, such as the carbon metabolism, photosynthesis and alanine, aspartate, and glutamate metabolism pathways, were also identified to be related to the Sb stress response of the bermudagrass plant by KEGG and GO enrichment. Overall, the present study revealed that photosynthesis and amino acid metabolism pathways play important roles in the Sb stress response of bermudagrass.

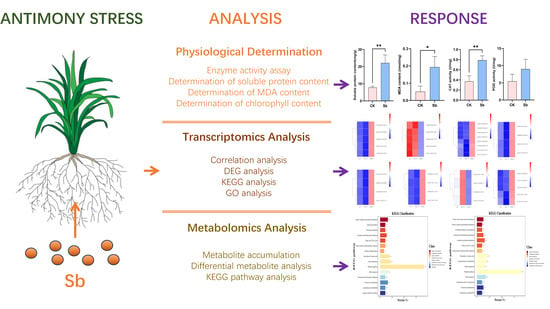
Graphical Abstract

1. Introduction

Antimony (Sb) is a highly toxic metalloid that has become an increasingly prevalent contaminant in ecosystems, and it is also classified as a carcinogen [1]. Sb primarily exists in two oxidation states which are III and V in biological, ecological, and geochemical systems [2]. Normally, in soil, the concentration of Sb is almost 0.3–8.4 mg/kg; in water, 36 mg/kg; and in plants, it ranges from 3.92 to 143.69 mg/kg. The tolerable daily intake of Sb for humans is 0.86 micrograms per kilogram of body weight per day, with concentrations beyond this threshold inducing significant toxic risks [3,4,5]. The high Sb concentration presents substantial health hazards to humans in Sb-contaminated areas. Consumption of Sb-contaminated crops, for example, rice (Oryza sativa L.), maize (Zea mays L.) and rapeseed (Brassica napus L.), can induce cardiovascular disorders, pulmonary diseases, and carcinogenesis [6,7]. Furthermore, Sb causes damage to plants including growth inhibition, photosynthetic efficiency reduction, nutrient absorption disruption, and organic metabolite synthesis alteration. Sb can enter into plants through passive uptake and active absorption [8], but the predominant pathway of Sb absorption has not been fully elucidated yet. Thus, it is important to understand the mechanism of Sb absorption in plants.
Abiotic stresses negatively affect plant germination, growth, and survival, while concurrently disrupting molecular regulatory networks, metabolic homeostasis, and proteomic profiles [9,10,11]. Nowadays, transcriptome analysis is a comprehensive tool to investigate the genetic regulatory mechanisms of plant stress responses [12]. For example, this approach revealed abiotic stress-responsive genes and their associated signaling pathways in rice (Oryza sativa L.) [13], arabidopsis (Arabidopsis thaliana L.) [14], cardoon (Cynara cardunculus L.) [15], and soybean (Glycine max [L.] Merr.) [16]. Except for gene expression regulation, all primary and secondary metabolites, which serve as intermediates of regulation pathways, play a vital role in plant adaptation to stress conditions. Primary metabolites provide the fundamental energy and biosynthetic precursors of basal metabolism for plant growth, while secondary metabolites are specifically synthesized under certain conditions. Under stress conditions, the synthesis of metabolites increases, which mitigates oxidative damage in plant cells [17]. Metabolomic analysis is used to study metabolic network regulation and functional roles at the cellular and tissue levels [18]. Thus, metabolomics has become an important tool in studies on the abiotic stress response of plants [19]. However, it is hard to unravel plant regulatory mechanisms deeply with single-omics approaches, whereas combined metabolomic and transcriptomic analysis is helpful in clarifying the relationship between genes and metabolites [20], and correlation analysis of transcriptomic and metabolomics can determine specific cell signal transduction pathways and gene expression changes in plants under stress [21].
Common bermudagrass (Cynodon dactylon [L.] Pers.), a perennial member of the Poaceae family, is distributed extensively in subtropical and tropical regions. Therefore, it is also known as warm-season grass [22]. It is also a grass that is tolerant to a variety of stresses simultaneously or sequentially, such as salt, heat, submergence, water deficits, and shade [23,24]. For the sake of survival under adverse conditions, grasses adopt structural modifications and respond through signals at various levels. Previous studies revealed that bermudagrass growing in Sb-polluted areas was found to have high concentrations of metals, which indicated that bermudagrass could be used as an effective adsorbent for phytoremediation and for reducing Sb pollution [25]. Since bermudagrass is a type of turfgrass, it is not commonly a part of the food chain. In addition, it has well-developed rhizomes and forms a dense groundcover which works efficiently in holding soil particles and thus prevents the dispersion and spread of heavy metals to other areas [26]. Therefore, the main objective of the current study involves (1) determining how antimony stress might affect bermudagrass’s physiological characteristics and (2) analyzing the pathways involved in bermudagrass’s response to Sb stress through transcriptomic and metabolomic approaches.

2. Materials and Methods

2.1. Plant Materials and Experimental Treatments

Common bermudagrass (C. dactylon), ‘Yangjiang’ cultivar, was grown in the greenhouse of Yangzhou University, Jiangsu Province, China in the year of 2023. The greenhouse was maintained at 25 °C ± 5 °C with a photoperiod of 12/12 h. The relative air humidity was 50–60%. A total of 30 stolons were planted in plastic pots (10 cm × 10 cm × 10 cm) which were filled with nutrient soil (600 g per pot) (Shouhe Co., Ltd., Weifang, Shandong, China). After two weeks of establishment, 10 pots of bermudagrass with uniform growth were divided into two groups. For the Sb treatment group, 100 mL of 200 mg/mL of antimony potassium tartrate of 1× Hoagland’s nutrient solution (Coolaber, Beijing, China) was applied to each pot every day, while for control pots, an equal quantity of 1× Hoagland’s nutrient solution was applied. Five replicates were set in each group. After 15 days of treatment, fresh leaves were collected and immediately frozen with liquid nitrogen and then preserved at an −80 °C temperature for measurement of physiological indicators. Considering that, compared with transcription, the occurrence of metabolism has a certain lag, three biological replicates of fresh leaves were collected after 0 h, 12 h, and 24 h Sb treatment for transcriptome analysis; and six biological replicates of fresh leaves were collected after 0, 24, and 36 h Sb treatment for metabolome analysis.

2.2. Measurement of Physiological Indexes

2.2.1. Measurement of Chlorophyll Pigments and Fluorescence

Chlorophyll content was measured by following previous study [27]. A total of 0.1 g of fresh leaves were chopped into around 3 cm pieces and immersed in 10 mL DMSO (dimethyl sulfoxide) to extract the chlorophyll pigments. After dark treatment for 72 h and the leaves were completely decolored, the absorbance at 645 nm and 663 nm of the chlorophyll extract solution was measured, and chlorophyll pigments were calculated according to the following formula:
Chla = 12.72 × A663 − 2.59 × A645
Chlb = 22.9 × A645 − 4.67 × A663
Chlt = 20.31 × A645 + 8.05 × A663
Chlorophyll fluorescence indicators were measured in fresh bermudagrass leaves by FluorPen FP110 (FluorCam, Brno, Czech) portable chlorophyll fluorescence instrument. Before the measurement, the leaves were subjected to dark adaptation for 30 min to ensure that the PSII reaction center was in the closed state.

2.2.2. Determination of Antioxidant Enzyme Activity, Malondialdehyde (MDA), and Soluble Protein Content

Briefly, 0.1 g of fresh leaves were quickly ground into fine powder with liquid nitrogen. Subsequently, the powder was immediately transferred into a centrifuge tube filled with 2 mL of pre-cooled phosphate buffer (pH 7.8). Then the mixture was centrifuged at 4 °C at 12,000 rpm for 15 min, and the supernatant was collected for subsequent experiments. The catalase (CAT), superoxide dismutase (SOD), MDA, and soluble protein activities were determined by enzyme activity kit (Solarbio, Beijing, China) according to the manufacturer’s instructions.

2.3. Metabolite Extraction and GC-TOF-MS Analysis

A total of 50 mg leaves were added in a 2 mL tube that was filled with 500 μL pre-cold extraction solution (methanol/dH2O, 3/1 (v/v) and vortexed for 30 s). In this experiment, 0.5 mg/mL adonitol was used as the internal standard. Then, steel balls were added into the system and ground at 40 Hz for 4 min, and the sample underwent ultrasonic treatment with an ice water bath for 5 min (repeat three times). After centrifuging for 15 min at 4 °C at 12,000 rpm (RCF = 13,800× g, R = 8.6 cm), 100 μL of the supernatant was moved to a new centrifuge tube. A 50 μL extract from each sample was collected and mixed for quality control (QC). After evaporating in a vacuum, 50 μL of methoxyamination hydrochloride (20 mg/mL in pyridine) was mixed in it. The mixture was then incubated for 30 min at 80 °C, followed by derivatization using 60 μL of BSTFA (N,O-bis(trimethylsilyl)acetamide) reagent (1% TMCS, v/v) for 1.5 h at 70 °C. After gradual cooling to 25 °C, 5 μL of FAMEs (fatty acid methyl esters) (in chloroform) was then added to the QC samples. All of the samples were detected by an Agilent 7890 gas chromatograph (San Clara, CA, USA) coupled with a time-of-flight mass spectrometer. The system used a DB-5MS capillary column (San Clara, CA, USA).
Briefly, a 1 μL sample was inserted in split less mode. Helium was the carrier gas, with a front inlet rid flow of 3 mL/min and a gas flow rate of 1 mL/min through the column. Initially the temperature was precisely set at 50 °C for 1 min, then raised to 310 °C at a constant rate of 10 °C per minute, and maintained at 310 °C for a rigorous 8 min. The insertion, transport line, and ion source temperatures were maintained at 280 °C, 280 °C, and 250 °C, respectively. In the electron impact mode, the precise energy level was set to −70 eV. The mass spectrometry data was meticulously obtained in full-scan mode, capturing a wide m/z range of 50–500 at a consistent rate of 12.5 spectra sec−1, promptly commencing after a 6.4 min solvent delay.
The raw data was analyzed using the Chroma TOF (V 4.3x, LECO, St. Joseph, MI, USA) software, which encompassed peak extraction, baseline adjustment, deconvolution, alignment, and integration. Metabolite identification was precisely carried out using the LECO-Fiehn Rtx5 database by strictly matching the mass spectrum and retention index. Subsequently, any peaks detected in less than half of the quality control (QC) samples or with a relative standard deviation (RSD) exceeding 30% in QC samples were decisively eliminated. A Student’s t-test p-value of 0.05 and VIP (Variable Importance in the Projection) > 1 were set as the threshold for significantly differential accumulated metabolites (DAMs).

2.4. RNA Extraction, cDNA Library Construction, and Transcriptome Analysis

RNA integrity was evaluated using the RNA Nano 6000 Assay Kit on the Bioanalyzer 2100 system from Agilent Technologies (San Clara, CA, USA). The total RNA was extracted from bermudagrass samples. In short, mRNA was isolated using poly-T oligo-attached magnetic beads. Fragmentation was performed with bivalent cations at higher temperatures in a 5X First Strand Synthesis Reaction Buffer. The first strand cDNA is produced with M-MuLV Reverse Transcriptase (RNase H-) and a random hexamer primer. Following that, the second stranded cDNA was then made using DNA Polymerase I and RNase H. The remaining DNA overhangs were carefully transformed into blunt ends with the assistance of exonuclease and polymerase activities. Following this, the 3’ ends of the DNA fragments were adenylated, and an adaptor with a distinctive hairpin loop structure was connected in preparation of hybridization. To ensure the selection of cDNA fragments within the specific range of 370 to 420 base pairs, the library fragments underwent meticulous purification using the AMPure XP system from Beckman Coulter in Beverly, MA, USA. We conducted PCR using Phusion High-Fidelity DNA polymerase, Universal PCR primers, and Index (X) Primer. Subsequently, we purified the PCR products using the AMPure XP system and evaluated the library quality on the Agilent Bioanalyzer 2100. The index-coded samples were clustered using a cBot Cluster Generation System with the Tru Seq PE Cluster Kit v3-cBot-HS (Illumina) following the manufacturer’s instructions. Subsequently, the library preparations underwent sequencing on an Illumina Novaseq 6000 platform (illumine, San Diego, CA, USA), resulting in the generation of 150 bp paired end reads.
The analysis of differential expressions between two conditions or groups, each with three biological replicates, was confidently conducted using the DESeq2 R package (version 1.20.0). DESeq2 effectively applies statistical routines based on the negative binomial distribution to determine differential expression in digital gene expression data. The p-values were adjusted with the Benjamini and Hochberg approaches to control the false discovery rate. Genes with an adjusted p-value of 0.05 or less were confidently assigned as differentially expressed. Before analysis, the read counts for each library were robustly adjusted using the edge R program package with a scaling normalized factor. Differential expression analysis of two conditions was rigorously conducted using the edge R package (version 3.22.5). A corrected p-value of 0.05 and |log2 (Fold Change)| > 1 have been set as the threshold for significant differential expression genes (DEGs).
The analysis of differentially expressed genes for Gene Ontology (GO) enrichment was conducted using the clusterProfiler R package (version 3.8.1), which effectively corrected for gene length bias. Any GO terms with a corrected p-value below 0.05 were confidently deemed significantly enriched by the differentially expressed genes. KEGG is an essential database resource for gaining a deep understanding of the high-level functions and utilities of biological systems. It specifically targets cells, organisms, and ecosystems, relying on molecular-level data. This encompasses large-scale molecular datasets generated by genome sequencing and other high-throughput experimental technologies (http://www.genome.jp/kegg/ (accessed on 2 September 2024)). We employed the Cluster Profiler R package to confidently evaluate the statistical enrichment of differentially expressed genes in KEGG pathways.

2.5. Statistical Analysis

Experimental data collection and analysis were performed using Microsoft Excel 2010. The data was analyzed by one-way ANOVA using SPSS 19.0 (p < 0.05 was significant). Tukey’s test was used to find the significant difference level to compare the differences among treatments and the control. Graphs of physiological indicators were prepared with GraphPad Prism 9.5.0 and Adobe Illustrator 2019. The NovaCloud Platform NovoMagic (https://magic.novogene.com) was used for transcriptomic analysis.

3. Results

3.1. Physiological Indicators of Bermudagrass Under Sb Stress

To explore the tolerance of bermudagrass against Sb stress, physiological indexes including antioxidants, photosynthesis, and cell membrane stability were measured in this study. The results showed that the leaves of bermudagrass turned yellowish and wilted after Sb stress treatment (Figure S1). In addition, compared to controls, the growth rate decreased significantly (Figure S2a) and the contents of soluble protein and MDA were 2.82 times and 3.78 times higher than those of the control group, respectively (Figure 1a,b). For changes in oxidant activities, the activities of CAT increased by 52.91%, but the activity of SOD decreased (Figure 1c,d). This shows that the cell membranes of leaf cells were damaged under Sb stress, which caused an increased concentration of active oxygen in cells; this is also consistent with the changing trend of CAT activities. However, the maximal quantum efficiency of PSII (Fv/Fm) and performance index for energy conservation (PIabs) of bermudagrass leaves decreased by 19.78% and 63.96%, respectively (Figure 1e,f). This suggests that the Fv/Fm value in C. dactylon leaves decreased with an increase in Sb stress treatment. Moreover, Sb accumulation showed a difference in leaves and roots. The Sb content in roots was 2-fold that of leaves (Figure S2b).

3.2. Transcriptomic Analysis

3.2.1. Sequence Assembly, Generation, and Correlation Analysis

To investigate the molecular regulation mechanisms against Sb stress in bermudagrass, RNA-seq was conducted in this study. As a result, 62.79 GB of raw data and 418,519,058 raw reads were acquired. After removal of the adapter, 61.05 GB of clean data and 406,960,342 clean reads were obtained. It is worth noting that the error rate for all samples was a mere 0.03%. Clean reads of nine samples ranged from 4.1 × 10⁷ to 4.9 × 10⁷. Moreover, analysis of the clean reads showed that the Q20 value was above 96.75, the Q30 value of all the samples was above 91.69, and the percentage of GC contents was qualified at around 54% (Table S1). This showed that the sequencing quality of clean reads was good enough and that the reads could be utilized for further analysis.
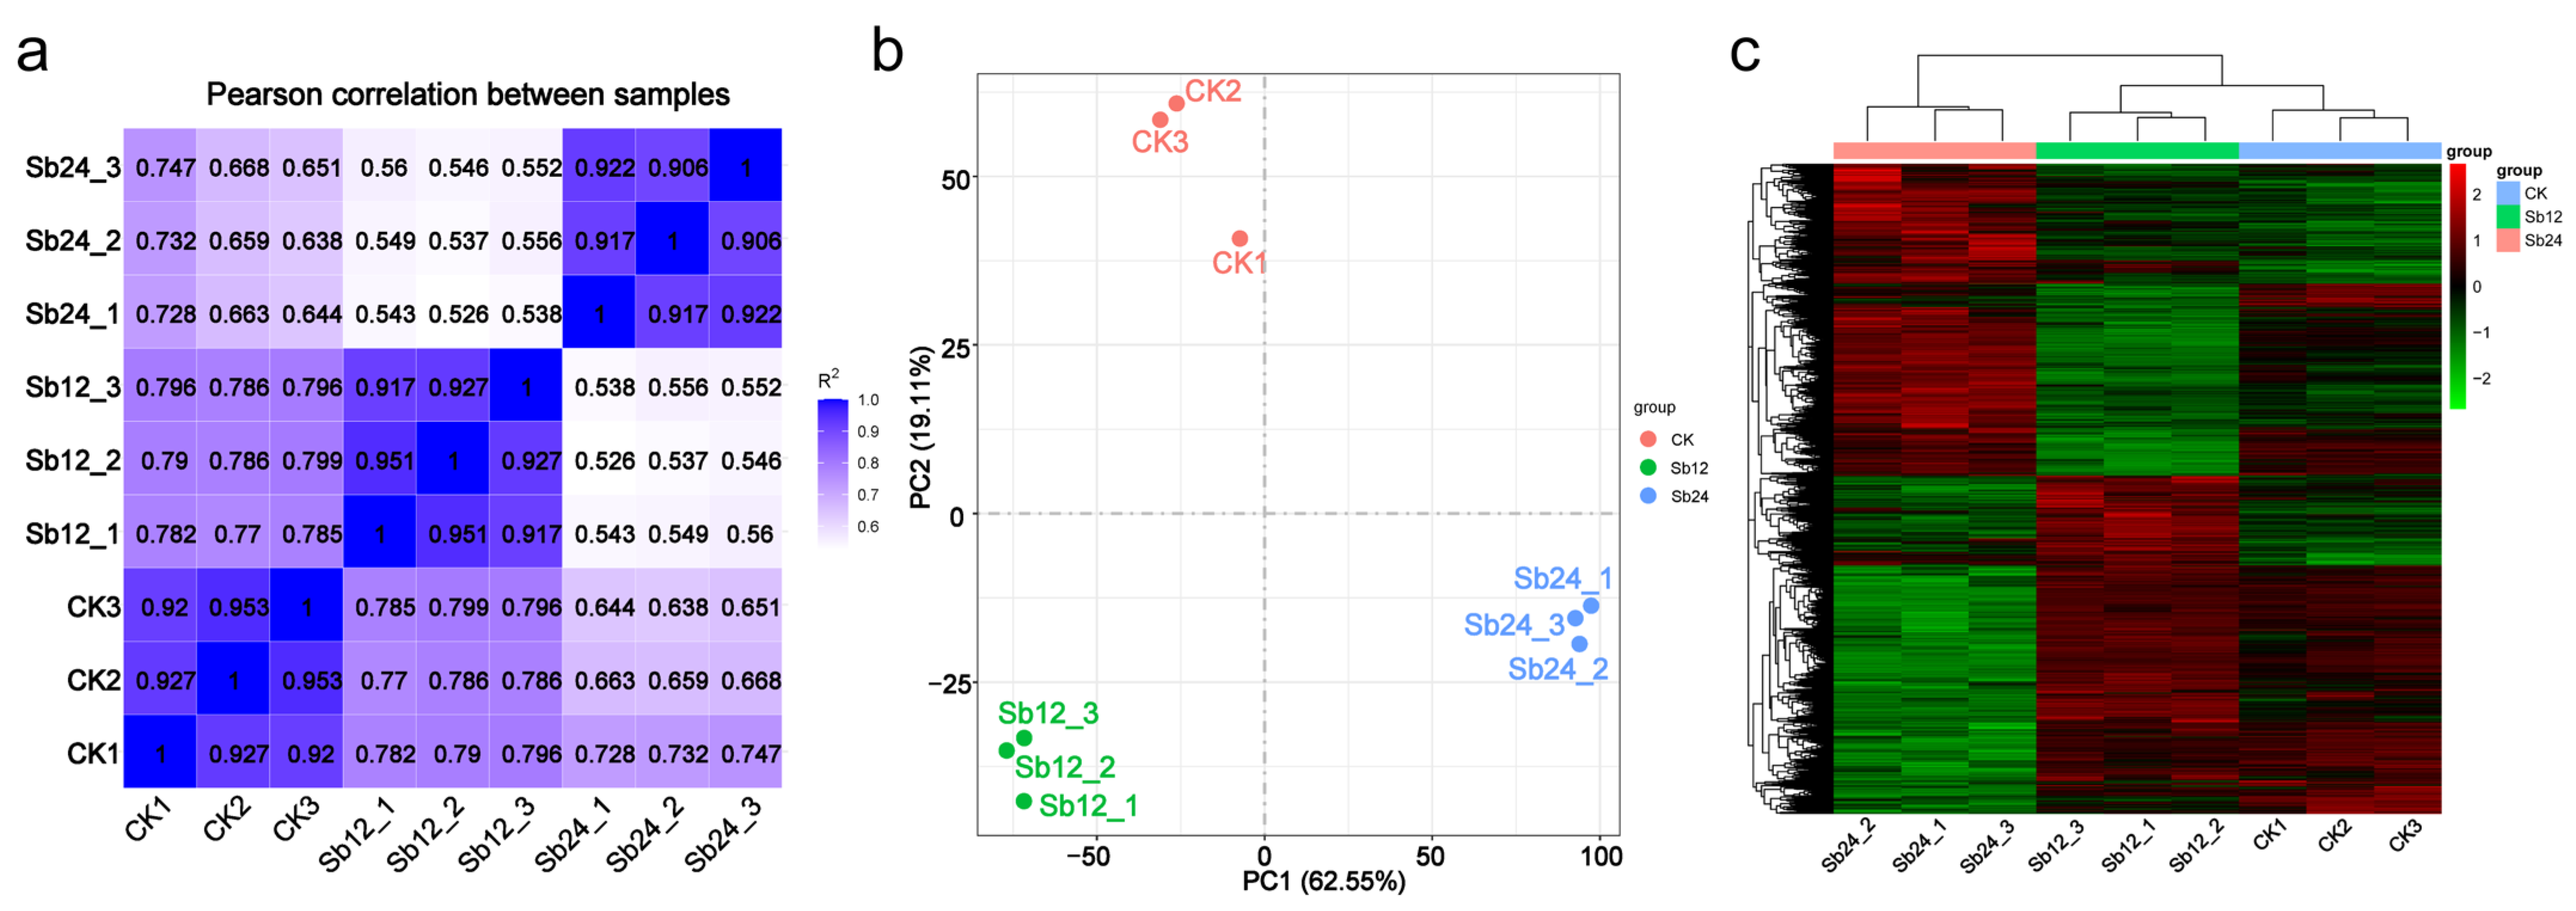
The correlation of gene expression levels between samples plays a crucial role in evaluating the reliability of the experiment and the accuracy of sample selection. By examining the FPKM (fragments per kilobase of transcript per million mapped reads) values of all genes in each sample, the correlation coefficients within and between sampling groups were calculated. The repetitions of each control group and treatment sample were highly correlated with each other. The correlation values between the repetitions in the CK, Sb12, and Sb24 groups were above 0.920, 0.917, and 0.906, respectively (Figure 2a). Principal component analysis (PCA) is often used to assess the variations among groups and the duplication of samples in the groups. PCA confidently employs linear algebra to reduce the dimension of genomic variable quantity and extract main components. The samples of different groups were dispersed but of the same group were combined (Figure 2b). A clustered heatmap of DEGs was created in which genes with the same expression pattern were placed together for further functional and regulation pathway analysis (Figure 2c).

3.2.2. Differentially Expressed Gene (DEG) Analysis

To further investigate the Sb-stress-response-related genes, DEGs were identified and analyzed using DESeq2 (v.1.20.0) with the criteria of |log2 (Fold Change)| ≥ 1 and padj < 0.05. It was observed that Sb stress significantly affected gene expression in bermudagrass. In the results, different numbers of DEGs were identified between the comparisons of Sb12 vs. CK, Sb24 vs. CK, and Sb24 vs. Sb12. Briefly, there are 3637 upregulated genes and 4694 downregulated from a total of 8331 DEGs in Sb12 (Figure 3a) and 7333 showed upregulated expression and 8690 showed downregulated expression from 16,023 total DEGs in the Sb24 group (Figure 3b). Among these DEGs, the genes RbcX1 (Rubisco related protein RbcX protein 1), SOT5 (cytosolic sulfotransferase 5), TIP4;2 (Tonoplast intrinsic protein 4;2), COL9 (CONSTANS-like 9), and Hsp40 (heat shock protein 40) were the most significantly upregulated, while CYP92C6, which encoded trimethyltridecatetraene synthase; DTX40, which encoded the protein DETOXIFICATION 40; and NFP3.1, which encoded the NITRATE TRANSPORTER 1/PEPTIDE TRANSPORTER family protein were the most significantly downregulated in bermudagrass after 12 h treatment of Sb stress. However, the genes CYP94C1 which encoded cytochrome P450 94C1, CYP79A1 which encoded Tyrosine N-monooxygenase, ERF109 which encoded ethylene-responsive transcription factor, and CP1 which encoded chlorophyll a/b binding protein were the most significantly upregulated, while the genes SBE3 which encoded 1,4-α-glucan-branching enzyme 3, APUM24 which encoded Pumilio homolog 24, FIB1 which encoded rRNA 2′-O-methyltransferase fibrillarin 1, RPP25L which encoded ribonuclease P protein subunit p25-like protein, and NIP7 which encoded 60S ribosome subunit biogenesis protein were the most significantly downregulated after 24 h treatment of Sb stress. These findings showed that DEGs in the Sb12 and Sb24 groups were substantially different from the DEGs of CK. Furthermore, the results showed that the expression of photosystem-related genes, such as the PS-I related proteins PsaD, PsaE, PsaF, PsaG, PsaH, PsaK, PsaL, PsaN, and PsaO and PS-II related proteins PsbA, PsbO, PsbR, PsbP, PsbS, and PsbW, were significantly upregulated (Table S2). However, ribosome biogenesis-related genes, such as NOP1, NOP56, NOP58, SNU13, DCK1, NHP2, GAR1, Nob1, BmS1, KRE33, Rcl1, and Tif6, were downregulated.

3.2.3. Gene Ontology (GO) and KEGG Pathway Analysis

GO is an expansive and detailed database that provides comprehensive descriptions of gene functions. This database classifies gene functions into three main categories: biological mechanisms, cellular components, and molecular mechanisms. Following the GO annotation of the differentially expressed genes (DEGs), the 2824 (Sb12 vs. CK), 4861 (Sb24 vs. CK), and 8282 (Sb24 vs. Sb12) DEGs were divided into 112, 90, and 163 GO terms, respectively. The most enriched 30 terms are shown in Figure 4. Further analysis of the Sb24 vs. Sb12 comparison showed that, in the biological process (BP) group, the most abundant processes were the cellular amino acid metabolic process (GO:0006520), ncRNA metabolic process (GO:0034660), and ribosome biogenesis (GO:0042254), which hit 258, 224, and 104 DEGs, respectively. In the cell component group, thylakoid part (GO:0044436) and photosynthetic membrane (GO:0034357) were the most abundant terms, which hit 71 and 92 DEGs, respectively. In the molecular processes group, the highly enriched terms observed were transferase activity, transporting one-carbon groups (GO:0016741), and methyltransferase activity (GO:0008168), which hit 244 and 220 DEGs, respectively (Figure 3g–i, Table S3).
Based on comprehensive and ongoing collection of biochemical, genetic, and functional data from biological systems, KEGG can precisely determine the diverse function of genes and their involvement in specific metabolic pathways. KEGG analysis revealed that a total of 2674 (Sb12 vs. CK), 4701 (Sb24 vs. CK), and 6371 (Sb24 vs. Sb12) DEGs were allocated to 123, 126, and 127 KEGG pathways, respectively. Further analysis showed that 49, 12, and 13 KEGG pathways were enriched significantly in the Sb12 vs. CK, Sb24 vs. CK, and Sb24 vs. Sb12 comparisons, respectively. Among them, “Photosynthesis—antenna proteins” was a highly enriched pathway in the comparison of Sb12 vs. CK, and “ribosome biogenesis in eukaryotes” was a highly enriched pathway in the comparisons of Sb24 vs. CK and Sb24 vs. Sb12, along with having the smallest p-values in each group (Figure 3d–f, Table S4).

3.3. Metabolomics Analysis

3.3.1. Metabolite Accumulation

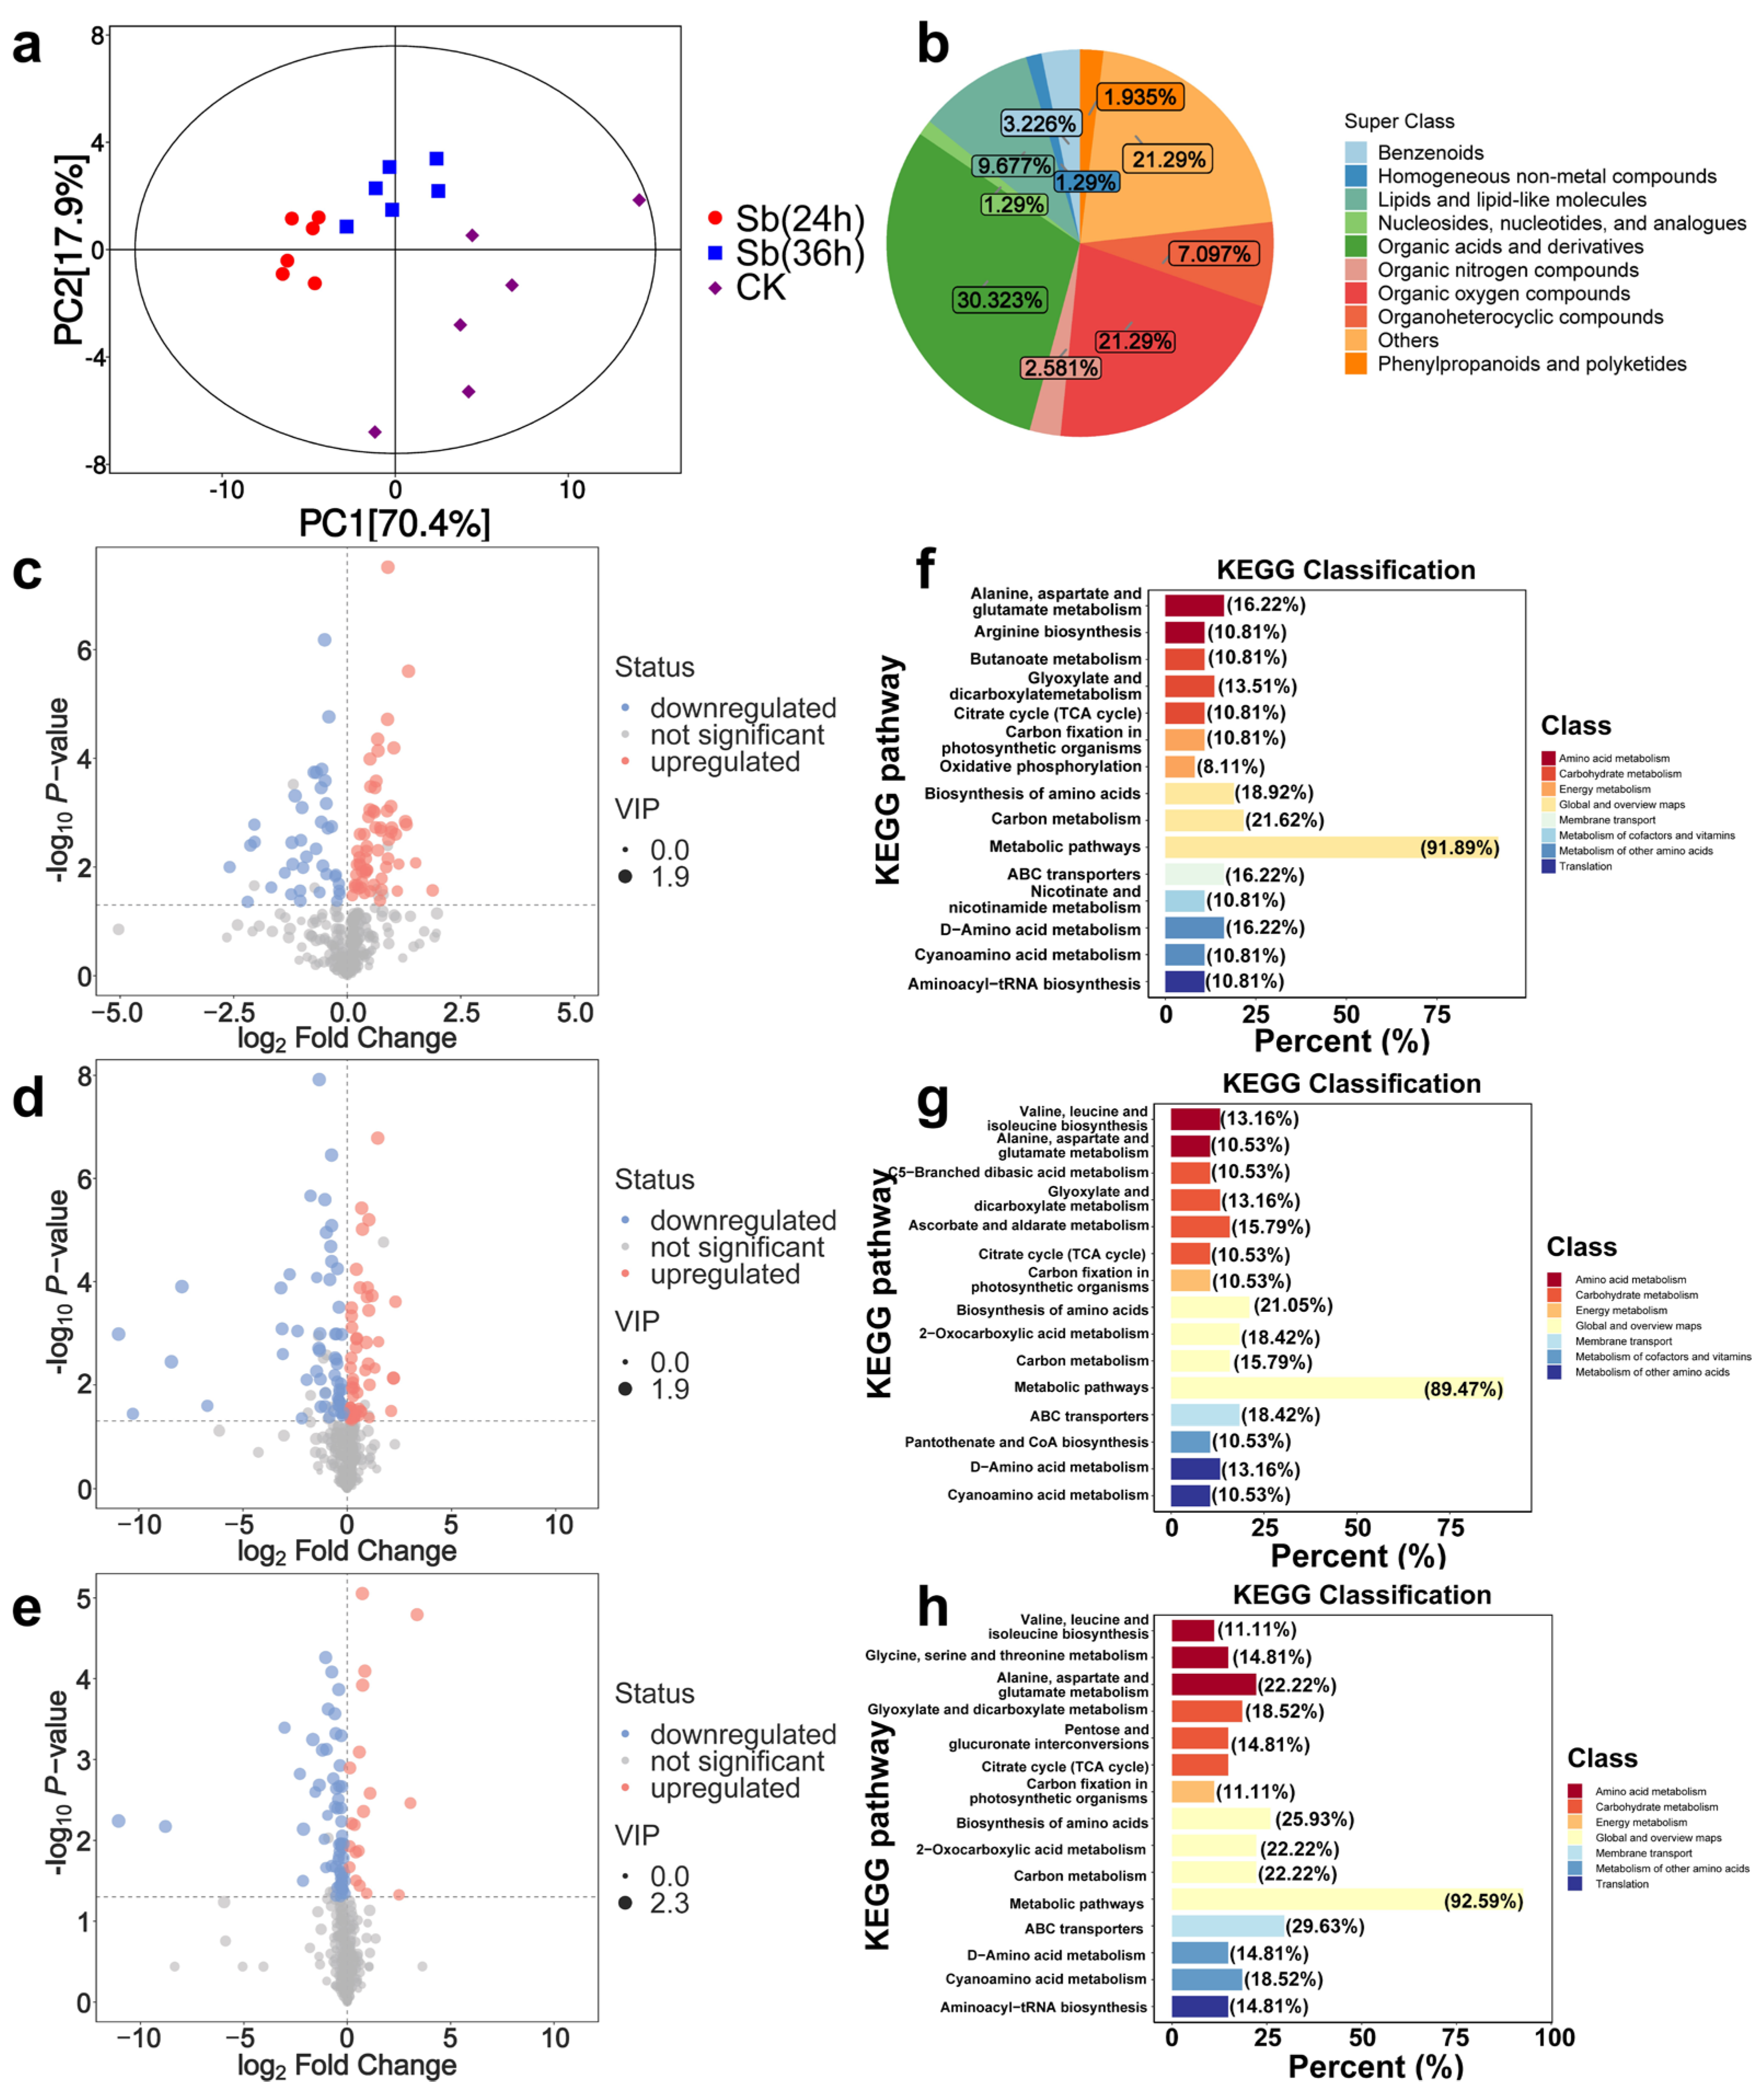
Collectively 155 metabolites were detected and quantified, including 5 benzenoids, 2 homogeneous non-metal compounds, 15 lipids and lipid-like molecules, 2 nucleosides, nucleotides, and analogs, 47 organic acids and their derivatives, 4 organic nitrogen compounds, 33 organic oxygen compounds, 11 organ heterocyclic compounds, 3 phenylpropanoids and polyketides, and 133 others (unknown) (Table S5). The principal component analysis revealed that PC1 explained 70.4% and PC2 explained 17.9% of the total variance (Figure 4a,b).

3.3.2. Differentially Accumulated Metabolite (DAMs) Analysis

A total of 155 differentially accumulated metabolites (DAMs) were identified by setting the threshold at VIP > 1.0 and p-value < 0.05 simultaneously. We generated a volcano plot to visually represent the distribution of these differential metabolites. In three different comparison groups (Sb24 vs. CK, Sb36 vs. CK, and Sb36 vs. Sb24), 61, 53, and 19 DAMs were upregulated, and 38, 57, and 62 DAMs were downregulated (Figure 4c–e; Table S6). The upregulated DAMs primarily comprised organic acids and derivatives, amino acids and derivatives, nucleotides, and lipids. Conversely, the decreased levels of DAMs primarily contained fatty acids and derivatives, amino acids and derivatives, organic acids, and carbohydrate compounds. Among the DAMs, accumulations of dehydroascorbic acid, toluenesulfonic acid, mucic acid, gentiobiose, saccharic acid, and asparagine were upregulated more than 2-fold after 24 h of Sb stress treatment; and accumulations of gentiobiose, ascorbate, threose were upregulated more than 4-fold after 36 h of Sb stress treatment. However, accumulations of proline, piceatannol, methionine, erythronolactone, and fluorenone were most significantly downregulated by Sb stress in bermudagrass. Decreases of log2 foldchange in methionine, erythronolactone, and fluorenone accumulations were even more than 6-fold under Sb stress.

3.3.3. KEGG Pathway Analysis

Through KEGG pathway enrichment analysis, it is possible to identify the key biochemical metabolic pathways that are closely related to Sb stress response in bermudagrass. The results revealed that the DAMs in three different comparison groups (Sb24 vs. CK, Sb36 vs. CK, and Sb36 vs. Sb24) were enriched in various metabolic pathways, and several pathways were identified to be enriched significantly at p < 0.05. In detail, the pathways of alanine, aspartate and glutamate, the citrate cycle (TCA cycle), and beta-Alanine metabolism were significantly enriched in both the Sb24 vs. CK and Sb36 vs. CK comparisons. In addition, the pathways of glycerolipid metabolism, valine, leucine and isoleucine biosynthesis, and aminoacyl-tRNA biosynthesis were significantly enriched in the Sb36 vs. Sb24 comparison (Figure 4f–h and Table S7). These results suggest that these pathways might be vitally important in studying the Sb stress response in bermudagrass.

3.4. Integrated Analysis of Transcriptomics and Metabolomics

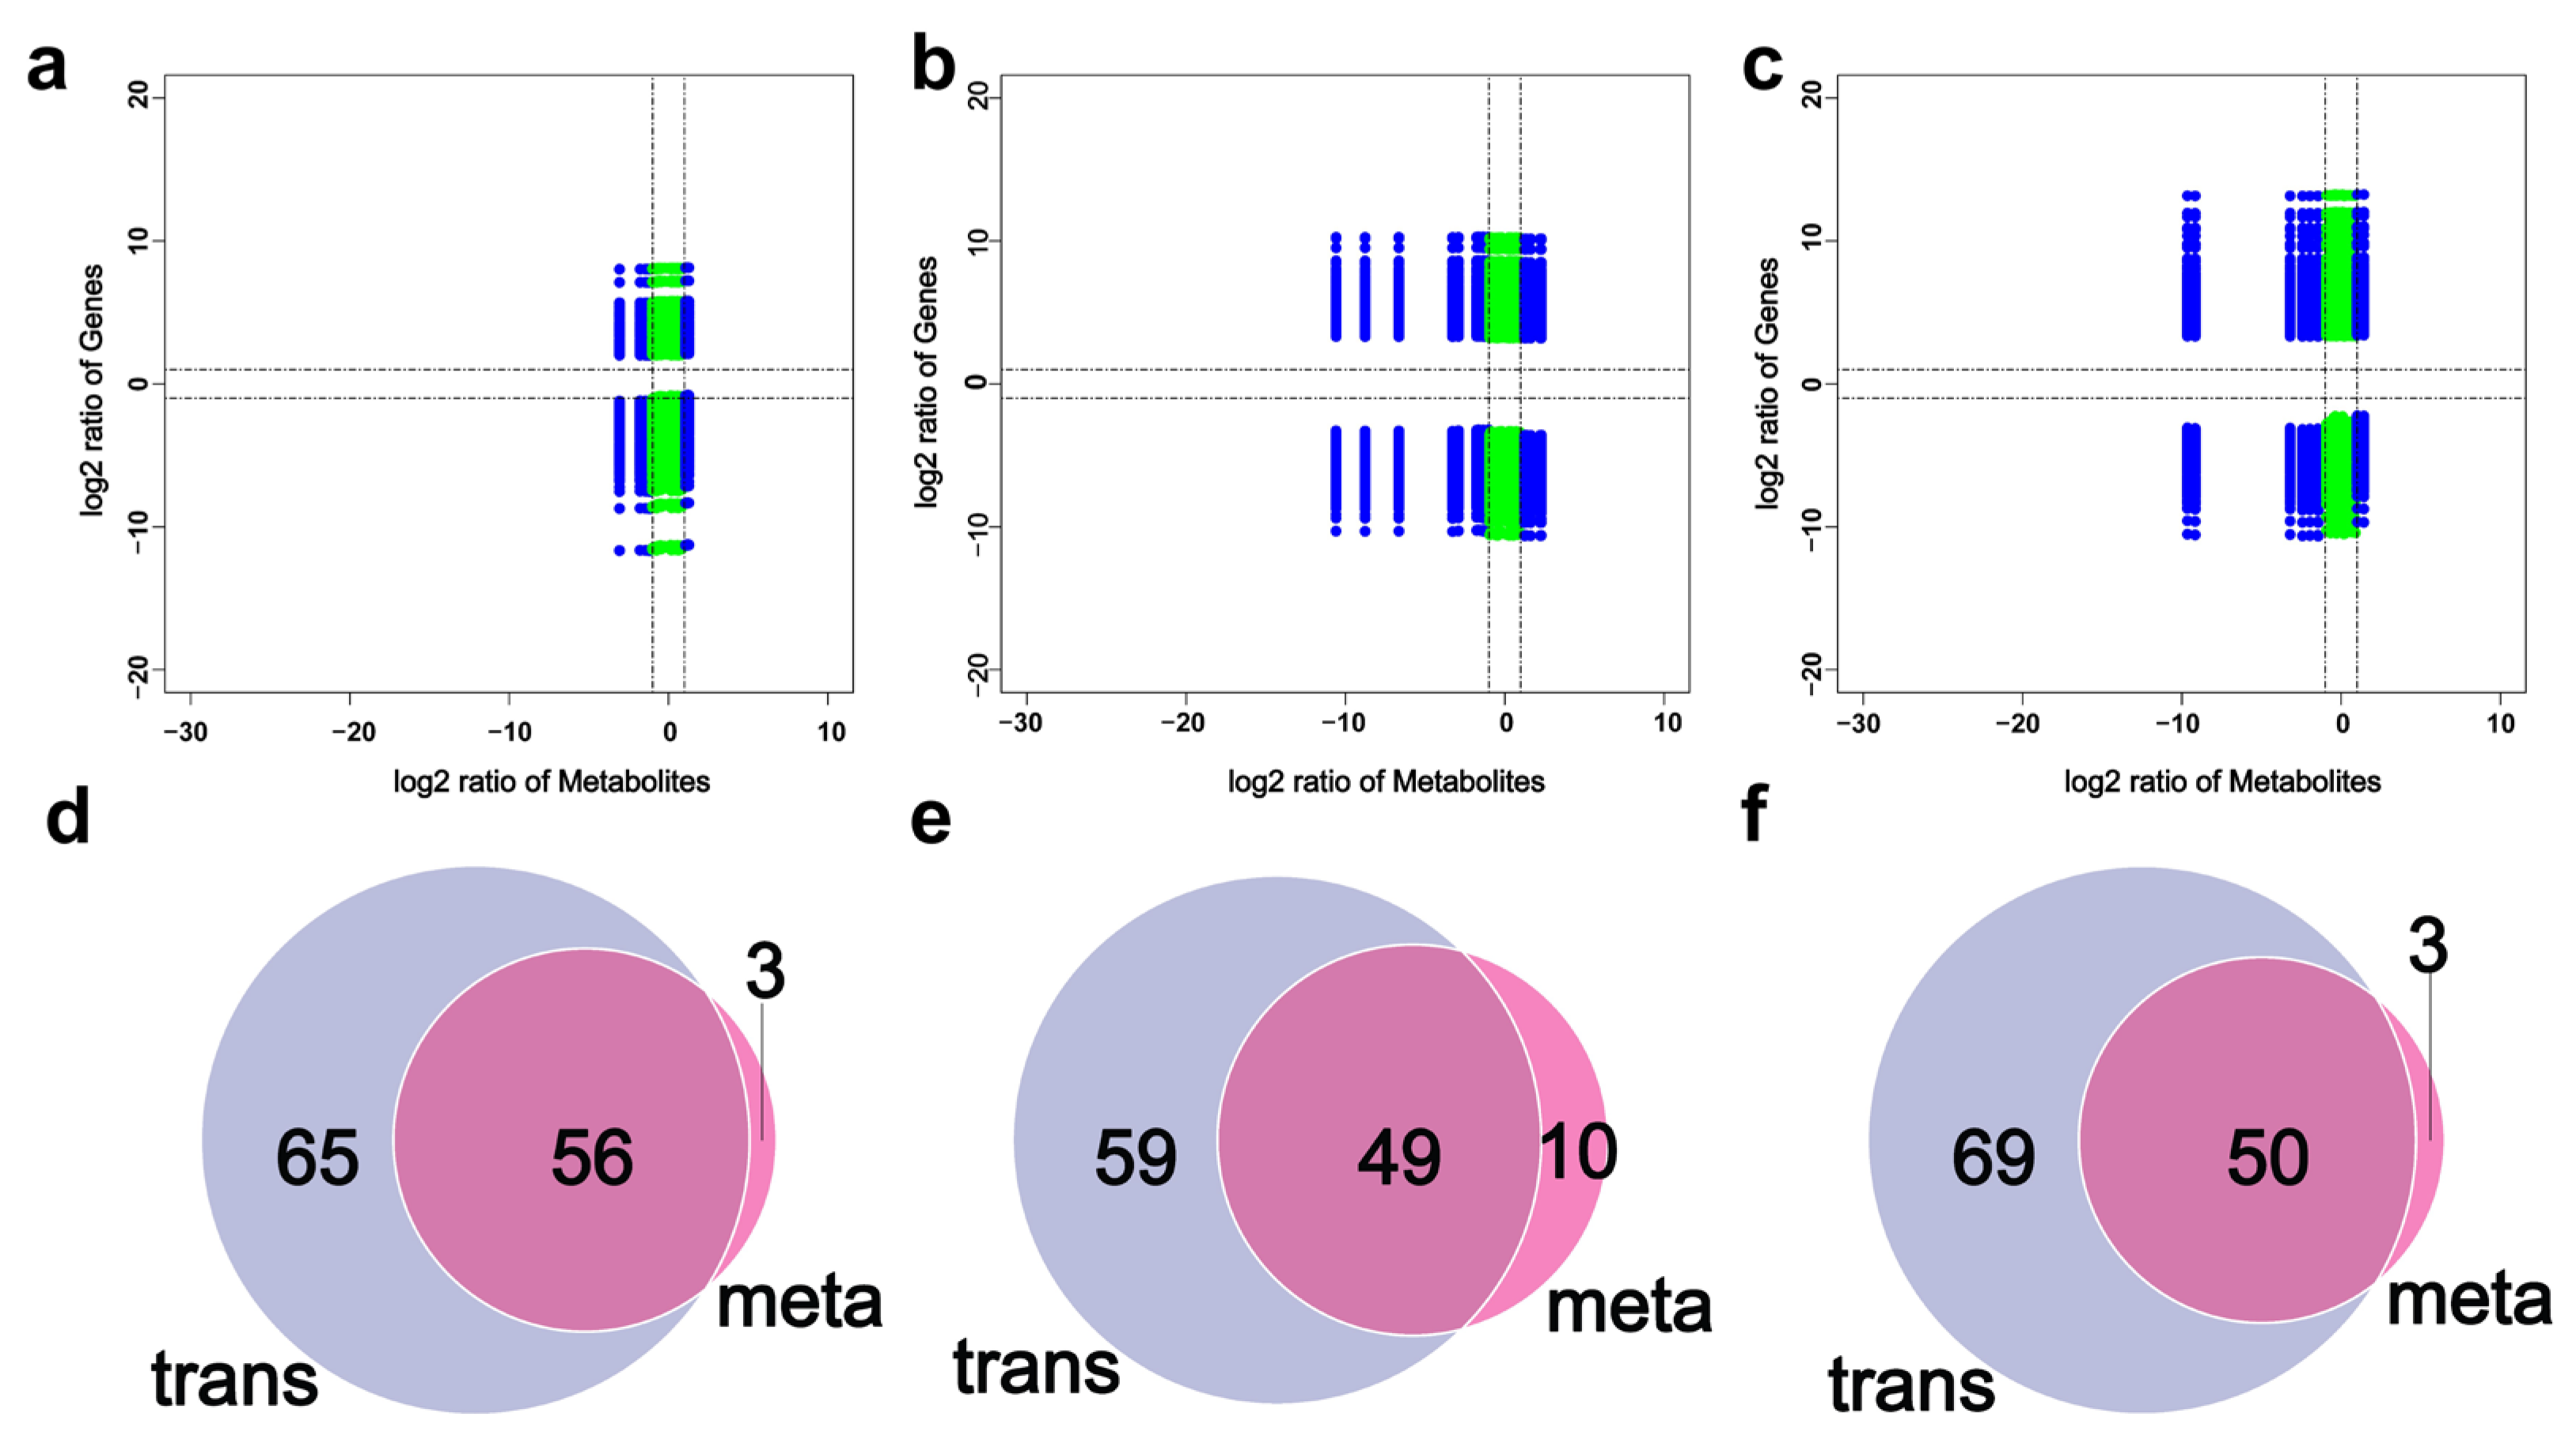
Integrated analysis was conducted to investigate the association between DEGs and DAMs in bermudagrass. The results showed that most of the DAMs demonstrated significant positive and negative correlations with DEGs in all three comparisons (Figure 5a–c; Table S8). The levels of the following metabolites were directly correlated with the expression of genes in carbon metabolism and biosynthesis of secondary metabolites. The DAMs were found to have either positive or negative correlations with most of the differentially expressed genes (DEGs). The level of these DAMs was found to be correlated with the expression level of DEGs involved in aminoacyl-tRNA and amino acids. Additionally, DEGs and DAMs from two comparisons were accurately co-mapped with KEGG database to determine their common pathways. The results showed that 56, 49, and 50 pathways were co-enriched by DEGs and DAMs in Sb12 vs. CK, Sb24 vs. CK, and Sb24 vs. Sb12, respectively (Figure 5d–f; Table S9). However, a majority of the common KEGG pathways were shared by all three comparisons, as “biosynthesis of cofactors” and “carbon metabolism” depicted a higher level of DAM and DEG abundance in Sb12 vs. CK. Furthermore, the highly enriched pathways in Sb24 vs. CK were the biosynthesis of cofactors and amino acid pathways (Table S9).

4. Discussion

4.1. Sb Stress-Induced Physiological Change in Bermudagrass

Sb accumulation causes severe detrimental effects in plants. It inhibits plant growth, disrupts electron transfer, and changes photosynthetic product flow direction in the antioxidant system and photosystem. Its accumulation interferes with the absorption of essential minerals including iron, manganese, and magnesium, consequently severely inhibiting plant growth [28,29]. Under normal conditions, excess ROS production can be scavenged by antioxidant enzymes in plants [30]. However, under Sb stress, the balance between ROS generation and elimination is interrupted, as ROS production sharply increases in bermudagrass, inducing damage to the cell membrane structure. Previous studies reported that in wheat (Triticum aestivum L.), Sb stress induces oxidative damage and causes membrane lipid peroxidation [31]. MDA is a key biomarker for assessing plant membrane lipid peroxidation. This study demonstrated that Sb stress exposure leads to a substantial accumulation of reactive oxygen species and malondialdehyde. Moreover, plants can effectively eliminate accumulated ROS via activating their antioxidant defense systems such as SOD, CAT, and POD. In our study, CAT activity was enhanced in bermudagrass after Sb treatment, while SOD activity was significantly decreased. Similar results were also observed in maize (Zea mays L.) under various heavy metal stresses, such as Zn, Ni, Cd, and Cu, where activities of POD and CAT were increased, but SOD activity was decreased [32]. These findings indicate that Sb toxicity causes oxidative damage to plant cell membranes, and heavy metals should play a unique role in SOD activity regulation in plants. Furthermore, photosystem II (PSII) is crucial in the plant photosynthetic system and represents a primary target for studying the impact of heavy metal stress. Studies have demonstrated that heavy metals can reduce PSII activity significantly [33,34]. In the present study, it was observed that the Fv/Fm value in C. dactylon leaves decreased with an increase in Sb stress treatment. This suggests that Sb has a substantial toxic impact on bermudagrass PSII activity. Consequently, the light energy capture capacity and electrons transferred through PSII are reduced, which induces a decrease in overall photosynthetic activity and irreversible photoinhibition. Additionally, the decline in photosynthetic capacity involves not only PSII dysfunction but also severe damage to light capture of PSI caused by heavy metals [35,36]. Heavy metals induce partial depolymerization of chlorophyll–protein complexes bound by PSII, thereby impairing normal photosystem function [35,37,38].

4.2. Photosystem Was Involved in Sb Stress Response of Bermudagrass

In this study, upregulation of numerous photosystem complex-related genes in bermudagrass under Sb stress condition was observed. In these genes, PsbO and PsbP encoded oxygen-evolving enhancer (OEE) proteins which were localized in the thylakoid lumen and stabilized manganese through the oxygen-evolving complex (OEC) [39]. The OEC is located on the thylakoid of PSII, and the catalytic core of the OEC is an inorganic manganese cluster, which completes the reaction of grabbing four electrons from water to form four protons (H+) and release oxygen. Moreover, the other PSII-related proteins including PsbR, PsbS, and PsbW were also upregulated after Sb stress treatment. It suggested that bermudagrass can counteract the damage produced by Sb stress by enhancing the reaction rate of PSII and the electron transmission speed of oxygen-releasing complexes and speeding up photosynthesis. The cytochrome b6f complex is made up of eight polypeptides. Electrons are unambiguously transferred to cytb6f via plastoquinone PQH2 and ultimately to plastocyanin (PC), while protons (H+) are transferred for measurements from the matrix to internal cavity. The other relevant coding genes, PetA cytochrome F, PetC cytochrome complex iron–sulfur subunit, and PetE plastocyanin, were significantly upregulated; as a result, electron speed increased and it accelerated photosynthesis, whereas PSI forms a complex by combining 178 auxiliary groups and 17 protein subunits. Previous studies reported that the psaO gene was upregulated in Brassica napus after treatment with sewage sludge that contained lead (Pb), copper (Cu), nickel (Ni), and zinc (Zn) [40], and photosystem-related genes such as psbQ, psbO, psaG, psaD, atpG, and PetH were significantly upregulated after selenium (Se) treatment [41]. Transcription of these genes and then their translation to functional proteins contribute to stabilizing the photosystem and increase the tolerance of plants to heavy metal stresses. In this study, nine protein subunits of PSI-related proteins were also significantly upregulated. Ferrioxidoreductin transfers electrons through Fd NADP+ reductase and finally connects the subunit at the center of proton flow rotation of the ATP synthase F0 subunit to generate torque to stimulate ATP synthesis. The related regulatory genes of F-type H+/Na+ transporting ATPase subunit α and F-type H+ transporting ATPase subunit B were also significantly upregulated. Therefore, these results suggested that bermudagrass responds to Sb stress via accelerating its photosynthesis and ATP production rate.

4.3. Sb Stress Affected the Synthesis of Polypeptides in Bermudagrass

Biogenesis of ribosomes is a fundamental cellular process that closely relates to cell growth and expansion. Cellular growth depends on the continuous synthesis of new ribosomes; hence, ribosome biogenesis directly parallels the rate of cell growth. The transcriptomic results in the present study revealed that ribosome biogenesis of pre-40S- and pre-60S-related genes was downregulated in bermudagrass under the Sb stress condition. This downregulation likely impairs the maturation of 60S and 40S. The disruption of these processes causes abnormal ribosome biogenesis in bermudagrass under Sb stress, which leads to cell cycle disturbance, apoptosis, and reductions in cell proliferation. Furthermore, the production of aminoacyl-tRNA is crucial in protein translation and various cellular processes, affecting cellular homeostasis and stress responses [42]. Heavy metals can disturb protein function by complexation with free thiols and other functional groups, oxidation of amino acid side chains, disruption of protein folding, and displacement of essential metal cofactors. The current study clearly demonstrates that Sb stress can disrupt the biosynthetic pathways of aminoacyl-tRNA, consequently inducing the upregulation of asparagine, valine, isoleucine, and glycine, which negatively affects protein synthesis efficiency. This study provides important insights into the possible role of the aminoacyl-tRNA biosynthesis pathway in the Sb stress response, as well as the potential protective mechanisms of chemoprotective agents. However, further investigations are necessary to fully understand the relationship between Sb stress, the biosynthesis pathway of aminoacyl-tRNA, and oxidative stress.

4.4. Bermudagrass Response to Sb Stress Through Transcriptomic and Metabolomic Regulation

Expression of enzyme-related genes is the primary response to abiotic stress in plants. With the translation of functional proteins, different metabolites are synthesized or transformed. Hence, combined analysis of transcriptomes and metabolomes is usually used to investigate the mechanisms of environmental stress responses in plants [43]. Several genes and metabolites were identified to be strongly correlated in low-temperature germination of rapeseed (B. napus) [44]. In the present study, it was found that expressions of some genes determined the synthesis of certain compounds in bermudagrass when exposed to Sb stress. After Sb stress treatment, the accumulation of aspartic acid was upregulated. Simultaneously, the expressions of the CAD gene, which encoded aspartate carbamoyltransferase, and the ADSS gene, which encoded adenylosuccinate synthase, were upregulated. These two enzymes catalyzed L-aspartate into N-carbamoyl-L-aspartate and adenylo-succinate, respectively, and the latter compound was further transformed into fumarate. This feedback regulation may be the reason that accumulation of fumaric acid was induced in bermudagrass under the Sb stress condition. In addition, the upregulation of alanine and glutamic acid accumulation, as well as AGXT2 (encoded alanine-glyoxylate transaminase) and GLUD1/2 (encoded glutamate dehydrogenase) gene expression, suggested a correlation between metabolite synthesis and gene expression. Interestingly, genes related to glutamate metabolism such as GLUL (encoded glutamine synthetase), PPAT (encoded amidophosphoribosyltransferase), and GFPT (encoded glutamine/fructose-6-phosphate transaminase) were downregulated, although the accumulation of glutamic acid was upregulated in bermudagrass after the Sb stress treatment. The regulation of these genes’ expression should induce a decline in glucose-1-phosphate accumulation in bermudagrass.

5. Conclusions

This study conclusively reveals the detrimental impact of Sb on bermudagrass growth and antioxidant response. Under Sb stress conditions, the activity of SOD and CAT and the MDA content changed significantly. Sb stress inhibits bermudagrass growth by changing multiple metabolic mechanisms including photosynthesis and the antioxidant system. Through integrated transcriptomic and metabolomic analysis, many DEGs and DAMs were identified to be involved in the Sb stress response of bermudagrass via participation in various metabolic pathways such as biosynthesis of aminoacyl-tRNA and ribosome biogenesis. Overall, this study explains the mechanisms of bermudagrass’s response to Sb pollution in the environment and provides a new perspective for the treatment of Sb-polluted land.

Supplementary Materials

The following supporting information can be downloaded at https://www.mdpi.com/article/10.3390/agriculture15212221/s1: Table S1: statistics of transcriptome data of bermudagrass; Table S2: Expression of the DEGs in bermudagrass after Sb treatment; Table S3: GO analysis of the DEGs after Sb treatment; Table S4: KEGG analysis of the DEGs after Sb treatment; Table S5: Classification of the metabolites that identified in bermudagrass; Table S6: Accumulation of the DAMs in bermudagrass after Sb treatment; Table S7: Pathways that enriched by metabolomic analysis after Sb treatment Table S8: Nine quadrant analysis between the DAMs and DEGs; Table S9: KEGG co-enrichment analysis of DAMs and DEGs in bermudagrass after Sb treatment. Figure S1: The morphology of bermudagrass after Sb treatment. Figure S2: Change of the growth rate (a) and Sb content (b) of/in bermudagrass after Sb treatment.

Author Contributions

Methodology, J.F., B.W., Y.C., and Y.X.; validation, Y.X., F.W., and X.L.; formal analysis, Q.L., and X.Y.; investigation, Q.L., Y.X., F.W., X.L., X.H., and S.G.; data curation, J.F., Y.X., and X.H.; writing—original draft preparation, Q.L., Y.X., and M.N.; writing—review and editing, M.N., J.F. and X.H.; visualization, Y.X.; supervision, J.F. and B.W.; funding acquisition, B.W. All authors have read and agreed to the published version of the manuscript.

Funding

This study was supported by the National Natural Science Foundation of China, grant numbers 41902264 and 31702165.

Data Availability Statement

The raw sequencing data supporting the findings of this study have been deposited in the Genome Sequence Archive (GSA) at the China National Center for Bioinformation (CNCB). The datasets are publicly accessible under BioProject accession PRJCA043974, which contains: 9 BioSample entries (SAMC5727423-SAMC5727431) and 9 sequencing experiment records (CRX1881970-CRX1881978). All data can be retrieved via the persistent URL https://www.cncb.ac.cn/search?dbId=&q=PRJCA043974 (accessed on 22 October 2025). The raw data supporting the conclusions of this article will be made available by the authors on request.

Conflicts of Interest

The authors declare no conflicts of interest.

References

  1. Karagas, M.R.; Wang, A.; Dorman, D.C.; Hall, A.L.; Pi, J.; Sergi, C.M.; Symanski, E.; Ward, E.M.; Arrandale, V.H.; Azuma, K.; et al. Carcinogenicity of cobalt, antimony compounds, and weapons-grade tungsten alloy. Lancet Oncol. 2022, 23, 577–578. [Google Scholar] [CrossRef]
  2. Filella, M.; Williams, P.A. Antimony biomethylation in culture media revisited in the light of solubility and chemical speciation considerations. Environ. Toxicol. 2010, 25, 431–439. [Google Scholar] [CrossRef]
  3. Tschan, M.; Robinson, B.H.; Nodari, M.; Schulin, R. Antimony uptake by different plant species from nutrient solution, agar and soil. Environ. Chem. 2009, 6, 144–152. [Google Scholar] [CrossRef]
  4. Guo, X.; Wu, Z.; He, M. Removal of antimony (V) and antimony (III) from drinking water by coagulation–flocculation–sedimentation (CFS). Water Res. 2009, 43, 4327–4335. [Google Scholar] [CrossRef]
  5. Qi, C.; Liu, G.; Kang, Y.; Lam, P.K.S.; Chou, C. Assessment and distribution of antimony in soils around three coal mines, Anhui, China. J. Air Waste Manag. Assoc. 2011, 61, 850–857. [Google Scholar] [CrossRef]
  6. Boreiko, J.C.; Rossman, G.T. Antimony and its compounds: Health impacts related to pulmonary toxicity, cancer, and genotoxicity. Toxicol. Appl. Pharmacol. 2020, 403, 115156. [Google Scholar] [CrossRef] [PubMed]
  7. Wu, F.; Fu, Z.; Liu, B.; Mo, C.; Chen, B.; Corns, W.; Liao, H. Health risk associated with dietary co-exposure to high levels of antimony and arsenic in the world’s largest antimony mine area. Sci. Total. Environ. 2011, 409, 3344–3351. [Google Scholar] [CrossRef]
  8. Feng, R.; Wei, C.; Tu, S.; Ding, Y.; Wang, R.; Guo, J. The uptake and detoxification of antimony by plants: A review. Environ. Exp. Bot. 2013, 96, 28–34. [Google Scholar] [CrossRef]
  9. Patel, M.K.; Mishra, A.; Jha, B. Non-targeted metabolite profiling and scavenging activity unveil the nutraceutical potential of psyllium (Plantago ovata Forsk). Front. Plant Sci. 2016, 7, 431. [Google Scholar] [CrossRef] [PubMed]
  10. Saharan, B.S.; Brar, B.; Duhan, J.S.; Kumar, R.; Marwaha, S.; Rajput, V.D.; Minkina, T. Molecular and physiological mechanisms to mitigate abiotic stress conditions in plants. Life 2022, 12, 1634. [Google Scholar] [CrossRef]
  11. Zhang, Y.; Xu, J.; Li, R.; Ge, Y.; Li, Y.; Li, R. Plants’ response to abiotic stress: Mechanisms and strategies. Int. J. Mol. Sci. 2023, 24, 10915. [Google Scholar] [CrossRef] [PubMed]
  12. Batista, R.; Saibo, N.; Lourenço, T.; Oliveira, M.M. Microarray analyses reveal that plant mutagenesis may induce more transcriptomic changes than transgene insertion. Proc. Natl. Acad. Sci. USA 2008, 105, 3640–3645. [Google Scholar] [CrossRef] [PubMed]
  13. Walia, H.; Wilson, C.; Condamine, P.; Liu, X.; Ismail, A.M.; Zeng, L.; Wanamaker, S.I.; Mandal, J.; Xu, J.; Cui, X.; et al. Comparative transcriptional profiling of two contrasting rice genotypes under salinity stress during the vegetative growth stage. Plant Physiol. 2005, 139, 822–835. [Google Scholar] [CrossRef] [PubMed]
  14. Kim, H.S.; Yu, Y.; Snesrud, E.C.; Moy, L.P.; Linford, L.D.; Haas, B.J.; Nierman, W.C.; Quackenbush, J. Transcriptional divergence of the duplicated oxidative stress-responsive genes in the Arabidopsis genome. Plant J. 2005, 41, 212–220. [Google Scholar]
  15. Puglia, G.D.; Prjibelski, A.D.; Vitale, D.; Bushmanova, E.; Schmid, K.J.; Raccuia, S.A. Hybrid transcriptome sequencing approach improved assembly and gene annotation in Cynara cardunculus (L.). BMC Genom. 2020, 21, 317. [Google Scholar] [CrossRef]
  16. Gong, Z.; Duan, Y.; Liu, D.; Zong, Y.; Zhang, D.; Shi, X.; Hao, X.; Li, P. Physiological and transcriptome analysis of response of soybean (Glycine max) to cadmium stress under elevated CO2 concentration. J. Hazard. Mater. 2023, 448, 130950. [Google Scholar] [CrossRef]
  17. Sumner, L.W.; Mendes, P.; Dixon, R.A. Plant metabolomics: Large-scale phytochemistry in the functional genomics era. Phytochemistry 2003, 62, 817–836. [Google Scholar] [CrossRef]
  18. Cao, H.; Zhang, A.; Zhang, H.; Sun, H.; Wang, X. The application of metabolomics in traditional Chinese medicine opens up a dialogue between Chinese and Western medicine. Phytother. Res. 2015, 29, 159–166. [Google Scholar] [CrossRef]
  19. Kim, S.; Yun, E.J.; Hossain, M.A.; Lee, H.; Kim, K.H. Global profiling of ultraviolet-induced metabolic disruption in Melissa officinalis by using gas chromatography-mass spectrometry. Anal. Bioanal. Chem. 2012, 404, 553–562. [Google Scholar] [CrossRef]
  20. Hirai, M.Y.; Yano, M.; Goodenowe, D.B.; Kanaya, S.; Kimura, T.; Awazuhara, M.; Arita, M.; Fujiwara, T.; Saito, K. Integration of transcriptomics and metabolomics for understanding of global responses to nutritional stresses in Arabidopsis thaliana. Proc. Natl. Acad. Sci. USA 2004, 101, 10205–10210. [Google Scholar] [CrossRef]
  21. Xiong, L.; Schumaker, K.S.; Zhu, J.K. Cell signaling during cold, drought, and salt stress. Plant Cell 2002, 14 (Suppl. 1), S165–S183. [Google Scholar] [CrossRef]
  22. Taliaferro, C.M. Diversity and vulnerability of Bermuda turfgrass species. Crop Sci. 1995, 35, 327–332. [Google Scholar] [CrossRef]
  23. Fang, Z.; Liu, C.; Ye, T.; Huang, C.; Zhang, Z.; Wang, Y.; Chan, Z. Integrated transcriptome and proteome analyses provide insight into abiotic stress crosstalks in bermudagrass. Environ. Exp. Bot. 2022, 199, 104864. [Google Scholar] [CrossRef]
  24. Noor, M.; Fan, J.; Kaleem, M.; Akhtar, M.T.; Jin, S.; Nazir, U.; Zhang, C.J.; Yan, X. Assessment of the changes in growth, photosynthetic traits and gene expression in Cynodon dactylon against drought stress. BMC Plant Biol. 2024, 24, 235. [Google Scholar] [CrossRef] [PubMed]
  25. Jin, C.; Peng, L. Antimony’s environmental impact in China. Science 2024, 386, 280–281. [Google Scholar] [CrossRef] [PubMed]
  26. Xie, Y.; Fan, J.; Zhu, W.; Amombo, E.; Lou, Y.; Chen, L.; Fu, J. Effect of heavy metals pollution on soil microbial diversity and bermudagrass genetic variation. Front. Plant Sci. 2016, 7, 755. [Google Scholar] [CrossRef] [PubMed]
  27. Lin, K.H.; Huang, M.Y.; Huang, W.D.; Hsu, M.H.; Yang, Z.W.; Yang, C.M. The effects of red, blue, and white light-emitting diodes on the growth, development, and edible quality of hydroponically grown lettuce (Lactuca sativa L. var. capitata). Sci. Hortic. 2013, 150, 86–91. [Google Scholar] [CrossRef]
  28. Zhu, Y.M.; Li, Z.F.; Shen, J.; Wu, K.; Zhao, P.; Wu, Z.; Liu, Z.; Yang, J.; Liu, H.; Rensing, C.; et al. Toxicity of different forms of antimony to rice plants: Photosynthetic electron transfer, gas exchange, photosynthetic efficiency, and carbon assimilation combined with metabolome analysis. J. Hazard. Mater. 2022, 437, 129433. [Google Scholar] [CrossRef]
  29. He, S.X.; Chen, J.Y.; Hu, C.Y.; Han, R.; Dai, Z.H.; Guan, D.X.; Ma, L.Q. Uptake, speciation and detoxification of antimonate and antimonite in As-hyperaccumulator Pteris Cretica L. Environ. Pollut. 2022, 308, 119653. [Google Scholar] [CrossRef]
  30. Zhou, X.J.; Sun, C.Y.; Zhu, P.F.; Liu, F. Effects of antimony stress on photosynthesis and growth of Acorus calamus. Front. Plant Sci. 2018, 9, 579. [Google Scholar] [CrossRef]
  31. Huang, H.L.; Ullah, F.; Zhou, D.X.; Yi, M.; Zhao, Y. Mechanisms of ROS regulation of plant development and stress responses. Front. Plant Sci. 2019, 10, 800. [Google Scholar] [CrossRef]
  32. AbdElgawad, H.; Zinta, G.; Hamed, B.A.; Selim, S.; Beemster, G.; Hozzein, W.N.; Wadaan, M.A.M.; Asard, H.; Abuelsoud, W. Maize roots and shoots show distinct profiles of oxidative stress and antioxidant defense under heavy metal toxicity. Environ. Pollut. 2020, 258, 113705. [Google Scholar] [CrossRef]
  33. Zeng, L.; Cai, J.S.; Li, J.J.; Lu, G.Y.; Li, C.S.; Fu, G.P.; Zhang, X.K.; Ma, H.Q.; Liu, Q.Y.; Zou, X.L.; et al. Exogenous application of a low concentration of melatonin enhances salt tolerance in rapeseed (Brassica napus L.) seedlings. J. Integr. Agric. 2018, 17, 328–335. [Google Scholar] [CrossRef]
  34. Li, Y.; Zhang, S.N.; Bao, Q.L.; Chu, Y.; Sun, H.; Huang, Y. Jasmonic acid alleviates cadmium toxicity through regulating the antioxidant response and enhancing the chelation of cadmium in rice (Oryza sativa L.). Environ. Pollut. 2022, 304, 119178. [Google Scholar] [CrossRef]
  35. Zhang, D.; Pan, X.; Mu, G.; Wang, J. Toxic effects of antimony on photosystem II of Synechocystis sp. as probed by in vivo chlorophyll fluorescence. J. Appl. Phycol. 2010, 22, 479–488. [Google Scholar] [CrossRef]
  36. Ma, J.; Lv, C.; Xu, M.; Chen, G.; Lv, C.; Gao, Z. Photosynthesis performance, antioxidant enzymes, and ultrastructural analyses of rice seedlings under chromium stress. Environ. Sci. Pollut. Res. 2016, 23, 1768–1778. [Google Scholar] [CrossRef]
  37. Srinivasulu, P.; Murthy, S.D.S. Action of selected heavy metal on photosynthetic electron transport activities of maize thylakoid membranes. Int. J. Plant Anim. Environ. Sci. 2015, 5, 90–93. [Google Scholar]
  38. Wang, S.; Wufuer, R.; Duo, J.; Li, W.; Pan, X. Cadmium caused different toxicity to photosystem I and photosystem II of freshwater unicellular algae Chlorella pyrenoidosa (Chlorophyta). Toxics 2022, 10, 352. [Google Scholar] [CrossRef]
  39. Kim, E.Y.; Choi, Y.H.; Lee, J.I.; Kim, I.H.; Nam, T.J. Antioxidant activity of Oxygen Evolving Enhancer Protein 1 purified from Capsosiphon fulvescens. J. Food Sci. 2015, 80, H1412–H1417. [Google Scholar] [CrossRef] [PubMed]
  40. Jaskulak, M.; Rostami, S.; Zorena, K.; Vandenbulcke, F. Transcriptome sequencing of Brassica napus highlights the complex issues with soil supplementation with sewage sludge. Chemosphere 2022, 298, 134321. [Google Scholar] [CrossRef] [PubMed]
  41. Zhu, S.; Sun, S.; Zhao, W.; Yang, X.; Mao, H.; Sheng, L.; Chen, Z. Utilizing transcriptomics and proteomics to unravel key genes and proteins of Oryza sativa seedlings mediated by selenium in response to cadmium stress. BMC Plant Biol. 2024, 24, 360. [Google Scholar] [CrossRef] [PubMed]
  42. Zhou, J.; Hong, H.; Zhao, J.; Fang, R.; Chen, S.; Tang, C. Metabolome analysis to investigate the effect of heavy metal exposure and chemoprevention agents on toxic injury caused by a multi-heavy metal mixture in rats. Sci. Total. Environ. 2024, 906, 167513. [Google Scholar] [CrossRef] [PubMed]
  43. Zhan, W.; Guo, G.; Cui, L.; Rashid, M.A.R.; Jiang, L.; Sun, G.; Yang, J.; Zhang, Y. Combined transcriptome and metabolome analysis reveals the effects of light quality on maize hybrids. BMC Plant Biol. 2023, 23, 41. [Google Scholar] [CrossRef]
  44. Song, J.; Chen, Y.; Jiang, G.; Zhao, J.; Wang, W.; Hong, X. Integrated analysis of transcriptome and metabolome reveals insights for low-temperature germination in hybrid rapeseeds (Brassica napus L.). J. Plant Physiol. 2023, 291, 154120. [Google Scholar] [CrossRef] [PubMed]
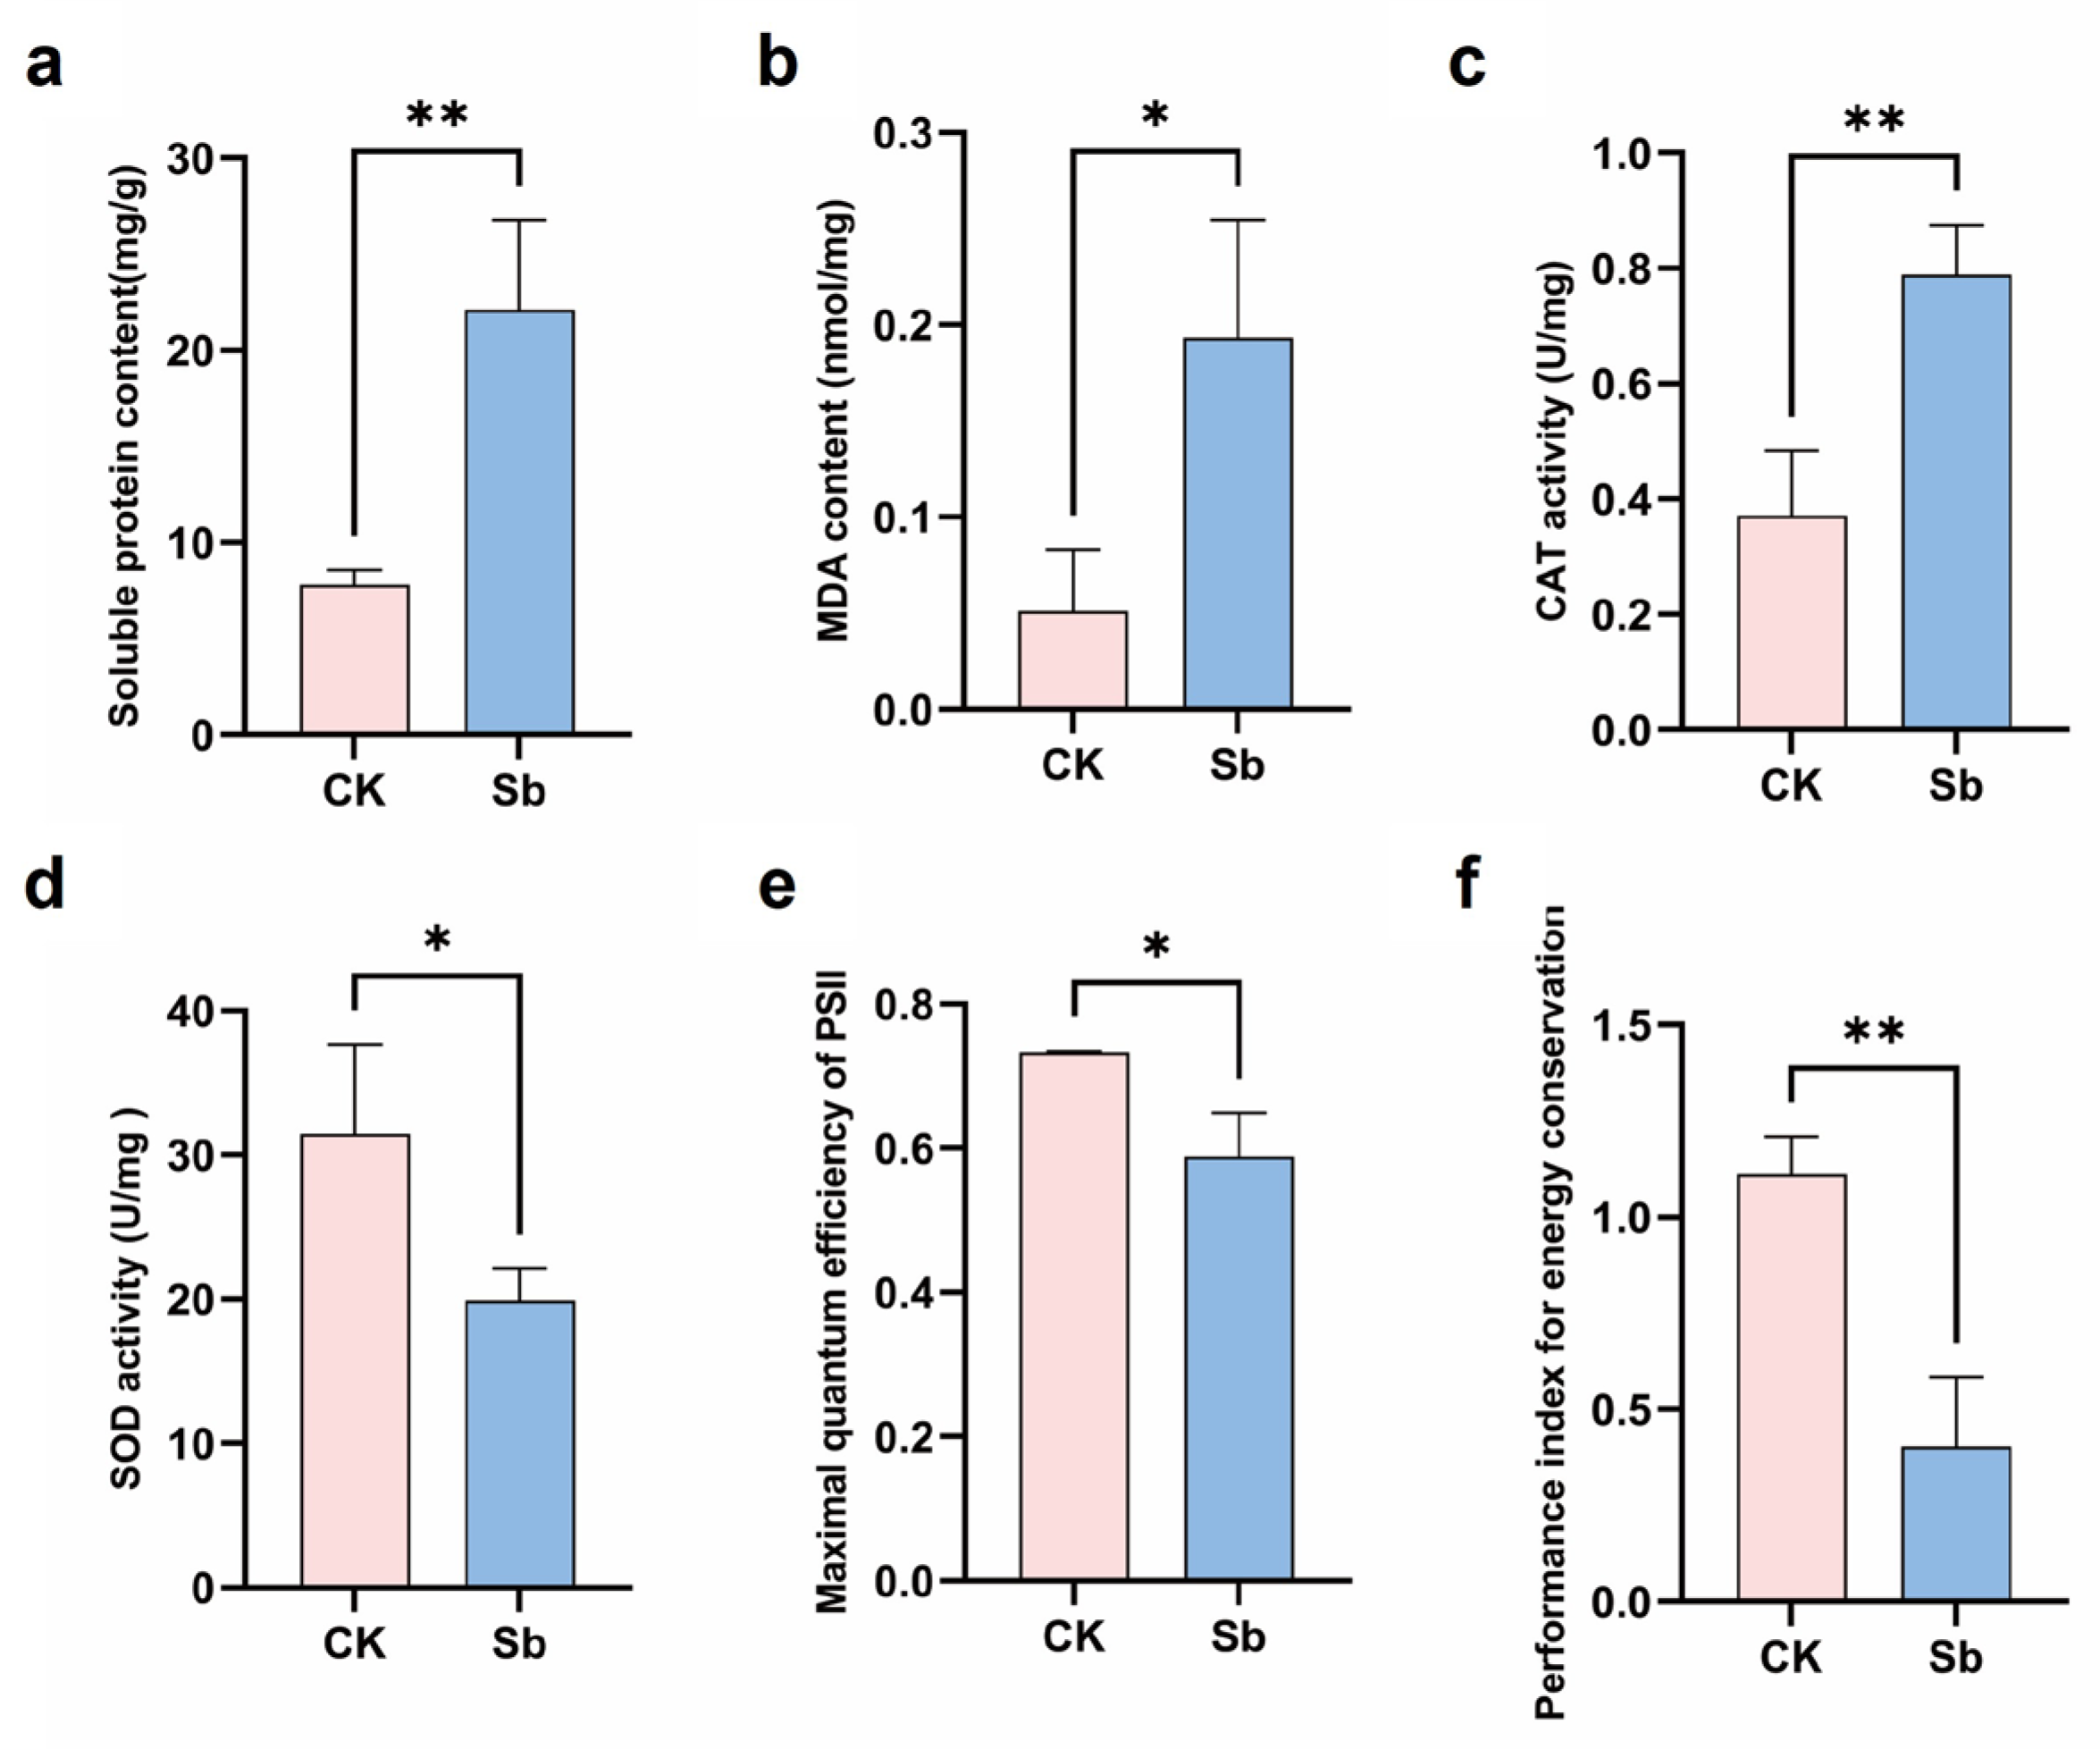
Figure 1. Physiological changes in bermudagrass under Sb stress. (a) Soluble protein content. (b) Malondialdehyde (MDA) content. (c) Catalase (CAT) activity. (d) Superoxide dismutase (SOD) activity. (e) The maximal quantum efficiency of PSII. (f) Performance index for energy conservation. CK = control. Sb = treatment with 200 mg/L potassium antimony tartrate for 15 days. * = significance at p < 0.05; ** = significance at p < 0.01.
Agriculture 15 02221 g001
Figure 2. Analysis of bermudagrass transcriptome data under antimony stress. (a) Pearson correlation between samples. (b) Principal component (PCA) analysis. (c) Gene expression heatmap of three treatment groups (CK, Sb12, Sb24). CK = control. Sb12 = treatment for 12 h. Sb24 = treatment for 24 h.
Agriculture 15 02221 g002
Figure 3. Enrichment analysis of differentially expressed genes (DEGs). (ac) Volcanic map of DEGs in three different treatment groups. (df) KEGG enrichment pathway of DEGs in the comparison groups. (gi) Pathways significantly enriched in the GO analysis. padj = adjusted p-value. DEGs: differentially expressed genes.
Agriculture 15 02221 g003
Figure 4. Metabolomic data analysis. (a) Principal component (PCA) analysis. (b) Pie map of super class of differential metabolites. (ce) Volcanic maps of differential metabolites in three groups. (fh) KEGG classification of differentially accumulated metabolites (DAMs).
Agriculture 15 02221 g004
Figure 5. Association analysis of transcriptome and metabolome. (ac) Nine quadrant maps of DEGs and DMs; (df) the Venn plots of DEGs and SDMs involved in KEGG pathways in the comparisons of Sb12 vs. CK, Sb24 vs. CK, and Sb24 vs. Sb12, respectively.
Agriculture 15 02221 g005
Disclaimer/Publisher’s Note: The statements, opinions and data contained in all publications are solely those of the individual author(s) and contributor(s) and not of MDPI and/or the editor(s). MDPI and/or the editor(s) disclaim responsibility for any injury to people or property resulting from any ideas, methods, instructions or products referred to in the content.