Article

Soil Enzyme Activities and Microbial Carbon Pump Promote Carbon Storage by Influencing Bacterial Communities Under Nitrogen-Rich Conditions in Tea Plantation

1
Research Institute of Forestry, Chinese Academy of Forestry, Beijing 100091, China
2
College of Forestry, Shandong Agricultural University, Taian 271018, China
3
Key Laboratory of National Forestry and Grassland Administration/Beijing for Bamboo & Rattan Science and Technology, International Center for Bamboo and Rattan, Beijing 100102, China
*
Author to whom correspondence should be addressed.
Agriculture 2025, 15(3), 238; https://doi.org/10.3390/agriculture15030238
Submission received: 17 December 2024 / Revised: 16 January 2025 / Accepted: 21 January 2025 / Published: 22 January 2025
(This article belongs to the Section Agricultural Soils)

Abstract

:
Carbon–nitrogen (C-N) coupling is a fundamental concept in ecosystem ecology. Long-term excessive fertilization in tea plantations has caused soil C-N imbalance, leading to ecological issues. Understanding soil C-N coupling under nitrogen loading is essential for sustainable management, yet the mechanisms remain unclear. This study examined C-N coupling in tea plantation soils under five fertilization regimes: no fertilization, chemical fertilizer, chemical + organic cake fertilizer, chemical + microbial fertilizer, and chemical + biochar. Fertilization mainly increased particulate organic carbon (POC) and inorganic nitrogen, driven by changes in bacterial community composition and function. Mixed fertilization treatments enhanced the association between bacterial communities and soil properties, increasing ecological complexity without altering overall trends. Fungal communities had a minor influence on soil C-N dynamics. Microbial necromass carbon (MNC) and microbial carbon pump (MCP) efficacy, representing long-term carbon storage potential, showed minimal responses to short-term fertilization. However, the microbial necromass accumulation coefficient (NAC) was nitrogen-sensitive, indicating short-term responses. PLS-PM analysis revealed consistent C-N coupling across the treatments, where soil nitrogen influenced carbon through enzyme activity and MCP, while bacterial communities directly affected carbon storage. These findings provide insights for precise soil C-N management and sustainable tea plantation practices under climate change.

1. Introduction

Tea (Camellia sinensis L.) is one of the world’s top three non-alcoholic beverages and a major economic crop in developing countries, such as China, India, Sri Lanka, and Kenya. Its cultivation area has been steadily expanding [1]. In 2022, the global tea plantation area reached approximately 5.32 million hectares, with China accounting for 3.33 million hectares, representing 62.6% of the global total [2]. However, long-term fertilization practices in tea plantations have led to soil carbon–nitrogen (C-N) imbalance, causing a series of ecological problems, such as soil degradation, increased greenhouse gas emissions, and aggravated non-point source pollution [3]. Tea plantations have also become hotspots for N2O emissions [4]. Therefore, understanding the mechanisms of soil C-N coupling and optimizing C-N management are fundamental for the sustainable development of tea plantation ecosystems.
C-N coupling was initially understood as nitrogen limitation, as plant growth generally increases with additional nitrogen input [5]. However, long-term nitrogen amendments (e.g., fertilization) have increased nitrogen availability, significantly influencing soil carbon dynamics and storage [6]. In fertilized ecosystems, nitrogen loss to the atmosphere within days or weeks, primarily through volatilization and denitrification, depends on the form of nitrogen applied and subsequent soil management practices. Only a small fraction of the nitrogen is assimilated by plants or retained in the soil [7]. Previous studies suggested that nitrogen addition influences soil carbon storage by affecting microbial metabolism and belowground biomass. Nitrogen inputs reduce the production of carbon-degrading enzymes by microbes while enhancing belowground plant productivity, thereby promoting soil carbon accumulation [8]. Nitrogen addition alters soil microbial community structure and metabolic activity, promoting the proliferation of nitrogen-related functional microbes (e.g., nitrifiers and denitrifiers) and increasing the activities of nitrogen-associated enzymes (e.g., NAG, LAP) [9]. These changes accelerate the decomposition of soil organic matter. Simultaneously, the availability of ammonium and nitrate for plant roots increases, enhancing plant-mediated carbon inputs to the soil [10]. In recent years, the role of microbial necromass in soil carbon accumulation and transformation has gained increasing attention. Nitrogen addition not only impacts the transient responses of microbial communities but also directly or indirectly influences microbial contributions to soil carbon accumulation and transformation [11]. Microbial growth and metabolism play a crucial role in regulating the formation and accumulation of soil carbon pools. After microbial death, their necromass and metabolic byproducts persist relatively stably in the soil, contributing to the soil carbon pool as microbial residues. The continuous generation of microbial residues, driven by the iterative growth and death of microbial communities, is defined as the microbial carbon pump (MCP) [12]. The ratio of microbial necromass carbon to soil organic carbon represents the MCP efficacy. Nitrogen addition enhances microbial activity and turnover rates, accelerating the formation of microbial necromass and altering MCP efficacy [13]. Microbial necromass carbon, as a recalcitrant organic carbon component, is essential for regulating soil carbon pool stability through its accumulation rate and MCP efficacy [14].
Soil enzymes play a critical role in the decomposition of organic matter, with their high activity releasing significant amounts of bioavailable organic nitrogen and carbon, thereby influencing the metabolic patterns of bacterial communities [15]. Under nitrogen-rich conditions, plants reduce direct carbon inputs to the soil, leading to a decrease in the soil carbon-to-nitrogen ratio (C/N). Changes in soil enzyme activity subsequently regulate the soluble C/N, which promotes the proliferation of specific bacterial communities while suppressing microbes that depend on high-carbon sources [16]. Although plants reduce rhizosphere carbon inputs under nitrogen-rich conditions, this does not negate their influence on soil C-N coupling. Instead, plants may indirectly shape microbial community functions by regulating soil enzyme activity [17]. Regulatory compounds secreted by plant roots, such as organic acids, amino acids, and phenolic compounds, can significantly alter soil enzyme activity, thereby influencing microbial strategies for carbon and nitrogen utilization [18]. This reflects an adaptive strategy of plants in nitrogen-rich environments, wherein plants reduce root carbon inputs to minimize competition with microbes and avoid unnecessary carbon losses while maintaining a stable C/N [19]. Consequently, microbial reliance on carbon sources shifts from direct plant inputs to decomposition products released by soil enzyme activity [20,21]. Therefore, understanding how soil enzymes regulate microbial communities and MCP efficacy following fertilization is key to elucidating C-N coupling.
Due to the high economic value of tea, nitrogen application rates in tea plantations are significantly higher than those in other managed ecosystems [22]. Tea plants, as a leaf-harvested cash crop, require considerable nitrogen inputs, with application rates ranging from 100 to 1200 kg N ha−1 y−1 [23,24]. In general, nitrogen application rates of 100 to 300 kg N ha−1 y−1 show a positive correlation with both tea yield and quality [25]. Excessive chemical fertilizer application does not effectively ensure tea yield and quality but instead exacerbates soil acidification and nutrient imbalances [26]. To enhance nitrogen use efficiency and reduce environmental risks, numerous studies have explored mixed fertilization practices, combining chemical fertilizers with organic fertilizers, microbial inoculants, or biochar [27]. Such practices have also been shown to increase soil carbon stocks in tea plantations [28]. While higher SOC levels can boost tea yield under low or moderate nitrogen applications, excessive nitrogen input coupled with high SOC levels may reduce the efficiency of fertilizer in improving yield [29]. Nitrogen addition disrupts soil stoichiometric balance, altering microbial resource allocation and community structure, which influences MCP efficacy through interactions between nitrogen availability and soil carbon dynamics [30]. Therefore, elucidating the soil C-N coupling processes under fertilization is essential for optimizing the nitrogen-yield relationship in tea plantations and promoting long-term carbon sequestration.
In this study, we investigated the C-N coupling processes in tea plantation soils under nitrogen-rich conditions during the initial stage of fertilization. Five common fertilization regimes were examined: no fertilization (CK), chemical fertilizer (FF), combined application of chemical and organic cake fertilizer (FO), combined application of chemical and microbial fertilizer (FM), and combined application of chemical fertilizer and biochar (FB). We hypothesized the following: (i) fertilization increases microbial necromass, thereby promoting soil carbon accumulation; (ii) fertilization alters microbial resource acquisition strategies; (iii) different fertilization regimes had minimal short-term effects on MCP efficacy, with soil enzymes playing a dominant role in regulating soil C-N coupling during this period.

2. Materials and Methods

2.1. Site Description and Experimental Design

The study was conducted at the Changchong Experimental Tea Plantation in Hefei, Anhui Province, China (117°8′52″ E, 31°18′53″ N). The site is characterized by a subtropical monsoon climate with distinct seasons. The mean annual temperature is 15.8 °C, and the mean annual precipitation is 1188 mm, with most rainfall occurring between May and July. During the experimental period, the daily average temperature was 22.27 ± 2.42 °C, with an average humidity of 78.01 ± 5.18%, and the total precipitation amounted to 97 mm. The soil type is classified as yellow-brown soil.
This study was conducted in a uniformly managed tea plantation with a tea plant age of six years. Five fertilization regimes were applied: no fertilization (CK), chemical fertilizer (FF), combined application of chemical and organic cake fertilizer (FO), combined application of chemical and microbial fertilizer (FM), and combined application of chemical fertilizer and biochar (FB). A randomized block design was adopted, with 20 plots (5 × 5 m) and four replicates per treatment. The chemical fertilizer contained nitrogen (N), phosphorus (P), and potassium (K) in a 22:8:15 ratio. The organic cake fertilizer consisted of 60.40% organic matter, 7.02% N, 3.01% P, and 1.60% K. The microbial fertilizer (Beijing Runze Xinye Bioengineering Technology Co., Ltd., Beijing, China) contained 40% organic matter, 5% total nutrients, and 2 billion viable microbes per gram of soil. The biochar comprised 42.21% organic carbon, 8.34% N, 2.31% P, and 16.12% K. The organic cake fertilizer was primarily derived from rapeseed cake, the microbial fertilizer contained Bacillus strains, and the biochar was produced using corn stalks as the main raw material. Fertilizer application rates followed local practices: chemical fertilizer at 300 kg N ha−1 y−1, organic fertilizer at 12 t ha−1 y−1, microbial fertilizer at 1.8 t ha−1 y−1, and biochar at 10 t ha−1 y−1. Fertilization treatments were applied in May 2023. Trenches approximately 15 cm deep were dug about 10 cm away from the tea plant roots, and the fertilizers were evenly distributed in the trenches before covering them with soil.

2.2. Soil Sampling and Analysis

Topsoil samples (0–20 cm) were collected both before fertilization and 30 days after treatment. Five soil cores were randomly taken from each plot and combined into a composite sample. The composite samples were sieved through 2 mm mesh and divided into three portions for subsequent analysis. One portion was stored at 4 °C and analyzed for soil enzyme activity within one week. Another portion was stored at room temperature for soil physicochemical property measurements. The remaining portion was stored at −80°C for DNA extraction to analyze microbial diversity. Using the complete dataset, we analyzed the soil C-N coupling processes in tea plantations under nitrogen-rich conditions during the early stages of fertilization.
The total carbon (TC) and total organic carbon (TOC) contents were measured using a total organic carbon analyzer (Shimadzu, TOC-LCPH, Kyoto, Japan). The total nitrogen (TN) content was determined with an elemental analyzer (Elementar, vario MACRO cube, Langenselbold, Germany). Dissolved organic carbon (DOC) was quantified using an automatic organic carbon analyzer (Elementar, vario TOC cube, Langenselbold, Germany). The particulate organic carbon (POC) and mineral-associated organic carbon (MAOC) contents were measured using the potassium dichromate heating method [31]. Ammonium nitrogen (NH4+-N) was analyzed using the indophenol blue colorimetric method, nitrate nitrogen (NO3⁻-N) using UV spectrophotometry, and nitrite nitrogen (NO2⁻-N) using the diazotization–azo colorimetric method. These nitrogen forms were quantified with a UV–Vis spectrophotometer (UV-1800PC, Shanghai Meipuda Instruments Co., Ltd., Shanghai, China). The soil microbial biomass carbon (MBC) and nitrogen (MBN) were determined by the chloroform fumigation–extraction method [32]. The soil pH was measured using a pH meter after mixing the soil and deionized water at a 1:2.5 (w/v) ratio. In addition, the soil inorganic carbon (IC) and soil organic nitrogen (ON) contents were calculated using the following formulas:
IC = TC − TOC
ON = TN − (NH4+-N + NO3-N + NO2⁻-N)

2.3. Soil Enzymes Activities

The activities of β-1,4-glucosidase (BG), β-1,4-N-acetylglucosaminidase (NAG), and leucine aminopeptidase (LAP) were measured using the fluorescence method [33]. Approximately 1 g of fresh soil was mixed with 50 mL of 50 mM sodium acetate buffer and vortexed for 30 s to prepare a soil slurry. Then, 200 μL of the soil slurry and 50 μL of a substrate solution were dispensed into black microplates. The NAG was incubated for 2 h, while BG and LAP were incubated for 4 h. The fluorescence intensity was measured using an excitation wavelength of 360 nm and an emission wavelength of 460 nm.

2.4. Microbial Diversity Analysis

DNA was extracted from 0.5 g of soil per sample using an E.Z.N.A.® Soil DNA Kit (Omega Bio-tek, Norcross, GA, USA) following the manufacturer’s instructions to obtain the total genomic DNA from microbial communities. The quality of the extracted DNA was assessed by 1% agarose gel electrophoresis, and the DNA concentration and purity were determined using a NanoDrop2000 spectrophotometer (Thermo Scientific, Waltham, MA, USA). The extracted DNA was used as a template for PCR amplification of the V3-V4 variable region of the 16S rRNA gene using forward primer 338F (5′-ACTCCTACGGGAGGCAGCAG-3′) and reverse primer 806R (5′-GGACTACHVGGGTWTCTAAT-3′). For fungal community analysis, the ITS2 region was amplified using forward primer ITS3F (5′-GCATCGATGAAGAACGCAGC-3′) and reverse primer ITS4R (5′-TCCTCCGCTTATTGATATGC-3′). The PCR conditions for the 16S rRNA gene were as follows: initial denaturation at 95 °C for 3 min, followed by 27 cycles of denaturation at 95 °C for 30 s, annealing at 55 °C for 30 s, and extension at 72 °C for 30 s, with a final extension at 72 °C for 10 min. For ITS region amplification, the same thermal conditions were applied, except for 35 cycles instead of 27. The PCR products were then stored at 4 °C (PCR instrument: ABI GeneAmp® 9700, Foster City, CA, USA). Sequencing was performed on the Illumina Nextseq2000 platform by Shanghai Majorbio Bio-Pharm Technology Co., Ltd. (Shanghai, China).
Quality-controlled and merged sequences were denoised using the DADA2 plugin within the Qiime2 pipeline, generating amplicon sequence variants (ASVs). Sequences annotated as chloroplasts and mitochondria were removed from all the samples. The sequencing depth was then rarefied to 20,000 sequences per sample to ensure uniformity. Taxonomic classification of the ASVs was performed using a Naive Bayes classifier implemented in Qiime2. The Silva 16S rRNA gene database (v138) was used for bacterial community classification, and the UNITE 9.0 database was employed for fungal community classification.

2.5. Calculations of MCP Efficacy

Soil amino sugars were measured using gas chromatography–mass spectrometry (GC-MS). Approximately 0.5–1.0 g of soil was placed into hydrolysis tubes, followed by the addition of 5 mL of 6 mol L−1 HCl along the tube wall. Air in the hydrolysis tube was displaced with nitrogen gas for 2 min before sealing the tube. The samples were hydrolyzed at 105 °C for 8 h in an oven. After cooling to room temperature, 250 μg of inositol were added to the hydrolysate, followed by centrifugation and evaporation to dryness. The residue was dissolved in 20 mL of pure water and adjusted to a pH of 6.6–6.8. After centrifugation, the residue was dissolved in 10 mL of anhydrous methanol. Following further centrifugation and nitrogen purging, the supernatant was evaporated to dryness, and 100 μg of arabitol along with 1 mL of water were added and freeze-dried. The derivatized samples were analyzed for amino sugars using a gas chromatograph (GC TRACE 1300, Thermo Fisher, Waltham, MA, USA). Bacterial necromass carbon (BNC) and fungal necromass carbon (FNC) were calculated based on the amino sugar contents using the following formulas [34]:
BNC = muramicacid × 45
FNC = (glucosamine/179.17 − 2 × muramicacid/251.23) × 179.17 × 9
The total microbial necromass carbon (MNC) was calculated as the sum of BNC and FNC. The MCP efficacy was calculated as the ratio of MNC to TOC [35]. Similarly, bacterial carbon pump (BCP) efficacy was calculated as the ratio of BNC to TOC, and fungal carbon pump (FCP) efficacy as the ratio of FNC to TOC. The total microbial necromass accumulation coefficient (T-NAC) was calculated as the ratio of MNC to MBC [36]. The bacterial necromass accumulation coefficient (B-NAC) was determined as the ratio of BNC to MBC, and the fungal necromass accumulation coefficient (F-NAC) as the ratio of FNC to MBC.

2.6. Statistical Analysis

The effects of the fertilization treatments were quantified using the response ratio (R), which is calculated as R = ln (T/C), where T represents the value under the treatment condition, and C represents the value under the control condition. Data calculations were performed using Excel 2021, and visualizations were generated using R 4.3.3. A positive R value indicates a positive treatment effect, while a negative R value indicates a negative treatment effect [37].
The following analyses and visualizations were conducted using R 4.3.3 and Gephi 0.10.1. Microbial community structure similarity among the samples was assessed using principal co-ordinates analysis (PCoA) based on the Bray–Curtis distance algorithm. To evaluate whether the microbial community structures differed significantly between the sample groups, an analysis of similarities (ANOSIM) was conducted. A correlation network was constructed using the top 100 most abundant microbial taxa, based on species–environment Spearman correlation coefficients (|r| > 0.6, p < 0.05). A heatmap illustrating the correlations between microbial taxa and environmental factors was generated using Spearman correlation coefficients, with hierarchical clustering performed using the Euclidean distance algorithm and complete-linkage hierarchical clustering. Group differences in MNC, T-NAC, and MCP efficacy were analyzed using Fisher’s LSD multiple comparison test. A correlation heatmap of environmental factors was constructed using Pearson correlation coefficients to visualize the relationships among these factors. The relationships between MNC, T-NAC, MCP efficacy, and each environmental factor were analyzed using the Mantel test. The relationships among the fertilization treatments, soil physicochemical properties, and microbial communities were further explored using the partial least squares path model (PLS-PM).

3. Results

3.1. Response of Soil Physicochemical Properties to Fertilization

All the fertilization treatments significantly influenced the accumulation of soil carbon and nitrogen components, though the mechanisms and magnitudes of their effects varied across the treatments. All the treatments positively affected POC, inorganic nitrogen forms (NH4+-N, NO3-N, and NO2-N), and NAG activity. Among the treatments, FM had the most comprehensive positive effects on carbon and nitrogen components, though it did not show the highest impact for each individual indicator. FO exhibited the strongest effect on POC, with an effect size of 0.86. However, FO had the weakest effect on NO3-N (effect size of 1.48), while the other treatments all exceeded 2.50. For NO2-N, FB had the weakest effect, with an effect size of 1.09, while FF had a higher effect size of 2.41, and the other treatments exceeded 3.40. For NH4+-N, all the treatments exhibited similar strengths, with effect sizes greater than 3.50. The FM and FO treatments had stronger effects on NAG activity compared to FF and FB. MBC showed a decreasing trend, whereas MBN increased across the treatments. The soil pH exhibited minimal variation across the treatments (Figure 1).

3.2. Response of Microbial Communities to Fertilization

After fertilization, no significant differences were observed in the bacterial community composition at the phylum level across the treatments (Figure 2a). However, the community structure differed significantly among the treatments (Figure 2c). The dominant bacterial phyla identified in this study included Acidobacteriota, Proteobacteria, Chloroflexi, Actinobacteriota, and Firmicutes. Following fertilization, the most abundant bacterial phylum shifted from Proteobacteria to Acidobacteriota. Specifically, FO increased the relative abundances of Acidobacteriota, Firmicutes, and Methylomirabilota, while reducing the relative abundances of Chloroflexi and Actinobacteriota. The bacterial composition under the other fertilization treatments showed smaller differences.
The fertilization treatments did not result in significant differences in the fungal community composition at the phylum level (Figure 2d), nor were there significant changes in the community structure (Figure 2f). The dominant fungal taxa identified in this study were Ascomycota, unclassified, and Basidiomycota. Under the FF treatment, the relative abundance of Ascomycota increased, while that of unclassified fungi decreased. Similarly, FB increased the relative abundance of Ascomycota but reduced the relative abundance of Basidiomycota. The other treatments showed minimal differences in fungal composition.
In general, the bacterial communities exhibited more pronounced responses to fertilization treatments, with significant changes in composition and structure. In contrast, the fungal communities showed no significant changes in response to the fertilization treatments.

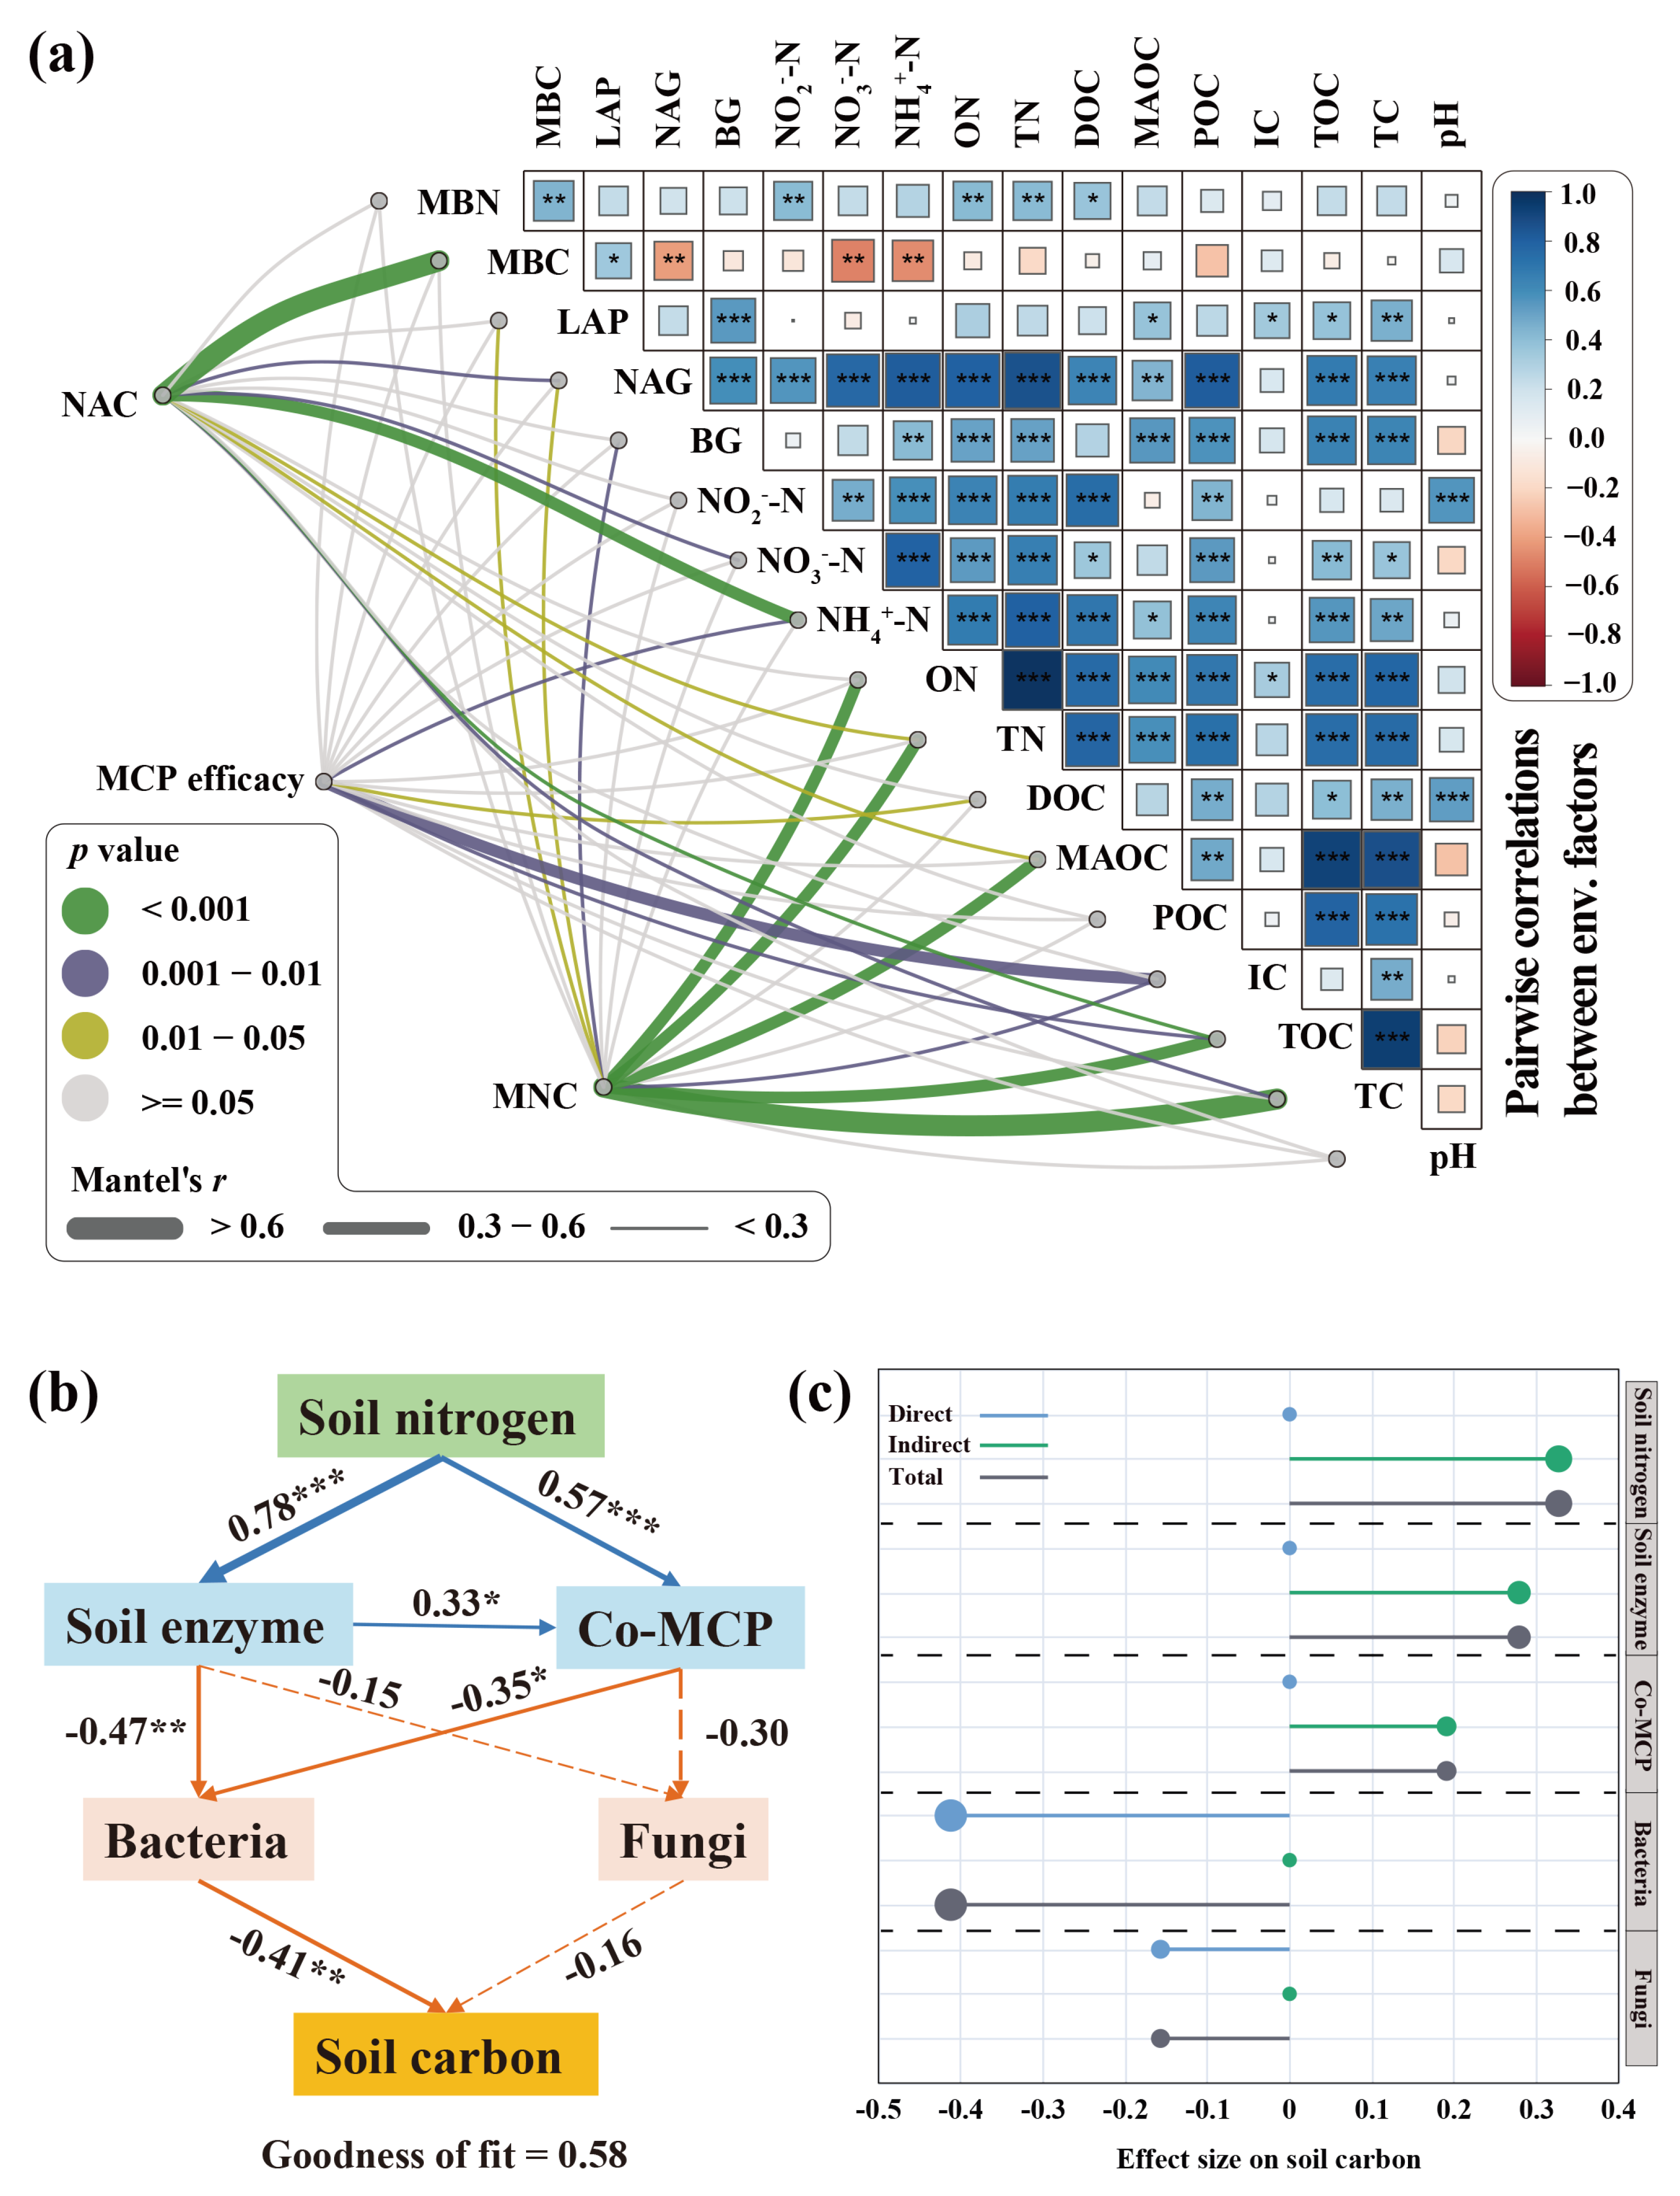
3.3. Relationship Between Microbial Community and Soil Physicochemical Properties

In the bacterial network linking communities to soil physicochemical properties, the average degree values for CK, FF, FO, FM, and FB were 3.92, 5.59, 8.29, 10.99, and 8.97, respectively. Compared to CK and FF, the mixed fertilization treatments (FO, FM, FB) enhanced the connectivity between the bacterial communities and soil physicochemical properties, indicating more complex ecological interactions (Figure 3). FM exhibited the highest average degree, reflecting the strongest overall bacterial community response to soil physicochemical properties. FB and FO followed, with FB and FO showing associations with a broader range of soil properties, suggesting more diverse bacterial functions. In contrast, the FF and FM treatments demonstrated fewer but more focused associations with soil properties (Figure 3). Across all the treatments, bacterial communities were primarily associated with TN, NH4+-N, NO3-N, NO2-N, POC, and NAG. In the fungal network, the average degree values for CK, FF, FO, FM, and FB were 3.34, 4.17, 5.49, 5.09, and 5.45, respectively. Compared to the bacterial communities, the fungal communities exhibited weaker overall responses to soil physicochemical properties (Figure 3). Mixed fertilization increased fungal connectivity to soil properties compared to CK and FF, but the differences between the treatments were smaller than those observed for the bacterial communities. Based on the size and clustering of soil property nodes, FB enhanced fungal functional diversity and increased associations with soil properties, followed by FO. In contrast, FF and FM induced smaller changes in fungal relationships with soil properties. Overall, the fungal communities responded less strongly to the fertilization treatments compared to the bacterial communities, with mixed fertilization fostering slightly higher connectivity and functional diversity.
To further elucidate the relationships between microbial communities and soil physicochemical properties, we focused on dominant communities, defined as those comprising more than 5% of the modules in the network. The dominant bacterial communities included Acidobacteriota, Proteobacteria, Actinobacteriota, Chloroflexi, and Firmicutes (Figure 4a), while the dominant fungal communities were Ascomycota, Basidiomycota, Mucoromycota, and unclassified (Figure 4b). Actinobacteriota, Proteobacteria, Firmicutes, and Ascomycota were positively correlated with soil carbon and nitrogen components, as well as soil enzyme activities (BG and NAG) but were negatively correlated with MBC. In contrast, Acidobacteriota, Chloroflexi, Basidiomycota, and Mucoromycota showed negative correlations with soil carbon and nitrogen components and enzyme activities but positive correlations with MBC (Figure 4c). The unclassified group had no significant effect on soil carbon and nitrogen components. These findings highlight distinct functional roles of microbial taxa in soil carbon and nitrogen cycling, with some groups promoting carbon and nitrogen turnover and others potentially inhibiting these processes.

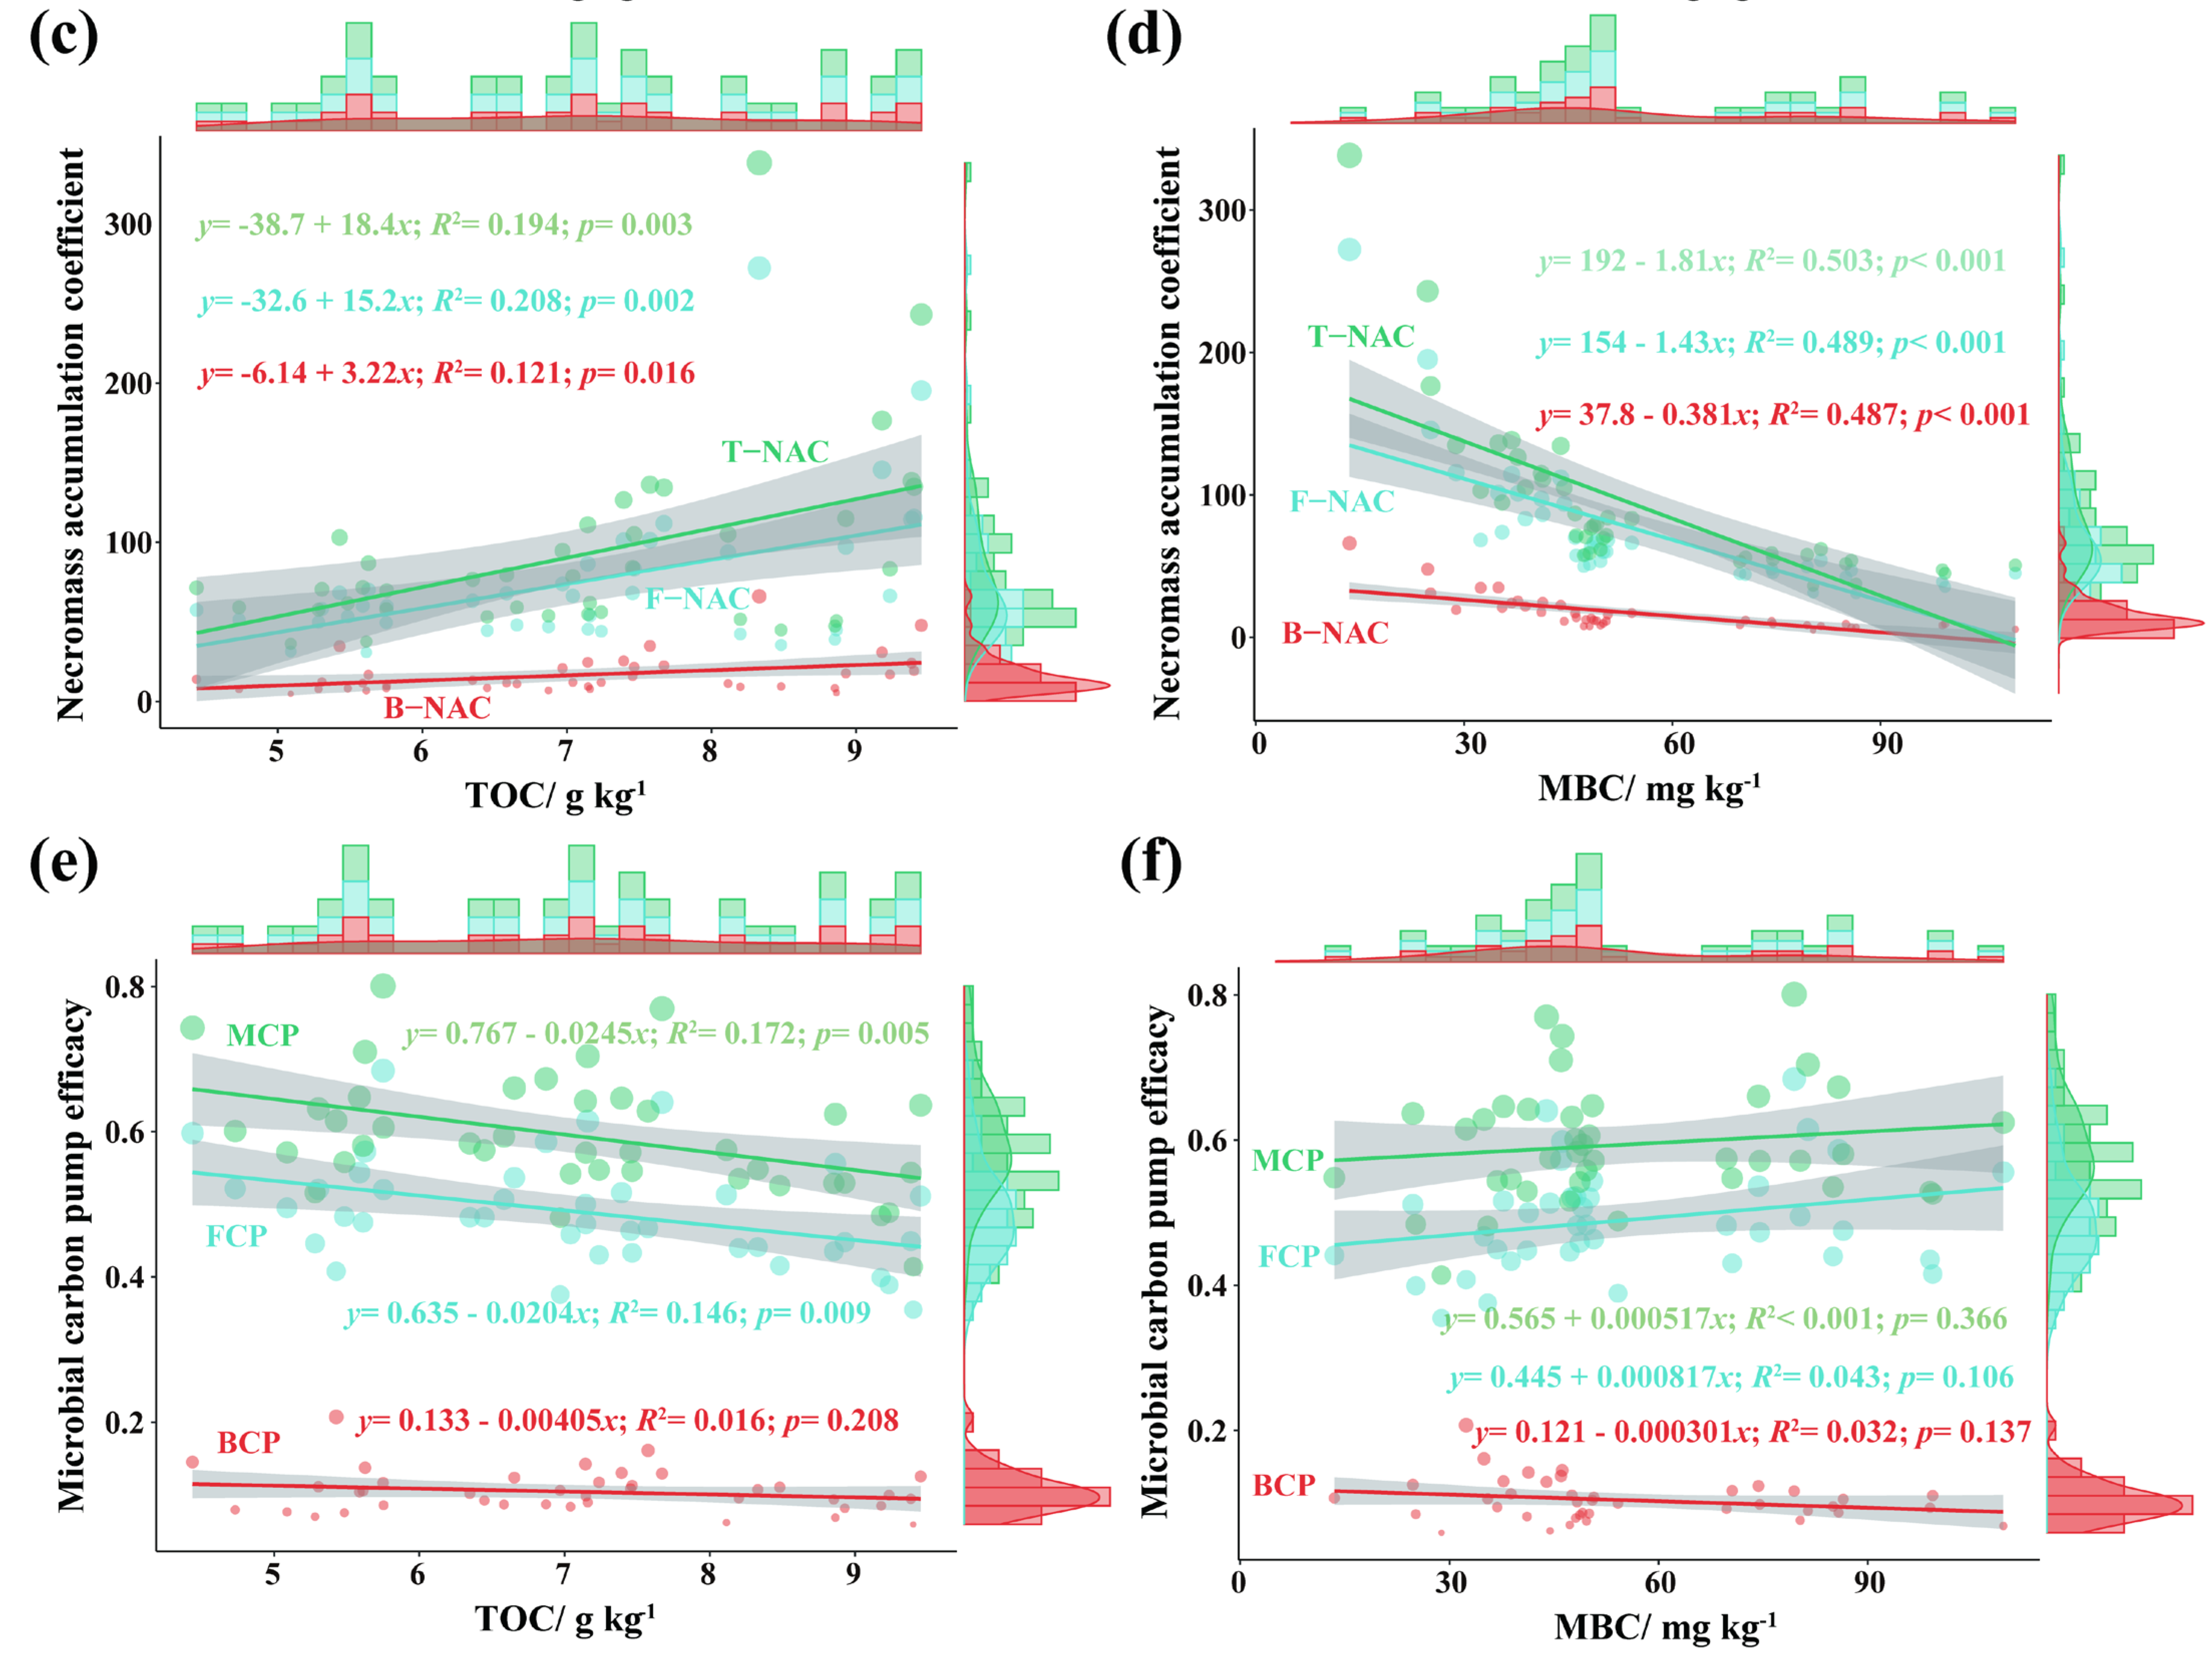
3.4. Responses of Microbial Necromass to Fertilization

There were minimal changes in BNC, FNC, and MNC before and after the fertilization treatments, with no significant differences observed among the treatment groups (Figure 5a,b). This indicates that fertilization had a limited effect on the accumulation of MNC. While B-NAC showed little change across the treatments, F-NAC and T-NAC were significantly higher under the FM treatment compared to the other treatments. Different fertilization treatments exhibited a progressive influence on F-NAC and T-NAC (Figure 5c,d). The MCP efficacy showed no significant differences across the fertilization treatments, suggesting a weak effect of fertilization on MCP efficacy (Figure 5e,f). Overall, while the fertilization treatments had limited effects on MNC, they did influence the necromass accumulation process, with FM being more conducive to microbial necromass accumulation. However, the impact of fertilization on MCP efficacy was negligible.
To clarify the characteristics of MNC, T-NAC, and MCP efficacy during the early stage of fertilization, their relationships with TOC and MBC were analyzed. MNC and FNC significantly increased with TOC, showing high R2 values, indicating a strong positive effect of TOC on the accumulation of MNC and FNC. BNC also increased with TOC but with a lower R2, suggesting that BNC was less influenced by TOC (Figure 6a). In contrast, the relationships between MNC, FNC, BNC, and MBC were not significant, with low R2 values, indicating a weak influence of MBC on MNC (Figure 6b). T-NAC, F-NAC, and B-NAC showed significant positive correlations with TOC, but the R2 values were low, suggesting that the microbial necromass accumulation coefficient (NAC) was only mildly affected by TOC (Figure 6c). However, T-NAC, F-NAC, and B-NAC were negatively correlated with MBC, with high and significant R2 values, indicating a strong inhibitory effect of MBC on NAC (Figure 6d). The MCP efficacy and FCP efficacy decreased with TOC, but the R2 values were low, indicating a minimal effect of TOC on MCP efficacy and FCP efficacy. The impact of TOC on BCP efficacy was not significant (Figure 6e). The MCP efficacy and FCP efficacy were significantly positively correlated with MBC but with low R2 values, while the BCP efficacy was not significantly affected by MBC (Figure 6f). Overall, TOC and MBC are key factors influencing microbial necromass accumulation. TOC exerts a strong positive effect, whereas MBC has a strong negative effect. In contrast, MCP efficacy is less influenced by both TOC and MBC.

3.5. Carbon–Nitrogen Coupling Processes Under Nitrogen-Rich Conditions

Using the complete dataset, we analyzed the soil C-N coupling processes in tea plantations under nitrogen-rich conditions during the early stages of fertilization. Overall, the soil physicochemical properties exhibited significant positive correlations, except for MBC, which showed significant negative correlations with NAG, NH4+-N, and NO3-N. MNC was strongly and significantly positively correlated with TC (r > 0.6) and moderately positively correlated with TOC, MAOC, TN, and ON (0.3 < r < 0.6); NAC showed a strong positive correlation with MBC (r > 0.6) and a significant positive correlation with NH4+-N, while exhibiting weaker correlations with NO3-N and NAG. MCP efficacy was significantly positively correlated only with IC and showed weaker positive correlations with NH4+-N and DOC (Figure 7a).
Based on the results, PLS-PM was employed to elucidate the carbon–nitrogen coupling processes under nitrogen-rich conditions during the early stages of fertilization. The model explained approximately 58% of the variations in soil carbon. Given the lack of significant changes in MCP efficacy, the observed variables MNC, NAC, and MCP efficacy were combined into a latent variable termed Co-MCP. The analysis revealed that bacterial communities had a direct inhibitory effect on soil carbon accumulation. Conversely, soil nitrogen indirectly promoted soil carbon accumulation by enhancing soil enzyme activity and Co-MCP, which, in turn, suppressed bacterial communities. The soil enzyme activity also indirectly facilitated soil carbon accumulation through its influence on Co-MCP. The fungal communities, however, had no significant impact on the process (Figure 7b,c). In summary, under nitrogen-rich conditions, soil nitrogen regulates bacterial communities by affecting soil enzyme activity and Co-MCP, thereby promoting soil carbon sequestration.

4. Discussion

4.1. The Impact of Soil Enzymes on C-N Coupling

Typically, it is believed that under nitrogen-rich conditions, bacteria and fungi are capable of utilizing the additional nitrogen proliferate, leading to increased secretion and activity of soil enzymes [38]. However, the findings of this study indicate that soil enzyme activity regulates bacterial communities (Figure 7b). Soil enzyme activity and microbial communities may engage in more intricate feedback mechanisms. Soil enzymes degrade and transform organic and inorganic substrates, thereby directly or indirectly influencing the energy and nutrient supplies available to microorganisms and reshaping community structure and function [39]. Different functional microbial groups prioritize distinct extracellular enzyme repertoires, further altering nutrient cycling efficiency and, in turn, exerting reciprocal regulation on the enzymatic system [40]. Over time, this two-way feedback establishes a dynamic equilibrium, in which the soil system undergoes continuous microhabitat remodeling and functional succession, ultimately driving tight coupling between nitrogen and carbon processes.
We found that Actinobacteriota, Proteobacteria, Firmicutes, and Ascomycota displayed positive correlations with soil carbon and nitrogen components, as well as soil enzyme activities, whereas Acidobacteriota, Chloroflexi, Basidiomycota, and Mucoromycota showed negative correlations (Figure 4c). This pattern may reflect distinct resource inheritance strategies. Under conditions of high nutrient availability and elevated enzyme activities, microorganisms capable of rapidly utilizing soluble carbon and nitrogen while synthesizing and secreting multiple extracellular enzymes (e.g., certain Proteobacteria, Actinobacteriota, Firmicutes, and Ascomycota) often gain a competitive edge [41]. By continually enhancing the production and diversity of these enzymes, they accelerate nutrient breakdown and transformation, thereby consolidating a eutrophic soil niche characterized by high enzyme activity and biomass. Once this niche and its associated microbial community are established, they tend to confer a genetic or memory effect on subsequent microbial succession and the retention of functional genes [42]. In contrast, oligotrophic taxa, such as Acidobacteriota, Chloroflexi, Basidiomycota, and Mucoromycota, are better adapted to environments where soil organic matter is relatively recalcitrant or nitrogen utilization efficiency is low [43]. Under these nutrient-poor conditions, they employ specialized metabolic pathways, structural protein modifications, or ecological strategies (e.g., forming hyphal networks or secreting fewer but more targeted enzymes) to utilize recalcitrant substrates [44]. Once such nutrient-poor microenvironments reach a stable state, the characteristic traits of these communities may persist, reflecting their capacity to maintain stable populations even under limited resource availability [39].
Under nitrogen-rich conditions, shifts in resource utilization strategies by both plants and microorganisms can create more complex cooperative or competitive interactions, rather than simply exerting stimulatory or inhibitory effects on microbial communities. Various factors, including soil physical structure, root exudates, and environmental parameters, may also intervene to either reinforce or weaken the observed positive or negative correlations. Soil pore-space architecture influences enzyme diffusion and substrate accessibility, favoring microbial populations adept at exploiting micro-scale resources. Likewise, root exudates can modify local pH or provide specific organic acids, shaping both competitive and mutualistic relationships among co-occurring taxa [45]. Moreover, climatic pulses (e.g., seasonal rainfall or drought) periodically alter soil enzyme activity and substrate availability, leading to cyclical expansions or declines in microbial groups displaying positive or negative correlations with soil properties [46]. Under such multifactorial influences, the mechanisms by which soil enzymes and microbial communities jointly regulate C-N coupling often exhibit pronounced spatiotemporal heterogeneity.

4.2. Response of MCP Efficacy to Nitrogen Addition

MCP efficacy measures the ability of microbial communities to transform and store organic carbon in soil, representing their role in long-term carbon sequestration [47]. MCP efficacy focuses on carbon stability and its long-term retention rather than short-term responses [48]. As such, in this study, the MCP efficacy showed no significant response to fertilization treatments (Figure 5c,d) but was significantly positively correlated with IC (Figure 7a). This highlights the potential of inorganic carbon as an indicator of MCP efficacy. The accumulation and stability of IC in soil reflect microbial activity’s regulatory function in soil carbon cycling, particularly in carbon transformation and long-term storage [49]. IC formation is closely linked to microbial processes, especially in carbonate formation, which represents the conversion of organic carbon into more stable forms and may be considered part of the MCP process [50]. Furthermore, changes in IC content can indicate the balance between carbon stabilization and loss, indirectly reflecting the long-term MCP efficacy [51]. However, the accumulation of IC is significantly limited in acidic soils [52], suggesting the need for further research to verify its universality and accuracy as an indicator of MCP efficacy.
MCP efficacy has certain limitations in studying soil C-N coupling processes following fertilization. To address these, we extended the concept of MCP by incorporating observed variables MNC, NAC, and MCP efficacy into a new latent variable, Co-MCP. This new variable was found to be influenced by soil nitrogen and enzyme activity under nitrogen-rich conditions, which, in turn, altered bacterial communities and promoted carbon accumulation (Figure 7b). However, the ecological significance of Co-MCP requires further exploration. Similar to MCP efficacy, short-term nitrogen addition does not significantly affect MNC levels in soil. In contrast, under nitrogen-rich conditions, microbial communities tend to allocate more resources to cell growth and metabolism, leading to a significant increase in NAC, thereby enhancing the potential for SOC storage [53]. NAC changes reflect dynamic regulation of soil nutrients and microbial activity in the short term, whereas MCP efficacy and MNC changes are more indicative of long-term balances between accumulation and decomposition processes within the system [54]. Incorporating MNC and NAC into the MCP framework improves the precision of describing and predicting C-N coupling processes. However, further research is needed to validate this expanded indicator system.
Additionally, we found that MNC, NAC, and MCP efficacy were each significantly correlated with TOC, whereas only F-NAC and T-NAC showed significant correlations with MBC (Figure 6). This outcome likely reflects distinct microbial strategies in C-N coupling and nutrient partitioning. Fungi typically possess more extensive hyphal networks and secrete a wider array of extracellular enzymes, enabling them to break down more complex or recalcitrant carbon sources in the soil. Once formed, fungal residues exhibit high stability and strong retention capacity, readily binding to soil minerals or organic colloids, thus displaying a more pronounced positive relationship with MBC. Fungal residues frequently accumulate within soil aggregates or clay–organic complexes, playing a pivotal role in stabilizing soil structure and retaining both carbon and nitrogen [55]. Although bacteria occur in larger numbers and grow more rapidly, their residues are more prone to subsequent microbial degradation or transformation. Consequently, B-NAC is less strongly associated with MBC, likely because bacterial residues undergo faster turnover in soil and exert a comparatively weaker accumulative effect [56]. When TOC increases, microbial communities, especially fungi, tend to allocate more energy to biosynthesis and enzyme secretion, thereby facilitating nitrogen uptake, assimilation, and residue formation [57]. Hence, the formation and accumulation of fungal residues serve as a critical bridge between soil biomass and residue pools. In managing soil microbial residue accumulation, greater emphasis on enhancing or maintaining fungal communities is warranted. This can be achieved by incorporating organic materials rich in lignin or polysaccharides to supply potential substrates, or by maintaining relatively stable soil moisture and aggregate structures that promote fungal growth and residue stabilization. Such practices offer promising avenues for increasing soil organic matter and improving nutrient retention through enhanced fungal contributions.

4.3. Impact of Priming Effect on Soil Carbon Due to Fertilizer Mixing

Fertilizer co-application significantly strengthened the relationships between microbial communities and soil physicochemical properties, resulting in more complex ecological processes (Figure 3 and Figure 4). Additionally, the correlations between various microbial taxa and soil carbon and nitrogen demonstrated a consistent trend, contributing to overall soil carbon accumulation (Figure 1 and Figure 4c). This outcome appears to contradict the typical priming effect. The priming effect refers to the stimulation of microbial activity following the input of external carbon sources (e.g., organic fertilizers), which accelerates the decomposition of pre-existing SOC [58]. This effect arises because microbes gain additional energy resources, altering their metabolic pathways and increasing the decomposition rate of soil organic matter [59]. The discrepancy suggests that while fertilizer co-application enhances C-N coupling and microbial interactions with soil properties, it may also mitigate the magnitude of the priming effect, promoting soil carbon sequestration rather than accelerating decomposition. Further studies are needed to unravel these contrasting mechanisms.
Fertilizer co-application induces a priming effect but still leads to soil carbon accumulation, likely due to the interplay of multiple factors. Although the priming effect enhances microbial activity and accelerates soil organic matter decomposition, the input of external organic carbon may exceed the rate of microbial decomposition [60]. Additionally, microbes utilize external carbon to improve metabolic efficiency, partially converting it into microbial necromass or metabolic byproducts. These microbial necromass components, such as cell fragments and extracellular polymers, are more recalcitrant and gradually accumulate in the soil [61]. Furthermore, fertilizer co-application increases soil mineral nutrients (e.g., iron, aluminum oxides, or clay minerals) that can bind with microbial-derived organic carbon products, forming stable mineral–organic complexes, thereby reducing further organic carbon decomposition [62]. Co-application also promotes plant growth, with root-derived carbon inputs further supplementing SOC stocks. Positive feedback mechanisms between plant roots and rhizosphere microbes can further accelerate soil carbon accumulation rather than loss [63,64]. The priming effect caused by fertilizer co-application can thus be viewed as a short-term disturbance to soil carbon balance. As the fertilization effect gradually diminishes, the soil transitions to a new carbon storage equilibrium. During this process, the input of external nutrients alters microbial utilization of soil carbon sources, stabilizing soil carbon balance after initial fluctuations. However, if the priming effect persists strongly, it may lead to sustained depletion of soil carbon pools, potentially undermining soil carbon storage capacity. In the context of long-term fertilization in agricultural soils, this could increase the risk of soil carbon pool depletion, emphasizing the need for careful management of fertilization practices to balance soil carbon dynamics.
Despite the varying short-term impacts of the five fertilization treatments (CK, FF, FO, FM, and FB) on soil priming effects, they overall conformed to a shared C-N coupling framework during the early fertilization stage (Figure 7b). In other words, shortly after fertilization, the soil system followed a pathway initiated by soil nitrogen inputs, modulated via soil enzyme activity and microbial carbon transformation (Co-MCP), and subjected to feedback from soil carbon and the microbial community. In the short term, exogenous nitrogen emerged as the most immediate driver, stimulating soil enzyme systems and microbial carbon utilization to varying extents. Under nitrogen-rich conditions, microbial pathways of carbon decomposition and uptake are relatively similar. Interestingly, soil carbon showed a negative correlation with the microbial community (particularly bacteria), which may stem from a “carbon supply–microbial consumption” dynamic [65]. When soil carbon is relatively abundant and easily decomposed, microbial populations initially benefit; however, rapid turnover and subsequent nutrient redistribution can favor the replacement of certain bacterial taxa by more competitive groups [66]. This finding aligns with our observation that the predominant bacterial phylum shifted from Proteobacteria to Acidobacteriota (Figure 2a). During the early fertilization period, these distinct fertilization strategies thus follow a unifying model in which nitrogen inputs drive enzymatic activity and microbial carbon processing, ultimately feeding back into soil carbon pools and microbial community structure. As fertilization continues and the soil environment evolves, each treatment will likely diverge in its effects on soil carbon stability, nitrogen fate, and microbial community composition. Nevertheless, in the initial stages, a consistent C-N coupling mechanism is evident across all the treatments. This coherence provides a more straightforward and accurate approach for assessing and quantifying the carbon pool in tea plantations following fertilization.

5. Conclusions

During the early fertilization stages, soil carbon primarily accumulated as POC, driven by enhanced bacterial activity and enzyme-mediated nutrient transformations. While MNC and MCP efficacy displayed limited short-term responses, NAC emerged as a nitrogen-sensitive indicator, reflecting microbial adaptations to nitrogen enrichment. Mixed fertilization regimes promoted soil enzyme activity (BG and NAG) and enhanced microbial interactions with soil properties, particularly among bacterial communities (Actinobacteriota, Proteobacteria, and Ascomycota), which contributed substantially to soil C-N coupling processes. To integrate targeted enzyme regulation and microbial community management into fertilization practices, farmers can consider applying microbial inoculants to boost enzyme-mediated nutrient cycling and selecting mixed fertilizers (e.g., combining organic and microbial fertilizers) to foster synergistic microbial interactions. These strategies aim to enhance soil carbon sequestration while mitigating nitrogen-driven ecological risks. Future research should refine the MCP framework to quantitatively link soil carbon storage efficiency with tea yield and ecological sustainability, paving the way for precision nutrient management in perennial cropping systems.

Author Contributions

Q.S.: writing—original draft, writing—review and editing, visualization, formal analysis, conceptualization, methodology, data curation, software, investigation; S.G.: conceptualization, methodology, project administration, supervision, validation, writing—review and editing; X.L.: investigation, visualization; Z.Y.: investigation; H.W.: investigation; L.Q.: conceptualization, writing—review and editing; X.Z.: conceptualization, funding acquisition, writing—review and editing. All authors have read and agreed to the published version of the manuscript.

Funding

This research was funded by the National Key R&D Program of China (grant number 2022YFF130300203).

Institutional Review Board Statement

Not applicable.

Data Availability Statement

The data presented in this study are available on request from the corresponding author.

Conflicts of Interest

The authors declare that they have no known competing financial interests or personal relationships that could have appeared to influence the work reported in this paper.

Abbreviations

The following abbreviations are used in this manuscript:
BCPbacterial carbon pump
BG β-1,4-glucosidase
B-NACbacterial necromass accumulation coefficient
BNCbacterial necromass carbon
CKno fertilization
C-Ncarbon–nitrogen
DOCdissolved organic carbon
FBcombined application of chemical fertilizer and biochar
FCPfungal carbon pump
FFchemical fertilizer
FMcombined application of chemical and microbial fertilizer
F-NACfungal necromass accumulation coefficient
FNCfungal necromass carbon
FOcombined application of chemical and organic fertilizer
ICinorganic carbon
LAPleucine aminopeptidase
MAOCmineral-associated organic carbon
MBCmicrobial biomass carbon
MBNmicrobial biomass nitrogen
MCPmicrobial carbon pump
MNCtotal microbial necromass carbon
NAGβ-1,4-N-acetylglucosaminidase
NACmicrobial necromass accumulation coefficient
NH4+-Nammonium nitrogen
NO2-Nnitrite nitrogen
NO3-Nnitrate nitrogen
ONorganic nitrogen
POCparticulate organic carbon
SOCsoil organic carbon
TCtotal carbon
TNtotal nitrogen
T-NACtotal microbial necromass accumulation coefficient
TOCtotal organic carbon

References

  1. Yan, P.; Shen, C.; Fan, L.; Li, X.; Zhang, L.; Zhang, L.; Han, W. Tea planting affects soil acidification and nitrogen and phosphorus distribution in soil. Agric. Ecosyst. Environ. 2018, 254, 20–25. [Google Scholar] [CrossRef]
  2. FAO. International Tea Market: Market Situation, Prospects and Emerging Issues. 2022. Available online: https://openknowledge.fao.org (accessed on 13 January 2025).
  3. Yang, X.; Ni, K.; Shi, Y.; Yi, X.; Ji, L.; Wei, S.; Jiang, Y.; Zhang, Y.; Cai, Y.; Ma, Q.; et al. Metagenomics reveals N-induced changes in carbon-degrading genes and microbial communities of tea (Camellia sinensis L.) plantation soil under long-term fertilization. Sci. Total Environ. 2023, 856, 159231. [Google Scholar] [CrossRef] [PubMed]
  4. Wang, Y.; Yao, Z.; Pan, Z.; Wang, R.; Yan, G.; Liu, C.; Su, Y.; Zheng, X.; Butterbach-Bahl, K. Tea-planted soils as global hotspots for N2O emissions from croplands. Environ. Res. Lett. 2020, 15, 104018. [Google Scholar] [CrossRef]
  5. Vitousek, P.; Howarth, R. Nitrogen limitation on land and in the sea: How can it occur? Biogeochemistry 1991, 13, 87–115. [Google Scholar] [CrossRef]
  6. Jiang, N.; Huang, W.; Chen, Z.; Zhang, Y.; Jiang, D.; Wu, C.; Yao, Z.; Chen, L. More labile carbon inputs lessen the positive effects of nitrogen enrichment on soil carbon storage in a temperate grassland. Plant Soil 2023, 505, 225–237. [Google Scholar] [CrossRef]
  7. Niu, S.; Song, L.; Wang, J.; Luo, Y.; Yu, G. Dynamic carbon-nitrogen coupling under global change. Sci. China Life Sci. 2023, 66, 771–782. [Google Scholar] [CrossRef]
  8. Ni, H.; Liu, C.; Sun, B.; Liang, Y. Response of global farmland soil organic carbon to nitrogen application over time depends on soil type. Geoderma 2022, 406, 115542. [Google Scholar] [CrossRef]
  9. Wang, X.; Feng, J.; Ao, G.; Qin, W.; Han, M.; Shen, Y.; Liu, M.; Chen, Y.; Zhu, B. Globally nitrogen addition alters soil microbial community structure, but has minor effects on soil microbial diversity and richness. Soil. Biol. Biochem. 2023, 179, 108982. [Google Scholar] [CrossRef]
  10. Feng, X.; Qin, S.; Zhang, D.; Chen, P.; Hu, J.; Wang, G.; Liu, Y.; Wei, B.; Li, Q.; Yang, Y.; et al. Nitrogen input enhances microbial carbon use efficiency by altering plant-microbe-mineral interactions. Glob. Chang. Biol. 2022, 28, 4845–4860. [Google Scholar] [CrossRef]
  11. Tian, J.; Dungait, J.A.J.; Hou, R.; Deng, Y.; Hartley, I.P.; Yang, Y.; Kuzyakov, Y.; Zhang, F.; Cotrufo, M.F.; Zhou, J. Microbially mediated mechanisms underlie soil carbon accrual by conservation agriculture under decade-long warming. Nat. Commun. 2024, 15, 377. [Google Scholar] [CrossRef]
  12. Liang, C.; Schimel, J.P.; Jastrow, J.D. The importance of anabolism in microbial control over soil carbon storage. Nat. Microbiol. 2017, 2, 17105. [Google Scholar] [CrossRef] [PubMed]
  13. Zhu, X.; Jackson, R.D.; DeLucia, E.H.; Tiedje, J.M.; Liang, C. The soil microbial carbon pump: From conceptual insights to empirical assessments. Glob. Chang. Biol. 2020, 26, 6032–6039. [Google Scholar] [CrossRef] [PubMed]
  14. Yang, L.; Canarini, A.; Zhang, W.; Lang, M.; Chen, Y.; Cui, Z.; Kuzyakov, Y.; Richter, A.; Chen, X.; Zhang, F.; et al. Microbial life-history strategies mediate microbial carbon pump efficacy in response to N management depending on stoichiometry of microbial demand. Glob. Chang. Biol. 2024, 30, e17311. [Google Scholar] [CrossRef] [PubMed]
  15. Allison, S.D.; Martiny, J.B. Resistance, resilience, and redundancy in microbial communities. Proc. Natl. Acad. Sci. USA 2008, 105, 11512–11519. [Google Scholar] [CrossRef]
  16. Wang, F.; Liu, Q.; Hu, X.; Fang, X.-M.; Wang, S.; Chen, F.-S. Divergent responses of soil microbial community to long-term nitrogen and phosphorus additions in a subtropical Chinese fir plantation. CATENA 2024, 242, 108132. [Google Scholar] [CrossRef]
  17. Mori, T. Does ecoenzymatic stoichiometry really determine microbial nutrient limitations? Soil. Biol. Biochem. 2020, 146, 107816. [Google Scholar] [CrossRef]
  18. Zhang, X.; Dippold, M.A.; Kuzyakov, Y.; Razavi, B.S. Spatial pattern of enzyme activities depends on root exudate composition. Soil. Biol. Biochem. 2019, 133, 83–93. [Google Scholar] [CrossRef]
  19. Craine, J.M.; Jackson, R.D. Plant nitrogen and phosphorus limitation in 98 North American grassland soils. Plant Soil 2009, 334, 73–84. [Google Scholar] [CrossRef]
  20. Henneron, L.; Kardol, P.; Wardle, D.A.; Cros, C.; Fontaine, S. Rhizosphere control of soil nitrogen cycling: A key component of plant economic strategies. New Phytol. 2020, 228, 1269–1282. [Google Scholar] [CrossRef]
  21. Moreau, D.; Bardgett, R.D.; Finlay, R.D.; Jones, D.L.; Philippot, L.; Power, S. A plant perspective on nitrogen cycling in the rhizosphere. Funct. Ecol. 2019, 33, 540–552. [Google Scholar] [CrossRef]
  22. Qiao, C.; Xu, B.; Han, Y.; Wang, J.; Wang, X.; Liu, L.; Liu, W.; Wan, S.; Tan, H.; Liu, Y.; et al. Synthetic nitrogen fertilizers alter the soil chemistry, production and quality of tea. A meta-analysis. Agron. Sustain. Dev. 2018, 38, 10. [Google Scholar] [CrossRef]
  23. Bonheure, D.; Willson, K. Mineral Nutrition and Fertilizers; Willson, K.C., Clifford, M.N., Eds.; Springer: Dordrecht, The Netherlands, 1992; pp. 269–329. [Google Scholar] [CrossRef]
  24. Wanyoko, J.; Owuor, P. Effects of plant densities and nitrogen fertilizer rates on the yield of mature seedling Kenyan tea. Tea 1995, 16, 14–20. Available online: https://www.cabidigitallibrary.org/doi/full/10.5555/19960304943 (accessed on 13 January 2025).
  25. Ma, L.; Yang, X.; Shi, Y.; Yi, X.; Ji, L.; Cheng, Y.; Ni, K.; Ruan, J. Response of tea yield, quality and soil bacterial characteristics to long-term nitrogen fertilization in an eleven-year field experiment. Appl. Soil Ecol. 2021, 166, 103976. [Google Scholar] [CrossRef]
  26. Ye, J.; Wang, Y.; Wang, Y.; Hong, L.; Jia, X.; Kang, J.; Lin, S.; Wu, Z.; Wang, H. Improvement of soil acidification in tea plantations by long-term use of organic fertilizers and its effect on tea yield and quality. Front. Plant Sci. 2022, 13, 1055900. [Google Scholar] [CrossRef]
  27. Han, Z.; Lin, H.; Xu, P.; Li, Z.; Wang, J.; Zou, J. Impact of organic fertilizer substitution and biochar amendment on net greenhouse gas budget in a tea plantation. Agric. Ecosyst. Environ. 2022, 326, 107779. [Google Scholar] [CrossRef]
  28. Xie, S.; Yang, F.; Feng, H.; Yu, Z.; Liu, C.; Wei, C.; Liang, T. Organic fertilizer reduced carbon and nitrogen in runoff and buffered soil acidification in tea plantations: Evidence in nutrient contents and isotope fractionations. Sci. Total Environ. 2021, 762, 143059. [Google Scholar] [CrossRef]
  29. Giannitsopoulos, M.L.; Burgess, P.J.; Sakrabani, R.; Holden, A.; Saini, H.; Kirui, C. Modelling the effects of soil organic content and pH on the yield responses of tea to nitrogen fertilizer. Agric. Syst. 2023, 212, 103754. [Google Scholar] [CrossRef]
  30. Hu, J.; Huang, C.; Zhou, S.; Liu, X.; Dijkstra, F.A. Nitrogen addition increases microbial necromass in croplands and bacterial necromass in forests: A global meta-analysis. Soil Biol. Biochem. 2022, 165, 108500. [Google Scholar] [CrossRef]
  31. Fang, X.; Zhou, G.; Qu, C.; Huang, W.; Zhang, D.; Li, Y.; Yi, Z.; Liu, J. Translocating subtropical forest soils to a warmer region alters microbial communities and increases the decomposition of mineral-associated organic carbon. Soil. Biol. Biochem. 2020, 142, 107707. [Google Scholar] [CrossRef]
  32. Vance, E.D.; Brookes, P.C.; Jenkinson, D.S. An extraction method for measuring soil microbial biomass C. Soil Biol. Biochem. 1987, 19, 703–707. [Google Scholar] [CrossRef]
  33. Bell, C.W.; Fricks, B.E.; Rocca, J.D.; Steinweg, J.M.; McMahon, S.K.; Wallenstein, M.D. High-throughput fluorometric measurement of potential soil extracellular enzyme activities. J. Vis. Exp. 2013, e50961. [Google Scholar] [CrossRef]
  34. Liang, C.; Amelung, W.; Lehmann, J.; Kastner, M. Quantitative assessment of microbial necromass contribution to soil organic matter. Glob. Chang. Biol. 2019, 25, 3578–3590. [Google Scholar] [CrossRef] [PubMed]
  35. Jiao, N.; Luo, T.; Chen, Q.; Zhao, Z.; Xiao, X.; Liu, J.; Jian, Z.; Xie, S.; Thomas, H.; Herndl, G.J.; et al. The microbial carbon pump and climate change. Nat. Rev. Microbiol. 2024, 22, 408–419. [Google Scholar] [CrossRef] [PubMed]
  36. Han, B.; Yao, Y.; Wang, Y.; Su, X.; Ma, L.; Chen, X.; Li, Z. Microbial traits dictate soil necromass accumulation coefficient: A global synthesis. Glob. Ecol. Biogeogr. 2023, 33, 151–161. [Google Scholar] [CrossRef]
  37. Shi, Y.; Wang, J.; Ao, Y.; Han, J.; Guo, Z.; Liu, X.; Zhang, J.; Mu, C.; Le Roux, X. Responses of soil N2O emissions and their abiotic and biotic drivers to altered rainfall regimes and co-occurring wet N deposition in a semi-arid grassland. Glob. Chang. Biol. 2021, 27, 4894–4908. [Google Scholar] [CrossRef]
  38. Li, J.; Sang, C.; Yang, J.; Qu, L.; Xia, Z.; Sun, H.; Jiang, P.; Wang, X.; He, H.; Wang, C. Stoichiometric imbalance and microbial community regulate microbial elements use efficiencies under nitrogen addition. Soil Biol. Biochem. 2021, 156, 108207. [Google Scholar] [CrossRef]
  39. Philippot, L.; Griffiths, B.S.; Langenheder, S. Microbial Community Resilience across Ecosystems and Multiple Disturbances. Microbiol. Mol. Biol. Rev. 2021, 85, e00026-20. [Google Scholar] [CrossRef]
  40. Xiao, W.; Chen, X.; Jing, X.; Zhu, B. A meta-analysis of soil extracellular enzyme activities in response to global change. Soil Biol. Biochem. 2018, 123, 21–32. [Google Scholar] [CrossRef]
  41. Stock, S.C.; Köster, M.; Dippold, M.A.; Nájera, F.; Matus, F.; Merino, C.; Boy, J.; Spielvogel, S.; Gorbushina, A.; Kuzyakov, Y. Environmental drivers and stoichiometric constraints on enzyme activities in soils from rhizosphere to continental scale. Geoderma 2019, 337, 973–982. [Google Scholar] [CrossRef]
  42. Louca, S.; Polz, M.F.; Mazel, F.; Albright, M.B.N.; Huber, J.A.; O’Connor, M.I.; Ackermann, M.; Hahn, A.S.; Srivastava, D.S.; Crowe, S.A.; et al. Function and functional redundancy in microbial systems. Nat. Ecol. Evol. 2018, 2, 936–943. [Google Scholar] [CrossRef]
  43. Fierer, N.; Bradford, M.A.; Jackson, R.B. Toward an ecological classification of soil bacteria. Ecology 2007, 88, 1354–1364. [Google Scholar] [CrossRef] [PubMed]
  44. Manici, L.M.; Caputo, F.; De Sabata, D.; Fornasier, F. The enzyme patterns of Ascomycota and Basidiomycota fungi reveal their different functions in soil. Appl. Soil. Ecol. 2024, 196, 105323. [Google Scholar] [CrossRef]
  45. Burns, R.G.; DeForest, J.L.; Marxsen, J.; Sinsabaugh, R.L.; Stromberger, M.E.; Wallenstein, M.D.; Weintraub, M.N.; Zoppini, A. Soil enzymes in a changing environment: Current knowledge and future directions. Soil Biol. Biochem. 2013, 58, 216–234. [Google Scholar] [CrossRef]
  46. Li, H.; Yang, S.; Semenov, M.V.; Yao, F.; Ye, J.; Bu, R.; Ma, R.; Lin, J.; Kurganova, I.; Wang, X.; et al. Temperature sensitivity of SOM decomposition is linked with a K-selected microbial community. Glob. Chang. Biol. 2021, 27, 2763–2779. [Google Scholar] [CrossRef]
  47. Feng, X.; Wang, S. Plant influences on soil microbial carbon pump efficiency. Glob. Chang. Biol. 2023, 29, 3854–3856. [Google Scholar] [CrossRef]
  48. Liang, C.; Zhu, X. The soil microbial carbon pump as a new concept for terrestrial carbon sequestration. Sci. China Earth Sci. 2021, 64, 545–558. [Google Scholar] [CrossRef]
  49. Qu, Y.; Tang, J.; Liu, B.; Lyu, H.; Duan, Y.; Yang, Y.; Wang, S.; Li, Z. Rhizosphere enzyme activities and microorganisms drive the transformation of organic and inorganic carbon in saline-alkali soil region. Sci. Rep. 2022, 12, 1314. [Google Scholar] [CrossRef]
  50. Lux, S.; Baldauf-Sommerbauer, G.; Siebenhofer, M. Hydrogenation of Inorganic Metal Carbonates: A Review on Its Potential for Carbon Dioxide Utilization and Emission Reduction. ChemSusChem 2018, 11, 3357–3375. [Google Scholar] [CrossRef]
  51. Bailey, V.L.; Pries, C.H.; Lajtha, K. What do we know about soil carbon destabilization? Environ. Res. Lett. 2019, 14, 083004. [Google Scholar] [CrossRef]
  52. Raza, S.; Miao, N.; Wang, P.; Ju, X.; Chen, Z.; Zhou, J.; Kuzyakov, Y. Dramatic loss of inorganic carbon by nitrogen-induced soil acidification in Chinese croplands. Glob. Chang. Biol. 2020, 26, 3738–3751. [Google Scholar] [CrossRef]
  53. Bai, Y.; Cotrufo, M.F. Grassland soil carbon sequestration: Current understanding, challenges, and solutions. Science 2022, 377, 603–608. [Google Scholar] [CrossRef] [PubMed]
  54. Liang, G.; Stark, J.; Waring, B.G. Mineral reactivity determines root effects on soil organic carbon. Nat. Commun. 2023, 14, 4962. [Google Scholar] [CrossRef] [PubMed]
  55. Xu, X.; Schimel, J.P.; Janssens, I.A.; Song, X.; Song, C.; Yu, G.; Sinsabaugh, R.L.; Tang, D.; Zhang, X.; Thornton, P.E. Global pattern and controls of soil microbial metabolic quotient. Ecol. Monogr. 2017, 87, 429–441. [Google Scholar] [CrossRef]
  56. Kallenbach, C.M.; Frey, S.D.; Grandy, A.S. Direct evidence for microbial-derived soil organic matter formation and its ecophysiological controls. Nat. Commun. 2016, 7, 13630. [Google Scholar] [CrossRef] [PubMed]
  57. Cui, Y.; Moorhead, D.L.; Guo, X.; Peng, S.; Wang, Y.; Zhang, X.; Fang, L. Stoichiometric models of microbial metabolic limitation in soil systems. Glob. Ecol. Biogeogr. 2021, 30, 2297–2311. [Google Scholar] [CrossRef]
  58. Fontaine, S.; Barot, S.; Barre, P.; Bdioui, N.; Mary, B.; Rumpel, C. Stability of organic carbon in deep soil layers controlled by fresh carbon supply. Nature 2007, 450, 277–280. [Google Scholar] [CrossRef]
  59. Yan, S.; Yin, L.; Dijkstra, F.A.; Wang, P.; Cheng, W. Priming effect on soil carbon decomposition by root exudate surrogates: A meta-analysis. Soil. Biol. Biochem. 2023, 178, 108955. [Google Scholar] [CrossRef]
  60. Kuzyakov, Y. Priming effects: Interactions between living and dead organic matter. Soil. Biol. Biochem. 2010, 42, 1363–1371. [Google Scholar] [CrossRef]
  61. Buckeridge, K.M.; Creamer, C.; Whitaker, J. Deconstructing the microbial necromass continuum to inform soil carbon sequestration. Funct. Ecol. 2022, 36, 1396–1410. [Google Scholar] [CrossRef]
  62. Lehmann, J.; Kleber, M. The contentious nature of soil organic matter. Nature 2015, 528, 60–68. [Google Scholar] [CrossRef]
  63. Chen, L.; Fang, K.; Wei, B.; Qin, S.; Feng, X.; Hu, T.; Ji, C.; Yang, Y. Soil carbon persistence governed by plant input and mineral protection at regional and global scales. Ecol. Lett. 2021, 24, 1018–1028. [Google Scholar] [CrossRef] [PubMed]
  64. Dijkstra, F.A.; Zhu, B.; Cheng, W. Root effects on soil organic carbon: A double-edged sword. New Phytol. 2021, 230, 60–65. [Google Scholar] [CrossRef] [PubMed]
  65. Ren, C.; Wang, T.; Xu, Y.; Deng, J.; Zhao, F.; Yang, G.; Han, X.; Feng, Y.; Ren, G. Differential soil microbial community responses to the linkage of soil organic carbon fractions with respiration across land-use changes. For. Ecol. Manag. 2018, 409, 170–178. [Google Scholar] [CrossRef]
  66. Wang, C.; Kuzyakov, Y. Mechanisms and implications of bacterial–fungal competition for soil resources. ISME J. 2024, 18, wrae073. [Google Scholar] [CrossRef] [PubMed]
Figure 1. Effect size of different fertilization treatments on soil physicochemical properties. Effect sizes are presented as mean ± standard error. Statistical significance was determined using the type II Wald Chi-square test, with significant differences indicated by asterisks: * 0.01 < p < 0.05, ** 0.001 < p < 0.01, *** p < 0.001. CK: no fertilization, FF: chemical fertilizer, FO: combined application of chemical and organic cake fertilizer, FM: combined application of chemical and microbial fertilizer, FB: combined application of chemical fertilizer and biochar. TC: total carbon, TOC: total organic carbon, IC: inorganic carbon, POC: particulate organic carbon, MAOC: mineral-associated organic carbon, DOC: dissolved organic carbon, TN: total nitrogen, ON: organic nitrogen, NH4+-N: ammonium nitrogen, NO3-N: nitrate nitrogen, NO2-N: nitrite nitrogen, BG: β-1,4-glucosidase, NAG: β-1,4-N-acetylglucosaminidase, LAP: leucine aminopeptidase, MBC: microbial biomass carbon, MBN: microbial biomass nitrogen.
Agriculture 15 00238 g001
Figure 2. Bacterial community composition before and after different fertilization treatments (a). Fungal community composition before and after different fertilization treatments (d). Community composition is based on phylum-level classification, including phyla with relative abundance > 0.01; phyla with relative abundance < 0.01 are grouped as “others”. PCoA analysis of bacterial community composition before and after different fertilization treatments (b,c). PCoA analysis of fungal community composition before and after different fertilization treatments (e,f). R was calculated using ANOSIM, and P was determined using permutation tests with 999 permutations. CK: no fertilization, FF: chemical fertilizer, FO: combined application of chemical and organic cake fertilizer, FM: combined application of chemical and microbial fertilizer, FB: combined application of chemical fertilizer and biochar.
Agriculture 15 00238 g002
Figure 3. Network analysis of microbial communities and soil physicochemical properties under different fertilization treatments. Node size corresponds to the number of edges associated with that node, representing the degree of connectivity. Only microbes with significant Spearman correlations (|r| > 0.6, p < 0.05) with soil properties are displayed in the network. CK: no fertilization, FF: chemical fertilizer, FO: combined application of chemical and organic cake fertilizer, FM: combined application of chemical and microbial fertilizer, FB: combined application of chemical fertilizer and biochar. TC: total carbon, TOC: total organic carbon, IC: inorganic carbon, POC: particulate organic carbon, MAOC: mineral-associated organic carbon, DOC: dissolved organic carbon, TN: total nitrogen, ON: organic nitrogen, NH4+-N: ammonium nitrogen, NO3-N: nitrate nitrogen, NO2-N: nitrite nitrogen, BG: β-1,4-glucosidase, NAG: β-1,4-N-acetylglucosaminidase, LAP: leucine aminopeptidase, MBC: microbial biomass carbon, MBN: microbial biomass nitrogen.
Agriculture 15 00238 g003
Figure 4. Module proportions of bacterial phyla in the correlation network (a). Module proportions of fungal phyla in the correlation network (b). Correlation analysis of microbial taxa with soil physicochemical properties for modules with proportions greater than 5% (c). Clustering was performed using the Euclidean distance algorithm and complete-linkage hierarchical clustering. Spearman correlation coefficients were calculated, and significance is indicated by asterisks: * 0.01 < p < 0.05, ** 0.001 < p < 0.01, *** p < 0.001. CK: no fertilization, FF: chemical fertilizer, FO: combined application of chemical and organic cake fertilizer, FM: combined application of chemical and microbial fertilizer, FB: combined application of chemical fertilizer and biochar. TC: total carbon, TOC: total organic carbon, IC: inorganic carbon, POC: particulate organic carbon, MAOC: mineral-associated organic carbon, DOC: dissolved organic carbon, TN: total nitrogen, ON: organic nitrogen, NH4+-N: ammonium nitrogen, NO3-N: nitrate nitrogen, NO2-N: nitrite nitrogen, BG: β-1,4-glucosidase, NAG: β-1,4-N-acetylglucosaminidase, LAP: leucine aminopeptidase, MBC: microbial biomass carbon, MBN: microbial biomass nitrogen.
Agriculture 15 00238 g004
Figure 5. Differences in MNC before and after different fertilization treatments (a,b). Differences in NAC before and after different fertilization treatments (c,d). Differences in MCP efficacy before and after different fertilization treatments (e,f). Group differences were analyzed using Fisher’s LSD multiple comparisons, with treatments labeled with different letters (e.g., “a” and “b”), indicating significant differences (p < 0.05). CK: no fertilization, FF: chemical fertilizer, FO: combined application of chemical and organic cake fertilizer, FM: combined application of chemical and microbial fertilizer, FB: combined application of chemical fertilizer and biochar, MNC: total microbial necromass carbon, BNC: bacterial necromass carbon, FNC: fungal necromass carbon, NAC: microbial necromass accumulation coefficient, T-NAC: total microbial necromass accumulation coefficient, B-NAC: bacterial necromass accumulation coefficient, F-NAC: fungal necromass accumulation coefficient, MCP: microbial carbon pump, BCP: bacterial carbon pump, FCP: fungal carbon pump.
Agriculture 15 00238 g005aAgriculture 15 00238 g005b
Figure 6. Linear regression relationships and marginal distribution histograms of MNC, NAC, and MCP efficacy with TOC (a,c,e). Linear regression relationships and marginal distribution histograms of MNC, NAC, and MCP efficacy with MBC (b,d,f). In the regression analyses, R2 represents the coefficient of determination, and p was calculated using t-tests. TOC: total organic carbon, MBC: microbial biomass carbon, MNC: total microbial necromass carbon, BNC: bacterial necromass carbon, FNC: fungal necromass carbon, NAC: microbial necromass accumulation coefficient, T-NAC: total microbial necromass accumulation coefficient, B-NAC: bacterial necromass accumulation coefficient, F-NAC: fungal necromass accumulation coefficient, MCP: microbial carbon pump, BCP: bacterial carbon pump, FCP: fungal carbon pump.
Agriculture 15 00238 g006aAgriculture 15 00238 g006b
Figure 7. Correlations among soil physicochemical properties and their relationships with MNC, NAC, and MCP efficacy (a). Correlations are based on Pearson coefficients, with the color gradient representing the correlation strength. Statistical significance is indicated by asterisks: * 0.01 < p < 0.05, ** 0.001 < p < 0.01, *** p < 0.001. C-N coupling relationships based on PLS-PM (b). Blue and orange arrows represent positive and negative relationships, respectively. The width of the arrows corresponds to the path coefficients, which were calculated using the path weighting scheme. Solid lines indicate significant relationships (p < 0.05), while dashed lines indicate non-significant relationships. The significance of path coefficients was determined using t-tests and is denoted by asterisks: * 0.01 < p < 0.05, ** 0.001 < p < 0.01, *** p < 0.001. In PLS-PM, the latent variable soil nitrogen includes TN, ON, NH4+-N, NO3-N, and NO2-N. The latent variable soil enzyme comprises BG and NAG. The latent variable Co-MCP consists of MNC, NAC, and MCP efficacy. The latent variable bacteria includes Acidobacteriota, Proteobacteria, Actinobacteriota, Chloroflexi, and Firmicutes, while the latent variable fungi comprises Ascomycota, Basidiomycota, and Mucoromycota. The latent variable soil carbon includes TC, TOC, IC, DOC, MAOC, POC, and MBC. Effect size of latent variables on soil carbon in PLS-PM (c). TC: total carbon, TOC: total organic carbon, IC: inorganic carbon, POC: particulate organic carbon, MAOC: mineral-associated organic carbon, DOC: dissolved organic carbon, TN: total nitrogen, ON: organic nitrogen, NH4+-N: ammonium nitrogen, NO3-N: nitrate nitrogen, NO2-N: nitrite nitrogen, BG: β-1,4-glucosidase, NAG: β-1,4-N-acetylglucosaminidase, LAP: leucine aminopeptidase, MBC: microbial biomass carbon, MBN: microbial biomass nitrogen.
Agriculture 15 00238 g007
Disclaimer/Publisher’s Note: The statements, opinions and data contained in all publications are solely those of the individual author(s) and contributor(s) and not of MDPI and/or the editor(s). MDPI and/or the editor(s) disclaim responsibility for any injury to people or property resulting from any ideas, methods, instructions or products referred to in the content.

