Abstract
In nature, plants have rich and vivid colors. Flower color can confer economic and ornamental value to ornamental plants, and is one of the target traits for current directed breeding. Therefore, it is essential to understand the molecular regulatory mechanisms behind flower color formation in ornamental plants. However, in Cosmos bipinnata Cav., one of the most important ornamental plants, the metabolic pathways and molecular regulatory mechanisms underlying the formation of different flower colors are not yet clear, which greatly restricts the molecular breeding of flower color varieties. We selected three varieties of Cosmos bipinnata Cav. with white, pink, and red flowers as research materials, and identified significantly different metabolites among them through ultra performance liquid chromatography mass spectrometry (UPLC-MS/MS) analysis and principal component analysis (PCA). Then, Kyoto Encyclopedia of Genes and Genomes (KEGG) enrichment analysis and transcriptome sequencing analysis in different colors flowers were used to reveal that the differential metabolites were enriched in flavonoid metabolic pathways and related structural genes were differentially expressed. Furthermore, we identified differentially expressed members of the MYB and bHLH transcription factor families, which play key roles in regulating the anthocyanin biosynthesis. By constructing a phylogenetic tree and performing a joint analysis of transcriptome and metabolome data, we further elucidated the molecular regulatory network underlying the formation of flower colors in Cosmos bipinnata Cav. This study not only provides a theoretical basis and gene resources for color-oriented breeding and the creation of new color varieties, but also offers new insights into the molecular mechanisms of flower color formation in plants.
1. Introduction
Cosmos bipinnata Cav. is native to Mexico and is an annual or perennial herbaceous flower of the genus Cosmos in the Asteraceae family. Cosmos bipinnata Cav. is one of the commonly used urban greening plants in China. Its flowers are light and bright, with lush and natural blooms and strong self-sowing ability. When planted in large patches, it has a wild and natural taste. It is widely used in gardens and can be placed on roadsides, lawns, and forest edges, or used as flower borders, hedgerows, flower clusters. It can also be used as ground cover or cut flowers. In addition, Cosmos bipinnata Cav. has extremely high medicinal value, and its inflorescence, seeds, and whole plant have the effects of clearing heat and detoxifying, improving vision, and dispelling dampness. For the creation of new floral germplasm, genetic transfer as a representative of biological breeding methods is a revolutionary technology in the breeding field and a new track that must be seized. This also requires in-depth analysis of the target metabolite biosynthesis pathway and its molecular regulation mechanism. Currently, research on Cosmos bipinnata Cav. mainly focuses on the seed setting rate and germination characteristics, the seed sowing period, and cultivation management. The lack of research on the biosynthesis pathway and molecular regulation mechanism of anthocyanins in Cosmos bipinnata Cav. greatly restricts the development process of molecular breeding, which is not conducive to maximizing its commercial and practical value.
In nature, plant pigments endow plants with rich and vivid colors. In the production and cultivation of horticultural crops, the bright appearance supplied by plant pigments not only helps plants attract pollinators, but also brings huge commercial value to horticultural crops as an important ornamental trait. Therefore, agronomic traits such as flower color, leaf color, and fruit color have always been important breeding targets for horticultural crops [1]. Current research shows that flavonoids can endow plants with a wide range of color ranges [2,3,4,5]. And anthocyanins, as a type of flavonoid compound, can cause many flowers and fruits to appear red, purple, and blue. They serves as the biochemical basis for the color of ornamental plants and is crucial in determining their ornamental value [6]. Therefore, it is urgent to elucidate the molecular mechanisms underlying the formation of different flower colors in Cosmos bipinnata Cav.
According to preliminary statistics, anthocyanins are found in 73 genera and 27 families of plants. Anthocyanins mainly include six anthocyanins: Pelargonidin, Cyanidin, Peonidin, Delphinidin, Petunidin, and Malvidin [7]. Delphinidin often endows flowers with blue/purple colors, cyanidin tends to give flowers red/magenta color, orange/brick red flowers mainly contain pelargonidin, peonidin produced by methylation of cyanidin often appears purple red in color, and malvidin produced by methylation of delphinidin appears purple in color [8,9,10,11].
In plants, anthocyanins are produced through flavonoid metabolism. Research on flavonoid metabolism has a long history and is in-depth. Studies on chrysanthemums have shown that the accumulation of anthocyanins in chrysanthemum flowers is the result of the joint expression of key structural genes such as CHS, CHI, F3H, F3′H, DFR, and ANS [12,13]. This pathway is relatively conserved in many species, such as arabidopsis [14] and petunias [15].
The biosynthesis of anthocyanins in plant is regulated by both internal and external factors, with external factors mainly including a series of environmental factors such as light intensity, photoperiod, light quality, and temperature [16]. The internal factors mainly refer to the genes related to flavonoid metabolism in plants. On the one hand, they refer to the flavonoid biosynthesis structural genes encoding related enzymes, and on the other hand, they refer to transcription factors involved in flavonoid metabolism regulation, such as MYB, bHLH, WRKY, YABBY, WD40 protein, bZIP protein, and zinc finger protein. In the past few decades, research on the molecular regulation of flavonoid biosynthesis has become increasingly in-depth [17,18], among them, the research on the involvement of MYB, bHLH, WD40, and WRKY proteins in regulation is the most in-depth and extensive. In the study of chrysanthemums, Xiang et al. identified for the first time the upstream regulatory complex CmMYB6-CMBHLH2 in the anthocyanin metabolism pathway, which promotes the accumulation of anthocyanins by promoting the expression of CmDFR genes [19,20]. In addition, the molecular regulatory mechanisms of transcription factors such as CmMYB01, CmMYB21, CmMYB9a, and CmMYB#7 on the biosynthesis of chrysanthemum anthocyanins are gradually being revealed [21,22,23,24]. Furthermore, PtrRML1 inhibits anthocyanin biosynthesis via a similar mechanism in poplar [25], anthocyanin biosynthesis is regulated by AtHY5 via the transcriptional activation of AtPAP1 in arabidopsis [26], and MdMYB1 is sumoylated and stabilized at protein levels to promote anthocyanin biosynthesis at low temperatures in apple [27].
With the revolutionary development of high-throughput sequencing technology, omics analysis methods provide rich data information for the growth and development processes of animals and plants. However, living systems are organisms with multiple components interconnected, and are highly complex and massive systems. Single-omics research can only identify single changes, cannot discover the causes of changes, and cannot study the interrelationships of complex biological processes. By combining multiple omics analyses to establish data relationships between molecules at different levels, and combining functional analysis, metabolic pathway enrichment, etc., a systematic and comprehensive analysis of the functions and regulatory mechanisms of biomolecules is conducted. Multi-omics, as a research method that combines two or more omics, has become one of the most effective tools in systems biology research [28,29]. The combination of transcriptome and metabolome is currently the most mature and in-depth technology in multi-omics research. The splicing results of transcriptome data can be used for predicting new genes and analyzing new transcripts, searching for key regulatory genes of important plant traits or phenotypes. The metabolome is a collection of all metabolites produced by cells, tissues, and organs in an organism, which are the final products of gene expression in the organism [30]. In this study, we selected three different colored varieties of Cosmos bipinnata Cav., namely white, pink, and red, as research materials. We speculate that the different colors may be due to differences in the metabolic pathways and regulatory mechanisms of plant pigments. In order to elucidate the molecular mechanisms underlying the formation of different flower colors in Cosmos bipinnata Cav., we used transcriptome-metabolomics analysis with a focus on pathways and regulation, related to plant pigment metabolism. This will provide a theoretical basis and gene reserve for color-oriented breeding and the creation of new color varieties of Cosmos bipinnata Cav.
2. Materials and Methods
2.1. Plant Materials and Growth Conditions
The Cosmos bipinnata Cav. were planted in a greenhouse with a temperature of 24 °C under 16 h of light and 16 °C under 8 h of darkness and a humidity of 70%. Then, at least 5 biological replicates of petals for each color were collected, with a portion for subsequent color measurement and another portion frozen at −80 °C for future experiments.
2.2. Flower Color Measurement
The International Commission on Illumination (CIE) introduced the Lab color space in 1976, which is a comprehensive model that encompasses all hues perceivable by human vision. This model is based on three components: the luminance (represented by “L”), and the “a” and “b” channels, with the former indicating a spectrum from red to green and the latter from blue to yellow [31]. To ascertain the color attributes of three distinct varieties of Cosmos bipinnata Cav., a Minolta CR-400 handheld colorimeter (Konica Minolta, Japan) was utilized. Through this device, measurements for luminance (L*) and the chromatic elements a* and b* were acquired. The saturation, or chroma (C*), was derived using the formula: C* = (a*2 + b*2)1/2 [32]. The experiment was conducted six times to ensure reliability.
2.3. Metabolomics Analysis
Six biological replicates were conducted for each sample. The experimental procedure begins with metabolite extraction from samples using 80% methanol, followed by storage at −80 °C for subsequent LC-MS analysis. Liquid chromatography was performed on an UltiMate 3000 UPLC System (Thermo Fisher Scientific, Bremen, Germany) with a gradient elution method. Mass spectrometry detection was accomplished with a TripleTOF 6600 system (SCIEX, Framingham, MA, USA), operating in both positive and negative ion modes, with dynamic data acquisition and regular calibration for accuracy. Data analysis involved preprocessing with XCMS 3.4.1 software, converting raw files to mzXML format, and utilizing R (version 4.0.0)-based tools like CAMERA and metaX for peak identification and grouping. Metabolite annotation was conducted using KEGG and HMDB databases, with further validation from an in-house spectral library. Statistical analysis in R included normalization, hierarchical clustering, PCA, and PLSDA, identifying significant metabolites through a combination of p-values, fold change, and VIP scores. Enrichment analysis with GSEA and MSigDB assessed gene set differences across KEGG pathways, with the significance determined by NES, p-values, and q-values, ultimately mapping the metabolites to their respective pathways. The R (version 4.0.0) package used is shown in the Table S2.
2.4. Sample Preparation, Transcriptome Sequencing, and Differential Expression Genes (DEGs) Analysis
The total RNA was extracted from different colored petals using RNAiso Reagent (Takara, Tokyo, Japan) according to the manufacturer’s instructions. Nine cDNA libraries for white, pink and red petals were constructed, with three biological replicates for each sample. The RNA libraries were sequenced on the Illumina NovaseqTM 6000 platform (LC Bio Technology Co., Ltd. Hangzhou, China). Subsequent bioinformatic analysis was performed using the OmicStudio tools at https://www.omicstudio.cn/tool (accessed on 1 July 2024) [33].
2.5. Construction of Phylogenetic Trees
For this study, we employed the neighbor-joining (NJ) method to construct a phylogenetic tree using MEGA 7.0 software. Protein sequences of the MYBs and bHLHs in Arabidopsis were obtained from the Arabidopsis Information Resource (TAIR) database at https://www.arabidopsis.org (accessed on 1 September 2024). We aligned target gene sequences using ClustalW, removed poorly aligned terminal sequences, and then conducted the NJ analysis with 500 bootstrap replicates to assess node support. The resulting tree was visualized and annotated in MEGA7.0 software for further biological interpretation.
2.6. Joint Analysis of Metabolomics–Transcriptomics
Firstly, significant differentially expressed genes and metabolites were screened in transcriptome and metabolome data, respectively. Then, based on the intersection of these pathways, differentially expressed genes and differential metabolites within the intersecting pathways were sought. Subsequently, the structure was depicted as a network diagram, displaying the associated data, with a particular emphasis on the pathways of interest and the differential expression patterns of RNAs. The R package used is shown in the Table S2.
2.7. Statistical Analysis
Data are shown as means. Multigroup comparisons were performed using one-way ANOVA, and a Student’s t-test was used for comparisons between the 2 groups. Differentially expressed genes are classified based on the fold change (FC) ≥ 2 or FC ≤ 0.5 (i.e., absolute value of log2FC ≥ 1) and the false discovery rate (FDR) value < 0.05 (|log2FC| ≥ 1&FDR < 0.05) as the standard. Differential metabolites need to simultaneously satisfy the following conditions: FC ≥ 1.2 or FC ≥ 1/1.2 p value < 0.05, VIP ≥ 1).
3. Results
3.1. Metabolomic Profiling of Three Different Colored Petals of Cosmos bipinnata Cav.
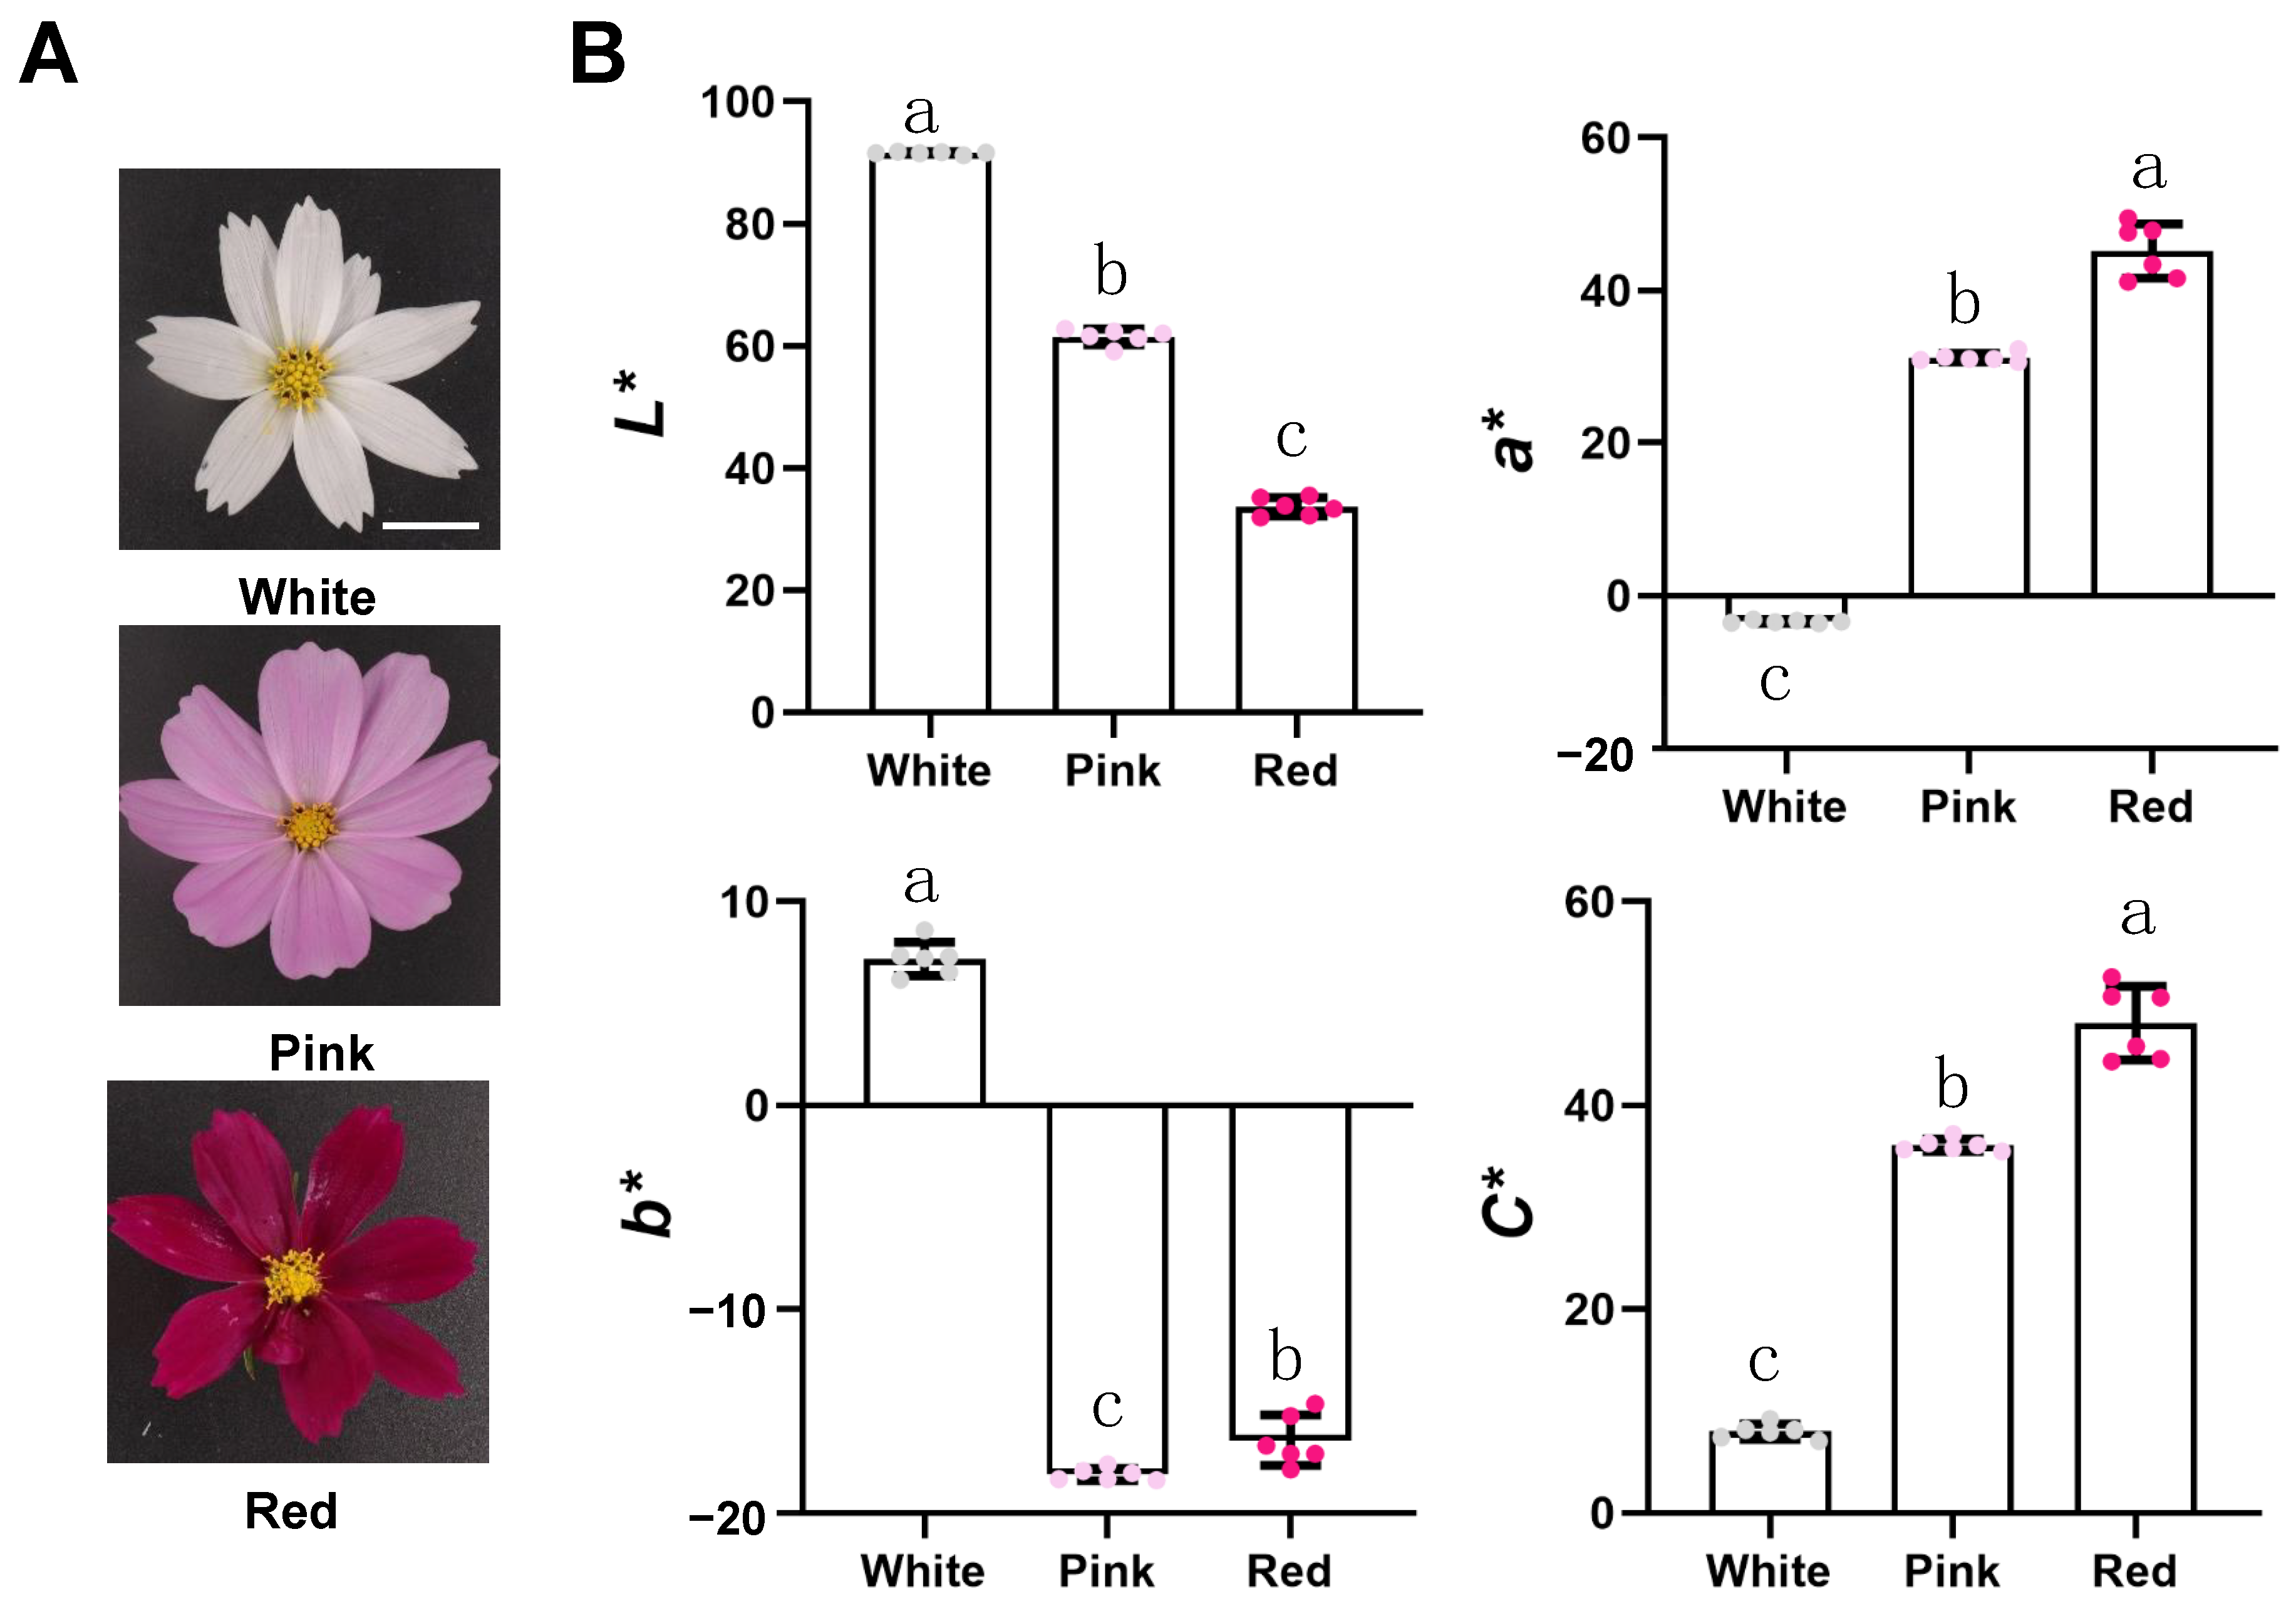
The blooming white, pink, and red flowers are the plant materials of this study (Figure 1A). We performed a CIElab analysis of phenotypes using a Minolta CR-400 portable colorimeter (Konica Minolta, Japan), distinguishing between white, pink, and red flowers (Figure 1B). We found that their values of lightness (L*) gradually decreased, while their chroma C* values gradually increased. At the same time, we found the a* value of white flowers is negative, the a* value of red flowers is significantly higher than that of pink flowers, and they are all positive; However, the b* value of white, pink, and red flowers, which ranges from blue to yellow, is the opposite of a*.
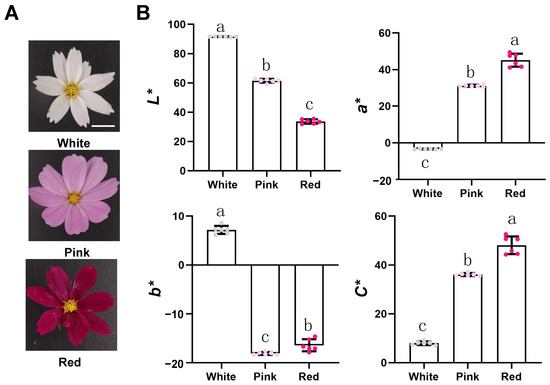
Figure 1.
The phenotype of Cosmos bipinnatus Cav. petals with different flower colors. Bars = 1 cm. (A) Cosmos bipinnatus Cav. with different flower colors, namely white, pink and red. (B) CIELab* color parameters of petals of three different flower colors. Error bars indicate the standard deviation of six biological replicates. Samples denoted by different letters are significantly different (p < 0.05, ANOVA).
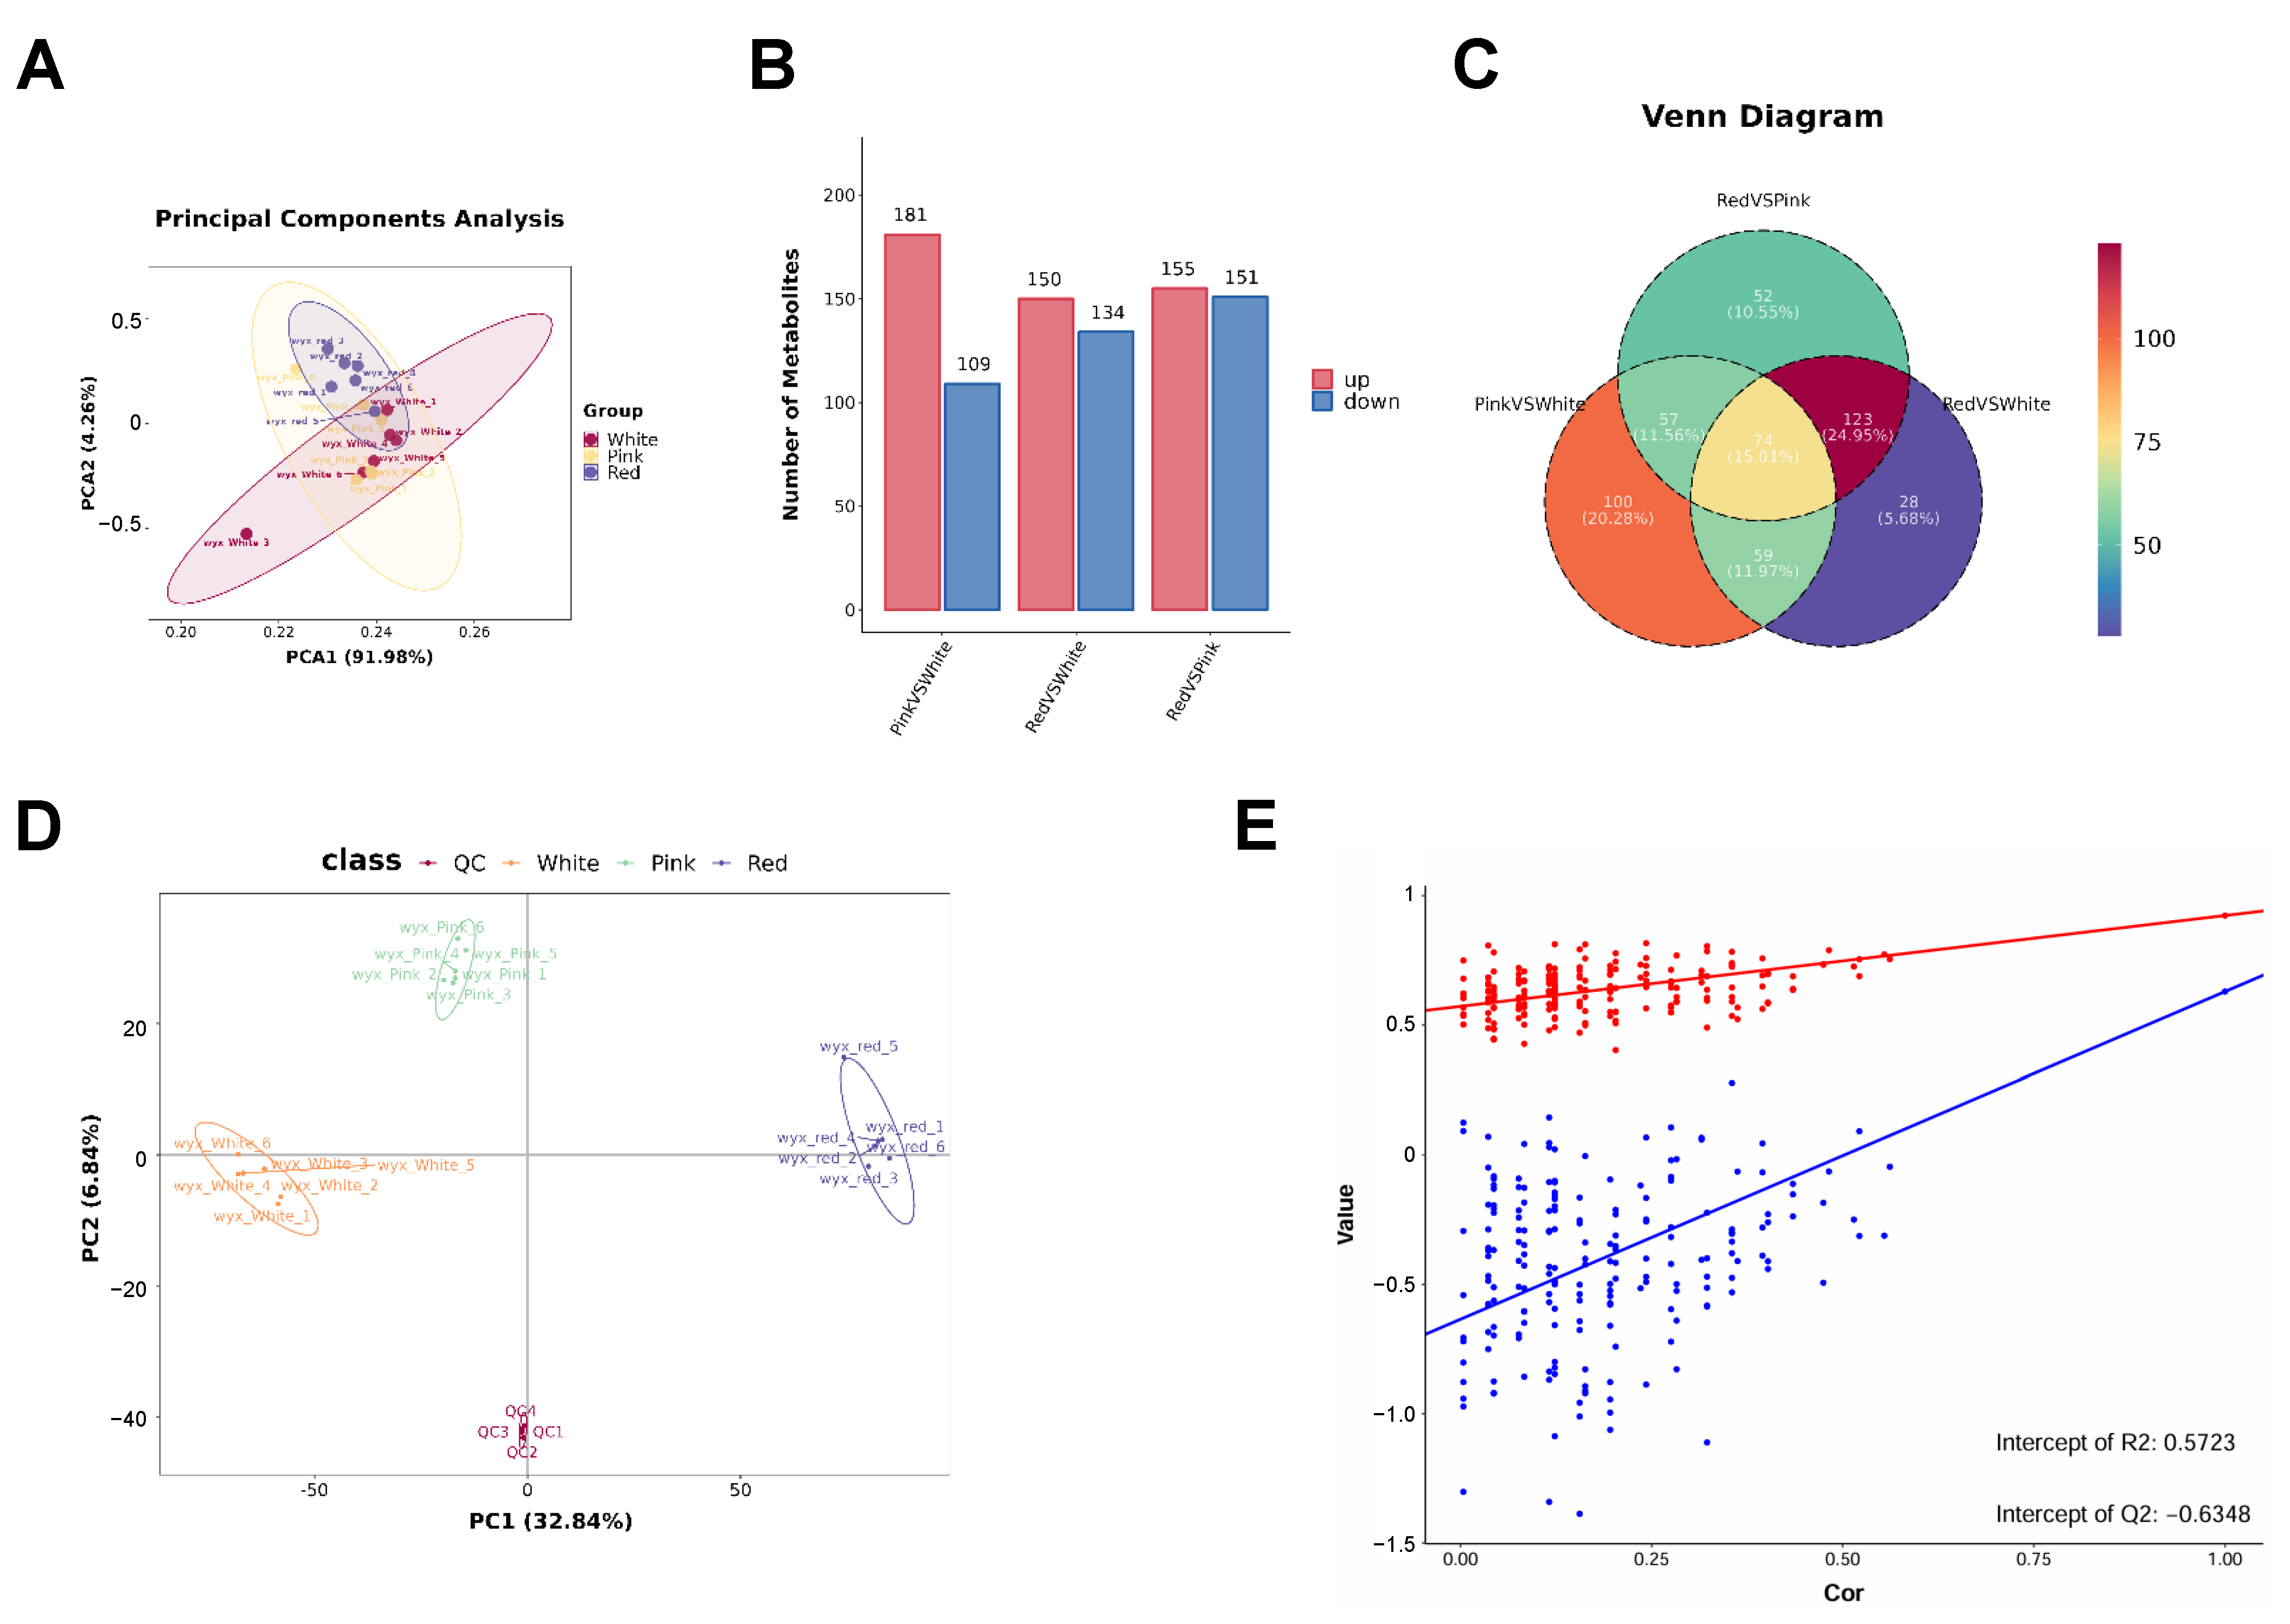
In order to further quantify the total metabolite profiling, UPLC–MS/MS analysis was performed to determine further the main metabolic changes between red, pink, and white flowers. Principal component analysis (PCA) showed values of PC1 91.98% and PC2 4.26% (Figure 2A). We identified a total of 13,604 primary metabolites and 1180 secondary metabolites. There were 181 secondary metabolites that were significantly higher in pink than in white flowers, 150 secondary metabolites higher in red than in white flowers, and 155 secondary metabolites higher in red than in pink flowers. However, there were 109 secondary metabolites that were significantly lower in pink than in white flowers, 134 secondary metabolites lower in red than in white flowers, and 151 secondary metabolites lower in red than in pink flowers (Figure 2B). There were 74 secondary metabolites in both pairwise comparisons of red vs. pink flowers, pink vs. white flowers, and red vs. white flowers (Figure 2C).
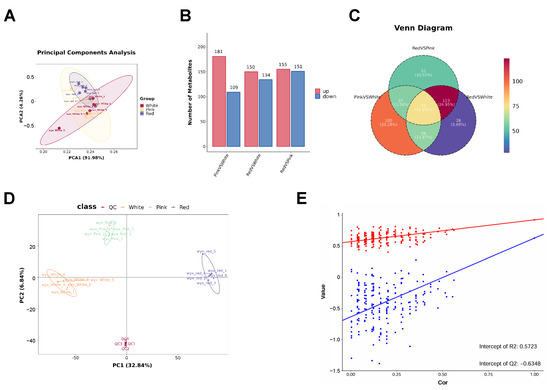
Figure 2.
Comprehensive analysis of metabolite profiles in Cosmos bipinnatus Cav. petals with different flower colors. (A) Principal component analysis (PCA) plot illustrating the separation of metabolite profiles based on flower color classes. (B) Bar chart showing the number of metabolites identified in each flower color class. (C) Venn diagram depicting the unique and shared metabolites among the three flower color classes. (D,E) The combined analysis of the PCA plot and scatter plot indicates a good separation of data between different groups and demonstrates the predictive accuracy of the model.
Furthermore, we conducted a multivariate statistical analysis of the metabolome using PLS-DA (partial least squares discriminant analysis), the results of which are shown in Figure 2D,E. The PLS-DA score plot showed PC1 32.84% and PC2 6.84%. Each point in the graph represents a sample, with different groups displayed in different colors. The relative position of each point represents the degree of dispersion among the samples. This figure indicates that the expression patterns within the three groups are similar, but different between groups (Figure 2D). Finally, the permutation test graph indicates that the metabolomic model is not overfitted (Figure 2E).
3.2. Determination of Key Metabolic Pathways
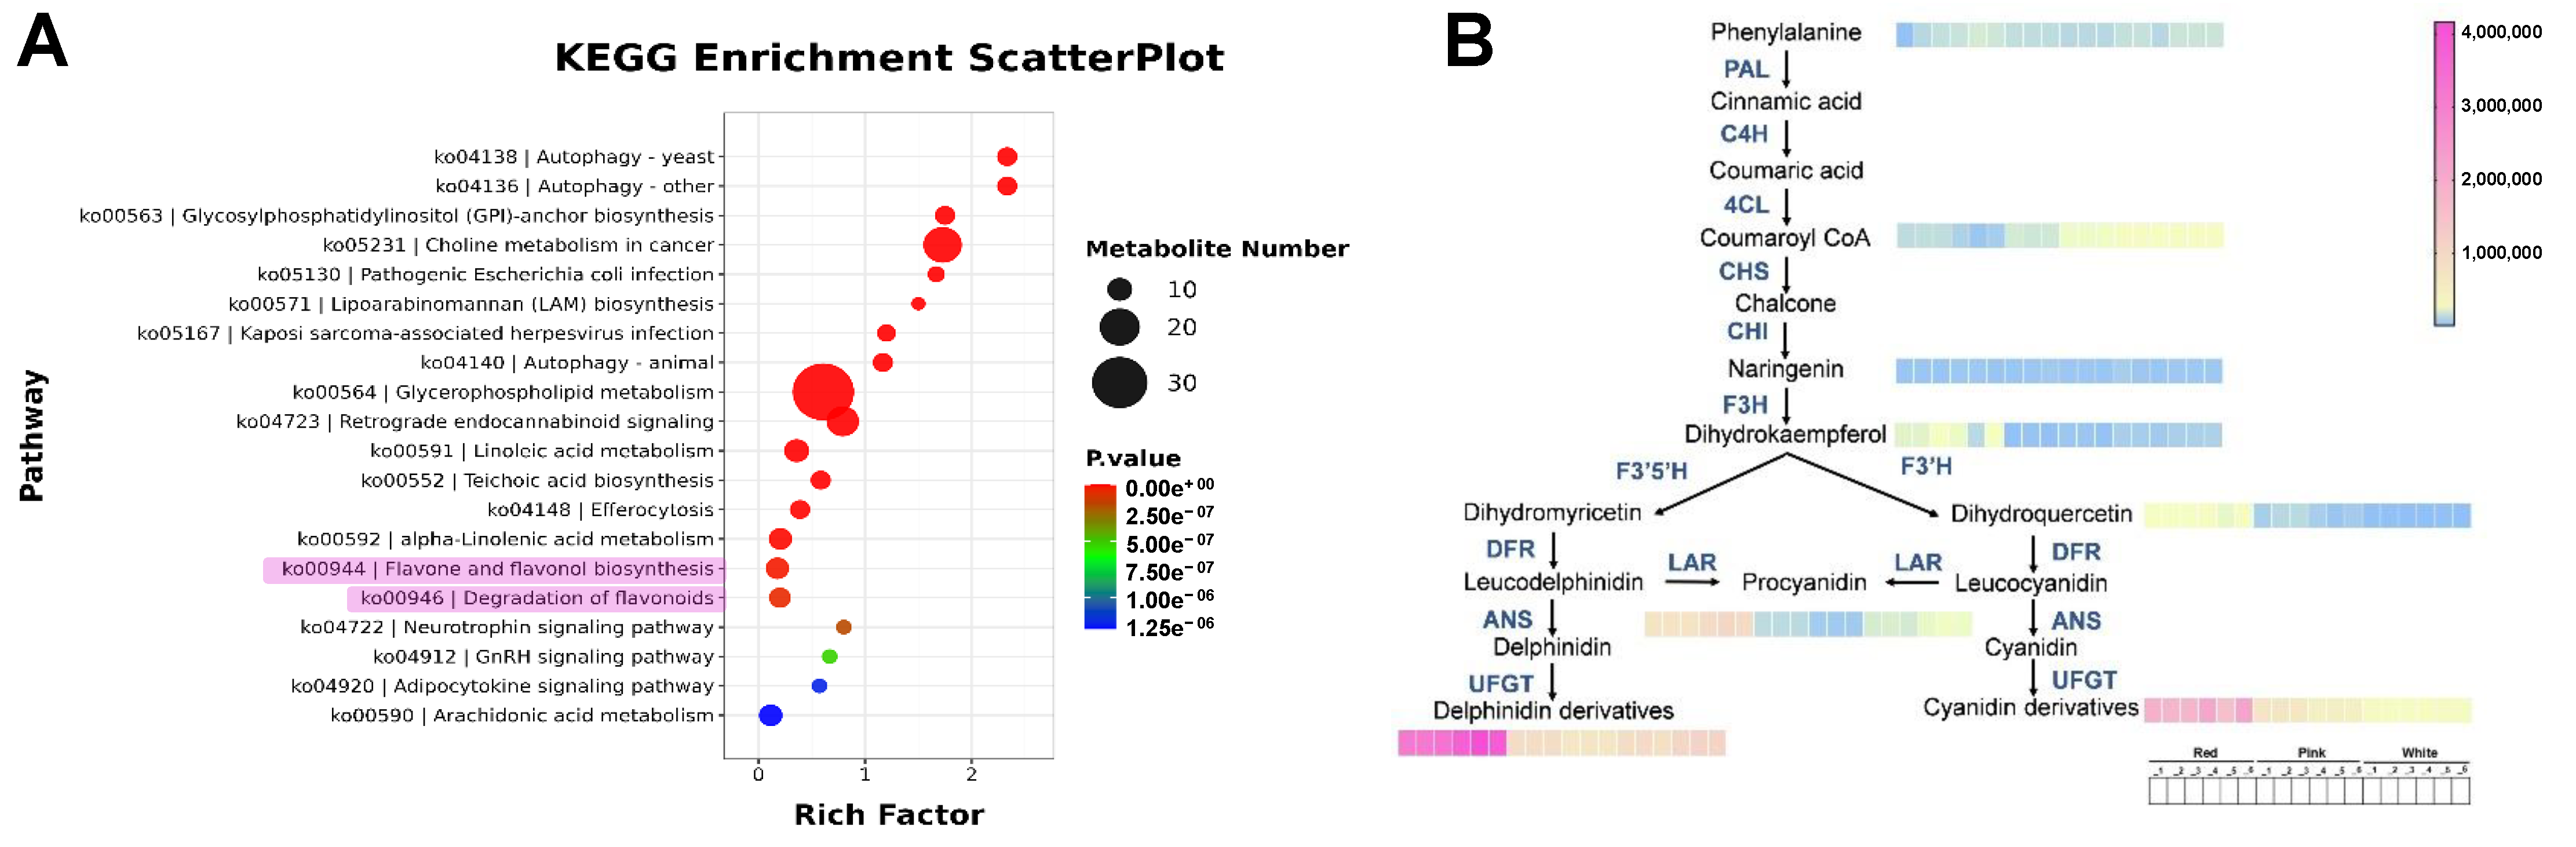
To further analyze the differential metabolites and their functions, we conducted a KEGG (Kyoto Encyclopedia of Genes and Genomes) enrichment analysis on the differential metabolites. As shown in Figure 3A, the pathways in which the differential metabolites are enriched include those related to flavonoid metabolism.

Figure 3.
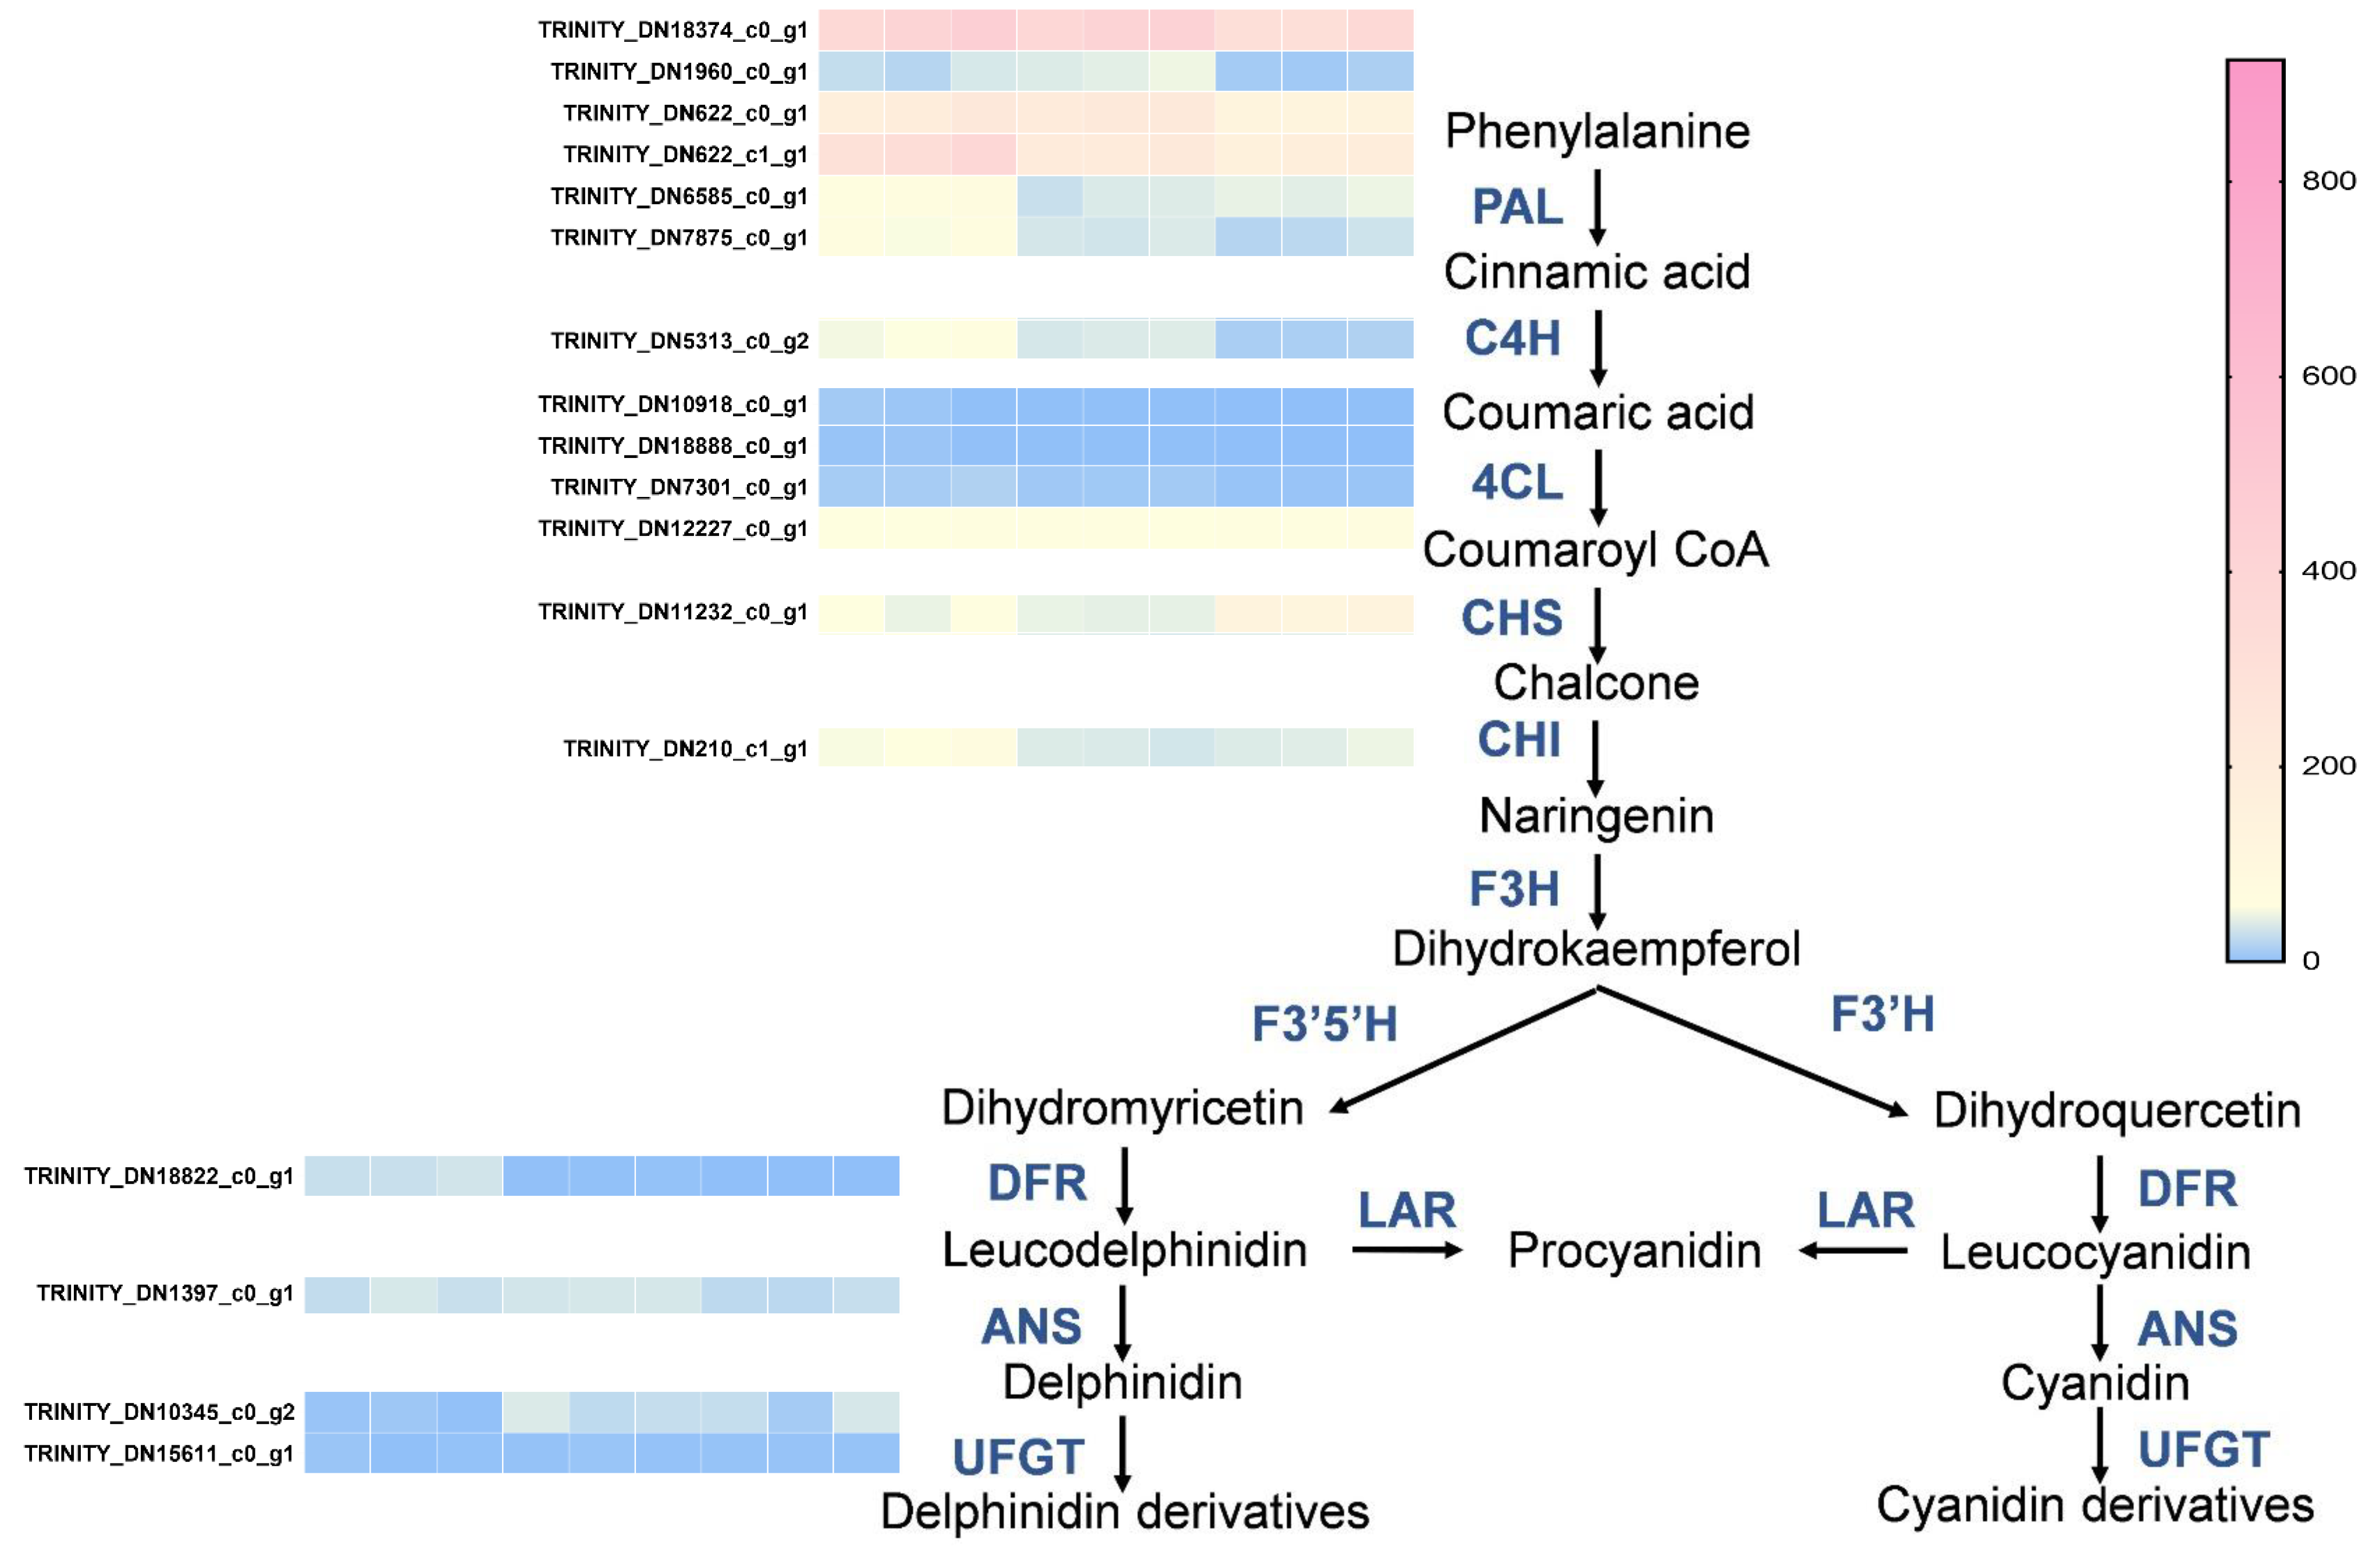
Metabolite pathway analysis. (A) KEGG enrichment scatter plot. The size of the dots represents the number of metabolites involved in each pathway, with larger dots indicating a higher number. The color gradient from blue to red signifies the p-value, with red indicating a more significant enrichment. (B) Metabolic pathway diagram. The arrows indicate the direction of metabolic flow, and the color gradient from blue to pink represents the quantity of metabolites, with pink indicating a higher quantity.
With the purpose of understanding the trend of metabolite changes, we mapped the KEGG metabolite pathways (Figure 3B). The results indicate that in the early stages of metabolism, there is no significant difference in the content of phenylalanine among the three groups. In the flavonoid metabolic pathway, the content of the first precursor Coumaroyl CoA is significantly higher in the white group than in the pink group, which is, in turn, higher than in the red group. This may be because the biosynthesis of more anthocyanins requires the catalysis of more precursor substances. However, there is no significant difference in the content of the intermediate product naringenin among the above groups, but its downstream intermediate products, dihydrokaempferol and dihydroquercetin, show a trend of significantly higher content in the red group. Similarly, the red group also has significantly higher content than the other two groups in the pigment substances, including proanthocyanidins, delphinidin derivatives, and cyanidin derivatives. The above results preliminarily suggest that the different flower colors of Cosmos bipinnatus Cav. are influenced by anthocyanin metabolism.
3.3. Identification of Differently Expressed Genes (DEGs) by Transcriptome
The total RNA extracted from the different color of flowers sampled at blooming stage provided the template for RNA-seq analysis. A total of nine samples (three biological replicates for each of the three colored flowers) were obtained. The outcome of the assembly procedure was a set of 180,912 transcript sequences, with an N50 of 1976 bp, a GC content of 39.31%, and a set of 57,971 gene sequences with an N50 of 1633 bp and a GC content of 39.37% (Table S1).
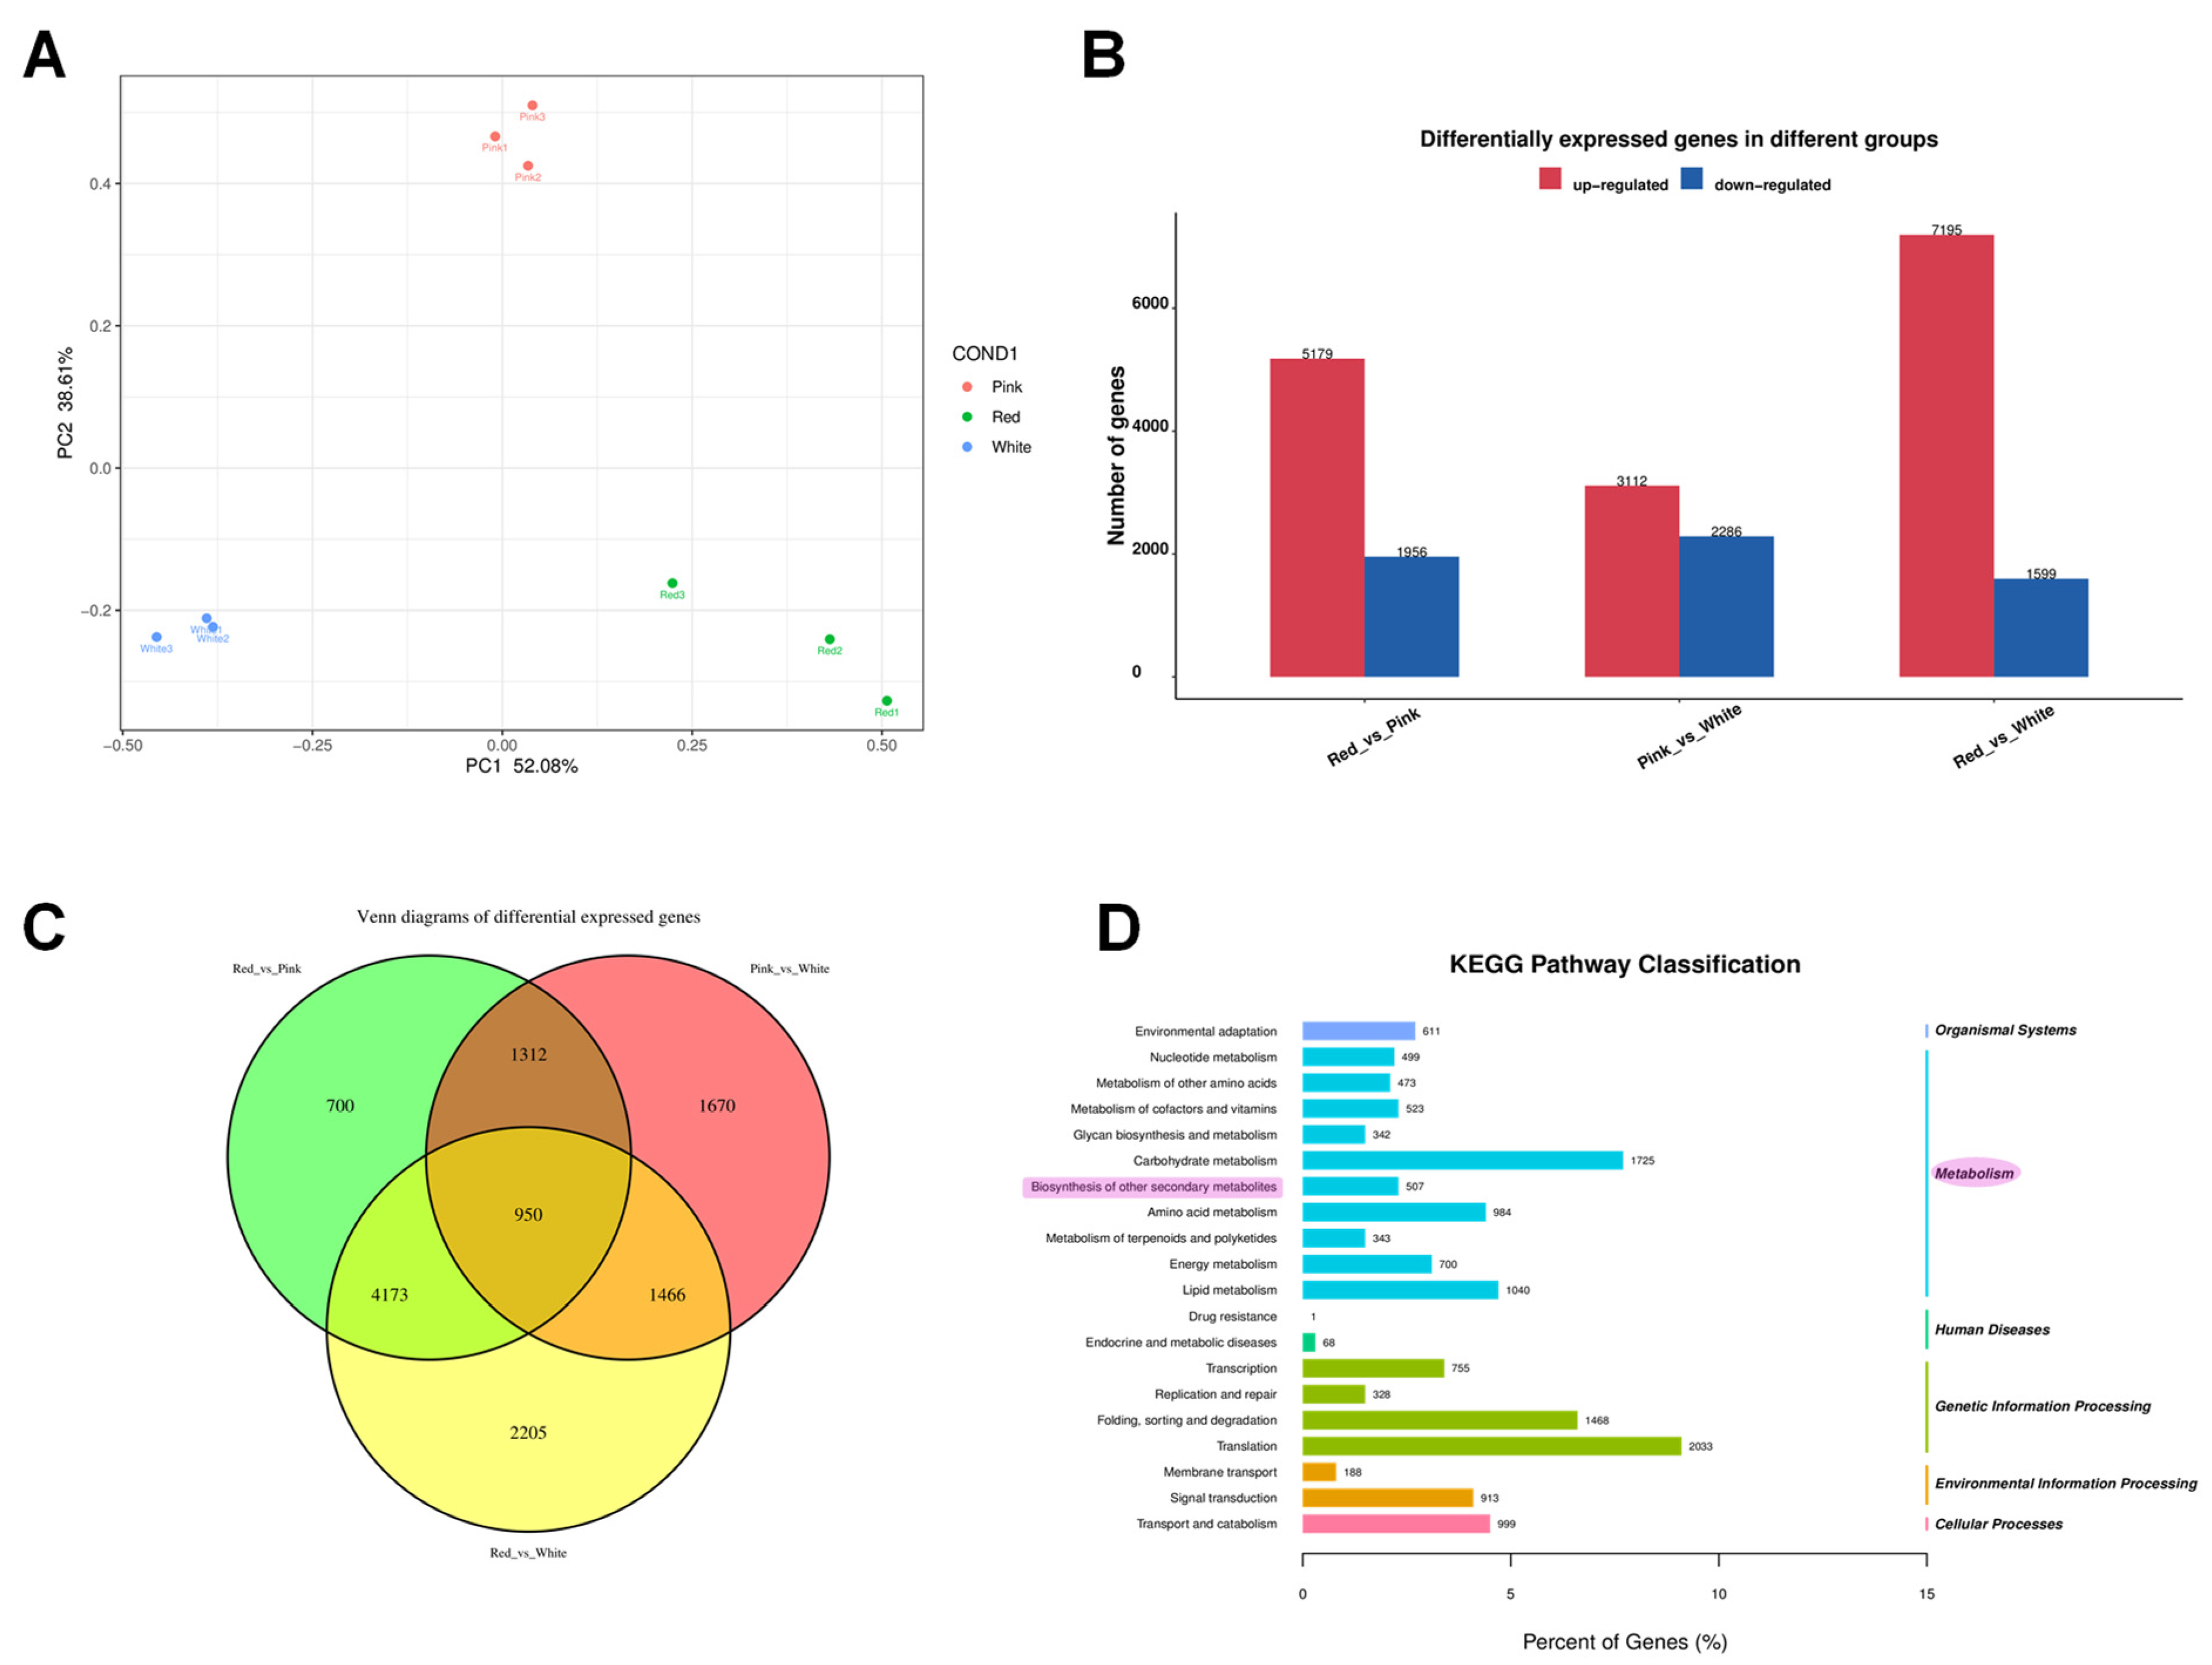
Principal component analysis (PCA) showed that PC1 was 52.08.6% and PC2 was 38.61%, and the PCA plot illustrates clear discrimination among genetic expression in the white, pink, and red groups (Figure 4A). Differential expression genes (DEGs) were analyzed by pairwise comparisons of transcriptomes between different colored flowers (white, pink, and red) (FDR ≤ 0.05 and |log2FC| ≥ 1) (Figure 4B). There were 5179 genes significantly more highly expressed in red than in pink flowers, 3112 genes more highly expressed in pink than in white flowers, and 7195 genes more highly expressed in red than in white flowers. However, there were 1956 genes expressed significantly lower in red than in pink flowers, 2286 genes lower expressed in pink than in white flowers, and 1599 genes lower expressed in red than in white flowers (Figure 4B). There were 950 DEGs in both pairwise comparisons of red vs. pink flowers, pink vs. white flowers, and red vs. white flowers (Figure 4C).

Figure 4.
Comprehensive analysis of differential gene expression and pathway classification in Cosmos bipinnatus Cav. (A) Principal component analysis (PCA) plot showing the distribution of samples across different flower colors. (B) Bar chart representing the number of differentially expressed genes (DEGs) in different groups. The red bars indicate up-regulated genes, while the blue bars represent down-regulated genes. The comparison groups are labeled as “Red_vs._Pink”, “Pink_vs._White”, and “Red_vs._White”. (C) Venn diagram illustrating the overlap of differentially expressed genes among the three groups. The numbers within each section represent the count of unique and shared genes across the different groups. (D) KEGG pathway classification of the differentially expressed genes. The bar graph shows the number of genes associated with each pathway category.
3.4. Functional Analysis of DEGs
So as to gain a deeper understanding of the transcriptional regulation of the genes underlying the changes in metabolites among different flower color groups (white, pink, and red), we performed KEGG enrichment analysis on the differentially expressed genes, indicating their enrichment in secondary metabolites (Figure 4D).
Following that, we analyzed the expression of structural genes in the phenylalanine metabolic pathway and the anthocyanin synthesis pathway. This analysis will help to elucidate how the expression of these genes contributes to the observed changes in metabolites and potentially to the differences in flower coloration. We found that the expression of PAL (TRINITY_DN18304_c0_g1, TRINITY_DN1960_c0_g1, TRINITY_DN622_c0_g1, TRINITY_DN622_c1_g1, TRINITY_DN6585_c0_g1, TRINITY_DN7875_c0_g1) and C4H (TRINITY_DN5313_c0_g2) genes was upregulated in the red and pink groups compared to the white group, while the expression of 4CL (TRINITY_DN10918_c0_g1, TRINITY_DN18888_c0_g1, TRINITY_DN7301_c0_g1, TRINITY_DN12227_c0_g1) did not show significant differences among the three groups. In the flavonoid metabolic pathway, CHI (TRINITY_DN210_c1_g1) and DFR (TRINITY_DN18822_c0_g1) tended to be upregulated in the red groups. However, the expression of CHS (TRINITY_DN11232_c0_g1), ANS (TRINITY_DN1397_c0_g1), and UFGT (TRINITY_DN10345_c0_g2, TRINITY_DN15611_c0_g1) in the flavonoid metabolic pathway did not change significantly (Figure 5).
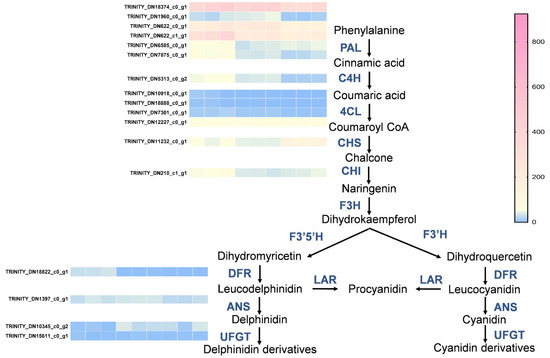
Figure 5.
Differentially expressed genes (DEGs) analysis of different groups of flavonoid biosynthetic pathways. Heatmap illustrating the expression levels of genes involved in the flavonoid biosynthesis pathway across different groups. The color gradient from blue to pink represents low to high expression levels, respectively. Genes are labeled with their respective Trinity IDs.
3.5. Identification of Candidate Members of MBW Complex in Differentially Expressed Genes
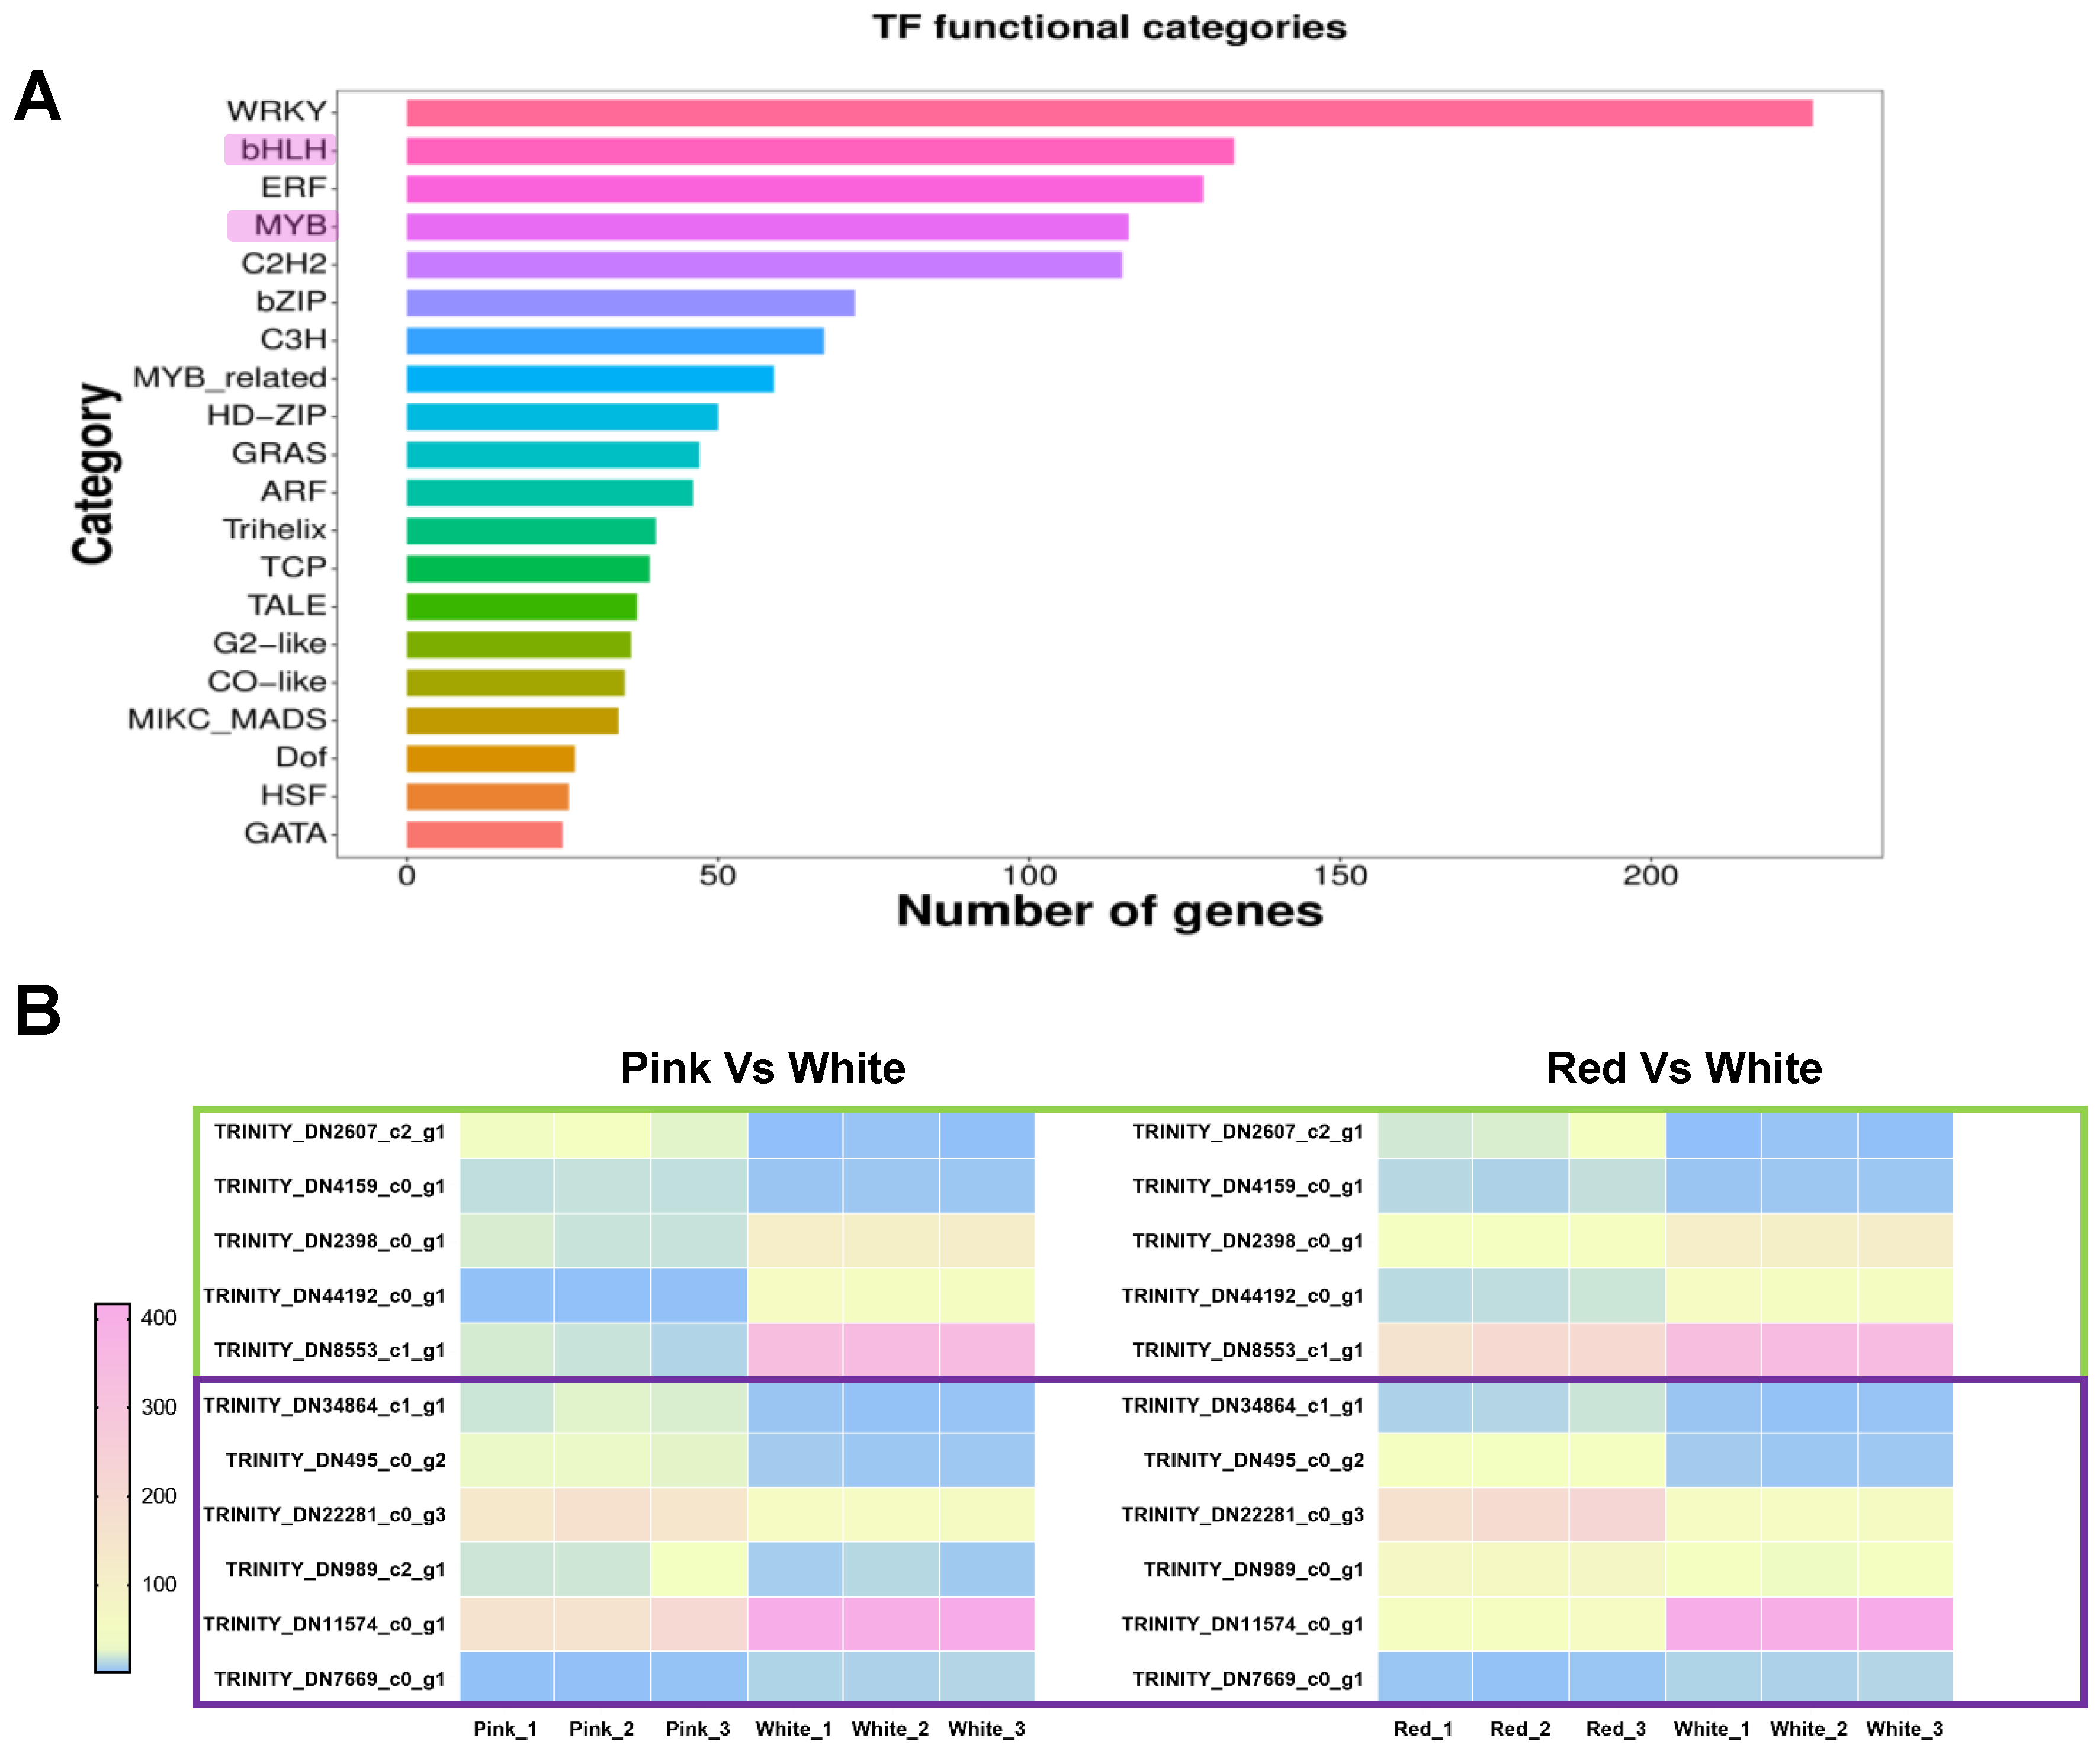
In previous studies on the regulation of anthocyanin biosynthesis metabolism, it has been found that the biosynthetic pathway of plant anthocyanins is regulated by the MBW protein complex, which is MYB-bHLH-WD40 [34,35], with MYB-bHLH playing a key role [36,37,38]. To further explore the regulatory mechanisms of anthocyanin biosynthesis in differently colored Cosmos bipinnata Cav., we further analyzed the differentially expressed MYB and bHLH transcription factors from the transcriptome sequencing. As shown in the figure, we obtained a total of 133 differentially expressed bHLH transcription factors and 116 MYB transcription factors (Figure 6A). To further mine the key regulatory factors involved in the regulation of anthocyanin biosynthesis in differently colored petals, we screened the transcription factors that were differentially expressed in both red vs. white flowers and pink vs. white flowers, as shown in the figure, including five bHLH TFs, with two up-regulated (TRINITY_DN2607_c2_g1, TRINITY_DN4159_c0_g1) and three down-regulated (TRINITY_DN2398_c0_g1, TRINITY_DN44192_c0_g1, TRINITY_DN8553_c1_g1); and six MYB TFs, with four up-regulated (TRINITY_DN34864_c1_g1,TRINITY_DN495_c0_g2, TRINITY_DN22281_c0_g3, TRINITY_DN989_c2_g1) and two down-regulated (TRINITY_DN11574_c0_g1, TRINITY_DN7669_c0_g1) (Figure 6B).
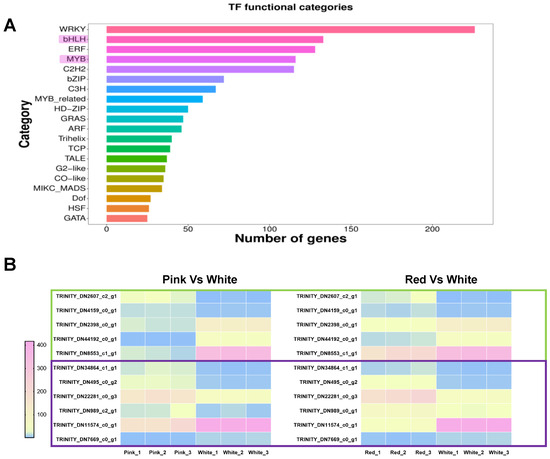
Figure 6.
Analysis of transcription factor (TF) functional categories and expression patterns. (A) Bar graph showing the number of genes associated with different transcription factor (TF) functional categories. The categories are listed on the y-axis, and the number of genes is represented on the x-axis. (B) Heatmap illustrates the expression patterns of MYB and bHLH transcription factors that are differentially expressed in both the red vs. white and pink vs. white group comparisons. The color gradient from blue to pink represents low to high expression levels. Genes are labeled with their respective Trinity IDs, with green boxes indicating bHLH transcription factors and purple boxes indicating MYB transcription factors.
Furthermore, to explore the potential functions of the above transcription factors in the biosynthesis of anthocyanins in Cosmos bipinnata Cav., we constructed and analyzed a phylogenetic tree, with the results shown in the Supplementary Materials (Figures S1 and S2). In the two phylogenetic trees, the red ones represent candidate positive regulatory factors obtained from the analysis of differentially expressed transcription factors in different flower color transcriptomes, and the blue ones represent candidate negative regulatory factors.
In the bHLH phylogenetic tree (Figure S1), among the Arabidopsis proteins most closely related to our candidate bHLH transcription factors, the vast majority have not yet been characterized in relation to plant flavonoid metabolism. Only AtbHLH1, which is most closely related to Trinity DN2398 c0_g1, has been shown in numerous previous studies to be a member of the Arabidopsis MBW protein complex, playing a positive regulatory role in flavonoid biosynthesis [14,39,40]. This differs from our identified Trinity DN2398 c0_g1 as a candidate negative regulatory factor in the flavonoid biosynthesis of Cosmos bipinnata Cav., suggesting that homologous genes may play different roles in different species, and require further exploration.
In the MYBs phylogenetic tree (Figure S2), Trinity DN11574 c0_g1 is most closely related to Arabidopsis MYB4, which is characterized as a negative regulator of anthocyanin [41]. However, the biological function in Arabidopsis of the homologous transcription factors of Trinity DN7669 c0_g1 regarding the biosynthesis of flavonoids is currently unclear. The protein Trinity DN989 c1_g1 is most closely related to Arabidopsis MYB20 and MYB43, which are characterized as positive regulators of the biosynthesis of phenylalanine and lignin [42]. This suggests that our candidate TF Trinity DN989 c1_g1 may be involved in the regulation of phenylalanine biosynthesis in the upstream pathway of flavonoid biosynthesis. The two Arabidopsis transcription factors most closely related to Trinity DN34864 c1 g1, MYB106 and MYB118, have not yet been characterized as being involved in flavonoids metabolism. The Trinity DN495 c0_g2 and DN2281 c0_g3 proteins have the closest homology to the Arabidopsis MYB57 transcription factor, which is characterized as promoting the accumulation of flavonoids by positively regulating the expression of AtFLS1 [43]. This suggests that our two candidate transcription factors may positively regulate the branch pathway of flavonoid metabolism in different flowers.
3.6. Regulatory Network of Predicted Flavonoid and Anthocyanidin Biosynthetic Pathways
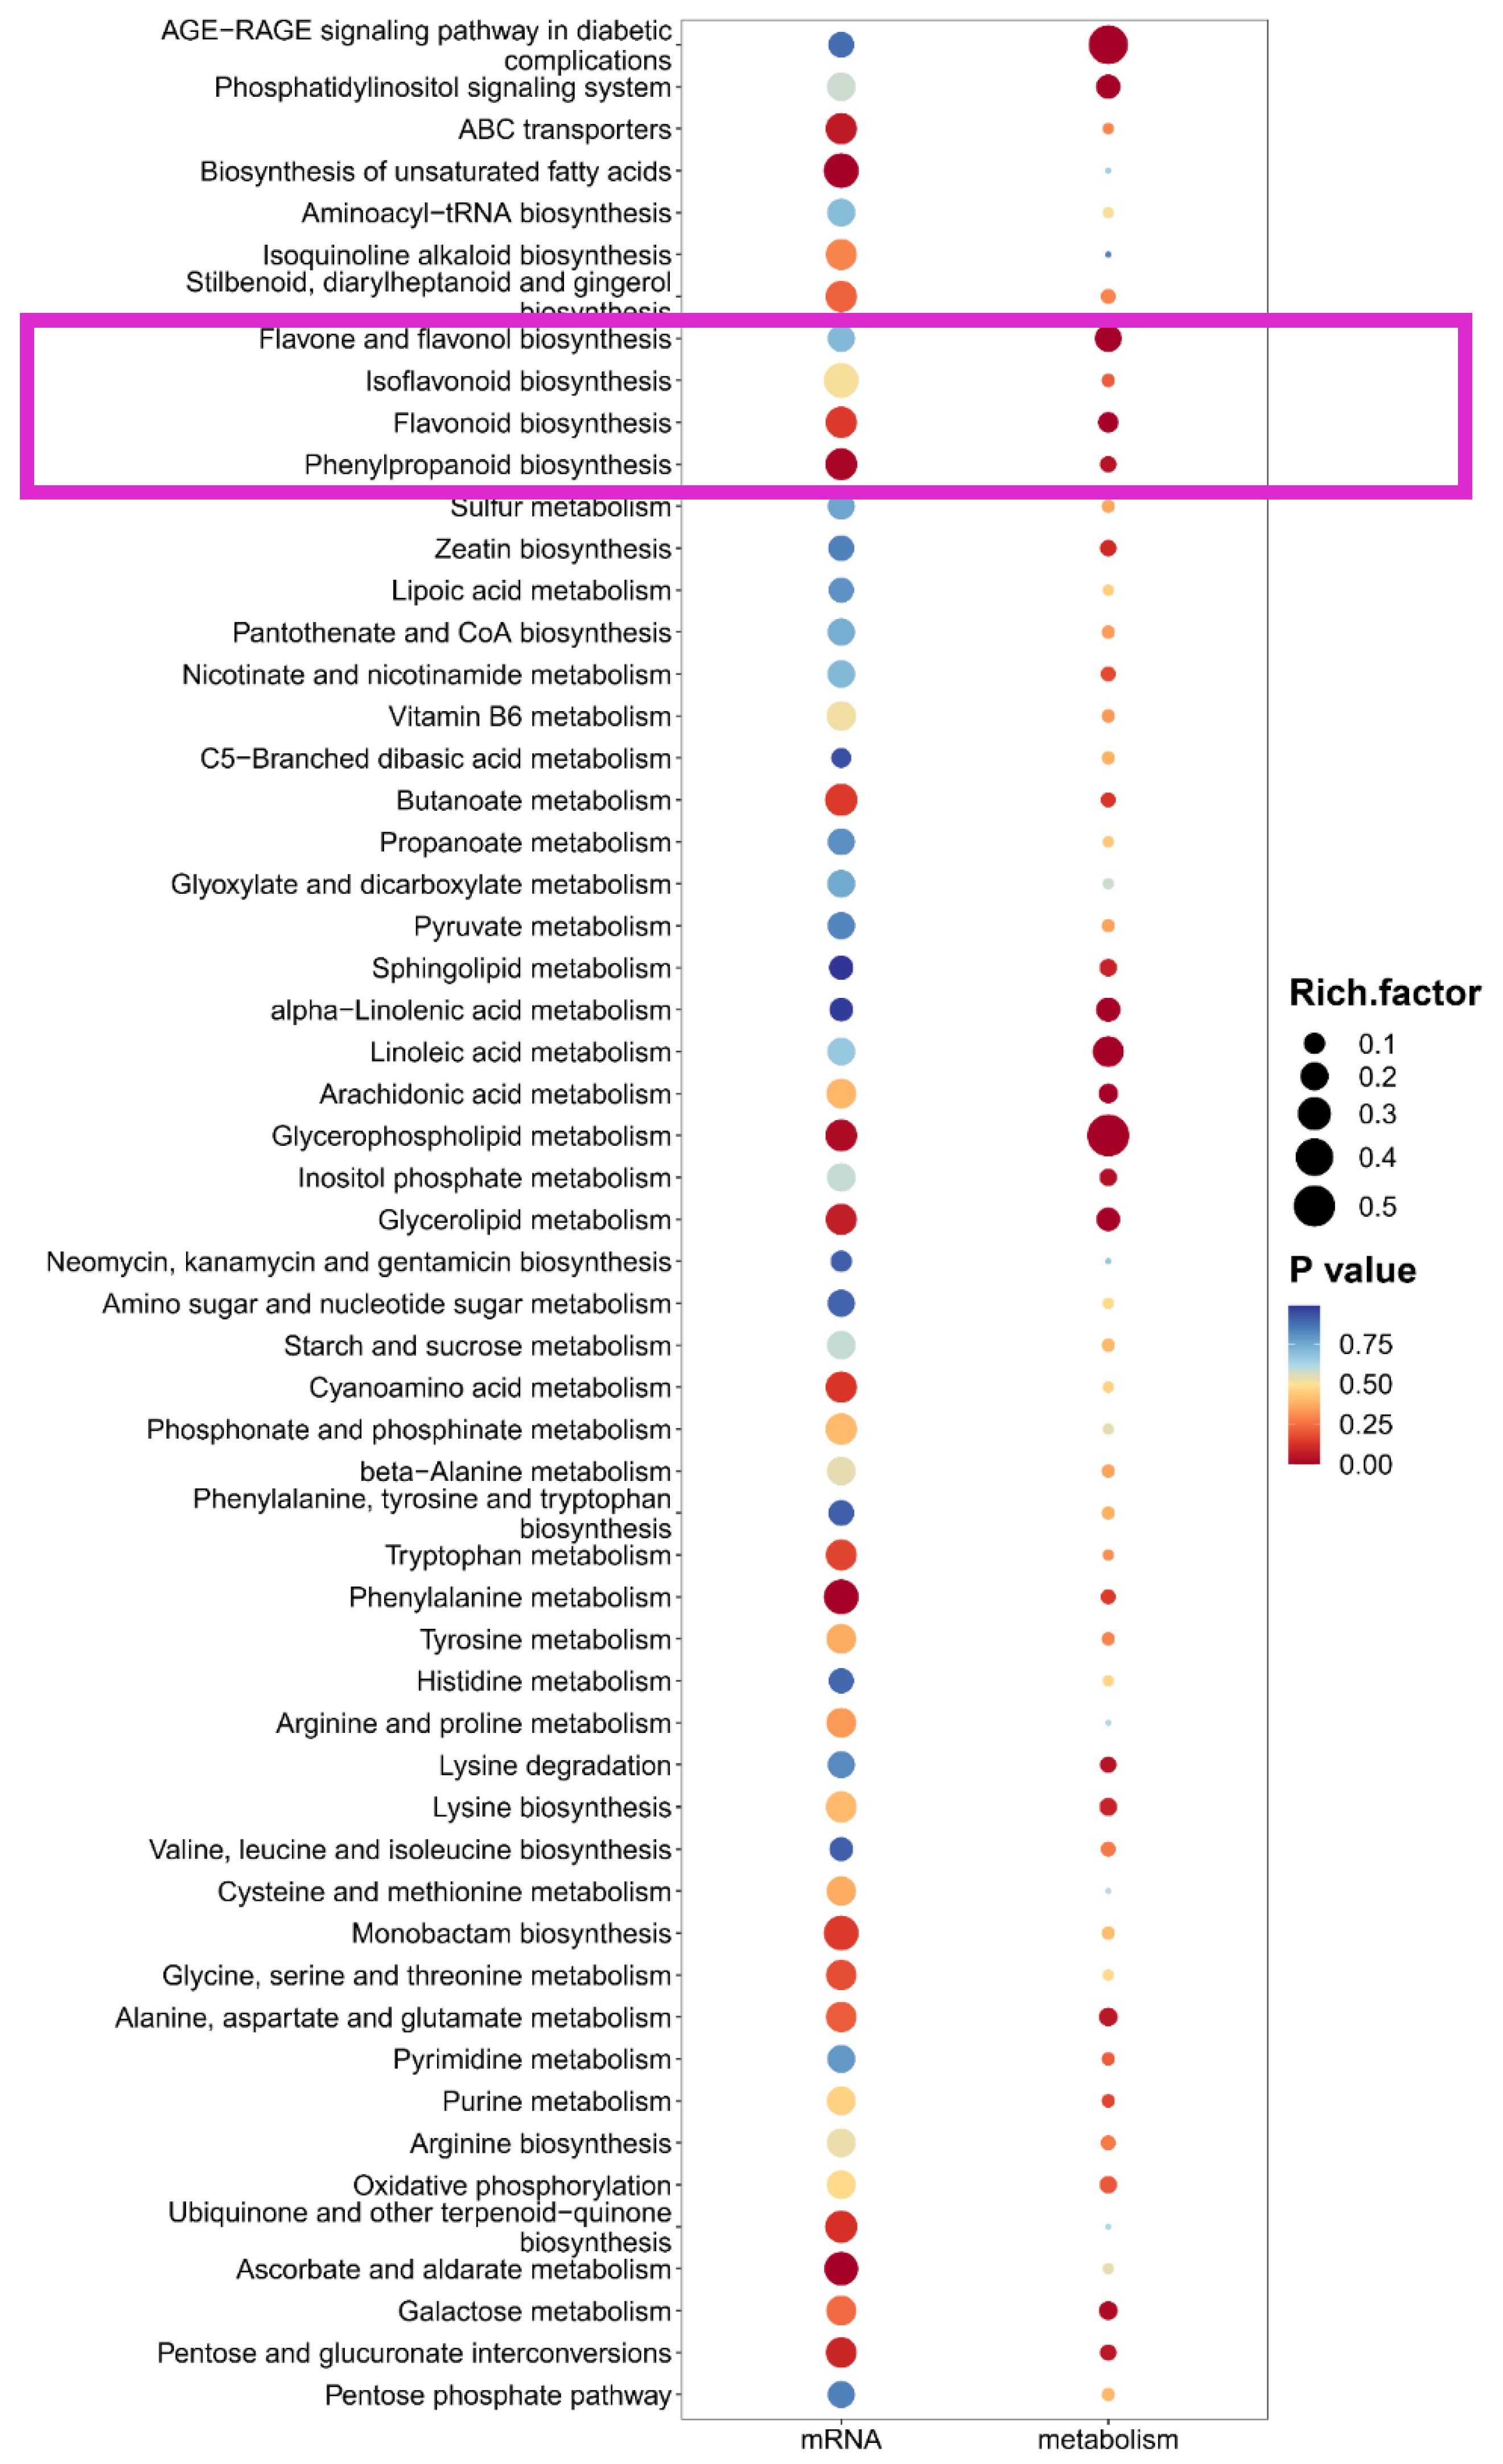
To circumvent the limitations of single-omics analysis, we conducted a joint analysis of the transcriptome and metabolome sequencing data obtained from differently colored flowers. The results are shown in the figure, in the combined analysis of the three groups, namely red vs. white, red vs. pink and pink vs. white flowers, we have identified metabolic pathways for flavone and flavonol biosynthesis, isoflavonoid biosynthesis, flavonoid biosynthesis, and phenylpropanoid biosynthesis (Figure 7 and Figure S3). Among the four above pathways, except for mRNA of flavone and flavonol biosynthesis, other bubbles show a red color scheme, indicating significant enrichment in the relevant pathways. This further indicates that the formation of different petal colors in flowers is regulated by the differences in metabolism of phenylalanine and flavonoids, as well as related structural genes and upstream candidate transcription factors, which provide a genetic reserve for subsequent guidance in the directed breeding of flower color.
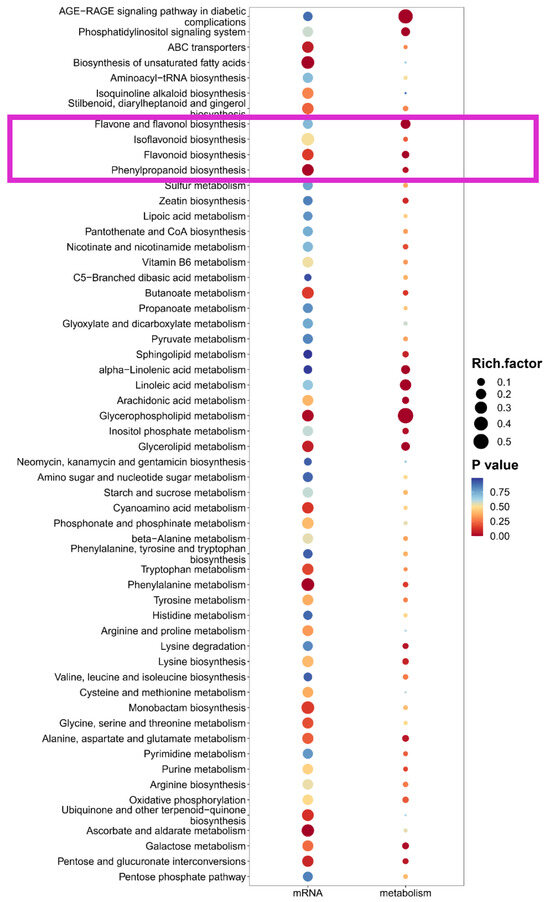
Figure 7.
Integrated enrichment analysis of transcriptomics and metabolomics between Pink vs. White flowers. The x-axis lists the metabolic pathways, with the p-value represented by a gradient from blue to red, where red indicates a more significant enrichment (lower p-value), and the size of each bubble corresponds to the degree of enrichment. The pink box represents flavonoid metabolism and its related metabolic pathways.
4. Discussion
The variation in flower color has been a subject of keen interest due to its significant role in plant breeding and its commercial value. Among them, flavonoid metabolism is important in determining plant color. However, in Cosmos bipinnata Cav., the unclear metabolic pathways of flavonoids and their molecular regulation have greatly limited the breeding of flower color. Anthocyanins are important products in the flavonoid metabolic pathway, and they are widely found in plants in nature. Anthocyanins can give flowers and fruits vivid colors, such as red, purple, and blue. In past studies, anthocyanin biosynthetic pathways were found be highly conserved during plant evolution [44], and plant anthocyanins biosynthesis was found be regulated by both endogenous and exogenous factors [45,46]. Our research combined the analysis of the metabolome and transcriptome of different flower colors, revealing to some extent the anthocyanin metabolism and regulation in different flower colors, laying the foundation for subsequent molecular-directed breeding. Of course, with advancements in omics technologies, further incorporating fields such as proteomics and modificationomics and conducting more comprehensive omics-based integrated analyses [47] can provide more precise and effective assistance in uncovering the molecular mechanisms behind flower color formation.
In our study, we found through metabolomic analysis that the different colors of Cosmos bipinnata Cav. petals are closely related to the content of products in the flavonoid metabolic pathway, especially anthocyanins, which is consistent with the previous research showing that anthocyanins determine plant color [2,3,4]. Furthermore, in the differential transcriptome analysis, we discovered that the biosynthesis genes PAL and C4H in the early stages of the flavonoid metabolic pathway were significantly upregulated in colored flowers (Figure 5), suggesting that early biosynthesis genes may play a key role in the formation of different flower colors in Cosmos bipinnata Cav. Similarly, the combined analysis of transcriptomics and metabolomics further pinpoints the flavonoid metabolic pathway as the key to the color differences observed in Cosmos bipinnata Cav. flowers. This is similar to the mechanism by which flavonoid metabolism pathways and their regulation affect plant color in other species, such as ornamental crabapple [48] and chrysanthemum [49].
Furthermore, our research has identified candidate transcription factors that regulate flavonoid metabolism, and constructed a phylogenetic tree for them. Among the Arabidopsis transcription factors that are most closely related to them, some have already been characterized for their regulatory role in anthocyanin biosynthesis, such as AtMYB4 [41] and AtbHLH1 [14,39,40] and etc., while others remain unclear. This also inspires the subsequent characterization of the biological functions of the candidate transcription factors we have identified in regulating anthocyanin biosynthesis. At a deeper level, although a canonical MBW complex has been described as involved in regulating flavonoids biosynthesis in many species, such as TTG1-GL3/TT8-PAP1 in Arabidopsis [50], MYB6-bHLH2 in chrysanthemum [19], and AN4-AN1-AN11 [51] in petunia, whether MYB and bHLH interact to form an MBW complex, and the molecular regulatory mechanisms of anthocyanin synthesis after their interaction, await further verification and exploration through molecular biology experiments. Of course, the phenomenon that homologous genes play different roles in different species also requires extra attention, as seen in Trinity DN2398 c0_g1 and AtbHLH1 (Figure S1), this may mean that homologous genes have different biological functions in different species.
The integration of transcriptome and metabolome data provides us with a more comprehensive analytical perspective, revealing a regulatory network that includes not only structural genes, but also the transcription factors that control the expression of these genes. This lays a solid foundation for the study of the molecular basis of flower color formation in Cosmos bipinnata Cav. plants, offering insights into the diversity of flower colors and subsequent targeted flower color breeding, thereby enhancing the esthetic and commercial value of ornamental plants.
Supplementary Materials
The following supporting information can be downloaded at: https://www.mdpi.com/article/10.3390/agriculture15030255/s1, Figure S1: Phylogenetic tree of bHLH transcription factors family; Figure S2: Phylogenetic tree of MYB transcription factors family; Figure S3: Integrated enrichment analysis of transcriptomics and metabolomics between Red vs. Pink (A) and Red vs. White (B); Table S1: Summary of transcriptome sequencing data for Cosmos bipinnatus Cav. petals with three different colors; Table S2: Summary of R package used.
Author Contributions
Y.W. conceived and designed the experiments; Y.W. and J.P. performed the experiments; Q.Z. and X.M. provided technical assistance; Y.H. coordinated sequencing efforts; Y.W. and X.Y. analyzed the data; Y.W. wrote the manuscript. All authors have read and agreed to the published version of the manuscript.
Funding
This work was financially supported by the Natural Science Foundation of the Jiangsu Higher Education Institutions of China (24KJD220001, 21KJB220005) and the Natural Science Foundation of Jiangsu Province, China (BK20230116, BK20240218).
Institutional Review Board Statement
Not applicable.
Data Availability Statement
Data are contained within the article or the Supplementary Materials. The original contributions presented in this study are included in the article/Supplementary Materials. Further inquiries can be directed to the corresponding author.
Acknowledgments
We appreciate Jiangsu Engineering and Technology Centre for Ecological and Environmental Protection in Urban and Rural Water Environment Management and Low Carbon Development for providing the relevant experimental equipment and facilities.
Conflicts of Interest
The authors declare no conflicts of interest.
References
- Gao, H.-N.; Jiang, H.; Cui, J.-Y.; You, C.-X.; Li, Y.-Y. The effects of hormones and environmental factors on anthocyanin biosynthesis in apple. Plant Sci. 2021, 312, 111024. [Google Scholar] [CrossRef] [PubMed]
- Grotewold, E. The genetics and biochemistry of floral pigments. Annu. Rev. Plant Biol. 2006, 57, 761–780. [Google Scholar] [CrossRef] [PubMed]
- Tanaka, Y.; Sasaki, N.; Ohmiya, A. Biosynthesis of plant pigments: Anthocyanins, betalains and carotenoids. Plant J. 2008, 54, 733–749. [Google Scholar] [CrossRef] [PubMed]
- Zhao, D.; Tao, J. Recent advances on the development and regulation of flower color in ornamental plants. Front. Plant Sci. 2015, 6, 261. [Google Scholar] [CrossRef]
- Lepiniec, L.; Debeaujon, I.; Routaboul, J.-M.; Baudry, A.; Pourcel, L.; Nesi, N.; Caboche, M. Genetics and biochemistry of seed flavonoids. Annu. Rev. Plant Biol. 2006, 57, 405–430. [Google Scholar] [CrossRef]
- Lu, C.; Li, Y.; Wang, J.; Qu, J.; Chen, Y.; Chen, X.; Huang, H.; Dai, S. Flower color classification and correlation between color space values with pigments in potted multiflora chrysanthemum. Sci. Hortic. 2021, 283, 110082. [Google Scholar] [CrossRef]
- Tanaka, Y.; Brugliera, F.; Chandler, S. Seeing is believing: Engineering anthocyanin and carotenoid biosynthetic pathways. Curr. Opin. Biotechnol. 2008, 19, 190–197. [Google Scholar] [CrossRef]
- Tanaka, Y.; Brugliera, F. Flower colour and cytochromes P450. Philos. Trans. R. Soc. London. Ser. B Biol. Sci. 2013, 368, 20120432. [Google Scholar] [CrossRef]
- Bakowska-Barczak, A. Acylated anthocyanins as stable, natural food colorants—A review. Pol. J. Food Nutr. Sci. 2005, 14, 55. [Google Scholar]
- Yabuya, T.; Nakamura, M.; Iwashina, T.; Yamaguchi, M.; Takehara, T. Anthocyanin-flavone copigmentation in bluish purple flowers of Japanese garden iris (Iris ensata Thunb.). Euphytica 1997, 98, 163–167. [Google Scholar] [CrossRef]
- Barnard, H.; Dooley, A.N.; Areshian, G.; Gasparyan, B.; Faull, K. Chemical evidence for wine production around 4000 BCE in the Late Chalcolithic Near Eastern highlands. J. Archaeol. Sci. 2011, 38, 977–984. [Google Scholar] [CrossRef]
- Wang, Y.; Zhou, L.-J.; Wang, Y.; Liu, S.; Chen, F. Functional identification of a flavone synthase and a flavonol synthase genes affecting flower color formation in Chrysanthemum morifolium. Plant Physiol. Biochem. 2021, 166, 1109–1120. [Google Scholar] [CrossRef] [PubMed]
- Dubos, C.; Stracke, R.; Grotewold, E.; Weisshaar, B.; Martin, C.; Lepiniec, L. MYB transcription factors in Arabidopsis. Trends Plant Sci. 2010, 15, 573–581. [Google Scholar] [CrossRef] [PubMed]
- Gonzalez, A.; Zhao, M.; Leavitt, J.M.; Lloyd, A.M. Regulation of the anthocyanin biosynthetic pathway by the TTG1/bHLH/Myb transcriptional complex in Arabidopsis seedlings. Plant J. 2008, 53, 814–827. [Google Scholar] [CrossRef] [PubMed]
- Albert, N.W.; Lewis, D.H.; Zhang, H.; Irving, L.J.; Jameson, P.E.; Davies, K.M. Light-induced vegetative anthocyanin pigmentation in Petunia. J. Exp. Bot. 2009, 60, 2191–2202. [Google Scholar] [CrossRef]
- Jaakola, L.; Hohtola, A. Effect of latitude on flavonoid biosynthesis in plants. Plant Cell Env. 2010, 33, 1239–1247. [Google Scholar] [CrossRef] [PubMed]
- Imène, H.; Heppel, S.C.; Jérémy, P.; Céline, L.; Stefan, C.; Serge, D.; Virginie, L.; Jochen, B. The Basic Helix-Loop-Helix Transcription Factor MYC1 Is Involved in the Regulation of the Flavonoid Biosynthesis Pathway in Grapevine. Mol. Plant 2010, 3, 509–523. [Google Scholar]
- Petroni, K.; Tonelli, C. Recent advances on the regulation of anthocyanin synthesis in reproductive organs. Plant Sci. 2011, 181, 219–229. [Google Scholar] [CrossRef] [PubMed]
- Xiang, L.-l.; Liu, X.-f.; Li, X.; Yin, X.-r.; Grierson, D.; Li, F.; Chen, K.-s. A Novel bHLH Transcription Factor Involved in Regulating Anthocyanin Biosynthesis in Chrysanthemums (Chrysanthemum morifolium Ramat.). PLoS ONE 2015, 10, e0143892. [Google Scholar] [CrossRef] [PubMed]
- Xiang, L.; Liu, X.; Shi, Y.; Li, Y.; Li, W.; Li, F.; Chen, K. Comparative Transcriptome Analysis Revealed Two Alternative Splicing bHLHs Account for Flower Color Alteration in Chrysanthemum. Int. J. Mol. Sci. 2021, 22, 12769. [Google Scholar] [CrossRef]
- Zhou, L.-J.; Geng, Z.; Wang, Y.; Wang, Y.; Liu, S.; Chen, C.; Song, A.; Jiang, J.; Chen, S.; Chen, F. A novel transcription factor CmMYB012 inhibits flavone and anthocyanin biosynthesis in response to high temperatures in chrysanthemum. Hortic. Res. 2021, 8, 248. [Google Scholar] [CrossRef]
- Wang, Y.; Zhou, L.-J.; Wang, Y.; Geng, Z.; Liu, S.; Chen, C.; Chen, S.; Jiang, J.; Chen, F. CmMYB9a activates floral coloration by positively regulating anthocyanin biosynthesis in chrysanthemum. Plant Mol. Biol. 2022, 108, 51–63. [Google Scholar] [CrossRef]
- Wang, Y.; Zhou, L.-J.; Wang, Y.; Geng, Z.; Ding, B.; Jiang, J.; Chen, S.; Chen, F. An R2R3-MYB transcription factor CmMYB21 represses anthocyanin biosynthesis in color fading petals of chrysanthemum. Sci. Hortic. 2022, 293, 110674. [Google Scholar] [CrossRef]
- Xiang, L.; Liu, X.; Li, H.; Yin, X.; Grierson, D.; Li, F.; Chen, K. CmMYB#7, an R3 MYB transcription factor, acts as a negative regulator of anthocyanin biosynthesis in chrysanthemum. J. Exp. Bot. 2019, 70, 3111–3123. [Google Scholar] [PubMed]
- Hu, Q.; Yang, L.; Liu, S.; Zhou, L.; Wang, X.; Wang, W.; Cai, L.; Wu, X.; Chang, Y.; Wang, S. A repressor motif-containing poplar R3 MYB-like transcription factor regulates epidermal cell fate determination and anthocyanin biosynthesis in Arabidopsis. J. Plant Biol. 2016, 59, 525–535. [Google Scholar] [CrossRef]
- Shin, D.H.; Choi, M.; Kim, K.; Bang, G.; Cho, M.; Choi, S.-B.; Choi, G.; Park, Y.-I. HY5 regulates anthocyanin biosynthesis by inducing the transcriptional activation of the MYB75/PAP1 transcription factor in Arabidopsis. FEBS Lett. 2013, 587, 1543–1547. [Google Scholar] [CrossRef]
- Zhou, L.-J.; Li, Y.-Y.; Zhang, R.-F.; Zhang, C.-L.; Xie, X.-B.; Zhao, C.; Hao, Y.-J. The small ubiquitin-like modifier E3 ligase MdSIZ1 promotes anthocyanin accumulation by sumoylating MdMYB1 under low-temperature conditions in apple. Plant Cell Environ. 2017, 40, 2068–2080. [Google Scholar] [CrossRef] [PubMed]
- Kim, J.; Woo, H.R.; Nam, H.G. Toward systems understanding of leaf senescence: An integrated multi-omics perspective on leaf senescence research. Mol. Plant Pathol. 2016, 9, 813–825. [Google Scholar] [CrossRef] [PubMed]
- Zhang, T.; Hu, Y.; Jiang, W.; Fang, L.; Guan, X.; Chen, J.; Zhang, J.; Saski, C.A.; Scheffler, B.E.; Stelly, D.M. Sequencing of allotetraploid cotton (Gossypium hirsutum L. acc. TM-1) provides a resource for fiber improvement. Nat. Biotechnol. 2015, 33, 531–537. [Google Scholar] [CrossRef]
- Jordan, K.W.; Nordenstam, J.; Lauwers, G.Y.; Rothenberger, D.A.; Alavi, K.; Garwood, M.; Cheng, L.L. Metabolomic characterization of human rectal adenocarcinoma with intact tissue magnetic resonance spectroscopy. Dis. Colon Rectum 2009, 52, 520. [Google Scholar] [CrossRef] [PubMed]
- Chen, S.; Zhang, L.; Xu, X.; Lv, H.; Yang, Y. Studies on factors influence UV-absorbance and color value of microencapsulated lutein. China Food Addit. 2013, 4, 100–102. [Google Scholar]
- Gonnet, J.-F. Colour effects of co-pigmentation of anthocyanins revisited-1. A colorimetric definition using the CIELAB scale. Food Chem. 1998, 63, 409–415. [Google Scholar] [CrossRef]
- Lyu, F.; Han, F.; Ge, C.; Mao, W.; Chen, L.; Hu, H.; Chen, G.; Lang, Q.; Fang, C. OmicStudio: A composable bioinformatics cloud platform with real-time feedback that can generate high-quality graphs for publication. iMeta 2023, 2, e85. [Google Scholar] [CrossRef] [PubMed]
- Hong, Y.; Lv, Y.; Zhang, J.; Ahmad, N.; Li, X.; Yao, N.; Liu, X.; Li, H. The safflower MBW complex regulates HYSA accumulation through degradation by the E3 ligase CtBB1. J. Integr. Plant Biol. 2023, 65, 1277–1296. [Google Scholar] [CrossRef]
- Lloyd, A.; Brockman, A.; Aguirre, L.; Campbell, A.; Bean, A.; Cantero, A.; Gonzalez, A. Advances in the MYB-bHLH-WD Repeat (MBW) Pigment Regulatory Model: Addition of a WRKY Factor and Co-option of an Anthocyanin MYB for Betalain Regulation. Plant Cell Physiol. 2017, 58, 1431–1441. [Google Scholar] [CrossRef]
- Sun-Hyung, L.; Da-Hye, K.; Kim, J.K.; Jong-Yeol, L.; Sun-Hwa, H. A Radish Basic Helix-Loop-Helix Transcription Factor, RsTT8 Acts a Positive Regulator for Anthocyanin Biosynthesis. Front. Plant Sci. 2017, 8, 1917. [Google Scholar]
- Liu, X.-F.; Yin, X.-R.; Allan, A.C.; Lin-Wang, K.; Shi, Y.-N.; Huang, Y.-J.; Ferguson, I.B.; Xu, C.-J.; Chen, K.-S. The role of MrbHLH1 and MrMYB1 in regulating anthocyanin biosynthetic genes in tobacco and Chinese bayberry (Myrica rubra) during anthocyanin biosynthesis. Plant Cell Tissue Organ Cult. 2013, 115, 285–298. [Google Scholar] [CrossRef]
- Lai, B.; Du, L.-N.; Liu, R.; Hu, B.; Su, W.-B.; Qin, Y.-H.; Zhao, J.-T.; Wang, H.-C.; Hu, G.-B. Two LcbHLH transcription factors interacting with LcMYB1 in regulating late structural genes of anthocyanin biosynthesis in Nicotiana and Litchi chinensis during anthocyanin accumulation. Front. Plant Sci. 2016, 7, 106. [Google Scholar] [CrossRef] [PubMed]
- Zhang, F.; Gonzalez, A.; Zhao, M.; Payne, C.T.; Lloyd, A. A network of redundant bHLH proteins functions in all TTG1-dependent pathways of Arabidopsis. Development 2003, 130, 4859–4869. [Google Scholar] [CrossRef]
- Cominelli, E.; Gusmaroli, G.; Allegra, D.; Galbiati, M.; Wade, H.K.; Jenkins, G.I.; Tonelli, C. Expression analysis of anthocyanin regulatory genes in response to different light qualities in Arabidopsis thaliana. J. Plant Physiol. 2008, 165, 886–894. [Google Scholar] [CrossRef]
- Wang, X.-C.; Wu, J.; Guan, M.-L.; Zhao, C.-H.; Geng, P.; Zhao, Q. Arabidopsis MYB4 plays dual roles in flavonoid biosynthesis. Plant J. 2020, 101, 637–652. [Google Scholar] [CrossRef]
- Geng, P.; Zhang, S.; Liu, J.; Zhao, C.; Wu, J.; Cao, Y.; Fu, C.; Han, X.; He, H.; Zhao, Q. MYB20, MYB42, MYB43, and MYB85 regulate phenylalanine and lignin biosynthesis during secondary cell wall formation. Plant Physiol. 2020, 182, 1272–1283. [Google Scholar] [CrossRef] [PubMed]
- Zhang, X.; He, Y.; Li, L.; Liu, H.; Hong, G. Involvement of the R2R3-MYB transcription factor MYB21 and its homologs in regulating flavonol accumulation in Arabidopsis stamen. J. Exp. Bot. 2021, 72, 4319–4332. [Google Scholar] [CrossRef]
- Winkel Shirley, B. It takes a garden. How work on diverse plant species has contributed to an understanding of flavonoid metabolism. Plant Physiol. 2001, 127, 1399–1404. [Google Scholar] [CrossRef] [PubMed]
- Liu, H.; Liu, Z.; Wu, Y.; Zheng, L.; Zhang, G. Regulatory mechanisms of anthocyanin biosynthesis in apple and pear. Int. J. Mol. Sci. 2021, 22, 8441. [Google Scholar] [CrossRef]
- Xu, W.; Dubos, C.; Lepiniec, L. Transcriptional control of flavonoid biosynthesis by MYB–bHLH–WDR complexes. Trends Plant Sci. 2015, 20, 176–185. [Google Scholar] [CrossRef] [PubMed]
- Yang, L.; Yang, Y.; Huang, L.; Cui, X.; Liu, Y. From single-to multi-omics: Future research trends in medicinal plants. Brief. Bioinform. 2023, 24, bbac485. [Google Scholar] [CrossRef] [PubMed]
- Huang, B.; Rong, H.; Ye, Y.; Ni, Z.; Xu, M.; Zhang, W.; Xu, L.-A. Transcriptomic analysis of flower color variation in the ornamental crabapple (Malus spp.) half-sib family through Illumina and PacBio Sequel sequencing. Plant Physiol. Biochem. 2020, 149, 27–35. [Google Scholar] [CrossRef]
- Geng, Z.; Wang, Y.; Wang, Y.; Wang, Y.; Sun, Y.; Wang, H.; Zhou, L.; Jiang, J.; Chen, S.; Chen, F. Transcriptomic and metabolomic analyses reveal CmMYB308 as a key regulator in the pink flower color variation of ‘Dante Purple’chrysanthemum. Plant Cell Rep. 2024, 43, 1–14. [Google Scholar] [CrossRef] [PubMed]
- Shi, M.-Z.; Xie, D.-Y. Biosynthesis and metabolic engineering of anthocyanins in Arabidopsis thaliana. Recent Pat. Biotechnol. 2014, 8, 47–60. [Google Scholar] [CrossRef] [PubMed]
- Albert, N.W.; Lewis, D.H.; Zhang, H.; Schwinn, K.E.; Davies, K.M. Members of an R2R3-MYB transcription factor family in Petunia are developmentally and environmentally regulated to control complex floral and vegetative pigmentation patterning. Plant J. 2011, 65, 771–784. [Google Scholar] [CrossRef] [PubMed]
Disclaimer/Publisher’s Note: The statements, opinions and data contained in all publications are solely those of the individual author(s) and contributor(s) and not of MDPI and/or the editor(s). MDPI and/or the editor(s) disclaim responsibility for any injury to people or property resulting from any ideas, methods, instructions or products referred to in the content. |
© 2025 by the authors. Licensee MDPI, Basel, Switzerland. This article is an open access article distributed under the terms and conditions of the Creative Commons Attribution (CC BY) license (https://creativecommons.org/licenses/by/4.0/).