Article

An Automatic Irrigation System Based on Hourly Cumulative Evapotranspiration for Reducing Agricultural Water Usage

1
Department of Bio-AI Convergence, Chungnam National University, Daejeon 34134, Republic of Korea
2
Department of Horticultural Science, Chungnam National University, Daejeon 34134, Republic of Korea
3
Institute of Agricultural Science, Chungnam National University, Daejeon 34134, Republic of Korea
*
Author to whom correspondence should be addressed.
Agriculture 2025, 15(3), 308; https://doi.org/10.3390/agriculture15030308
Submission received: 20 December 2024 / Revised: 24 January 2025 / Accepted: 29 January 2025 / Published: 30 January 2025
(This article belongs to the Section Agricultural Water Management)

Abstract

:
This study investigates the development and application of an automatic irrigation system based on hourly cumulative evapotranspiration (ET) to optimize cabbage growth while reducing agricultural water usage. Traditional irrigation methods often result in inefficient water use due to reliance on human judgment or fixed schedules. To address this issue, the proposed system utilizes environmental data collected from a field sensor (FS), the Korea meteorological administration (KMA), and a virtual sensor based on a machine learning model (ML) to calculate the hourly ET and automate irrigation. The ET was calculated using the FAO 56 Penman–Monteith (P-M) ETo. Experiments were conducted to compare the effectiveness of different irrigation levels, ranging from 40, 60, 80, and 100% crop evapotranspiration (ETc), on plant growth and the irrigation water productivity (WPI). During the 46-day experimental period, cabbage growth and WPI were higher in the FS and KMA 60% ETc levels compared to other irrigation levels, with water usage of 8.90 and 9.07 L/plant, respectively. In the ML treatment, cabbage growth and WPI were higher in the 80% ETc level compared to other irrigation levels, with water usage of 8.93 L/plant. These results demonstrated that irrigation amounts of approximately 9 L/plant provided the optimal balance between plant growth and water conservation over 46 days. This system presents a promising solution for improving crop yield while conserving water resources in agricultural environments.

1. Introduction

Water is an essential element used in various fields, including domestic use, agricultural use, industrial use, environmental maintenance and restoration, recreation, and tourism [1,2,3,4]. Although water covers 71% of the Earth’s surface, the water resources available for human use are limited [5]. As of 2024, many countries are experiencing water shortages due to the increasing global population [6,7,8]. To resolve these issues, many countries are implementing Integrated Water Resources Management (IWRM) policies. IWRM is a method for effectively and sustainably managing water resources [9]. It coordinates the development and management of water, land, and related resources to maximize economic and social welfare without compromising the sustainability of vital ecosystems [10,11]. In the Republic of Korea, the IWRM policy is being applied in agriculture, aiming to minimize unnecessary agricultural water usage [12,13]. It is essential to collect sensor-based data on environmental factors and perform real-time crop monitoring to minimize unnecessary agricultural water use [14,15]. Additionally, a comprehensive irrigation strategy for managing agricultural water is necessary.
As climate change becomes more extreme, the amount of water required by crops is changing [16,17,18]. Traditional irrigation methods relied on experience. Farmers manually irrigated the fields or used agricultural machinery such as sprinklers and irrigation systems. For instance, cabbage cultivation can utilize methods such as sprinkler and drip irrigation [19]. Applying the proper amount of water at the appropriate time is essential for maximizing yield and improving water efficiency [20]. However, these irrigation methods, which rely on human experience, often lead to unnecessary agricultural water use and are not effective in water management.
Therefore, a precision agriculture-based irrigation system is necessary to reduce agricultural water use. Precision agriculture is a farming approach that utilizes advanced technology to increase agricultural productivity and maximize resource use efficiency [21,22]. It is essential to collect data through real-time monitoring of environmental factors and crops to maximize resource use efficiency, ensuring resources are supplied when needed for crop cultivation. In precision agriculture, environmental data that can be collected include temperature, relative humidity, atmospheric pressure, precipitation and rainfall, wind speed, solar radiation, soil moisture content, and temperature [23,24]. Efficient agricultural water management methods in precision agriculture based on environmental data include soil moisture sensor-based water management and evapotranspiration (ET)-based water management [25,26].
Soil moisture sensor-based water management involves determining soil moisture content in real-time and supplying the appropriate amount of water when needed [27]. This method allows for the direct assessment of TAW (Total Available Water) and RAW (Readily Available Water) ranges, thereby reducing unnecessary agricultural water use and supplying crops with the exact amount of water they need, resulting in efficient use of water resources [28,29]. However, the installation and cost of sensors are high, and the measurement results can vary depending on the accuracy and reliability of the sensors. Maintenance is required to prevent sensor failures or malfunctions, and, since sensors only reflect the soil conditions of specific areas where they are installed, it can be difficult to achieve consistent management over large areas. Additionally, due to the need for reinstallation of sensors each season, soil moisture sensors are often used for research purposes rather than practical field agriculture.
ET-based agricultural water management estimates ET using meteorological data and the physiological characteristics of crops to manage water resources [30,31]. A representative method is using the P-M equation to estimate the grass reference evapotranspiration (ETo). The environmental data required for estimating ETo include solar radiation, soil heat flux density, temperature, wind speed, and both saturated and actual vapor pressure [32,33,34]. By calculating ETo from these environmental data and multiplying by the crop coefficient (Kc) for each growth stage, the crop evapotranspiration (ETc) can be estimated, and the required amount of water can be supplied [35,36,37]. The ET-based water management method is not limited to specific areas and allows for broader water management using meteorological data. However, the collected meteorological data may be inaccurate, or the calculated ET may differ from actual values due to changing environmental conditions. Additionally, the greater the distance between the meteorological sensors and the actual field, the more the calculated ET values may vary.
A broad water management approach is needed to conserve agricultural water in field agriculture. Therefore, water management based on the ET is deemed more efficient than water management based on soil moisture. To overcome the limitations of water management based on ET, machine learning was used to reduce the differences between the meteorological administration data and actual field data. Additionally, to minimize the impact of real-time environmental changes on the calculated ET values, an irrigation strategy is proposed that calculates and accumulates the hourly ETo, resulting in a cumulative ET irrigation approach. The irrigation method based on cumulative evapotranspiration can reduce errors caused by real-time environmental changes more effectively than the irrigation method based on the daily evapotranspiration, enabling timely and accurate water estimation for irrigation. Based on the field sensor, meteorological administration sensor, and virtual sensor utilizing machine learning, environmental data would be used to calculate the hourly ETo and determine the required water volume in this study. Therefore, the purpose of this study is to calculate the cumulative ETo, using weather data based on field sensor values, Korea Meteorological Administration data values, and virtual sensor values from ML, and to cultivate cabbage with irrigation strategies according to 40, 60, 80, and 100% ETc under each condition to find the optimal irrigation algorithm.

2. Materials and Methods

2.1. Plant Materials and Experimental Site

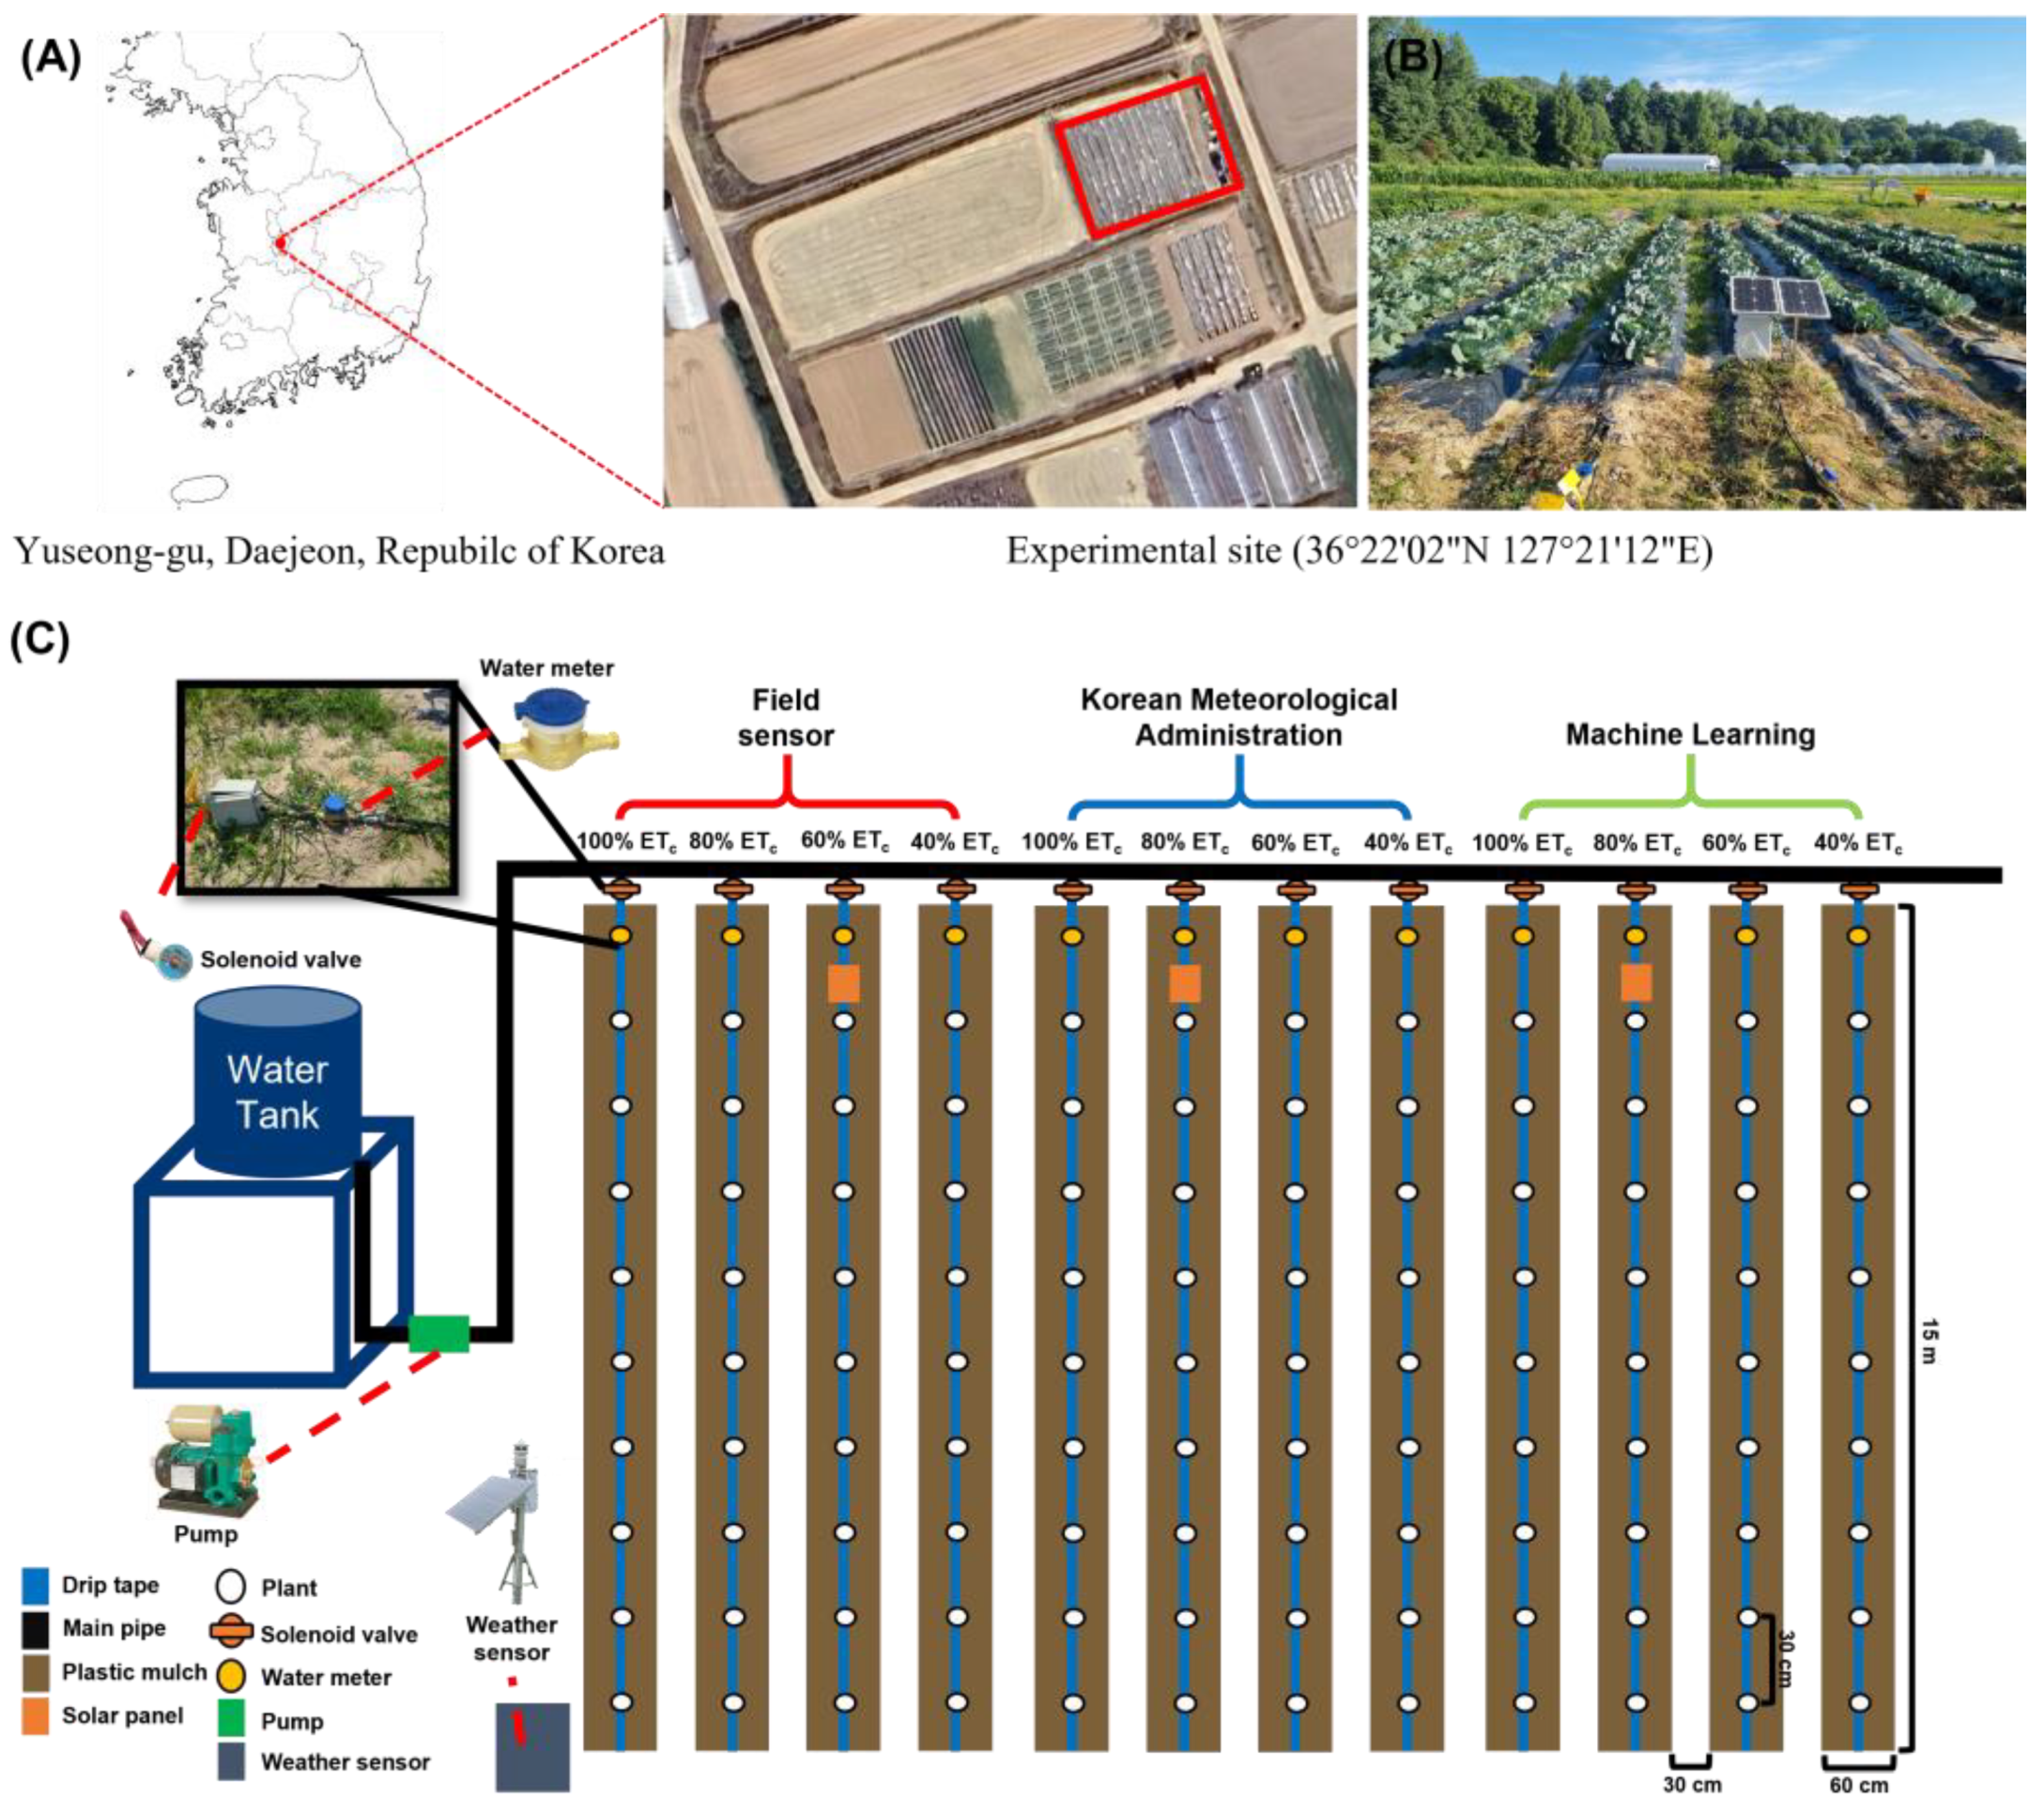
This experiment was conducted in a site (36°22′02″ N 127°21′12″ E, elevation = 47 m) located at Chungnam National University (99 Daehak-ro, Yuseong-gu, Daejeon 34134, Republic of Korea). According to the Korea Meteorological Administration (https://data.kma.go.kr/, accessed on 22 January 2025), the average temperature in the experimental region from April to June was 18.9 °C, with a minimum temperature of 13.4 °C and a maximum temperature of 24.9 °C. The total precipitation during this period was 268.21 mm. These meteorological parameters reflect the standard conditions of an average year. The plant material used was cabbage (Brassica oleracea ‘Daebakna’, Asia Seed Korea Co., Ltd., Seoul, Republic of Korea). On 11 March 2024, seeds were sown in rock wool substrate (2.5 × 2.5 × 4 cm, Grodan, Roermond, The Netherlands) in a 128-cell seedling tray at a plant factory. After 2 days of dark treatment, the seedlings were grown under conditions of light intensity 150 ± 10 μmol m−2 s−1, photoperiod 16/8 h (light/dark), temperature 25 ± 2 °C, and relative humidity 70–75%. After the true leaves had developed, the plants were supplied with Yamazaki nutrient solution composed of N 8 me L−1, P 1.5 me L−1, K 4.5 me L−1, Ca 2 me L−1, Mg 1 me L−1, and S 3 me L−1, with a pH of 6.5 ± 0.3 and an EC of 0.8 dS m−1.
On 18 April, four weeks after sowing, the cabbages were transplanted to a field. The field was mulched with black plastic, and the cabbages were planted at a spacing of 30 cm. Before transplanting, considering the characteristics of the field soil, a basal application of 6.1 kg ha−1 of 21N-17P-17K compound fertilizer, 3.4 kg ha−1 of phosphate, and 0.8 kg ha−1 of potassium was applied (Table 1). After transplanting, the cabbages were cultivated for a total of 72 days until they were harvested on 28 June. Until 12 May, the cabbages were irrigated with equal amounts of water using drip pipes (UniRamTM AS, 13.7 mm diameter, 0.3 m emitter spacing, 1 L h−1 at 0.5–4 kPa, Netafim Korea Co., Ltd., Seongnam, Gyeonggi-do, Republic of Korea). From 13 May to 27 June, an automatic irrigation system was applied, and water was supplied based on the cumulative evapotranspiration measured for the duration of 46 days.

2.2. Calculation of the Hourly Reference Evapotranspiration

The hourly reference evapotranspiration was calculated based on the P-M ETo as shown in Equation (1):
E T o = 0.408 Δ R n G + γ 37 T h r + 273 u 2 e 0 T h r e a Δ + γ 1 + 0.34 u 2 ,
where ETo is the grass reference evapotranspiration [mm hour−1], Rn is net radiation at the grass surface [MJ m−2 h−1], G is soil heat flux density [MJ m−2 h−1], Thr is mean hourly air temperature [°C], Δ is saturation slope vapor pressure curve at Thr [kPa °C−1], γ is psychrometric constant [kPa °C−1], e0 (Thr) is saturation vapor pressure at air temperature Thr [kPa], ea is average hourly actual vapor pressure [kPa], and u2 is average hourly wind speed [m s−1].
Wind speed, solar radiation, relative humidity, and temperature were collected using the field sensor (FS), the Korea Meteorological Administration (KMA), and the virtual sensor based on machine learning (ML) to estimate evapotranspiration. In the FS treatments, meteorological factors were measured every three minutes using weather sensors installed at the Chungnam National University field. The hourly grass reference evapotranspiration (ETo) was then calculated by averaging the meteorological data collected over each hour. In the KMA treatments, the hourly reference evapotranspiration was calculated using meteorological data measured every hour by the KMA, located 1091 m from the experimental field. In the ML treatments, an XGBoost (Extreme Gradient Boosting) model was trained using sensor data and the KMA data from January 2023 to April 2024 (Figure 1). The trained machine learning model estimated the meteorological data for the experimental site when input with data from the KMA. The performance of the virtual sensor based on the XGBoost model is shown (Table 2). The meteorological data for the experimental site were output hourly, and the ETo was calculated based on this data.

2.3. Experimental Design Using Automatic Irrigation System

An automatic irrigation system was developed and used to supply water based on the ETo. Each treatment calculated the ETo based on meteorological data determined by the FS, the KMA, and the ML. The ETo was accumulated each hour, and, when the cumulative ETo reached 1 mm hour−1, water was supplied using solenoid valves (HPW2110A (10A), Autosigma Hyosin Co., Ltd., Bucheon-si, Republic of Korea) and pumps (PW-200SMA, 19 L·min−1, Wilo Pumps Co., Ltd., Busan, Republic of Korea). The irrigation amounts were 40, 60, 80, and 100% of the crop evapotranspiration (ETc), supplied via drip pipes (Table 3). According to data from Nongsaro (http://www.nongsaro.go.kr), managed by the Rural Development Administration of Korea, the crop coefficients during the mid-growth (17 days) and late-growth (29 days) stages are set to 1.11 and 1.13, respectively. The ETc was calculated as shown in Equation (2):
E T c = 0.8 × K c × E T o ,
where ETc is the crop evapotranspiration [mm hour−1], Kc is the crop coefficient, ETo is the grass reference evapotranspiration [mm hour−1], and 0.8 is the mulching coefficient.
From 13 May to 27 June, water management was conducted using an automatic irrigation system. When the cumulative ETo reached 1 mm, the FS, the KMA, and the ML treatments were each supplied with water at 20, 30, and 40 min past the hour, respectively.

2.4. Measurements of Plant Growth Parameters

On 28 June, five cabbages from each treatment were harvested, and plant growth was measured. Each treatment consisted of a single plot with 40 plants, from which five plants were randomly analyzed from each plot (n = 5). The parameters measured included the number of leaves, leaf area, head diameter, shoot fresh weight, head fresh weight, root fresh weight, shoot dry weight, head dry weight, and root dry weight. The dry weight was determined by placing the samples in sample analysis bags and drying them in an oven (HB-501M, Hanbaek Scientific Technology Co., Ltd., Bucheon-si, Republic of Korea) set at 70 °C for 4 days. Additionally, a small portion of the samples collected for component analysis was dried in a freeze-dryer (TFD5503, Ilshin BioBase Co., Ltd., Dongducheon-si, Republic of Korea) for 4 days. The weights were measured using an electronic balance (SPX2202KR, Ohaus Co., Ltd., Parsippany, NJ, USA) and summed to obtain the final dry weight. The leaf area was measured using a leaf area meter (LI-3100, LI-COR Co., Ltd., Lincoln, NE, USA).

2.5. Water Usage and Irrigation Water Productivity

To evaluate water usage after applying the automatic irrigation system, a water meter ([MW] 15 mm, Dae Han Meter Tech Co., Ltd., Gimpo-si, Republic of Korea) was installed (Figure 2). Water usage was measured from 13 May to 27 June. The water usage per plant for each treatment was determined, and the water use per irrigation was calculated using Equations (3) and (4). Additionally, irrigation water productivity (WPI) was measured using Equation (4), with reference to [38].
W a t e r   u s e   p e r   i r r i g a t i o n   m L = T o t a l   i r r i g a t i o n   w a t e r   u s e   L T o t a l   n u m b e r   o f   i r r i g a t i o n s ,
I r r i g a t i o n   w a t e r   p r o d u c t i v i t y   W P I = M a r k e t a b l e   h e a d   w e i g h t   k g I r r i g a t i o n   w a t e r   u s e   m 3 ,

2.6. Statistical Analysis

The statistical analysis was conducted with one-way ANOVA using the SPSS program (version 26, SPSS Inc., Chicago, IL, USA). To determine significant differences between means of irrigation levels, Tukey’s honestly significant difference test was applied at a significance level of p ≤ 0.05. Graphs were generated in Sigmaplot (version 15.0, Systat Software Inc., Chicago, IL, USA). A hierarchical clustering heatmap was created based on normalized average data from various parameters. Principal component analysis (PCA) followed the modified method by [39] and was performed using XLSTAT software(version 26.4.1, Addinsoft, Paris, France).

3. Results

3.1. Cumulative Evapotranspiration and the Number of Irrigations

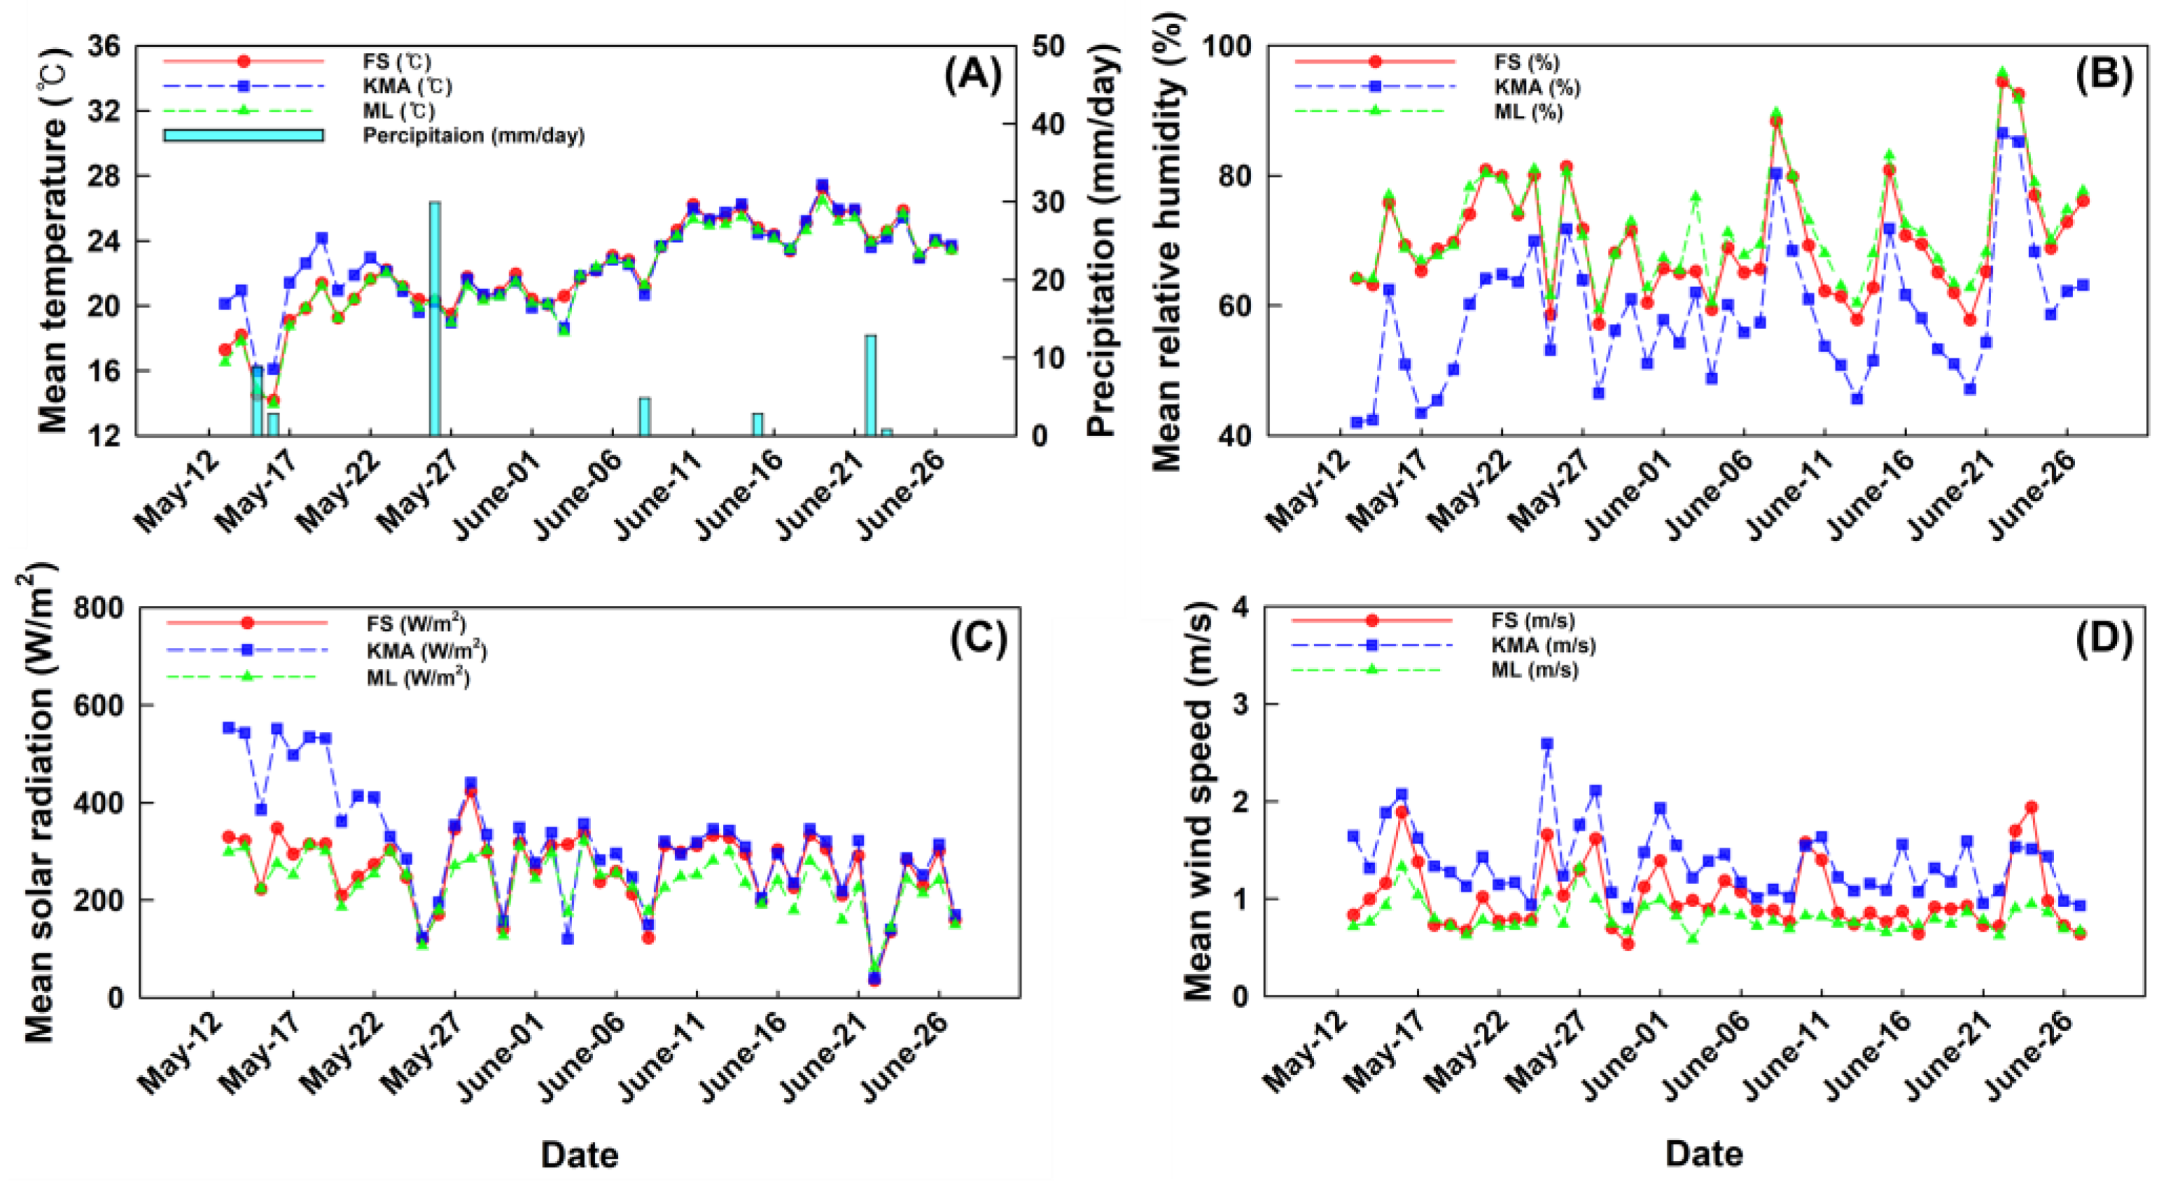
From 13 May to 27 June, the mean temperature, the mean relative humidity, the mean solar radiation, and the mean wind speed were measured over a 46-day period using the FS, the KMA, and the ML (Figure 3). The mean temperature measured by the FS, the KMA, and ML ranged from 13.9 to 27.3 °C, 13.5 to 27.5 °C, and 13.9 to 26.5 °C, respectively. Using the KMA, the total precipitation over the 46-day period was measured at 64 mm (Figure 3A). The mean relative humidity measured by the FS, the KMA, and ML ranged from 57.34 to 94.53%, 42.27 to 86.65%, and 59.61 to 95.88%, respectively (Figure 3B). The mean solar radiation measured by the FS, the KMA, and ML ranged from 38.32 to 424.78 W/m2, 43.00 to 554.81 W/m2, and 65.30 to 323.78 W/m2, respectively (Figure 3C). The mean wind speed measured by the FS, the KMA, and ML ranged from 0.55 to 1.95 m s−1, 0.92 to 2.60 m s−1, and 0.60 to 1.34 m s−1, respectively (Figure 3D).
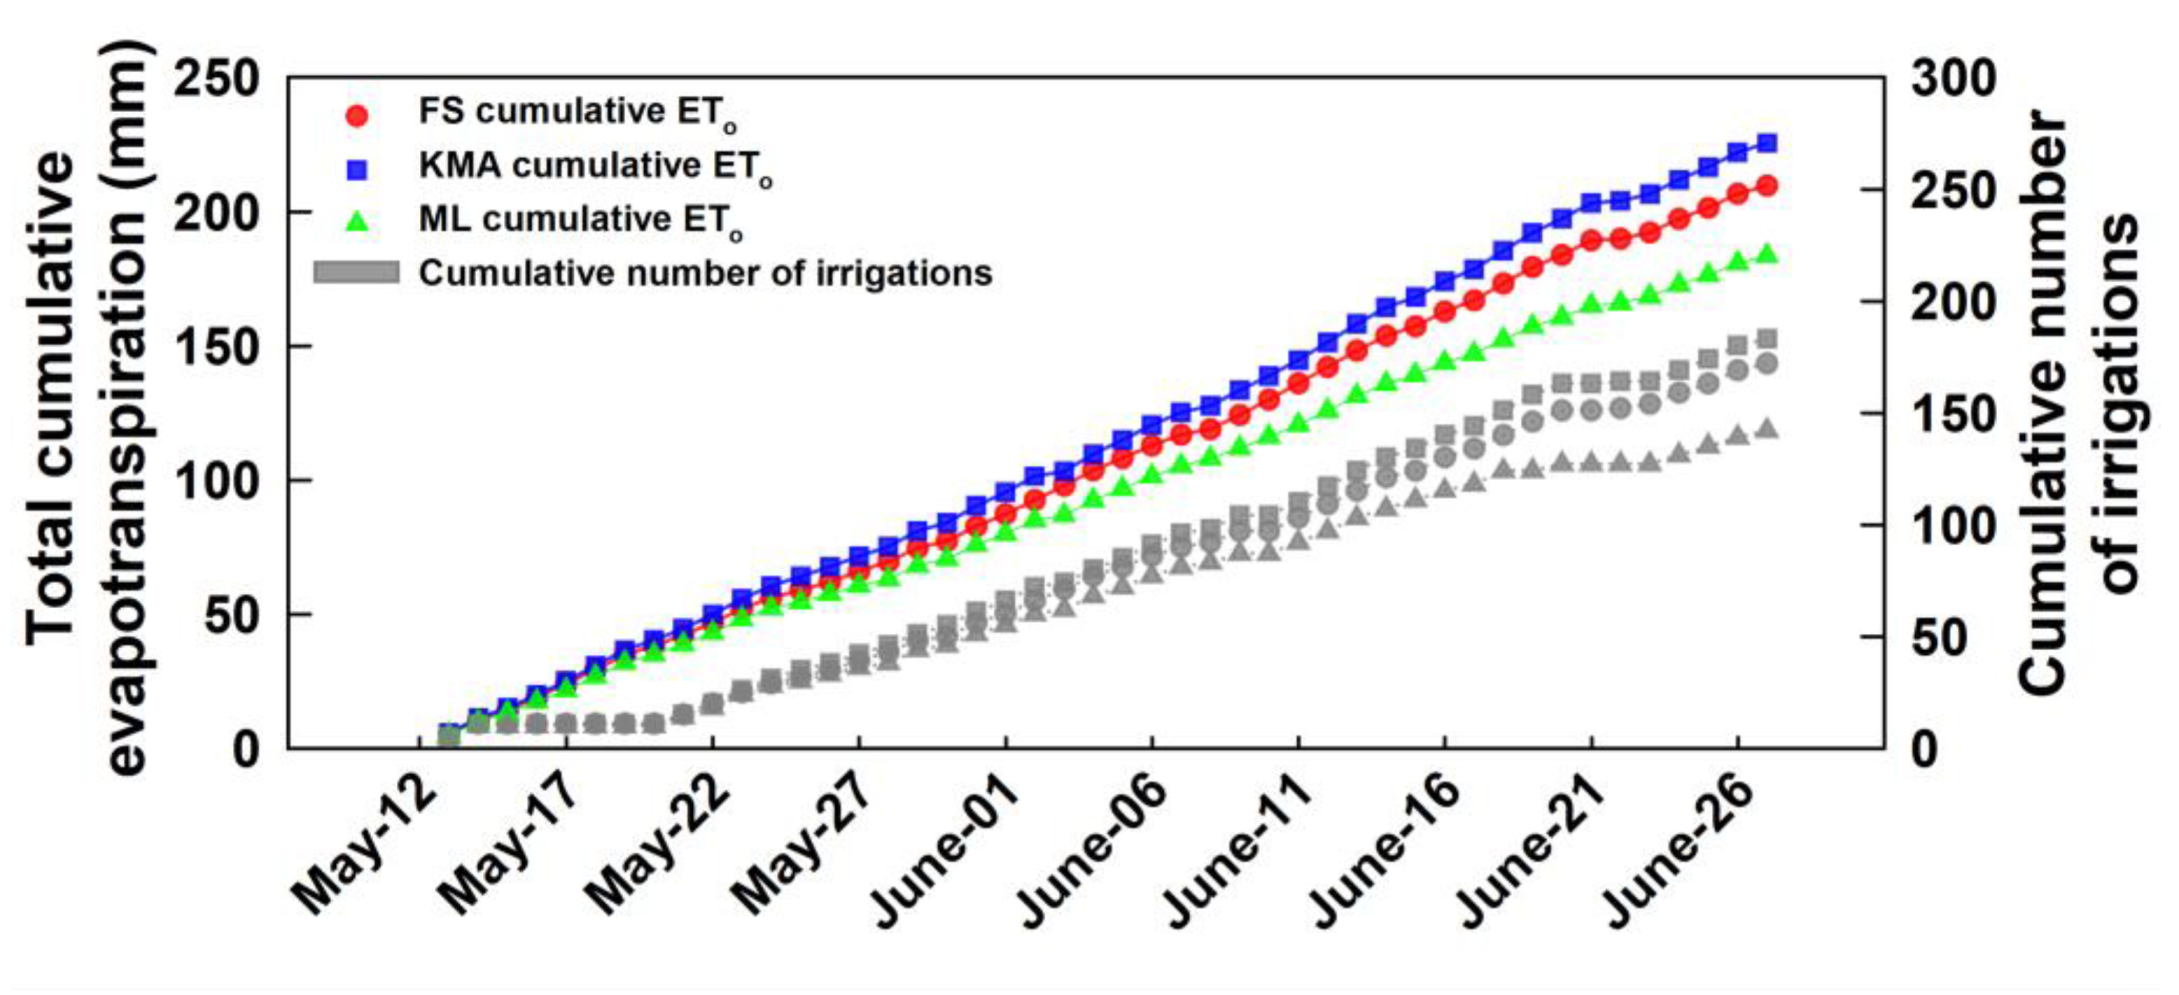
The cumulative evapotranspiration was measured at 5.51, 4.03, and 3.62 mm/day from 24 May to 26 May and at 6.06, 4.68, and 7.44 mm/day from 16 June to 18 June, respectively (Figure 4). The peaks in soil moisture content indicate the operation of the automatic irrigation system and confirm that irrigation was conducted appropriately based on cumulative evapotranspiration (Figure 4). During the experiment period, the hourly evapotranspiration was calculated using meteorological data collected from the FS, the KMA, and the ML. Over the 46-day period from 13 May to 27 June, the total cumulative evapotranspiration was measured at 209.50, 225.41, and 183.42 mm for the FS, the KMA, and the ML, respectively (Figure 5). The solenoid valve of the automatic irrigation system operated 172, 183, and 141 times in the FS, the KMA, and the ML treatments, with operation rates measured at 82.3%, 81.3%, and 77.0%, respectively (Figure 5).

3.2. Growth Parameters of Cabbage

The cabbage was cultivated using an automatic irrigation system for 46 days, from 13 May to 27 June, and the growth parameters such as NL (leaf number), LA (leaf area), SPAD, Fv/Fm, SFW (shoot fresh weight), SDW (shoot dry weight), RFW (root fresh weight), and RDW (root dry weight) were investigated (Table 4). The image presents cabbages harvested on 28 June (Figure 6). In the FS treatment, there were no significant differences in LA, SPAD, Fv/Fm, and RFW between irrigation levels based on ETc. The LA measured 7303, 11,808, 8501, and 8647 cm2 for the 40, 60, 80, and 100% ETc levels, respectively, showing reductions of 38.2, 28, and 26.8% for the 40, 80, and 100% ETc levels compared to the 60% ETc level. The SFW was 2393 and 3935 g for the 40 and 60% ETc levels, respectively, which shows a 64.4% increase in the 60% ETc treatment compared to the 40% ETc level. The SDW measured 250.7, 356.4, 246.8, and 243.7 g for the 40, 60, 80, and 100% ETc levels, respectively, showing reductions of 29.6, 30.7, and 31.6 in the 40, 80, and 100% ETc levels compared to the 60% ETc level. The RDW measured 34.6 and 20.6 g for the 60 and 100% ETc levels, respectively, showing a 67.5% increase in the 60% ETc level compared to the 100% ETc level.
In the KMA treatment, there were no significant differences in SPAD, Fv/Fm, and RFW between irrigation levels based on ETc (Table 4). The NL was measured as 19.0 and 23.8 for the 60 and 80% ETc levels, respectively, showing a 25.3% increase in the 80% ETc level compared to the 60% ETc level. The LA was 13,368 and 7843 cm2 for the 60 and 100% ETc levels, respectively, showing a 70.4% increase in the 60% ETc level compared to the 100% ETc level. The SFW was 4041, 2588, and 2535 g for the 60, 80, and 100% ETc levels, respectively, showing decreases of 36.0 and 37.3% in the 80 and 100% ETc levels compared to the 60% ETc level. The SDW was 345.3, 204.3, and 214.0 g for the 60, 80, and 100% ETc levels, respectively, representing decreases of 40.8 and 38.0% in the 80 and 100% ETc levels compared to the 60% ETc level. The RDW was 34.2, 34.3, and 16.6 g for the 40, 60, and 80% ETc levels, respectively, indicating increases of 106.4 and 106.9% in the 40 and 60% ETc levels compared to the 80% ETc level.
In the ML treatment, there were no significant differences in SPAD and Fv/Fm between irrigation levels based on ETc (Table 4). The NL was 25.6, 17.8, 19.4, and 18.8 for the 40, 60, 80, and 100% ETc levels, respectively, showing reductions of 30.5, 24.2, and 26.6% for the 60, 80, and 100% ETc levels compared to the 40% ETc level. The LA measured 5916, 9107, 8533, and 7701 cm2 for the 40, 60, 80, and 100% ETc levels, respectively, representing increases of 53.9, 44.2, and 30.2% for the 60, 80, and 100% ETc levels compared to the 40% ETc level. The SFW was 1541, 2998, 3207, and 2717 g for the 40, 60, 80, and 100% ETc levels, respectively, indicating increases of 94.5, 108.1, and 76.3% for the 60, 80, and 100% ETc levels compared to the 40% ETc level. The RFW measured 85.1, 120.4, and 118.9 g for the 40, 60, and 100% ETc levels, respectively, showing increases of 41.5 and 39.8% in the 60 and 100% ETc levels compared to the 40% ETc level. The SDW was 150.0, 298.8, 279.8, and 277.1 g for the 40, 60, 80, and 100% ETc levels, respectively, indicating increases of 99.2, 86.5, and 84.7% for the 60, 80, and 100% ETc levels compared to the 40% ETc level. The RDW measured 17.2, 32.0, 25.0, and 28.5 g for the 40, 60, 80, and 100% ETc levels, respectively, representing increases of 85.8, 45.0, and 65.7% for the 60, 80, and 100% ETc levels compared to the 40% ETc level.

3.3. Cabbage Head Parameters

The diameter, HFW (head fresh weight), HDW (head dry weight), and yield of the cabbages were examined across five replicates (Table 5). In the FS treatment, the diameter was 15.08 and 17.66 cm for the 40 and 60% ETc levels, respectively, representing an 11.8% increase in the 60% ETc level compared to the 40% ETc level. The HFW was 1195 and 1956 g for the 40 and 60% ETc levels, respectively, indicating increases of 63.7% for the 60% ETc levels compared to the 40% ETc level. There were no significant differences in the HDW between irrigation levels based on ETc.
In the KMA treatment, the diameter was 16.08 and 19.81 cm for the 40 and 60% ETc levels, respectively, representing a 23.2% increase in the 60% ETc level compared to the 40% ETc level (Table 5). There were no significant differences in the HFW and yield between irrigation levels based on ETc. The HDW was 133.5, 66.5, and 80.1 g for the 60, 80, and 100% ETc levels, respectively, showing decreases of 50.1 and 40.0% in the 80 and 100% ETc levels compared to the 60% ETc levels.
In the ML treatment, the diameter was 13.19, 18.34, 19.59, and 18.93 cm for the 40, 60, 80, and 100% ETc levels, respectively, showing an increase of 39.0, 48.5, and 43.5% for the 60, 80, and 100% ETc levels compared to the 40% ETc level (Table 5). The HFW was 605, 1564, 1809, and 1517 g for the 40, 60, 80, and 100% ETc levels, respectively. This represents increases of 158.5, 199.0, and 150.7% in the 60, 80, and 100% ETc levels compared to the 40% ETc level. The HDW measured 41.1, 123.6, 125.9, and 111.4 g for the 40, 60, 80, and 100% ETc levels, respectively, showing increases of 200.7, 206.5, and 171.2% for the 60, 80, and 100% ETc levels compared to the 40% ETc level.

3.4. Water Usage During the Experimental Period

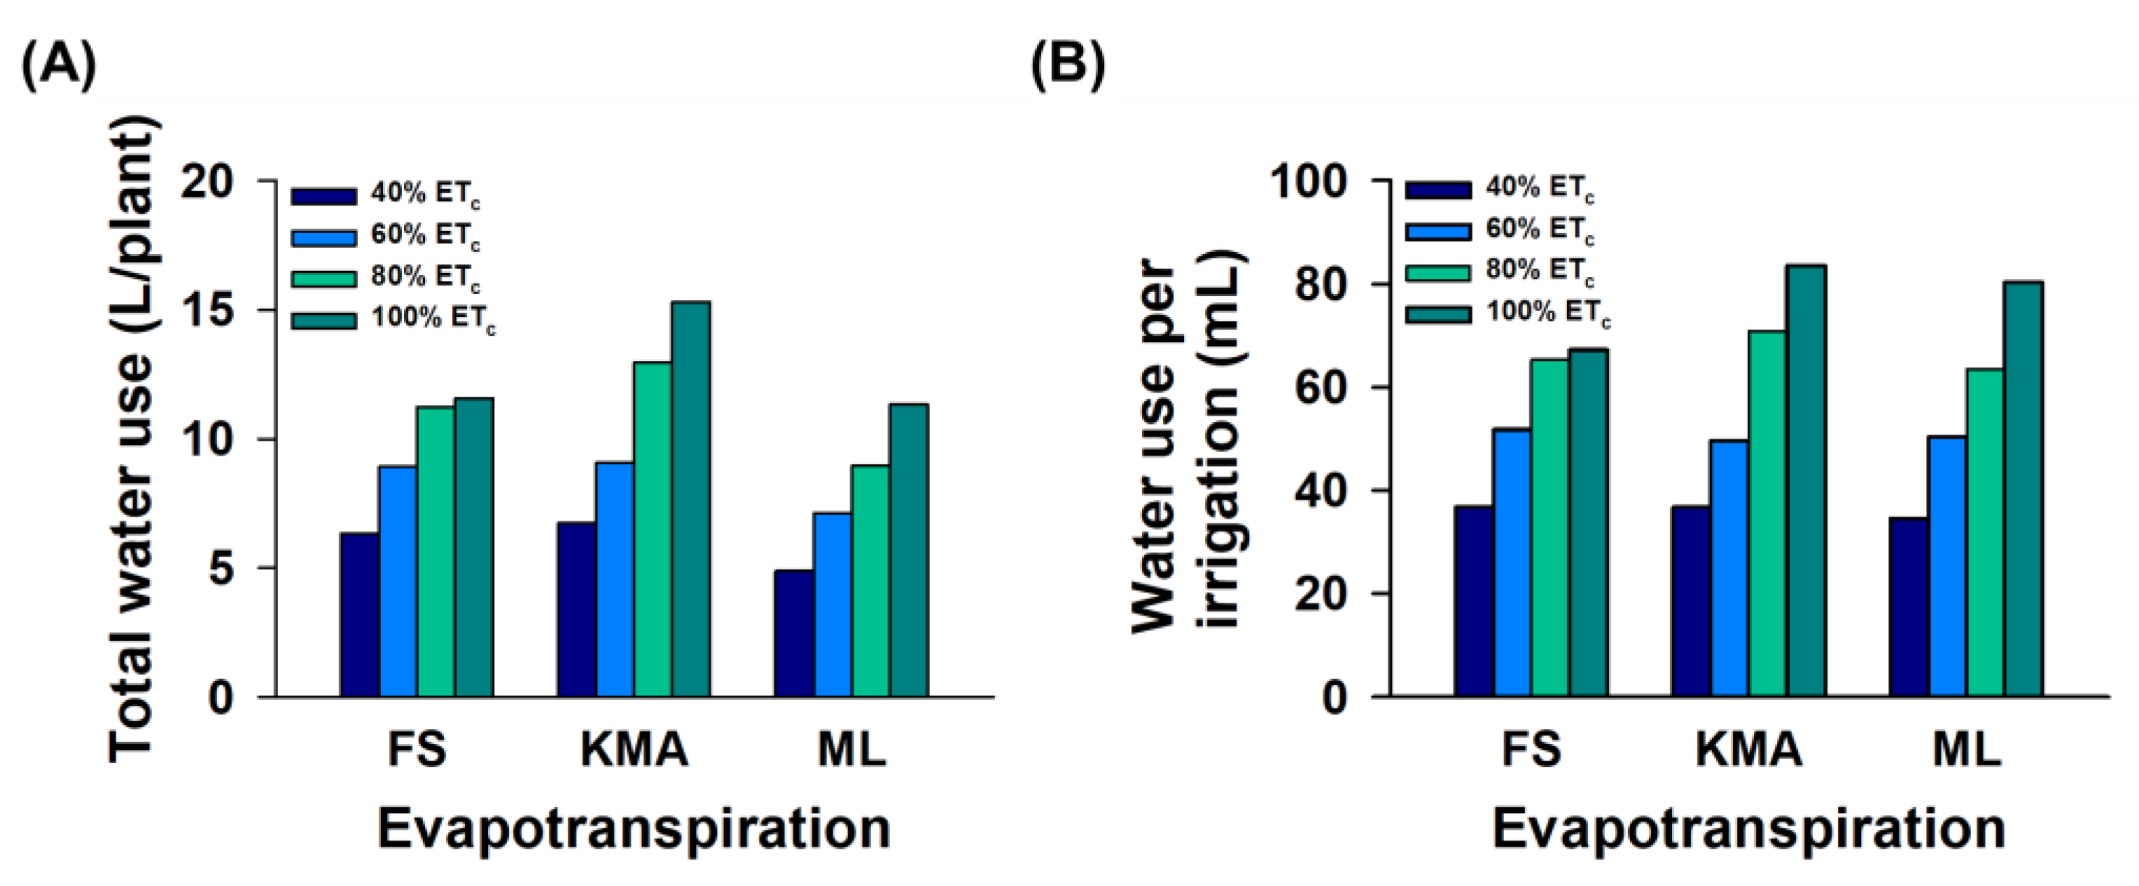
The water usage by the automatic irrigation system was measured over a 46-day period from 13 May to 27 June. In the FS treatment, total water usage per plant for the 40, 60, 80, and 100% ETc levels was 6.30, 8.90, 11.22, and 11.55 L, respectively (Figure 7A). The water usage per irrigation for the 40, 60, 80, and 100% ETc levels was 36.65, 51.73, 65.24, and 67.13 mL, respectively (Figure 7B). In the KMA treatment, total water usage per plant for the 40, 60, 80, and 100% ETc levels was 6.71, 9.07, 12.95, and 15.28 L, respectively (Figure 7A). The water usage per irrigation for the 40, 60, 80, and 100% ETc levels was 36.66, 49.54, 70.74 and 83.48 mL, respectively (Figure 7B). In the ML treatment, total water usage per plant for the 40, 60, 80, and 100% ETc levels was 4.86, 7.09, 8.93, and 11.31 L, respectively (Figure 7A). The water usage per irrigation for the 40, 60, 80, and 100% ETc levels was 34.47, 50.29, 63.34 and 80.21 mL, respectively (Figure 7B).

3.5. Irrigation Water Productivity of Cabbage and Yields

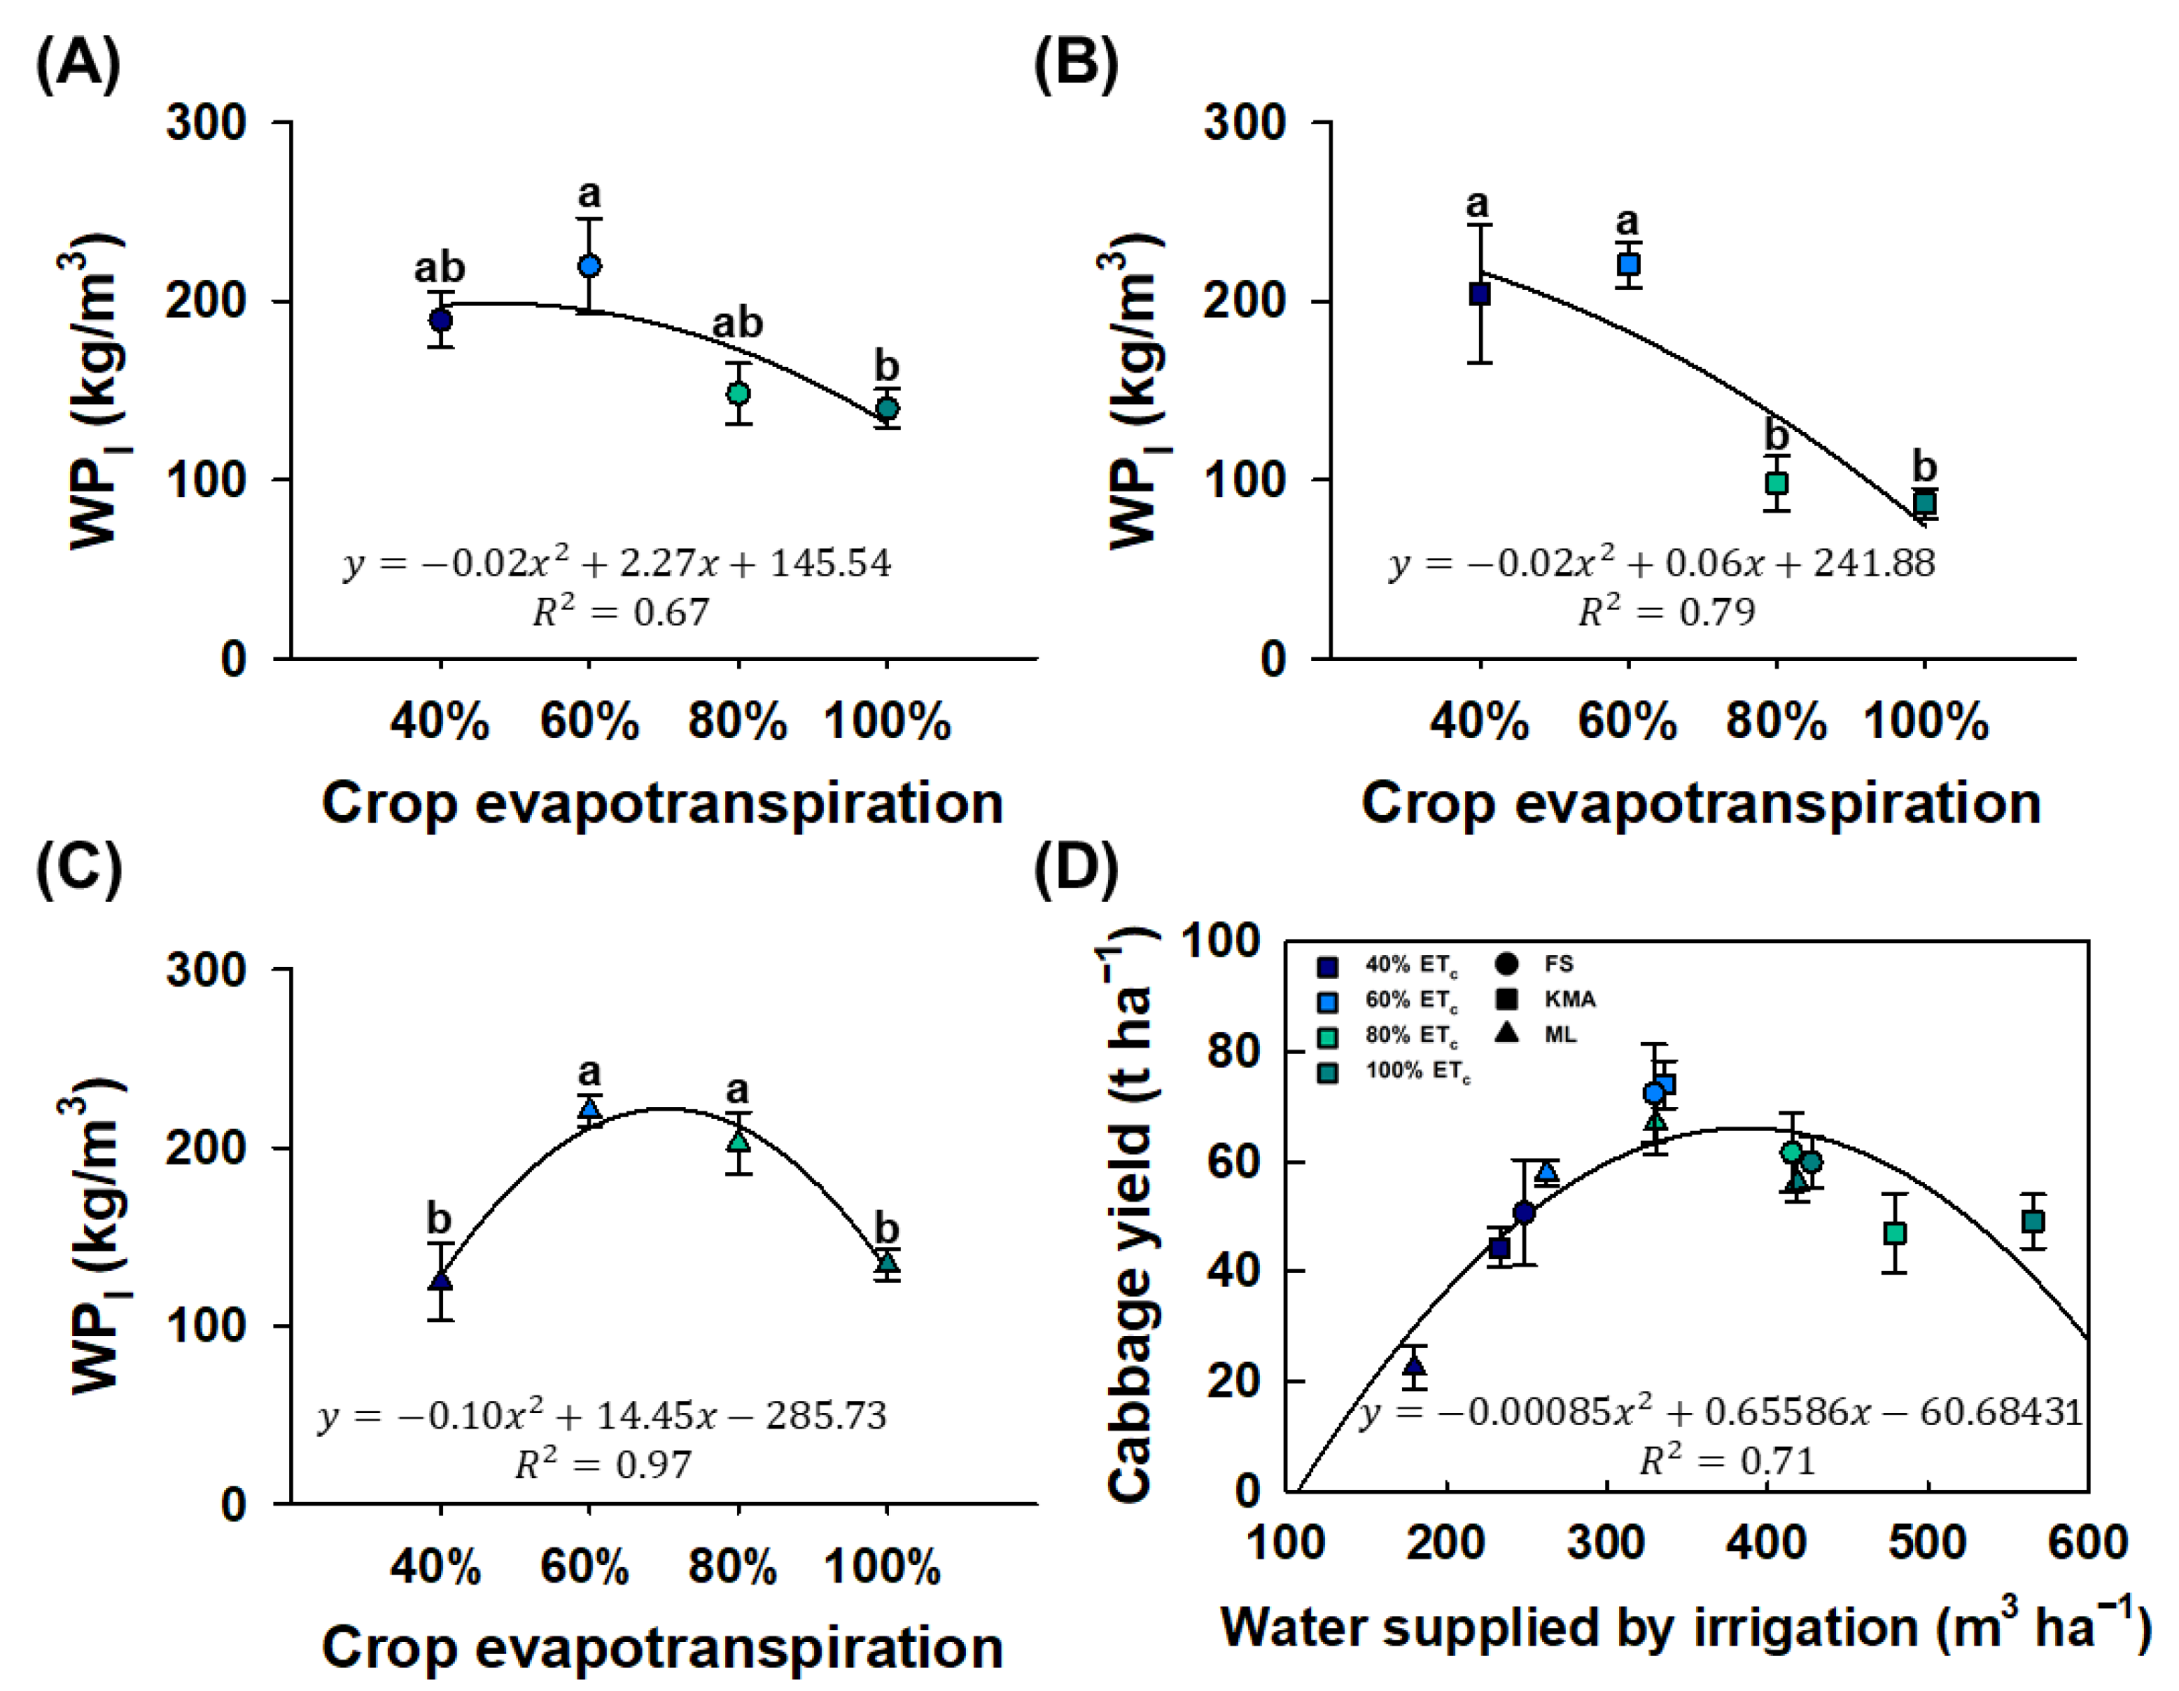
The irrigation water productivity (WPI) of cabbage was analyzed over a 46-day period from 13 May to 27 June (Figure 8). In the FS treatment, the WPI for the 40, 60, 80, and 100% ETc levels were measured at 189.58, 219.83, 148.38, and 140.14 kg m−3, respectively. Compared to the 100% ETc level, the 60% ETc level increased by 56.9%. The coefficient of determination for the FS treatment was 0.67 (Figure 8A). In the KMA treatment, the WPI for the 40, 60, 80, and 100% ETc levels were measured at 204.05, 220.49, 98.10, and 86.73 kg m−3, respectively. Compared to the 60% ETc level, the WPI decreased by 55.5 and 60.7% in the 80 and 100% ETc levels, respectively. The coefficient of determination for the KMA treatment was 0.79 (Figure 8B). In the ML treatment, the WPI for the 40, 60, 80, and 100% ETc levels were measured at 124.48, 220.56, 202.54, and 134.14 kg m−3, respectively. Compared to the 60% ETc level, the WPI decreased by 43.6 and 39.2% in the 40 and 100% ETc levels, respectively. The coefficient of determination for the ML treatment was 0.97 (Figure 8C).
Water supplied by irrigation and cabbage yields were compared in all treatments (Figure 8D and Table 5). In the FS treatment, when irrigation was supplied at 223.10, 329.30, 415.14, and 427.35 m3, the yields were 44.22, 72.37, 61.60, and 59.87 t ha−1 (converted to fresh weight per hectare units), respectively. In the KMA treatment, irrigation amounts of 248.72, 335.59, 479.15, and 565.36 m3 resulted in yields of 50.66, 73.96, 46.99, and 49.03 t ha−1, respectively. In the ML treatment, irrigation at 179.82, 262.33, 330.41, and 418.74 m3 led to yields of 22.39, 57.87, 66.94, and 56.13 t ha−1, respectively. The results of the regression analysis showed a coefficient of determination of 0.71. The maximum expected yield, using an automatic irrigation system, was 65.83 t ha−1 with 385.8 m3 of water, corresponding to 10.43 L/plant and a head weight of 1.78 kg.

3.6. Hierarchical Clustering Heatmap and Principal Component Analysis

A heatmap was generated using color gradients to visualize the performance of different parameters across each treatment. Normalized average data of different variables were used for the heatmap (n = 5). The parameters were clustered into two groups using hierarchical clustering (Figure 9A). The ‘Cluster A’ included SFW, SDW, HFW, diameter, LA, RFW, RDW, HDW, SPAD, and WPI. The ‘Cluster B’ consisted of NL and Fv/Fm. All raw data were analyzed using PCA. The results of the PCA showed that PC1 accounted for 61.05% of the total variance and PC2 accounted for 9.26%, with the two components explaining 70.31% of the total variance (Figure 9B). PC1 was determined by growth parameters such as SFW, SDW, HFW, diameter, LA, RFW, RDW, HDW, WPI, and NL, while PC2 was determined by SPAD and Fv/Fm. The parameters in ‘Cluster A’ had a positive correlation with each other.

4. Discussion

The automatic irrigation system operated based on cumulative evapotranspiration, and the cumulative evapotranspiration was measured as highest for the KMA, followed by the FS, and then the ML treatments. Accordingly, water usage for each irrigation level followed the same results: the KMA, the FS, and the ML treatments (Figure 7A). In the FS treatment, the water usage of the 100% ETc level was similar to that of the 80% ETc level due to a malfunction in the solenoid valve operation time (Figure 7). Consequently, the FS treatment had the lowest coefficient of determination for WPI among all treatments (Figure 8). In contrast, the ML treatment exhibited accurate water use per plant and the highest coefficient of determination for WPI across all treatments (Figure 7B and Figure 8). Therefore, it is concluded that the ML treatment provided the most accurate irrigation management when the automatic irrigation system was in operation.
In our study, the FS and the KMA 60% ETc levels exhibited higher WPI, along with increased RDW, SFW, SDW, HFW, and HDW (Figure 8 and Table 4). In 2016, the cabbage yield for 0.4, 0.6, 0.8, 1.0, and 1.2 ETc levels were 27.90, 34.68, 42.64, 43.88, and 38.81 t ha−1, respectively. As the irrigation amount increased, cabbage yield also increased; however, the yield decreased at the 1.2 ETc level, and WPI sharply declined from the 0.8 ETc level [40]. Similarly, in a three-year study conducted between 2009 and 2012, the average cabbage yield for 0.8, 0.9, 1.0, and 1.1 ETc levels was 23.2, 29.7, 31.7, and 26.4 t ha−1, respectively. While the yield increased with irrigation up to the 1.0 ETc level, they declined in the 1.1 ETc level [19]. Notably, the highest water use efficiency was observed in the 0.9 ETc level, and water use efficiency declined as irrigation levels increased thereafter. A similar finding was reported by [41], where the average cabbage head weight in 1997 was 1.1, 1.8, 2.3, 2.6, and 2.7 kg in the 20, 40, 60, 80, and 100% pan evaporation levels, respectively, with the 60% pan evaporation level showing the highest water use efficiency. These results suggest that irrigation levels have a significant effect on cabbage growth and yield, and it is important to determine the optimal water use efficiency.
Plant roots absorb various mineral ions from the soil through both the apoplast and symplast pathways [42,43]. Both pathways are involved in the transport of water and mineral ions, and sufficient water supply to the rhizosphere is essential for the absorption of mineral ions by the roots [44,45]. The absorbed ions are transported to the shoot via the xylem, where they are utilized for cell differentiation, elongation, and turgor [46,47,48]. Therefore, root growth is closely related to shoot growth, and many plant studies have confirmed the strong correlation between root and shoot growth [49,50,51]. Hierarchical clustering and PCA analysis showed that WPI, root parameters, and shoot parameters clustered together, indicating a positive correlation between root and shoot parameters (Figure 9). Consequently, the 60% ETc level could positively influence WPI and RDW, which in turn could also have a positive effect on shoot growth parameters belonging to the same cluster.
On the other hand, in the KMA treatment, SFW and HDW decreased in the 80 and 100% ETc levels compared to the 60% ETc level (Table 4 and Table 5). Overly wet conditions in the rhizosphere can reduce root respiration and inhibit root growth [52,53]. Reduced root growth can lead to decreased shoot growth and yield, as there is a positive correlation between root and shoot growth (Figure 9). The 80 and 100% ETc levels not only resulted in unnecessary water usage but also had a negative impact on shoot growth (Figure 8 and Table 4). Therefore, the automatic irrigation system based on hourly cumulative evapotranspiration, supplying 12.95 and 15.28 L over 46 days, could potentially reduce cabbage yield.
In the ML treatments, cabbage under the 40% ETc level showed a decrease in LA, head diameter, HFW, HDW, SFW, SDW, RDW, and yield compared to the 60, 80, and 100% ETc levels, although LA was higher (Table 4 and Table 5). Similarly, in the FS treatment, SFW, head diameter, HFW, and yield were reduced at the 40% ETc level. In 2012, 50% ETc treatment after 133 days of transplanting resulted in an 8.4, 25.3, and 17.8% reduction in head width, fresh weight, and yield, respectively, compared to the 100% ETc treatment [54]. In 2020, the 0.6 ETo level showed a 3.6, 13.9, and 9.1% reduction in head diameter, fresh weight, and yield, respectively, compared to the 1.0 ETo level [55]. These findings suggest that lower irrigation levels based on ETc can negatively impact cabbage growth and yields.
Water moves from the soil to the roots, from roots to stems and leaves, and eventually evaporates into the air through transpiration [56,57]. Water moves from areas of higher to lower water potential [58]. Lower irrigation amounts can reduce soil water potential more than larger amounts of irrigation [59,60]. As a result, when soil and root water potential differences decrease, it becomes more difficult for water to move from the soil to the plant roots. Since soil mineral ions are absorbed with water by plant roots, lower irrigation amounts can make it difficult for plants to absorb the materials necessary for growth. Therefore, low irrigation amounts can lead to reduced plant growth. Using the automatic irrigation system based on hourly cumulative evapotranspiration, supplying less than 6.30 L of water over 46 days, can lower soil water potential compared to other treatments, making it difficult for roots to absorb water and thereby reducing cabbage head fresh weight and yields (Table 5).

5. Conclusions

The automatic irrigation system based on hourly cumulative evapotranspiration positively impacted cabbage growth by supplying water in a timely and appropriate amount. Hierarchical clustering and principal component analysis (PCA) showed that root growth parameters and shoot parameters were grouped together, indicating a positive correlation between them. An irrigation amount of 4.86 L/plant (ML 40% ETc) over 46 days reduced root growth, which in turn led to a decline in shoot growth. On the other hand, 12.95 L/plant (KMA 100% ETc) caused over-watering in the root zone, thereby reducing shoot growth and leading to unnecessary agricultural water usage. Irrigation levels based on evapotranspiration measured by the FS, the KMA, and the ML at 60, 60, and 80% ETc levels excluding natural rainfall, respectively, showed optimal results for cabbage growth and WPI. Water usage in the FS 60% ETc level was 8.90 L/plant, while, in the KMA 60% ETc level, it was 9.07 L/plant, and, in the ML 80% ETc level, it was 8.93 L/plant. Based on these findings, the optimal irrigation amount for cabbage cultivation is approximately 9.0 L/plant over 46 days, considering both yield and WPI. The automatic irrigation system based on hourly cumulative evapotranspiration can efficiently increase cabbage yields while reducing unnecessary agricultural water usage. These findings can be applied to other crops, highlighting the broader potential of this irrigation system for optimizing water use.

Author Contributions

Conceptualization, Y.L., and J.P.; methodology, Y.L. and S.-u.H.; software, S.-u.H.; validation, Y.L., S.-u.H., and X.W.; formal analysis, Y.L.; investigation, Y.L.; resources, S.-u.H.; data curation, S.-u.H.; writing—original draft preparation, Y.L.; writing—review and editing, S.H.; visualization, Y.L.; supervision, J.P.; project administration, J.P.; funding acquisition, K.L. All authors have read and agreed to the published version of the manuscript.

Funding

This work was supported by the Korea Institute of Planning and Evaluation for Technology in Food, Agriculture, Forestry (IPET) (Agricultural Foundation and Disaster Response Technology Development Program), funded by Ministry of Agriculture, Food and Rural Affairs (MAFRA) (RS-2022-IP322082).

Institutional Review Board Statement

Not applicable.

Data Availability Statement

The raw data supporting the conclusions of this article will be made available by the authors on request.

Acknowledgments

Technical assistance provided by HANKISUL (Daedeokgu, Daejeon, Republic of Korea) was greatly appreciated during the experimental setup.

Conflicts of Interest

The authors declare no conflicts of interest. The funders had no role in the design of this study; in the collection, analyses, or interpretation of data; in the writing of the manuscript; or in the decision to publish the results.

References

  1. Gleick, P.H. Water use. Annu. Rev. Environ. Resour. 2003, 28, 275–314. [Google Scholar] [CrossRef]
  2. Daigger, G.T. Evolving urban water and residuals management paradigms: Water reclamation and reuse, decentralization, and resource recovery. Water Environ. Res. 2009, 81, 809–823. [Google Scholar] [CrossRef] [PubMed]
  3. Demadis, K.D.; Mavredaki, E.; Stathoulopoulou, A.; Neofotistou, E.; Mantzaridis, C. Industrial water systems: Problems, challenges and solutions for the process industries. Desalination 2007, 213, 38–46. [Google Scholar] [CrossRef]
  4. Gössling, S.; Peeters, P.; Hall, C.M.; Ceron, J.-P.; Dubois, G.; Scott, D. Tourism and water use: Supply, demand, and security. An international review. Tour. Manag. 2012, 33, 1–15. [Google Scholar] [CrossRef]
  5. Issac, M.N.; Kandasubramanian, B. Effect of microplastics in water and aquatic systems. Environ. Sci. Pollut. Res. 2021, 28, 19544–19562. [Google Scholar] [CrossRef]
  6. Salehi, M. Global water shortage and potable water safety; Today’s concern and tomorrow’s crisis. Environ. Int. 2022, 158, 106936. [Google Scholar] [CrossRef]
  7. He, C.; Liu, Z.; Wu, J.; Pan, X.; Fang, Z.; Li, J.; Bryan, B.A. Future global urban water scarcity and potential solutions. Nat. Commun. 2021, 12, 4667. [Google Scholar] [CrossRef]
  8. Van Vliet, M.T.; Jones, E.R.; Flörke, M.; Franssen, W.H.; Hanasaki, N.; Wada, Y.; Yearsley, J.R. Global water scarcity including surface water quality and expansions of clean water technologies. Environ. Res. Lett. 2021, 16, 024020. [Google Scholar] [CrossRef]
  9. Biswas, A.K. Integrated water resources management: A reassessment: A water forum contribution. Water Int. 2004, 29, 248–256. [Google Scholar] [CrossRef]
  10. Rahaman, M.M.; Varis, O. Integrated water resources management: Evolution, prospects and future challenges. Sustain. Sci. Pract. Policy 2005, 1, 15–21. [Google Scholar] [CrossRef]
  11. Yang, D.; Yang, Y.; Xia, J. Hydrological cycle and water resources in a changing world: A review. Geogr. Sustain. 2021, 2, 115–122. [Google Scholar] [CrossRef]
  12. Jang, T.; Lee, S.-B.; Sung, C.-H.; Lee, H.-P.; Park, S.-W. Safe application of reclaimed water reuse for agriculture in Korea. Paddy Water Environ. 2010, 8, 227–233. [Google Scholar] [CrossRef]
  13. Korea Water Resources Corporation (K-water). Concept of Integrated Water Resources Management. Available online: https://www.kwater.or.kr/eng/futu/sub01/manaPage.do?s_mid=1197 (accessed on 18 December 2024).
  14. Bwambale, E.; Abagale, F.K.; Anornu, G.K. Smart irrigation monitoring and control strategies for improving water use efficiency in precision agriculture: A review. Agric. Water Manag. 2022, 260, 107324. [Google Scholar] [CrossRef]
  15. Touil, S.; Richa, A.; Fizir, M.; Argente García, J.E.; Skarmeta Gomez, A.F. A review on smart irrigation management strategies and their effect on water savings and crop yield. Irrig. Drain. 2022, 71, 1396–1416. [Google Scholar] [CrossRef]
  16. Kang, Y.; Khan, S.; Ma, X. Climate change impacts on crop yield, crop water productivity and food security–A review. Prog. Nat. Sci. 2009, 19, 1665–1674. [Google Scholar] [CrossRef]
  17. Misra, A.K. Climate change and challenges of water and food security. Int. J. Sustain. Built Environ. 2014, 3, 153–165. [Google Scholar] [CrossRef]
  18. Chowdhury, S.; Al-Zahrani, M.; Abbas, A. Implications of climate change on crop water requirements in arid region: An example of Al-Jouf, Saudi Arabia. J. King Saud Univ.-Eng. Sci. 2016, 28, 21–31. [Google Scholar] [CrossRef]
  19. Shinde, M.; Pawar, D.; Kale, K.; Dingre, S. Performance of cabbage at different irrigation levels under drip and microsprinkler irrigation systems. Irrig. Drain. 2021, 70, 581–592. [Google Scholar] [CrossRef]
  20. Bute, A.; Iosob, G.-A.; Antal-Tremurici, A.; Brezeanu, C.; Brezeanu, P.M.; Cristea, T.O.; Ambăruş, S. The most suitable irrigation methods in cabbage crops (Brassica oleracea L. var. capitata): A review. Sci. Papers. Ser. B. Hortic. 2021, 65, 399–405. [Google Scholar]
  21. Cisternas, I.; Velásquez, I.; Caro, A.; Rodríguez, A. Systematic literature review of implementations of precision agriculture. Comput. Electron. Agric. 2020, 176, 105626. [Google Scholar] [CrossRef]
  22. Basso, B.; Antle, J. Digital agriculture to design sustainable agricultural systems. Nat. Sustain. 2020, 3, 254–256. [Google Scholar] [CrossRef]
  23. Sharma, A.; Jain, A.; Gupta, P.; Chowdary, V. Machine learning applications for precision agriculture: A comprehensive review. IEEE Access 2020, 9, 4843–4873. [Google Scholar] [CrossRef]
  24. Bhat, S.A.; Huang, N.-F. Big data and ai revolution in precision agriculture: Survey and challenges. IEEE Access 2021, 9, 110209–110222. [Google Scholar] [CrossRef]
  25. Wanniarachchi, S.; Sarukkalige, R. A review on evapotranspiration estimation in agricultural water management: Past, present, and future. Hydrology 2022, 9, 123. [Google Scholar] [CrossRef]
  26. Sharma, K.; Irmak, S.; Kukal, M.S. Propagation of soil moisture sensing uncertainty into estimation of total soil water, evapotranspiration and irrigation decision-making. Agric. Water Manag. 2021, 243, 106454. [Google Scholar] [CrossRef]
  27. Bwambale, E.; Abagale, F.K.; Anornu, G.K. Data-driven modelling of soil moisture dynamics for smart irrigation scheduling. Smart Agric. Technol. 2023, 5, 100251. [Google Scholar] [CrossRef]
  28. Rushton, K.; Eilers, V.; Carter, R. Improved soil moisture balance methodology for recharge estimation. J. Hydrol. 2006, 318, 379–399. [Google Scholar] [CrossRef]
  29. Eisenhauer, D.E.; Martin, D.L.; Heeren, D.M.; Hoffman, G.J. Irrigation Systems Management; American Society of Agricultural and Biological Engineers (ASABE): St. Joseph, MI, USA, 2021. [Google Scholar]
  30. Marin, F.R.; Angelocci, L.R.; Nassif, D.S.; Costa, L.G.; Vianna, M.S.; Carvalho, K.S. Crop coefficient changes with reference evapotranspiration for highly canopy-atmosphere coupled crops. Agric. Water Manag. 2016, 163, 139–145. [Google Scholar] [CrossRef]
  31. Paredes, P.; Pereira, L.; Almorox, J.; Darouich, H. Reference grass evapotranspiration with reduced data sets: Parameterization of the FAO Penman-Monteith temperature approach and the Hargeaves-Samani equation using local climatic variables. Agric. Water Manag. 2020, 240, 106210. [Google Scholar] [CrossRef]
  32. Allen, R.G. Assessing integrity of weather data for reference evapotranspiration estimation. J. Irrig. Drain. Eng. 1996, 122, 97–106. [Google Scholar] [CrossRef]
  33. Zotarelli, L.; Dukes, M.D.; Romero, C.C.; Migliaccio, K.W.; Morgan, K.T. Step by step calculation of the Penman-Monteith Evapotranspiration (FAO-56 Method). Inst. Food Agric. Sci. Univ. Fla. 2010, 1–10. [Google Scholar] [CrossRef]
  34. Vinukollu, R.K.; Wood, E.F.; Ferguson, C.R.; Fisher, J.B. Global estimates of evapotranspiration for climate studies using multi-sensor remote sensing data: Evaluation of three process-based approaches. Remote Sens. Environ. 2011, 115, 801–823. [Google Scholar] [CrossRef]
  35. Allen, R.G.; Pereira, L.S.; Raes, D.; Smith, M. Crop evapotranspiration-Guidelines for computing crop water requirements-FAO Irrigation and drainage paper 56. Fao Rome 1998, 300, D05109. [Google Scholar]
  36. Wang, J.; Zhang, Y.; Gong, S.; Xu, D.; Juan, S.; Zhao, Y. Evapotranspiration, crop coefficient and yield for drip-irrigated winter wheat with straw mulching in North China Plain. Field Crops Res. 2018, 217, 218–228. [Google Scholar] [CrossRef]
  37. Pereira, L.S.; Paredes, P.; Melton, F.; Johnson, L.; Mota, M.; Wang, T. Prediction of crop coefficients from fraction of ground cover and height: Practical application to vegetable, field and fruit crops with focus on parameterization. Agric. Water Manag. 2021, 252, 106663. [Google Scholar] [CrossRef]
  38. Liao, R.; Zhang, S.; Zhang, X.; Wang, M.; Wu, H.; Zhangzhong, L. Development of smart irrigation systems based on real-time soil moisture data in a greenhouse: Proof of concept. Agric. Water Manag. 2021, 245, 106632. [Google Scholar] [CrossRef]
  39. Vidal, N.P.; Manful, C.F.; Pham, T.H.; Stewart, P.; Keough, D.; Thomas, R. The use of XLSTAT in conducting principal component analysis (PCA) when evaluating the relationships between sensory and quality attributes in grilled foods. MethodsX 2020, 7, 100835. [Google Scholar] [CrossRef]
  40. Jadhav, S.; Khodke, U.; Ingle, V.; Awari, H. Water use efficiency of cabbage as influenced by irrigation schedules and fertigation levels. J. Pharmacogn. Phytochem. 2020, 9, 344–348. [Google Scholar]
  41. Imtiyaz, M.; Mgadla, N.; Manase, S.; Chendo, K.; Mothobi, E. Yield and economic return of vegetable crops under variable irrigation. Irrig. Sci. 2000, 19, 87–93. [Google Scholar] [CrossRef]
  42. Farvardin, A.; González-Hernández, A.I.; Llorens, E.; García-Agustín, P.; Scalschi, L.; Vicedo, B. The apoplast: A key player in plant survival. Antioxidants 2020, 9, 604. [Google Scholar] [CrossRef]
  43. Suslov, M.; Daminova, A.; Egorov, J. Real-Time Dynamics of Water Transport in the Roots of Intact Maize Plants in Response to Water Stress: The Role of Aquaporins and the Contribution of Different Water Transport Pathways. Cells 2024, 13, 154. [Google Scholar] [CrossRef] [PubMed]
  44. Steudle, E. Water transport across roots. Plant Soil 1994, 167, 79–90. [Google Scholar] [CrossRef]
  45. Wu, J.; Zhang, R.; Gui, S. Modeling soil water movement with water uptake by roots. Plant Soil 1999, 215, 7–17. [Google Scholar] [CrossRef]
  46. Sattelmacher, B. The apoplast and its significance for plant mineral nutrition. New Phytol. 2001, 149, 167–192. [Google Scholar] [CrossRef]
  47. Horst, W.J.; Wang, Y.; Eticha, D. The role of the root apoplast in aluminium-induced inhibition of root elongation and in aluminium resistance of plants: A review. Ann. Bot. 2010, 106, 185–197. [Google Scholar] [CrossRef]
  48. Ali, O.; Cheddadi, I.; Landrein, B.; Long, Y. Revisiting the relationship between turgor pressure and plant cell growth. New Phytol. 2023, 238, 62–69. [Google Scholar] [CrossRef]
  49. Wilson, J.B. Shoot competition and root competition. J. Appl. Ecol. 1988, 25, 279–296. [Google Scholar] [CrossRef]
  50. Cahill, J.; James, F. Interactions between root and shoot competition vary among species. Oikos 2002, 99, 101–112. [Google Scholar] [CrossRef]
  51. Hutchings, M.J.; John, E.A. The effects of environmental heterogeneity on root growth and root/shoot partitioning. Ann. Bot. 2004, 94, 1–8. [Google Scholar] [CrossRef]
  52. Grzesiak, S.; Grzesiak, M.T.; Filek, W.; Hura, T.; Stabryła, J. The impact of different soil moisture and soil compaction on the growth of triticale root system. Acta Physiol. Plant. 2002, 24, 331–342. [Google Scholar] [CrossRef]
  53. Xu, S.; Li, K.; Li, G.; Hu, Z.; Zhang, J.; Iqbal, B.; Du, D. Canada Goldenrod Invasion Regulates the Effects of Soil Moisture on Soil Respiration. Int. J. Environ. Res. Public Health 2022, 19, 15446. [Google Scholar] [CrossRef] [PubMed]
  54. Xu, C.; Leskovar, D. Growth, physiology and yield responses of cabbage to deficit irrigation. Hortic. Sci. 2014, 41, 138–146. [Google Scholar] [CrossRef]
  55. Sarkar, S.; Saha, R.; Patra, S.K. Irrigation and fertilizer management on growth, yield, water and fertilizer use efficiencies on cabbage in a sandy loam soil. Int. J. Curr. Microbiol. Appl. Sci. 2020, 9, 64–77. [Google Scholar] [CrossRef]
  56. Green, S.R.; Kirkham, M.; Clothier, B.E. Root uptake and transpiration: From measurements and models to sustainable irrigation. Agric. Water Manag. 2006, 86, 165–176. [Google Scholar] [CrossRef]
  57. Scharwies, J.D.; Dinneny, J.R. Water transport, perception, and response in plants. J. Plant Res. 2019, 132, 311–324. [Google Scholar] [CrossRef]
  58. Papendick, R.; Campbell, G. Theory and measurement of water potential. Water Potential Relat. Soil Microbiol. 1981, 9, 1–22. [Google Scholar]
  59. Kang, Y.; Wan, S. Effect of soil water potential on radish (Raphanus sativus L.) growth and water use under drip irrigation. Sci. Hortic. 2005, 106, 275–292. [Google Scholar] [CrossRef]
  60. García-Tejera, O.; López-Bernal, Á.; Orgaz, F.; Testi, L.; Villalobos, F.J. The pitfalls of water potential for irrigation scheduling. Agric. Water Manag. 2021, 243, 106522. [Google Scholar] [CrossRef]
Figure 1. Flowchart representing the process of training a virtual sensor based on machine learning (XGBoost Model).
Agriculture 15 00308 g001
Figure 2. Location and layout of cabbage irrigation experiment. (A) Location of experimental site for field cabbage irrigation experiment. (B) 72 days after transplanting. (C) Schematic diagram of the experimental field setup for cultivating cabbages.
Agriculture 15 00308 g002
Figure 3. Precipitation and daily temperature from 13 May to 27 June. (A) Mean temperature and precipitation, (B) mean relative humidity, (C) mean solar radiation, and (D) mean wind speed were measured by the FS (field sensor), the KMA (Korea Meteorological Administration), and the ML (machine learning). Precipitation was measured by the KMA.
Agriculture 15 00308 g003
Figure 4. Soil moisture content and daily cumulative evapotranspiration from 24 to 26 May and from 16 to 18 June. Soil moisture content was measured using a soil moisture sensor in 100% ETc measured by the KMA (Korea Meteorological Administration), and cumulative evapotranspiration was measured based on the KMA.
Agriculture 15 00308 g004
Figure 5. Total cumulative evapotranspiration and number of irrigations of the FS (field sensor), the KMA (Korea Meteorological Administration), and the ML (machine learning) over 46 days (13 May–27 June).
Agriculture 15 00308 g005
Figure 6. Comparison of cabbage growth under different evapotranspiration (ET) conditions measured by (A) the FS (field sensor), (B) the KMA (Korea Meteorological Administration), and (C) the ML (machine learning) over various irrigation levels (40, 60, 80, and 100% ETc). The cabbages were grown in an experimental field for a total of 72 days from 18 April to 27 June. The scale bar represents 10 cm.
Agriculture 15 00308 g006
Figure 7. Total water use of the automatic irrigation system for cultivating cabbage from 13 May to 27 June. Evapotranspiration (ET) conditions measured by the FS (field sensor), the KMA (Korea Meteorological Administration), and the ML (machine learning). (A) Total water use per plant. (B) Water use per irrigation.
Agriculture 15 00308 g007
Figure 8. Irrigation water productivity (WPI) and cabbage yield of the automatic water supply system for cultivating cabbage from 13 May to 27 June. Evapotranspiration (ET) conditions measured by (A) the FS (field sensor), (B) the KMA (Korea Meteorological Administration), and (C) the ML (machine learning) over various irrigation levels (40, 60, 80, and 100% ETc). (D) Cabbage yield versus water supplied by irrigation (converted to hectare units). Data are represented as the mean ± SE (standard error) of five samples (n = 5). Different letters indicate a significant difference between treatments based on ETc irrigation levels (Tukey’s HSD test at p ≤ 0.05).
Agriculture 15 00308 g008
Figure 9. (A) Hierarchical clustering heatmap representing different variables under the treatments (FS, field sensor; KMA, Korea Meteorological Administration; ML, machine learning) based on ETc irrigation levels. Normalized average data of different variables were used to the heatmap (n = 5). The variables were grouped into two clusters (Cluster A and Cluster B). (B) PCA (principal component analysis) represents the relationship among various irrigation levels and variables. The variables included HFW (head fresh weight), SFW (shoot fresh weight), HDW (head dry weight), LA (leaf area), SDW (shoot dry weight), WPI (irrigation water productivity), RDW (root dry weight), RFW (root fresh weight), diameter, NL (number of leaves), SPAD, and Fv/Fm.
Agriculture 15 00308 g009
Table 1. The field soil properties at 0–20 cm depth at the experimental site in 2024.
YearBulk Density
(g cm−3)
pH (H2O)AP
(mg kg−1)
K
(cmol kg−1)
Ca
(cmol kg−1)
Mg
(cmol kg−1)
EC
(dS m−1)
20242.576.71260.23.60.90.2
Note: AP, available phosphate content.
Table 2. Performance evaluation of XGBoost model for each meteorological factor.
Model
Evaluation
Solar Radiation
(W/m2)
Temperature
(°C)
Relative
Humidity (%)
Wind Speed
(m/s)
R20.8480.9820.9300.730
RMSE101.0361.3405.8920.384
MAE56.4530.8453.9240.264
Note: R2, coefficient of determination; RMSE, root mean squared error; MAE, mean absolute error.
Table 3. Water use per irrigation according to irrigation levels.
Irrigation LevelsMulching
Coefficient
Plant Density
(cm)
Water Use per Irrigation (mL/plant)
Kcmid (1.11) Kcend (1.13)
40% ETc0.8 0.3 × 0.33232.4
60% ETc4848.6
80% ETc6464.8
100% ETc8081
Note: Kc, crop coefficient; Kcmid was applied for 17 days, and Kcend was applied for 29 days.
Table 4. The growth parameters of cabbage under different evapotranspiration (ET) conditions, measured by the FS (field sensor), the KMA (Korea Meteorological Administration), and the ML (machine learning), were analyzed under various irrigation levels (40, 60, 80, and 100% of ETc) from 13 May to 27 June.
TreatmentNo. of LeavesLeaf Area (cm2)SPADFv/FmSFW (g)RFW (g)SDW (g)RDW (g)
EvapotranspirationIrrigation Levels
FS40% ETc20.0 ± 0.637303 ± 690.98 b76.16 ± 3.800.75 ± 0.022393 ± 170.15 b115.14 ± 14.98250.67 ± 21.24 b27.26 ± 2.12 ab
60% ETc19.4 ± 0.4011808 ± 963.27 a76.10 ± 0.530.80 ± 0.013935 ± 500.63 a133.06 ± 13.28356.40 ± 34.55 a34.57 ± 2.58 a
80% ETc19.2 ± 0.978501 ± 516.66 b73.88 ± 1.500.77 ± 0.023079 ± 291.71 ab98.01 ± 10.70246.83 ± 25.66 b26.32 ± 4.35 ab
100% ETc18.8 ± 0.498647 ± 389.59 b76.48 ± 2.830.80 ± 0.022937 ± 156.76 ab87.77 ± 5.59243.67 ± 13.92 b20.64 ± 1.18 b
SignificanceNS**NSNS*NS**
KMA40% ETc20.4 ± 0.24 ab9273 ± 1525.18 ab75.14 ± 2.680.75 ± 0.022844 ± 538.44 ab133.68 ±29.76279.21 ± 47.49 ab34.23 ± 7.45 a
60% ETc19.0 ± 1.30 b13,368 ± 563.70 a78.98 ± 2.490.75 ± 0.014041 ± 24.31 a150.19 ± 6.04345.28 ± 16.20 a34.31 ± 1.43 a
80% ETc23.8 ± 1.11 a9603 ± 1757.29 ab75.90 ± 2.450.78 ± 0.012588 ± 331.46 b86.98 ± 8.77204.32 ± 31.89 b16.58 ± 2.18 b
100% ETc20.0 ± 0.89 ab7843 ± 248.45 b72.10 ± 2.120.80 ± 0.012535 ± 159.21 b92.62 ± 4.58213.97 ± 11.82 b20.86 ± 0.86 ab
Significance**NSNS****
ML40% ETc25.6 ± 1.63 a5916 ± 252.88 b68.26 ± 2.12 b0.83 ± 0.001541 ± 136.11 b85.06 ± 12.19 b149.99 ± 8.62 b17.22 ± 1.73 b
60% ETc17.8 ± 0.58 b9107 ± 380.63 a73.98 ± 1.43 ab0.80 ± 0.012998 ± 166.14 a120.40 ± 7.20 a298.77 ± 16.81 a31.99 ± 2.59 a
80% ETc19.4 ± 1.03 b8533 ± 498.90 a72.84 ± 1.65 ab0.82 ± 0.013207 ± 231.67 a109.53 ± 7.99 ab279.76 ± 18.44 a24.98 ± 1.63 a
100% ETc18.8 ± 0.8 b7701 ± 353.19 a75.48 ± 1.67 a0.80 ± 0.022717 ± 131.61 a118.92 ± 3.46 a277.09 ± 12.70 a28.53 ± 1.47 a
Significance******NSNS**********
Note: SFW, shoot fresh weight; RFW, root fresh weight; SDW, shoot dry weight; RDW, root dry weight; NS, not significant (p > 0.05); significance at * p ≤ 0.05, ** p ≤ 0.01, *** p ≤ 0.001. Values are the mean ± SE (standard error) of five samples (n = 5). Different letters indicate a significant difference between various irrigation levels via Tukey’s HSD test at p ≤ 0.05.
Table 5. The cabbage head parameters and yield under different evapotranspiration (ET) conditions measured by the FS (field sensor), the KMA (Korea Meteorological Administration), and the ML (machine learning), were analyzed under various irrigation levels (40, 60, 80, and 100% of ETc) from 13 May to 27 June.
TreatmentHead Diameter (cm)HFW (g)HDW (g)Yield (t ha−1)
EvapotranspirationIrrigation Levels
FS40% ETc15.08 ± 0.41 b1195 ± 97.93 b84.83 ± 9.3444.22 ± 3.62 b
60% ETc17.66 ± 0.60 a1956 ± 238.91 a117.58 ± 12.6472.37 ± 8.84 a
80% ETc17.56 ± 0.68 ab1665 ± 191.70 ab97.11 ± 11.6861.60 ± 7.09 ab
100% ETc17.54 ± 0.78 ab1618 ± 123.35 ab93.52 ± 7.3459.87 ± 4.56 ab
SignificanceNS*NS*
KMA40% ETc16.08 ± 0.86 b1369 ± 259.8796.56 ± 14.34 ab50.65 ± 9.62
60% ETc19.81 ± 0.84 a1999 ± 115.78133.45 ± 7.02 a73.96 ± 4.28
80% ETc16.98 ± 1.23 ab1270 ± 195.4366.53 ± 11.61 b46.99 ± 7.23
100% ETc16.41 ± 0.56 ab1325 ± 132.1380.12 ± 6.83 b49.03 ± 4.89
Significance*NS**NS
ML40% ETc13.19 ± 0.9 b605 ± 238.35 b41.09 ± 4.84 b22.39 ± 3.94 b
60% ETc18.34 ± 0.38 a1564 ± 142.58 a123.55 ± 9.30 a57.87 ± 2.36 a
80% ETc19.59 ± 0.59 a1809 ± 345.42 a125.93 ± 11.43 a66.93 ± 5.72 a
100% ETc18.93 ± 0.44 a1517 ± 211.85 a111.42 ± 9.87 a56.13 ± 3.51 a
Significance************
Note: HFW, head fresh weight; HDW, head dry weight; Yield was converted to fresh weight per hectare. NS, not significant (p > 0.05); significance at * p ≤ 0.05, ** p ≤ 0.01, *** p ≤ 0.001. Values are the mean ± SE (standard error) of five samples (n = 5). Different letters indicate a significant difference between various irrigation levels via Tukey’s HSD test at p ≤ 0.05.
Disclaimer/Publisher’s Note: The statements, opinions and data contained in all publications are solely those of the individual author(s) and contributor(s) and not of MDPI and/or the editor(s). MDPI and/or the editor(s) disclaim responsibility for any injury to people or property resulting from any ideas, methods, instructions or products referred to in the content.