Article

Mapping Novel Loci and Candidate Genes Associated with Cadmium Content in Maize Using Genome-Wide Association Analysis

1
College of Agriculture and Biology, Zhongkai University of Agriculture and Engineering, Guangzhou 510408, China
2
Institute of Nanfan & Seed Industry, Guangdong Academy of Science, Guangzhou 510316, China
3
Crop Research Institute, Guangdong Academy of Agricultural Sciences, Guangzhou 510641, China
*
Authors to whom correspondence should be addressed.
These authors contributed equally to this work.
Agriculture 2025, 15(4), 389; https://doi.org/10.3390/agriculture15040389
Submission received: 24 November 2024 / Revised: 3 February 2025 / Accepted: 10 February 2025 / Published: 12 February 2025
(This article belongs to the Section Crop Genetics, Genomics and Breeding)

Abstract

:
Cadmium is a toxic, carcinogenic element that threatens food safety due to its tendency to be absorbed by plants along with essential nutrients. This study conducted a genome-wide association study (GWAS) using SNP genotyping data from 170 natural maize populations to analyze cadmium content in maize grains across three environments. The MLM_Q+Kinship and MLM_PCA+Kinship models identified 6424 (HN), 991 (JMO), and 1358 (JMT) SNPs linked to cadmium accumulation in the MLM_Q+Kinship model, with 121 SNPs common across all environments. Additionally, the MLM_PCA+Kinship model detected 824 (HN), 950 (JMO), and 910 (JMT) SNPs, with 14 shared loci. In total, 126 reliable SNP loci, representing 14 QTLs, were identified, highlighting 12 superior haplotypes and 2 favorable alleles. A negative correlation between these loci and cadmium content was observed. Within 100 kbp of the QTLs, 45 candidate genes were identified, associated with 11 GO terms and 5 KEGG pathways. Analysis revealed 12 maize lines with at least one stable locus, all of which showed reduced Cd levels. Key hybrids, such as CAU95×CAU65 and CAU95×CAU266, demonstrated the potential for low Cd accumulation. This study provides valuable insights for breeding maize with reduced Cd uptake using stable gene loci discovered through GWAS.

1. Introduction

Maize (Zea mays L.) is an important cereal crop that is in huge demand as food and fodder across the world. Maize serves as a basic raw material to produce starch, protein, oil, alcoholic beverages, food sweeteners, and fuels, which provide nutrients for maintaining human and animal health [1]. However, apart from beneficial elements, harmful elements in the soil, such as cadmium (Cd), enter the plant body through its roots during growth and development. Reportedly, Cd is one of the detrimental heavy metals released into the environment, either naturally or anthropogenically [1]. This is highly persistent and toxic, and upsets industrial and agricultural activities by contaminating soil, water, and food. Its long duration endurance in soil and water results in higher accumulation and uptake into plants and the food chain [2]. Living organisms, especially humans, are exposed to Cd through plants as a major vegetative food source, which causes health problems [3].
Currently, Cd pollution is becoming increasingly severe, and farmland in many parts of the world has been contaminated with cadmium, resulting in the inability to cultivate. For example, 19% of farmland in China is contaminated with cadmium, of which approximately 45 million acres cannot be cultivated due to severe pollution [4]. Therefore, research on the relationship between Cd toxicity and plants has gradually increased in recent years. For instance, the toxicity of Cd reduces the uptake and translocation of nutrients and water, increases oxidative damage, disrupts plant metabolism, and inhibits plant morphology and physiology [5]. Higher toxicity inhibits plant growth, tends to lead to plant necrosis, inhibits C-fixation, decreases chlorophyll content, and decreases photosynthetic activity [6]. In addition, it lowers stomatal density, conductance, and CO2 uptake, limiting photosynthesis [7]. Exposure to Cd in soil induces osmotic stress in plants by minimizing leaf relative water content and transpiration, resulting in physiological damage [8]. Moreover, its toxicity causes the overproduction of reactive oxygen species (ROS), damaging plant membranes and destroying cellular biomolecules and organelles [9]. Hence, there is a pressing need to understand the genetic mechanisms governing Cd accumulation in plants to develop strategies for breeding varieties with lower Cd uptake, including maize [10].
However, Cd accumulation in plants is a complex trait that is influenced by various genetic and environmental factors [11]. Historically, studies on Cd accumulation have focused on identifying quantitative trait loci (QTL) associated with the trait, but these approaches often fall short due to the multifaceted nature of the genetic regulation involved in heavy metal uptake [12]. With the advent of high-throughput sequencing technologies, genome-wide association studies (GWAS) have emerged as powerful tools for dissecting complex traits by identifying associations between genetic and phenotypic variations in a diverse set of individuals [13]. Therefore, some researchers have begun to use GWAS to explore marker sites related to Cd content in maize [14,15,16,17]. Unfortunately, the use of these loci for material evaluation and validation of candidate genes is relatively weak, and very few loci can be applied to agricultural production. Thus, exploring more gene loci and strengthening the above research to identify important candidate genes will be beneficial for further in-depth gene dissection in the future. This will help implement breeding and biotechnology interventions to minimize Cd levels in maize, thereby safeguarding food and feed supplies against Cd contamination and its subsequent health implications [18].
Here, GWAS analysis was used based on SNP genotyping data from 170 natural populations of maize to identify single nucleotide polymorphism (SNP) peaks associated with cadmium enrichment in maize grains across different environments. In addition, based on multiple methods and phenotypic values in multiple environments, stable loci were screened, and their phenotypic effect values were used to evaluate the materials. Then, based on the QTN/QTL formed by these loci, candidate genes were searched within 100kbp upstream and downstream [19], and the correlations between these candidate genes were obtained. Furthermore, this study utilized RT-qPCR and gene overexpression in yeast to validate the function of candidate genes. In summary, this study aims to draw the following conclusions: (1) obtain reliable QTN/QTL and candidate genes related to cadmium accumulation; (2) screen some stable low-cadmium materials to provide basic materials for subsequent breeding of high-quality varieties and predicting hybrid combinations; (3) conduct preliminary validation of candidate genes, screen some obvious candidate genes that can be focused on, and provide basic information for subsequent molecular mechanism research.

2. Materials and Methods

2.1. Plant Material and Phenotypic Data Analysis

The 170 maize accessions from Dr. Lai’s laboratory at China Agricultural University [20], were planted at the Hainan experimental station in SanYa (18.75° N, 109.17° E) as the first environment (HN) in November 2013. Subsequent plantings occurred at the Guangdong experimental station in Jiang Men (22.61° N, 113.06° E) in September 2020 (JMO) and 2021 (JMT), as the second and third environment, respectively. There was one replicate in each environment. At both locations, the accessions were arranged in a randomized complete block design with 0.25 m spacing within rows and 0.6 m between rows. Then, according to the methodology from our previous study [19], well-pollinated ears of selfed seeds were harvested to measure the cadmium (Cd) content in maize grains using inductively coupled plasma mass spectrometry (Agilent 7700 series).
The Cd content data from 170 maize accessions were analyzed, including calculations of the mean, range, skewness, kurtosis, and coefficient of variation (CV). Additionally, the interactions between genes and the environment, as well as broad-sense heritability (h2), were calculated following the methods described in our previous study [19].

2.2. Genome-Wide Association Mapping, LD Analysis, and Superior Allele Analysis

A total of 170 accessions underwent genotyping-by-sequencing (GBS) analysis, following protocols detailed in previous research [20]. To assess the population structure, we utilized Admixture (v1.3.0) with its standard parameters and tested hypothetical subgroup (K) values ranging from 2 to 15 to obtain the Q matrix. Additionally, the kinship matrix was computed using EMMAX software (v2012) with the parameters -v, -h, -s, and -d 10. To identify peak SNPs, we employed the GWAS method using emmax software with two models: Multiple Loci Linear Mixed (MLM_Q+Kinship and MLM_PCA+Kinship). A threshold p-value of less than 1/116,011, equivalent to 8.62 × 10⁻⁶ (adjusted with Bonferroni correction), was set to detect significant SNPs.
To analyze linkage disequilibrium (LD), we utilized TASSEL 3.0 software [21], employing the default parameters with a full matrix. When the LD between two loci were greater than 0.6 [22,23], they were considered to form a haplotype as a QTL. The phenotypic effect value (Ai) for each QTN allele was derived using the method outlined by [19,24], applying the formula Ai = (∑Nij/ni) − (∑N/n). This formula calculates Ai based on the phenotypic determination value (Ni) of materials carrying the QTN(i) allele, the count of such materials (ni), and the average phenotypic value of all materials (N/n). A negative Ai indicates a reduced (−) QTN allele, whereas a positive value signifies a synergistic (+) QTN allele, with + representing a superior allele and - an alternative allele. Subsequently, IBM SPSS Statistics 19 software was utilized to conduct ANOVA to assess phenotypic variations among materials with different alleles and also for a correlation analysis between the number of superior alleles and Cd concentration of maize grain.

2.3. Candidate Gene Prediction, GO, and KEGG Analysis, and Bioinformatics Analysis

Utilizing the peak SNPs as a starting point, potential candidate genes were thoroughly explored in the MaizeGDB (http://www.maizegdb.org, accessed on 8 October 2023) and NCBI (https://www.ncbi.nlm.nih.gov/, accessed on 16 October 2023) databases. Following this initial search, a BLAST analysis was conducted on all identified candidate genes at http://plants.ensembl.org/index.html (accessed on 27 October 2023) to locate homologous genes and annotate their functions, drawing parallels with Arabidopsis. Furthermore, Gene Ontology (GO) and KEGG pathway analyses were executed using the KOBAS v3.0 software (http://bioinfo.org/kobas/annotate/, accessed on 16 October 2023) to elaborate on the functional categories of these candidate genes. Additionally, STRING software (https://cn.string-db.org/, accessed on 13 December 2023) were used for interaction analysis among candidate genes, and the K-mean method was applied to classify them. SWISS-MODEL (https://swissmodel.expasy.org/, accessed on 23 February2024) was used to draw the three-dimensional structure of the proteins. The GPS-SUMO software (https://sumo.biocuckoo.cn/advanced.php, accessed on 23 February 2024) was used to predict the SUMOylation sites of the protein.

2.4. RT-qPCR and Yeast Cadmium Tolerance Experiment

Maize B73 was cultivated to the three-leaf stage and then treated with cadmium concentrations of 0, 0.1, and 0.5 μM CdCl2 for 8 h and 48 h, respectively. Subsequently, total RNAs were extracted from the whole plant and reverse-transcribed into cDNA. ZmACTIN1 was utilized as an internal reference for RT-qPCR, and primer information is provided in Table S1.
Using the cDNA of maize B73 as a template, primer pairs were designed (Table S1) to amplify candidate genes. These genes were then constructed into pGBDT7 vectors. pGBDT7 plasmids carrying the target genes and pGBDT7 plasmids without the target genes (as controls) were transformed into yeast AH109. The yeast strains were treated with 0 and 0.075 mM CdCl2 and their growth status was observed.

3. Results

3.1. Statistical Analysis of Phenotype

Statistical analysis was conducted on the Cd content in the grains of 170 maize accessions. The Cd concentration ranged from 0 to 0.06295 µg·g−1, with an average concentration of 0.0068 µg·g−1, in HN. In JMO and JMT, the ranges were 0–0.167 µg·g−1 (average 0.0286 µg·g−1) and 0.0057–0.1711 µg·g−1 (average 0.0311 µg·g−1), respectively. The coefficient of variation for Cd concentration exceeded 76% in all three environments, indicating significant phenotypic variation among the accessions (Table 1).
The analysis of genotype and environmental effects showed that environmental and genetic factors, as well as the interaction between environment and genes, had a significant influence (p-value < 0.001) on Cd concentration (Table 1). Furthermore, ANOVA was used to compare the Cd concentrations of the population materials between each pair of environments (Figure S1). The results showed significant differences in population material between HN and JMO and between HN and JMT, but no significant difference between JMO and JMT. These findings suggest that soil Cd content may play a crucial role as an environmental factor influencing Cd accumulation in maize grains. Additionally, broad-sense heritability (H2) exceeded 75.92% (Table 1), indicating that genetic factors play an important role.

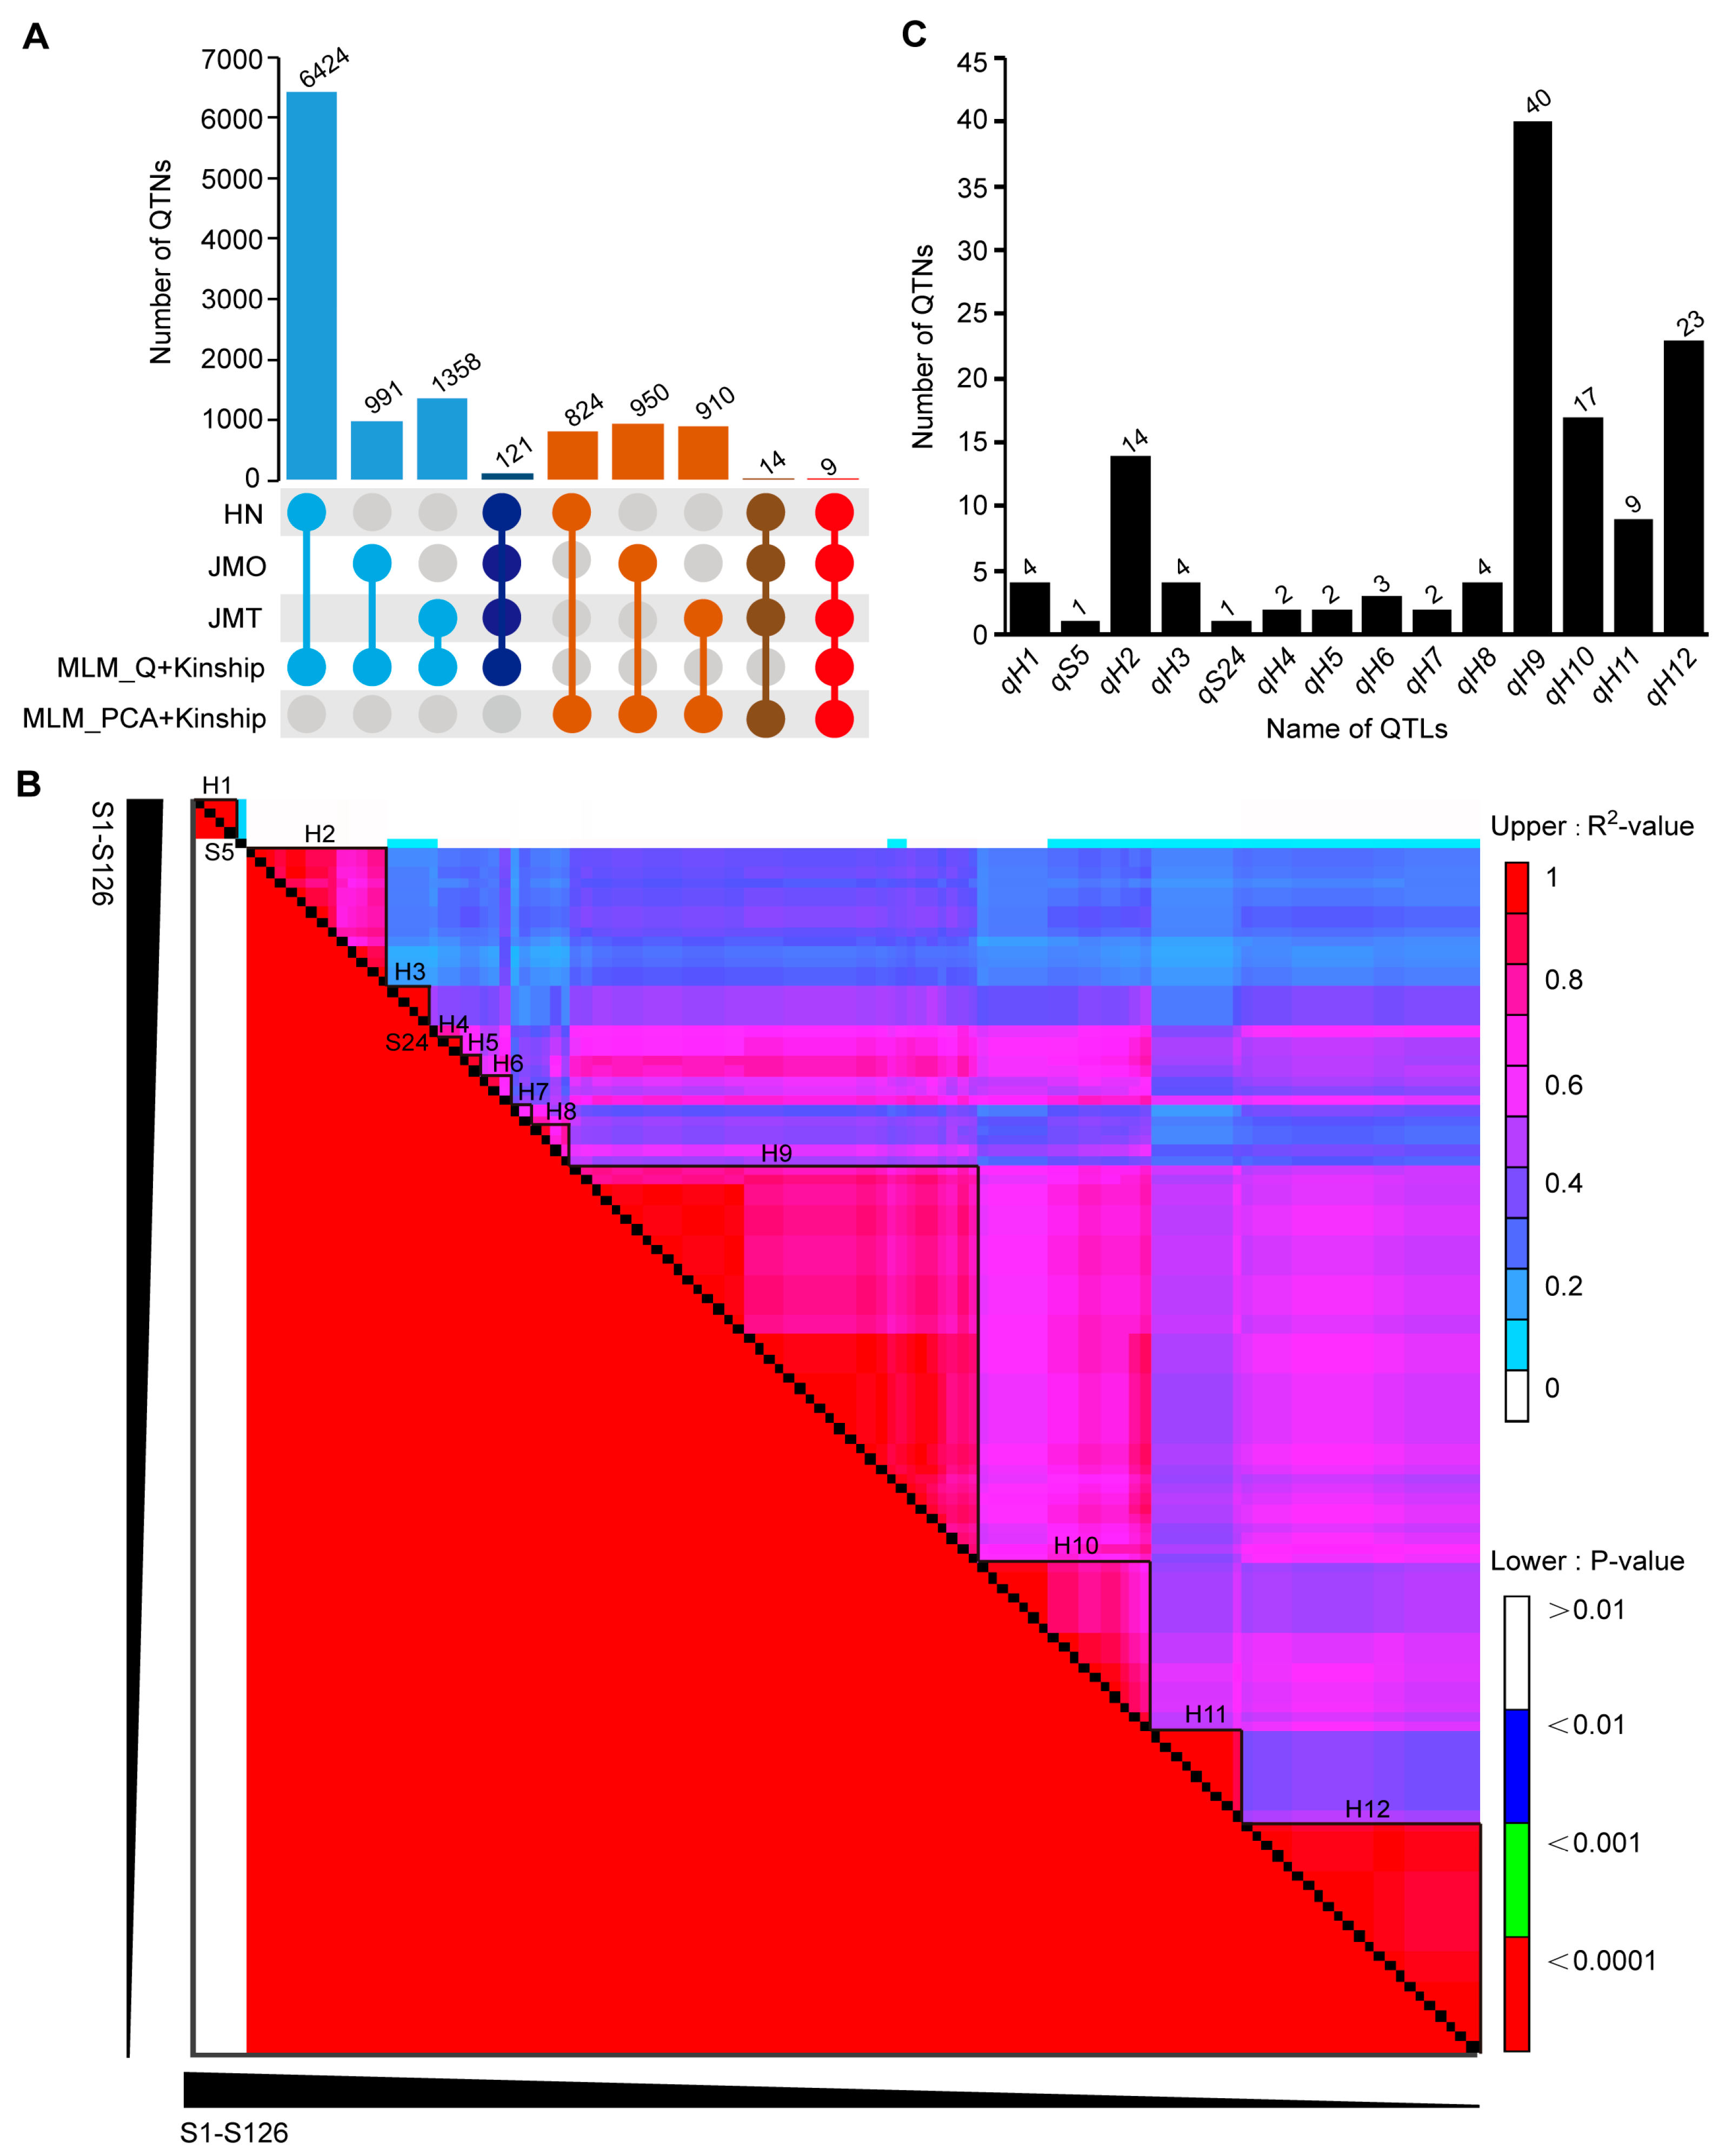
3.2. Genome-Wide Association Studies and Linkage Disequilibrium

To reduce the influence of population structure and kinship on the results of association mapping (Zhu et al., 2023) [19], we conducted analyses of the population structure, principal components, and kinship. Subsequently, the probability value (Q) of each material’s genome variation from each subpopulation, the score of each material’s principal component (PCA), and the kinship coefficient (Kinship) between each pair of materials were obtained. Finally, two mixed linear model (MLM) methods were used for GWAS: MLM_Q+Kinship and MLM_PCA+Kinship. It was found that 8773 QTNs were detected using the MLM_Q+Kinship across the three environments (Figure 1A, Table S2), among which 6424, 991, and 1358 QTNs were identified in HN, JMO, and JMT, respectively. However, only 121 QTNs (p = 7.11 × 10⁻⁶–2.04 × 10⁻⁸) were identified across all the environments, all of which were located on Chr2. Using MLM_PCA+Kinship, 2684 QTNs were detected across the three environments (Figure 1A, Table S3), with 824, 950, and 910 QTNs identified in HN, JMO, and JMT, respectively. Among these, 14 QTNs (p = 8.14 × 10⁻⁶ to 6.09 × 10⁻⁶) were distributed on Chr1 (5 QTNs) and chromosome 2 (9 QTNs) and were identified in all three environments. It is worth mentioning that nine of these QTNs were detected not only in both association models but also in all three environments. Ultimately, 126 QTNs were considered reliable and were named S1–S126 (Table S3, Figure 1B) in this study. In addition, the QTNs detected by different methods were equally reliable [25]; therefore, the nine QTNs (Figure 1A) detected by combining multiple methods and environments were the focus, named S104 and S109–S116 (Table S4).
In addition, the linkage disequilibrium of 7875 pairs among the 126 QTNs pairings were analyzed (Figure 1B, Table S5). When QTNs were on the same chromosome and the R2-value between them was greater than 0.6 [22], they could form a haplotype as a QTL. Here, a single haplotype, H1, was found on Chr.1, referred to as QTN (qH1), containing four QTNs (S2–S5) with R2-values ranging from 1, and the maximum positional distance was 1744 bp (Figure 1B,C; Table S5). However, S5 is an independent QTN and is classified as a QTL (qS5) on Chr.1 (Figure 1B). A total of 11 haplotypes were found on Chr.2, namely H2 (qH2; 14 QTNs), H3 (qH3; 4), H4 (qH4; 2), H5 (qH5; 2), H6 (qH6; 3), H7 (qH7; 2), H8 (qH8; 2), H9 (qH9; 4), H10 (qH10; 40), H11 (qH11; 17), and H12 (qH12; 9). Their R2-values ranged from 0.69~1, 1, 1, 0.95, 0.64~0.92, 0.62, 0.68~0.95, 0.72~1, 0.68~1, 0.91~1, and 0.94~1, respectively. The maximum positional distances were 6177 bp, 34 bp, 18 bp, 2439 bp, 35,191 bp, 7132 bp, 69,560 bp, 22,946 bp, 4394 bp, 86 bp, and 538 bp, respectively. S24 was also an independent QTN and was classified as a QTL (qS24) (Figure 1B,C; Table S5). Nine of these QTNs (S104, S109–S116) were included in qH12 (Table S5); therefore, subsequent attention was focused on information about this QTL. In summary, a total of 14 QTLs were found in this study, which can be used to screen potential low-cadmium materials or predict the cadmium content of early materials for molecular marker-assisted breeding. Additionally, using these QTLs, candidate genes can be searched upstream and downstream to understand the potential functional pathways of Cd uptake and accumulation.

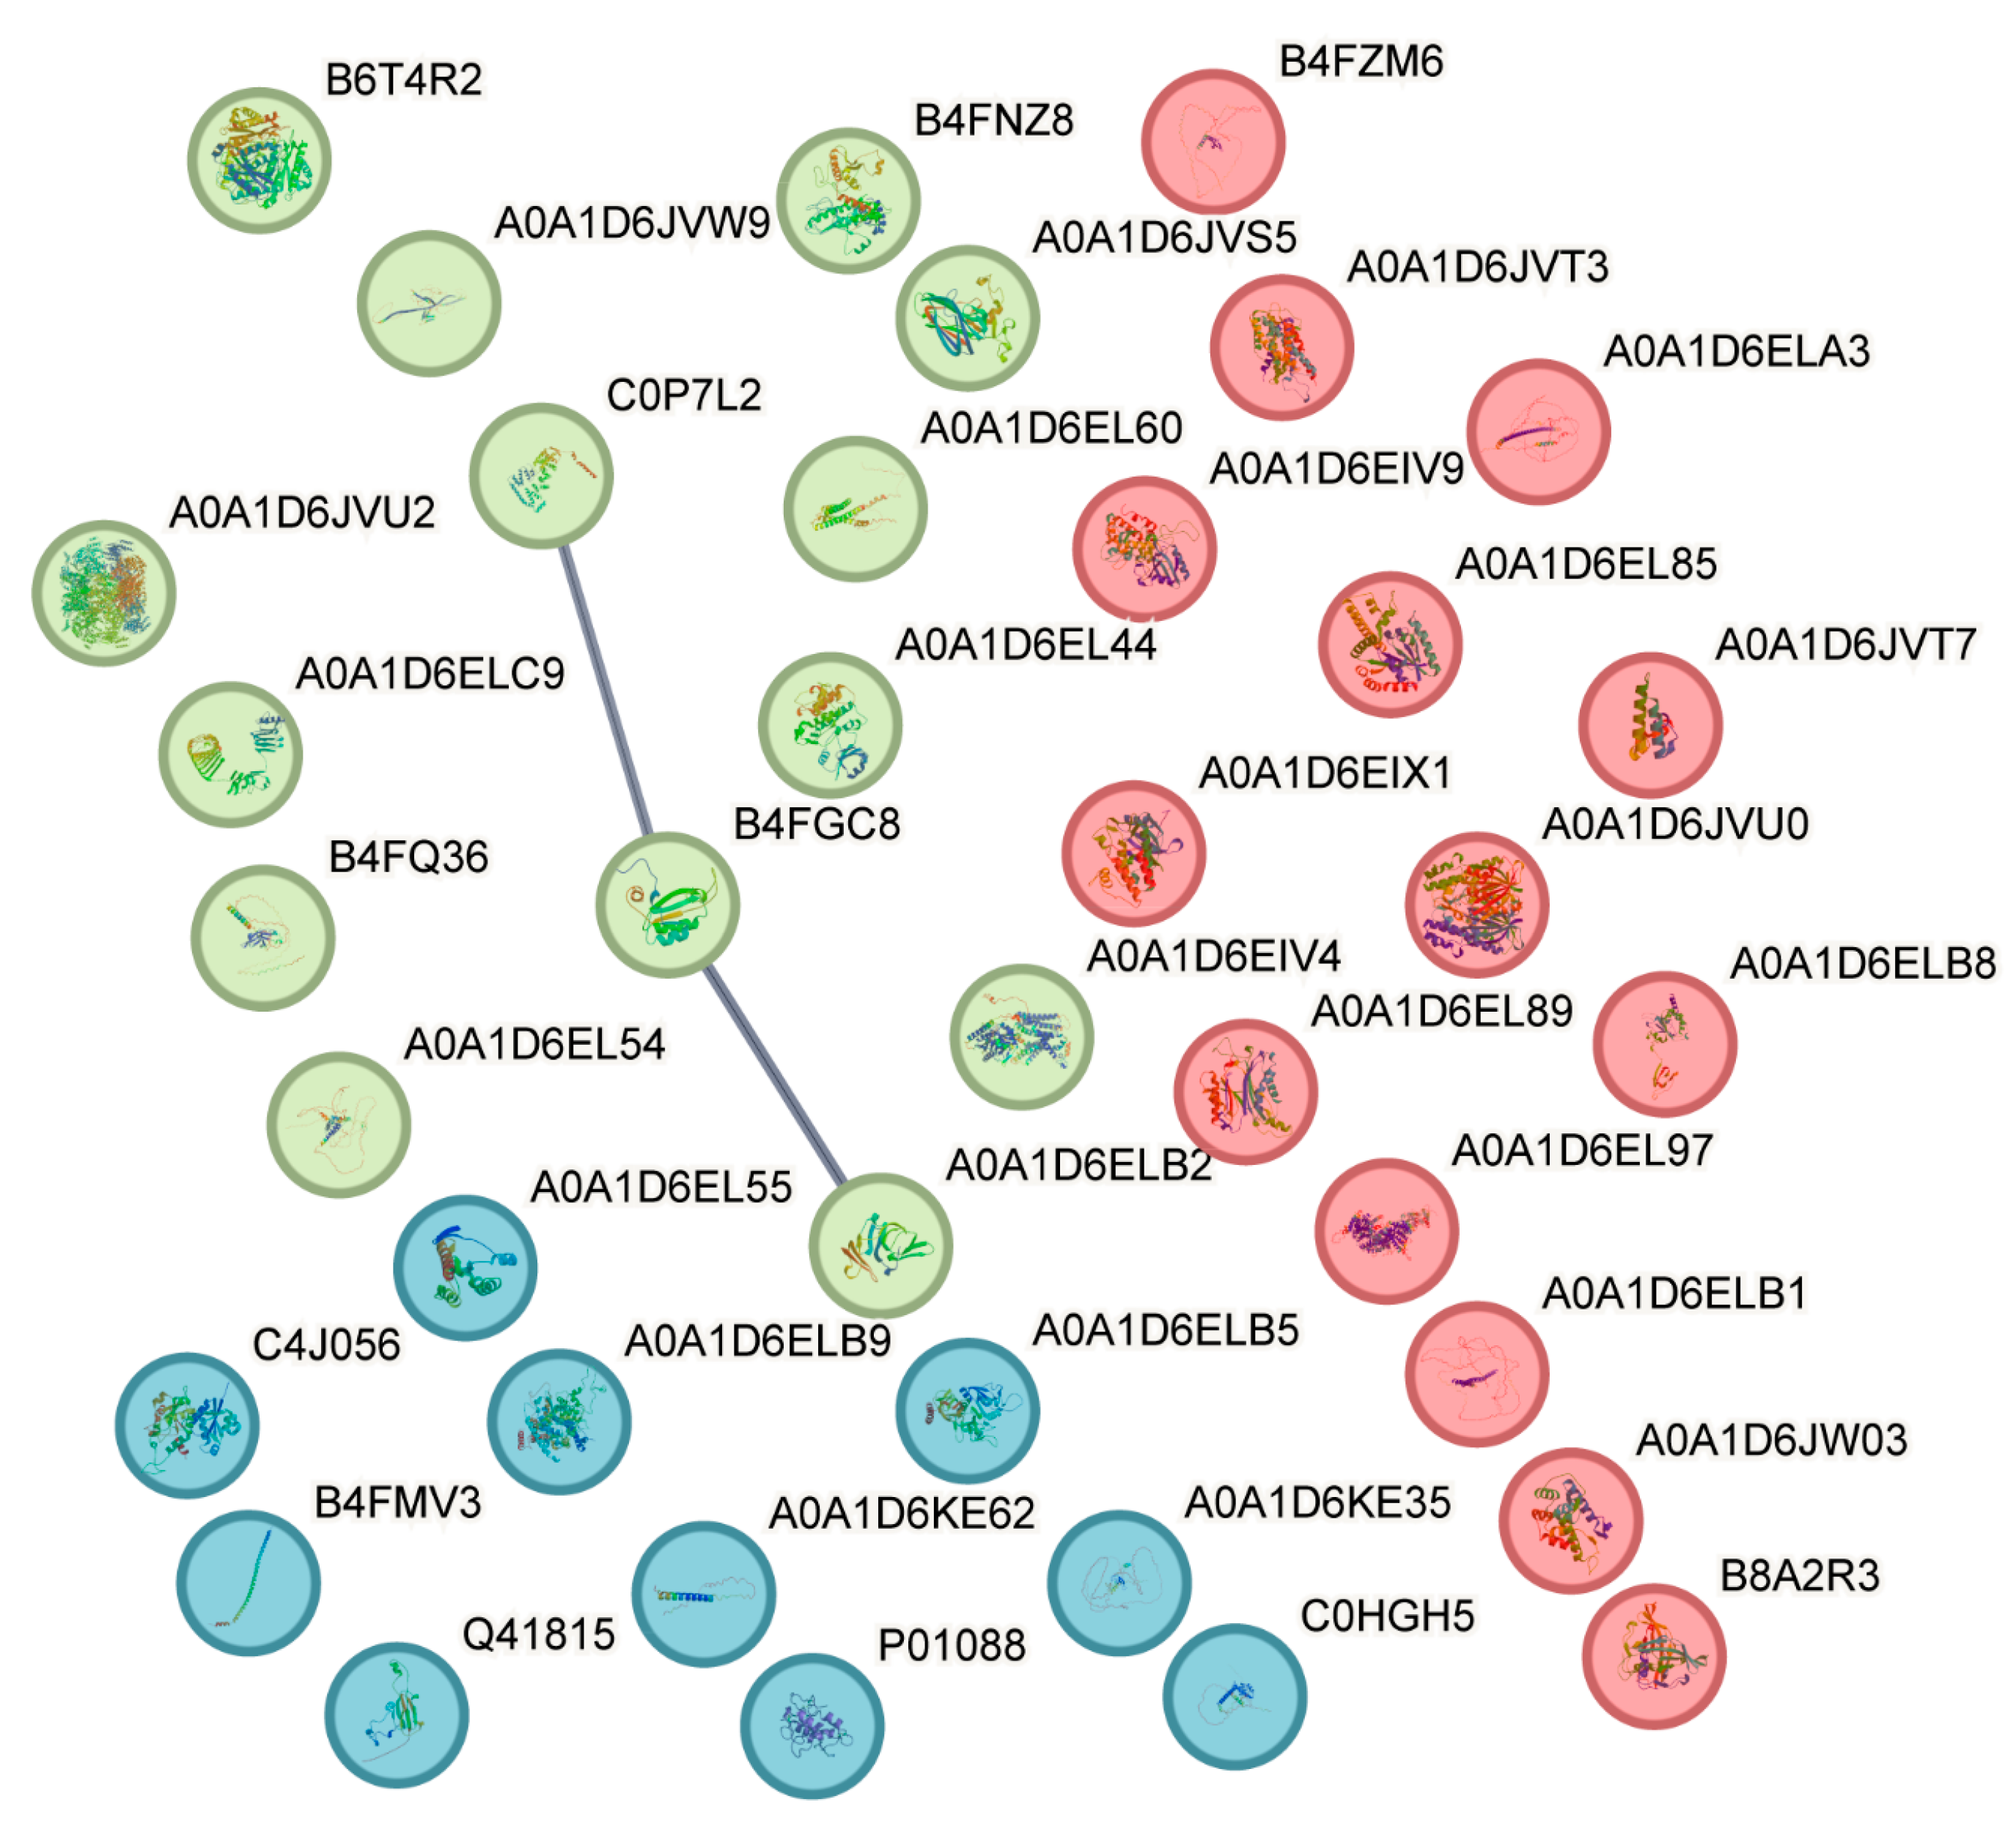
3.3. Candidate Gene Screening, Go and KEGG Analysis, and Interaction Analysis

The 14 QTLs were used to search for candidate genes in the upstream (+) and downstream (−) regions. We identified candidate genes within ±100 kb of these QTLs, resulting in 45 candidate genes that could express 45 proteins (Table S6). GO and KEGG analyses with a p-value < 0.05 identified eight proteins, including A0A1D6EL85, B4FMV3, C0HGH5, B4FNZ8, A0A1D6JVS5, B6T4R2, and B4FGC8, which were associated with 11 GO terms (Table S7). These included seven biological processes (BPs), two molecular functions (MFs), and two cellular components (CCs). Among them, BP is mainly related to the synthesis and transport of proteins, including tRNA modification, regulation of alternative mRNA splicing via spliceosome, positive regulation of transcription, and DNA-templated, which are directly related. MFs and CCs are also associated with protein anabolism, such as tRNA dimethylallyl transferase activity (MF) and cytosolic small ribosomal subunit (CC). Additionally, five proteins, including C4J056, Q41815, A0A1D6EL85, A0A1D6JVU0, and A0A1D6ELB5, were related to five pathways (Table S7), including phosphonate and phosphinate metabolism, protein processing in the endoplasmic reticulum, zeatin biosynthesis, fatty acid elongation, and N-glycan biosynthesis. These results show that cadmium-related genes are associated with many biological processes in plants, particularly protein anabolism. Besides influencing protein anabolism, Cd accumulation in plants may be regulated by other biological processes (Tables S6 and S7), such as defense response and fatty acid synthesis.
Proteins are the executors of life functions; therefore, understanding the relationships among the 45 identified proteins will help clarify the molecular mechanisms of Cd action in plants. Therefore, we analyzed the interactions of these 45 proteins. Out of these, 38 proteins (Figure 2) were identified, and their three-dimensional structures were shown using the STRING database. The results indicated that only three proteins, COPCL2, B4FGC8, and A0A1D6ELB2, had interaction potential, while the other proteins were relatively independent. Additionally, we classified the 38 proteins and found that they could be divided into three categories (Figure 2) using K-MEAN clustering via STRING software. This analysis revealed that the 38 proteins could be classified into three subgroups: yellow (containing 14 proteins), red (14 proteins), and blue (10 proteins). This classification provides a basis for the subsequent selection of representative candidate proteins.

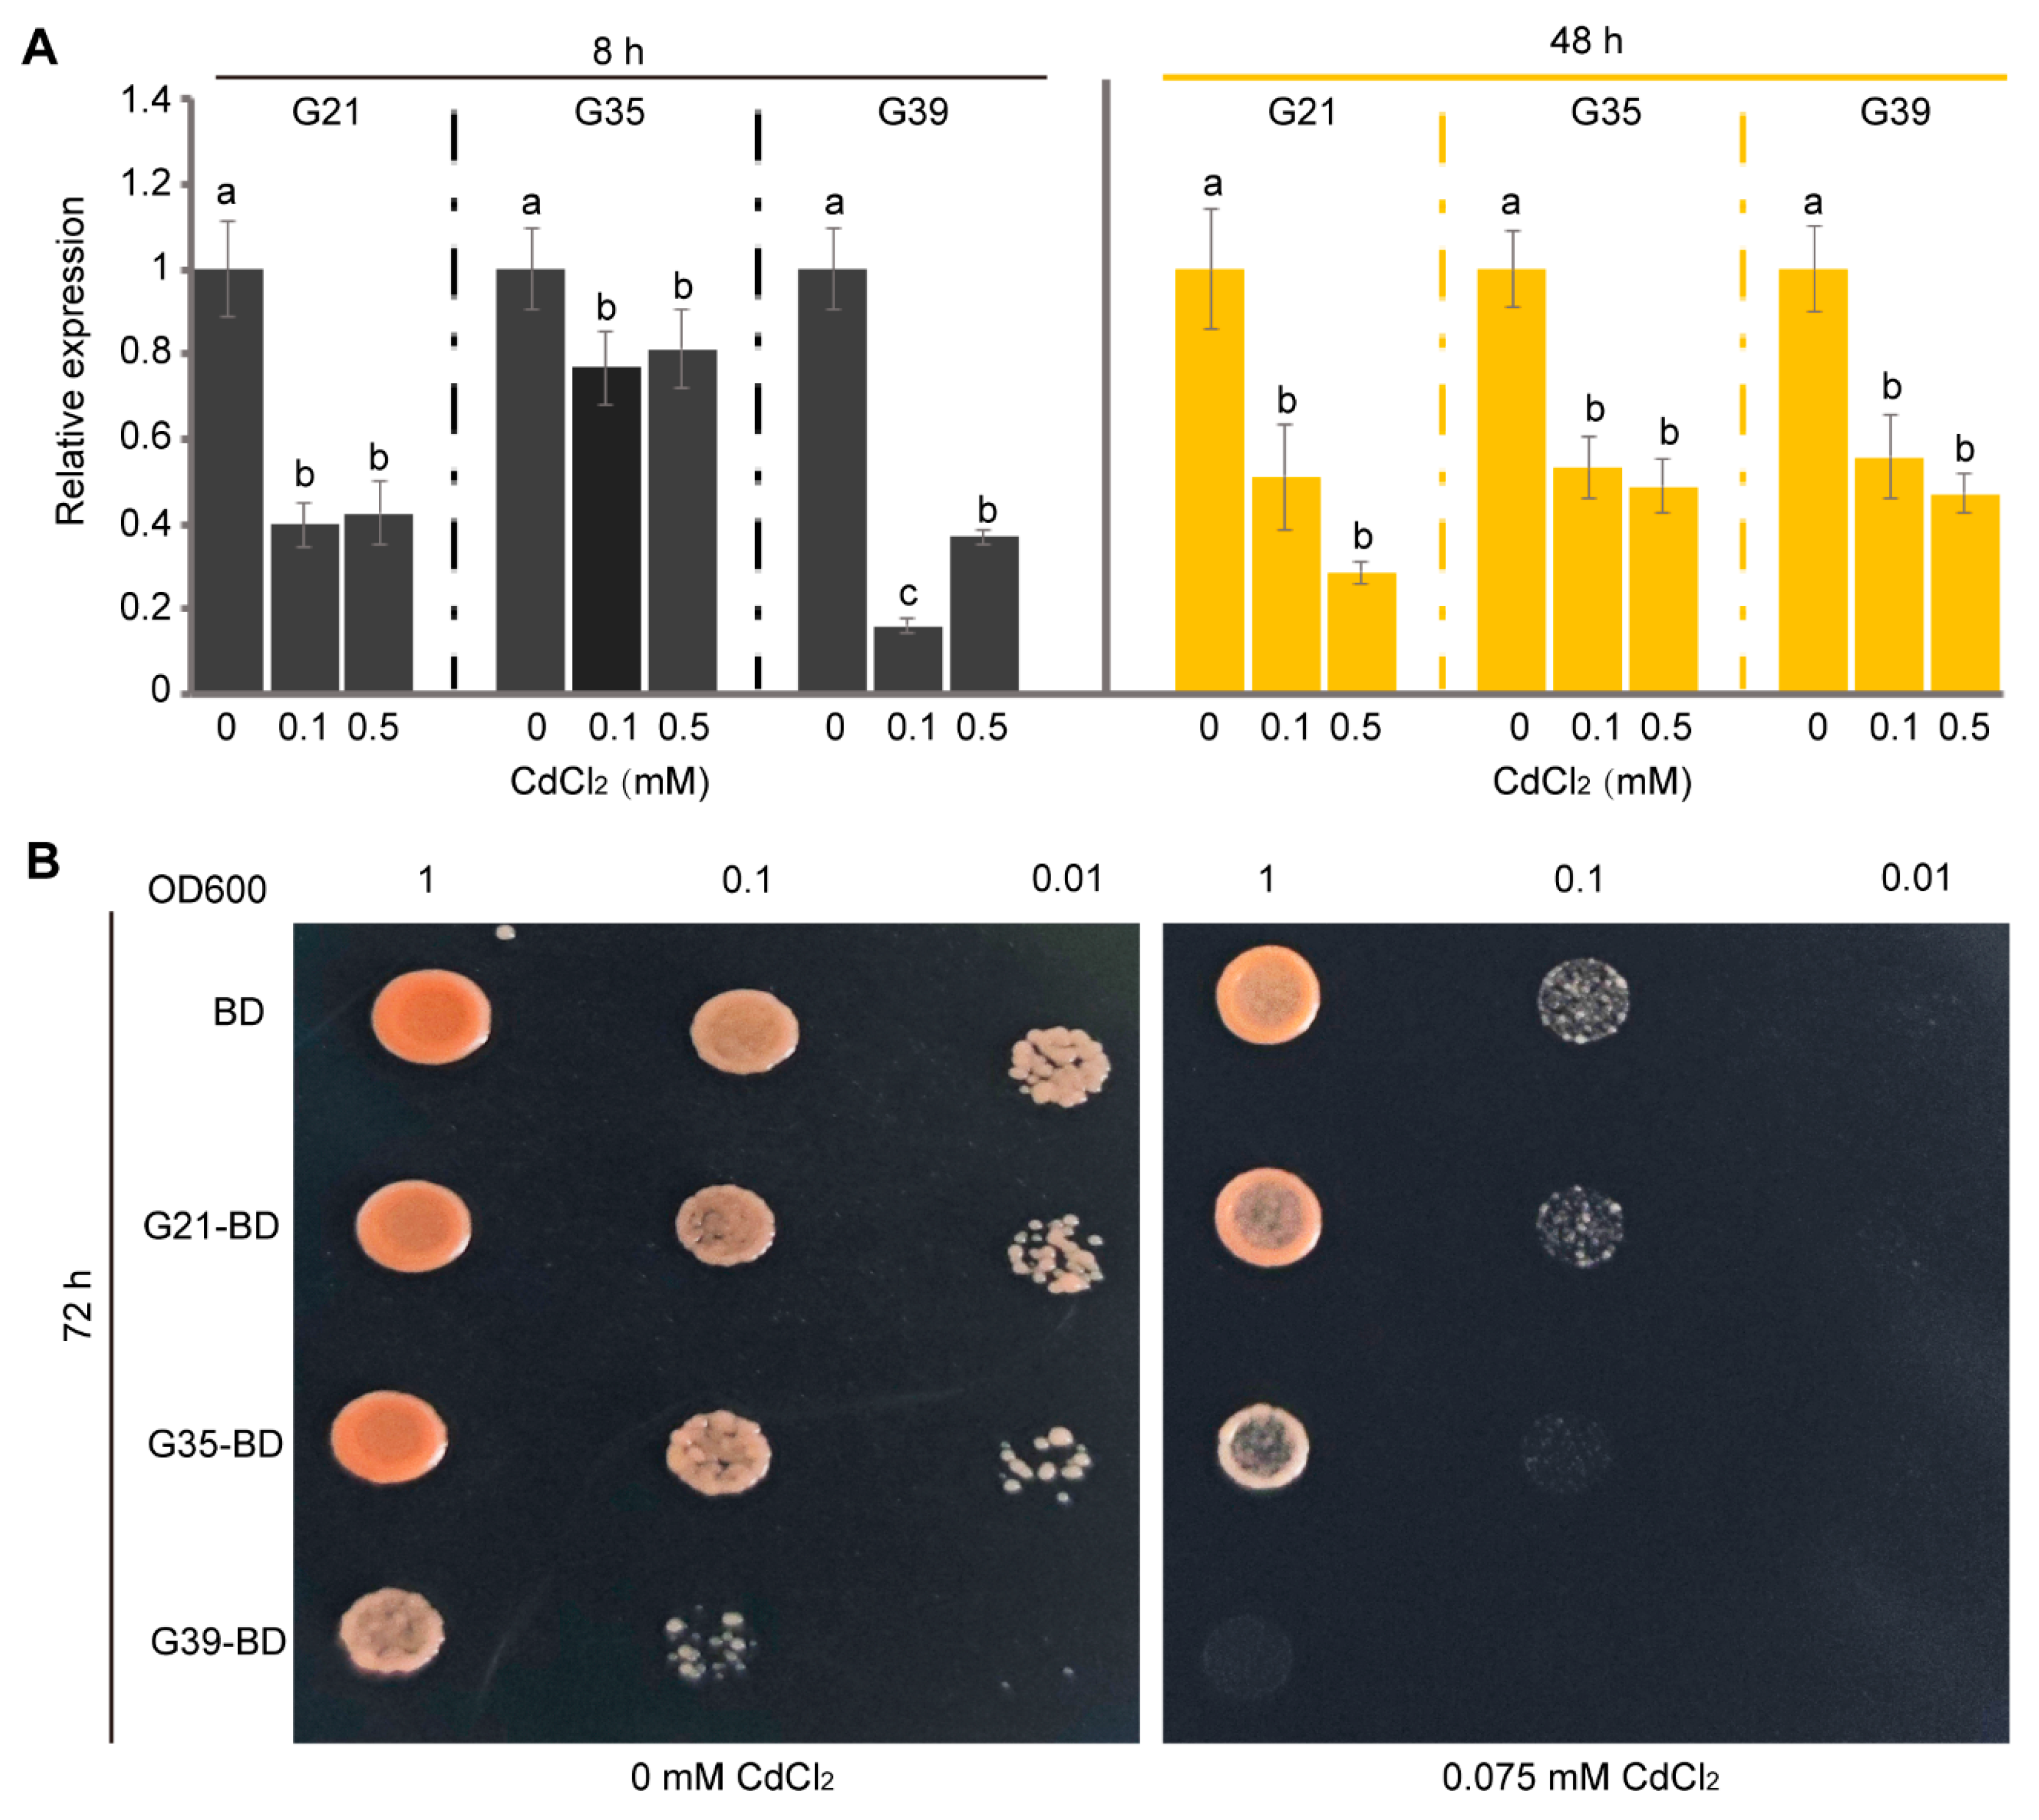
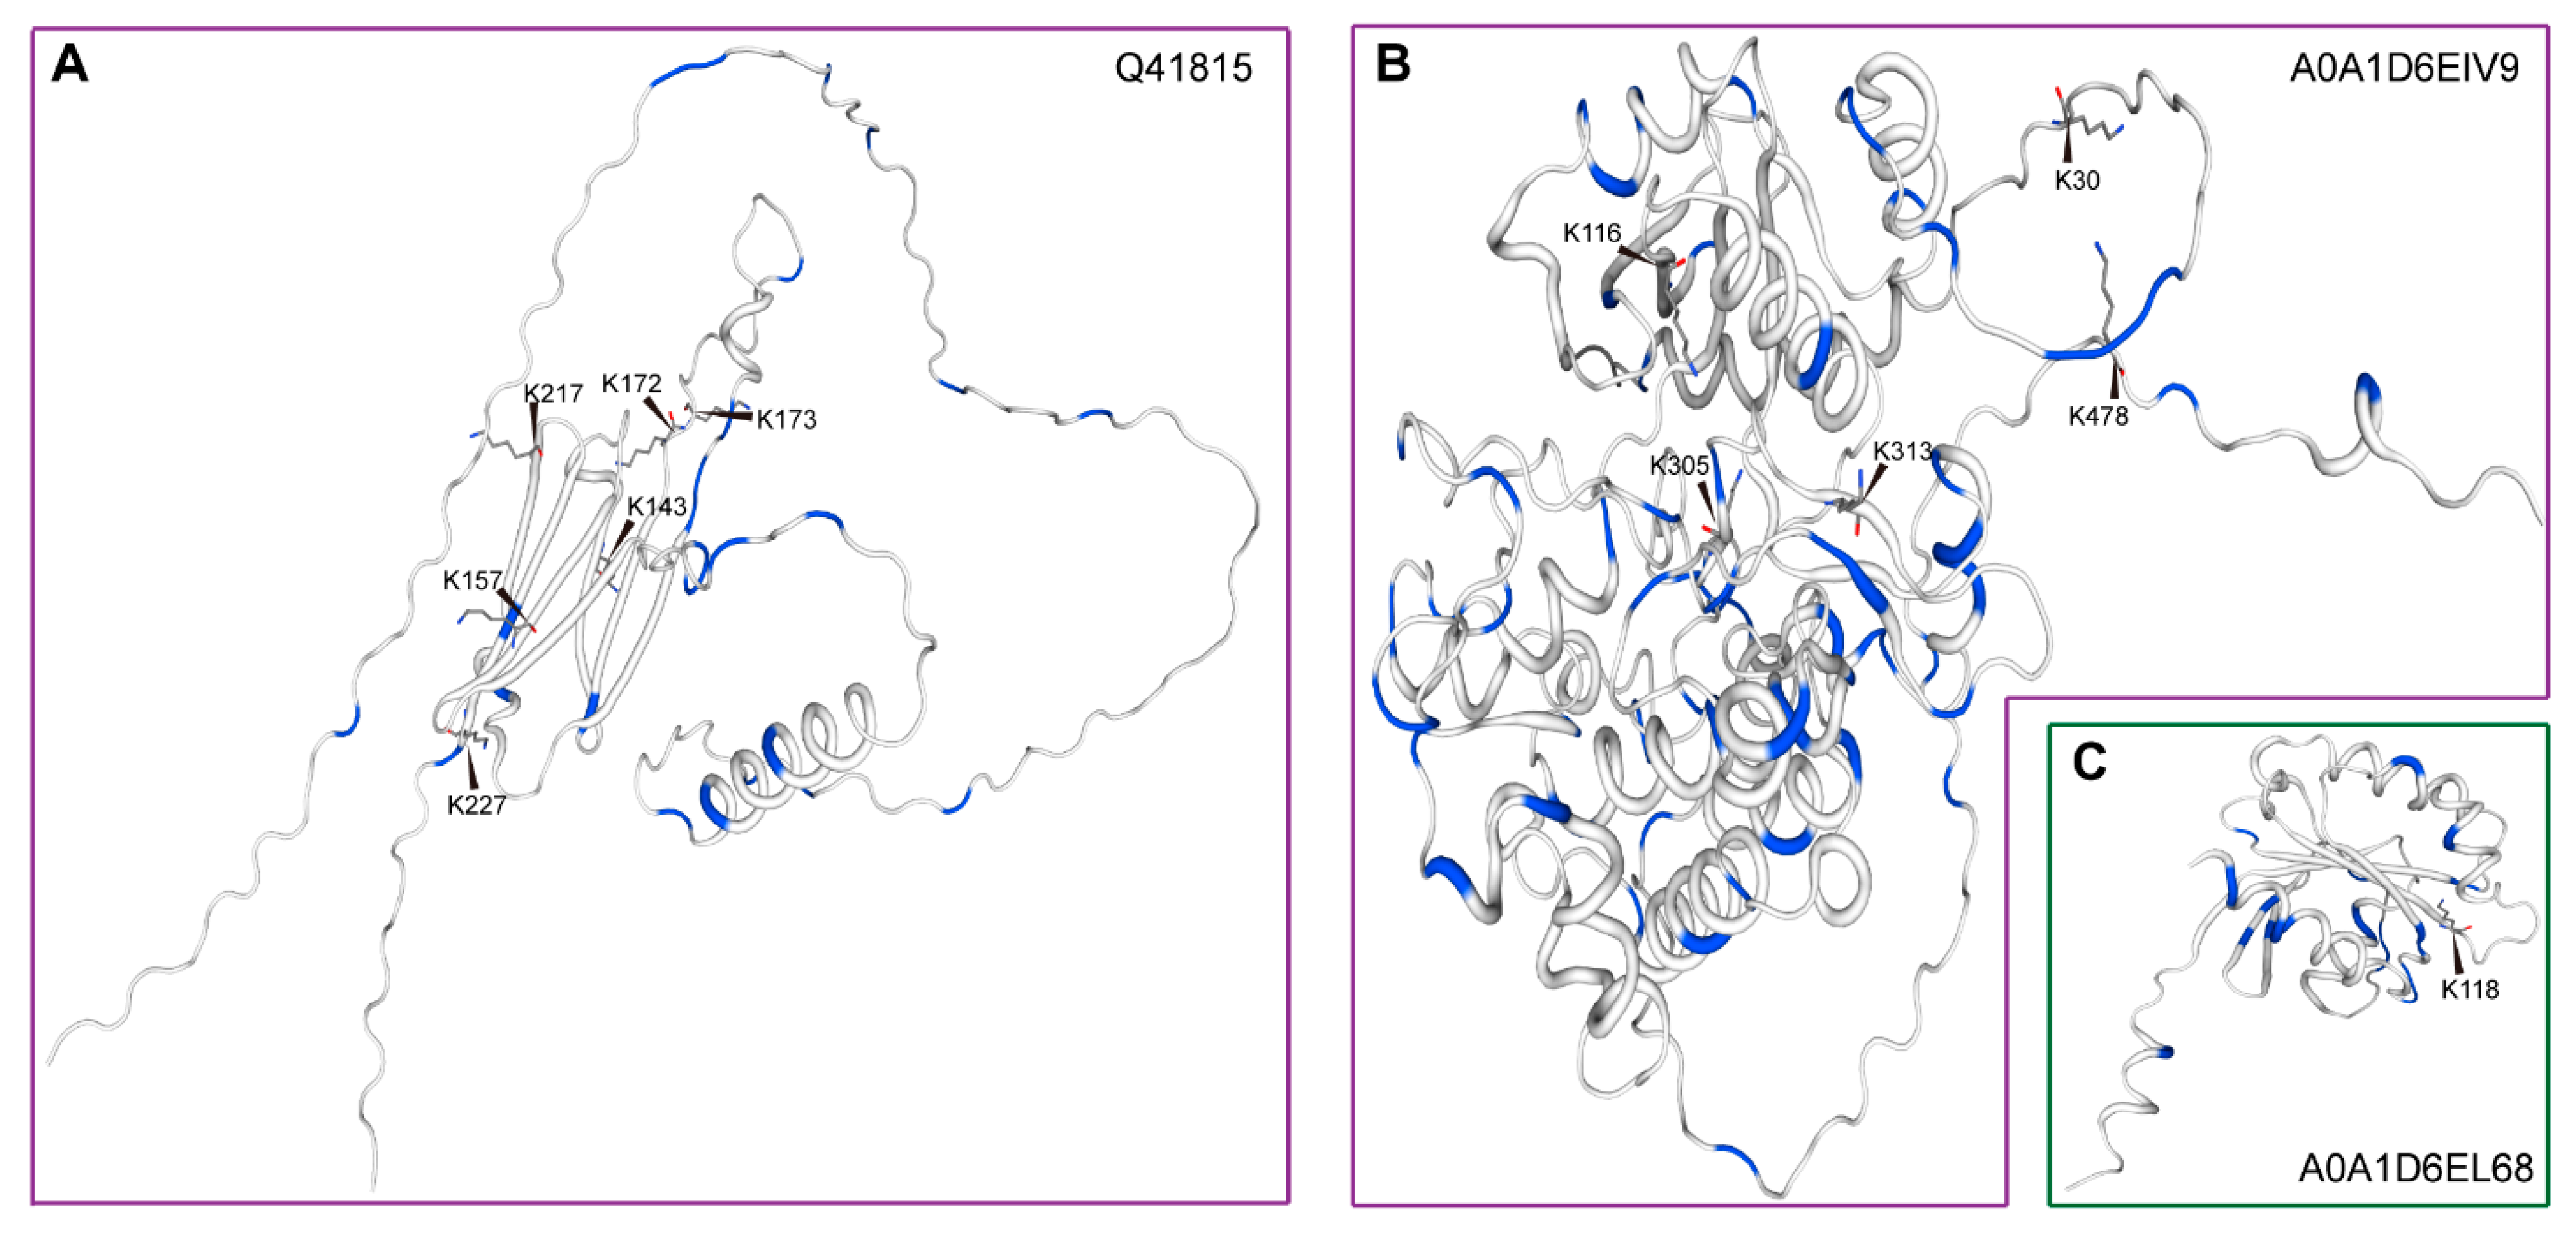
3.4. Gene Expression Profiles, Yeast Cadmium Tolerance, and Post-Translational Modifications Prediction

The expression profile of genes can reflect their participation in life activities [23]. Hence, to understand the response of the 45 genes to Cd stress, we performed RT-qPCR. The results showed that only three candidate genes did not show significant changes in expression levels induced by Cd stress, whereas the remaining 42 genes could be induced to some extent by Cd stress at a certain period and/or different concentrations to show significant changes (Table S8). Among them, 18 candidate genes were significantly downregulated, and 6 candidate genes were significantly upregulated in 0.1 mM and 0.5 mM CdCl2 at 8 h (Table S8). In addition, a total of 10 candidate genes were significantly downregulated in 0.1 and 0.5 mM CdCl2 after 48 h of treatment, while a total of 4 candidate genes were significantly upregulated (Table S8).
It is worth noting that the expression levels of three candidate genes (Figure 3A, Table S8) were significantly downregulated after treatment with 0.1 μM and 0.5 μM CdCl2 for both 8 and 48 h these genes were Zm00001eb093750 (G21), Zm00001d028408 (G35), and Zm00001d005231 (G39). This indicates that G21, G35, and G39 respond to multi-stage cadmium stress, and their expression levels are negatively regulated by high concentrations of cadmium. It is speculated that these genes contribute to Cd absorption, and plants choose to reduce their expression levels to avoid Cd toxicity.
To further understand the response of these three genes to cadmium, this study overexpressed them separately in yeast AH109. AH109 containing these genes grew worse than AH109 without these genes in an environment of 0 μM CdCl2, especially G39 (Figure 3B). More importantly, when treated with 0.075 mM CdCl2, AH109 with these genes showed a more significant difference in growth compared to AH109 without these genes, particularly G35 and G39 (Figure 3B). This indicates that the overexpression of these three genes placed a burden on yeast, resulting in a more significant toxic phenotype under cadmium stress. These genes can be used as important genes for optimizing crop Cd tolerance in the future.
In addition, proteins often rely on post-translational modifications during their functional execution. Interestingly, the three typical candidate gene-expressed proteins identified in this study, namely Q41815 (Zm00001d028408), A0A1D6EIV9 (Zm00001eb093750), and A0A1D6EL68 (Zm00001d005231), all belong to potential SUMOylation substrates. Among them, Q41815 was identified to have SUMOylation in previous studies [23] and SUMOylation can also be predicted for A0A1D6EIV9 and A0A1D6EL68, respectively. They showed high potential SUMOylation sites (Figure 4A–C), with six sites (K143, K157, K172, K173, K217, and K227) in the protein Q41815 (Figure 4A), five sites (K30, K116, K305, K313, and K478) in A0A1D6EIV9 (Figure 4B), and one site (K118) in A0A1D6EL68 (Figure 4C). Fascinatingly, their SUMOylation sites are concentrated in three-dimensional structures, indicating there may be some mutual regulation between these sites. A0A1D6EIV9 is a potential serine/threonine protein kinase, suggesting that serine/threonine phosphorylation may also be an important post-translational modification involved in plant Cd accumulation. Therefore, this study also annotated the positions of the serine/threonine residues present in their three-dimensional structures. The results showed that these amino acids are widely distributed throughout various parts of the proteins (Figure 4A–C). Overall, it is suggested that the functions of these three proteins are highly likely to be influenced by SUMOylation. Moreover, serine/threonine phosphorylation may also be an important regulatory factor, thereby regulating Cd accumulation in plants.

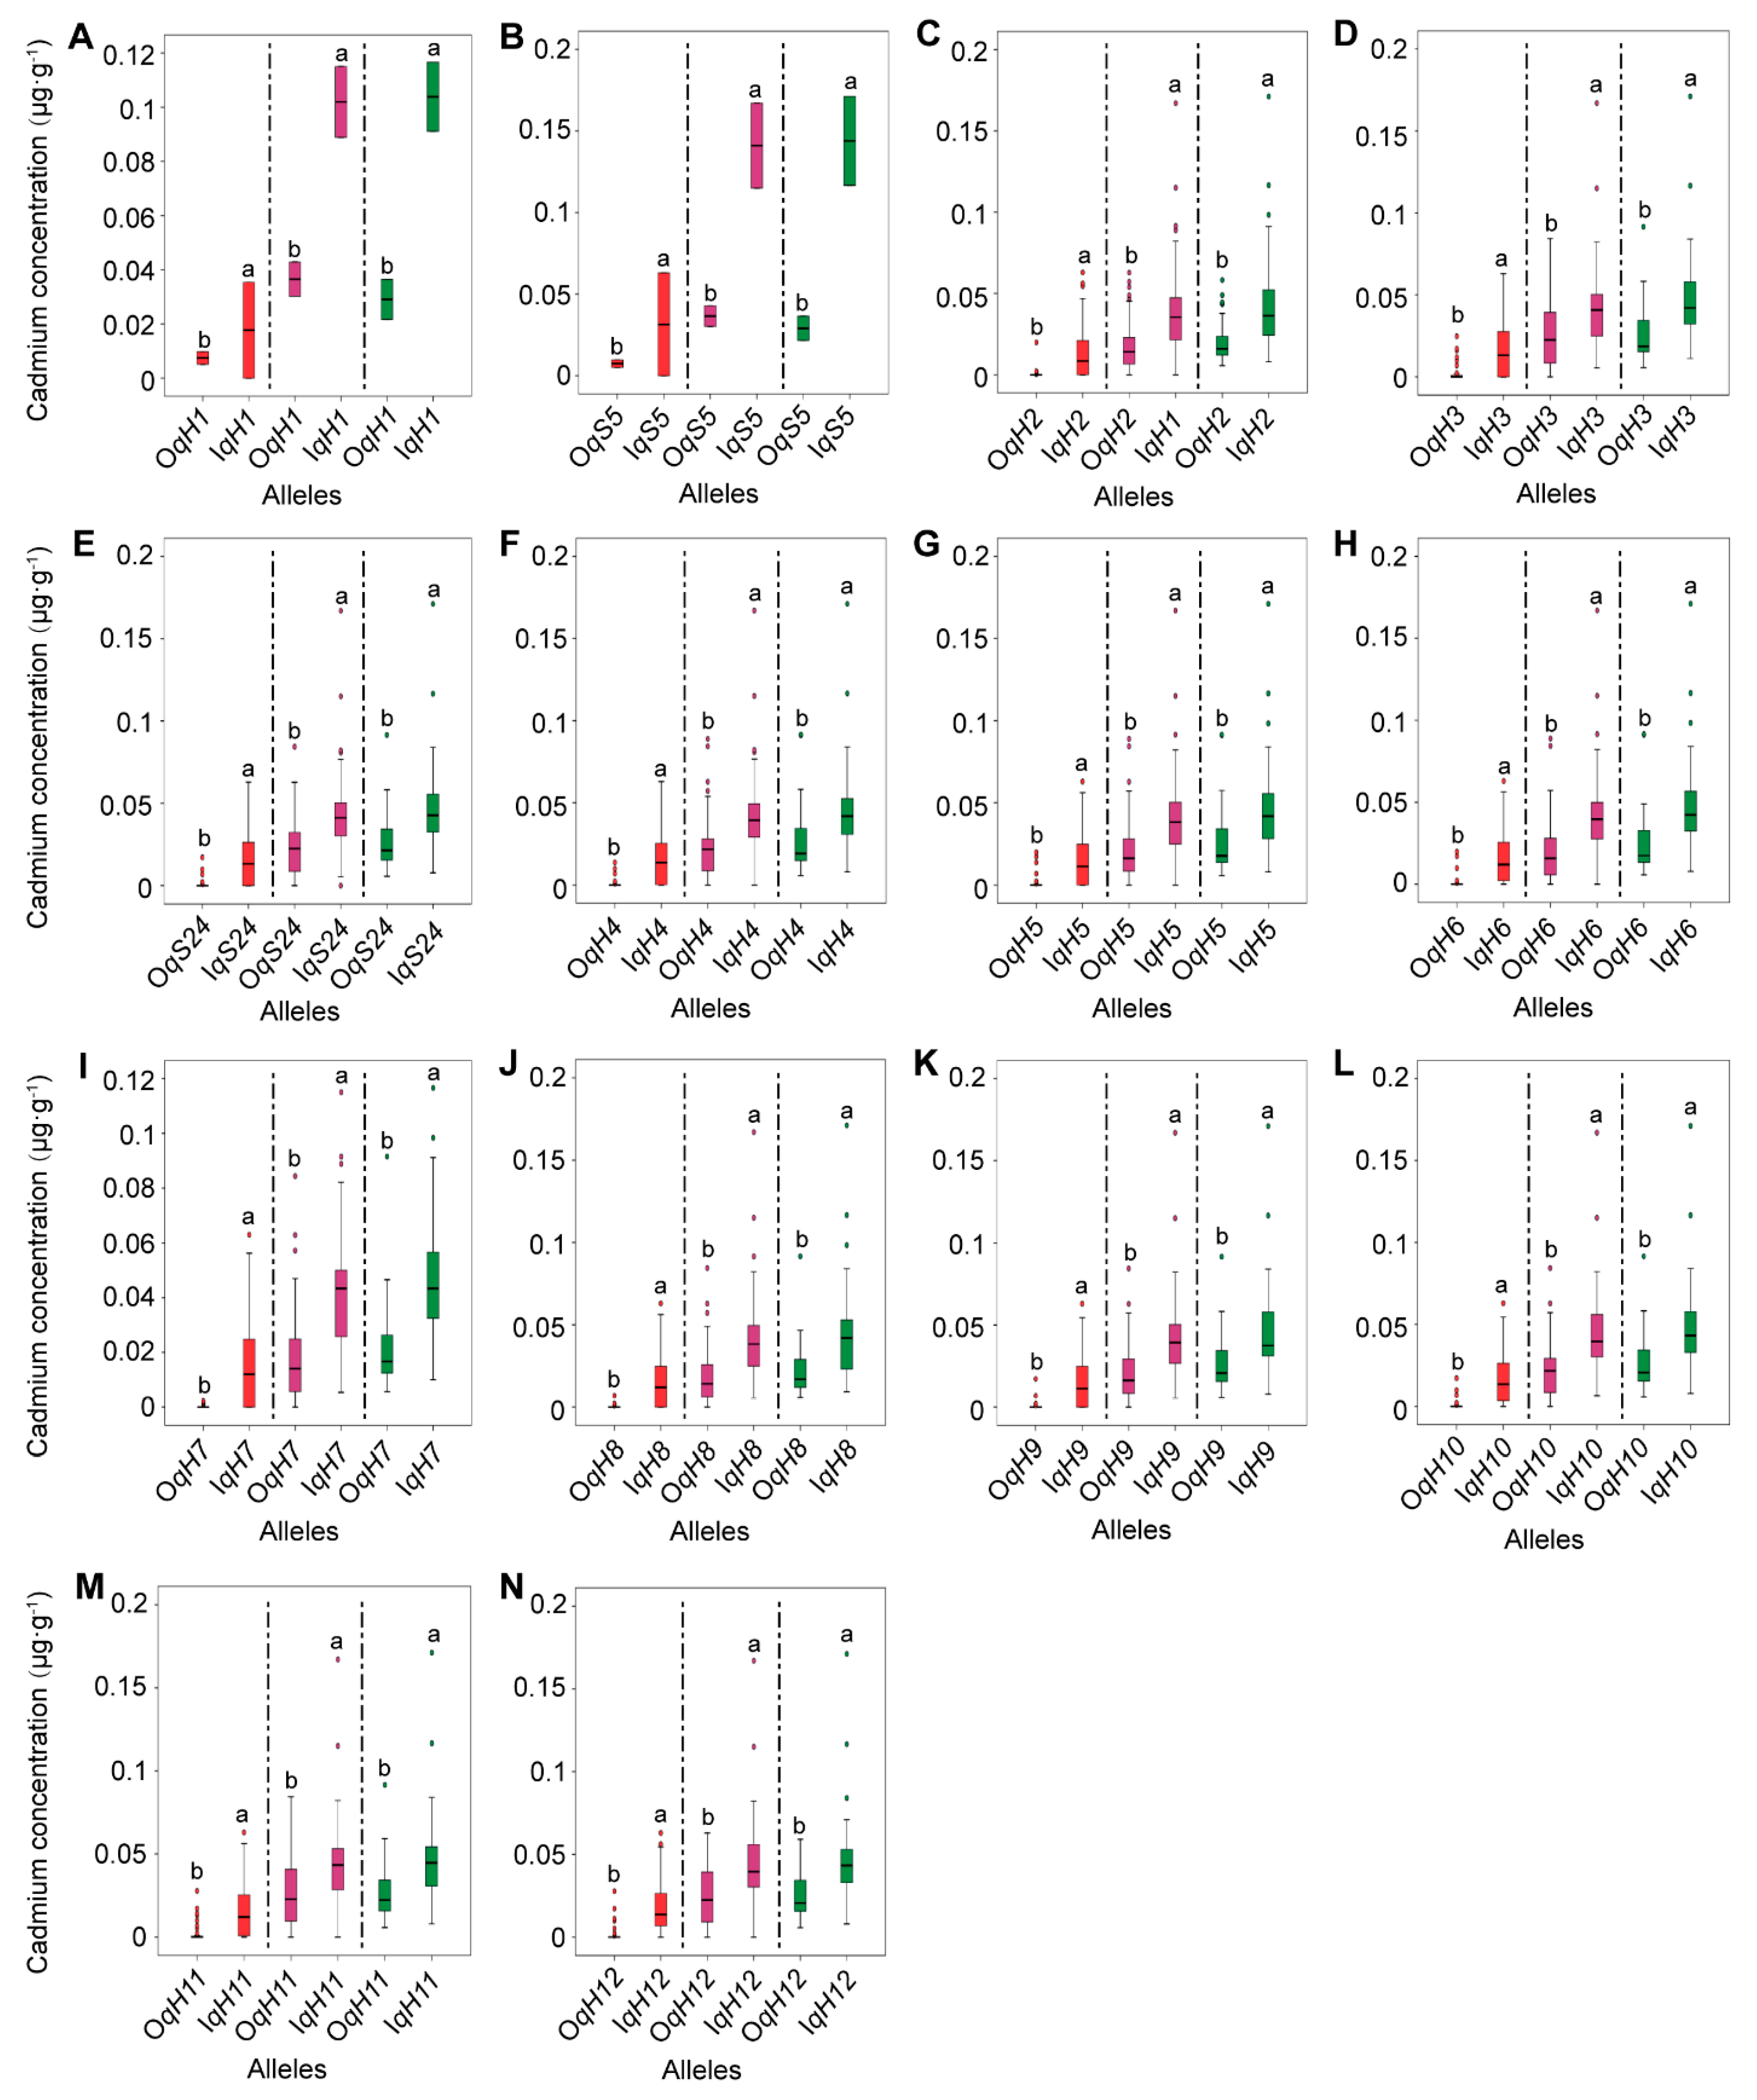
3.5. Distribution of Superior Alleles and Hybrid Combination Prediction

In this study, 126 reliable QTNs were identified to understand the allelic variations in these loci. Different allelic variation sites in a single QTN were used to classify 170 samples and calculate their phenotypic effect values. For example, there were two allelic variations (CC and TT) in QTN S1. The mean Cd concentration of the materials with CC and TT at this position was calculated, and subsequently, the mean Cd concentration of the total materials was subtracted. Finally, the mean phenotype effect values of alleles with CC and TT were 0.05709 µg·g−1 and −0.00092 µg·g−1 across the three environments, respectively. Therefore, TT tends to reduce the accumulation of cadmium in maize grains. Thus, “T” can be judged as an excellent allelic variation and “C” as an alternative allelic variation. Finally, the 126 excellent allelic variants obtained in this study tended to reduce Cd accumulation in maize grains, while the alternative allelic variants were associated with an increased risk of Cd accumulation (Table S9).
In addition, due to the strong linkage among these 126 QTNs, 12 haplotype blocks, and 2 single QTNs were formed, which were classified as 14 QTLs. Thus, it would be more representative and efficient to discover the excellent haplotypes of the 12 haplotype blocks and the excellent allelic variation from the two single QTNs for screening excellent candidate materials. According to the phenotypic effects of 126 different allelic variants of QTNs, 12 excellent haplotypes and two excellent allelic variants were obtained. These were, respectively: “T G C C” (corresponding QTL was qH1; the mean phenotypic effect value was −0.00092 in three environments), “T T A T A T T T T G T C T A” (qH2; −0.00968 µg·g−1), “T A A T” (qH3; −0.0056 µg·g−1), “C C” (qH4; −0.0068 µg·g−1), “C C” (qH5; −0.00712 µg·g−1), “C C G” (qH6; −0.00757 µg·g−1), “C T” (qH7; −0.0088 µg·g−1), “T G G G” (qH8; −0.00868 µg·g−1), “A C G C T T C C G T C C G A T G C G G G T C G T G C C T T A G C G G T A T C T C” (qH9; −0.0071 µg·g−1), “A T G G T G T G A G A A C C G G T” (qH10; −0.00652 µg·g−1), “G C T T G T T G C” (qH11; −0.00601 µg·g−1), “A G G T G A A A C C C T A A C A A C G C T G G” (qH12; −0.0069 µg·g−1), “C” (qS5; −0.00135 µg·g−1), and “C” (qS24; −0.0065 µg·g−1).
These excellent haplotypes and allelic variants tend to reduce Cd toxicity in plants, whereas the alternative haplotypes and allelic variants tend to accumulate Cd in maize grains (Figure 5; Table S10), which is not conducive to healthy food production. For example, the alternative haplotype of qH1 is “C A T T,” with a phenotypic effect value of 0.05709 µg·g−1, while the alternative allelic variant of qS5 is “T,” with a phenotypic effect value of 0.08473 µg·g−1. Notably a negative correlation was detected between the number of superior alleles (involving 12 excellent haplotypes and two excellent allelic variants) and cadmium concentration in HN (r = −0.52, p ≤ 1.98 × 10⁻¹²) (Figure 6A), in JMO (r = −0.35, p ≤ 2.00 × 10⁻⁶) (Figure 6B), and in JMT (r = −0.39, p ≤ 4.60 × 10⁻⁵) (Figure 6C). Thus, these superior alleles can be used in molecular-assisted breeding for Cd resistance in maize based on these results.
Cd accumulation not only causes plant toxicity, resulting in reduced production, but also increases the risk of disease caused by the human consumption of Cd-contaminated grain. Therefore, it is of great significance to select crops with low Cd accumulation and reduce the Cd content in the grain. Hence, this study used the 12 excellent haplotypes and two excellent allelic variants discovered to screen low-cadmium materials in the population. The results showed that the cadmium concentration of 12 materials (Table S11) in the three environments was less than 0.01 µg·g−1, far lower than the limit of cadmium concentration in agricultural products stipulated by the European Food Safety Authority (EFSA) (≤0.05 µg·g−1). Among them, CAU37, CAU189, CAU211, CAU266, and CAU301 contained 12 excellent haplotypes and two excellent allelic variants. The average Cd concentrations in the three environments were 0.00936 µg·g−1, 0.00399 µg·g−1, 0.00189 µg·g−1, 0.00253 µg·g−1, and 0.00365 µg·g−1, respectively. CAU95 (with an average cadmium concentration of 0.00282 µg·g−1) and CAU432 (0.00575 µg·g−1) contained 11 excellent haplotypes and two excellent allelic variants. CAU65 (0.00578 µg·g−1) contained 10 excellent haplotypes and two excellent allelic variants. CAU403 (0.00492 µg·g−1) contained nine excellent haplotypes and two excellent allelic variants. CAU134 (0.00492 µg·g−1) and CAU159 (0.00530 µg·g−1) both contained eight excellent haplotypes and two excellent allelic variants, while CAU398 (0.00499 µg·g−1) contained the least number of these excellent haplotypes and allelic variants, with four and one respectively.
In addition, cadmium generally has no specific transporter in plants and often follows the bivalent cations necessary for plants in the form of free riding into the body, such as manganese (Mn) and iron (Fe), which causes cadmium poisoning and cadmium pollution in grain. However, Mn and Fe are essential trace elements for plants; therefore, in the process of selecting and breeding low-Cd materials, it is important to ensure that these materials also absorb these elements favorably. Therefore, based on the 8 Mn-efficient and 10 Fe-efficient QTNs found in our previous studies [19], further evaluation of the 12 materials in this study revealed that CAU95 contained only one of the 8 Mn-efficient QTNs (qMn-7). The average Mn content in the three environments (10.58080 µg·g−1) was much higher than that in the other 11 materials (4.83712 µg·g−1 to 9.55880 µg·g−1; the mean value was 7.19525 µg·g−1). However, CAU65, containing two QTNs (qFe-6a and qFe-6b), which belonged to a haplotype with r2 = 1, and CAU266 with one QTN (qFe-7), showed a high Fe content. Their average Fe contents in the three environments were 54.48250 µg·g−1 (CAU65) and 63.93472 µg·g−1 (CAU266), respectively, which approached or surpassed the Consultative Group on International Agricultural Research (CGIAR) target of 60 µg·g−1 of iron content for maize grains in the biofortification challenge of 2004. Therefore, to select comprehensive green materials with low Cd efficiency as well as high Mn and Fe efficiency sites at the same time, the following two hybrid combinations, namely CAU95×CAU65 and CAU95×CAU266, can be preferentially formulated for breeding. The resulting offspring were expected to contain 12 excellent haplotypes and two excellent allelic variations in all the low cadmium trends in this study and contain 1 Mn high-QTN site with 1 or 2 Fe high-QTN sites, respectively (Table 2).

4. Discussion

Cadmium is a first-class carcinogen. Contamination of crops not only affects their growth and development but also poses a serious threat to human health once consumed [26]. Therefore, this study focused on Cd content in maize kernels. Through the analysis of cadmium content in 170 maize kernel samples from three environments, it was found that the variation rate of this population was greater than 75%, indicating rich variation. Additionally, the interaction between plant genotypes and growing conditions plays a critical role in determining the accumulation of heavy metals in crops [26]. Our analysis of the interaction between genes and environments found that Cd accumulation is not only significantly influenced by genes, but also greatly influenced by the environment.
We observed no significant difference in Cd content when the population was planted at the same experimental site in different years; however, significant differences were noted between different experimental sites. This highlights the importance of soil Cd content as a key determinant of Cd pollution in agricultural products. Similar environmental influences on metal uptake were reported by [27], who emphasized the significant role of soil composition and contamination levels on Cd accumulation in rice.
Further analysis of broad-sense heritability (H2 > 75.92%) demonstrated that Cd accumulation is strongly regulated by genetic factors, consistent with findings by [18], which reported high heritability for metal accumulation traits in rice. These results suggest that selective breeding is a viable strategy for reducing Cd levels in crops. The observed rich variation in Cd content within this population, driven by genetic factors, provides a strong foundation for identifying Cd-related gene loci and screening for low-Cd maize materials.
GWAS analysis identified a substantial number of quantitative trait nucleotides (QTNs) associated with Cd accumulation in maize. The detection of 8773 QTNs via MLM_Q+Kinship models and 2684 QTNs via MLM_PCA+Kinship models across the three environments underscores the complex genetic architecture governing Cd uptake and highlights the influence of environmental interactions on genetic expression related to Cd accumulation. This high number of QTNs aligns with the findings of [28], who reported a similarly complex genetic basis for heavy metal tolerance in plants. A key finding from our study was the identification of 126 QTNs consistently present across all environments, predominantly located on chromosomes 1 and 2. This suggests a possible genomic hotspot for Cd accumulation traits, a notion supported by similar research conducted by [29] on rice, who identified specific chromosomal regions associated with metal uptake. Linkage disequilibrium analysis further refined our understanding of the genetic control of Cd accumulation by identifying 14 quantitative trait loci (QTLs) from the significant QTNs. The formation of haplotypes, such as H1 on Chr.1 and multiple haplotypes on Chr.2, indicates regions with tightly linked genes potentially involved in Cd uptake and transport mechanisms. This discovery is particularly significant, as it opens avenues for marker-assisted selection in breeding programs aimed at reducing Cd content in maize grains, echoing the strategies proposed by [29] for improving crop resilience to abiotic stresses.
The identification of nine QTNs consistent across different models and environments underscores their robustness as candidate loci for functional validation. The convergence of results from multiple analytical approaches bolsters the credibility of these QTNs as critical genetic markers for Cd accumulation, mirroring the multi-model GWAS strategy employed by [30], which emphasized cross-validation for reliable marker identification in complex traits. The establishment of 14 QTLs through linkage disequilibrium analysis further enhances our genetic understanding of Cd accumulation and provides a valuable resource for developing low-Cd maize varieties. These QTLs hold significant potential as molecular markers for selective breeding, marking a substantial step toward sustainable agriculture by reducing Cd exposure in the food chain.
The screening of candidate genes near the 14 identified QTLs revealed 45 genes potentially involved in Cd accumulation. Expanding the search to ±100 kb from the QTLs highlights the complexity of pinpointing specific genes for such traits, reflecting the intricate polygenic control of metal uptake in plants. This methodology aligns with [31], who extended gene search ranges to capture distant regulatory elements influencing trait expression.
The identification of three candidate genes (Zm00001eb093750, Zm00001d028408, and Zm00001d005231) as putative SUMOylation substrates provides important insights into their potential roles in Cd sensitivity and tolerance. SUMOylation, a post-translational modification, regulates various cellular processes, including stress responses, by influencing protein stability, localization, and interactions. The clustering of SUMOylation sites within the three-dimensional structures of these proteins suggests regulatory mechanisms that could modulate their function under Cd stress. For example, Zm00001d028408, a serine/threonine protein kinase, may play a role in signaling pathways that regulate metal ion transport or sequestration, similar to observations in Arabidopsis where SUMOylation has been linked to heavy metal detoxification.
Comparisons of homologous genes in Cd hyperaccumulators, such as Thlaspi caerulescens and Sedum alfredii, may offer further insights. Hyperaccumulators often exhibit enhanced SUMOylation or specific regulatory adaptations that improve their Cd tolerance. Exploring the SUMOylation patterns of these homologous genes could reveal key differences that enhance protein stability or activity under high Cd conditions. Such insights could guide future breeding strategies, including modifications to SUMOylation sites or the targeted expression of SUMOylated variants of these genes, to develop maize varieties with improved Cd tolerance and reduced accumulation.
GO and KEGG pathway analyses revealed the functional aspects of the identified candidate genes, highlighting their involvement in various biological processes, molecular functions, and cellular components, particularly those related to protein synthesis and transport. The association of these genes with processes such as tRNA modification and alternative mRNA splicing suggests a complex regulatory mechanism of Cd response at the transcriptional and post-transcriptional levels, similar to findings reported by [32] in their study on metal stress response in Arabidopsis.
The identification of pathways related to phosphonate and phosphinate metabolism, protein processing in the endoplasmic reticulum, and N-glycan biosynthesis further illustrates the multifaceted impact of Cd stress on plant cellular and metabolic processes. These pathways are crucial for plant growth and stress response, indicating that Cd accumulation might interfere with essential physiological functions, a concept supported by the research of [33] on the systemic effects of heavy metals on plant metabolism.
An interaction analysis of the 45 proteins encoded by the candidate genes revealed limited direct interactions, with only 3 proteins showing potential interactions. This suggests that the proteins involved in Cd accumulation may function independently or within different complexes, highlighting the complexity of the molecular mechanisms underlying Cd uptake and sequestration in plants. Similar assumptions were drawn by [34], who reported a lack of direct interactions among key proteins involved in arsenic detoxification in soybeans, suggesting a modular approach to heavy metal stress management in plants.
RT-qPCR analysis of the 45 candidate genes identified through our screening process has provided pivotal insights into the dynamic nature of the plant’s response to Cd stress. The observation that 42 of the 45 genes exhibited significant changes in expression levels under Cd stress underscores the sensitivity of these genes to metal stress, highlighting their potential roles in Cd response mechanisms. This extensive alteration in gene expression is consistent with findings from [35], who reported widespread transcriptomic changes in maize under various abiotic stresses, including heavy metals.
The differential expression patterns, with 18 genes being downregulated and 6 upregulated in the initial 8-h exposure to Cd, reflect the complex regulatory networks plants deploy in response to metal stress. Downregulation of a substantial number of genes may indicate a protective mechanism that mitigates the toxic effects of Cd by reducing the expression of genes potentially involved in Cd uptake or transport. This hypothesis is supported by research from [31], which found that plants often downregulate metal transporter genes as an initial response to heavy metal exposure to limit metal uptake. The sustained response observed at 48 h, with additional genes being both upregulated and downregulated, suggests a phase-dependent adjustment to prolonged Cd exposure. This temporal regulation of gene expression highlights the adaptability of the plant’s stress response mechanisms, a phenomenon similarly observed in rice by [36] under arsenic stress. Particularly noteworthy is the response of four candidate genes (G21, G35, and G39), which were consistently downregulated across different Cd concentrations and exposure durations. The consistent downregulation of these genes at both low and high Cd concentrations suggests their direct involvement in plant defense strategies against Cd toxicity, possibly by limiting Cd uptake or translocation within the plant. This targeted reduction in gene expression as a defense mechanism against metal toxicity has been documented in studies such as those by [37], which highlighted the role of specific genes in modulating metal tolerance and accumulation in plants.
The expression profiles of these candidate genes under Cd stress not only validate their potential involvement in Cd response pathways but also open avenues for detailed functional characterization. Understanding the precise roles of these genes, whether in metal uptake, sequestration, or detoxification, is crucial for unraveling the molecular basis of Cd tolerance and accumulation in maize. Future studies should focus on functional validation through gene knockout or overexpression to elucidate the specific contributions of these genes to Cd tolerance mechanisms.
More importantly, the distinction between alleles that contribute to lower Cd accumulation (‘superior’) versus those associated with higher accumulation (‘alternative’) is a critical step toward developing maize varieties with reduced Cd content. This approach is in line with the strategy adopted by [38], who utilized allele-specific markers to breed low-arsenic rice varieties. The identification of 126 reliable QTNs and the subsequent classification of superior and alternative allelic variations in this study are significant. The discovery of 12 excellent haplotypes and two excellent allelic variants associated with reduced Cd accumulation provides a robust genetic framework for screening and selecting low-Cd maize lines. This finding is particularly relevant given the stringent regulations on Cd levels in agricultural products, such as those set by the European Food Safety Authority (EFSA). The ability to identify maize materials with Cd concentrations (less than 0.01 µg·g−1) far below these regulatory limits underscores the potential of genetic selection as a tool for enhancing food safety and reducing health risks associated with Cd exposure.
The practical application of these genetic insights is exemplified by the prediction of hybrid combinations that leverage superior allelic variants for low Cd accumulation. The proposed hybrids, CAU95×CAU65 and CAU95×CAU266, represent targeted breeding strategies aimed at combining traits of low Cd accumulation with other desirable agronomic properties such as high manganese (Mn) and iron (Fe) content. This holistic breeding approach not only addresses the issue of Cd toxicity but also contributes to the biofortification of maize, enhancing its nutritional value. Furthermore, the mention of the nonspecific transport mechanism of Cd in plants highlights the complexity of breeding for low Cd accumulation. The ability of Cd to ‘hitchhike’ with essential bivalent cations such as Mn and Fe in plant tissues presents a challenge to breeding efforts, necessitating a careful balance between reducing Cd uptake and ensuring adequate micronutrient levels. This dual focus is crucial for developing crop varieties that are safe for consumption without compromising their nutritional value.
Overall, our comprehensive investigation revealed the intricate interplay between genetic and environmental factors in determining cadmium (Cd) accumulation in maize. The significant variability in Cd content across different environments and the observed genotype-by-environment interactions highlight the potential of strategic breeding and environmental management to mitigate Cd accumulation. Our genome-wide association studies (GWAS) and linkage disequilibrium analyses delineated a complex genetic landscape underpinning Cd accumulation, identifying key quantitative trait nucleotides (QTNs) and quantitative trait loci (QTL) that lay the groundwork for future breeding efforts aimed at reducing Cd levels in maize, thereby enhancing food safety.
Furthermore, the screening of candidate genes and their functional analyses through Gene Ontology (GO) and Kyoto Encyclopedia of Genes and Genomes (KEGG) pathways have unveiled potential molecular players and pathways involved in Cd uptake and response. These insights are crucial for the functional validation and characterization of the identified genes, paving the way for the development of Cd-tolerant maize varieties using advanced genetic engineering and marker-assisted selection techniques. Expression profile analysis under Cd stress has underscored the responsiveness of certain genes to heavy metal exposure, particularly those that exhibit consistent downregulation. These genes have emerged as promising targets for engineering Cd tolerance, potentially through the modulation of gene expression to enhance plant resilience to Cd stress.
Moreover, the identification of superior allelic variants and prediction of hybrid combinations with low Cd accumulation capabilities mark a significant advancement in the genetic improvement of maize for food safety. The proposed hybrids not only reduced Cd risk, but also improved micronutrient profiles, aligning with the goals of agricultural sustainability and public health. Future research should focus on the experimental validation of these hybrid combinations in field trials and delve deeper into the genetic, molecular, and physiological mechanisms underlying Cd uptake and accumulation in maize. Such studies will not only confirm the practical applicability of our findings but also contribute to the broader objectives of producing safer, more nutritious maize varieties suited to the challenges of modern agriculture and food security.

5. Conclusions

In conclusion, our comprehensive GWAS analysis utilizing MLM_Q+Kinship and MLM_PCA+Kinship models on 170 natural maize populations successfully identified a significant number of SNP loci associated with Cd content in maize grains across three different environments. Notably, 126 SNP loci were consistently associated with all environments, with a subset of 14 QTLs being particularly reliable across different analytical models. The identification of candidate genes in proximity to these loci and their subsequent functional annotation through GO and KEGG analyses underlines their potential involvement in critical biological functions and pathways related to cadmium uptake and accumulation. Our findings, particularly the significant differences in Cd content associated with certain SNP loci as revealed through ANOVA analysis, underscore the presence of stable genetic factors influencing Cd accumulation. The screening of maize materials harboring these stable loci has led to the identification of germplasms with inherently low Cd content, offering promising candidates for breeding programs aimed at reducing Cd levels in maize.
This study identified 126 reliable QTNs and 14 QTLs associated with Cd accumulation in maize, highlighting key loci for molecular-assisted breeding. Three candidate genes, Zm00001eb093750, Zm00001d028408, and Zm00001d005231, were identified as putative SUMOylation substrates, with potential roles in Cd sensitivity and tolerance. The discovery of superior allelic variants and haplotypes associated with reduced Cd accumulation provides valuable genetic markers for breeding low-Cd maize. Additionally, two proposed hybrids, CAU95×CAU65 and CAU95×CAU266, demonstrated the potential to combine low Cd accumulation with high nutrient efficiency (Mn and Fe). These findings offer practical tools for developing maize varieties that ensure food safety and meet nutritional needs, contributing to sustainable agriculture.

Supplementary Materials

The following supporting information can be downloaded at: https://www.mdpi.com/article/10.3390/agriculture15040389/s1, Figure S1: Box plot representing cadmium concentration (µg g⁻¹) across three different environments (HN, JMO, and JMT). The black horizontal line inside each box represents the median, while the whiskers indicate the data range, excluding outliers. Outliers are displayed as individual points. Different letters above the boxes (a, b) denote statistically significant differences among groups (p < 0.05), with JMO and JMT showing significantly higher cadmium concentrations compared to HN; Table S1: The information of primers; Table S2: Peak SNP (QTN) identifying via MLM_Q+Kinship model in different environments; Table S3: Peak SNP (QTN) identifying via MLM_PCA+Kinship model in different environments; Table S4: Reliable peak SNP (QTN) identifying via MLM_Q+Kinship or MLM_PCA+Kinship model in the three environments (HN/JMO/JMT); Table S5: Haloptype/QTN and QTL information; Table S6: ID information of 45 candidate genes and proteins; Table S7: The results of KEGG and GO analysis; Table S8: RT-qPCR results of 45 candidate genes; Table S9: Allelic variation of 126 QTNs and their phenotypic effect values; Table S10: Excellent or alternative haplotype/allele of 14 QTLs and their phenotypic effect value across three environments; Table S11: 14 QTLs information contained in 12 maize materials and their cadmium content across three environments.

Author Contributions

Y.Q., R.L., L.F. and X.X., designed the research; R.L., X.X., X.L., W.C. and X.Z. analyzed the data; R.L., X.X., Z.C. and L.F. wrote the paper; R.L., X.X., H.Z., Y.H., M.C., J.L., L.F. and Y.Q. carried out the experiments. All authors have read and agreed to the published version of the manuscript.

Funding

The project was supported by the National Natural Science Foundation of China (32072027), the Guangdong Province special projects in key fields of ordinary colleges and universities, the Guangdong Province key construction discipline research ability enhancement project (2022ZDJS023), the Key Research Project of Guangdong Provincial Department of Education (2022ZDZX4017), the Guangzhou Science and Technology Plan Project (SL2023A04J02318), and the Special Project for Rural Revitalization Strategy in Guangdong Province (2022-NPY-00-023-5).

Institutional Review Board Statement

All methods were performed in accordance with the relevant guidelines and regulations.

Data Availability Statement

The data presented in this study are available on request from the corresponding author. The data are not publicly available due to privacy concerns and ethical considerations regarding participant confidentiality.

Conflicts of Interest

The authors declare that they have no conflict of interest.

References

  1. Suleman, M.; Ashraf, M.; Raza, Q.U.A.; Bashir, M.A.; Rahman, S.U.; Aon, M.; Ali, S.; Shahzad, S.M.; Khalid, M.U.; Raza, H.M.A.; et al. Determining the Cadmium Accumulation in Maize (Zea mays L.) and Soil Influenced by Phosphoric Fertilizers in Two Different Textured Soils. Land 2022, 11, 1313. [Google Scholar] [CrossRef]
  2. Park, H.J.; Kim, S.U.; Jung, K.Y.; Lee, S.; Choi, Y.D.; Owens, V.N.; Kumar, S.; Yun, S.W.; Hong, C.O. Cadmium Phytoavailability from 1976 through 2016: Changes in Soil Amended with Phosphate Fertilizer and Compost. Sci. Total Environ. 2021, 762, 143132. [Google Scholar] [CrossRef] [PubMed]
  3. Shaari, N.E.M.; Tajudin, M.T.F.M.; Khandaker, M.M.; Majrashi, A.; Alenazi, M.M.; Abdullahi, U.A.; Mohd, K.S. Cadmium Toxicity Symptoms and Uptake Mechanism in Plants: A Review. Braz. J. Biol. 2024, 84, e252143. [Google Scholar] [CrossRef]
  4. Chen, Y.; Chao, Z.F.; Jin, M.; Wang, Y.L.; Li, Y.; Wu, J.C.; Xiao, Y.; Peng, Y.; Lv, Q.Y.; Gui, S.; et al. A Heavy Metal Transporter Gene ZmHMA3a Promises Safe Agricultural Production on Cadmium-Polluted Arable Land. J. Genet. Genom. 2023, 50, 130–134. [Google Scholar] [CrossRef]
  5. Haider, F.U.; Liqun, C.; Coulter, J.A.; Cheema, S.A.; Wu, J.; Zhang, R.; Wenjun, M.; Farooq, M. Cadmium Toxicity in Plants: Impacts and Remediation Strategies. Ecotoxicol. Environ. Saf. 2021, 211, 111887. [Google Scholar] [CrossRef]
  6. Matayoshi, C.L.; Pena, L.B.; Arbona, V.; Gómez-Cadenas, A.; Gallego, S.M. Biochemical and Hormonal Changes Associated with Root Growth Restriction under Cadmium Stress during Maize (Zea mays L.) Pre-Emergence. Plant Growth Regul. 2022, 96, 269–281. [Google Scholar] [CrossRef]
  7. Baryla, A.; Carrier, P.; Franck, F.; Coulomb, C.; Sahut, C.; Havaux, M. Leaf Chlorosis in Oilseed Rape Plants (Brassica napus) Grown on Cadmium-Polluted Soil: Causes and Consequences for Photosynthesis and Growth. Planta 2001, 212, 696–709. [Google Scholar] [CrossRef]
  8. Waheed, A.; Haxim, Y.; Islam, W.; Ahmad, M.; Ali, S.; Wen, X.; Khan, K.A.; Ghramh, H.A.; Zhang, Z.; Zhang, D. Impact of Cadmium Stress on Growth and Physio-Biochemical Attributes of Eruca Sativa Mill. Plants 2022, 11, 2981. [Google Scholar] [CrossRef] [PubMed]
  9. Abbas, T.; Rizwan, M.; Ali, S.; Adrees, M.; Zia-ur-Rehman, M.; Qayyum, M.F.; Ok, Y.S.; Murtaza, G. Effect of Biochar on Alleviation of Cadmium Toxicity in Wheat (Triticum aestivum L.) Grown on Cd-Contaminated Saline Soil. Environ. Sci. Pollut. Res. 2018, 25, 25668–25680. [Google Scholar] [CrossRef]
  10. Chen, Q.; Wu, F. bo Breeding for Low Cadmium Accumulation Cereals. J. Zhejiang Univ. Sci. B 2020, 21, 442–459. [Google Scholar] [CrossRef]
  11. Huang, X.; Duan, S.; Wu, Q.; Yu, M.; Shabala, S. Reducing Cadmium Accumulation in Plants: Structure–Function Relations and Tissue-Specific Operation of Transporters in the Spotlight. Plants 2020, 9, 223. [Google Scholar] [CrossRef] [PubMed]
  12. Yan, Y.F.; Lestari, P.; Lee, K.J.; Kim, M.Y.; Lee, S.H.; Lee, B.W. Identification of Quantitative Trait Loci for Cadmium Accumulation and Distribution in Rice (Oryza sativa). Genome 2013, 56, 227–232. [Google Scholar] [CrossRef] [PubMed]
  13. Li, B.; Ritchie, M.D. From GWAS to Gene: Transcriptome-Wide Association Studies and Other Methods to Functionally Understand GWAS Discoveries. Front. Genet. 2021, 12, 713230. [Google Scholar] [CrossRef]
  14. Zhao, X.; Luo, L.; Cao, Y.; Liu, Y.; Li, Y.; Wu, W.; Lan, Y.; Jiang, Y.; Gao, S.; Zhang, Z.; et al. Genome-Wide Association Analysis and QTL Mapping Reveal the Genetic Control of Cadmium Accumulation in Maize Leaf. BMC Genom. 2018, 19, 91. [Google Scholar] [CrossRef]
  15. Baseggio, M.; Murray, M.; Wu, D.; Ziegler, G.; Kaczmar, N.; Chamness, J.; Hamilton, J.P.; Robin Buell, C.; Vatamaniuk, O.K.; Buckler, E.S.; et al. Genome-Wide Association Study Suggests an Independent Genetic Basis of Zinc and Cadmium Concentrations in Fresh Sweet Corn Kernels. G3 Genes Genomes Genet. 2021, 11, jkab186. [Google Scholar] [CrossRef]
  16. Zhao, F.; Wang, N.; Bao, F.; Zhao, G.; Jing, L.; Wang, G.; Han, Q.; Hao, Z.; Chen, B. Genome-Wide Association Study Reveals Genetic Basis of Trace Elements Accumulation in Maize Kernels. Agriculture 2022, 12, 262. [Google Scholar] [CrossRef]
  17. Yan, H.; Guo, H.; Xu, W.; Dai, C.; Kimani, W.; Xie, J.; Zhang, H.; Li, T.; Wang, F.; Yu, Y.; et al. GWAS-Assisted Genomic Prediction of Cadmium Accumulation in Maize Kernel with Machine Learning and Linear Statistical Methods. J. Hazard. Mater. 2023, 441, 129929. [Google Scholar] [CrossRef]
  18. Paape, T.; Heiniger, B.; Santo Domingo, M.; Clear, M.R.; Lucas, M.M.; Pueyo, J.J. Genome-Wide Association Study Reveals Complex Genetic Architecture of Cadmium and Mercury Accumulation and Tolerance Traits in Medicago Truncatula. Front. Plant Sci. 2022, 12, 806949. [Google Scholar] [CrossRef]
  19. Zhu, H.; Lai, R.; Chen, W.; Lu, C.; Chachar, Z.; Lu, S.; Lin, H.; Fan, L.; Hu, Y.; An, Y.; et al. Genetic Dissection of Maize (Zea mays L.) Trace Element Traits Using Genome-Wide Association Studies. BMC Plant Biol. 2023, 23, 631. [Google Scholar] [CrossRef]
  20. Liu, H.; Shi, J.; Sun, C.; Gong, H.; Fan, X.; Qiu, F.; Huang, X.; Feng, Q.; Zheng, X.; Yuan, N.; et al. Gene Duplication Confers Enhanced Expression of 27-KDa γ-Zein for Endosperm Modification in Quality Protein Maize. Proc. Natl. Acad. Sci. USA 2016, 113, 4964–4969. [Google Scholar] [CrossRef]
  21. Sahu, H.; Amadabade, J.; Dhiri, N. Association Mapping: A Useful Tool. Int. J. Plant Sci. 2015, 10, 85–94. [Google Scholar] [CrossRef]
  22. Ray, A.M.; Zuhlke, K.A.; Levin, A.M.; Douglas, J.A.; Cooney, K.A.; Petros, J.A. Sequence Variation in the Mitochondrial Gene Cytochrome c Oxidase Subunit I and Prostate Cancer in African American Men. Prostate 2009, 69, 956–960. [Google Scholar] [CrossRef] [PubMed]
  23. Lai, R.; Jiang, J.; Wang, J.; Du, J.; Lai, J.; Yang, C. Functional Characterization of Three Maize SIZ/PIAS-Type SUMO E3 Ligases. J. Plant Physiol. 2022, 268, 153588. [Google Scholar] [CrossRef] [PubMed]
  24. Zhang, T.; Qian, N.; Zhu, X.; Chen, H.; Wang, S.; Mei, H.; Zhang, Y. Variations and Transmission of QTL Alleles for Yield and Fiber Qualities in Upland Cotton Cultivars Developed in China. PLoS ONE 2013, 8, e57220. [Google Scholar] [CrossRef] [PubMed]
  25. Ikram, M.; Lai, R.; Xia, Y.; Li, R.; Zhao, W.; Siddique, K.H.M.; Chen, J.; Guo, P. Genetic Dissection of Tobacco (Nicotiana tabacum L.) Plant Height Using Single-Locus and Multi-Locus Genome-Wide Association Studies. Agronomy 2022, 12, 1047. [Google Scholar] [CrossRef]
  26. Feng, K.; Li, J.; Yang, Y.; Li, Z.; Wu, W. Cadmium Absorption in Various Genotypes of Rice under Cadmium Stress. Int. J. Mol. Sci. 2023, 24, 8019. [Google Scholar] [CrossRef]
  27. Li, X.; Du, J.; Sun, L.; Zhang, Y.; Feng, Y.; Zheng, L.; Wang, G.; Huang, X. Derivation of Soil Criteria of Cadmium for Safe Rice Production Applying Soil–Plant Transfer Model and Species Sensitivity Distribution. Int. J. Env. Res. Public Health 2022, 19, 8854. [Google Scholar] [CrossRef]
  28. Zhou, G.; Zhu, Q.; Mao, Y.; Chen, G.; Xue, L.; Lu, H.; Shi, M.; Zhang, Z.; Song, X.; Zhang, H.; et al. Multi-Locus Genome-Wide Association Study and Genomic Selection of Kernel Moisture Content at the Harvest Stage in Maize. Front. Plant Sci. 2021, 12, 697688. [Google Scholar] [CrossRef]
  29. Grapes, L.; Dekkers, J.C.M.; Rothschild, M.F.; Fernando, R.L. Comparing Linkage Disequilibrium-Based Methods for Fine Mapping Quantitative Trait Loci. Genetics 2004, 166, 1561–1570. [Google Scholar] [CrossRef]
  30. Wang, C.; Han, B. Twenty Years of Rice Genomics Research: From Sequencing and Functional Genomics to Quantitative Genomics. Mol. Plant 2022, 15, 593–619. [Google Scholar] [CrossRef]
  31. Li, Y.; Ding, L.; Zhou, M.; Chen, Z.; Ding, Y.; Zhu, C. Transcriptional Regulatory Network of Plant Cadmium Stress Response. Int. J. Mol. Sci. 2023, 24, 4378. [Google Scholar] [CrossRef] [PubMed]
  32. Sferra, G.; Fantozzi, D.; Scippa, G.S.; Trupiano, D. Key Pathways and Genes of Arabidopsis Thaliana and Arabidopsis Halleri Roots under Cadmium Stress Responses: Differences and Similarities. Plants 2023, 12, 1793. [Google Scholar] [CrossRef] [PubMed]
  33. Feki, K.; Tounsi, S.; Mrabet, M.; Mhadhbi, H.; Brini, F. Recent Advances in Physiological and Molecular Mechanisms of Heavy Metal Accumulation in Plants. Environ. Sci. Pollut. Res. 2021, 28, 64967–64986. [Google Scholar] [CrossRef] [PubMed]
  34. Yang, G.L.; Zheng, M.M.; Tan, A.J.; Liu, Y.T.; Feng, D.; Lv, S.M. Research on the Mechanisms of Plant Enrichment and Detoxification of Cadmium. Biology 2021, 10, 544. [Google Scholar] [CrossRef] [PubMed]
  35. Moravčíková, D.; Žiarovská, J. The Effect of Cadmium on Plants in Terms of the Response of Gene Expression Level and Activity. Plants 2023, 12, 1848. [Google Scholar] [CrossRef]
  36. Li, C.; Hong, Y.; Sun, J.; Wang, G.; Zhou, H.; Xu, L.; Wang, L.; Xu, G. Temporal Transcriptome Analysis Reveals Several Key Pathways Involve in Cadmium Stress Response in Nicotiana tabacum L. Front. Plant Sci. 2023, 14, 1143349. [Google Scholar] [CrossRef]
  37. Niekerk, L.A.; Carelse, M.F.; Bakare, O.O.; Mavumengwana, V.; Keyster, M.; Gokul, A. The Relationship between Cadmium Toxicity and the Modulation of Epigenetic Traits in Plants. Int. J. Mol. Sci. 2021, 22, 7046. [Google Scholar] [CrossRef]
  38. Wang, Q.; Zeng, X.; Song, Q.; Sun, Y.; Feng, Y.; Lai, Y. Identification of Key Genes and Modules in Response to Cadmium Stress in Different Rice Varieties and Stem Nodes by Weighted Gene Co-Expression Network Analysis. Sci. Rep. 2020, 10, 9525. [Google Scholar] [CrossRef]
Figure 1. Association analysis and linkage disequilibrium analysis of populations. (A) The number of significant QTNs and stable QTNs for Cd concentration with two GWAS models (MLM_Q+Kinship and MLM_Q+PCA) in HN, JMO, and JMT. Horizontal bars show the number of QTNs for different environments and methods. The colors of circles corresponding to horizontal bars indicate the environment in which QTNs was detected and the method applied. Blue indicates that QTNs was identified using the MLM_Q+Kinship model in a single environment, but dark blue indicates that QTNs was identified using the MLM_Q+Kinship model in three environments; brown color indicates that QTNs was identified using the MLM_PCA+Kinship model in a single environment, but dark brown indicates that QTNs was identified using the MLM_PCA+Kinship model in three environments; red color indicates that QTNs was identified not only using two GWAS model, but also in three environments. (B) Linkage disequilibrium analysis between pairwise QTNs which was detected using one of the GWAS model in three environments; QTNs within 50 kb of the same chromosome and with R2 > 0.6 were identified as strong linkage and classified as haplotype blocks, including H1–H12, but the S5 and S24 was independent showing correcting location. The triangular slant represents the QTN number (S1–S126) in ascending order, and each rectangle represents the R2-value (upper) or p-value (lower) between the two QTNs. (C) The number of each QTL. Each haplotype block (H1–H12) was a single QTL (qH1qH12), while an independent QTN (S5 and S24) as a single QTL (qS5 and qS24).
Agriculture 15 00389 g001
Figure 2. Interaction analysis and classification of candidate proteins. Interaction analysis of the candidate proteins was performed using STRING software, and 38 proteins were identified. A circle represents a protein, and its protein ID is labeled at the upper left end. The same color indicates being classified into the same subgroup using the K-mean classification method, while the predicted three-dimensional structure of protein is displayed in the circle. The connecting line between the two circles represents the possible interaction between the predicted proteins (high score = 0.7).
Agriculture 15 00389 g002
Figure 3. The expression patterns of candidate genes and yeast cadmium tolerance. (A) Three-leaf stage maize seedlings were treated with 0 mM, 0.1 mM, and 0.5 μM CdCl2 for 8 h and 48 h, respectively. Total RNA was extracted and was then analyzed via RT-qPCR. The signals of 0 mM CdCl2 sample were set to 1. The ZmActin1 gene was used as an internal control. The data are presented as the mean ± standard error (SE) from triplicate experiments. ANOVA was performed for significance analysis (p < 0.05), which same letters indicate no significant difference, but different letters indicate a significant difference. (B) Three genes were overexpressed into yeast AH109 and treated with 0 mM and 0.075 mM CdCl2 on -Leu SD medium for 72 h using an empty vector pGBDT7 (BD) as a control. G21 represents Zm00001eb093750, G35 represents Zm00001d028408, and G39 represents Zm00001d005231.
Agriculture 15 00389 g003
Figure 4. Prediction of protein three-dimensional structure and SUMOylation sites. (A) Q41815 and (B) A0A1D6EIV9 in purple boxes and (C) A0A1D6EL68 in green boxes. SWISS-MODEL (https://swissmodel.expasy.org/, accessed on 23 February 2024) was used for three-dimensional structural analysis of proteins and for predicting SUMOylation sites based on GPS-SUMO software (https://sumo.biocuckoo.cn/advanced.php, accessed on 23 February 2024) with a high threshold. The blue position displayed in the amino acid sequence represents the position of serine or threonine, while the black arrow indicates the predicted SUMOylation site. “K” represents lysine, which is the predicted “K” that can be SUMOylated, and the number following represents the position of the amino acid sequence where “K” is located. For example, “K30” represents lysine at the 30th position of the amino acid sequence.
Agriculture 15 00389 g004
Figure 5. The differences in Cd concentration between superior and alternative alleles of each QTL in different environments. (AN): Fourteen QTNs corresponding to superior alleles (with O before the QTL name) and alternative alleles (with I before the QTL name), such as OqH1 represents the superior alleles of qH1, while IqH1 represents the alternative alleles. Red box-plots indicate environmental HN, purple box-plots represent environmental JMO, and green box-plots represent environmental JMT. Different letters indicate significant differences at the p-value < 0.05 using ANOVA.
Agriculture 15 00389 g005
Figure 6. Scatter plot with fitted regression lines representing the correlation between superior alleles and cadmium concentration in maize grain. A negative correlation was calculated between the number of superior alleles and Cd concentration of maize grain in (A) HN, (B) JMO, and (C) JMT. HN: Hainan; JMO: first repeat of Jiangmen; JMT: second repeat of Jiangmen.
Agriculture 15 00389 g006
Table 1. Statistical analysis of cadmium concentration (unit: µg·g−1).
YearEnvironmentRangeMeanCV/%FgFeFg×eH2/%
2013HN0~0.062950.0068186.6823.27 *1086.34 *6.39 *75.92
2020JMO0~0.1670.028688.23
2021JMT0.0057~0.17110.031176.31
HN: Hainan experimental station (2013); JMO: Jiangmen experimental station (2020); JMT: Jiangmen experimental station (2021); CV: coefficient of variation; Fg, Fe, Fg×e: F values in ANOVA for genotype, environment, and interaction between genotype and environment, respectively; *: significance at p-value < 0.001, respectively; H2: broad-sense heritability.
Table 2. Hybrid combinations predication for cadmium in maize from excellent genetic locus (unit: µg·g−1).
DirectionP1P2Number of P1-Excellent Haplotype/
Allelic Variation
Number of P2-Excellent Haplotype/
Allelic Variation
Expected Offspring Haplotype/
Allelic Variation
Low Cd and relative high Mn/Fe CAU95 *CAU65 #11/210/212/2
CAU95 *CAU266 @11/212/212/2
* Indicates that the material has 1 manganese-efficient QTN, qMn-7. # indicates that the material has 2 iron-efficient QTNs, qFe-6a and qFe-6b. @ indicates that the material has one iron-efficient QTN, qFe-7. This information can be found in our previous study [19].
Disclaimer/Publisher’s Note: The statements, opinions and data contained in all publications are solely those of the individual author(s) and contributor(s) and not of MDPI and/or the editor(s). MDPI and/or the editor(s) disclaim responsibility for any injury to people or property resulting from any ideas, methods, instructions or products referred to in the content.

