Article

A Semi-Supervised Diffusion-Based Framework for Weed Detection in Precision Agricultural Scenarios Using a Generative Attention Mechanism

1
China Agricultural University, Beijing 100083, China
2
Beijing Foreign Studies University, Beijing 100089, China
3
College of Life Sciences, Shihezi University, Shihezi 832003, China
4
Xinjiang Production and Construction Corps Key Laboratory of Oasis Town and Mountain-basin System Ecology, Shihezi 832003, China
*
Authors to whom correspondence should be addressed.
These authors contributed equally to this work.
Agriculture 2025, 15(4), 434; https://doi.org/10.3390/agriculture15040434
Submission received: 1 January 2025 / Revised: 8 February 2025 / Accepted: 9 February 2025 / Published: 19 February 2025

Abstract

:
The development of smart agriculture has created an urgent demand for efficient and accurate weed recognition and detection technologies. However, the diverse and complex morphology of weeds, coupled with the scarcity of labeled data in agricultural scenarios, poses significant challenges to traditional supervised learning methods. To address these issues, a weed detection model based on a semi-supervised diffusion generative network is proposed. This model integrates a generative attention mechanism and semi-diffusion loss to enable the efficient utilization of both labeled and unlabeled data. Experimental results demonstrate that the proposed method outperforms existing approaches across multiple evaluation metrics, achieving a precision of 0.94, recall of 0.90, accuracy of 0.92, and mAP@50 and mAP@75 of 0.92 and 0.91, respectively. Compared to traditional methods such as DETR, precision and recall are improved by approximately 10% and 8%, respectively. Additionally, compared to the enhanced YOLOv10, mAP@50 and mAP@75 are increased by 1% and 2%, respectively. The proposed semi-supervised diffusion weed detection model provides an efficient and reliable solution for weed recognition and introduces new research perspectives for the application of semi-supervised learning in smart agriculture. This framework establishes both theoretical and practical foundations for addressing complex target detection challenges in the agricultural domain.

1. Introduction

Agriculture serves as the foundation for human survival and development, and crop yield and quality directly determine the economic benefits of agriculture and food security [1,2,3]. However, weeds, as one of the most common biological interferences in agricultural production, can severely reduce crop yield and quality by competing with crops for water, nutrients, sunlight, and growing space. It is estimated that weeds cause crop yield losses of up to 10–15% globally each year [4,5]. The weed problem is particularly prominent in the cultivation of field crops, affecting not only yield but also potentially leading to imbalances in the agricultural ecosystem. Effective weed control is a key element in ensuring efficient and sustainable agricultural development.
Traditional weed management methods mainly rely on the use of chemical herbicides or manual weeding [6,7]. While chemical herbicides work quickly and cover large areas, prolonged and excessive use can lead to soil and water pollution, damage to the ecological environment, and an increase in herbicide resistance. On the other hand, manual weeding is effective in reducing environmental pollution but is labor-intensive, inefficient, and not feasible in large-scale agricultural fields due to high cost and labor constraints [8]. With the increasing attention to environmental protection and sustainable agriculture, finding ways to effectively control weeds while minimizing negative impacts on the ecosystem has become a critical challenge.
In recent years, the development of smart agriculture technologies has provided new solutions for the precise identification and control of weeds [9]. Deep learning techniques have enabled image-based weed detection and classification tasks, laying the foundation for efficient and environmentally friendly weed management systems. Compared to traditional methods, deep learning-based weed recognition offers advantages such as higher automation, better detection accuracy, and stronger adaptability [10,11]. However, many challenges remain in current research and applications. Supervised learning is the dominant technology in weed detection, but it heavily depends on large-scale labeled datasets. To address this issue, Saleh Alzayat et al. [12] proposed a new semi-supervised weed detection method that includes two main components: first, multi-scale feature representation techniques are used to capture unique weed features at different scales; second, an adaptive pseudo-labeling strategy is introduced that dynamically assigns confidence scores to pseudo-labels generated from unlabeled data during training. Experiments on the COCO dataset and five well-known weed datasets demonstrated that this method achieved state-of-the-art performance in weed detection while requiring significantly fewer labeled data compared to existing methods. Muvva Vijaya Bhaskar Reddy et al. [13] proposed a simple and efficient deep learning-based weed detection model to address the main drawbacks of feature extraction, such as loss of originality and image quality issues. To address real-time monitoring issues, Narayana Ch Lakshmi et al. [14] proposed a weed detection system based on YOLOv7. Experimental results showed that the YOLOv7 model achieved 99.8% accuracy, but further modeling with machine vision systems deployed on onboard computers requires real-world setting evaluations and updates.
Li et al. [15] evaluated the effectiveness of a semi-supervised learning framework for multi-class weed detection, using two object detection frameworks: FCOS (Fully Convolutional One-Stage Object Detection) and Faster-RCNN (Faster Region-based Convolutional Neural Networks). Experimental results showed that the proposed method achieved detection accuracies of approximately 76% and 96% with only 10% of the labeled data in the CottonWeedDet3 and CottonWeedDet12 datasets, respectively. Zhang et al. [16] proposed an optimized Faster R-CNN-based soybean seedling weed recognition method. They used the trained Faster R-CNN algorithm to detect soybeans and weeds in natural field environments, addressing the issue of low attention focus during model training and comparing the method with two classic object detection algorithms, SSD and YOLOv4. The experimental results indicated that the Faster R-CNN algorithm using VGG19-CBAM as the backbone feature extraction network effectively identified soybeans and weeds in complex backgrounds. The average recognition speed per image was 336 ms, with an average recognition accuracy of 99.16%, which improved by 5.61% compared to the unoptimized version and by 2.24% compared to SSD and 1.24% compared to YOLOv4. However, the agricultural environment is highly dynamic, and field conditions are greatly influenced by weather, lighting, and weed growth stages, which poses challenges for model generalization.
To address the challenges mentioned above, a semi-supervised weed detection and recognition framework is proposed in this paper, combining high-quality synthetic data generated by a diffusion model to enhance the model’s performance with limited labeled data. Specifically, the main contributions of this paper include the following:
  • Introduction of diffusion model-based generative cyclic network: This paper is the first to apply a diffusion model to weed detection tasks, designing a semi-supervised diffusion-based generative cyclic network capable of generating high-quality synthetic data. The model improves the realism and diversity of the generated data through cyclic optimization strategies. This approach significantly reduces the reliance on large-scale labeled data.
  • Design of a combined generation and detection attention mechanism: A generation attention mechanism is proposed in this paper, which integrates the features generated by the diffusion model into the detection network. By dynamically adjusting the weight distribution, this mechanism enhances the detection model’s ability to express fine-grained features in complex scenes, especially in scenarios where weeds and crops have highly similar appearances.
  • Proposal of a new semi-supervised loss function: To optimize the model’s performance with limited labeled data, a new loss function, semi-diffusion loss, is introduced. This function combines the characteristics of supervised and generative learning, effectively balancing the training weights between labeled and generated data, thereby improving the model’s overall robustness and detection accuracy.
In conclusion, the semi-supervised weed detection framework proposed in this paper not only provides a new approach for accurate weed identification but also opens up new directions for the application of deep learning in smart agriculture.

2. Related Work

2.1. Supervised Learning

Supervised learning is one of the core techniques in computer vision. Its principle involves using a training dataset with explicit labels to guide the model in learning and performing feature extraction and task decision-making [17,18,19,20,21,22]. The mathematical modeling of supervised learning is generally based on optimizing the objective function to minimize the gap between the model’s predictions and the true labels. Let the training dataset D = ( x i , y i ) i = 1 N , where x i represents the i-th image, and y i represents its corresponding label, which could be the class label in a classification task or a bounding box and its associated class in an object detection task. The basic objective of supervised learning is to optimize the model’s parameters θ by learning the prediction function f ( x ; θ ) so that it approximates the true label y i . In classification tasks, the most commonly used optimization objective is the cross-entropy loss function, defined as:
L C E = 1 N i = 1 N c = 1 C y i c log y ^ i c ,
where C represents the total number of classes, y i c is the true distribution of the sample i for class c (typically one-hot encoded), and y ^ i c is the predicted probability for class c. By minimizing L C E , the model adjusts the parameters θ so that the predicted distribution y ^ i c is as close as possible to the true distribution y i c . In object detection tasks, in addition to classification loss, the bounding box regression loss must also be considered. Bounding box regression typically uses the smooth L 1 loss function, defined as:
L b b o x = 1 N i = 1 N j { x , y , w , h } Smooth L 1 ( t i j t ^ i j ) ,
where t i j and t ^ i j represent the true and predicted coordinates for the bounding box in the x, y positions, as well as the width w and height h. The smooth L 1 function is defined as:
Smooth L 1 ( x ) = 0.5 x 2 , if | x | < 1 , | x | 0.5 , otherwise .
The total loss for object detection is typically the weighted sum of classification and bounding box regression losses:
L t o t a l = L C E + λ L b b o x ,
where λ is the balancing coefficient used to adjust the relative weight of classification and bounding box regression losses. In weed detection, YOLO series are the most common supervised learning frameworks. YOLO models, using a single-stage detection framework, simplify the object detection task to an end-to-end regression problem, significantly improving detection speed [23,24,25]. Specifically, YOLO divides the input image into an S × S grid, with each grid responsible for predicting several bounding boxes and their corresponding class probabilities. Its loss function includes classification loss, localization loss, and confidence loss:
L Y O L O = L c l a s s + L b b o x + L c o n f .
Although supervised learning performs excellently in weed detection tasks, its limitations are quite apparent. Firstly, acquiring high-quality annotated data is costly, especially in complex agricultural scenarios, where annotations for different weed species and growth stages require expert knowledge, greatly increasing the difficulty of data labeling. Secondly, the complexity of agricultural environments (e.g., lighting changes, soil background interference) poses a higher demand on the model’s generalization ability [26]. Furthermore, the diversity of weed species and their similarity to crop morphology lead to significant class confusion, which limits the model’s detection accuracy [18,27,28].

2.2. Semi-Supervised Learning

In the field of image recognition, especially in agricultural scenarios like weed detection, semi-supervised learning has become an important research direction [17,29,30,31,32]. Semi-supervised learning lies between supervised and unsupervised learning, utilizing a large amount of unlabeled data along with a small amount of labeled data for training, thus reducing the dependency on labeled data. The advantages of semi-supervised learning in agricultural image analysis are particularly significant because agricultural data often faces challenges like high labeling costs and scarce samples, particularly in weed detection tasks where labeling different weed species and complex environments is even more difficult [33]. In pseudo-label generation, the model first predicts the unlabeled data and assigns the high-confidence predictions as pseudo-labels to the unlabeled samples [34]. The goal of the pseudo-label generation process is to expand the training dataset by assigning labels to unlabeled data, thereby improving the model’s generalization ability. Its loss function can be expressed as:
L u = 1 M j = 1 M I ( y ^ j τ ) · CE ( y ^ j , f ( x j ; θ ) ) ,
where I ( y ^ j τ ) is the indicator function, which indicates that the pseudo-label y ^ j is used to calculate the loss when the predicted probability exceeds the threshold τ . CE ( y ^ j , f ( x j ; θ ) ) is the cross-entropy loss, which measures the gap between the pseudo-label and the model’s prediction. Semi-supervised learning has made significant progress in agricultural applications, especially in tasks such as weed detection, crop recognition, and disease detection. In weed detection, semi-supervised learning is especially crucial, as the diversity of weed species and their morphological similarities to crops pose challenges to traditional supervised learning methods, which require large amounts of labeled samples to achieve high detection accuracy [35,36,37]. Semi-supervised learning can effectively utilize unlabeled image data for enhanced training, overcoming the limitations of insufficient labeled data.

3. Materials and Methods

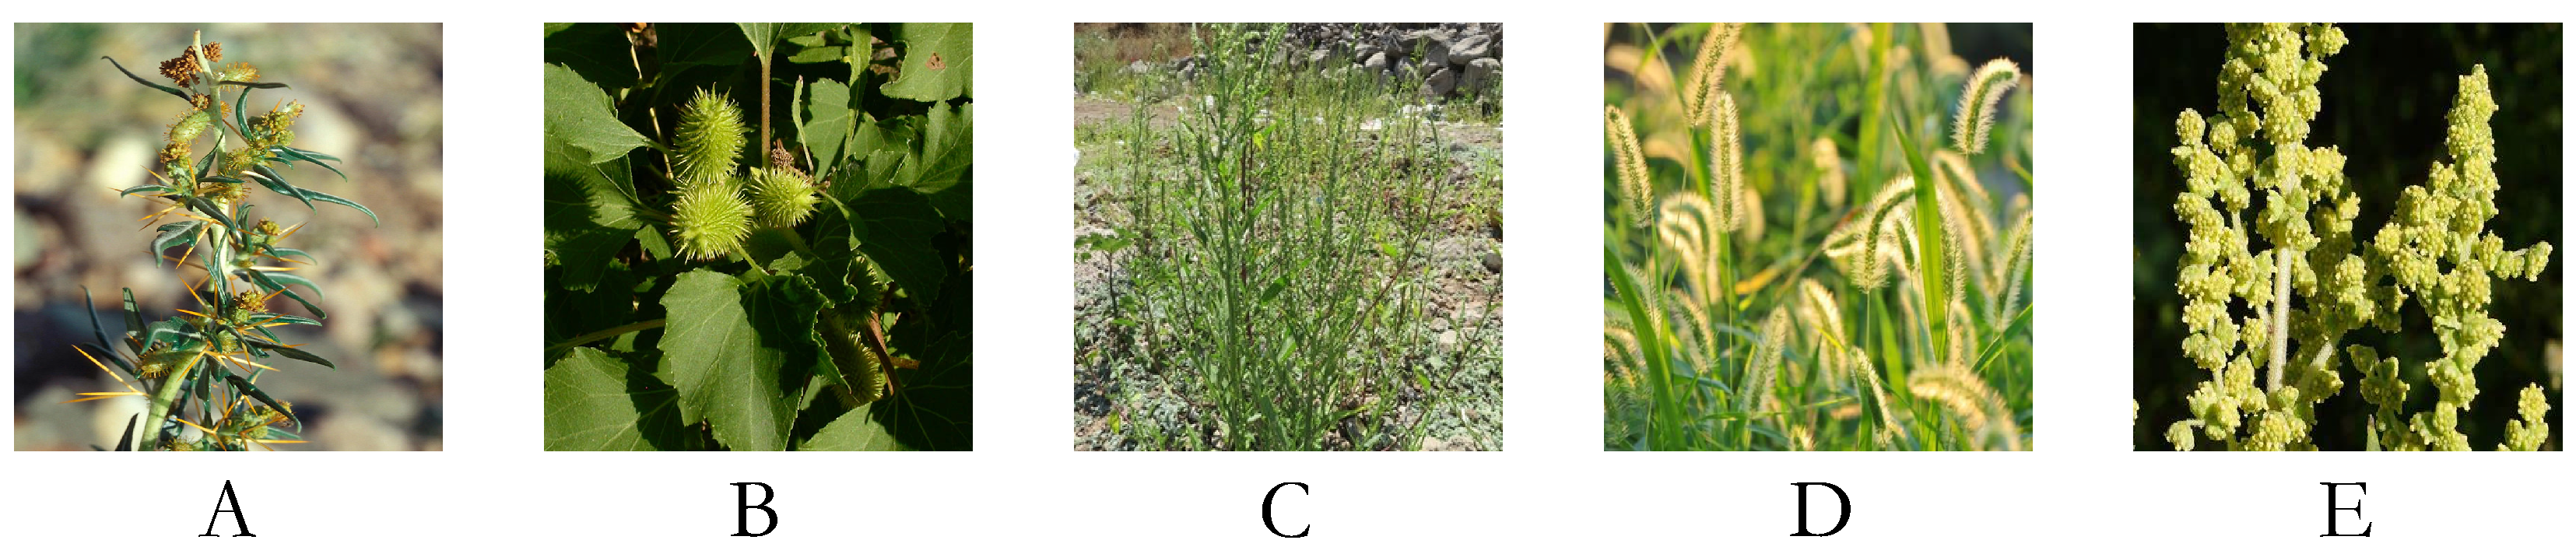
3.1. Dataset Collection

The collection of the dataset forms the foundational work for implementing the semi-supervised weed recognition model and directly impacts the accuracy of model training and validation. In this study, image data were primarily collected from experimental fields in Zhuozhou, Hebei province, Changchun, Jilin Province, and publicly available online sources, as shown in Figure 1, from January 2023 to October 2024.
The selected weed types include Setaria viridis, Xanthium spinosum, Cyclachaena xanthiifolia, Xanthium italicum, and Amaranthus rudis. The number of images per weed type ranged from 800 to 2200, as summarized in Table 1, ensuring the dataset’s diversity and sufficiency.
During image acquisition, high-resolution digital cameras and drone-mounted imaging devices were employed to ensure the capture of high-quality images from various angles and heights. The digital cameras were primarily used for ground-level close-up images, while drones were utilized to obtain large-scale field images from aerial perspectives. This multi-angle approach aids subsequent model recognition by adapting to the various growth stages of weeds and lighting conditions. Particular attention was given to capturing the distinctive features of different growth cycles for each weed type. Additionally, differences between similar weed variants, such as Xanthium spinosum and Cyclachaena xanthiifolia, were meticulously observed. Although these weeds share similar appearances, differences in leaf shapes and spine lengths were noted through careful on-site observation and consultation with agricultural experts, ensuring these subtle distinctions were accurately reflected in the collected images. To further enhance the dataset’s representativeness and adaptability, additional images were sourced from online platforms. These images primarily originated from agricultural fields in various regions, covering diverse soil types, lighting conditions, and climatic environments, thereby improving the dataset’s generalization capability across both national and global contexts. During the incorporation of online images, only high-quality and accurately labeled resources were selected to maintain the dataset’s authenticity and reliability. Through this comprehensive data collection process, a high-quality, diverse, and information-rich weed image dataset was established, providing a solid foundation for training the semi-supervised learning model.

3.2. Data Annotation

In weed detection tasks, due to the complexity of agricultural environments and the diversity of weed species, accurate annotation is not only crucial for improving model performance but also the foundation for ensuring the reliability of experimental results. The weed dataset in this study includes various types of weeds, each exhibiting unique characteristics under different growth stages and environmental conditions. To enable effective training, it is essential to accurately annotate the weeds in each image. During the data annotation process, we employed expert-assisted manual annotation. Agricultural experts carefully examined each image and precisely annotated every weed region in the image. Specifically, the experts first identified the weeds in the image and marked their corresponding bounding boxes. These bounding boxes not only indicated the position of the weeds but also included category information about the weed types. Additionally, the experts annotated the weeds based on their growth stages. For example, the leaves of Setaria viridis are narrow and light green in the early growth stage, while they become broader and darker as the plant matures. These subtle differences were carefully recorded during the annotation process, providing more contextual information for subsequent model training.
We paid special attention to the consistency and comprehensiveness of the annotations. Consistency in annotation refers to ensuring that the same type of weed follows the same annotation standards across different images, avoiding data noise caused by inconsistent annotations. Comprehensiveness means ensuring that the performance of each weed category is fully covered under all environmental conditions, lighting situations, and growth stages. In the construction of this study’s dataset, the accuracy and quality of annotations are critical factors that influence the model’s training effectiveness. To ensure high-quality annotations, we implemented a rigorous annotation process, combining expert guidance and automated tools to assist with the annotation, ensuring that the data annotation meets high standards.

3.3. Data Augmentation

Data augmentation techniques are widely used in deep learning to improve the robustness and generalization ability of models, especially when training data are insufficient. By applying various transformations to the training data, data augmentation can generate additional training samples, enabling the model to learn richer features. In the agricultural field, especially in tasks such as weed detection and crop disease recognition, data augmentation plays a crucial role in enhancing model accuracy, as shown in Figure 2.
CutOut is a simple and effective image data augmentation technique that enhances the model’s robustness by occluding a rectangular region (“cutout”) in the input image. The principle of this method is to randomly select a region in the image and set the pixel values of that region to zero, preventing the model from overly relying on a particular region or local feature. Given an input image x, the CutOut operation randomly generates a rectangular region with size w × h at a random location and sets the pixel values in that region to zero. This operation can be represented by the following formula:
x ˜ = x ( 1 M ) ,
where ⊙ represents element-wise multiplication, and M is a binary matrix with the same dimensions as the input image. Mixup is another augmentation method that generates new samples through linear interpolation. It combines two images and their corresponding labels in a weighted manner to create new training samples. Given two input images x 1 and x 2 and their corresponding labels y 1 and y 2 , the Mixup operation generates a new image x ˜ and label y ˜ as follows:
x ˜ = λ x 1 + ( 1 λ ) x 2 ,
y ˜ = λ y 1 + ( 1 λ ) y 2 ,
where λ is a randomly generated weight, usually sampled from a beta distribution, i.e., λ beta ( α , α ) , where α is a hyperparameter that determines the shape of the weight distribution. In this way, mixup generates smoother decision boundaries, improving the model’s generalization ability. GridMask is a grid-based occlusion augmentation method designed to enhance the model’s ability to learn local features. Unlike cutout, gridmask does not occlude the entire rectangular region but instead divides the image into several grids and randomly occludes some of the grids to achieve data augmentation. Given that the input image x has size H × W , gridmask divides the image into G × G grids and randomly selects several grids for occlusion. The occlusion operation can be expressed as the following formula:
x ˜ = x ( 1 M ) ,
where M is a binary matrix of size H × W , representing the location of the grids. In each grid, some grids are randomly selected for occlusion. The size and shape of the occlusion area are determined by the grid size G and the occlusion probability. By this method, GridMask generates different types of local occlusion, increases the diversity of training data, and forces the model to extract useful features from multiple local regions in the image.

3.4. Proposed Method

To address the challenges of limited annotated agricultural image data, the complexity of weed species, and the high morphological similarity between crops and weeds, a weed detection network framework based on a semi-supervised diffusion model is proposed. The overall framework integrates the powerful generative capabilities of diffusion models with the feature extraction and classification capacities of detection networks, leading to the design of an innovative semi-supervised learning mechanism. This mechanism enables efficient and accurate weed recognition and detection under conditions of limited annotated data. The framework comprises three primary modules: the semi-supervised diffusion weed detection network, the semi-supervised diffusion data generation loop, and the detection network based on the generative attention mechanism. To further enhance training effectiveness, a novel semi-supervised loss function, referred to as semi-diffusion loss, is introduced. This loss function enables the collaborative optimization of supervised and generative signals by combining the learning processes of annotated and generated data. The network structure is illustrated in Figure 3.

3.4.1. Semi-Supervised Diffusion Weed Detection Network

The proposed semi-supervised diffusion weed detection network (SSDWDN) consists of four core modules: the efficient hybrid encoder, the uncertainty-minimal query selection module, the cross-scale compact feature fusion module (CCFF), the decoder, and detection head. The overall design effectively combines the generative capabilities of the diffusion model with the feature extraction and fusion capacities of the detection network.
The efficient hybrid encoder plays a crucial role in extracting image features. After passing through the backbone, the input image is processed by the encoder’s multi-scale feature extraction layers. The encoder consists of three key feature layers (S3, S4, S5) that extract low-level, mid-level, and high-level features, respectively. Each feature layer applies the SiLU activation function and Batch Normalization (BN) to maintain gradient flow stability. The outputs from these feature extraction layers are aggregated into the CCFF through hierarchical feature fusion, with the resolution of each feature progressively decreasing to adapt to multi-scale target detection tasks. Within the encoder, an adaptive integrated feature interaction (AIFI) module is employed to enhance information interaction across different scales using a dynamic attention mechanism. The computation of the AIFI module is expressed as follows:
F AIFI = softmax ( Q · K ) · V ,
where Q, K, and V represent the query, key, and value matrices, respectively. The softmax function is applied to normalize the attention weights, ensuring effective integration of information across scales.
The query (Q), key (K), and value (V) matrices represent the feature representations, and F AIFI denotes the output features. The softmax function is applied to normalize the attention weights. This dynamic interaction effectively enhances the network’s capability to capture critical features of weed targets. The CCFF module integrates the features generated by the diffusion model with the multi-scale features extracted by the encoder. Features generated by the diffusion model are encoded with position embeddings before being weighted and fused with image features at each layer. The fusion weights are computed as follows:
W fusion = softmax ( F gen · F img ) ,
where F gen and F img represent the generated features and image features, respectively, and W fusion is the fusion weight. The fused features are added to the original image features through residual connections, and the results are passed to the decoder. The uncertainty-minimal query selection module optimizes pseudo-label generation by selecting high-confidence target regions during detection, ensuring higher-quality pseudo-data generated by the diffusion model. This is achieved by calculating the prediction uncertainty for each target region and selecting the targets with the lowest uncertainty as pseudo-label training samples. The uncertainty is computed based on the standard deviation ( σ ):
σ = 1 n i = 1 n ( y ^ i y ¯ ) 2 ,
where y ^ i represents the predicted class probabilities for each iteration, and y ¯ is the mean of the predictions. By filtering out targets with lower uncertainty, the credibility of the generated data during training is improved.
The decoder employs a multi-layer convolutional neural network (Conv1×1, Conv3×3) to gradually restore feature resolution and uses an object query detection head to predict target regions. The object query is generated with position-encoded features using the following formula:
Q obj = sin ( p o s 10000 2 i / d ) ,
where p o s denotes the positional encoding, and d represents the embedding dimension. This formula incorporates positional information to enhance the network’s target localization capabilities. The final predictions include category classification and bounding box regression, optimized with an IoU-based loss function.
The mathematical core of this design lies in the integration of generative model features with multi-scale features of the detection network. Positional attention and cross-feature fusion significantly enhance the expressive capacity of the detection network. First, the efficient hybrid encoder optimizes information flow across scales through the AIFI module, enabling the network to capture detailed features of weed targets across different scales. Second, the CCFF module improves the network’s adaptability to generated data by fusing generative and image features, alleviating the challenges posed by insufficient labeled data. Compared to traditional detection models, the SSDWDN demonstrates superior performance by extending the utilization of unlabeled data and further optimizing pseudo-label quality through the uncertainty-minimal query selection mechanism. Moreover, the attention mechanism based on generative features reduces the network’s sensitivity to complex backgrounds, improving precise localization of target regions. This design proves highly effective in addressing complex agricultural scenarios and sparse labeled data, offering a robust and efficient solution for weed detection and agricultural intelligence.

3.4.2. Semi-Supervised Diffusion Data Generation Loop

The semi-supervised diffusion data generation loop (SSDDGL) is designed to iteratively optimize the quality and diversity of generated data, thereby enhancing the performance of the detection network. The framework consists of two core components: the generative module and the discriminative module. Additionally, a teacher–student architecture and diffusion-based generation mechanism are incorporated. The overall structure of the network is illustrated in Figure 4 and includes key components such as the encoder, decoder, generative diffusion loss module, and discriminative loss module.
The encoder and decoder are implemented with a symmetric structure. The encoder consists of five convolutional layers, with input dimensions progressively reduced as ( 256 , 256 , 3 ) , ( 128 , 128 , 64 ) , ( 64 , 64 , 128 ) , ( 32 , 32 , 256 ) , and ( 16 , 16 , 512 ) . The convolutional kernel size is 3 × 3 with a stride of 2, and the channel count increases from 3 to 512. The decoder restores the feature dimensions through transposed convolutions, with output dimensions gradually increased as ( 16 , 16 , 512 ) , ( 32 , 32 , 256 ) , ( 64 , 64 , 128 ) , ( 128 , 128 , 64 ) , and ( 256 , 256 , 3 ) . The final layer of the decoder utilizes the SiLU activation function to ensure smoothness and nonlinearity in the output features.
A teacher–student architecture is introduced to improve the quality of the generated data. The parameters of the teacher network are updated via the exponential moving average (EMA) of the student network’s parameters, expressed as:
θ T = α θ T + ( 1 α ) θ S ,
where θ T and θ S denote the parameters of the teacher and student networks, respectively, and α is the momentum coefficient, typically set to 0.999. This design ensures the stability of the teacher network during training and provides high-quality supervisory signals to the student network.
The generative module is based on the reverse diffusion process, which generates synthetic data from pure noise. The generation process is described as
p θ ( x t 1 | x t ) = N ( x t 1 ; μ θ ( x t , t ) , σ t 2 I ) ,
where μ θ ( x t , t ) is the predicted mean, σ t 2 is the fixed noise variance, x t represents the image state at the current timestep, and x t 1 is the state at the previous timestep.
The generative diffusion loss function ( L gen ) optimizes the model by predicting the noise during the generation process, defined as
L gen = E t , x t , ϵ ϵ ϵ θ ( x t , t ) 2 ,
where ϵ represents the true noise, and ϵ θ denotes the predicted noise.
The discriminative module is responsible for optimizing the quality of pseudo-labels by supervising the consistency between generated and real data distributions. The discriminative loss function ( L disc ) is given as
L disc = E x p data [ log D ( x ) ] E x p gen [ log ( 1 D ( x ) ) ] ,
where D ( x ) represents the discriminator’s predicted probability for input data x, and p data and p gen are the distributions of real and generated data, respectively.
SSDDGL iteratively generates and optimizes pseudo-labels to improve the model’s performance. Specifically, generated data are first input into the detection network, where features are extracted, and pseudo-labels are generated. These pseudo-labels are then used as supervisory signals to optimize the next iteration of the diffusion generation process. The cycle loss is defined as
L cycle = E x p gen y pred y true 2 ,
where y pred represents the pseudo-label predicted by the detection network, and y true is the approximate ground truth label generated by the teacher network. By minimizing L cycle , the network progressively enhances the realism and diversity of the generated data.
The diffusion model generates high-quality images through the reverse diffusion process, grounded in the learning of probability density functions. In SSDDGL, the generative module optimizes the mean squared error of noise prediction to approximate the real data distribution p data . The teacher–student architecture ensures stable supervisory signals, guiding the student network’s optimization and enabling high generalization performance with limited labeled data. Compared to traditional generative models such as GANs, diffusion models exhibit significant advantages in stability and diversity. The stepwise generation mechanism of diffusion introduces greater randomness at each step, enhancing data diversity. Furthermore, the iterative optimization strategy of SSDDGL progressively improves the quality of generated data, and the supervision signals from the discriminative module ensure the accuracy of pseudo-labels. This design effectively addresses the issue of scarce annotations in agricultural data and significantly enhances the performance of detection networks, particularly in complex scenarios.

3.4.3. Generative Attention Mechanism

The generative attention mechanism significantly differs from standard self-attention mechanisms in both its design objectives and sources of information, as shown in Figure 5. While standard self-attention mechanisms focus on capturing global dependencies within the features of the input data by calculating the similarity between queries (Q), keys (K), and values (V) of the input features, the generative attention mechanism introduces additional features generated by diffusion models. By fusing generated features with input features, this mechanism provides richer semantic information, enhancing the network’s ability to recognize target regions. This design is particularly suitable for semi-supervised learning scenarios, where generative models are employed to augment the feature representation of real data. Specifically, the generative attention mechanism dynamically integrates the generated features F g from the diffusion model and the real image features F r , capturing a more comprehensive spatial and semantic context. In contrast, traditional self-attention mechanisms rely solely on local correlations within the input data.
The generative attention mechanism is implemented through a multi-layer feature fusion network comprising three modules: the generative feature embedding module, the feature fusion module, and the weighted output module. The input dimensions for the real features are F r R H × W × C r , and the generated features are F g R H × W × C g , where the height H = 32 , the width W = 32 , the number of channels for real features C r = 256 , and for generated features C g = 128 .
  • Generative feature embedding module: The generated features F g are first passed through a 1 × 1 convolutional layer to reduce the number of channels to 128 while preserving the spatial dimensions, thereby reducing computational overhead. The embedding process is expressed as
    F g = Conv 1 × 1 ( F g ) ,
    where F g R H × W × 128 represents the embedded features.
  • Feature fusion module: Complementary information between the generated features F g and the real features F r is captured by computing the attention weight matrix W. The attention weights are computed as
    W = softmax ( F g · F r ) ,
    where W R H × H denotes the normalized attention weights. The fused features F a are obtained by weighting the real features F r and adding the generated features F g :
    F a = W · F r + F g .
  • Weighted output module: The fused features F a are further processed through a 3 × 3 convolutional layer to enhance local information and adjust the number of channels to the target dimension C o = 256 :
    F o = Conv 3 × 3 ( F a ) ,
    where F o R H × W × C o represents the final fused feature output.
The generative attention mechanism is embedded into the feature extraction stage of the semi-supervised diffusion weed detection network (SSDDN). It dynamically fuses the generated features F g from the diffusion model with the real image features F r at different scales, thereby enhancing the representation of multi-scale features. This integration provides several key advantages. First, the mechanism incorporates semantic information from the generative model, which is particularly beneficial for recognizing complex targets in scenarios with limited labeled data. The generated features F g , enriched with contextual information through the diffusion model, significantly improve the model’s focus on target regions when fused with the real features F r . Second, the dynamic attention weights W enable the generative attention mechanism to adaptively adjust the contribution of generated and real features, allowing the model to flexibly adjust feature representations based on the characteristics of different scenes. Additionally, the use of local convolution operations ensures computational efficiency while refining the detail of the feature fusion.
Theoretically, the generative attention mechanism enhances the alignment and integration of different information sources within the feature space, enabling the SSDDN to more effectively adapt to complex backgrounds and diverse targets. This leads to higher precision and robustness in weed detection tasks. By addressing the challenges of background interference and target diversity in agricultural image scenarios, the proposed mechanism significantly improves the applicability of semi-supervised learning in intelligent agriculture.

3.4.4. Semi-Diffusion Loss

Traditional supervised learning loss functions, such as cross-entropy loss and mean squared error loss, primarily rely on labeled data by directly optimizing the discrepancy between model outputs and true labels to update parameters. However, in semi-supervised learning, relying solely on labeled data is insufficient to fully exploit the potential of unlabeled data. The semi-diffusion loss combines supervised loss from labeled data and pseudo-supervised loss from unlabeled data, establishing a comprehensive optimization objective that maximizes the utility of unlabeled data under conditions of limited labeled samples.
The semi-diffusion loss consists of two components: the supervised loss L s and the pseudo-supervised loss L u . The pseudo-supervised loss optimizes generated pseudo-labels for unlabeled data. The core idea is to use high-confidence pseudo-labels as optimization targets. Specifically, pseudo-labels are included in the loss computation when the model’s prediction confidence for unlabeled samples exceeds a predefined threshold τ . The pseudo-supervised loss is formulated as
L u = 1 M j = 1 M I ( max ( y ^ j ) τ ) y ^ j y j pseudo 2 ,
where y ^ j denotes the predictions for the unlabeled sample, y j pseudo represents the generated pseudo-labels, I ( · ) is an indicator function that evaluates to 1 if the prediction confidence exceeds τ and 0 otherwise, and M is the number of unlabeled samples.
The final semi-diffusion loss is defined as the weighted sum of the supervised loss and pseudo-supervised loss:
L SDL = λ s L s + λ u L u ,
where λ s and λ u are hyperparameters controlling the relative contributions of supervised loss and pseudo-supervised loss during the training process. By adjusting these weights, the impact of different data sources on model optimization can be flexibly controlled.
In the SSDDN, the semi-diffusion loss is closely integrated with the diffusion model’s generative capability and the detection network’s feature learning process. The diffusion model incrementally generates pseudo-labels, providing supervisory signals for unlabeled data, while the detection network jointly optimizes features from both labeled and generated data. During each training iteration, the computation of the semi-diffusion loss follows these steps:
  • Pseudo-labels y j pseudo for unlabeled data are generated by the diffusion model.
  • The detection network computes the supervised loss L s for labeled data and the pseudo-supervised loss L u for unlabeled data.
  • The losses L SDL are combined to update the network parameters.
Through this approach, the semi-diffusion loss enables the network to fully utilize the potential information contained in unlabeled data and enhances the robustness of the detection network with high-quality pseudo-labels generated by the diffusion model. The design of the semi-diffusion loss is grounded in the following theoretical principles: minimizing the supervised loss L s ensures accurate feature representation learned from labeled data, while minimizing the pseudo-supervised loss L u effectively leverages unlabeled data, thereby expanding the distributional coverage of the training samples. The ultimate goal is to optimize the network’s performance across the entire data distribution p ( x ) .
The reliability of the pseudo-supervised loss L u is ensured by the introduction of a confidence threshold τ , which ensures that only high-confidence pseudo-labels are used for optimization. According to semi-supervised learning theory, high-confidence pseudo-labels are more likely to approximate the true distribution, thereby guaranteeing the effectiveness of unlabeled data. Furthermore, the flexible adjustment of the weights λ s and λ u mitigates the risk of noise introduced by inaccurate pseudo-labels, further stabilizing the training process. This design demonstrates significant potential for improving the performance of detection networks in scenarios with limited labeled data.

3.5. Evaluation Metrics

To comprehensively assess the model’s performance, various common evaluation metrics were selected, including precision (p), recall (r), accuracy ( a c c ), mean average precision (mAP@50), mAP@75, and frames per second (FPS). Precision is defined as the proportion of true positive samples among those predicted as positive by the model. It reflects the accuracy of the model’s predictions, with higher values indicating that more of the predicted positive samples are correct. Recall is the proportion of true positive samples correctly predicted by the model among all actual positive samples. Accuracy is the proportion of correctly predicted samples among all samples. To evaluate the performance of the model in object detection tasks, particularly in multi-object detection, mean average precision (mAP) was adopted. mAP is a commonly used evaluation metric in object detection tasks, mainly measuring the model’s precision performance at different recall rates. The calculation of mAP is based on the precision–recall curve and measures the average precision at different recall rates. mAP@50 and mAP@75 represent specific evaluation standards of mAP, corresponding to an intersection over union (IoU) threshold of 50% and 75%, respectively. Specifically, mAP@50 calculates the average precision when IoU is greater than or equal to 50%, while mAP@75 calculates it for IoU greater than or equal to 75%. FPS measures the model’s processing speed, indicating how many images the model can process per second, providing an insight into the computational efficiency of the model. These metrics are defined as follows:
p = T P T P + F P
r = T P T P + F N
a c c = T P + T N T P + T N + F P + F N
mAP @ 50 = 1 N i = 1 N A P i , I o U 0.5
mAP @ 75 = 1 N i = 1 N A P i , I o U 0.75
FPS = Number of images processed Total time taken to process these images
where T P represents the number of true positives, F P represents false positives, F N represents false negatives, T N represents true negatives, and N is the number of classes. A P i , I o U 0.5 represents the average precision for class i when IoU is greater than or equal to 50%, and similarly for A P i , I o U 0.75 . Through these evaluation metrics, the performance impact of different models and configurations on the weed recognition task can be accurately measured, providing a basis for further optimization and improvement.

4. Results and Discussion

4.1. Results

4.1.1. Baseline

In this study, multiple well-known baseline models were used to comprehensively evaluate the performance of the proposed model. These include YOLOv9l [38], YOLOv10l [39], leafdetection [40], TinySegFormer [41], and DETR [42]. The YOLO series models, as classic object detection algorithms, are particularly adept at handling real-time detection tasks. They predict object bounding boxes and class labels directly using regression methods, achieving a good balance between speed and accuracy. YOLOv9l and YOLOv10l are iterative improvements based on the YOLO series. YOLOv10l introduces more complex network architectures and an improved loss function, further enhancing the model’s detection accuracy and robustness. Leafdetection is a deep learning model specifically designed for plant leaf disease detection. It utilizes CNNs to extract detailed features of plant leaves, accurately identifying disease regions. TinySegFormer is a small-scale target segmentation model based on transformers. By combining traditional CNNs with transformer architectures, it effectively improves image segmentation tasks, particularly in fine-grained segmentation in complex backgrounds. DETR is an end-to-end object detection model based on transformers. It uses the self-attention mechanism to globally model features, effectively handling detection tasks for various objects in complex scenes. The same dataset was used for all models, ensuring a fair and consistent comparison between the proposed model and the baseline models. This dataset includes various weed types under different growth stages and environmental conditions. By comparing these baseline models, the advantages and areas for improvement of the proposed method in the weed recognition task can be better understood, further verifying its effectiveness and feasibility in practical applications.

4.1.2. Hardware and Software Platform

In this experiment, high-performance computational hardware was utilized to support the training and inference processes of complex models in deep learning tasks. Specifically, the hardware platform used an NVIDIA A100 GPU, which possesses powerful computational capabilities, making it suitable for large-scale deep learning training tasks. To ensure the efficiency of the training process, the hardware was also equipped with 64 GB of memory and high-frequency processors (such as AMD Ryzen 9 5950X or Intel i9-series processors), enabling the quick processing of large volumes of training data and multi-task parallel processing. Additionally, the hardware was integrated with a high-bandwidth data storage system to support the rapid reading and storage of large image datasets, ensuring that training efficiency was not hindered by data bottlenecks.
In terms of the software platform, Python 3.8 was used as the programming language, paired with the popular deep learning framework PyTorch. These frameworks provide flexible and efficient model training and inference capabilities, supporting various deep learning algorithms, such as CNNs and generative models (e.g., diffusion models). For data processing and augmentation, libraries such as OpenCV and PIL were employed to preprocess and enhance the images, ensuring the quality and diversity of the input data. Model training was accelerated using NVIDIA’s CUDA and cuDNN libraries to maximize GPU performance and improve training speed.

4.1.3. Optimizer and Hyperparameters

For this experiment, the dataset was divided into training, validation, and test sets. Specifically, 80% of the dataset was used for training, and 20% was used for testing. This ratio ensures that the training set is sufficiently large for the model to learn effectively while maintaining the independence of the test set for model evaluation. During training, five-fold cross-validation was adopted to further optimize the model’s performance. The basic idea of cross-validation is to divide the dataset into five equal subsets, using one subset as the validation set and the remaining four as the training set. This process is repeated for each subset, helping to reduce the model’s dependence on a single data partition and providing more reliable evaluation results.
Regarding hyperparameters, the learning rate was initially set to 0.001 and then adjusted based on the changes in the loss function during training using a learning rate decay strategy. A larger learning rate was used in the early stages to accelerate convergence and gradually reduced in later stages to fine-tune model parameters. The Adam optimizer was employed, with its update rule given as
θ t = θ t 1 α · m t v t + ϵ ,
where θ t is the model parameter, α is the learning rate, m t and v t are the first and second moment estimates of the gradient, and ϵ is a smoothing term to prevent division by zero. The Adam optimizer has been shown to perform well during deep neural network training, especially when dealing with sparse and noisy gradients, with faster convergence. Additionally, the batch size was set to 32, which is the number of samples used to update the model parameters in each training iteration. This batch size was found to perform stably in the experiment, balancing memory usage and training efficiency. Dropout, with a rate of 0.5, was also used to prevent overfitting. This means that during training, each neuron has a 50% chance of being temporarily discarded, forcing the model to learn more robust features. Hyperparameters such as the regularization coefficient and gradient clipping thresholds were also fine-tuned. The regularization coefficient λ was set to 0.001 to avoid overfitting, and gradient clipping was applied to prevent gradient explosion, with the clipping threshold set to 5.0, meaning that when the gradient magnitude exceeds 5.0, it is clipped to that threshold.

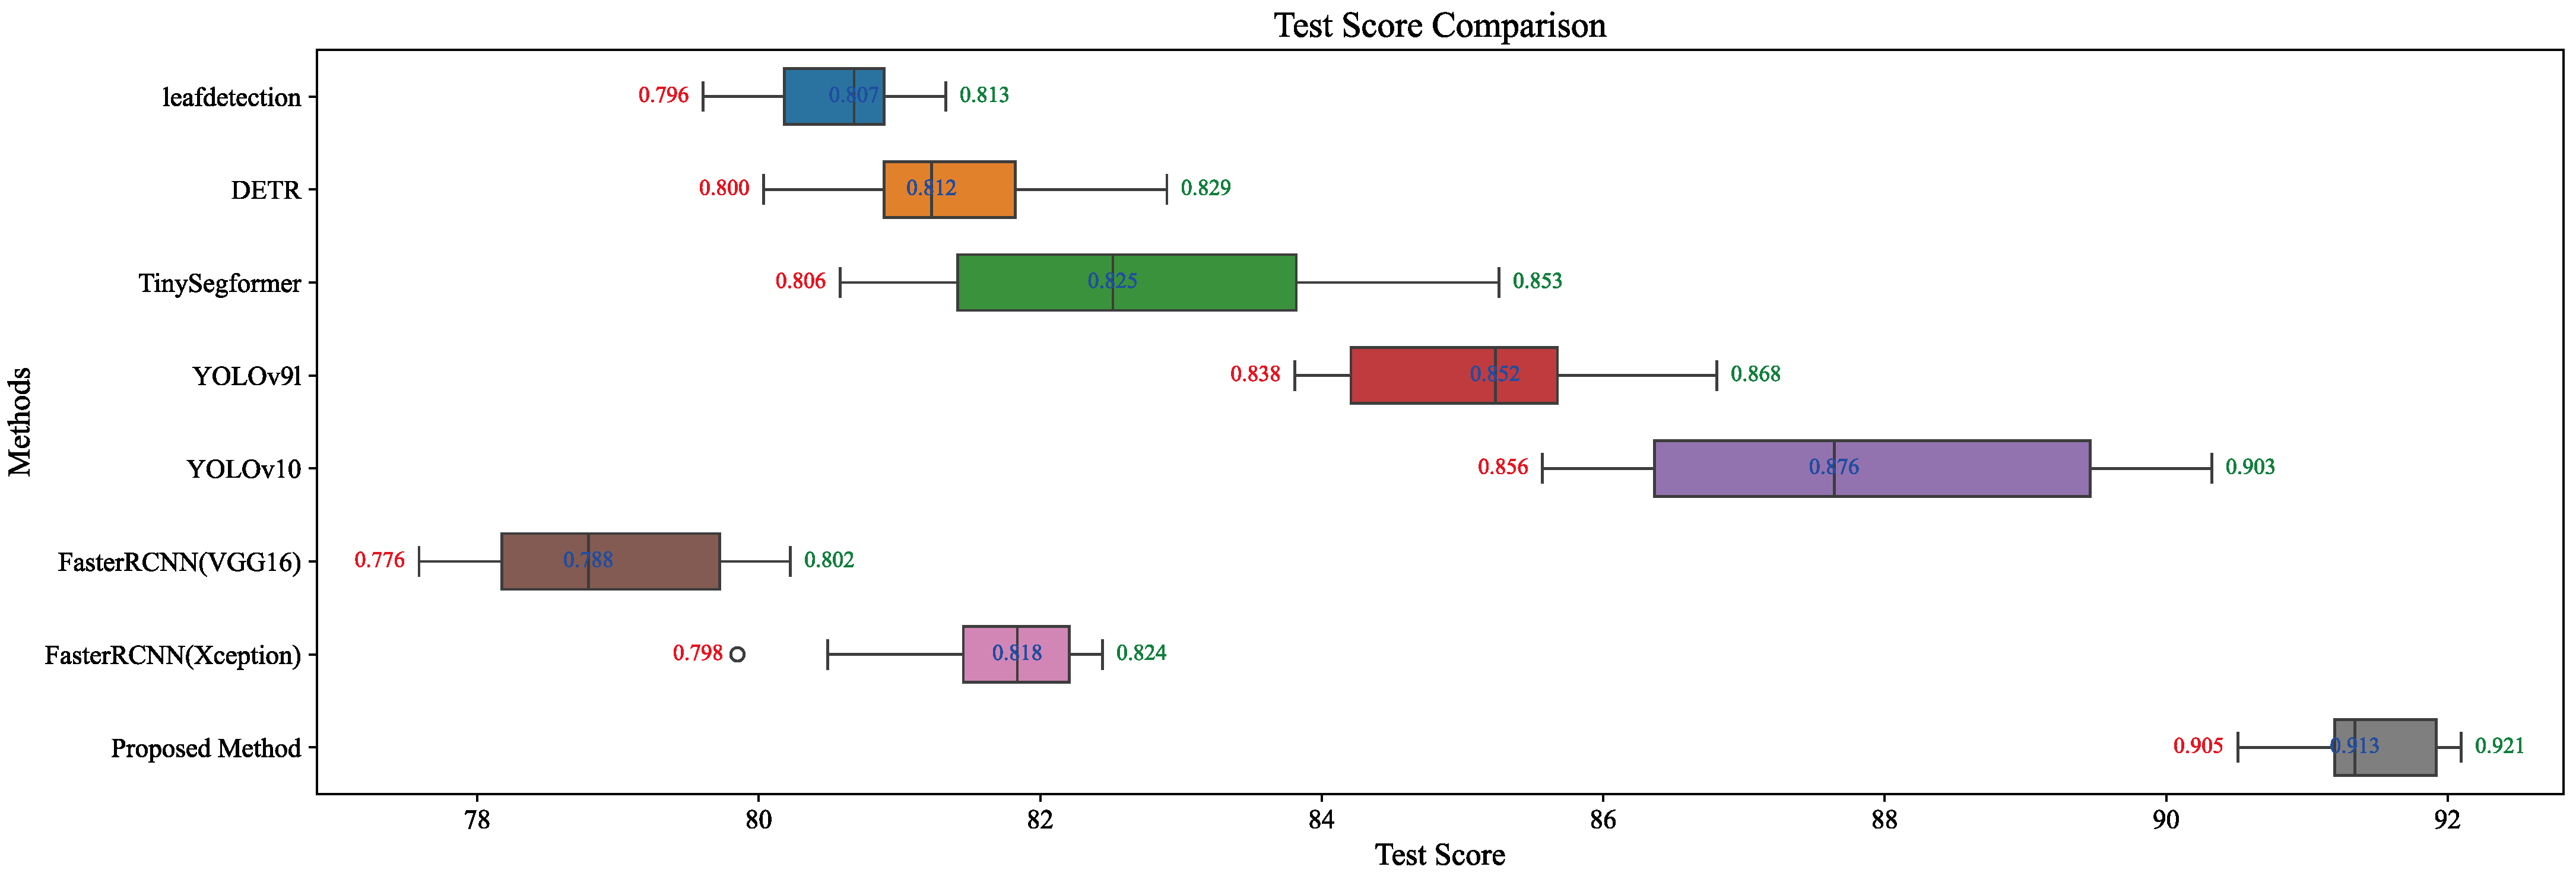
4.1.4. Weed Detection Results

This experiment was designed to compare the performance of different models on weed recognition tasks, evaluate the superiority of the proposed model for this task, and analyze the applicability of various models in real-world applications. The evaluation metrics include precision, recall, accuracy, mAP@50, and mAP@75, which collectively assess the models’ performance in terms of precision, coverage, and overall capability. As shown in Table 2 and Figure 6, the proposed method outperforms all other compared models across all metrics, demonstrating its effectiveness in handling weed detection in complex agricultural scenarios.
Compared to the baseline model, leafdetection, and the classic object detection model DETR, the proposed method improves precision and recall by approximately 10% and 8%, respectively, indicating significant performance enhancements. Additionally, compared to the improved YOLOv10l, the proposed method achieves increases of 1% and 2% in mAP@50 and mAP@75, respectively, showcasing its superior detection capability and robustness.
From a theoretical perspective, the performance differences among these models are primarily attributed to their mathematical properties and architectural designs. The leafdetection model utilizes traditional image segmentation and detection techniques, emphasizing lightweight architecture but lacking the ability to deeply capture contextual information, resulting in lower precision and recall. DETR incorporates a transformer architecture and self-attention mechanisms, allowing it to capture global feature relationships, leading to moderate improvements in precision and mAP. However, its computational complexity imposes performance limitations. TinySegformer combines lightweight design with hierarchical transformer structures, further enhancing global information extraction while reducing computational costs, thus surpassing DETR and leafdetection across multiple metrics. YOLOv9l and YOLOv10l, as efficient object detection models, balance precision and speed by optimizing receptive fields and feature extraction modules. Notably, YOLOv10l achieves improved performance through better multi-scale feature fusion, approaching the results of the proposed method. However, the proposed model introduces semi-supervised diffusion generation networks and generative attention mechanisms, which exhibit significant advantages in feature enhancement and multi-task optimization. Mathematically, the diffusion model generates high-quality pseudo-labels through sampling, effectively addressing the issue of insufficient labeled data. Simultaneously, the generative attention mechanism dynamically allocates feature weights, further improving feature extraction accuracy and efficiency. Consequently, the proposed method’s performance advantages in complex scenarios can be attributed to the rationality of its mathematical design and the synergistic effects of its modules, providing an efficient and robust solution for smart agriculture.

4.1.5. Results Analysis for Different Weed Types Using the Proposed Method

This experiment was conducted to evaluate the applicability and performance stability of the proposed model in detecting different types of weeds. The data in Table 3 reveal that the model’s detection performance varies across weed types, but overall, it exhibits high detection precision and stability. The results indicate that the model performs best on “Setaria viridis,” achieving a precision of 0.97 and mAP@50 and mAP@75 values of 0.95 and 0.94, respectively, demonstrating exceptional effectiveness in identifying weed types with prominent features. However, for “Amaranthus rudis,” precision and recall drop to 0.90 and 0.87, respectively, and mAP metrics are relatively lower. This discrepancy highlights the model’s limitations in handling weeds with less distinct visual features or those that closely resemble background elements. Such differences suggest that the morphological characteristics of different weed types and their complexity in relation to the background significantly impact detection performance.
Theoretically, these results are closely related to the distribution of weed features and the mathematical properties of the model. The superior performance on “Setaria viridis” can be attributed to its highly distinguishable morphological characteristics, such as clear edges and textured details. During the feature extraction stage, the generative attention mechanism effectively captures and enhances these prominent features. Specifically, the mechanism dynamically adjusts the weights of generated features and real features, enhancing information representation for target regions. The attention weight matrix is computed as W = softmax ( F g · F r ) , ensuring priority is given to distinguishing features. In contrast, for “Amaranthus rudis,” with complex backgrounds or indistinct features, the model may face instability in generating pseudo-labels, which could hinder the optimization of pseudo-supervised loss L u . Since L u depends on high-confidence pseudo-labels, samples failing to meet the confidence threshold τ may not be adequately utilized. Furthermore, the diffusion-generated features may be susceptible to noise interference in complex scenes, leading to misalignment between generated and real data. These mathematical constraints further suggest that while the proposed model significantly improves detection performance, additional optimizations may be required to enhance its robustness and generalization in challenging scenarios.

4.1.6. Test on Other Aerial-Based Detection Tasks

To further evaluate the robustness of the proposed method, we borrowed the research approach from [43] and extended it by testing our model on aerial view datasets. Specifically, we selected the open Kaggle dataset [44] for testing to assess the applicability of the proposed method in a broader set of data sources. This experiment was conducted to verify how well the model performs on aerial imagery and to confirm its robustness in different types of datasets, which may have different feature characteristics compared to ground-level data. The results are shown in the Table 4:
The results demonstrate that the proposed model performs well on both the Kaggle dataset and the dataset used in this paper. Although there is a slight drop in performance when tested on the Kaggle dataset, the overall results remain impressive, showing that the model maintains strong accuracy and generalization even when applied to aerial view data. The minor difference in performance between the two datasets may be attributed to the variations in image quality, acquisition conditions, and feature characteristics between ground-level and aerial imagery. However, the results suggest that the proposed model is capable of adapting to different data sources, further validating its robustness in various agricultural detection tasks. In conclusion, the experiment confirms that the proposed method, originally trained on ground-level data, is also highly applicable to aerial imagery. This strengthens the applicability of the model for large-scale weed detection tasks, especially in remote sensing and UAV-based applications. Future work may involve further optimizing the model to bridge the performance gap across different types of agricultural data sources and exploring additional datasets with more diverse environmental factors.

4.2. Discussion

4.2.1. Discussion on Different Data Augmentation Methods

Data augmentation plays a crucial role in enhancing the performance of deep learning models, particularly when labeled data are limited. In the context of agricultural image analysis, including weed detection, data augmentation techniques help increase the diversity and quantity of training samples, making the model more robust and improving its generalization ability. This section discusses the effects of different data augmentation methods, including CutOut, MixUp, and GridMask, on the performance of the proposed model. These methods were applied individually and in combination to assess their impact on key evaluation metrics, such as precision, recall, accuracy, and mAP@50/mAP@75. An ablation experiment was conducted to compare the performance of the model under different augmentation conditions. The results are shown in Table 5.
The results indicate that data augmentation significantly improves the performance of the model across all metrics. The model’s performance is enhanced by each individual augmentation method, with MixUp showing the most notable improvement in precision, recall, and mAP metrics. Specifically, MixUp contributes to a better balance between the diversity of data and the reduction of overfitting, which helps the model to generalize better. On the other hand, GridMask and CutOut also improve performance by forcing the model to focus on different parts of the image, promoting the learning of more robust features. When combined, CutOut, MixUp, and GridMask together yield the best results, with the highest values for precision, recall, accuracy, and mAP metrics, indicating the complementary nature of these augmentation methods. In summary, the results highlight the significant impact of data augmentation on the model’s performance. Combining different augmentation techniques maximizes the benefits, as each method enhances different aspects of feature learning and robustness. These findings reinforce the importance of employing data augmentation strategies, particularly in agricultural image analysis, where data are often limited and diverse. Future work can explore additional augmentation techniques and investigate their effects on the model’s generalization capability in more diverse agricultural environments.

4.2.2. Ablation Study on Different Learning Methods

The objective of this experiment is to analyze the impact of different learning methods on the performance of the weed detection model and to verify the superiority of the proposed semi-supervised attention mechanism. The experimental results, as shown in Table 6, indicate that both GAN and VAE, as semi-supervised learning methods, exhibit improved detection accuracy compared to standard attention mechanisms.

4.3. Exploratory Data Analysis

In the exploratory data analysis (EDA) section of this study, the performance of different models on the weed detection task was compared, and the experimental results were visualized using violin plots and box plots, as shown in Figure 7 and Figure 8. These analyses provide an intuitive understanding of the distribution of model performance and highlight the advantages of the proposed method.
From the violin plot, significant differences in score distributions among the models can be observed. The traditional methods, leafdetection and DETR, exhibit relatively concentrated distributions but lower overall scores, mainly within the ranges of 80–82 and 81–83, respectively. This indicates their limitations in complex agricultural scenarios. TinySegformer, incorporating a lightweight transformer architecture, achieves a certain performance improvement over DETR, with its score range extending to 82–85. However, instability in detection results is still observed in some cases. YOLOv9 and YOLOv10l, as improved object detection models, enhance receptive fields and feature extraction capabilities, leading to significantly higher scores, with YOLOv10l achieving a score distribution between 85 and 90. Notably, the proposed method outperforms all other models, exhibiting the highest average score (close to 92) and the most compact distribution, indicating superior robustness across different test samples, lower variance, and higher prediction stability. The box plot further illustrates the score ranges and outlier distribution of each model. It can be observed that leafdetection and Faster R-CNN (VGG16) have relatively large interquartile ranges (IQRs), suggesting that their performance varies considerably across different samples. In contrast, the proposed method has the smallest IQR, demonstrating the stability of its detection results. Furthermore, based on the p-value statistics, the proposed method exhibits a statistically significant advantage over other models, further validating its superior performance in the weed detection task.

Limitations and Future Work

Despite achieving significant performance improvements in weed detection tasks, several limitations remain that require further exploration in future research. First, the performance of the semi-supervised generative model heavily depends on the quality of the pseudo-labels, which are influenced by the complexity of unlabeled data and the generalization capacity of the generative model. When the background information is complex or the weed target features are ambiguous, the pseudo-labels may contain noise or bias, potentially impacting the training effectiveness and generalization performance of the model. Additionally, the data augmentation techniques employed in this study, such as CutOut, MixUp, and GridMask, while effectively enhancing the robustness and generalization capability of the model by increasing data diversity, may still face challenges under complex backgrounds or varying lighting conditions. These methods might not be the highest priority technique to rely on in such scenarios, and a more comprehensive and diversified augmentation pipeline could be devised to better handle the intricacies of agricultural image data.
Moreover, although the diffusion model demonstrates exceptional performance in generating high-quality and diverse data, its generation process involves multiple iterative computations, resulting in extended training times and high computational costs. This limitation may pose challenges in practical applications, particularly under resource and time constraints. Furthermore, in the proposed generative attention mechanism, the issue of generating features that may introduce noise has not been explicitly addressed. In situations where complex backgrounds or target features are not obvious, this noise may affect the performance of the model. Future work should explore ways to optimize the feature generation process and minimize the introduction of noise, ensuring more accurate feature generation and improving the model’s robustness in complex scenarios. Finally, while the dataset established in this study covers various weed types and growth environments, certain weed species or environmental characteristics specific to other global regions may remain unaddressed. As a result, the model’s generalization capability in these scenarios requires further validation.

5. Conclusions

Weed recognition and detection are critical research topics in smart agriculture, playing a significant role in improving agricultural productivity and reducing environmental pollution. To address challenges such as limited labeled data, diverse weed types, and high morphological similarity between weeds and crops in agricultural scenarios, a weed detection model based on a semi-supervised diffusion generative network is proposed. This model incorporates a generative attention mechanism and semi-diffusion loss, forming an efficient semi-supervised learning framework. Experimental results demonstrate that the proposed model significantly outperforms existing methods across multiple evaluation metrics, achieving a precision of 0.94, recall of 0.90, accuracy of 0.92, and mAP@50 and mAP@75 of 0.92 and 0.91, respectively. These results validate the robustness and detection capability of the model in complex agricultural scenarios. Compared to traditional methods such as DETR, the proposed method improves precision and recall by approximately 8%. Furthermore, compared to the enhanced YOLOv10, mAP metrics are increased by 1% to 2%, further demonstrating the model’s superiority.The key innovations of this study are as follows: First, the introduction of the diffusion model for pseudo-label generation effectively utilizes unlabeled data, significantly improving performance under limited labeled data conditions. Second, the generative attention mechanism dynamically fuses generated features with real features, enhancing the representation of target regions. Third, the semi-diffusion loss combines supervised loss from labeled data with pseudo-supervised loss from unlabeled data, enabling collaborative multi-task optimization. Additionally, experimental analyses provide in-depth insights into the impact of different attention mechanisms and generative methods on weed detection performance, highlighting the crucial role of feature fusion between generated and real features in improving model performance. In conclusion, the proposed model and methodology offer an efficient and robust solution for weed detection in agricultural scenarios. Not only does the model surpass existing methods in performance, but it also provides new perspectives and practical foundations for further research on the application of semi-supervised learning in smart agriculture. Future studies can focus on improving the efficiency and generalization capability of the model and extending its application to broader agricultural scenarios, thereby advancing the development and practice of smart agriculture.

Author Contributions

Conceptualization, R.L., X.W. and Y.C.; Data curation, Y.Z. and X.T.; Formal analysis, Y.X. and C.J.; Funding acquisition, H.D. and S.Y.; Investigation, Y.X.; Methodology, R.L., X.W., Y.C. and C.J.; Project administration, H.D. and S.Y.; Resources, Y.Z., X.T. and Y.S.; Software, R.L., X.W. and Y.C.; Supervision, Y.S., H.D. and S.Y.; Validation, Y.X. and C.J.; Visualization, Y.Z., X.T. and Y.S.; Writing—original draft, R.L., X.W., Y.C., Y.X., Y.Z., X.T., C.J., Y.S., H.D. and S.Y. All authors have read and agreed to the published version of the manuscript.

Funding

This research was funded by The National Key Research and Development Program of China (2024YFC2607600).

Data Availability Statement

The data presented in this study are available on request from the corresponding author.

Conflicts of Interest

The authors declare no conflicts of interest.

References

  1. Kumar, A.; Sharma, P. Impact of climate variation on agricultural productivity and food security in rural India. Soc. Sci. Res. Netw. 2022. [Google Scholar] [CrossRef]
  2. Chouhan, G.K.; Verma, J.P.; Jaiswal, D.K.; Mukherjee, A.; Singh, S.; de Araujo Pereira, A.P.; Liu, H.; Abd_Allah, E.F.; Singh, B.K. Phytomicrobiome for promoting sustainable agriculture and food security: Opportunities, challenges, and solutions. Microbiol. Res. 2021, 248, 126763. [Google Scholar] [CrossRef] [PubMed]
  3. Zhang, Y.; Yang, X.; Liu, Y.; Zhou, J.; Huang, Y.; Li, J.; Zhang, L.; Ma, Q. A time-series neural network for pig feeding behavior recognition and dangerous detection from videos. Comput. Electron. Agric. 2024, 218, 108710. [Google Scholar] [CrossRef]
  4. Esposito, M.; Westbrook, A.S.; Maggio, A.; Cirillo, V.; DiTommaso, A. Neutral weed communities: The intersection between crop productivity, biodiversity, and weed ecosystem services. Weed Sci. 2023, 71, 301–311. [Google Scholar] [CrossRef]
  5. Zhang, Y.; Wa, S.; Liu, Y.; Zhou, X.; Sun, P.; Ma, Q. High-accuracy detection of maize leaf diseases CNN based on multi-pathway activation function module. Remote Sens. 2021, 13, 4218. [Google Scholar] [CrossRef]
  6. Monteiro, A.; Santos, S. Sustainable approach to weed management: The role of precision weed management. Agronomy 2022, 12, 118. [Google Scholar] [CrossRef]
  7. Adeux, G.; Cordeau, S.; Antichi, D.; Carlesi, S.; Mazzoncini, M.; Munier-Jolain, N.; Bàrberi, P. Cover crops promote crop productivity but do not enhance weed management in tillage-based cropping systems. Eur. J. Agron. 2021, 123, 126221. [Google Scholar] [CrossRef]
  8. Choudhary, A.K.; Yadav, D.; Sood, P.; Rahi, S.; Arya, K.; Thakur, S.; Lal, R.; Kumar, S.; Sharma, J.; Dass, A.; et al. Post-Emergence herbicides for effective weed management, enhanced wheat productivity, profitability and quality in North-Western Himalayas: A ‘Participatory-Mode’Technology Development and Dissemination. Sustainability 2021, 13, 5425. [Google Scholar] [CrossRef]
  9. Rai, N.; Zhang, Y.; Ram, B.G.; Schumacher, L.; Yellavajjala, R.K.; Bajwa, S.; Sun, X. Applications of deep learning in precision weed management: A review. Comput. Electron. Agric. 2023, 206, 107698. [Google Scholar] [CrossRef]
  10. Vasileiou, M.; Kyrgiakos, L.S.; Kleisiari, C.; Kleftodimos, G.; Vlontzos, G.; Belhouchette, H.; Pardalos, P.M. Transforming weed management in sustainable agriculture with artificial intelligence: A systematic literature review towards weed identification and deep learning. Crop Prot. 2024, 176, 106522. [Google Scholar] [CrossRef]
  11. Upadhyay, A.; Sunil, G.; Zhang, Y.; Koparan, C.; Sun, X. Development and evaluation of a machine vision and deep learning-based smart sprayer system for site-specific weed management in row crops: An edge computing approach. J. Agric. Food Res. 2024, 18, 101331. [Google Scholar] [CrossRef]
  12. Saleh, A.; Olsen, A.; Wood, J.; Philippa, B.; Azghadi, M.R. Semi-Supervised Weed Detection for Rapid Deployment and Enhanced Efficiency. arXiv 2024, arXiv:2405.07399. [Google Scholar]
  13. Muvva, V.B.R.; Kumpati, R.; Skarka, W. Efficient Weed Detection Using CNN with an Autonomous Robot. In Proceedings of the 2024 2nd International Conference on Unmanned Vehicle Systems-Oman (UVS), Muscat, Oman, 12–14 February 2024; pp. 1–7. [Google Scholar]
  14. Narayana, C.L.; Ramana, K.V. An efficient real-time weed detection technique using YOLOv7. Int. J. Adv. Comput. Sci. Appl. 2023, 14, 65. [Google Scholar] [CrossRef]
  15. Li, J.; Chen, D.; Yin, X.; Li, Z. Performance evaluation of semi-supervised learning frameworks for multi-class weed detection. Front. Plant Sci. 2024, 15, 1396568. [Google Scholar] [CrossRef] [PubMed]
  16. Zhang, X.; Cui, J.; Liu, H.; Han, Y.; Ai, H.; Dong, C.; Zhang, J.; Chu, Y. Weed identification in soybean seedling stage based on optimized Faster R-CNN algorithm. Agriculture 2023, 13, 175. [Google Scholar] [CrossRef]
  17. Yan, J.; Wang, X. Unsupervised and semi-supervised learning: The next frontier in machine learning for plant systems biology. Plant J. 2022, 111, 1527–1538. [Google Scholar] [CrossRef] [PubMed]
  18. Garibaldi-Márquez, F.; Flores, G.; Mercado-Ravell, D.A.; Ramírez-Pedraza, A.; Valentín-Coronado, L.M. Weed classification from natural corn field-multi-plant images based on shallow and deep learning. Sensors 2022, 22, 3021. [Google Scholar] [CrossRef] [PubMed]
  19. Trabucco, B.; Doherty, K.; Gurinas, M.; Salakhutdinov, R. Effective data augmentation with diffusion models. arXiv 2023, arXiv:2302.07944. [Google Scholar]
  20. Li, Q.; Zhang, Y. Confidential Federated Learning for Heterogeneous Platforms against Client-Side Privacy Leakages. In Proceedings of the ACM Turing Award Celebration Conference 2024, Changsha, China, 5–7 July 2024; pp. 239–241. [Google Scholar]
  21. Veeragandham, S.; Santhi, H. Optimization enabled Deep Quantum Neural Network for weed classification and density estimation. Expert Syst. Appl. 2024, 243, 122679. [Google Scholar] [CrossRef]
  22. Belissent, N.; Peña, J.M.; Mesías-Ruiz, G.A.; Shawe-Taylor, J.; Pérez-Ortiz, M. Transfer and zero-shot learning for scalable weed detection and classification in UAV images. Knowl.-Based Syst. 2024, 292, 111586. [Google Scholar] [CrossRef]
  23. Zhang, F.; Ren, F.; Li, J.; Zhang, X. Automatic stomata recognition and measurement based on improved YOLO deep learning model and entropy rate superpixel algorithm. Ecol. Inform. 2022, 68, 101521. [Google Scholar] [CrossRef]
  24. Das, S.; Chatterjee, M.; Stephen, R.; Singh, A.K.; Siddique, A. Unveiling the Potential of YOLO v7 in the Herbal Medicine Industry: A Comparative Examination of YOLO Models for Medicinal Leaf Recognition. Int. J. Eng. Res. Technol. 2024, 13. [Google Scholar]
  25. Adhinata, F.D.; Wahyono; Sumiharto, R. A comprehensive survey on weed and crop classification using machine learning and deep learning. Artif. Intell. Agric. 2024, 13, 45–63. [Google Scholar] [CrossRef]
  26. Sujatha, R.; Chatterjee, J.M.; Jhanjhi, N.; Brohi, S.N. Performance of deep learning vs machine learning in plant leaf disease detection. Microprocess. Microsyst. 2021, 80, 103615. [Google Scholar] [CrossRef]
  27. Shorewala, S.; Ashfaque, A.; Sidharth, R.; Verma, U. Weed density and distribution estimation for precision agriculture using semi-supervised learning. IEEE Access 2021, 9, 27971–27986. [Google Scholar] [CrossRef]
  28. Al-Badri, A.H.; Ismail, N.A.; Al-Dulaimi, K.; Salman, G.A.; Khan, A.; Al-Sabaawi, A.; Salam, M.S.H. Classification of weed using machine learning techniques: A review—challenges, current and future potential techniques. J. Plant Dis. Prot. 2022, 129, 745–768. [Google Scholar] [CrossRef]
  29. Li, Y.; Chao, X. Semi-supervised few-shot learning approach for plant diseases recognition. Plant Methods 2021, 17, 1–10. [Google Scholar] [CrossRef] [PubMed]
  30. Moreno, H.; Gómez, A.; Altares-López, S.; Ribeiro, A.; Andújar, D. Analysis of Stable Diffusion-derived fake weeds performance for training Convolutional Neural Networks. Comput. Electron. Agric. 2023, 214, 108324. [Google Scholar] [CrossRef]
  31. Benchallal, F.; Hafiane, A.; Ragot, N.; Canals, R. ConvNeXt based semi-supervised approach with consistency regularization for weeds classification. Expert Syst. Appl. 2024, 239, 122222. [Google Scholar] [CrossRef]
  32. Hu, R.; Su, W.H.; Li, J.L.; Peng, Y. Real-time lettuce-weed localization and weed severity classification based on lightweight YOLO convolutional neural networks for intelligent intra-row weed control. Comput. Electron. Agric. 2024, 226, 109404. [Google Scholar] [CrossRef]
  33. Liu, T.; Jin, X.; Zhang, L.; Wang, J.; Chen, Y.; Hu, C.; Yu, J. Semi-supervised learning and attention mechanism for weed detection in wheat. Crop Prot. 2023, 174, 106389. [Google Scholar] [CrossRef]
  34. Rizve, M.N.; Duarte, K.; Rawat, Y.S.; Shah, M. In defense of pseudo-labeling: An uncertainty-aware pseudo-label selection framework for semi-supervised learning. arXiv 2021, arXiv:2101.06329. [Google Scholar]
  35. Ajayi, O.G.; Ashi, J.; Guda, B. Performance evaluation of YOLO v5 model for automatic crop and weed classification on UAV images. Smart Agric. Technol. 2023, 5, 100231. [Google Scholar] [CrossRef]
  36. Manikandakumar, M.; Karthikeyan, P. Weed classification using particle swarm optimization and deep learning models. Comput. Syst. Sci. Eng. 2023, 44, 913–927. [Google Scholar] [CrossRef]
  37. Sunil, G.; Zhang, Y.; Koparan, C.; Ahmed, M.R.; Howatt, K.; Sun, X. Weed and crop species classification using computer vision and deep learning technologies in greenhouse conditions. J. Agric. Food Res. 2022, 9, 100325. [Google Scholar]
  38. Wang, C.Y.; Yeh, I.H.; Liao, H.Y.M. Yolov9: Learning what you want to learn using programmable gradient information. arXiv 2024, arXiv:2402.13616. [Google Scholar]
  39. Wang, A.; Chen, H.; Liu, L.; Chen, K.; Lin, Z.; Han, J.; Ding, G. Yolov10: Real-time end-to-end object detection. arXiv 2024, arXiv:2405.14458. [Google Scholar]
  40. Zhang, Y.; Wa, S.; Zhang, L.; Lv, C. Automatic plant disease detection based on tranvolution detection network with GAN modules using leaf images. Front. Plant Sci. 2022, 13, 875693. [Google Scholar] [CrossRef] [PubMed]
  41. Zhang, Y.; Lv, C. TinySegformer: A lightweight visual segmentation model for real-time agricultural pest detection. Comput. Electron. Agric. 2024, 218, 108740. [Google Scholar] [CrossRef]
  42. Carion, N.; Massa, F.; Synnaeve, G.; Usunier, N.; Kirillov, A.; Zagoruyko, S. End-to-end object detection with transformers. In European Conference on Computer Vision; Springer: Berlin/Heidelberg, Germany, 2020; pp. 213–229. [Google Scholar]
  43. Rehman, M.U.; Eesaar, H.; Abbas, Z.; Seneviratne, L.; Hussain, I.; Chong, K.T. Advanced drone-based weed detection using feature-enriched deep learning approach. Knowl.-Based Syst. 2024, 305, 112655. [Google Scholar] [CrossRef]
  44. Zhang, Y.; Li, M.; Ma, X.; Wu, X.; Wang, Y. High-precision wheat head detection model based on one-stage network and GAN model. Front. Plant Sci. 2022, 13, 787852. [Google Scholar] [CrossRef] [PubMed]
Figure 1. Dateset samples: (A) is Xanthium spinosum; (B) is Xanthium italicum; (C) is Amaranthus rudis; (D) is Setaria viridis; (E) is Cyclachaena xanthiifolia.
Agriculture 15 00434 g001
Figure 2. Data augmentation methods used in this paper.
Agriculture 15 00434 g002
Figure 3. The figure illustrates the overall framework of the proposed semi-supervised diffusion weed detection network (SSDWDN).
Agriculture 15 00434 g003
Figure 4. The figure illustrates the overall structure of the proposed SSDDGL. The network consists of a teacher encoder, a student encoder, a generative diffusion loss module, and a discriminative loss module.
Agriculture 15 00434 g004
Figure 5. Generative attention mechanism architecture.
Agriculture 15 00434 g005
Figure 6. Visualization of weed detection results on different methods.
Agriculture 15 00434 g006
Figure 7. EDA violin plots.
Agriculture 15 00434 g007
Figure 8. EDA box plots.
Agriculture 15 00434 g008
Table 1. Number of images for different weed types.
Weed TypeNumber of Images
Setaria viridis1591
Xanthium spinosum842
Cyclachaena xanthiifolia2094
Xanthium italicum1796
Amaranthus rudis1339
Table 2. Performance evaluation of different models on weed recognition tasks.
ModelPrecisionRecallAccuracymAP@50mAP@75FPS
leafdetection [40]0.830.800.810.820.8023.1
DETR0.840.820.830.840.8218.9
TinySegformer [41]0.860.840.850.860.8434.7
YOLO v9l0.880.860.870.880.8645.8
YOLO v10l0.910.890.900.910.8943.6
FasterRCNN (VGG16)0.810.790.800.810.7918.9
FasterRCNN (Xception)0.840.820.820.840.8023.5
Proposed Method0.940.900.920.920.9133.5
Table 3. Detection performance for different weed types.
Weed TypePrecisionRecallAccuracymAP@50mAP@75
Setaria viridis0.970.930.950.950.94
Xanthium spinosum0.950.910.930.930.92
Cyclachaena xanthiifolia0.930.890.910.910.90
Xanthium italicum0.920.880.900.900.89
Amaranthus rudis0.900.870.880.870.86
Table 4. Performance test on other dataset.
ModelPrecisionRecallAccuracymAP@50mAP@75FPS
DETR0.700.710.700.680.6518.9
YOLO v9l0.720.710.720.700.6845.8
YOLO v10l0.710.690.700.650.6243.6
FasterRCNN (VGG16)0.670.610.630.650.6118.9
FasterRCNN (Xception)0.670.620.640.650.6223.5
Proposed Method0.750.720.720.720.6933.5
Table 5. Ablation experiment results on different data augmentation methods.
Augmentation MethodPrecisionRecallAccuracymAP@50mAP@75
No Augmentation0.850.800.820.850.83
CutOut0.880.840.860.870.85
MixUp0.900.860.880.890.87
GridMask0.890.850.870.880.86
CutOut + MixUp + GridMask0.940.900.920.920.91
Table 6. Ablation study on different learning methods.
ModelPrecisionRecallAccuracymAP@50mAP@75FPS
GAN (Semi-Supervised)0.720.690.710.710.7028.5
VAE (Semi-Supervised)0.870.830.850.840.8341.9
Standard Self-Attention0.890.850.860.840.8118.3
CBAM0.850.810.830.830.8231.6
Semi-Supervised Attention0.940.900.920.920.9133.5
Disclaimer/Publisher’s Note: The statements, opinions and data contained in all publications are solely those of the individual author(s) and contributor(s) and not of MDPI and/or the editor(s). MDPI and/or the editor(s) disclaim responsibility for any injury to people or property resulting from any ideas, methods, instructions or products referred to in the content.

