Article

Bionic Optimal Design and Performance Study of Soil Loosening Shovels for Degraded Grasslands

1
College of Engineering, China Agricultural University, No. 17 Qinghua East Road, Haidian District, P.O. Box 134, Beijing 100083, China
2
School of Agricultural Engineering and Food Science, Shandong University of Technology, Zibo 255091, China
*
Author to whom correspondence should be addressed.
Agriculture 2025, 15(5), 487; https://doi.org/10.3390/agriculture15050487
Submission received: 6 February 2025 / Revised: 18 February 2025 / Accepted: 21 February 2025 / Published: 24 February 2025
(This article belongs to the Section Agricultural Technology)

Abstract

:
To improve the soil loosening effects of degraded grasslands, this study investigates the performance of a bionic loosening shovel designed based on the claws of prairie zokor. A single-factor simulation test of the bionic loosening shovel was conducted using EDEM software to analyze the effects of loosening depth (H) and operating speed (V) on key parameters, including the ridge disturbance area (As), furrow disturbance area (Af), loosening resistance (Fr), and trench specific resistance (Fc). Additionally, field tests were performed to validate the simulation results of the bionic loosening shovel. The findings indicate that the difference ratio (Da1) between the simulated and test values for the bionic loosening shovel remained consistently low, confirming the reliability of the simulation model in predicting variations in response parameters. Furthermore, comparative field tests were conducted to evaluate the loosening performance of the bionic loosening shovel against standard loosening shovels (the diamond-shaped loosening shovel and the arrow-shaped loosening shovel). The results show that the bionic loosening shovel achieved the lowest values for As, Af, and Fr under the same operating parameters. However, its effect on improving Af was limited. These findings provide valuable technical support for the enhancement and optimization of loosening shovels for degraded grasslands.

1. Introduction

Natural grasslands serve as a vital ecological security barrier, playing a strategic role in maintaining biodiversity and promoting ecological sustainability [1]. China possesses extensive grassland resources, which cover approximately 40% of the country’s total land area [2]. The grassland ecosystems in northern China primarily consist of meadow steppe and typical steppe [3,4]. The dominant grass species in these grasslands are perennial rhizomatous grasses, such as Leymus chinensis, which play a crucial role in the ecological composition and functionality of these ecosystems. Driven by multiple factors, grassland degradation has become an increasingly prominent issue on a national scale. For example, external factors, such as climate change, overgrazing, and natural fires [5,6,7], lead to a reduction in surface vegetation. Meanwhile, internal factors, such as the biological characteristics of Leymus chinensis [8,9], contribute to degradation. The well-developed root system of Leymus chinensis intertwines with the soil, forming a root-soil complex. The structure reduces its permeability and aeration and ultimately inhibits the growth of Leymus chinensis [10,11].
At present, there are two primary approaches to improving degraded grasslands. Ecological restoration methods, including fenced enclosures and rotational grazing systems [12,13], enhance surface vegetation coverage. Mechanical improvement methods, including root cutting, soil loosening, and fertilization [14,15,16,17], employ mechanical equipment to break up the root-soil complex and replenish soil nutrients and fertility. As a critical component of mechanical improvement methods, mechanized soil loosening methods can effectively break the root-soil complex and enhance soil air permeability and water permeability [18,19]. However, mechanical soil loosening technologies for grasslands in China still rely on traditional mechanical soil loosening technologies for farmland. The insufficient integration between the agronomic requirements of mechanical improvement and the loosening shovels leads to significant resistance during operation, resulting in unsatisfactory loosening effects on the grassland. This issue has become the primary bottleneck restricting the development of mechanized improvement technology for degraded grasslands.
To enhance the soil loosening effects on degraded grasslands, numerous scholars have conducted research on the following technologies. (1) Study on soil loosening modes. Huang et al. [20] proposed a combined vibration and deep loosening technology, which was applied to degraded grasslands in the Song-nen Plain. The results indicated that this technology significantly improved the physical and chemical parameters favorable for grass growth. De Boer et al. [21] proposed a method of loosening grasslands by lifting the turf. The results demonstrated that this method effectively reduces soil compaction and improves soil structure, although its effects on forage yield and nitrogen uptake were limited. (2) Study on the interaction between loosening a shovel and soil. Zhang et al. [4] conducted disturbance tests on degraded grasslands using four plow points at different tillage depths and shank spacings. The study analyzed the soil disturbance characteristics following the operations and developed a soil disturbance response model based on the results. He et al. [22] performed furrow opening experiments on grasslands with three passive subsoiler-type openers at varying working depths and examined the influence of working depth on working resistance, disturbance cross-sectional area, and trench area specific resistance. Wang et al. [23] optimized the installation parameters of the subsoiler’s wing using the discrete element method (DEM). The study created a parameter model to evaluate the effects of the upward angle, the mounting height, and the mounting angle on soil loosening efficiency and the soil disturbance area ratio. Liu et al. [24] combined DEM with field experiments to assess the impact of the angle of the subsoiler and the depth of tillage on soil structure and energy requirements. (3) Study on the Influence of Working Environment on Soil Loosening Performance. Sasaki et al. [25] investigated the impact of moisture and clay content on soil disturbance and penetration resistance in different Latosols. They identified optimal moisture ranges for subsoiling in forest plantations and highlighted the variability of these ranges across soil types. Zhou et al. [26] conducted a 9-year, site-specific study in a semi-arid environment, finding that no-tillage and subsoiling improved maize yields and increased soil water storage under variable rainfall conditions. This underscores the long-term benefits of these tillage practices for both soil health and crop performance. The above studies provide valuable references for the optimized design of loosening shovels for grasslands and the improvement of loosening modes in degraded grasslands.
In addition to the above studies, numerous scholars have applied biomimetic engineering to the design of loosening shovels, aiming to enhance their operating effectiveness and reduce loosening resistance. Organisms have evolved over hundreds of millions of years, and their structures exhibit high adaptability to the environment. Therefore, a loosening shovel designed using bionic methods can significantly enhance adaptability to the environment and operational effectiveness. Zhang et al. [27] designed a bionic root cutter inspired by the jaw of the Prosopocoilus astacoides. The results indicated that the cutter improves trenching stability and reduces horizontal resistance. Wang et al. [28] developed a bionic subsoiler based on the ridge structure of shark scales and explored the effects of internal friction angle and riblet height on tillage energy consumption and soil disturbance. Through both DEM and field tests, the results verified that the bionic subsoiler significantly improves soil loosening. Song et al. [29] designed a bionic subsoiler based on the mole claw, constructed an interaction model between the soil and the subsoiler by using DEM, and verified that the bionic subsoiler significantly improves soil loosening through soil bin tests and field tests. Li et al. [30] constructed a model of the interaction between the bionic subsoiler based on the bear claw and soil, analyzing the effects of the working depths and rake angles of the subsoiler on the soil cutting forces and disturbance characteristics. Studies have shown that grassland rodent pest is a major factor in grassland degradation [31,32]. Through their burrowing behavior, these rodents alter soil structure and destroy plant roots. Among these rodents, the prairie zokor is a representative species. Therefore, this study uses the prairie zokor’s paw as a bionic prototype to design a bionic loosening shovel that aims to enhance soil loosening in degraded grasslands.
Studying the interaction between loosening shovels and soil is essential for optimizing the structure of loosening shovels. By analyzing the influence of the structural characteristics and motion parameters of loosening shovels on soil’s mechanical properties, a solid foundation can be established for improving loosening efficiency, reducing energy consumption, and minimizing soil structural damage. In this context, DEM [30] is an effective tool for analyzing the complex dynamic interactions between loosening shovels and soil [33,34]. These studies have primarily focused on predicting and analyzing the working resistance and soil damage caused by loosening shovels. For example, DEM-based simulation optimization tests have been conducted to evaluate the structural parameters of loosening shovels, such as the cutting edge curve, the entry angle, and the handle thickness of the loosening shovel [35,36,37]; DEM has also been used to assess the impact of working parameters like operating speed and loosening depth on the performance of loosening shovels [24,38]. Moreover, DEM has been employed to study the interaction between loosening shovels and soil, exploring the movement and distribution of soil under external loads [39].
Based on previous studies [4,10], this study further integrates bionic engineering with DEM to propose the design of a bionic loosening shovel inspired by the claw of the prairie zokor. By combining DEM simulations with field tests, the working performance of the bionic loosening shovel under various operating parameters is systematically analyzed, addressing the limitations of previous studies in practical application verification and offering a novel approach for the restoration of degraded grasslands. The purpose of this study was to (1) use image processing and reverse engineering methods to obtain the contour curve of the prairie zokor’s claws and establish a 3D model of a bionic loosening shovel based on the curve, (2) combine DEM with field tests to analyze the soil movement patterns and loosening effects at different operating speeds and loosening depths, and (3) conduct a comparative test between the bionic soil loosening shovel and two standard loosening shovels (the diamond-shaped loosening shovel and the arrow-shaped loosening shovel) with different operating parameters.

2. Materials and Methods

2.1. Mechanized Soil Loosening Requirements

Based on the soil structure of grasslands and the growth characteristics of Leymus chinensis, the following mechanical soil loosening requirements are proposed.
  • To minimize damage to the growth environment of Leymus chinensis and soil microorganisms, the fragmentation of soil in the loosening area should be reduced, and soil turning should be avoided.
  • To minimize damage to the roots by the loosening shovels, the loosening depth should exceed the depth of root concentration.
  • To provide an appropriate growth space for the roots of Leymus chinensis and enhance water and nutrient absorption, the deeper soil should be loosened appropriately.
  • Excessive disturbance may further loosen the root-soil layer, increasing wind and water erosion and damaging surface vegetation. Therefore, the disturbance of the root-soil layer during loosening should be minimized.
  • To reduce mechanical energy consumption and improve operational efficiency, the loosening resistance of the shovel should be minimized.

2.2. Bionic Optimal Design of Loosening Shovels

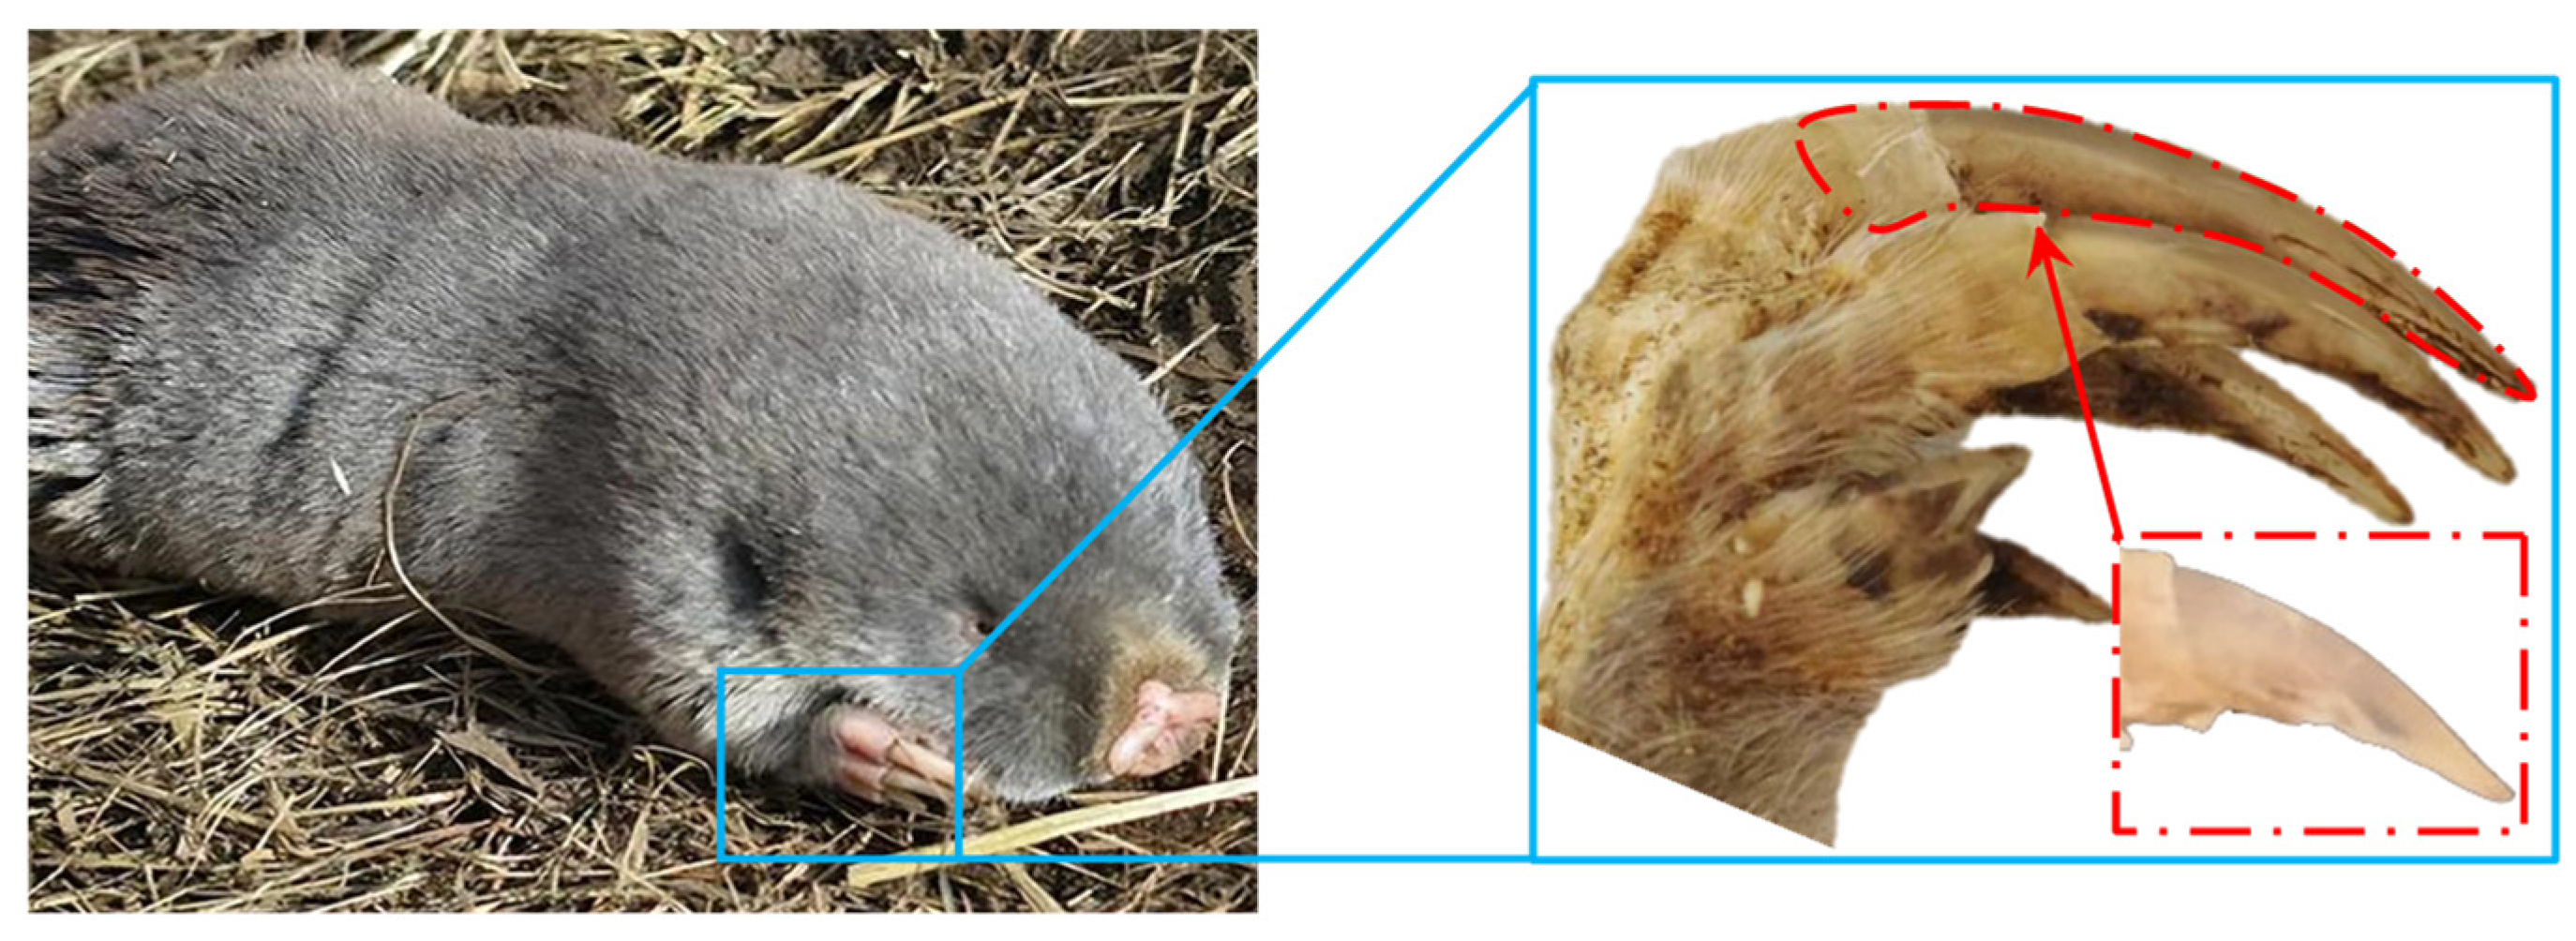
2.2.1. Basic Characteristics of Prairie Zokor

The development of bionics provides an innovative approach to solving engineering problems and achieving breakthroughs in key technologies. A bionic loosening shovel based on the prairie zokor’s paw was designed. The prairie zokor is one of the major destructive species in grassland ecosystems, typically using its claws to dig complex burrows and destroy grassland vegetation. Studies have shown [40] that the prairie zokor primarily uses its front paws for soil excavation, with a digging depth ranging from 180 to 250 mm from the surface. By observing the prairie zokor’s behavior, the largest toe of its front paw (Figure 1) was selected as the bionic object. The process of designing the bionic loosening shovel involved acquiring the bionic object, extracting feature parameters, fitting these features, and constructing a 3D model. The prairie zokor paw used in this study was purchased online.

2.2.2. Contour Feature Extraction and Fitting

The soil-digging action of the prairie zokor’s claws is complex. This study simplifies the action into translational motion, which is the most common motion when loosening shovels interact with the soil. Since the outer surface of the prairie zokor’s front claw is an irregular free-form surface, a non-contact measurement method [29] was employed to obtain the contour information. The specific steps are as follows.
  • The largest toe of the prairie zokor’s paw is shaved off using scissors, then cleaned with an ultrasonic instrument and disinfected with a high-concentration ethanol solution. It is rinsed with water, air-dried naturally, and finally prepared as a sample for spare use.
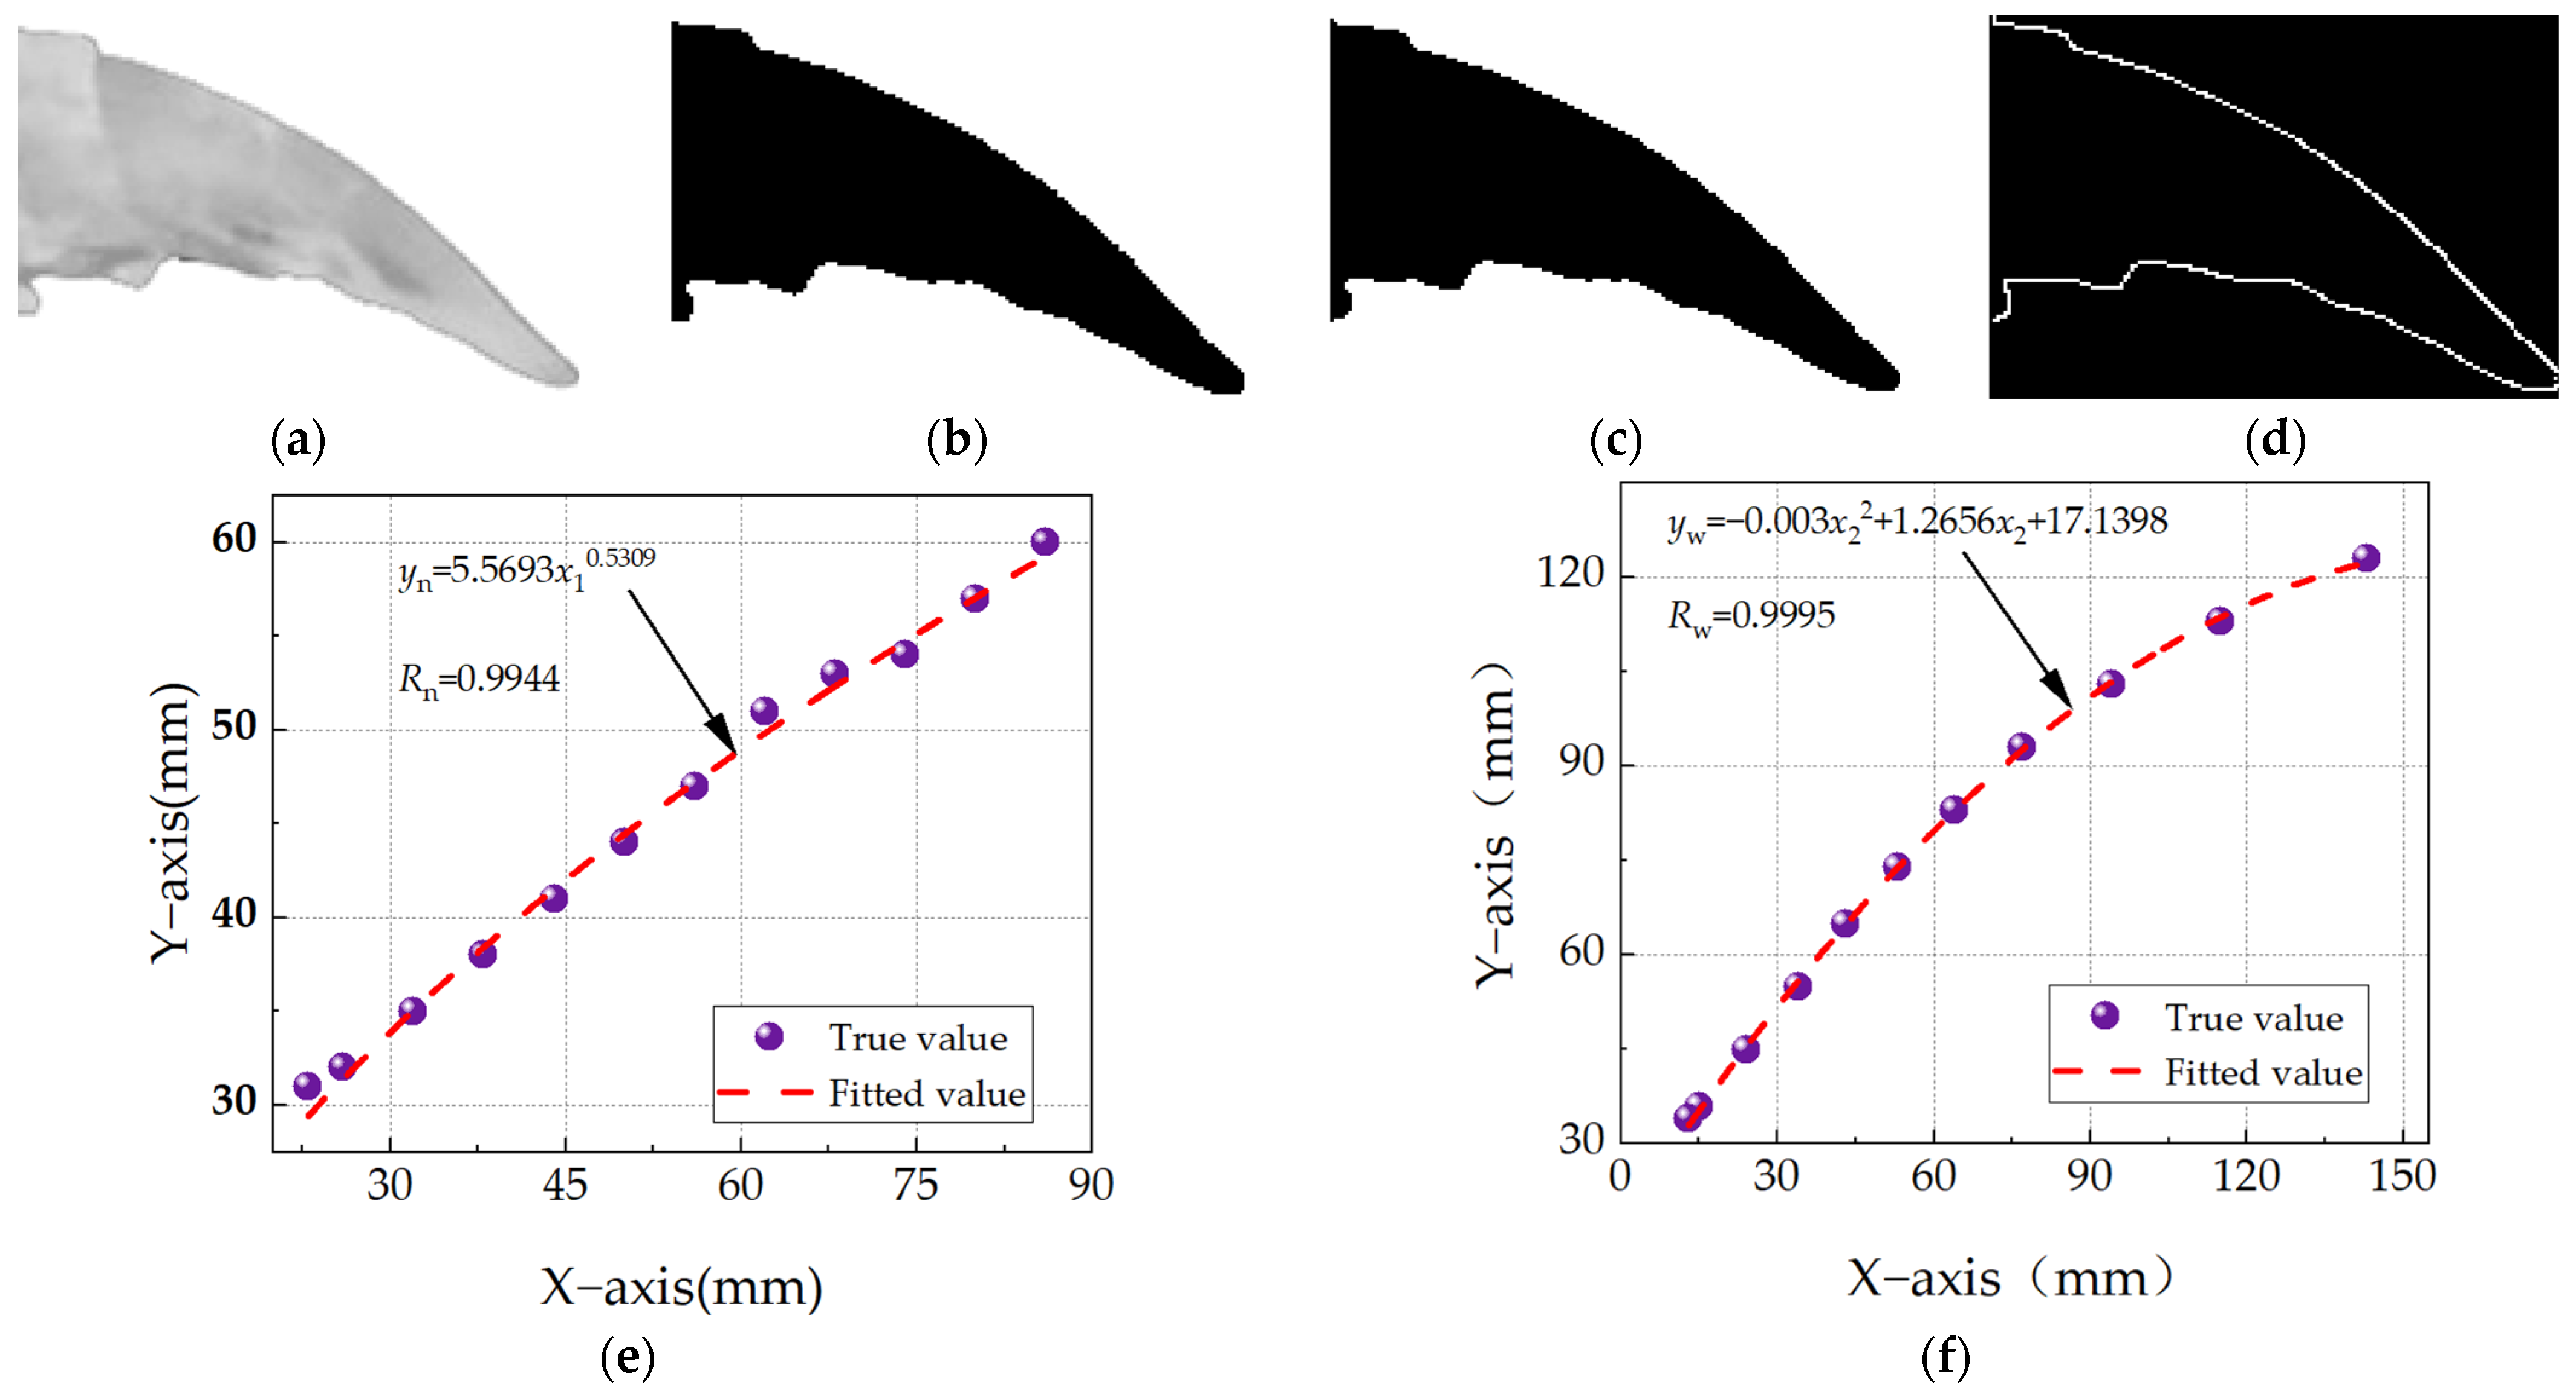
  • A high-definition camera is used to capture an image of the largest toe of the prairie zokor’s paw, which is imported into MATLAB R2021a. Then, the image undergoes grayscale processing (Figure 2a), binarization processing (Figure 2b), and filtering processing (Figure 2c). MATLABs Canny operator is used to detect the edges of the toe (Figure 2d) and extract the point cloud data of the inner and outer contours from the processed images, and point cloud data for both the inner and outer contours are extracted from the processed image.
  • The point cloud data obtained were imported into Origin 2021, where the trajectories of the inner and outer contours of the toe are fitted. Then, the fitting equations were obtained. During the fitting process, the effectiveness of the fitting is evaluated using the coefficients of determination, Rn and Rw. The closer these coefficients were to 1, the better the fit. The fitted trajectories of the inner and outer contours of the toe are shown in Figure 2e,f. The fitting coefficients of the inner and outer trajectories were 0.9944 and 0.9995. The results indicated that the fitted equations accurately characterized the inner and outer contours of the toe.

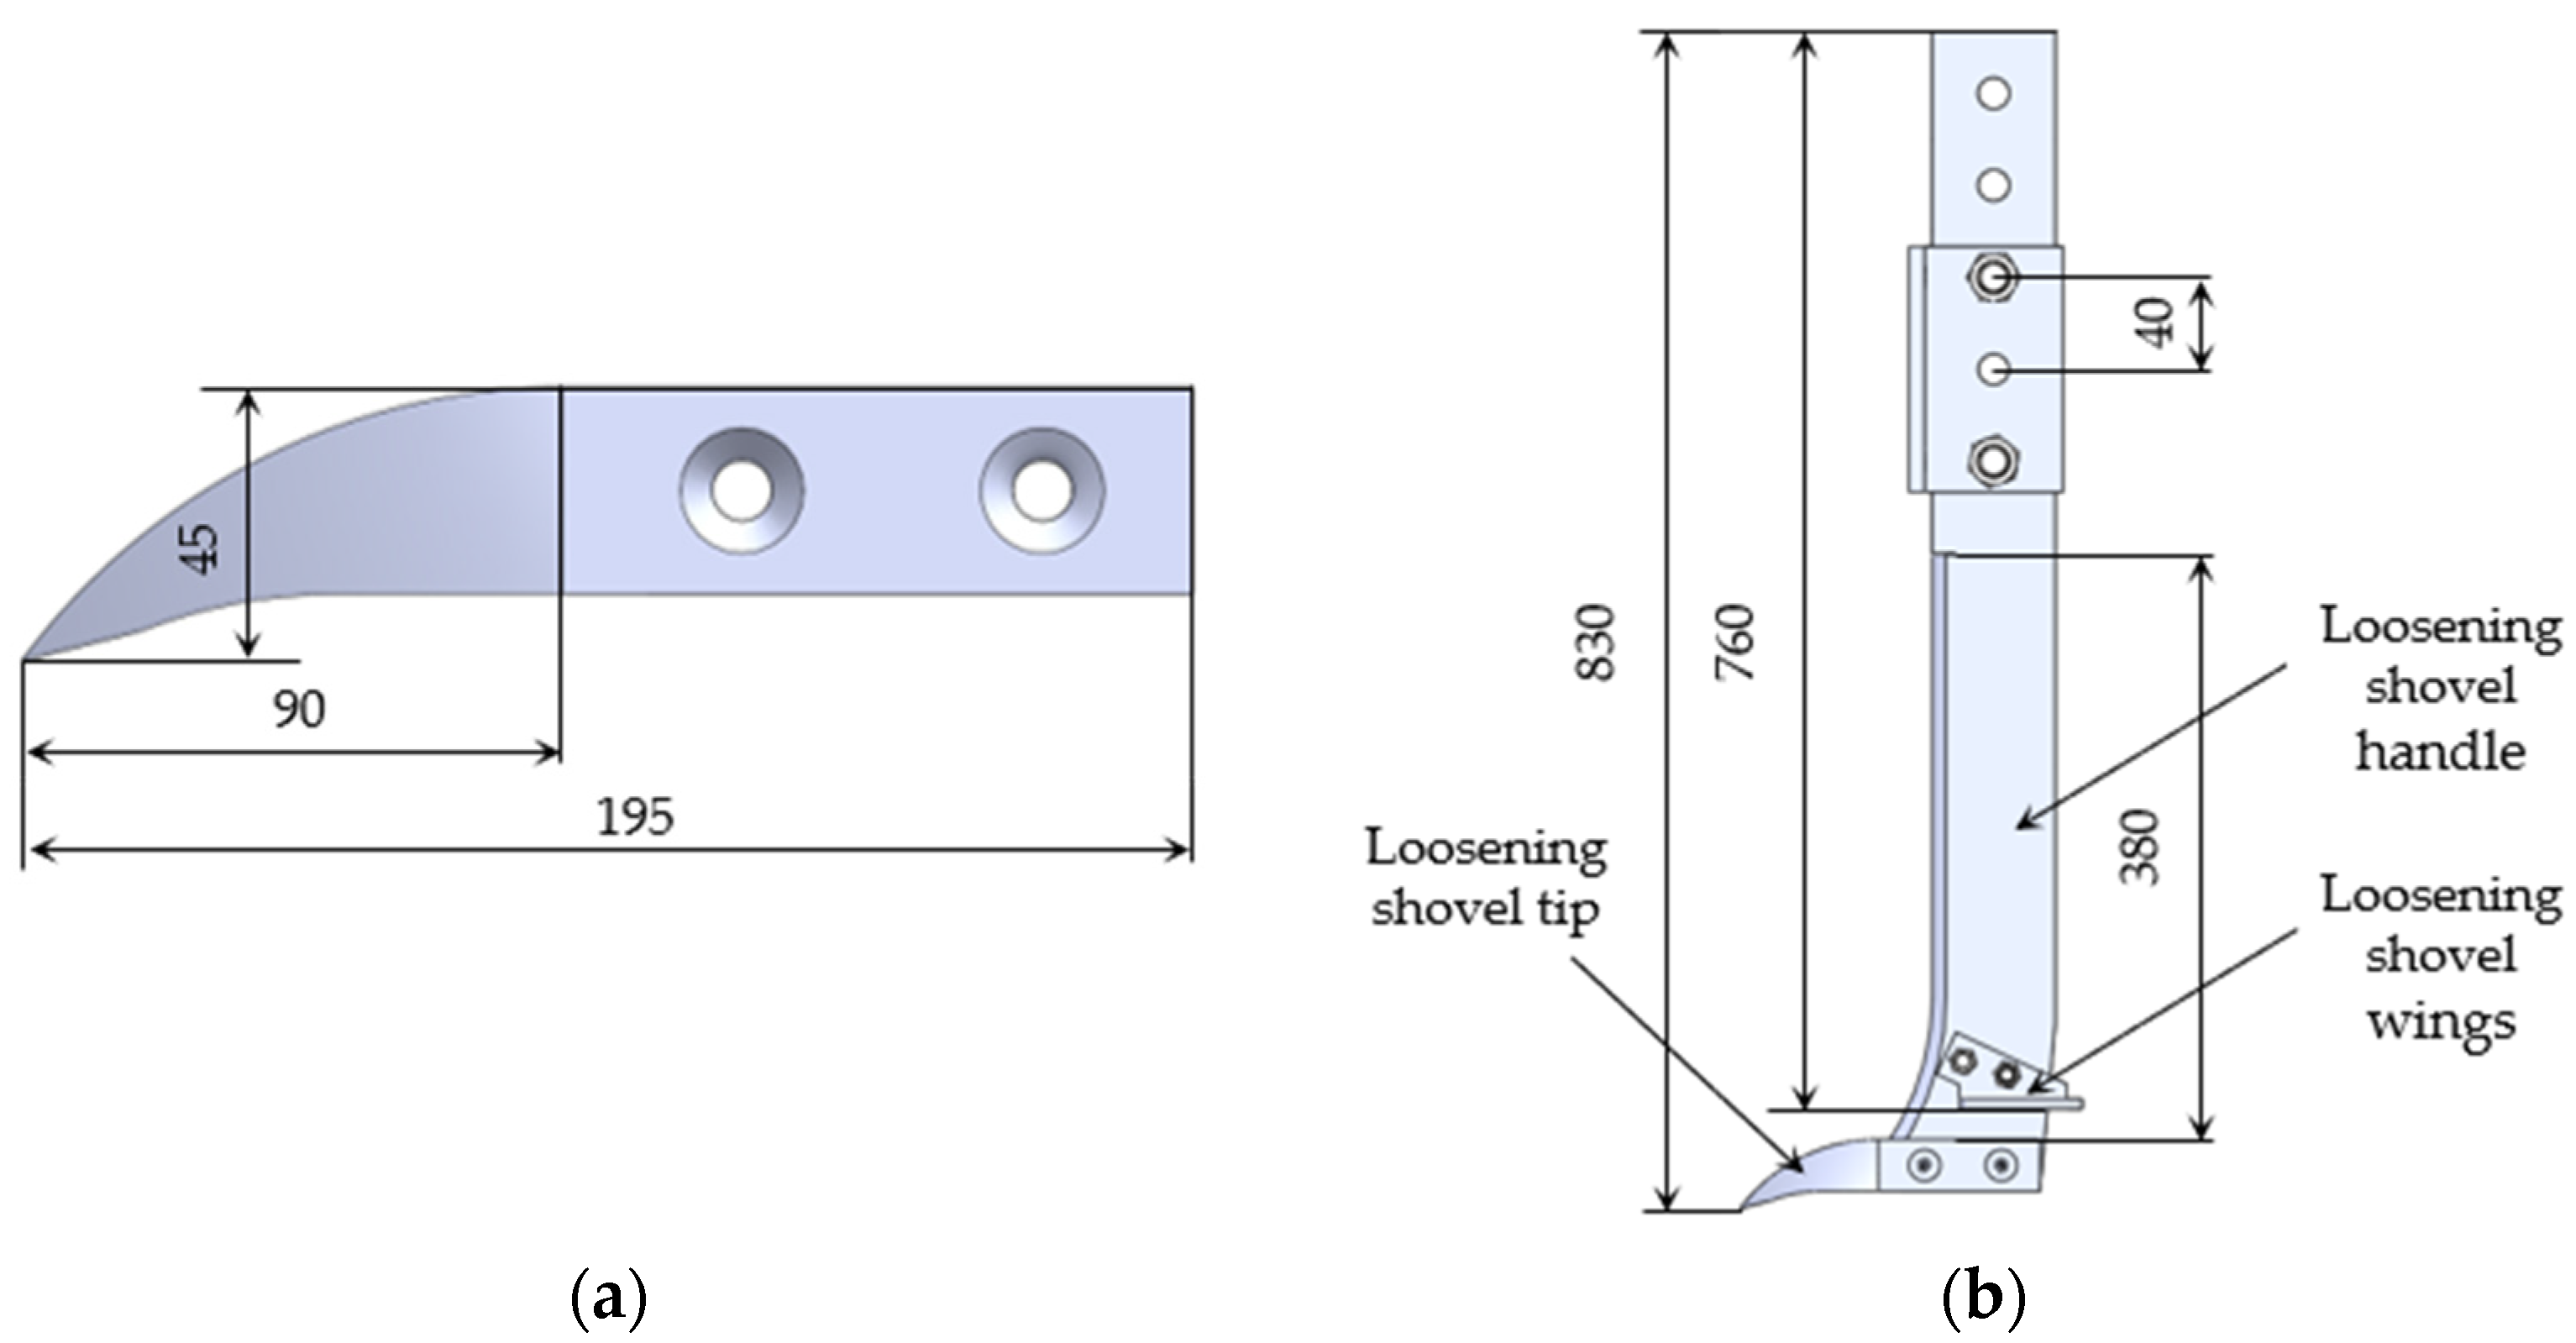
2.2.3. Three-Dimensional Modeling of the Bionic Loosening Shovel

The fitted equations were imported into SolidWorks 2019 to create the 3D model of the bionic loosening shovel. Studies have shown [41] that the width of the loosening shovel tip significantly affects loosening resistance and soil disturbance. A wider loosening shovel tip results in greater soil disturbance, requiring higher cutting force and shear force. To enhance the adaptability of the bionic loosening shovel to the grassland, the shovel tip’s 3D model was scaled up in equal proportions based on the width specified in the Chinese standard (JB/T 9788–1999) [42], as shown in Figure 3a. The bionic loosening shovel consists of the tip, handle, and wings, as illustrated in Figure 3b. The total height of the loosening shovel is 830 mm, with a single loosening depth adjustment of 40 mm, allowing a loosening depth range from 0 to 360 mm. The loosening shovel tip is 195 mm in length, 45 mm in width, and 40 mm in thickness. The blade of the loosening shovel handle measures 380 mm in length and 20 mm in thickness.
When loosening degraded grassland, the bionic loosening shovel compresses the soil on both sides. The soil exerts lateral pressure on the shovel, which is considered passive earth pressure. The soil in this area is silty loam; thus, the lateral pressure on the bionic loosening shovel is
P p = 1 2 c H 2 K p × 10 6
where Pp is the passive earth pressure. c is the unit weight of grassland; Kp is the Rankine passive earth pressure coefficient. H is loosening depth.
According to Equation (1), both the c and Kp are known values and the main factor affecting Pp is H. As H increases, the pressure exerted by the root-soil complex on the bionic loosening shovel increases, thereby raising the loosening resistance of the shovel. Studies have shown that V also significantly impacts soil disturbance characteristics [43]. As V increases, soil disturbance width, surface flatness, and disturbance area also increase. Therefore, investigating the operational effects of the bionic loosening shovel under varying V and H is crucial. This will be analyzed in greater detail in the following sections of this study.

2.3. Discrete Element Simulation

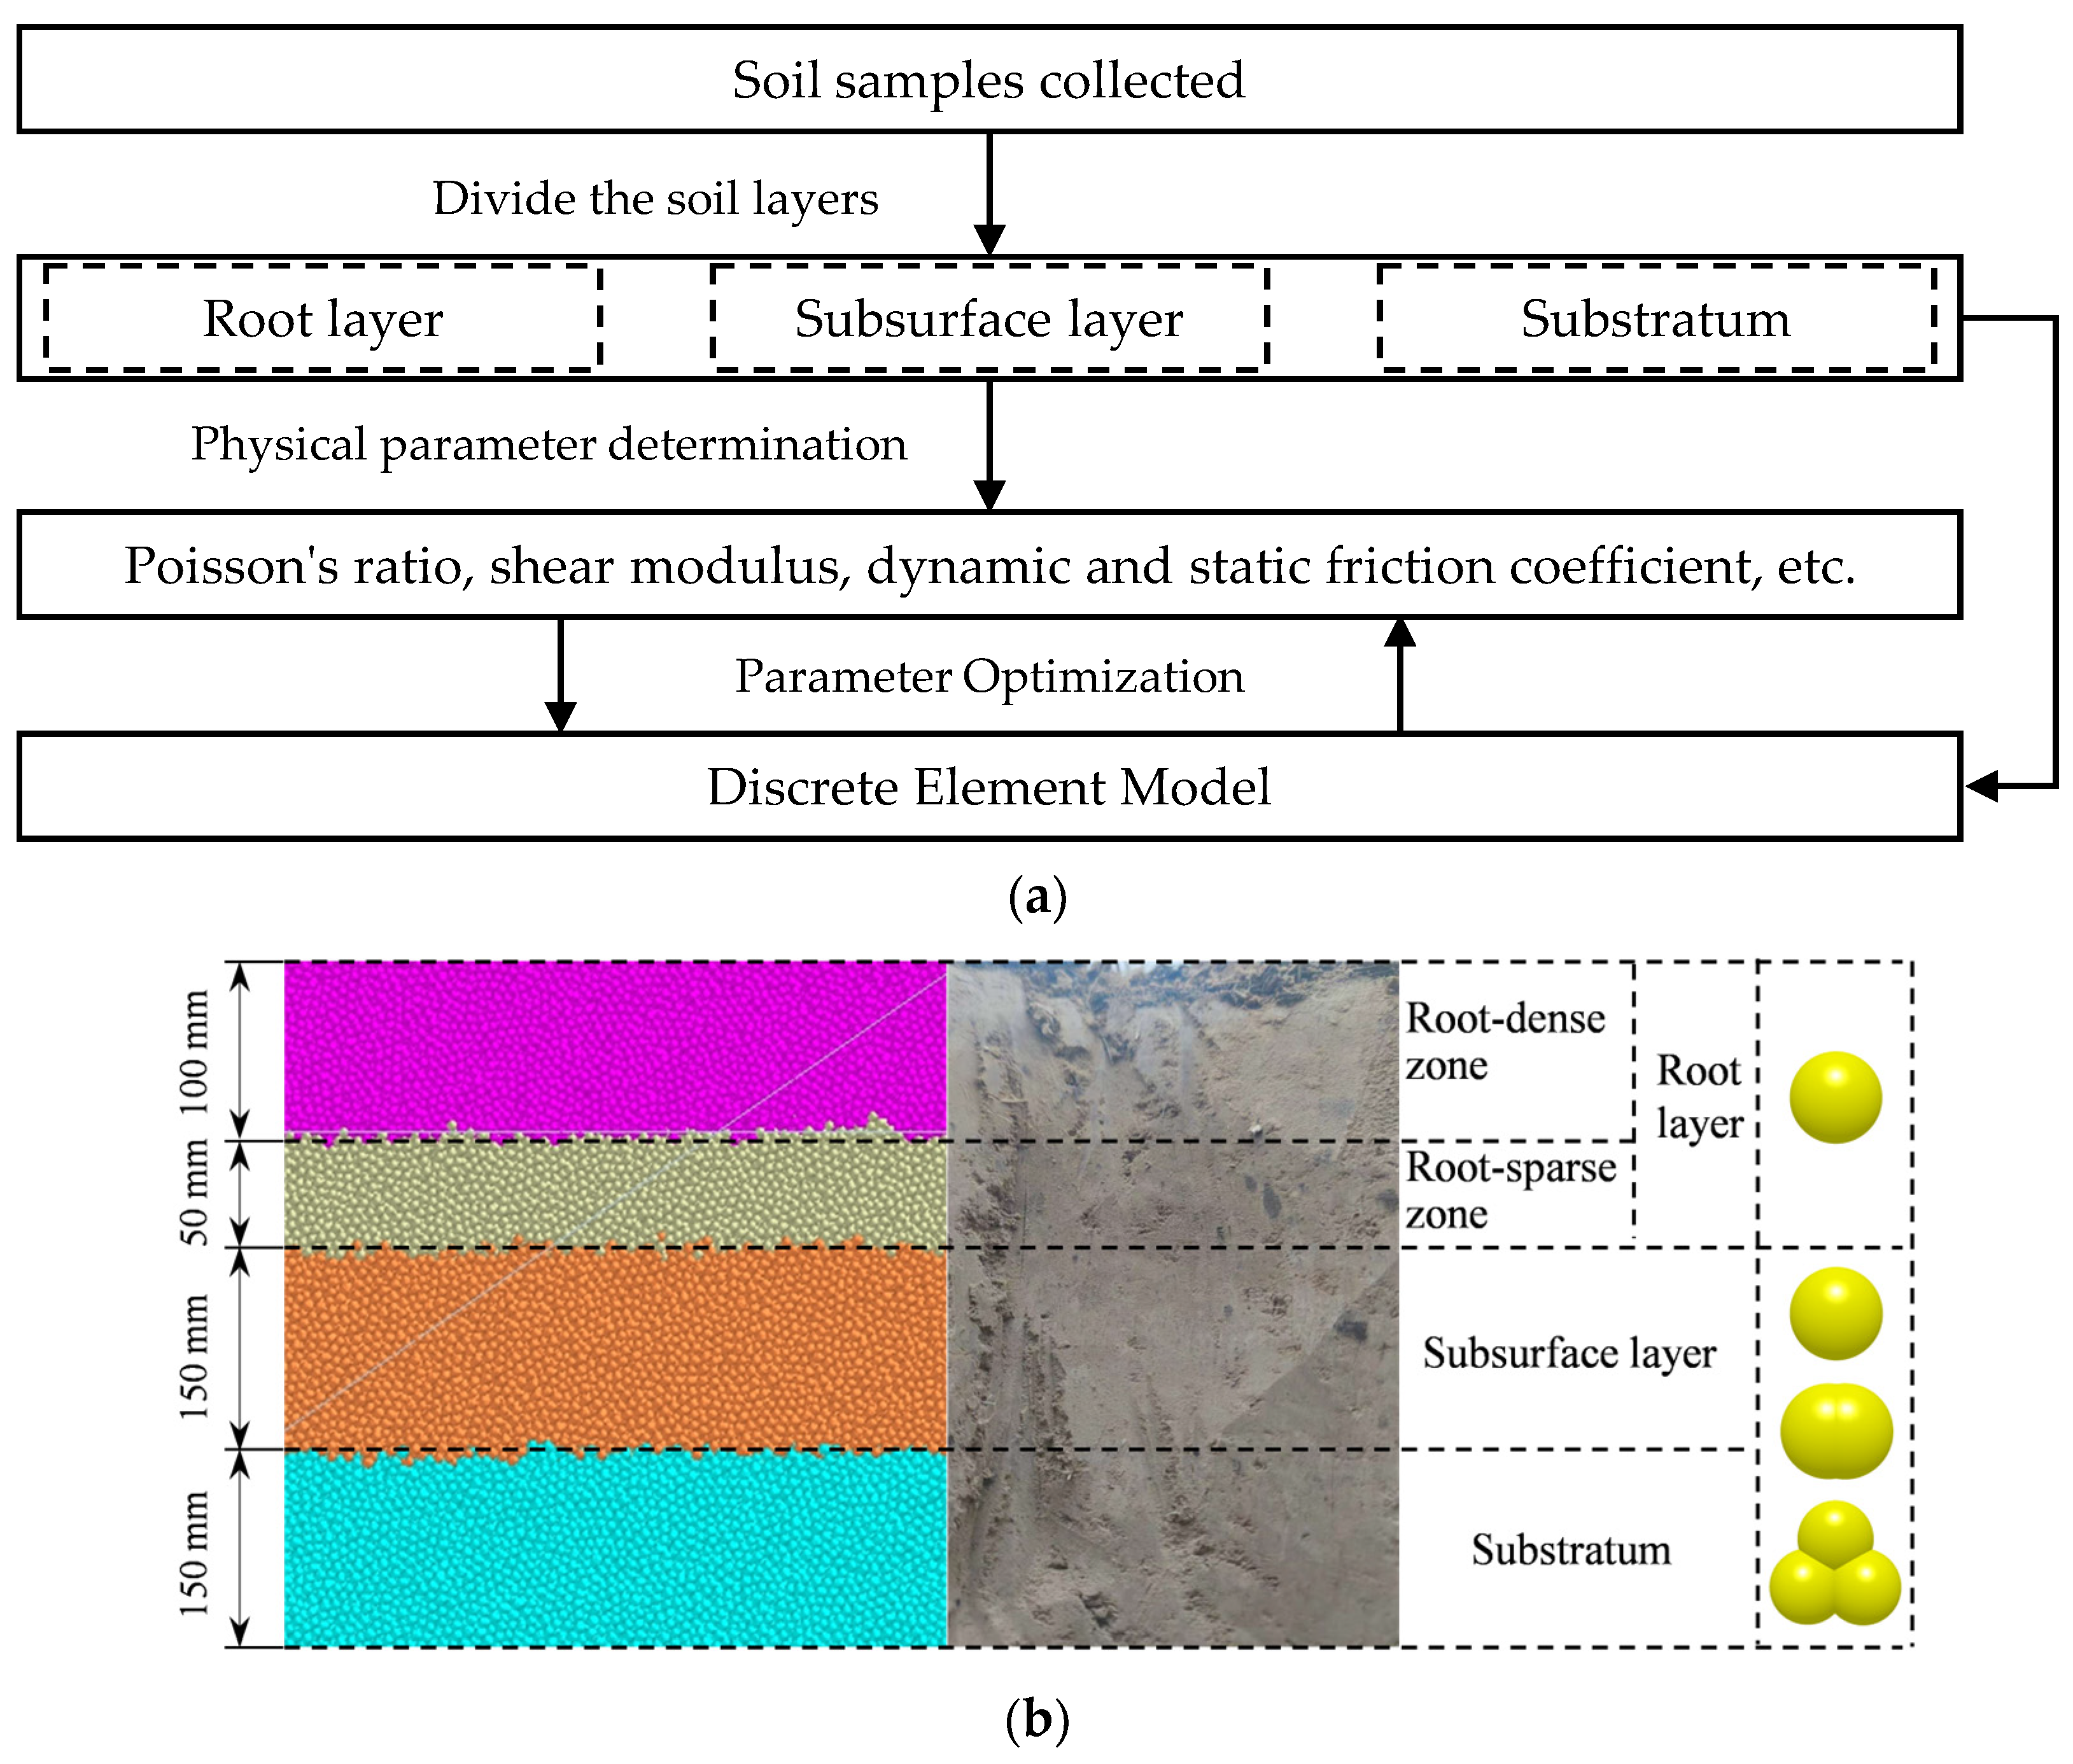
2.3.1. Simulation Model Construction

The DEM method has been widely used in studying the interaction between loosening shovels and tillage objects, becoming an effective tool for optimizing shovel structures and enhancing working performance [28]. In this study, DEM simulations were conducted to analyze the interaction between the bionic loosening shovel and the grassland. Preliminary analysis revealed that the root-soil complex structure of degraded grassland primarily consists of the root-soil layer and the soil layer. The root-soil layer is mainly composed of Leymus chinensis’ root system and soil. Most studies have focused on the construction of root-soil complex models composed of root systems and field crops, such as yam [44], corn [45], and Panax notoginseng [46]. The physical parameters of the root system, root distribution, and root density per unit volume were different between the above crops and Leymus chinensis. Leymus chinensis is a perennial forage crop with a strong root tillering ability, resulting in a root density per unit volume far exceeding that of field crops. When constructing a discrete element model of the root-soil complex, it is essential to restore the morphological characteristics and root density per unit volume of Leymus chinensis. Additionally, simulating the connection between the root system and the soil during the tillering growth process is also necessary through this model. Therefore, using the method for simulating a discrete element model of field crops to simulate the root-soil complex of grassland poses significant challenges in terms of computational efficiency and model construction accuracy.
To improve computational efficiency and ensure the accuracy of the discrete element model, In this paper, the root-soil complex is regarded as the root-soil layer. A method is proposed that combines the root particles and soil particles of the root-soil layer into a single composite particle. Based on the root distribution, the root-soil layer is divided into a root-dense zone (0~100 mm) and a root-sparse zone (100~150 mm). Each zone consists of spherical particles with a diameter of 5 mm. To more accurately restore the grassland soil environment, the soil layer was layered and modeled according to the soil layer distribution of the grassland, including the subsurface layer and substratum, each with a thickness of 150 mm (Figure 4a). At the same time, the soil particle types [39] in the core and subsoil layers were set as single sphere, dual sphere, and triple sphere, with soil particles having a diameter of 5 mm, and each particle type having the same mass share. Finally completed the construction of the discrete element model of the grassland. The results are shown in Figure 4b. The discrete element model of the grassland is established using EDEM 2018. During model construction, boundary effects can influence particle flow, leading to simulation results that may not accurately reflect the mechanical properties of the model. To minimize the influence of the interaction between the particle model and the boundary of the simulation area, the dimensions of the soil box model were set to 1200 mm × 600 mm × 450 mm.
Material parameters and contact parameters are crucial for constructing discrete element models of grasslands. The material of the bionic loosening shovel is 65Mn steel, and its density, Poisson’s ratio and shear modulus are obtained from published data [47]. The physical parameters of the root-soil layer and the soil layer were measured according to the Chinese standard (GB/T 50123–2019) [48]. The soil density, Poisson’s ratio, and shear modulus of the root system and soil were obtained using the cutting ring and triaxial test [49]. The friction coefficient between the bionic loosening shovel, soil, and the root of Leymus chinensis was obtained through the inclined plane test and the friction coefficient determination test [45,50]. The main parameters of the model are shown in Table 1. The soil type at the test area is silty loam, marked by strong cohesion among soil particles and mutual adhesion between the root system and the soil, the Hertz-Mindlin with Bonding model is employed to represent the mechanical behavior of both the root-soil layer and the soil layer.

2.3.2. Design and Process of Simulation Tests

The constructed discrete element model of grassland was applied to the study of the operating performance of the bionic loosening shovel. In order to evaluate the operating effect of the bionic loosening shovel, disturbance parameters such as ridge disturbance area (As) and furrow disturbance area (Af) as well as mechanical parameters like loosening resistance (Fr) and trench-specific resistance (Fc), were proposed as evaluation indicators. To ensure the effective working time of the loosening blade on the grassland, the operating speed was determined based on the speed range specified by Wu et al. [44]. The loosening depth was selected based on the soil structure of the grassland. The final parameter ranges for both V and H are summarized in Table 2. Based on the parameter range shown in Table 2, with H and V as the operating parameters, a single-factor simulation test of the bionic loosening shovel was conducted. The influence of each operating parameter on the operating parameter was analyzed. During simulation, either H or V was controlled at a stable value, while the other variable was varied according to the range shown in Table 2. The response parameter values under different parameters are obtained.
For clarity, composite particles and soil particles are collectively referred to as model particles throughout this paper. During the simulation, the bionic loosening shovel model was imported into the soil box model, and the loosening operation was performed with V (Figure 5a). When measuring the operating parameters, different colors were assigned to distinguish the velocity of particles. A critical curve was then drawn to represent the soil profile disturbance based on whether model particles were in motion (Figure 5b). The disturbance contour above the surface line represents the soil surface after tillage, with the area enclosed by this contour and the surface line defined as the ridge disturbance area (As). The disturbance contour below the surface line represents the internal soil disturbance profile, with the area enclosed by this contour and the surface line defined as the furrow disturbance area (Af). Together, As and Af constitute the soil disturbance area (Ac). The area enclosed by the lateral disturbance boundary, the surface line, and the theoretical subsoiling bottom before subsoiling is referred to as the theoretical area before loosening (A0). The larger the value of As and Af, the greater the disturbance of the root-soil layer and the soil layer by the bionic loosening shovel. In practice, the disturbance of the root-soil layer should be reduced while increasing the disturbance of the soil layer. Fr reflects the dynamic performance of the bionic loosening shovel in actual farming. A larger Fr indicates greater power consumption of the bionic loosening shovel. During the simulation, loosening resistance under different operating parameters was obtained using the post-processing module of EDEM 2018. Fc (Equation (2)) reflects the energy consumption required to loosen a unit volume of soil. A larger Fc indicates greater energy consumption by the bionic loosening shovel when loosening a unit volume of soil. Based on the research by RAPER [51], the calculation formula for Fc is as follows:
F c = F r A c
where Fc is the trench-specific resistance, Fr is the loosening resistance, and Ac is the soil disturbance area.

2.4. Field Test Design and Parameter Acquisition

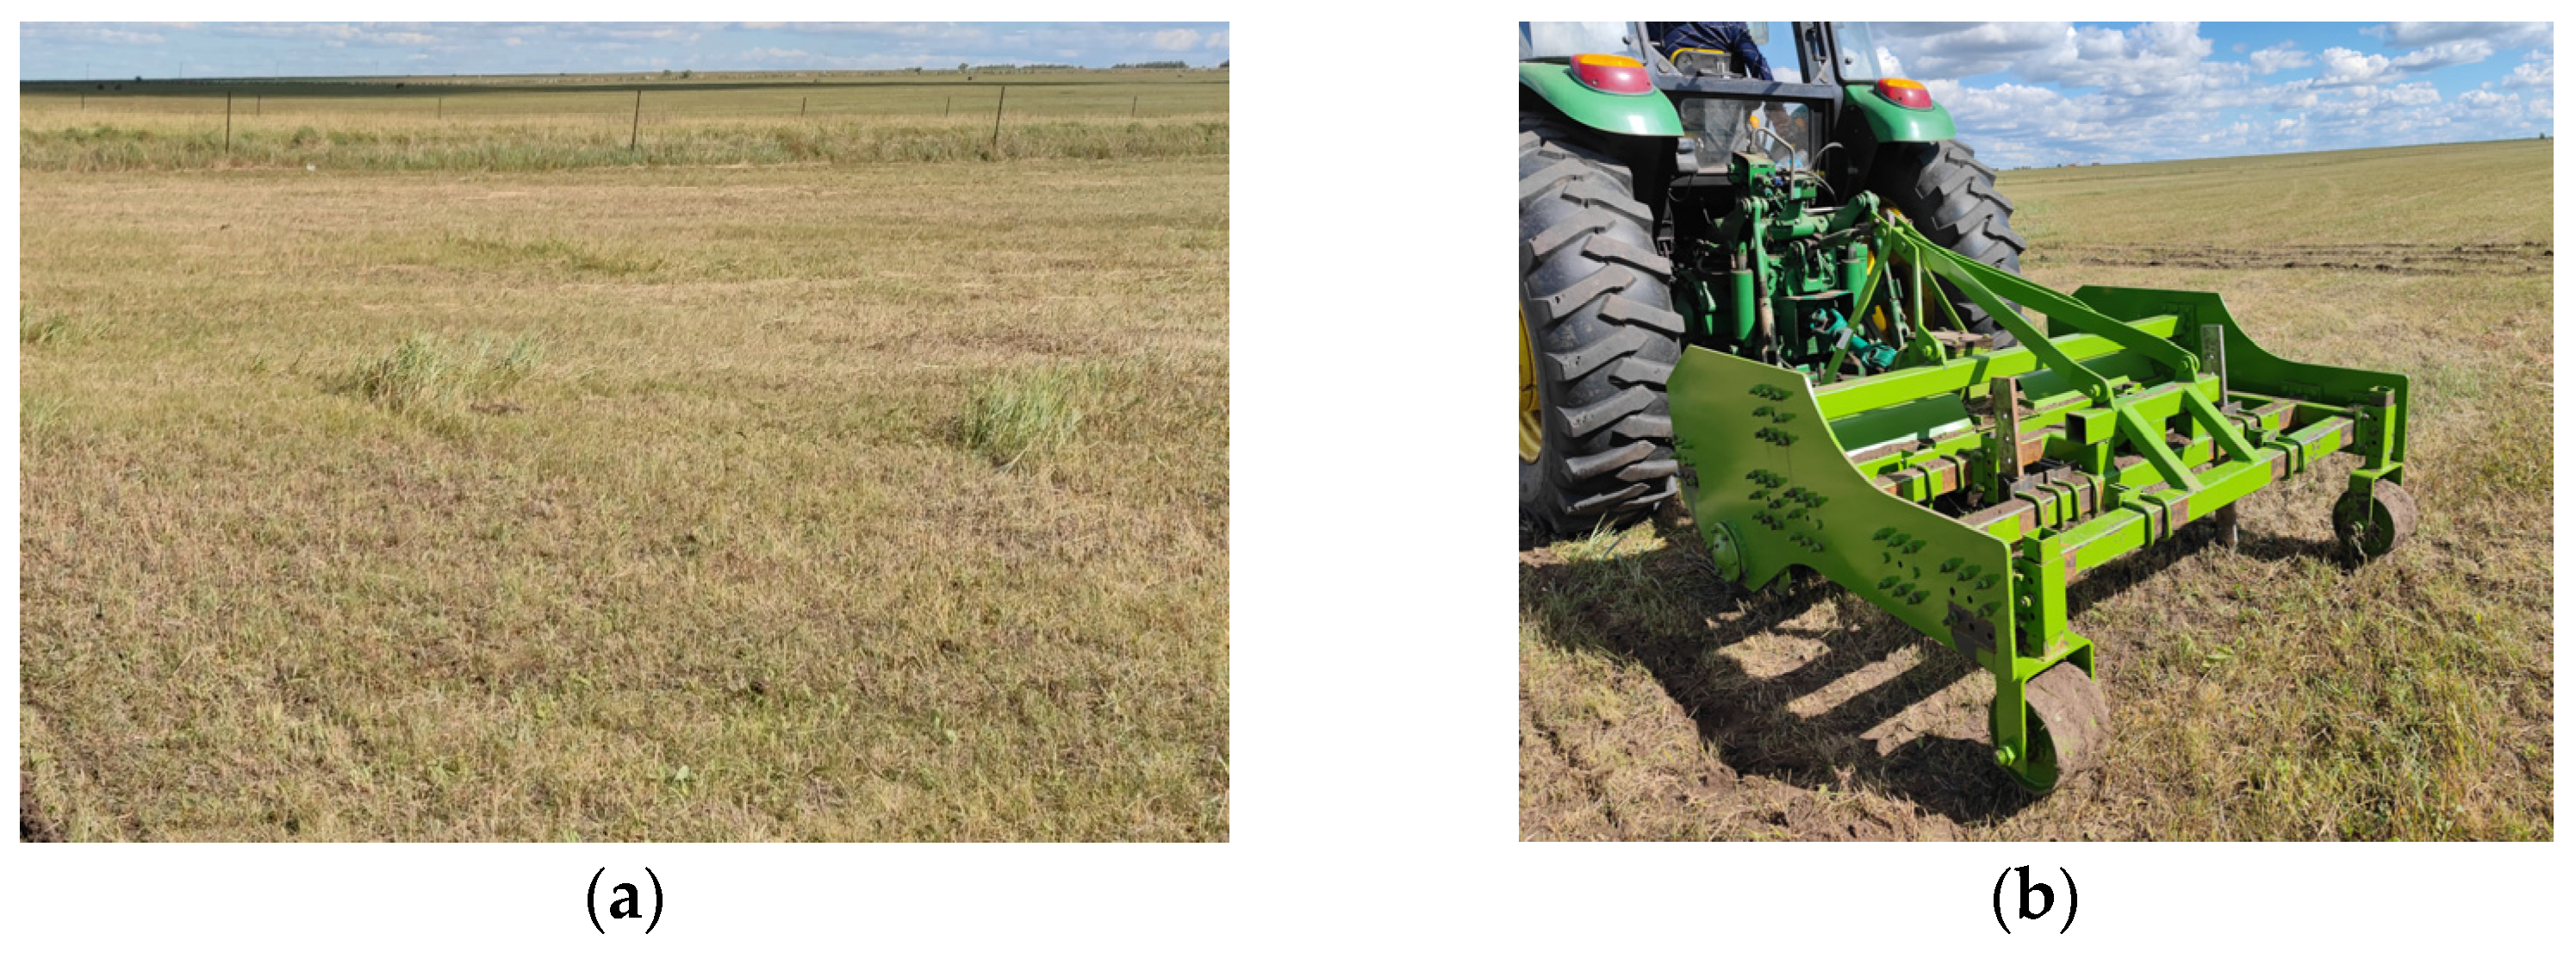
2.4.1. Description of Test Environment

The soil loosening test was conducted on degraded grassland in Hailar District, Inner Mongolia Autonomous Region, China (49°20′ N, 195°59′ E). Before the test, vegetation diversity in the area was measured according to the Chinese standard (GB/T 34751-2017) [52]. Forage grasses in 1 m × 1 m sample plots were collected, and the types and numbers of forage grasses in the sample plots were counted. The results showed that the grassland species in the test area were mainly Leymus chinensis and other weeds. According to the Chinese standard (NY/T1121.4–2006) [53], three test areas were randomly selected at the test site. The volume weight of soil and soil moisture content were measured using cutting rings, while soil compaction was measured using a Spectrum SC-900 soil compaction meter. The average volume weight of soil in the area where the bionic loosening shovel was tested was 1.35 g/cm3, with an average soil moisture content of 11.49% and an average soil compaction of 3370.47 kPa. In the area where the diamond loosening shovel was tested, the average volume weight of soil was 1.31 g/cm3, the average soil moisture content was 12.15%, and the average soil compaction was 3478.67 kPa. For the arrow-shaped loosening shovel, the average volume weight of soil was 1.29 g/cm3, the average soil moisture content was 12.88%, and the average soil compaction was 3225.13 kPa. The differences in soil physical parameters across the three working areas were minimal, with no significant variation in these parameters.

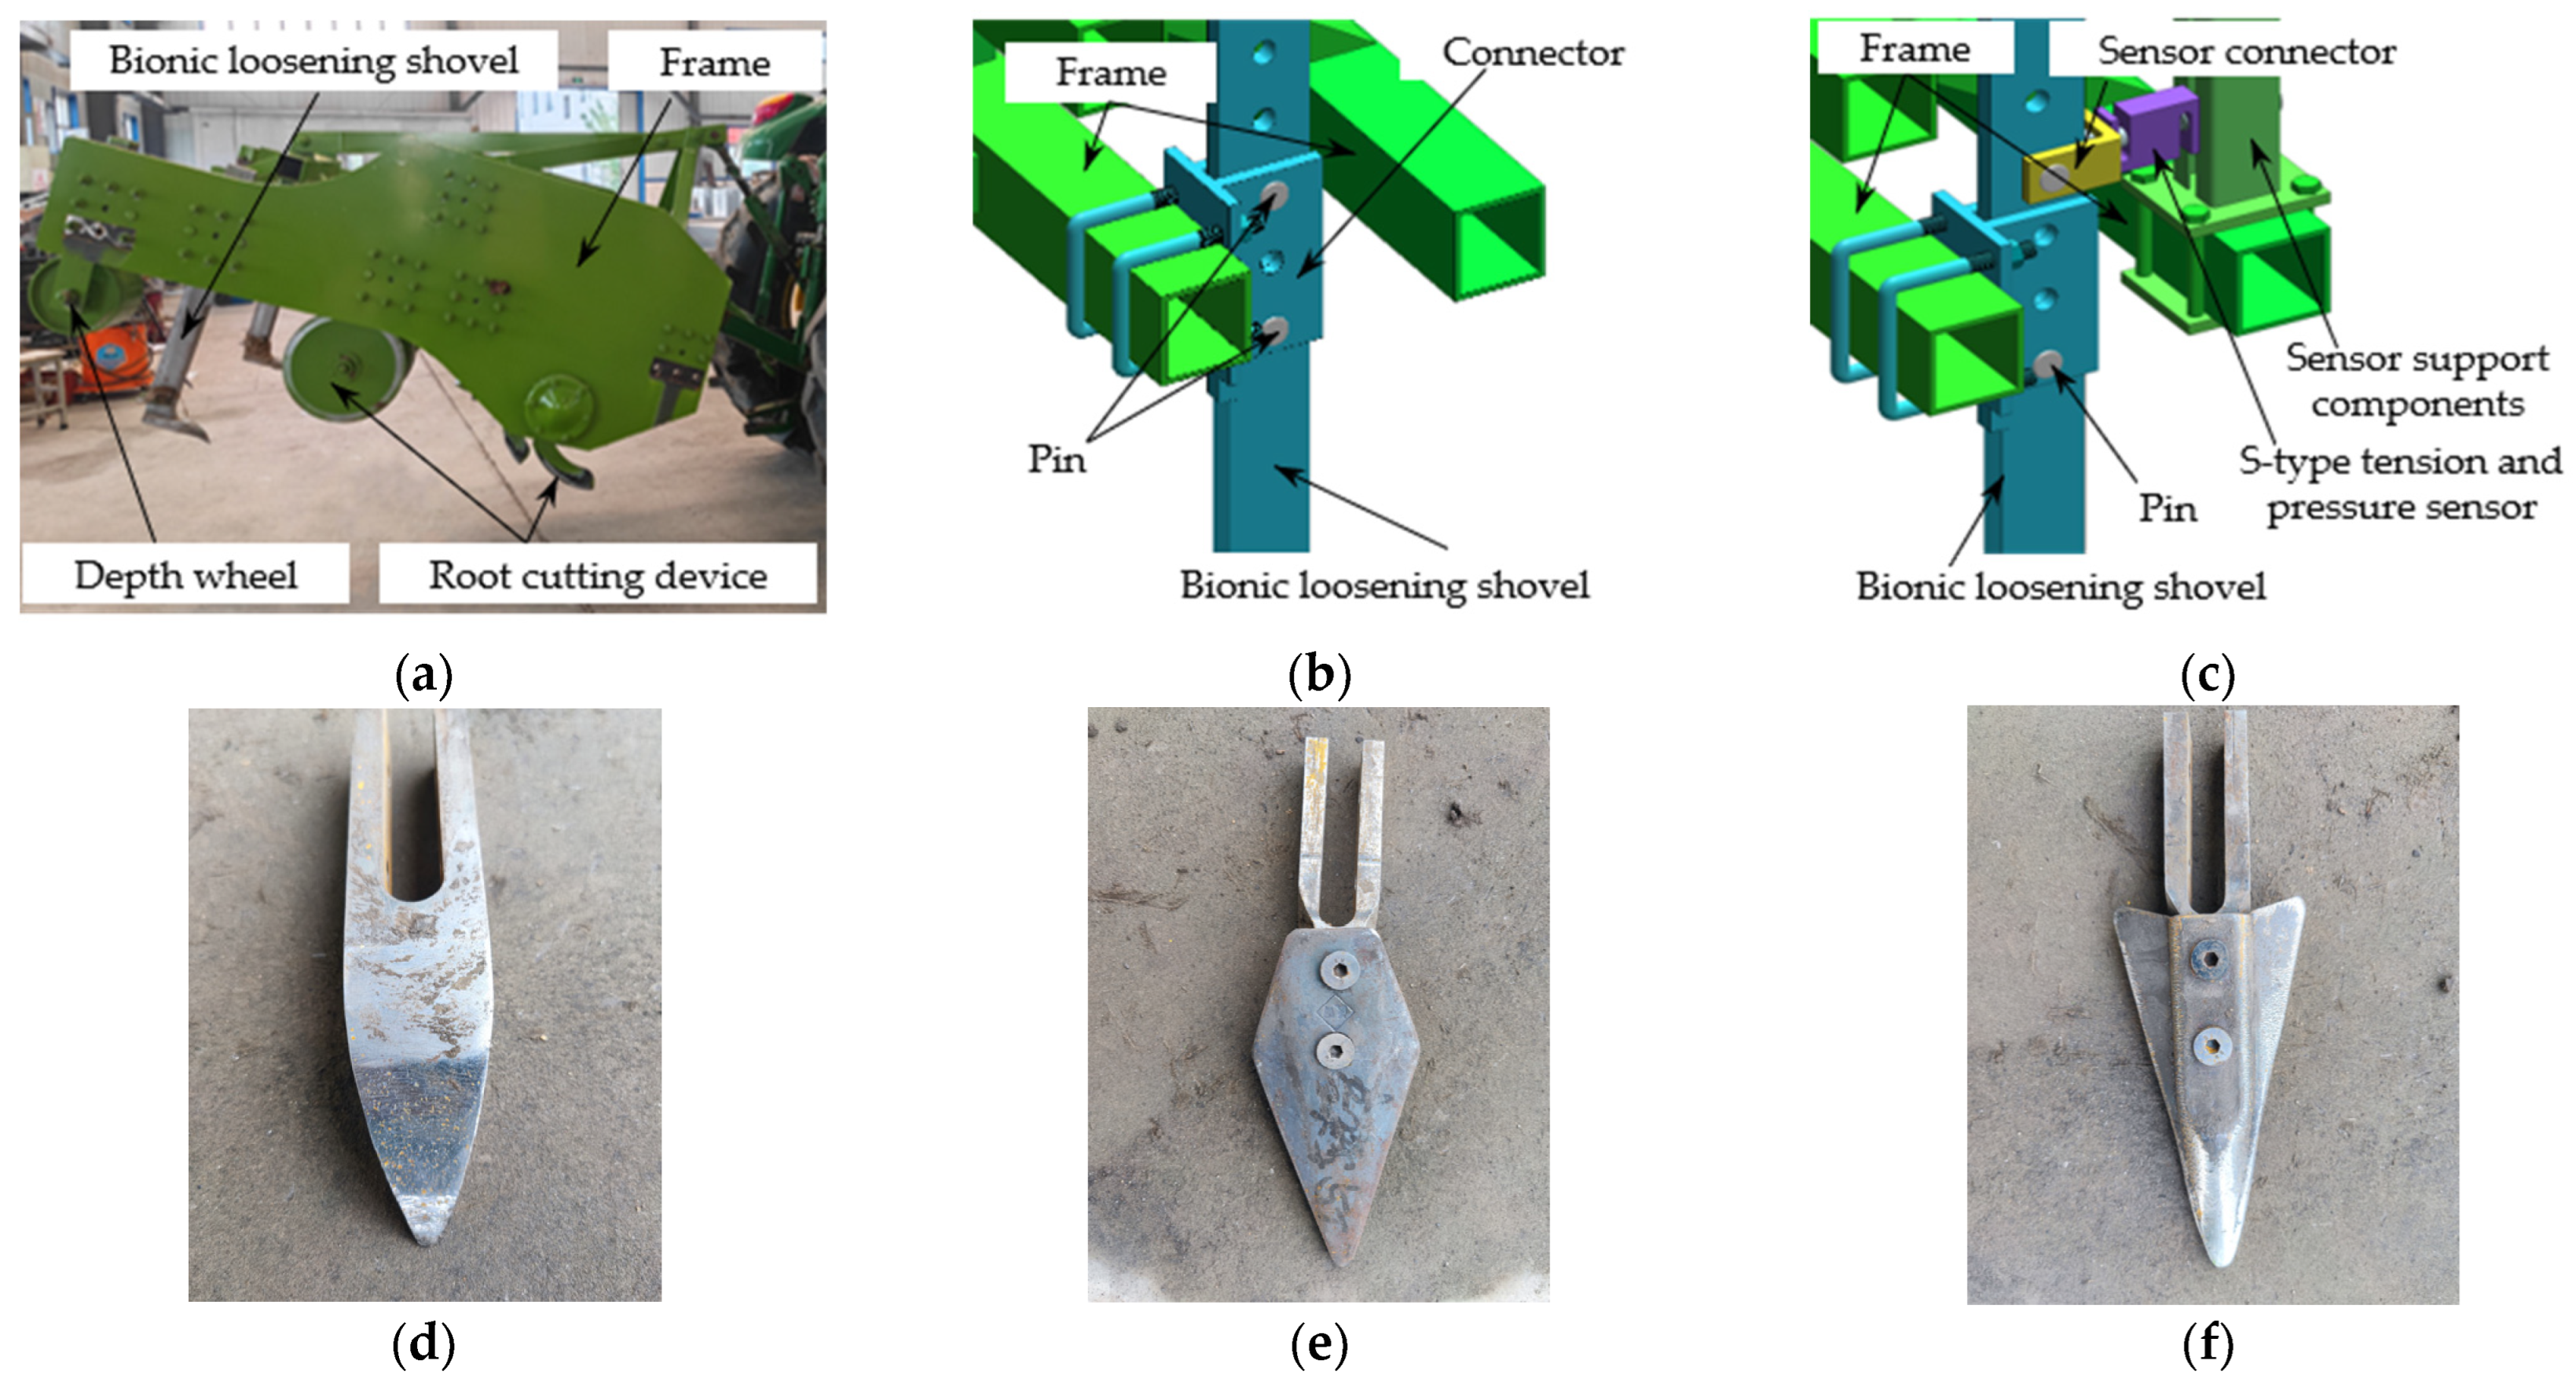
2.4.2. Test Equipment

To explore the change patterns of the disturbance parameters and the mechanical parameters of a bionic loosening shovel under different operating parameters, a degraded grassland loosening test bench was designed and manufactured (Figure 6a). The test bench is mainly composed of a frame, root-cutting devices, bionic loosening shovels, and two-depth wheels. The bionic loosening shovel is connected to the frame through a connector; the connector is fixed to the frame through bolts, and the bionic loosening shovel is connected to the connector through two pins (Figure 6b). By adjusting the matching mode between the adjustment hole of the bionic loosening shovel and the limit hole of the connector, the loosening depth H can be adjusted as required. Based on the overall layout of the test bench, the loosening resistance of the bionic loosening shovel was measured using an S-type tension and pressure sensor (Figure 6c). The S-type tension and pressure sensor is installed between the bionic loosening shovel and the sensor support component. It is connected to the sensor support components and the sensor connector with bolts. The sensor connector is connected to the bionic loosening shovel with one pin. To verify the accuracy of the discrete element model in Section 2.3, a single-factor field test of the bionic loosening shovel (Figure 6d) was conducted using the same operating parameters as the simulation test. At the same time, to verify the working effect of the bionic loosening shovel, comparative tests were conducted between the bionic loosening shovel and the standard loosening shovels. The standard loosening shovels include a diamond-shaped loosening shovel (Figure 6e) and an arrow-shaped loosening shovel (Figure 6f).

2.4.3. Design of Field Tests

To compare the operating effects of the bionic loosening shovel and the standard loosening shovel, comparative tests under different operating parameters were conducted. Before the test, the length of the test field was set to 30 m, with the first 5 m designated as the preparation stage and the remaining 25 m as the stable stage of the operation. To minimize the impact of surface vegetation on the quality of loose soil, the Leymus chinensis in the operating area was mowed before the test (Figure 7a). The cutting height of Leymus chinensis stalks after mowing is approximately 10 mm. During the test, the test bench was towed by a John Deere 1204 tractor (Figure 7b), and its operating velocity was adjusted by controlling the tractor’s travel velocity. After the test, various data were collected, and each test was repeated three times. When conducting a single-factor test for loosening depth, ensure that the operating speed of each loosening shovel is kept constant at 0.9 m/s. Similarly, when performing a single-factor test for operating speed, ensure that the loosening depth for each shovel is maintained at 240 mm.

2.4.4. Data Collection and Processing

During data collection, a self-made soil profiler (Figure 8a) was used to measure and draw the soil disturbance contours after the operation, including the soil surface after tillage and the internal soil disturbance profile. As and Af were calculated based on the contour information shown in Figure 5b. The Fr of the bionic soil loosening shovel is measured as shown in Figure 6c. During data collection, the connector is connected to the bottom of the loosening shovels with only one pin. During the loosening operation, the bottom of the loosening shovel is influenced by soil resistance, causing the entire shovel to swing around the pin. During this process, the top of the bionic loosening shovel swings forward around the pin, generating a pulling force on the sensor, and the data are obtained through the X_Test software. Taking the bionic loosening shovel as an example, the movement during the loosening operation is simplified to lever motion. Using the bionic loosening shovel as an example, the movement during the loosening operation is simplified to lever motion. Throughout the operation, the bionic loosening shovel handle maintains a torque balance state. At this point, the force on the sensor is not the loosening resistance of the bionic loosening shovel (Figure 8b). The loosening resistance of the bionic loosening shovel is calculated using Equation (3).
F 1 L 1 = F 2 L 2
where F1 is the resistance exerted by the grassland on the bionic loosening shovel. F2 is the pulling force applied to the sensor by the bionic loosening shovel handle. L1 is the distance between the connection point of the bionic loosening shovel and the connector and the force point of the bionic loosening shovel. L2 is the distance between the connection point between the bionic loosening shovel and the connector and the connection point between the bionic loosening shovel and the sensor.
To analyze the trend of changes in the test value of the bionic loosening shovel relative to the simulation value, as well as the trend of changes in the test value of the bionic loosening shovel relative to the test values of the diamond-shaped and arrow-shaped loosening shovels, two difference ratios, Da1 (see Equation (4)) and Da2 (see Equation (5)), are introduced.
D a 1 = R s 1 R d R d
D a 2 = R s 2 R d R d
where Da1 is the difference ratio between the test value of the bionic shovel and its corresponding simulation value under a specific operating parameter. Da2 is the difference ratio between the test value of the bionic shovel and the test value of the standard loosening shovels (diamond-shaped loosening shovel and arrow-shaped loosening shovel) under the same operating parameter. Rs1 is the simulation value of the bionic loosening shovel. Rs2 is the test value of the standard loosening shovel (diamond-shaped loosening shovel and arrow-shaped loosening shovel) under the same operating parameter. Rd is the test value of the bionic loosening shovel under a specific operating parameter.

3. Results and Discussion

3.1. Simulation Results and Analysis

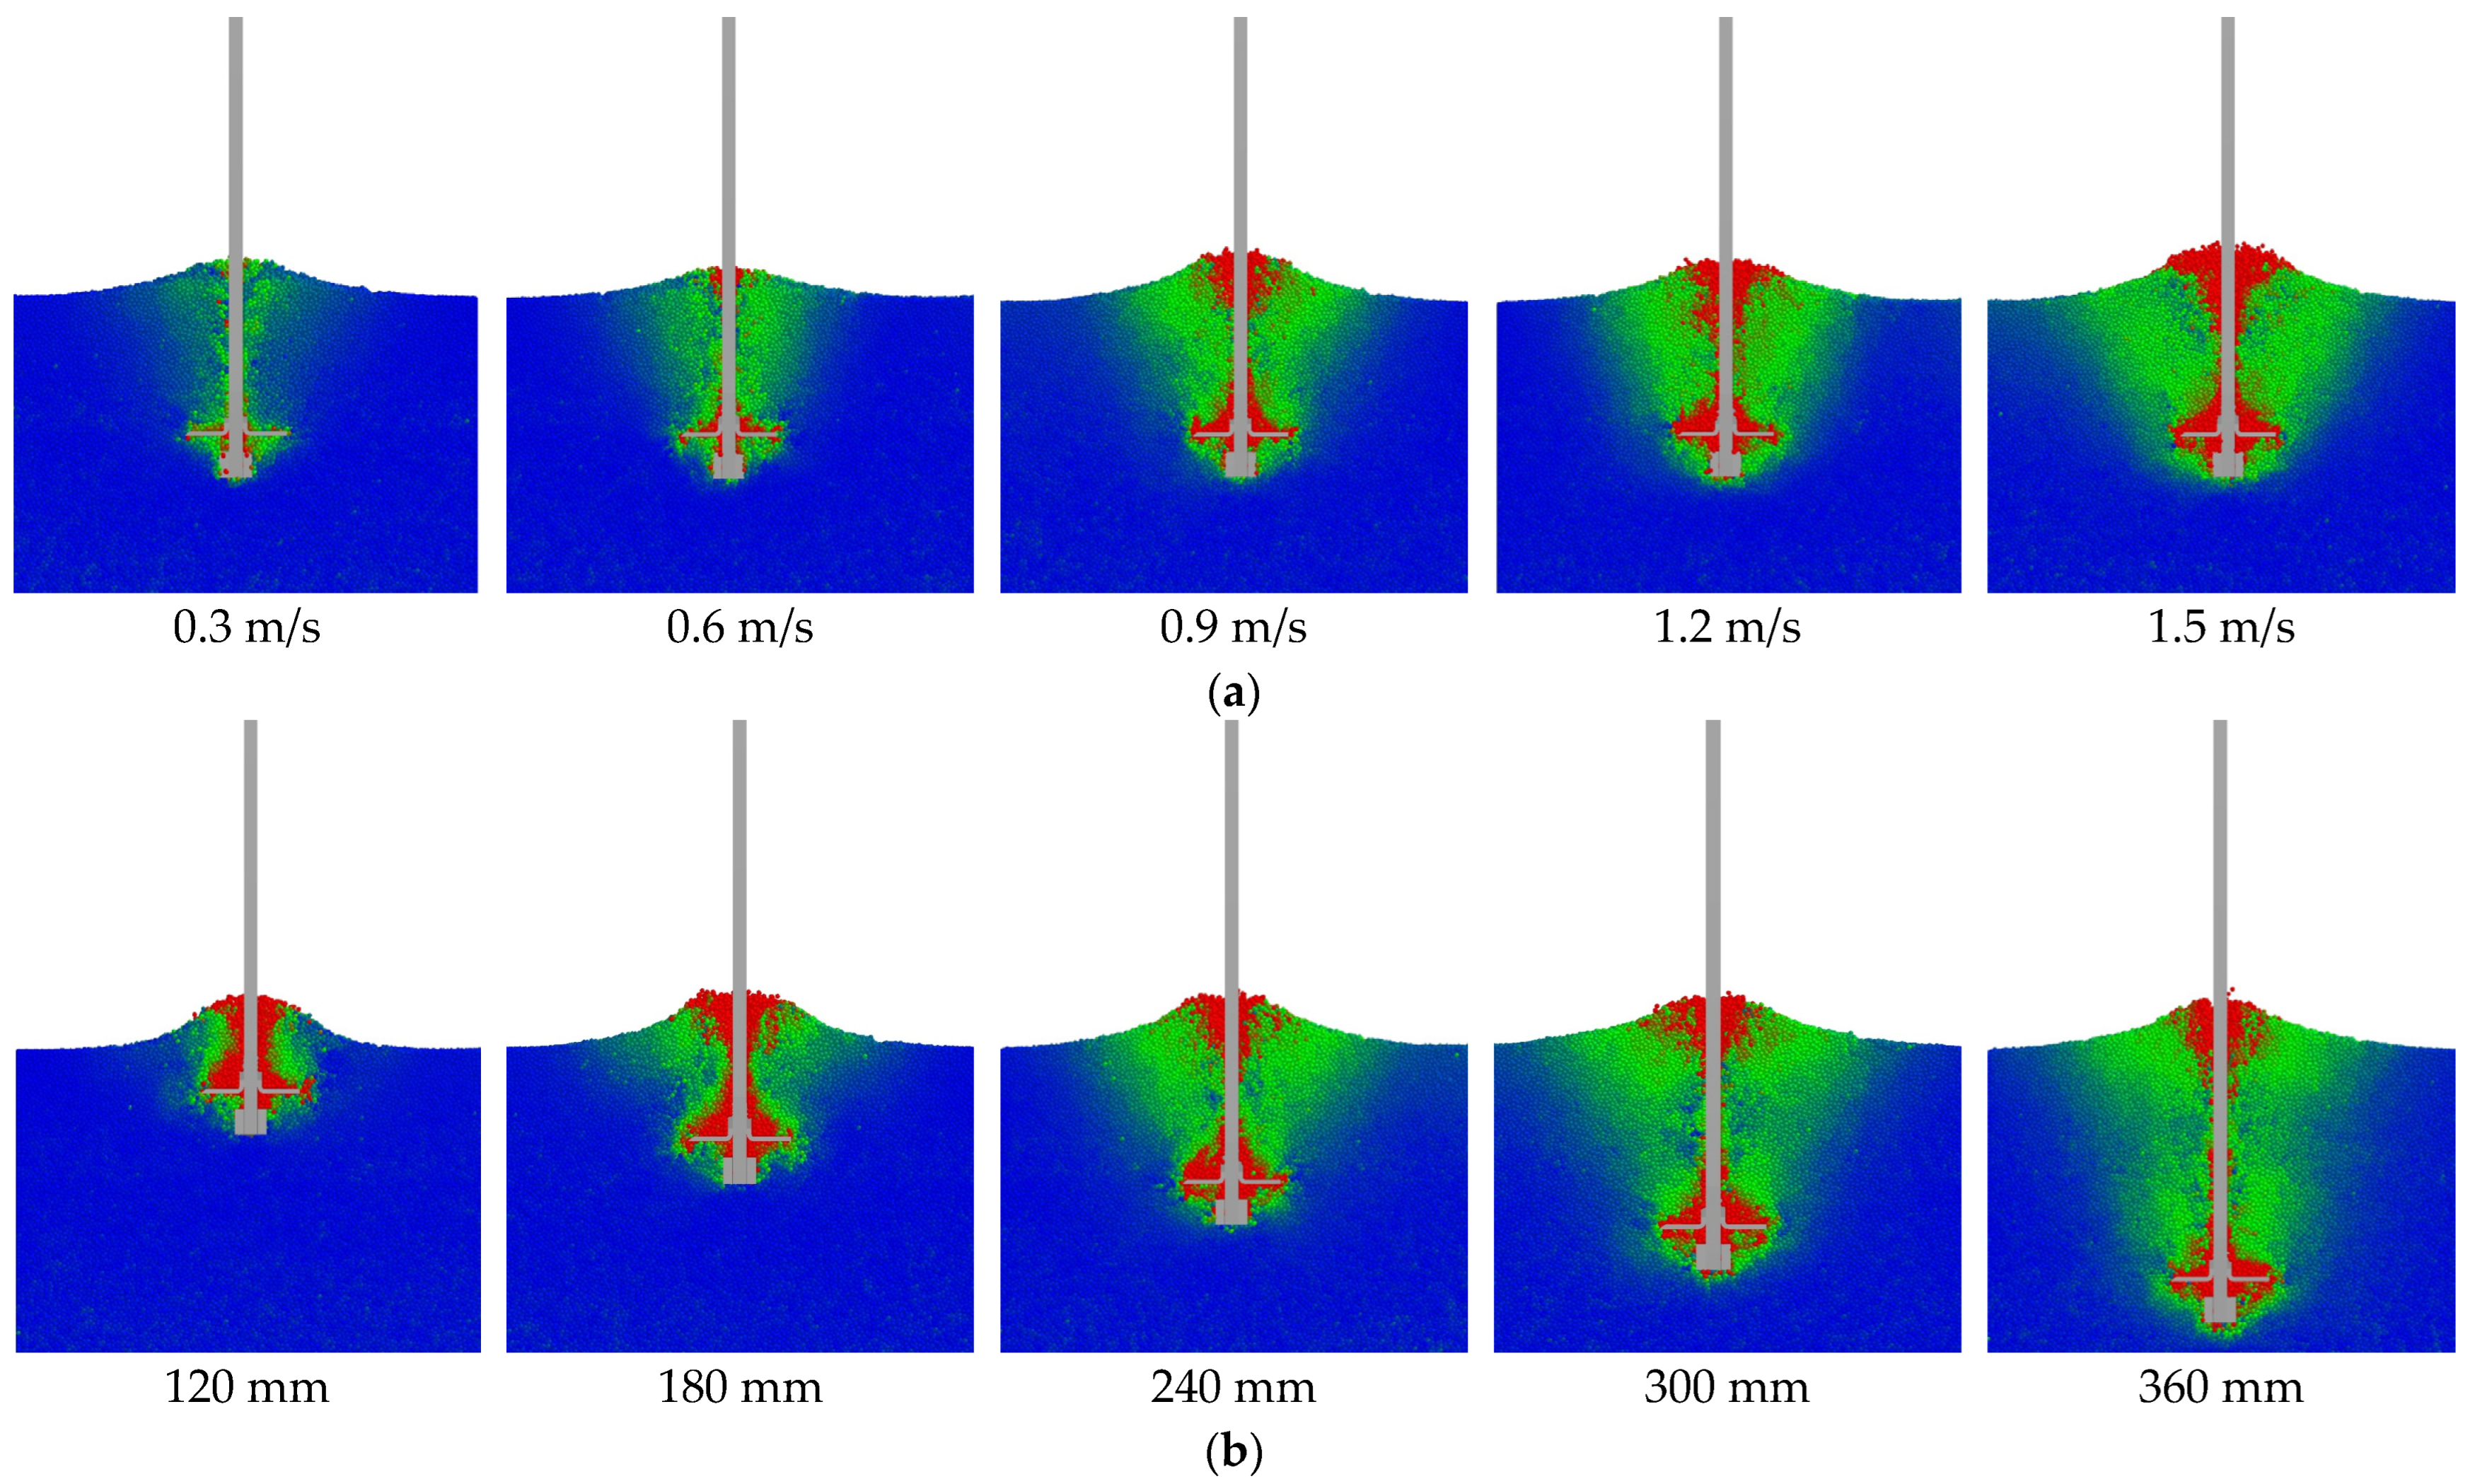
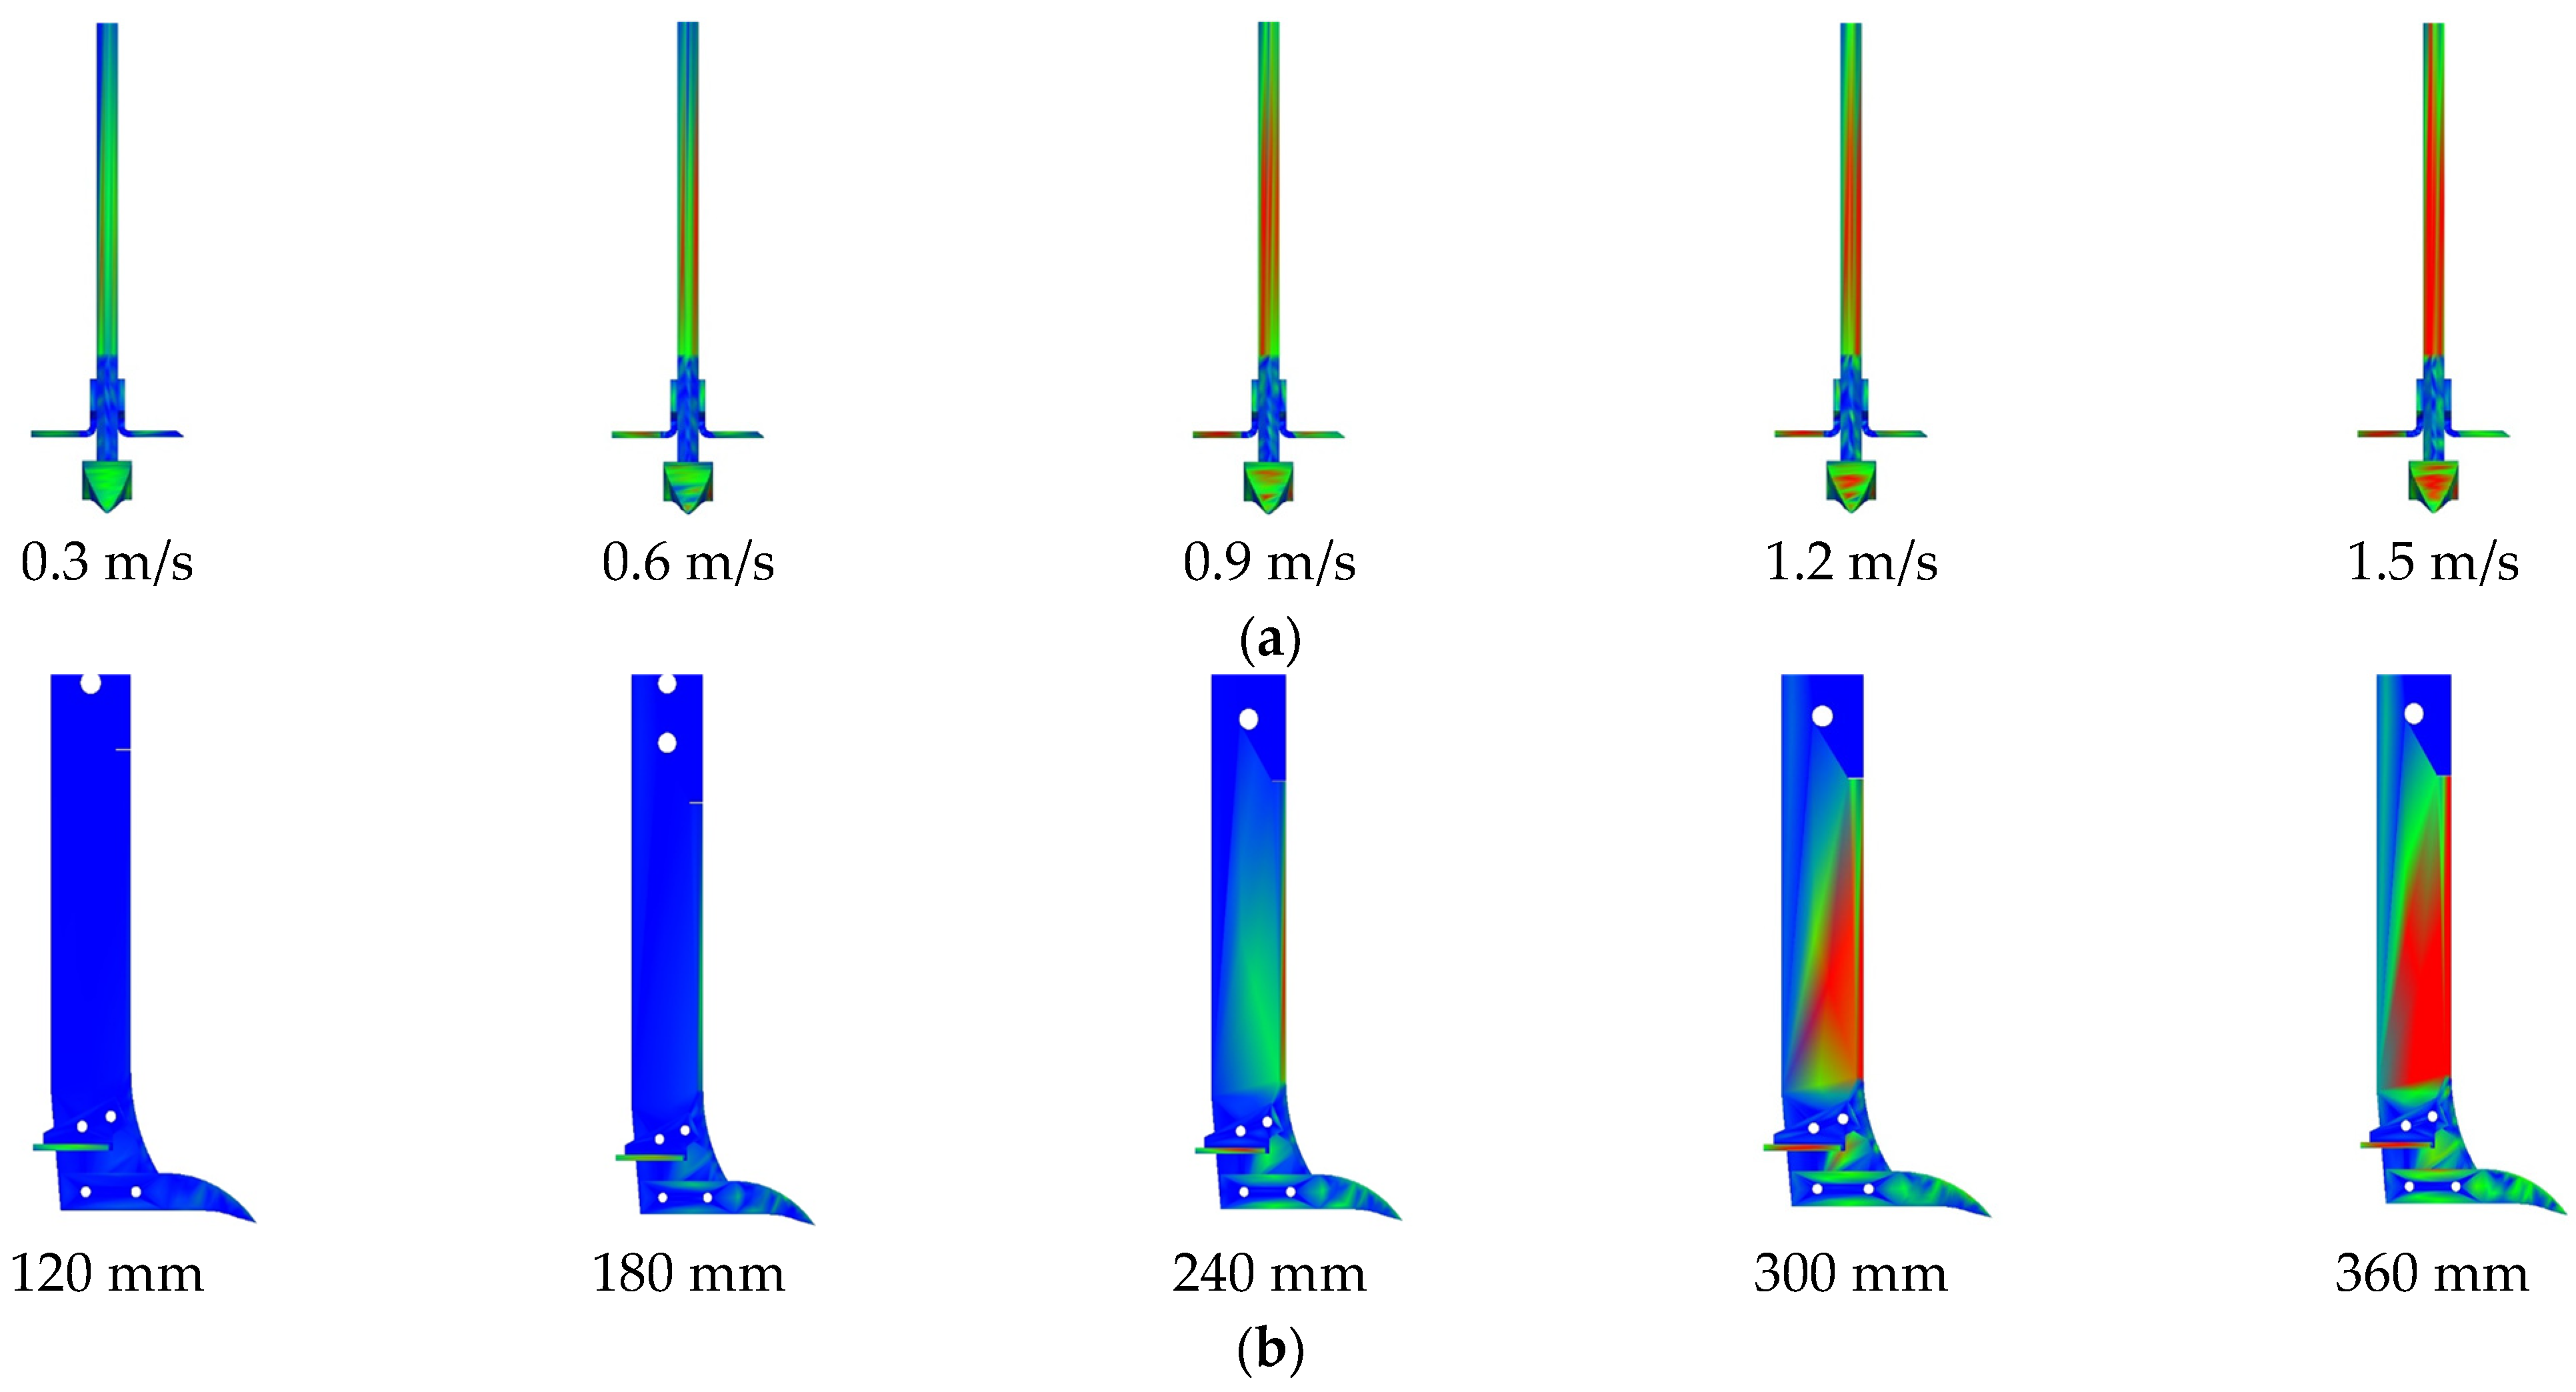
3.1.1. Soil Disturbance Status

EDEM was used to obtain soil disturbance images at different V (Figure 9a) and different H (Figure 9b). Different colors represent the movement velocity of model particles: red for maximum velocity, green for middle velocity, and blue for minimum velocity, which also indicates the particles are at rest. Moreover, further analysis of the color changes in model particles indicates that the disturbance effect is greatest in areas where the particles turn red, moderate in areas where they turn green, and minimal in areas where they remain blue.
As illustrated in Figure 9a, when the loosening operation is conducted at 0.3 m/s, the color change in model particles near the loosening shovel indicates a change in their velocity. Additionally, only a small number of model particles near the loosening shovel tip turn red. The results indicate that at this speed, the velocities of particles near the loosening shovel tip are the highest, causing the greatest disturbance in this area. However, compared to soil disturbance images at other speeds, the range of color change of model particles in the soil disturbance image at 0.3 m/s is the smallest. The results indicate that at 0.3 m/s, the disturbance of the bionic loosening shovel to the root-soil layer and the soil layer is also the smallest. As V increases, the color of model particles on both sides of the loosening shovel handle near the surface gradually turns red, and the number of particles turning red in this area and near the bionic loosening tip shovel increases. The results indicate that the disturbance caused by the bionic loosening shovel in these areas increases, with the degree of disturbance being greater than in other areas. At a speed of 1.5 m/s, the disturbance in these areas reaches its maximum. Additionally, as V increases, the range of color change of model particles near the bionic loosening shovel also increases. The results indicate that the disturbance area of the bionic loosening shovel on the root-soil and the soil layers increases with operating speed. At 1.5 m/s, the disturbance area reaches its maximum.
As illustrated in Figure 9b, when H is 120 mm, a large number of model particles on both sides of the loosening shovel handle turn red, accounting for a significant proportion of the entire disturbance area. The results indicate that at this operating depth, a pronounced stress concentration occurs between the root-soil layer and the soil layer, which enhances the crushing effect of the bionic loosening shovel across the entire area. Additionally, compared to soil disturbance images at other depths, the range of color change in model particles at a loosening depth of 120 mm is the smallest. The results indicate that at this depth, the disturbance range of the bionic loosening shovel on the grassland is minimal. As H increases, the proportion of model particles turning red near the bionic loosening shovel tip and on both sides of the bionic loosening shovel handle near the surface gradually decreases. However, the red particles remain concentrated in these two areas. The results indicate that as H increases, the stress diffusion effect between the root-soil layers and the soil layers gradually increases, resulting in a gradual decrease in the crushing effect of the bionic loosening shovel handle on these layers. However, as H increases, the range of color change of model particles near the shovel also gradually increases. The results indicate that the disturbance area of the root-soil layer and the soil layer by the bionic loosening shovel increases with the increase in H. When H is 360 mm, the disturbance area of the root-soil layer and the soil layer reaches the maximum value, which is consistent with the results of Aikins et al. [54] and Wu et al. [43]. Considering the actual working environment, higher operating speeds or deeper loosening depths lead to greater disturbance to the grassland on both sides of the loosening shovel handle.

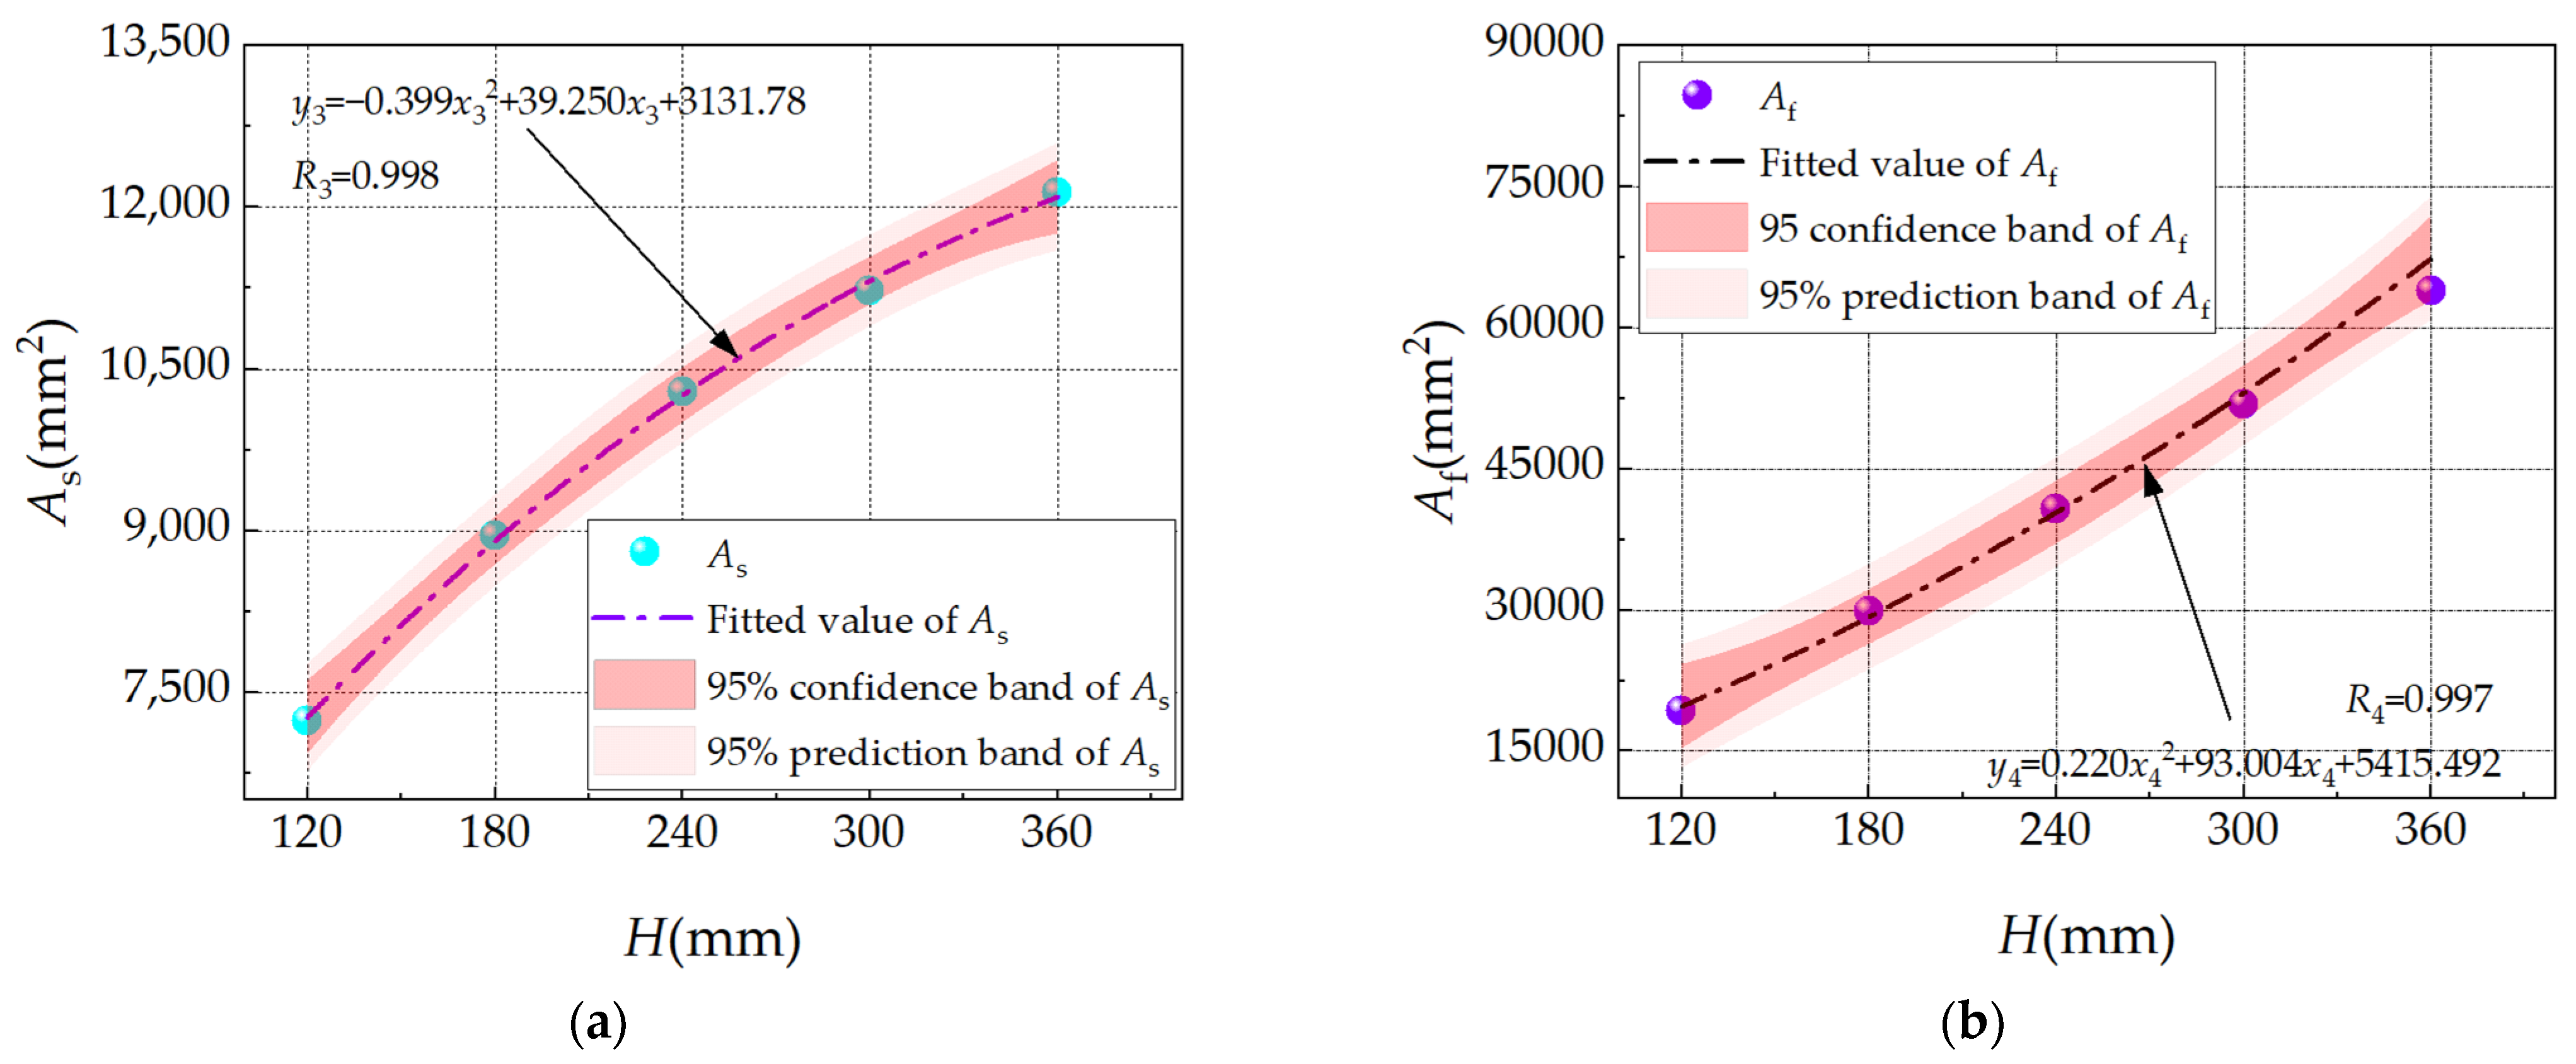
3.1.2. Effects of Operating Parameters on the Soil Disturbance Area

To further investigate the influence of operation parameters on soil disturbance, the critical velocity segmentation method was employed to draw soil disturbance contours after operations with varying V and H values and to calculate As and Af for each parameter. The results are presented in Figure 10 and Figure 11.
Figure 10 shows a schematic diagram of the effect of V on As and Af. Figure 10 illustrates that with the increase in V, both As and Af exhibit a nonlinear growth trend. At the operating speed of 0.3~1.5 m/s, As changed by 14.892%, 8.995%, 4.630%, and 5.126%, while Af changed by 2.401%, 5.003%, 4.517%, and 1.465%, compared with the previous values. The primary reason is that the impact force (Fc) of the bionic loosening shovel on the soil continuously increases with the rise in V, thereby enhancing the soil disturbance effect, as shown in Equation (6). Concurrently, the kinetic energy of model particles per unit area increases exponentially with the increase in V, enhancing the fluidity of model particles at higher strain rates, as shown in Equation (7). The dynamic response of model particles continuously diffuses from the inner layer to the surface layer and both sides of the bionic loosening shovel handle, increasing As and Af. These results are consistent with the trend observed in Figure 9a. However, an excessive V will cause greater model particle splashing and disturbance, dramatically increasing the disturbed area and increasing damage to the root system and soil structure.
The growth rates of As and Af gradually decrease with increasing V. This is primarily because as V increases, the disturbance range of the model by the loosening shovel also increases. However, as V continues to increase, the model reaches a saturated loose state, causing the growth of the disturbance area to slow down gradually. Additionally, the loosening shovel needs to overcome the kinetic energy consumption caused by internal friction and dissipation between model particles, which reduces their motion state, resulting in a gradual decrease in the growth rate with increasing V.
F c = m 1 V t
E k = m 2 v 2 2
where Fc is the impact force of the loosening shovel. m1 is the quality of the loosening shovel. t is the time. Ek is the kinetic energy of model particles. m2 is the quality of model particles. v is the velocity of model particles.
Figure 11 shows a schematic diagram of the effect of H on As and Af. Figure 11 illustrates that with the increase in H, both As and Af exhibit a nonlinear growth trend. This result is consistent with that of McKyes et al. [55]. The primary reason is that with the rise in H, the contact area between the bionic loosening shovel and the model gradually increases. The shearing and friction effects of the loosening shovel handle on the model are enhanced (Figure 9b), improving model particle movement from the inner layer to the surface, and finally increasing As. With As and H increases, the direct operating range of the loosening shovel on the model continues to expand, increasing the overall disturbance of model particles. The interaction between particles causes the disturbance range of soil particles in the horizontal and vertical directions of the bionic loosening shovel handle to continuously expand (Figure 12) and finally increase Af. The growth rate of As decreases with the rise in H, while the growth rate of Af increases with the rise in H, indicating that the influence of H on Af is greater than that of As.

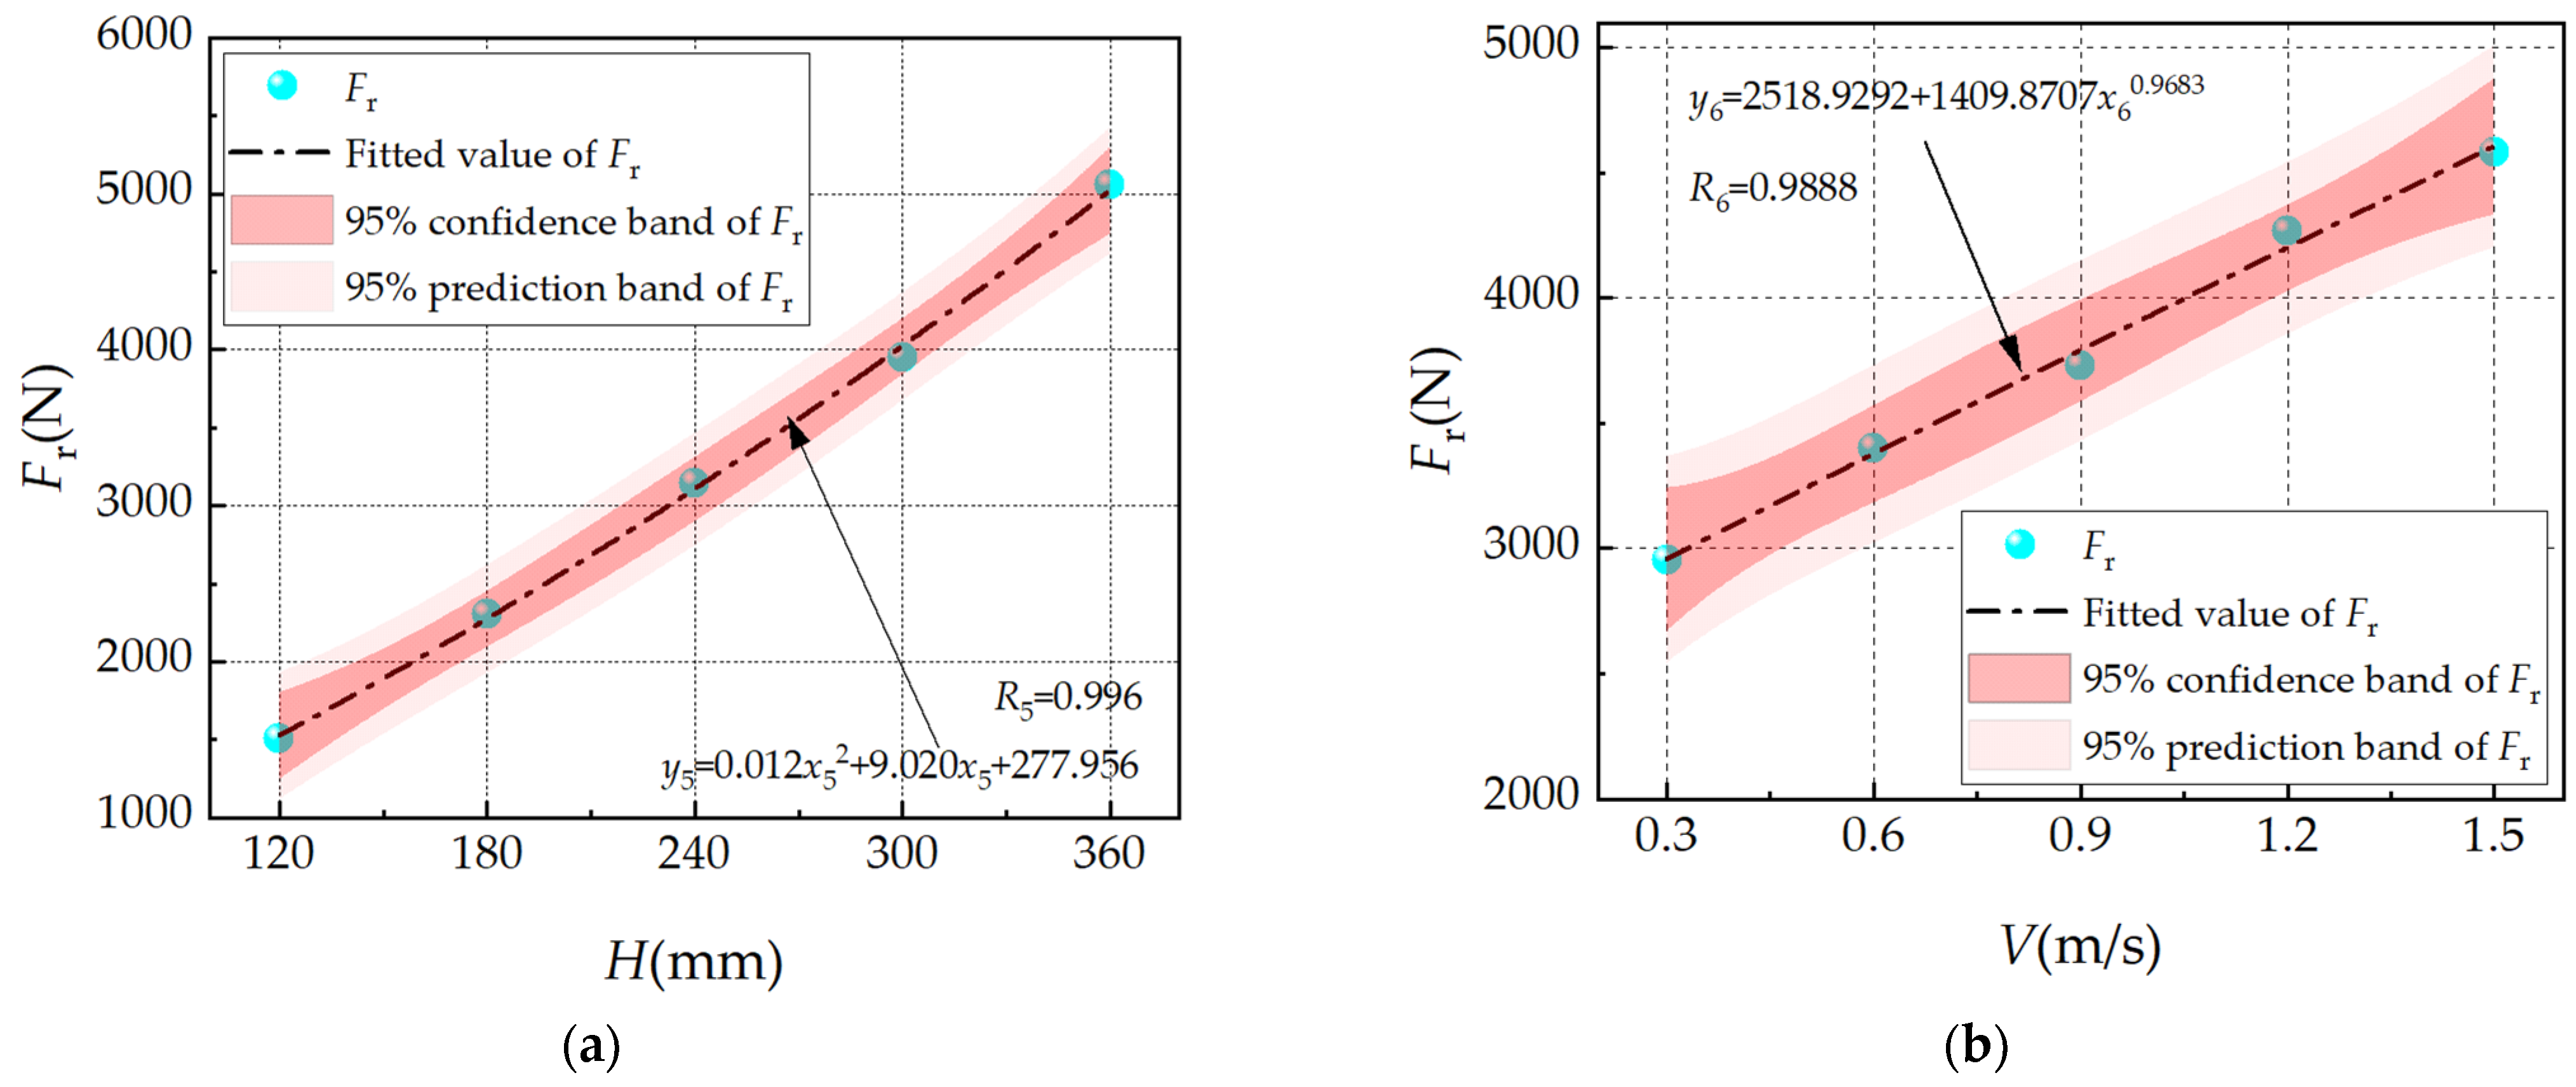
3.1.3. Effect of Operating Parameters on Loosening Resistance and Specific Resistance

Fr reflects the power consumption of the bionic loosening shovel. Figure 13 shows the force cloud diagram of the bionic loosening shovel under different operating parameters. Red represents the maximum Fr that the bionic loosening shovel can withstand, green represents the middle value of Fr, and blue represents the minimum value of Fr. As shown in Figure 13a, with the increase in V, the red area of the bionic loosening shovel gradually increases, indicating that the resistance of the bionic loosening shovel is increasing. The increase in the red area is mainly concentrated at the edge of the loosening shovel handle and the end face of the loosening shovel tip. As shown in Figure 13b, the Fr of the bionic loosening shovel increases with the increase in H, and the main component bearing the resistance is the loosening shovel handle. Comparing the force cloud diagrams of Figure 13a,b, it can be seen that the color difference of the bionic loosening shovel at different H is greater, indicating that the resistance of the bionic loosening shovel is more affected by H.
To further analyze the relationship between operating parameters and Fr, the loosening resistance of the bionic loosening shovel under different parameters was measured by using an S-type tension and pressure sensor. Figure 14 shows the fitting curves of Fr for different H and V values. The fitting coefficients R5 and R6 for the two curves are 0.996 and 0.9888, indicating high fitting accuracy. As shown in Figure 14a, Fr increases with the rise in H. The larger the value of H, the greater the loosening resistance applied to the loosening shovel (Figure 13b), and the faster Fr increases. The results of this study are consistent with those of IBRAHMI et al. [56] and Song et al. [29]. Based on the analysis of the soil environment of the grassland, the root layer structure is relatively loose due to biological activities and climate influences, while the soil layer particles are closely arranged and exhibit strong cohesion and adhesion. Additionally, the network structure formed by the roots of Leymus chinensis provides strong shear strength and overall adhesion, necessitating the loosening shovel to overcome greater friction and shear forces. As shown in Figure 14b, Fr increases approximately linearly with the rise of the value of V. In the range of 0.3 to 1.5, the error between the parameter value of y6 when the exponent of x6 is 0.9683 and the parameter value of y6′ when the exponent of x6 is 1 ranges from 0% to 2.07%. The main reason is that when the value of V is small, the kinetic energy transferred to the model particles by the loosening shovel is minimal. As the value of V increases, the kinetic energy transferred to the model particles by the loosening shovel gradually increases. Simultaneously, as the value of V increases, the strain rate of the soil continues to increase, resulting in the grassland exhibiting stronger resistance to deformation at high strain rates, thereby increasing the Fr of the bionic loosening shovel.
Fc effectively reflects the grassland loosening efficiency of the machine. A smaller value of Fc indicates lower soil loosening resistance per unit area of grassland, resulting in higher soil loosening efficiency. Figure 15 shows the fitting curves of different values of H and V with Fc. As shown in Figure 15a, the value of Fc increases with rising H, but the growth rate gradually decreases. The primary reason is that roots are densely distributed within the soil at a depth of 0~100 mm. These roots support the soil structure and enhance the stress transfer range during the loosening process, resulting in an increased Ac as the value of H continues to rise. Additionally, the roots improve the shear resistance of the soil, leading to an increase in the value of Fr with greater loosening depth. However, as the H value further increased, the root content of Leymus chinensis gradually decreased, and the stability of the deep soil weakened. This resulted in the growth rate of Ac being slightly greater than the growth rate of Fr. Consequently, the value of Fc increased with rising H, but the growth rate gradually decreased. As shown in Figure 15b, the value of Fc exhibits a nonlinear increasing trend with rising V. The primary reason is that as the value of V increases, the shear force exerted by the loosening shovel on the grassland intensifies, leading to a severe squeezing and shearing effect on the soil layer, which increases soil particle fragmentation. However, due to the dissipation effect between particles, the growth rate of the value of Fr slightly surpasses that of the value of Ac. Consequently, the value of Fc shows a nonlinear increasing trend as the value of V increases.
Using DEM simulations, the researchers quantitatively analyzed the effects of varying loosening depths and operational speeds on soil particle dynamics, disturbance patterns, and energy consumption characteristics. This study lays a theoretical foundation for optimizing the ‘loosening depth-operational speed’ parameters in agricultural practices. Additionally, the DEM simulations provided a detailed view of structural changes in the soil matrix, allowing for direct observation of soil fracture patterns and the distribution of particle aggregates throughout the loosening process. These microscopic-scale insights not only clarify how the bionic shovel minimizes root damage in degraded grassland ecosystems but also complement and validate the macroscopic results from field tests.

3.2. Field Test Results and Analysis

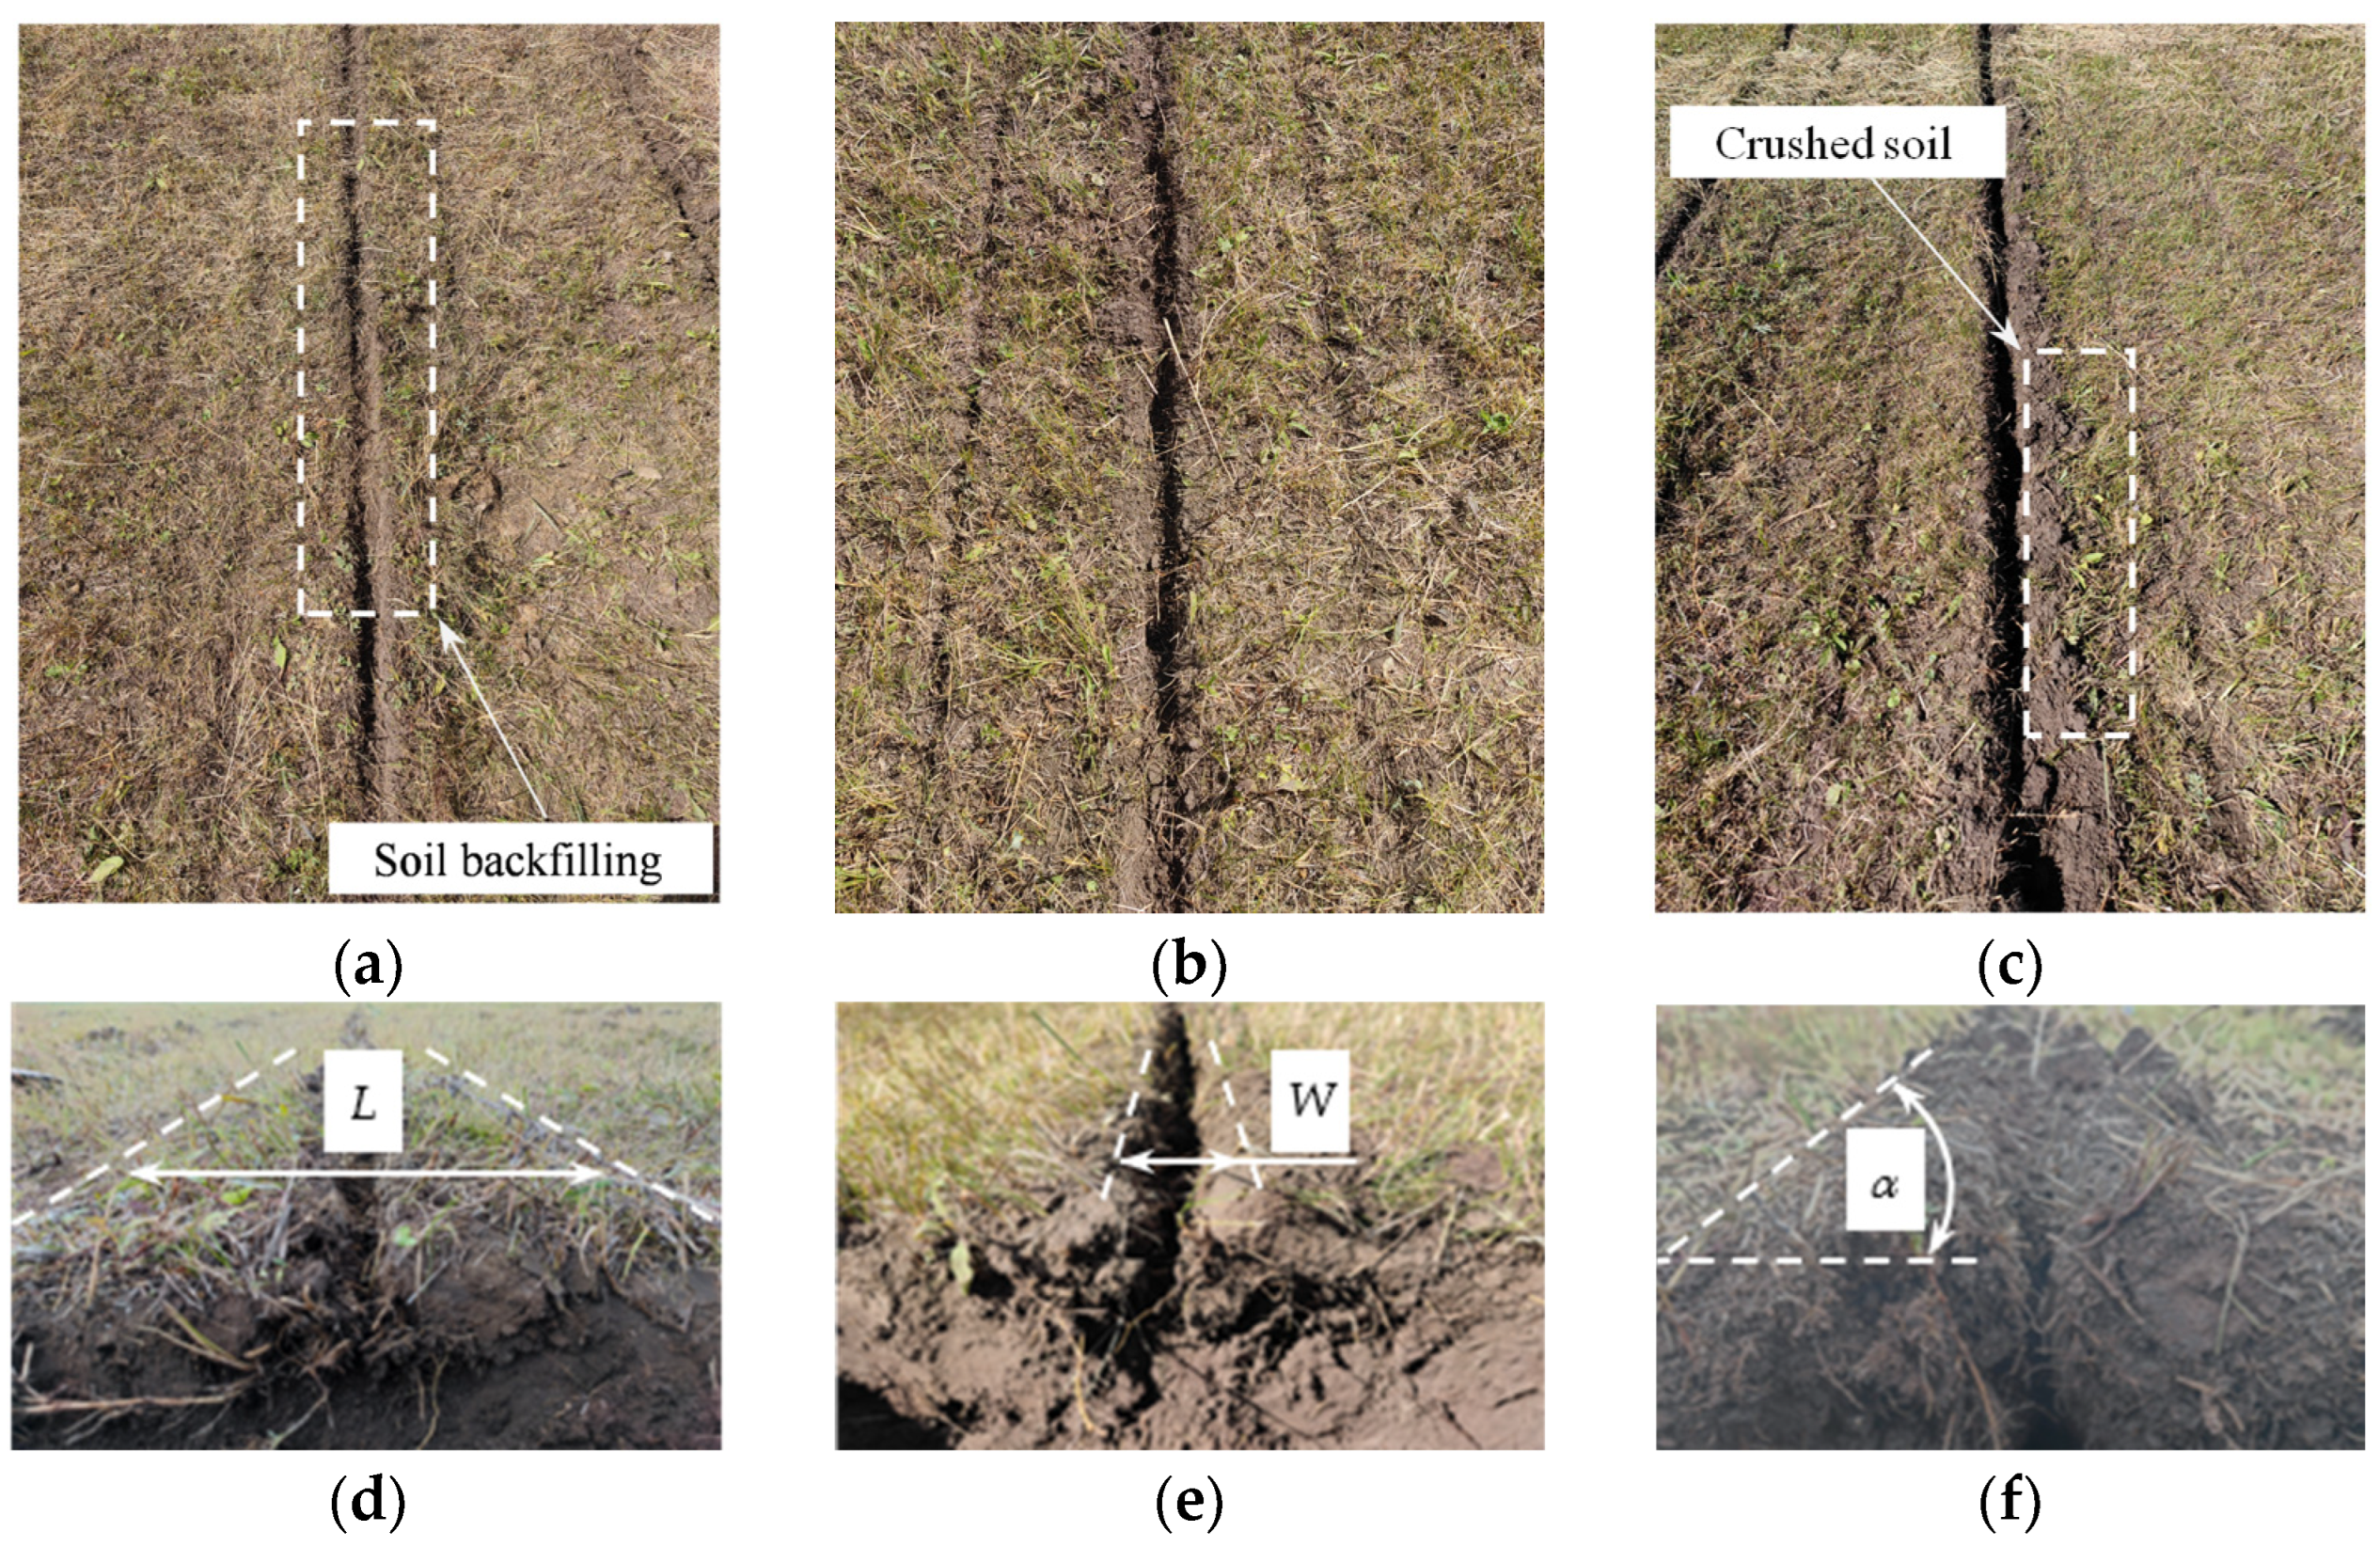
3.2.1. Disturbance Feature Analysis

The results of one group of combined operating parameters were selected for analysis. Among them, the operation status of the bionic loosening shovel with the arrow-shaped loosening shovel and the diamond-shaped loosening shovel is shown in Figure 16. This section evaluates the operational effect of each shovel shape based on the soil ridge angle (α), loosening furrow width (W), and loosening width (L). Specifically, a smaller α and W, along with a larger L, indicate a better loosening effect.
As shown in Figure 16a–c, the soil disturbance on the surface of the grassland after the operation using the bionic loosening shovel is minimal. Less broken soil is generated on the surface after the operation, and the soil backfilling effect is optimal. The soil disturbance on the surface of the grassland after the operation using an arrow-shaped loosening shovel is maximal. More broken soil is generated on both sides of the loosening furrow, and the soil backfill effect is the worst. During field tests with different parameters, it was found that as the value of V increased, the amount of broken soil on both sides of the loosening furrow for the bionic loosening shovel, the arrow-shaped loosening shovel, and the diamond-shaped loosening shovel continued to increase. When operating with a higher value of V, the soil on both sides of the loosening furrow became more crushed or even turned over, consistent with the trend in Figure 9a. As shown in Figure 16d–f, α and W are the smallest after using the bionic loosening shovel. The average soil ridge angle α is 18.56°, and the average loosening furrow width W is 46.33 mm. The values of α and W were largest after using the arrow-shaped loosening shovel. The average value of α was 27.53°, and the average value of W was 84.77 mm. However, L is the largest after using the arrow-shaped loosening shovel and smallest after using the bionic loosening shovel. The results indicate that the arrow-shaped loosening shovel has a greater loosening range than the bionic loosening shovel. The tests found that as the value of H increases, the value of α, the value of W, and the value of L for all three shovels become larger, but the disturbance effect on the surface soil is reduced. Based on the above analysis, the results show that the bionic loosening shovel provides better surface soil disturbance than the diamond-shaped and arrow-shaped loosening shovels.

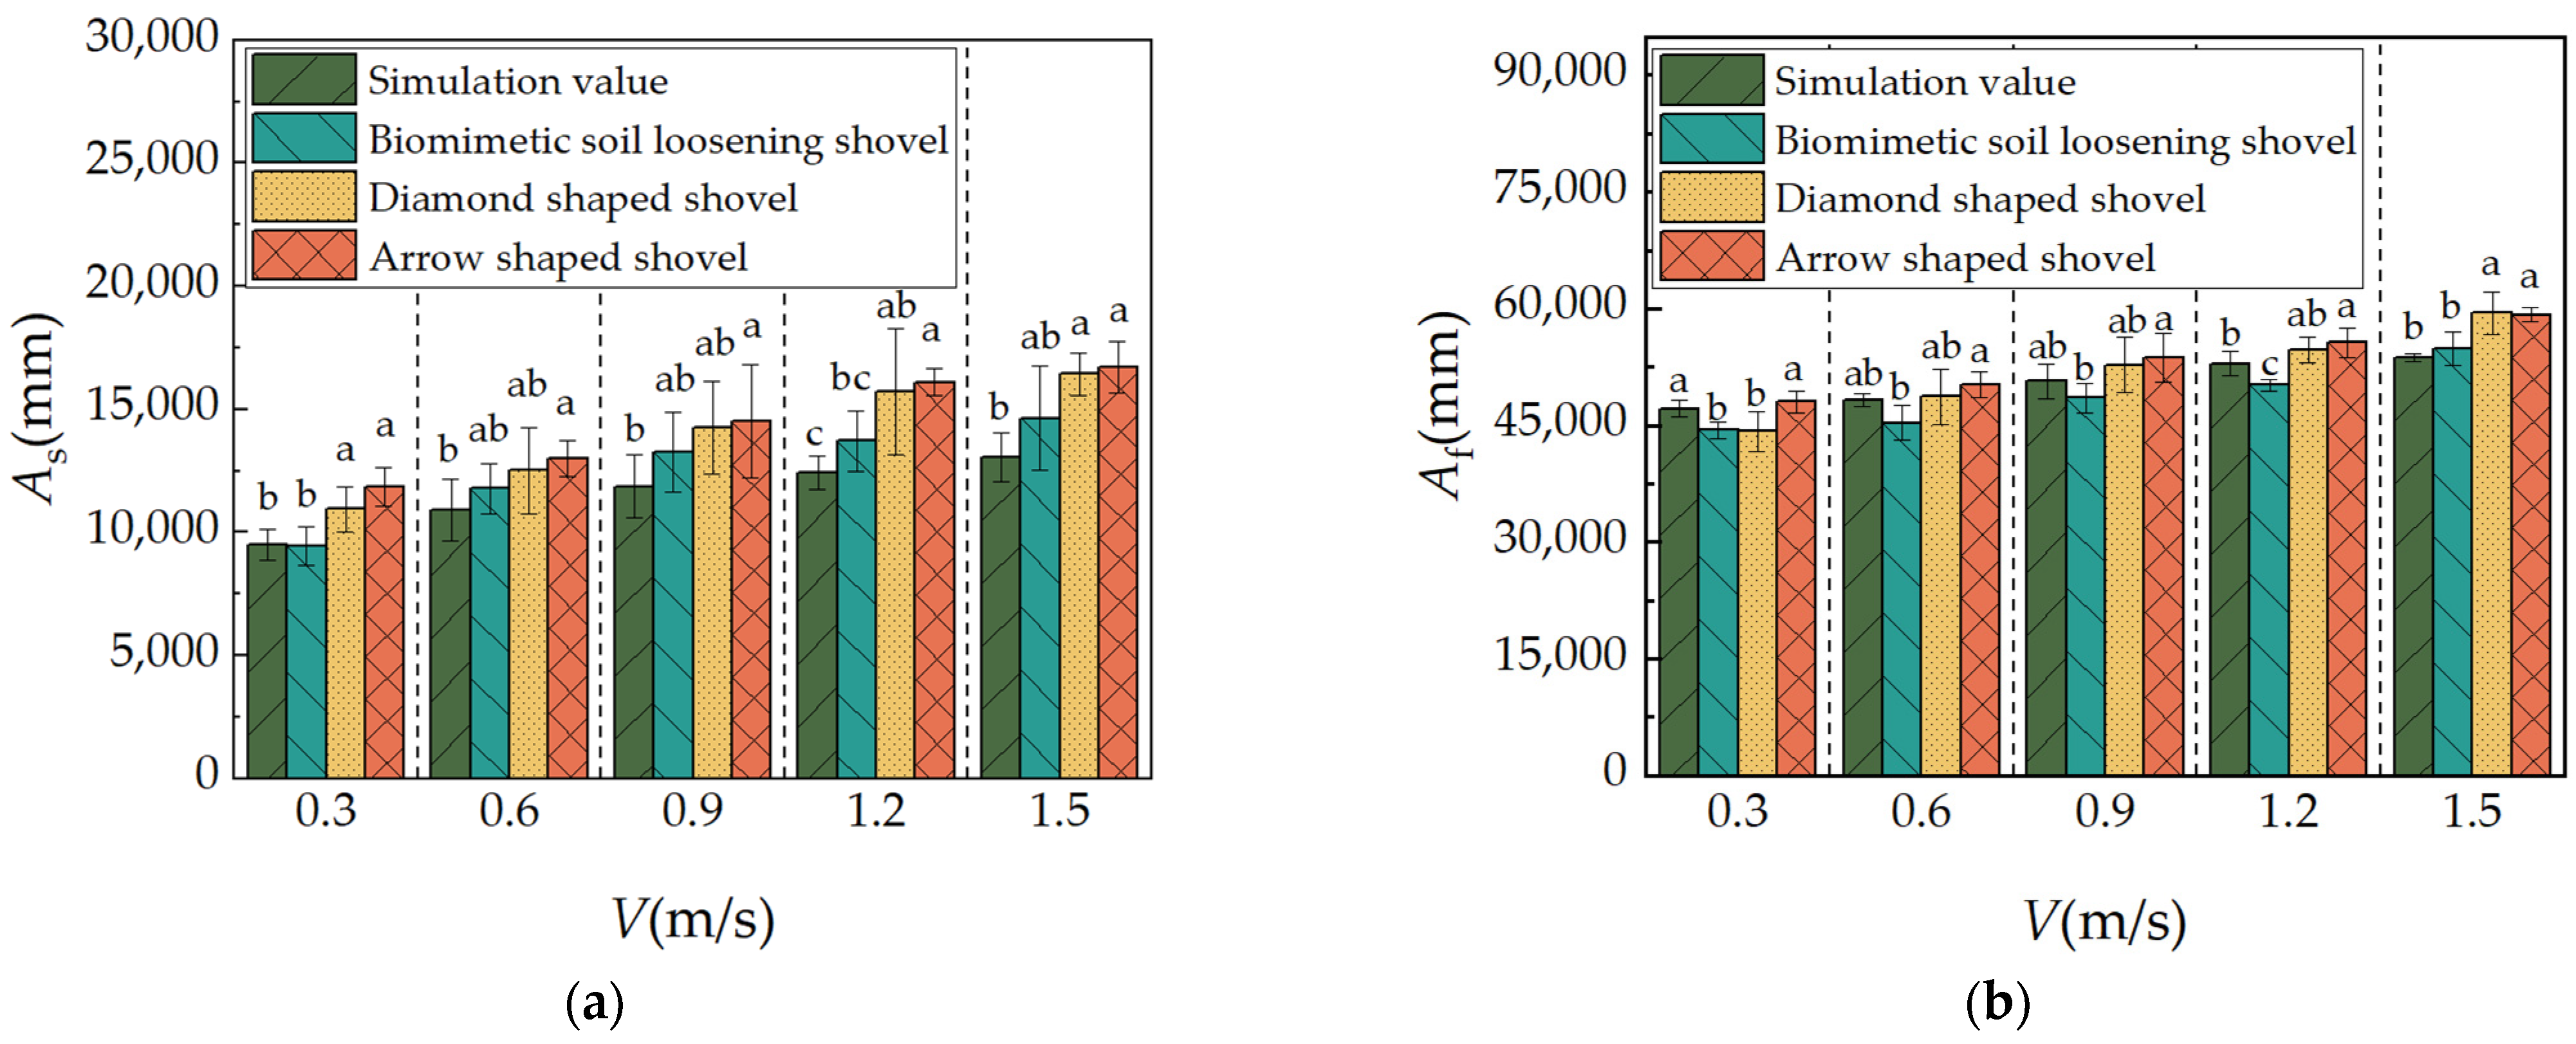
3.2.2. Comparison Values of As and Af Among Three Types of Loosening Shovels

To analyze the difference between the simulation and test values of the bionic loosening shovel, as well as the test differences among the three loosening shovels, the difference ratios (Da1 and Da2) are proposed as an evaluation index (Equations (4) and (5)). The values of As and Af under different operating parameters for the three types of loosening shovels are shown in Figure 17 and Figure 18. From Figure 17, it can be seen that as V increases, the values of As and Af for the bionic loosening shovel also increase. Da1 between the test and simulation values for As of the bionic loosening shovel is 0.53%, 7.68%, 10.49%, 9.41%, and 10.81%. For Af, Da1 are 6.22%, 6.44%, 4.45%, 5.57%, and 2.10%. The results indicate that the simulation closely aligns with the field test results after operating the bionic loosening shovel, confirming that the simulation model can reliably predict the changing trends of As and Af for the bionic loosening shovel. Similarly, the values of As and Af for all three types of loosening shovels increase as V rises. The trends in As and Af after using the three types of loosening shovels were approximately consistent with the simulated trends for the bionic loosening shovel (Figure 10). Comparing the results of the three types of loosening shovels at the same speed, the As value after using the bionic loosening shovel is the smallest, while the As value after using the arrow-shaped loosening shovel is the largest. At working speeds of 0.3 to 1.5 m/s, the average of Da2 between the As values using the bionic and arrow-shaped loosening shovels is 15.41%. This shows that the bionic loosening shovel is more effective in reducing surface soil disturbance. Similarly, the Af value after using the bionic loosening shovel is the smallest, while the Af value after using the arrow-shaped loosening shovel is the largest. The average of Da2 between the Af value using the bionic and arrow-shaped loosening shovels is 9.68%. The results indicate that the bionic loosening shovel does not significantly enhance the disturbance of the inner soil.
As shown in Figure 18 at H of 120 to 360 mm, As and Af gradually increase after using the bionic loosening shovel. Under the same value of H, the average value of Da1 between the test and simulation values of As using the bionic loosening shovel is 6.15%, and the average value of Da1 between the test and simulation values of Af is 6.57%. The results show that the Da1 values of the field test and simulation for As and Af are smaller. The field test and simulation results of As and Af after using the bionic loosening shovel (Figure 11) exhibit similar trends. The simulation model can predict the changing trends of As and Af for the bionic loosening shovel under different H values.
Under the same value of H, the As value after using the bionic loosening shovel is smaller than that of the diamond loosening shovel and the arrow-shaped loosening shovel. The Da2 values between the As value of the bionic loosening shovel and those of the diamond and arrow-shaped loosening shovels are 11.48% and 20.25%, respectively. The Da2 values between the Af value of the bionic loosening shovel and those of the diamond and arrow-shaped loosening shovels are 5.27% and 5.97%. The results show that the disturbance effect of the bionic loosening shovel on the surface soil is better than that of the diamond-shaped loosening shovel and arrow-shaped loosening shovel, but the disturbance ability on the inner soil is slightly lower than that of the diamond-shaped loosening shovel and arrow-shaped loosening shovel.

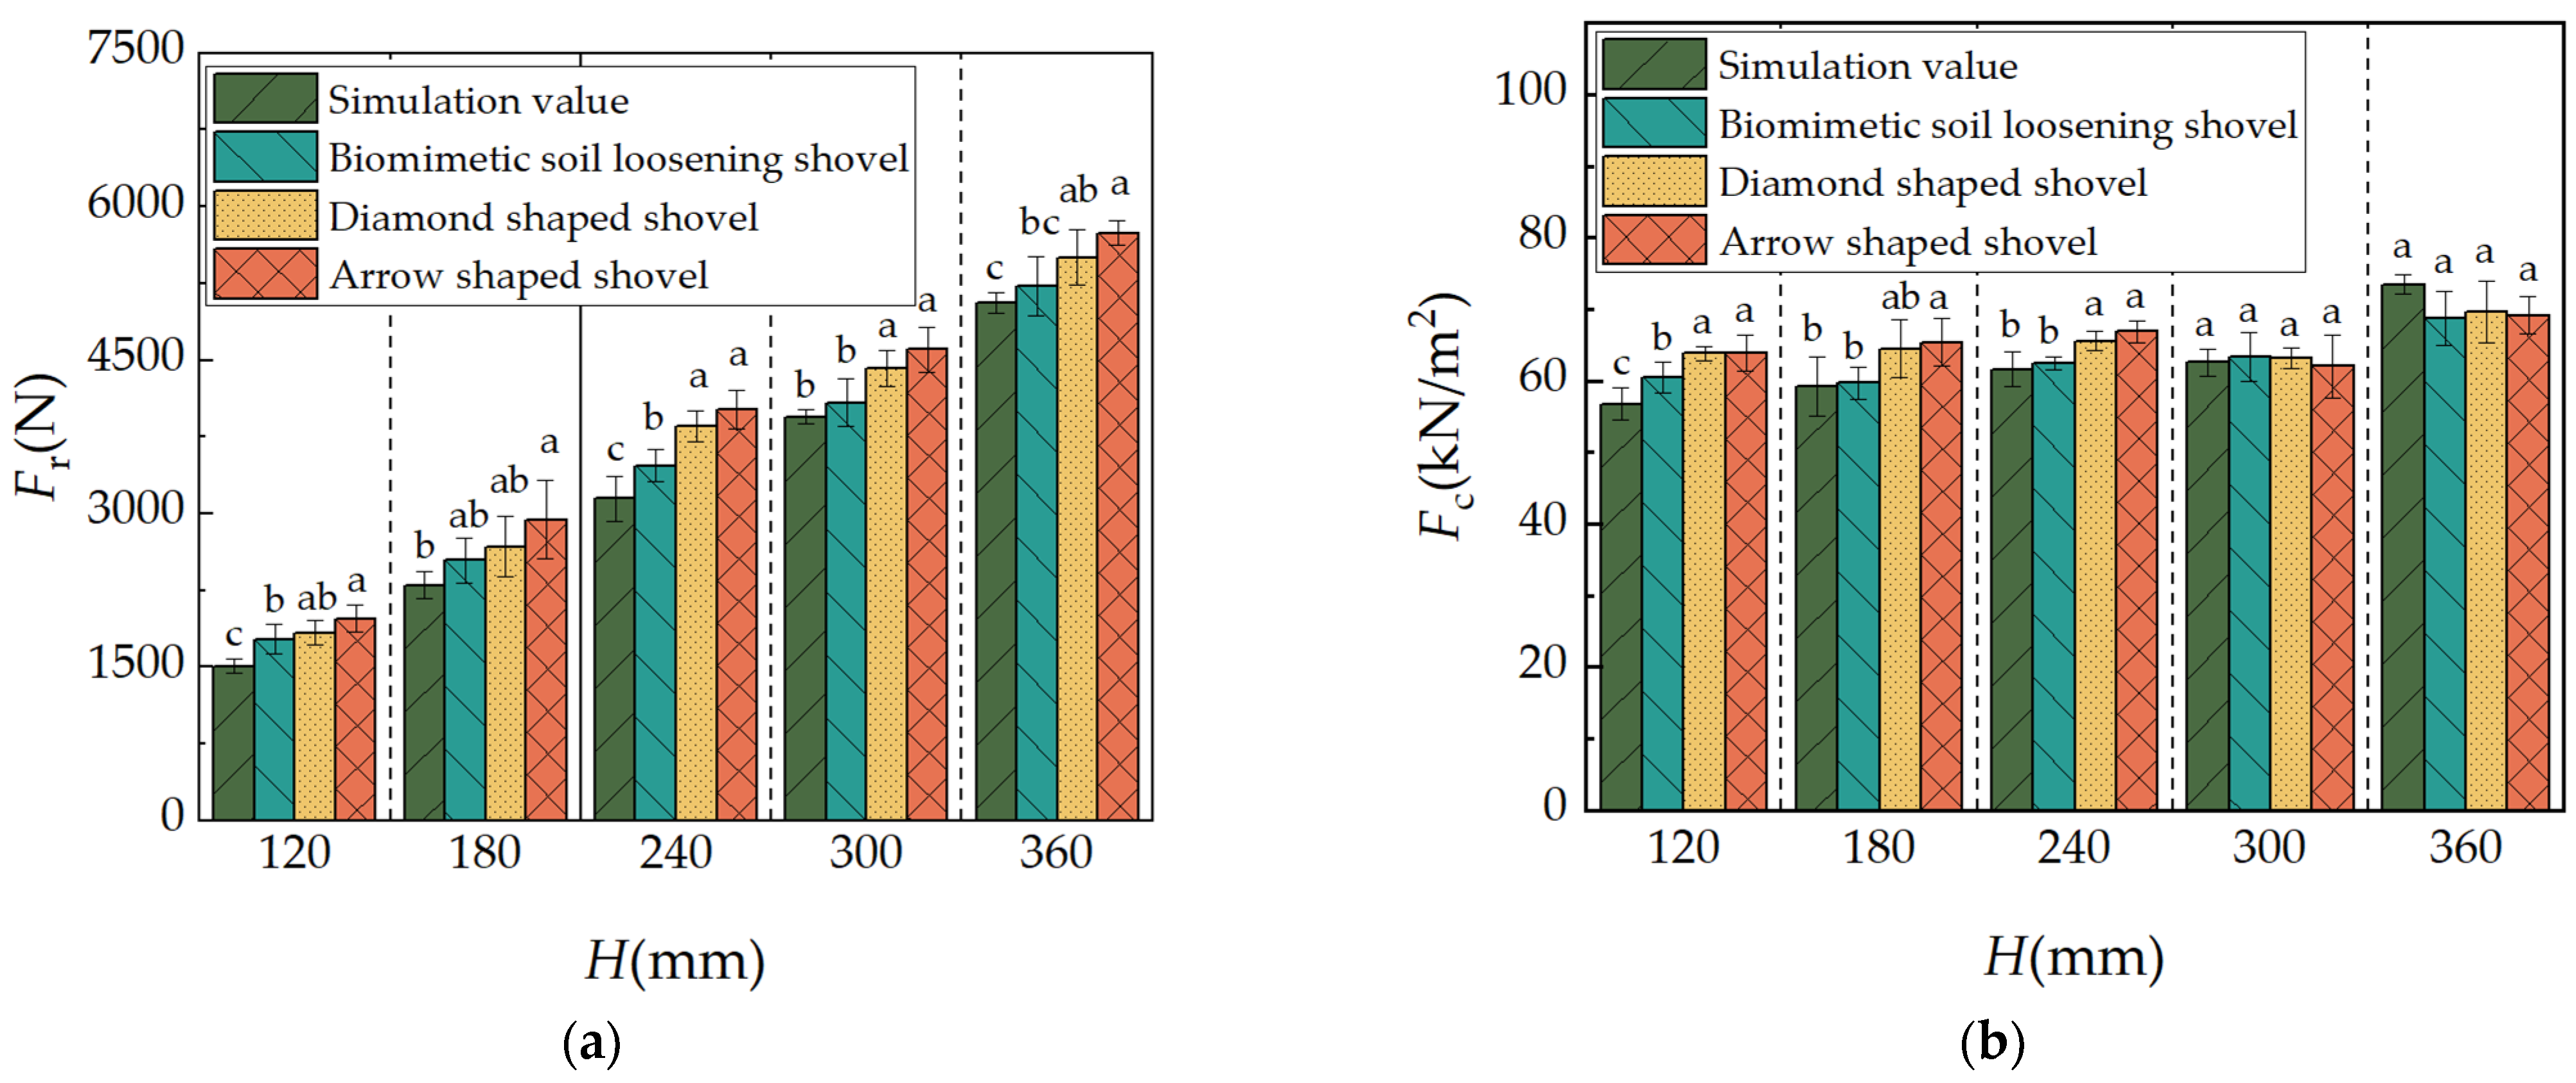
3.2.3. Effects of Operating Parameters on Fr and Fc

The variation of Fr and Fc after using three types of loosening shovels under different operation parameters is shown in Figure 19 and Figure 20. Figure 19 illustrates the variation of Fr and Fc after using three types of loosening shovels at different V. As shown in Figure 19, as V increases, Fr and Fc for the three loosening shovels gradually increase, consistent with the results in Figure 14b and Figure 15b. When the operation speed ranges from 0.3 m/s to 1.5 m/s, the average Da1 value between the simulation and test values of Fr using the bionic loosening shovel is 3.66%, and the average Da1 value between the simulation and test values of Fc is 4.01%. The results indicate that the simulation model can better predict the changing trend of Fr for the bionic loosening shovel. At the same value of V, the average value of Da2 between the Fr values of the bionic loosening shovel and the Fr values of the diamond-shaped loosening shovel was 12.47%, and the average value of Da2 between the Fr values of the bionic loosening shovel and the Fr values of the arrow-shaped loosening shovel was 20.55%. The average value of Da2 between the Fc values of the bionic loosening shovel and the Fc values of the diamond-shaped loosening shovel was 4.69%, and the average value of Da2 between the Fc values of the bionic loosening shovel and the Fc values of the arrow-shaped loosening shovel was 9.16%. The results show that the values of Fr and Fc of the bionic loosening shovel are the smallest, and the values of Fr and Fc of the arrow-shaped loosening shovel are the largest. Therefore, the power consumption of the bionic loosening shovel in loosening the degraded grassland is the smallest.
As shown in Figure 20a, Fr increases with the increase in H after using the three types of loosening shovels. This growth trend is consistent with that shown in Figure 14a. Specifically, under the same H, the average Da1 between the simulation and test values for Fr with the bionic loosening shovel is 8.04%. The results indicate that the Da1 between the test and simulation values after using the bionic loosening shovel is minimal. This suggests that the simulation model accurately predicts the Fr value of the bionic loosening shovel under different H. Additionally, under the same H conditions, the Fr value for the arrow-shaped loosening shovel is the largest, while the Fr value for the bionic loosening shovel is the smallest. The minimum Da2 between the Fr value of the bionic loosening shovel and the arrow-shaped loosening shovel is 8.97%. The results show that the bionic loosening shovel can effectively reduce Fr. In Figure 20b, Fc initially decreases and then increases with increasing H. This behavior can be attributed to the fact that the root system is primarily distributed around a depth of 100 mm, which is a critical zone where the root system helps connect the soil. This makes the soil more difficult to break in this region and requires greater cutting force, explaining the observed initial decrease followed by an increase in Fc.
According to the soil loosening improvement requirements outlined in Section 2.1. Combined with the simulation test and the field comparison test results of the three types of loosening shovels, the results indicate that the arrow-shaped loosening shovel causes the greatest disturbance to the surface soil, with the highest Fr and Fc during the loosening process. The high disturbance and increased forces are less suitable for degraded grasslands, as excessive soil disruption can harm the soil structure and root systems, potentially leading to further degradation. The bionic loosening shovel has the least disturbance to the surface soil, and the Fr and Fc carried during the loosening process are the smallest. Therefore, the bionic loosening shovel is more conducive to the loosening of degraded grassland.
Furthermore, studies are recommended to focus on the motion bionics of the bionic objects in addition to structural bionics. Investigating the motion mechanisms of bionic objects and integrating these findings into the optimization of loosening shovels could further improve the performance of tillage tools. By combining both structural and motion bionics, the operational effectiveness of loosening tools can be significantly enhanced.

4. Conclusions

In this study, the claws of prairie zokor were used as bionic objects. Structural bionics and image processing technology were used to design a bionic loosening shovel suitable for degraded grassland. DEM is applied to analyze the changes in As, Af, Fr, and Fc for the bionic loosening shovel under different V and H. These results were verified through field tests. Additionally, the performance of the bionic loosening shovel is compared with that of standard loosening shovels (the diamond loosening shovel and the arrow-shaped loosening shovel) in field tests. The findings provide technical support for optimizing the design of loosening shovels for degraded grasslands. The following conclusions were drawn.
  • The simulation results indicate that As, Af, Fr, and Fc all show a nonlinear increase as V and H increase. As V increases, the growth rate of Fc rises gradually, while the growth rate of Fr remains relatively stable, and the growth rates of As and Af decrease. As H increases, the growth rates of Af and Fr tend to increase, while the growth rates of As and Fc decrease.
  • The field tests, conducted with varying values of V and H, show that the changes in As, Af, Fr, and Fc align closely with the trends observed in the simulation results. The Da1 between the test and simulation values for As, Af, Fr, and Fc is less than 10%, indicating that the simulation model can reliably predict the performance of the bionic loosening shovel.
  • After using the bionic loosening shovel, the values of α and W were the smallest, with an average α of 18.56° and an average W of 46.33 mm. In contrast, after using the arrow-shaped loosening shovel, α and W were the largest, with an average α of 27.53° and an average W of 84.77 mm. L was the largest with the arrow-shaped loosening shovel and the smallest with the bionic loosening shovel. Overall, the bionic loosening shovel demonstrated a better disturbance effect on the surface soil compared to both the diamond-shaped and arrow-shaped loosening shovels.
  • The comparative test results show that the bionic loosening shovel has the smallest As, Fr, and Fc values, while the arrow-shaped loosening shovel has the largest. Specifically, compared with the arrow-shaped loosening shovel, As the bionic loosening shovel is reduced by 15.41% and 20.25%, Fr is reduced by 20.55% and 8.97%, and Fc is reduced by 9.16% and 4.69%. However, the bionic loosening shovel does not significantly improve Af. Considering the requirements for loosening soil in degraded grasslands, the bionic loosening shovel outperforms both the diamond-shaped and arrow-shaped loosening shovels, making it more suitable for this purpose.

Author Contributions

Conceptualization, investigation, writing-original draft, visualization, Z.W.; methodology, Z.W.; resources, supervision, writing-review and editing, Y.Y. and D.W.; soil sampling, Z.W. and X.Z.; data collection, Z.W. and C.P. All authors have read and agreed to the published version of the manuscript.

Funding

This research was supported by the earmarked fund for National Key R&D Program of China (2022YFD2001903) and the earmarked fund for CARS (CARS-34).

Institutional Review Board Statement

Not applicable.

Data Availability Statement

The data are contained within the article. Further inquiries can be directed to the corresponding author.

Acknowledgments

This work was supported by the earmarked fund for National Key R&D Program of China (2022YFD2001903) and the earmarked fund for CARS (CARS-34).

Conflicts of Interest

The authors declare no conflicts of interest.

References

  1. Petermann, J.S.; Buzhdygan, O.Y. Grassland biodiversity. Curr. Biol. 2021, 31, R1195–R1201. [Google Scholar] [CrossRef] [PubMed]
  2. Gu, C.; Jia, Z.; Du, B.; He, L.; Li, Q. Reviews and prospects of ecological restoration measures for degraded grasslands of China. Ecol. Environ. 2022, 31, 1465. [Google Scholar] [CrossRef]
  3. Wang, Z.; Li, L.; Han, X.; Dong, M. Do rhizome severing and shoot defoliation affect clonal growth of Leymus chinensis at ramet population level? Acta Oecol. 2004, 26, 255–260. [Google Scholar] [CrossRef]
  4. Zhang, X.; You, Y.; Wang, D.; Wang, Z.; Liao, Y.; Li, S. Soil failure characteristics and loosening effectivity of compacted grassland by subsoilers with different plough points. Biosyst. Eng. 2024, 237, 170–181. [Google Scholar] [CrossRef]
  5. Han, J.G.; Zhang, Y.J.; Wang, C.J.; Bai, W.M.; Wang, Y.R.; Han, G.D.; Li, L.H. Rangeland degradation and restoration management in China. Rangel. J. 2008, 30, 233. [Google Scholar] [CrossRef]
  6. Pulido, M.; Schnabel, S.; Lavado Contador, J.F.; Lozano-Parra, J.; Gómez-Gutiérrez, Á.; Brevik, E.C.; Cerdà, A. Reduction of the frequency of herbaceous roots as an effect of soil compaction induced by heavy grazing in rangelands of SW spain. CATENA 2017, 158, 381–389. [Google Scholar] [CrossRef]
  7. Zhang, Z.; Gong, J.; Wang, B.; Li, X.; Ding, Y.; Yang, B.; Zhu, C.; Liu, M.; Zhang, W. Regrowth strategies of Leymus chinensis in response to different grazing intensities. Ecol. Appl. 2020, 30, e02113. [Google Scholar] [CrossRef]
  8. Liu, Y.; Meng, L.; Huang, Z.; Shi, Z.; Wu, G. Contribution of fine roots mechanical property of poaceae grasses to soil erosion resistance on the loess plateau. Geoderma 2022, 426, 116122. [Google Scholar] [CrossRef]
  9. Zhang, X.; You, Y.; Wang, D.; Zhu, L. Quality evaluation of the soil-root composites layer of Leymus chinensis grassland based on different degradation degrees. CATENA 2022, 215, 106330. [Google Scholar] [CrossRef]
  10. Sang, H.; He, C.; Bi, Y.; Liu, M.; Wang, X. Evaluation of the performance of very narrow tines with different geometrical structures for tilling natural grassland. Biosyst. Eng. 2022, 224, 34–48. [Google Scholar] [CrossRef]
  11. You, Y.; Wang, D.; Liu, J. A device for mechanical remediation of degraded grasslands. Soil Tillage Res. 2012, 118, 1–10. [Google Scholar] [CrossRef]
  12. Chen, X.; Zhang, T.; Guo, R.; Li, H.; Zhang, R.; Degen, A.A.; Huang, K.; Wang, X.; Bai, Y.; Shang, Z. Fencing enclosure alters nitrogen distribution patterns and tradeoff strategies in an alpine meadow on the Qinghai-Tibetan Plateau. CATENA 2021, 197, 104948. [Google Scholar] [CrossRef]
  13. Xu, L.; Nie, Y.; Chen, B.; Xin, X.; Yang, G.; Xu, D.; Ye, L. Effects of fence enclosure on vegetation community characteristics and productivity of a degraded temperate meadow steppe in northern China. Appl. Sci. 2020, 10, 2952. [Google Scholar] [CrossRef]
  14. De Boer, H.C.; Deru, J.G.C.; Van Eekeren, N. Sward lifting in compacted grassland: Contrasting effects on two different soils. Soil Tillage Res. 2020, 201, 104564. [Google Scholar] [CrossRef]
  15. Drewry, J.J.; Lowe, J.A.H.; Paton, R.J. Effect of subsoiling on soil physical properties and pasture production on a Pallic Soil in Southland, New Zealand. N. Z. J. Agric. Res. 2000, 43, 269–277. [Google Scholar] [CrossRef]
  16. Głąb, T.; Kacorzyk, P. Root distribution and herbage production under different management regimes of mountain grassland. Soil Tillage Res. 2011, 113, 99–104. [Google Scholar] [CrossRef]
  17. Zhang, H.; Araya, K.; Kudoh, M.; Zhang, C.; Jia, H.; Liu, F.; Sawai, T.; Yang, S. An explosive subsoiler for the improvement of meadow soil, part 3: Field experiments. J. Agric. Eng. Res. 2000, 75, 327–332. [Google Scholar] [CrossRef]
  18. Ning, T.; Liu, Z.; Hu, H.; Li, G.; Kuzyakov, Y. Physical, chemical and biological subsoiling for sustainable agriculture. Soil Tillage Res. 2022, 223, 105490. [Google Scholar] [CrossRef]
  19. Zhang, L.; Zhai, Y.; Chen, J.; Zhang, Z.; Huang, S. Optimization design and performance study of a subsoiler underlying the tea garden subsoiling mechanism based on bionics and EDEM. Soil Tillage Res. 2022, 220, 105375. [Google Scholar] [CrossRef]
  20. Huang, Y.; Si, Z.J.; Teng, Y.; Wang, B. Research on the improved effect of grassland desertification salinity-alkalinity by vibration deep loosening integration technology. In Proceedings of the 2011 International Conference on New Technology of Agricultural, Zibo, China, 27–29 May 2011. [Google Scholar] [CrossRef]
  21. De Boer, H.C.; Deru, J.G.C.; Van Eekeren, N. Sward lifting in compacted grassland: Effects on soil structure, grass rooting and productivity. Soil Tillage Res. 2018, 184, 317–325. [Google Scholar] [CrossRef]
  22. He, C.; You, Y.; Wang, D.; Wu, H.; Ye, B. An experimental investigation of soil layer coupling failure characteristics on natural grassland by passive subsoiler-type openers. INMATEH-Agric. Eng. 2020, 61, 49–58. [Google Scholar] [CrossRef]
  23. Wang, X.; Gao, P.; Yue, B.; Shen, H.; Fu, Z.; Zheng, Z.; Zhu, R.; Huang, Y. Optimization of installation parameters of subsoiler’ wing using the discrete element method. Comput. Electron. Agric. 2019, 162, 523–530. [Google Scholar] [CrossRef]
  24. Liu, K.; Sozzi, M.; Gasparini, F.; Marinello, F.; Sartori, L. Combining simulations and field experiments: Effects of subsoiling angle and tillage depth on soil structure and energy requirements. Comput. Electron. Agric. 2023, 214, 108323. [Google Scholar] [CrossRef]
  25. Sasaki, C.M.; Gonçalves, J.L.d.M.; da Silva, Á.P. Ideal subsoiling moisture content of Latosols used in forest plantations. For. Ecol. Manag. 2007, 243, 75–82. [Google Scholar] [CrossRef]
  26. Wang, S.; Wang, H.; Hafeez, M.B.; Zhang, Q.; Yu, Q.; Wang, R.; Wang, X.; Li, J. No-tillage and subsoiling increased maize yields and soil water storage under varied rainfall distribution: A 9-year site-specific study in a semi-arid environment. Field Crops Res. 2020, 255, 107867. [Google Scholar] [CrossRef]
  27. Zhang, X.; You, Y.; Wang, D.; Lv, J. Design and experiment of a combined root-cutting and ditching device. INMATEH-Agric. Eng. 2022, 66, 383–392. [Google Scholar] [CrossRef]
  28. Wang, Y.; Li, N.; Ma, Y.; Tong, J.; Pfleging, W.; Sun, J. Field experiments evaluating a biomimetic shark-inspired (BioS) subsoiler for tillage resistance reduction. Soil Tillage Res. 2020, 196, 104432. [Google Scholar] [CrossRef]
  29. Song, W.; Jiang, X.; Li, L.; Ren, L.; Tong, J. Increasing the width of disturbance of plough pan with bionic inspired subsoilers. Soil Tillage Res. 2022, 220, 105356. [Google Scholar] [CrossRef]
  30. Li, B.; Chen, Y.; Chen, J. Modeling of soil–claw interaction using the discrete element method (DEM). Soil Tillage Res. 2016, 158, 177–185. [Google Scholar] [CrossRef]
  31. Hilal, M.G.; Ji, C.; Li, Y.; Tang, K.; Li, H.; Liu, X.; Lin, K.; Wang, D. Deciphering the role of rodents in grassland degradation; A review. J. Environ. Manag. 2024, 370, 122618. [Google Scholar] [CrossRef]
  32. Guo, Z.G.; Li, X.F.; Liu, X.Y.; Zhou, X.R. Response of alpine meadow communities to burrow density changes of plateau pika (Ochotona curzoniae) in the Qinghai-Tibet Plateau. Acta Ecol. Sin. 2012, 32, 44–49. [Google Scholar] [CrossRef]
  33. Ucgul, M.; Saunders, C.; Fielke, J.M. Discrete element modelling of top soil burial using a full scale mouldboard plough under field conditions. Biosyst. Eng. 2017, 160, 140–153. [Google Scholar] [CrossRef]
  34. Zhao, J.; Lu, Y.; Wang, X.; Zhuang, J.; Han, Z. A bionic profiling-energy storage device based on MBD-DEM coupled simulation optimization reducing the energy consumption of deep loosening. Soil Tillage Res. 2023, 234, 105824. [Google Scholar] [CrossRef]
  35. Tamás, K.; Jóri, I.J.; Mouazen, A.M. Modelling soil–sweep interaction with discrete element method. Soil Tillage Res. 2013, 134, 223–231. [Google Scholar] [CrossRef]
  36. Tamás, K.; Bernon, L. Role of particle shape and plant roots in the discrete element model of soil–sweep interaction. Biosyst. Eng. 2021, 211, 77–96. [Google Scholar] [CrossRef]
  37. Yang, Y.; Li, M.; Tong, J.; Ma, Y. Study on the interaction between soil and the five-claw combination of a mole using the discrete element method. Appl. Bionics Biomech. 2018, 2018, 7854052. [Google Scholar] [CrossRef]
  38. Hang, C.; Gao, X.; Yuan, M.; Huang, Y.; Zhu, R. Discrete element simulations and experiments of soil disturbance as affected by the tine spacing of subsoiler. Biosyst. Eng. 2018, 168, 73–82. [Google Scholar] [CrossRef]
  39. Hang, C.; Huang, Y.; Zhu, R. Analysis of the movement behaviour of soil between subsoilers based on the discrete element method. J. Terramech. 2017, 74, 35–43. [Google Scholar] [CrossRef]
  40. Chen, M.; Ma, L.; Shao, M.; Wei, X.; Jia, Y.; Sun, S.; Zhang, Q.; Li, T.; Yang, X.; Gan, M. Chinese zokor (Myospalax fontanierii) excavating activities lessen runoff but facilitate soil erosion—A simulation experiment. CATENA 2021, 202, 105248. [Google Scholar] [CrossRef]
  41. Mamman, E. The effects of tool width and rake angle on draught and soil failure patterns of model chisels furrowers. In Proceedings of the 2019 ASABE Annual International Meeting, Boston, MA, USA, 7–10 July 2019; ASABE: St. Joseph, MI, USA, 2019. [Google Scholar] [CrossRef]
  42. JB/T 9788–1999; Subsoiler and Share Shaft. China Machine Press: Beijing, China, 1999.
  43. Wu, P.; Zhang, X.; Zeng, Z.; Chen, Y. DEM simulation of subsoiling for soil disturbance as affected by soil layering and working speed. Smart Agric. Technol. 2024, 7, 100385. [Google Scholar] [CrossRef]
  44. Liu, Y.; Zhao, J.; Yin, B.; Ma, Z.; Hao, J.; Yang, X.; Feng, X.; Ma, Y. Discrete element modelling of the yam root–soil complex and its verification. Biosyst. Eng. 2022, 220, 55–72. [Google Scholar] [CrossRef]
  45. Zhang, S.; Zhao, H.; Wang, X.; Dong, J.; Zhao, P.; Yang, F.; Chen, X.; Liu, F.; Huang, Y. Discrete element modeling and shear properties of the maize stubble-soil complex. Comput. Electron. Agric. 2023, 204, 107519. [Google Scholar] [CrossRef]
  46. Xie, K.; Zhang, Z.; Wang, F.A.; Yu, X.; Wang, C.; Jiang, S. Calibration and experimental verification of discrete element parameters of Panax notoginseng root. Int. J. Agric. Biol. Eng. 2024, 17, 12–23. [Google Scholar] [CrossRef]
  47. Wang, X.; Zhang, S.; Pan, H.; Zheng, Z.; Huang, Y.; Zhu, R. Effect of soil particle size on soil-subsoiler interactions using the discrete element method simulations. Biosyst. Eng. 2019, 182, 138–150. [Google Scholar] [CrossRef]
  48. GB/T 50123–2019; Standard for Geotechnical Testing Method. China Planning Press: Beijing, China, 2019.
  49. Zhou, L.; Gao, J.; Hu, C.; Li, Q. Numerical simulation and testing verification of the interaction between track and sandy ground based on discrete element method. J. Terramech. 2021, 95, 73–88. [Google Scholar] [CrossRef]
  50. Li, J.; Xie, S.; Liu, F.; Guo, Y.; Liu, C.; Shang, Z.; Zhao, X. Calibration and testing of discrete element simulation parameters for sandy soils in potato growing areas. Appl. Sci. 2022, 12, 10125. [Google Scholar] [CrossRef]
  51. Raper, R.L. Force requirements and soil disruption of straight and bentleg subsoilers for conservation tillage systems. Appl. Eng. Agric. 2005, 21, 787–794. [Google Scholar] [CrossRef]
  52. GB/T 34751-2017; Utilization Site Classification of Rangeland. Administration for Quality Supervision, Inspection and Quarantine of the People’s Republic of China & Standardization Administration of the People’s Republic of China: Beijing, China, 2017.
  53. NY/T 1121.4–2006; Soil Testing—Part 4: Method for Determination of Soil Bulk Density. China Agriculture Press: Beijing, China, 2006.
  54. Aikins, K.A.; Antille, D.L.; Ucgul, M.; Barr, J.B.; Jensen, T.A.; Desbiolles, J.M.A. Analysis of effects of operating speed and depth on bentleg opener performance in cohesive soil using the discrete element method. Comput. Electron. Agric. 2021, 187, 106236. [Google Scholar] [CrossRef]
  55. McKyes, E.; Maswaure, J. Effect of design parameters of flat tillage tools on loosening of a clay soil. Soil Tillage Res. 1997, 43, 195–204. [Google Scholar] [CrossRef]
  56. Ibrahmi, A.; Bentaher, H.; Hbaieb, M.; Maalej, A.; Mouazen, A.M. Study the effect of tool geometry and operational conditions on mouldboard plough forces and energy requirement: Part 1. Finite element simulation. Comput. Electron. Agric. 2015, 117, 258–267. [Google Scholar] [CrossRef]
Figure 1. Schematic diagram of the prairie zokor and its claws. Notes: The blue frame shows an enlarged image of the prairie zokor’s front paw, while the red frame highlights an enlarged image of the largest toe of its front paw.
Agriculture 15 00487 g001
Figure 2. Image processing flowchart of the largest toe of the prairie zokor’s paw: (a) Grayscale processing; (b) Binarization processing; (c) Filtering processing; (d) Edge detection; (e) Inner contour fitting; (f) Outer contour fitting.
Agriculture 15 00487 g002
Figure 3. Schematic diagram of the bionic loosening shovel structure: (a) Bionic loosening shovel tip; (b) Composition of the bionic loosening shovel.
Agriculture 15 00487 g003
Figure 4. Construction process and results of discrete element model of the root-soil complex: (a) Construction process of discrete element model of the root-soil complex; (b) Results of discrete element model of the root-soil complex. Notes: The root layer consists of a root-dense zone and a root-sparse zone, with the root layer, subsurface layer, and substratum all having a uniform soil depth of 150 mm.
Agriculture 15 00487 g004
Figure 5. Schematic diagram of the operation process and soil disturbance: (a) Operation process; (b) Schematic diagram of soil disturbance. Notes: In Figure 5b, different colors represent the movement velocity of model particles. Red for maximum velocity, green for middle velocity, and blue for minimum velocity.
Agriculture 15 00487 g005
Figure 6. Schematic diagram of the whole machine and main operating parts: (a) Whole machine structure composition; (b) Installation and height adjustment of the bionic loosening shovel; (c) Sensor installation; (d) Bionic loosening shovel; (e) Diamond-shaped loosening shovel; (f) Arrow-shaped loosening shovel.
Agriculture 15 00487 g006
Figure 7. Operational scenario and test process: (a) Working surface after mowing; (b) Soil loosening process.
Agriculture 15 00487 g007
Figure 8. Data measurement methods and devices: (a) Methods for determining loosening resistance; (b) Self-made soil profiler.
Agriculture 15 00487 g008
Figure 9. Schematic diagram of soil disturbance under different operating parameters: (a) Schematic diagram of soil disturbance at different operating speeds; (b) Schematic diagram of soil disturbance at different loosening depths. Notes: Red represents the maximum value of the movement velocity of model particles, green corresponds to the middle value, and blue indicates the minimum value of the movement velocity.
Agriculture 15 00487 g009
Figure 10. Schematic diagram of soil disturbance area changes after operations with different parameters: (a) Soil disturbance area at different V; (b) Soil disturbance area at different V.
Agriculture 15 00487 g010
Figure 11. Schematic diagram of soil disturbance area changes after operations with different parameters: (a) Soil disturbance area at different H; (b) Soil disturbance area at different V.
Agriculture 15 00487 g011
Figure 12. Model disturbance cross-section at different H. Notes: Red represents the maximum value of the movement velocity of model particles, green corresponds to the middle value, and blue indicates the minimum value of the movement velocity.
Agriculture 15 00487 g012
Figure 13. Force cloud diagram of the bionic loosening shovel with different operating parameters: (a) Force cloud diagram of bionic soil loosening shovel at different V; (b) Force cloud diagram of bionic soil loosening shovel at different H. Notes: Red represents the maximum Fr that the bionic loosening shovel can withstand, green represents the middle value of Fr, and blue represents the minimum value of Fr.
Agriculture 15 00487 g013
Figure 14. Variation curves of soil resistance under different operating parameters: (a) soil resistance at different H; (b) soil resistance at different V.
Agriculture 15 00487 g014
Figure 15. Variation curves of soil resistance under different operating parameters: (a) soil resistance at different depths; (b) soil resistance at different velocities.
Agriculture 15 00487 g015
Figure 16. Schematic diagram of field test results: (a) The surface working effect after using the bionic loosening shovel; (b) The surface working effect after using the diamond-shaped loosening shovel; (c) The surface working effect after using the arrow-shaped loosening shovel; (d) Longitudinal section of the ground surface after the bionic loosening shovel; (e) Longitudinal section of ground surface after the diamond-shaped loosening shovel; (f) Longitudinal section of ground surface after the arrow-shaped loosening shovel.
Agriculture 15 00487 g016
Figure 17. Schematic diagram showing the influence of V on As and Af: (a) Schematic diagram showing the influence of V on As; (b) Schematic diagram showing the influence of V on Af. Notes: Lowercase letters indicate the difference between the simulation results and the field test results of the three types of loosening shovels.
Agriculture 15 00487 g017
Figure 18. Schematic diagram of the effect of H on As and Af: (a) Schematic diagram of the effect of H on As; (b) Schematic diagram of the effect of H on Af. Notes: Lowercase letters indicate the difference between the simulation results and the field test results of the three types of loosening shovels.
Agriculture 15 00487 g018
Figure 19. Schematic diagram of the effect of V on Fr and Fc: (a) Schematic diagram of the effect of V on Fr; (b) Schematic diagram of the effect of V on Fc. Notes: Lowercase letters indicate the difference between the simulation results and the field test results of the three types of loosening shovels.
Agriculture 15 00487 g019
Figure 20. Schematic diagram of the effect of H on Fr and Fc: (a) Schematic diagram of the effect of H on Fr; (b) Schematic diagram of the effect of H on Fc. Notes: Lowercase letters indicate the difference between the simulation results and the field test results of the three types of loosening shovels.
Agriculture 15 00487 g020
Table 1. Major model parameters.
MaterialParameterValue
65Mn steelDensity (kg/m3)7830 [45]
Poisson’s ratio0.35 [45]
Shear modulus (Pa)7.27 × 10¹⁰ [45]
Soil particlesDensity (kg/m3)2650
Poisson’s ratio0.4
Shear modulus (Pa)1.15 × 10⁶
Restitution coefficient between soil particles0.50
Coefficient of static friction between soil particles0.45
Coefficient of rolling friction between soil particles0.51
Restitution coefficient between soil particles and composite particles0.50
Coefficient of static friction between soil particles and composite particles0.44
Coefficient of rolling friction between soil particles and composite particles0.51
Restitution coefficient between soil particles and 65Mn steel0.42
Coefficient of static friction between soil particles and 65Mn steel0.61
Coefficient of rolling friction between soil particles and 65Mn steel0.65
Composite particlesDensity (kg/m3)2500
Poisson’s ratio0.4
Shear modulus (Pa)3.0 × 10⁶
Restitution coefficient between composite particles0.58
Coefficient of static friction between composite particles0.55
Coefficient of rolling friction between composite particles0.49
Restitution coefficient between composite particles and 65Mn steel0.47
Coefficient of static friction between composite particles and 65Mn steel0.54
Coefficient of rolling friction between composite particles and 65Mn steel0.49
Table 2. Value range of each operation parameter.
FactorParameter Value
V (m/s)0.30.60.91.21.5
H (mm)120180240300360
Disclaimer/Publisher’s Note: The statements, opinions and data contained in all publications are solely those of the individual author(s) and contributor(s) and not of MDPI and/or the editor(s). MDPI and/or the editor(s) disclaim responsibility for any injury to people or property resulting from any ideas, methods, instructions or products referred to in the content.

