Article

Fertilizer Amount and Soil Properties Govern Differential Adsorption of Polyphosphate and Orthophosphate

Engineering Research Center of Comprehensive Utilization and Clean Processing of Phosphorus Resources of Ministry of Education, School of Chemical Engineering, Sichuan University, Chengdu 610065, China
*
Author to whom correspondence should be addressed.
Agriculture 2025, 15(6), 585; https://doi.org/10.3390/agriculture15060585
Submission received: 22 January 2025 / Revised: 26 February 2025 / Accepted: 5 March 2025 / Published: 10 March 2025
(This article belongs to the Section Agricultural Soils)

Abstract

:
The growing use of ammonium polyphosphate (APP) fertilizer requires an understanding of its soil transformation for sustainable phosphorus (P) management and environmental protection. This study investigated the adsorption characteristics of APP1 (two P species) and APP2 (seven P species) in six soils, comparing them with monoammonium phosphate (MAP). Results revealed that APP adsorption was greater than MAP under low P soil and/or low P addition condition, but was lower under high P soil and high P addition conditions. Generally, APP1 showed greater adsorption than APP2, except in laterite soil rich in iron (Fe) and aluminum (Al) oxides. Polyphosphates in APP, especially pyrophosphate, mainly contributed to total P adsorption and promoted the release of native orthophosphate in soil. Compared to MAP, APP’s chelation altered soil pH and released Fe, Al, and organic carbon, impacting P adsorption. Redundancy analysis indicated that Fe oxide and Olsen-P in acidic soils accounted for 54.5% of the variance in adsorption differences between APP and MAP, while pH and organic matter in calcareous soils explained 49.7%. In conclusion, the adsorption differences between APP and MAP depended on P concentration, APP’s P species distribution, and soil properties, providing valuable insights for optimal P management in sustainable agriculture.

1. Introduction

Phosphorous (P) fertilizer plays a vital role in agricultural production. However, traditional orthophosphate (P1) fertilizers are very poorly utilized [1,2], mainly because the P applied to the soil is easily fixed via adsorption or precipitation [3,4,5]. Fortunately, water-soluble ammonium polyphosphate (APP, (NH4)n+2PnO3n+1, n < 20) is currently being increasingly used as an alternative P fertilizer and has shown superiority in enhancing crop yields, improving soil quality, and increasing P utilization efficiency compared to the traditional P1 fertilizer such as monoammonium phosphate (MAP) [6,7,8,9,10]. It has been assumed that polyphosphate (poly-P) is less susceptible to adsorption by soils, which is a key factor in its ability to improve P use efficiency [11,12,13]. However, little direct information is available on the adsorption of APP in soils. Understanding the adsorption behavior of APP in the soils is important for the efficient use of P fertilizer in agriculture and for environmental protection.
Some researchers have reported the adsorption characteristics of poly-P by minerals or soil, mainly focusing on single pyrophosphate (P2) or tripolyphosphate (P3) [14,15,16,17,18,19]. Al-Kanani and Mackenzie [14] reported that P2 adsorption by soil or goethite was lower than that of P1. In contrast, others have shown that P2 adsorption by soil or minerals exceeded that of P1 [15,16,17,18,19], with this difference being more pronounced in low pH soils [19]. It can be seen that the soil’s adsorption capacity for poly-P differs from that for P1, likely influenced by soil properties. APP fertilizers, composed of P1, P2, P3, and/or more condensed P, exhibit good water solubility and chelating capacity to medium and trace metal elements [8,20,21], adding complexity to soil adsorption of APP compared to single P1 or Poly-P. In our previous studies, the adsorption behavior of APPs (APP1 and APP2 with two and seven P species coexistence, respectively) on two typical minerals (i.e., goethite and calcite) was investigated. It was found that the adsorption of APP was greater than that of MAP on goethite [22]. However, on calcite, APP adsorption was greater than MAP at low P concentrations but lower at high P concentrations [23]. Furthermore, the coadsorption of various P species in APPs occurred on the goethite, notably P1 and P2 [22], while P2 in APP solutions with various P species coexistence mainly selectively adsorbed and/or precipitated on calcite [23]. These findings indicate that mineral type and P concentration affect APP adsorption by minerals. In acidic soils, Fe and Al oxides and clay minerals are most influential, whereas in neutral and calcareous soils, CaCO3 and clay minerals predominate in controlling P sorption [24,25,26,27]. Meanwhile, poly-P can improve soil pH [28,29,30] and solubilize organic compounds [14,31]. This suggest that APP application may lead to different soil P adsorption processes compared to single P1 or poly-P, with variations likely dependent on soil properties. However, to the authors’ knowledge, no studies to date have focused on the adsorption behavior of APP fertilizers containing various coexisting P species in soils and how they differ from traditional P1 fertilizer.
Therefore, the aim of this study was to explore the adsorption characteristics of two typical APP fertilizers containing different numbers of P species (i.e., APP1 containing two P species and APP2 containing seven P species) in six different soils in comparison to MAP. The total P adsorption of APP by soil and the contribution rate of each P species in APP to the total P adsorption were investigated. Furthermore, soil properties and the pH, metal ions (Ca, Fe, and Al), and dissolved organic carbon (DOC) in the adsorption equilibrium solution were investigated to determine the reasons for the different adsorption characteristics of APP compared to MAP in soils. We hypothesized that the difference between APP and MAP adsorption by soil depends on their concentrations, APP’s P species distribution, and soil properties.

2. Materials and Methods

2.1. Experimental Soils and P Sources

In order to obtain a systematic/comprehensive view of the adsorption characteristic of APP and its effect factor in typical agricultural soils in China, six different soil types, i.e., laterite soil, red soil, cinnamon soil, fluvo-aquic soil., acid, and calcareous purple soils, were investigated. According to the US soil taxonomy, laterite, red, purple, cinnamon, and fluvo-aquic soils are classified as Oxisol, Utisol, Entisols, Mollisols, and Inceptisols, respectively. Some data on acidic and calcareous purple soils were extracted from Yuan et al. [32]. The six studied soils were collected from different regions of China (Table 1), and were prepared by removing roots and crop residues, air-drying, mixing, and sieving through a 2 mm mesh. The MAP (analytical pure), APP1, and APP2 (>98% purity) were sourced from Cologne Chemicals Co. (Chengdu, China), Chanhen Chemical Corporation (Fuquan, Guizhou, China), and Sino-Linchem International Inc (Nanning, Guangxi, China), respectively. The physicochemical properties of the studied soils and the P species distribution (i.e., each P species percentage in the total P) of different P fertilizers are detailed in Table 1 and Table 2, respectively.
Soil pH was determined with a pH meter (PHS-3E, INESA, Shanghai, China) after extracting soils with distilled water at a 1:2.5 (soil:water) ratio. Olsen P was determined colorimetrically using the molybdenum blue method following extraction with NaHCO3 [33]. Soil organic matter (OM) was determined by the potassium dichromate oxidation method [34]. Total nitrogen was determined by Kjeldahl digestion with sulfuric acid [35]. The soil CaCO3 was measured by acid neutralization [36]. Soil Fe and Al oxides were extracted using dithionite-citrate-bicarbonate (DCB) [37]. Exchangeable and water-soluble Ca were extracted with deionized water and ammonium acetate, respectively [38,39]. Fe, Al, and Ca concentrations in the corresponding extracts were determined by inductively coupled plasma atomic emission spectrometry (ICP-AES, 7000DV, PerkinElmer, Waltham, MA, USA). The distribution of P species in MAP and APP fertilizers was characterized by ion chromatography (IC) (ICS-600, Thermo scientific, Waltham, MA, USA) [40].

2.2. P Adsorption Experiments

To determine P sorption isotherms according to Graetz and Nair [41], 1 g soil was mixed with 25 mL of 0.01 M KCl solutions. These solutions, with P concentrations spanning 0 to 300 mg/L (0, 1, 5, 10, 20, 50, 100, 150, 200, 250, and 300), were amended with two drops of toluene to prevent microbial interference, and shaken at 180 rpm for 24 h at 25 °C [42]. After the shock, centrifugation at 25,000× g for 8 min clarified the suspensions, which were then filtered using a 0.45 µm filter. Each procedure was repeated three times. The filtrates’ P1 concentrations were determined by colorimetry with a continuous flowing analyzer (AA3, Seal, Norderstedt, Germany). The total P concentration was determined by ICP-AES (7000DV, PerkinElmer, Waltham, MA, USA) after concentrated HNO3-H2SO4 autoclave digestion [43]. Meanwhile, based on the adsorption isotherm results, the adsorption equilibrium solutions at the initial concentrations of 50, 100, and 300 mg P L−1 were selected to measure the separation and quantification of P species using IC (ICS-600, Thermo scientific, Waltham, MA, USA) [40]. The concentration of DOC, concentrations of Ca, Fe, and Al, and pH in the solutions were measured by elemental analyzer (Vario TOC, Elementar, Frankfurt, Germany), ICP-AES (7000DV, PerkinElmer, Waltham, MA, USA), and pH meter (PHS-3E, INESA, Shanghai, China), respectively.

2.3. Calculations

2.3.1. P Adsorption

Based on the variation between the initial and equilibrium solution P concentrations, the amount of P adsorbed onto the soil was computed using Equation (1).
Q = C 0 C t × V ÷ W
where Q = the adsorption amount (mg kg−1); C0 = the initial P concentration (mg L−1); Ct = the equilibrium P concentration (mg L−1); V = the volume of solution added to the sample; and W = the dry weight of the soil (g).

2.3.2. Adsorption Isotherm Equations

Langmuir and Freundlich isotherms [27,44,45] were used to determine P sorption parameters, as follows:

Langmuir Isotherm

C / S = 1 / K L × S m a x + C / S m a x
where C = the P concentration in solution after a 24 h equilibration; S = the amount of P sorbed by the solid phase (mg P kg−1); Smax = the P sorption maximum (mg P kg−1); and KL = a constant related to binding energy of P (L mg−1 P).
The P buffer capacity (PBC) of soil was estimated from the product of KL and Smax. Additionally, the degree of P saturation (DPS) was calculated from Olsen-P and Smax as Equation (3).
D P S = ( O l s e n - P ) ( O l s e n - P + S m a x ) × 100

Freundlich Isotherm

log S = log K F + n log C
where C = the P concentration in solution after a 24 h equilibration; S = the amount of P sorbed by the solid phase (mg P kg−1); KF = the Freundlich sorption coefficient (L kg−1); and n = a constant related to sorption intensity.

2.3.3. Statistical Analysis

All data were analyzed using Microsoft Excel 2013 and all figures were created using Origin 2021. Analysis of variance (ANOVA) was used to determine the significance of the treatment based on a randomized complete block design, with calculations performed in SPSS 18.0 software. Multiple treatment group means were compared using the Least Significant Difference (LSD) test, with p < 0.05 considered significantly different. PAST software (Version 4.03) was used to perform Pearson correlation analyses. Relationships between soil properties and variations in adsorption parameters (APP vs. MAP) were further explored using redundancy analysis (RDA). Adonis analysis was utilized to identify key predictors affecting differences in adsorption parameters (APP vs. MAP); significant soil factors (p < 0.05) were then retained for RDA. The RDA model was tested using ANOVA to identify parameters that significantly explained variance in adsorption parameter differences (APP vs. MAP). The vegan package in R (version 4.1.1) was employed for both RDA and Adonis analyses. Each result displayed in the figures and tables represents the average of three replications.

3. Results

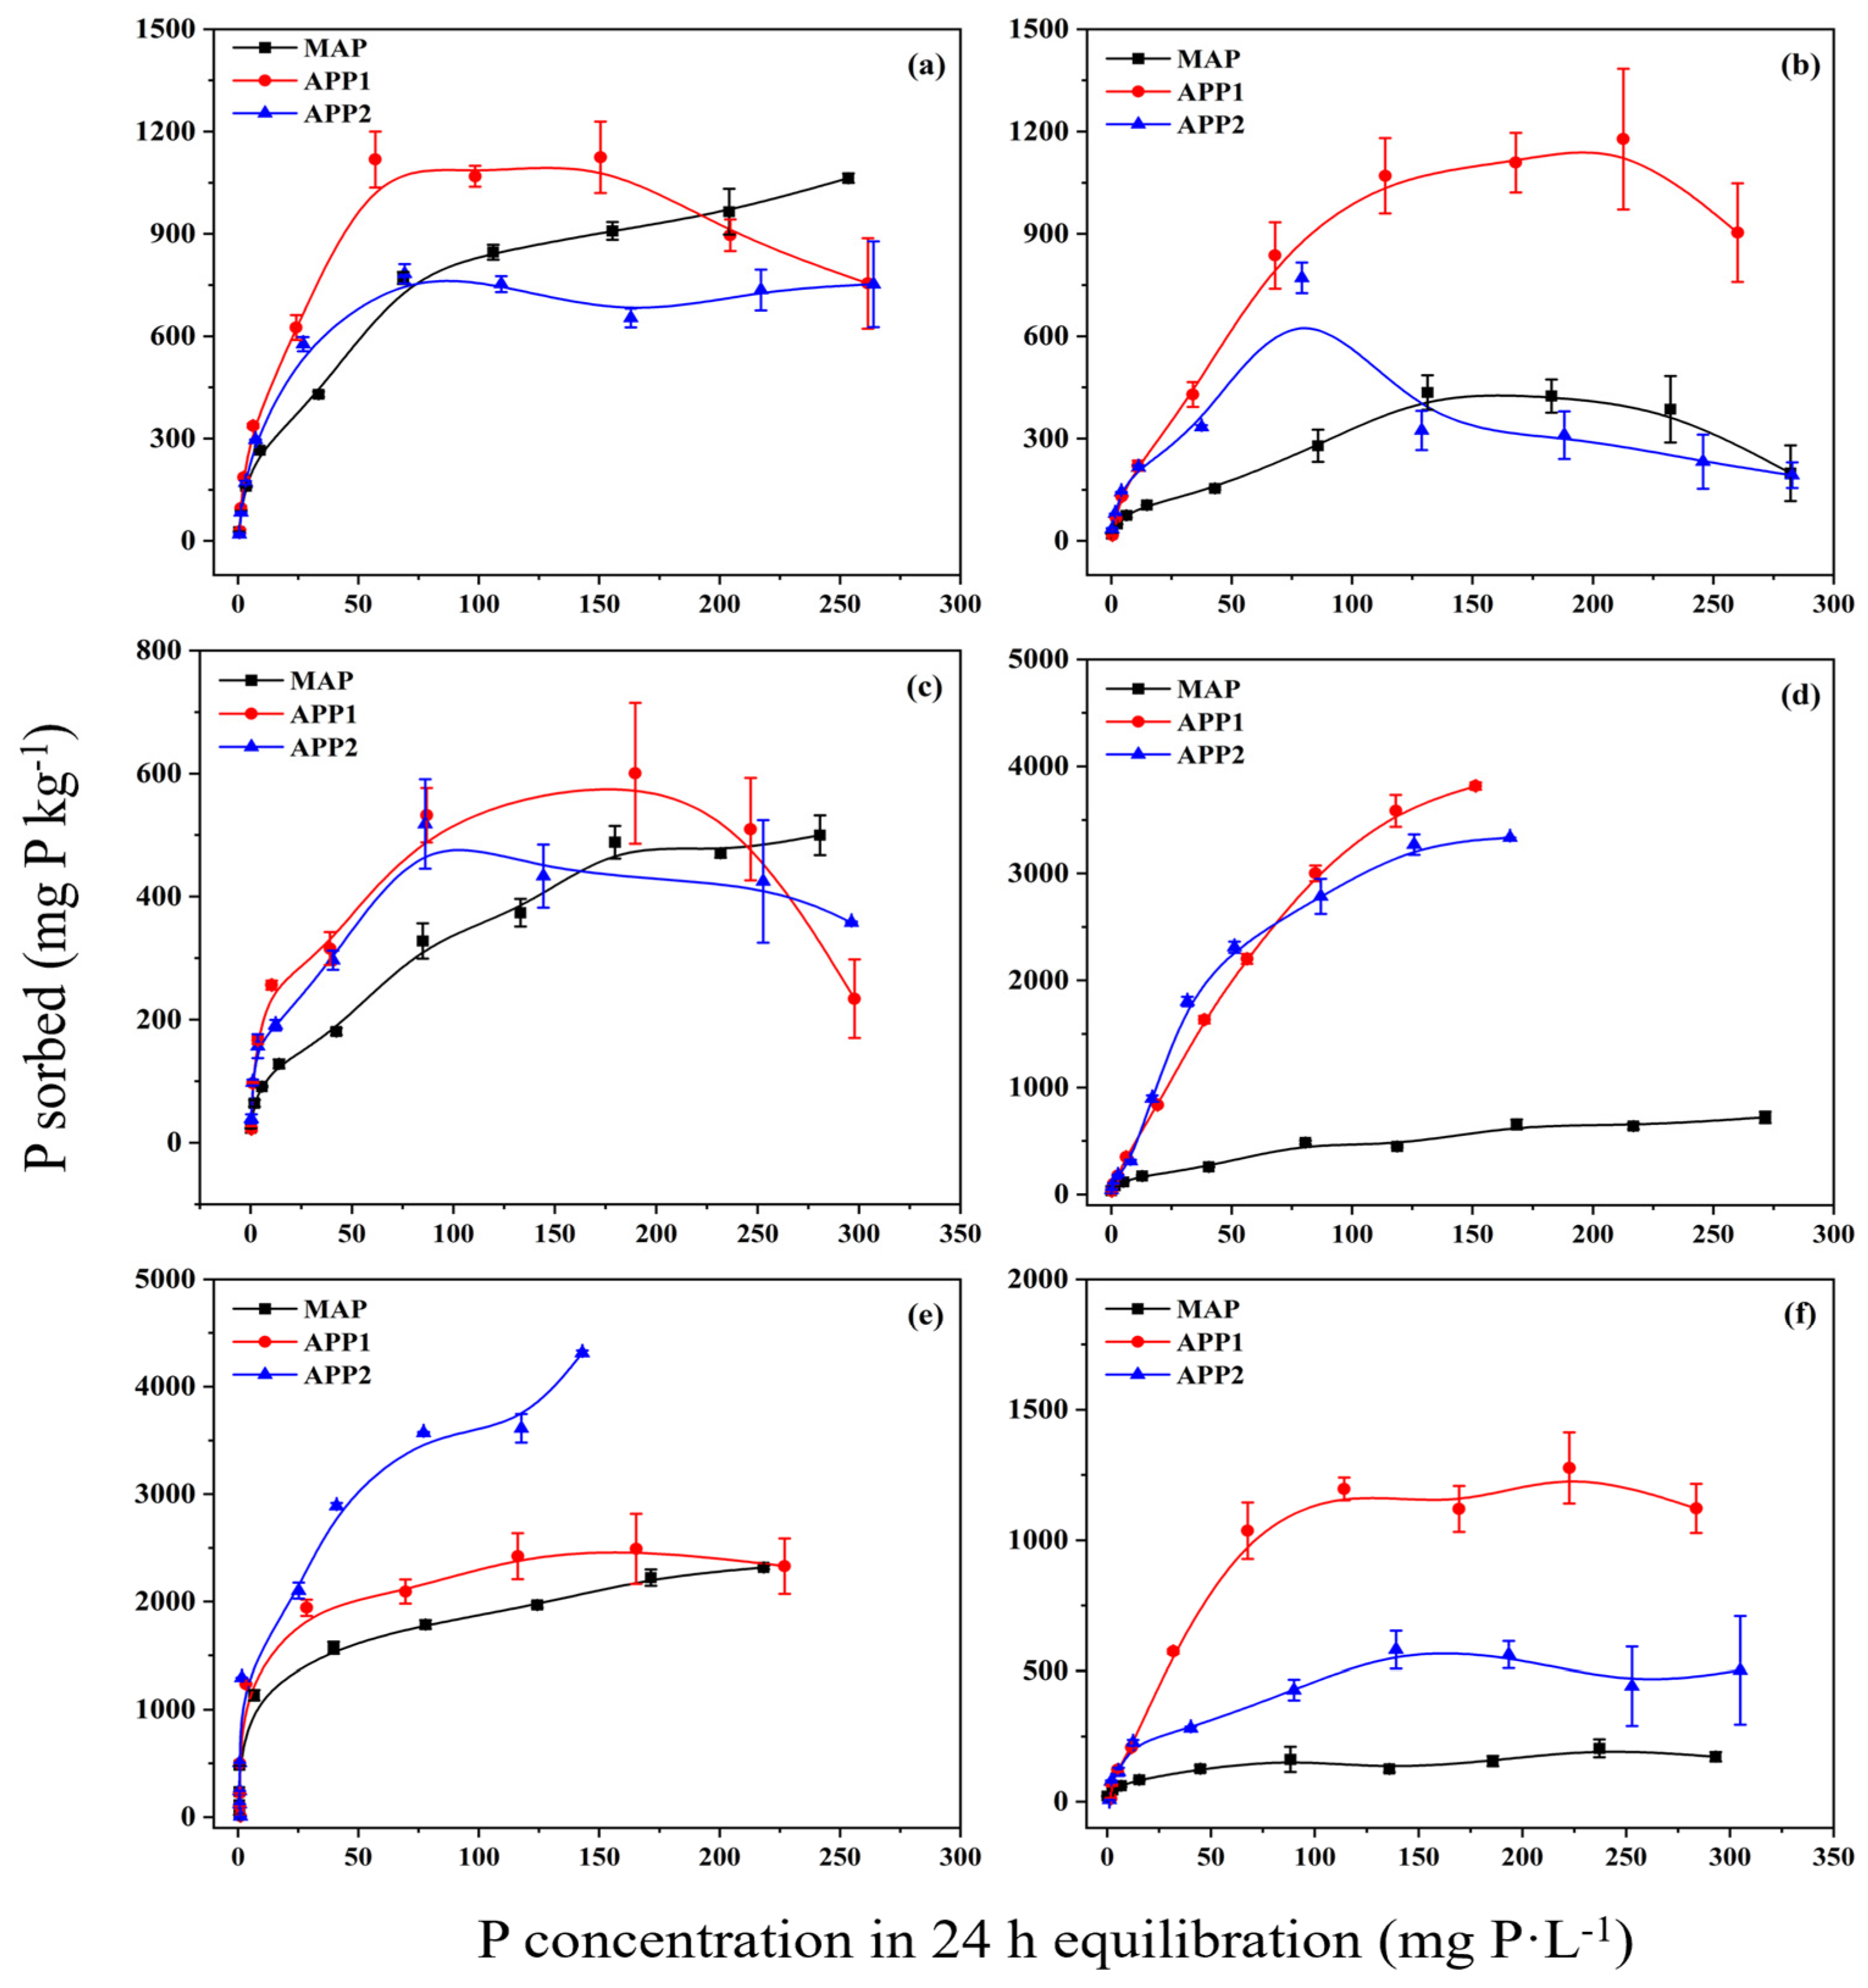
3.1. Sorption Characteristics of Total P

The six soils examined exhibited distinct properties (Table 1). The laterite, red, and acidic purple soils were characterized as acidic, whereas the cinnamon, calcareous purple, and fluvo-aquic soils were identified as calcareous. As the initial P concentration increased from 1 to 300 mg L−1, the P adsorption by the soils initially exhibited a significant increase, followed by a slight increase or plateau (Figure 1). MAP adsorption by soils gradually increased with increasing P concentration, except for the fluvo-aquic soil, where MAP adsorption initially increased, peaked at 435 mg kg−1 at initial total P concentration of 150 mg L−1, and then decreased (Figure 1b). In red, acidic purple, and fluvo-aquic soils, APP1 adsorption initially increased, reaching maximum levels at initial P concentrations of 200 mg L−1 or 250 mg L−1, and then decreased (Figure 1a–c). For laterite and cinnamon soils, APP1 adsorption increased and then plateaued with rising P concentrations (Figure 1e,f), whereas in calcareous purple soil, it continuously increased (Figure 1d).
APP2 adsorption increased in the range of 1 to 100 or 150 mg L−1, and then decreased overall in the range of 100 or 150 to 300 mg L−1 in red, acidic purple, fluvo-aquic, and cinnamon soils (Figure 1a–c,f). In contrast, APP2 adsorption consistently rose with increasing P concentration in laterite and calcareous purple soils (Figure 1d,e). Compared to MAP, the red, acidic purple, and fluvo-aquic soils exhibited higher adsorption for APP at lower concentrations (i.e., below 100 or 150 mg L−1), but lower adsorption at higher concentrations (i.e., 200–300 mg L−1) (Figure 1a–c). However, in laterite, calcareous purple, and cinnamon soils, APP adsorption was consistently higher than MAP adsorption (Figure 1d–f).
Langmuir and Freundlich equations accurately described the P sorption isotherms when solution P concentrations ranged from 1–100 mg L−1 f, except for the sorption of APPs in calcareous purple soil using the Langmuir equation (Table 3). Langmuir modeling revealed that the Smax of soils for APPs was 1.1–10.9 times higher than that for MAP, while the DPS for APPs was 0.1–0.9 times lower than that for MAP. However, the KL of soils for APPs was generally lower than that for MAP under most conditions. Consequently, the PBC of soils for APPs was significantly higher than that for MAP, expect in laterite soil. Meanwhile, the Freundlich KF and n of soils were significantly higher for APPs than for MAP under most conditions. Compared to APP1, the Smax of soil for APP2 was higher in laterite and calcareous purple soils, but lower in the other four soils. However, the KL of soil for APP2 was lower in laterite and calcareous purple soils, but higher in the remaining soils. Furthermore, the KF for APP2 exceeded that for APP1, while the n was generally lower for APP2 than for APP1, with the exception of laterite soil.

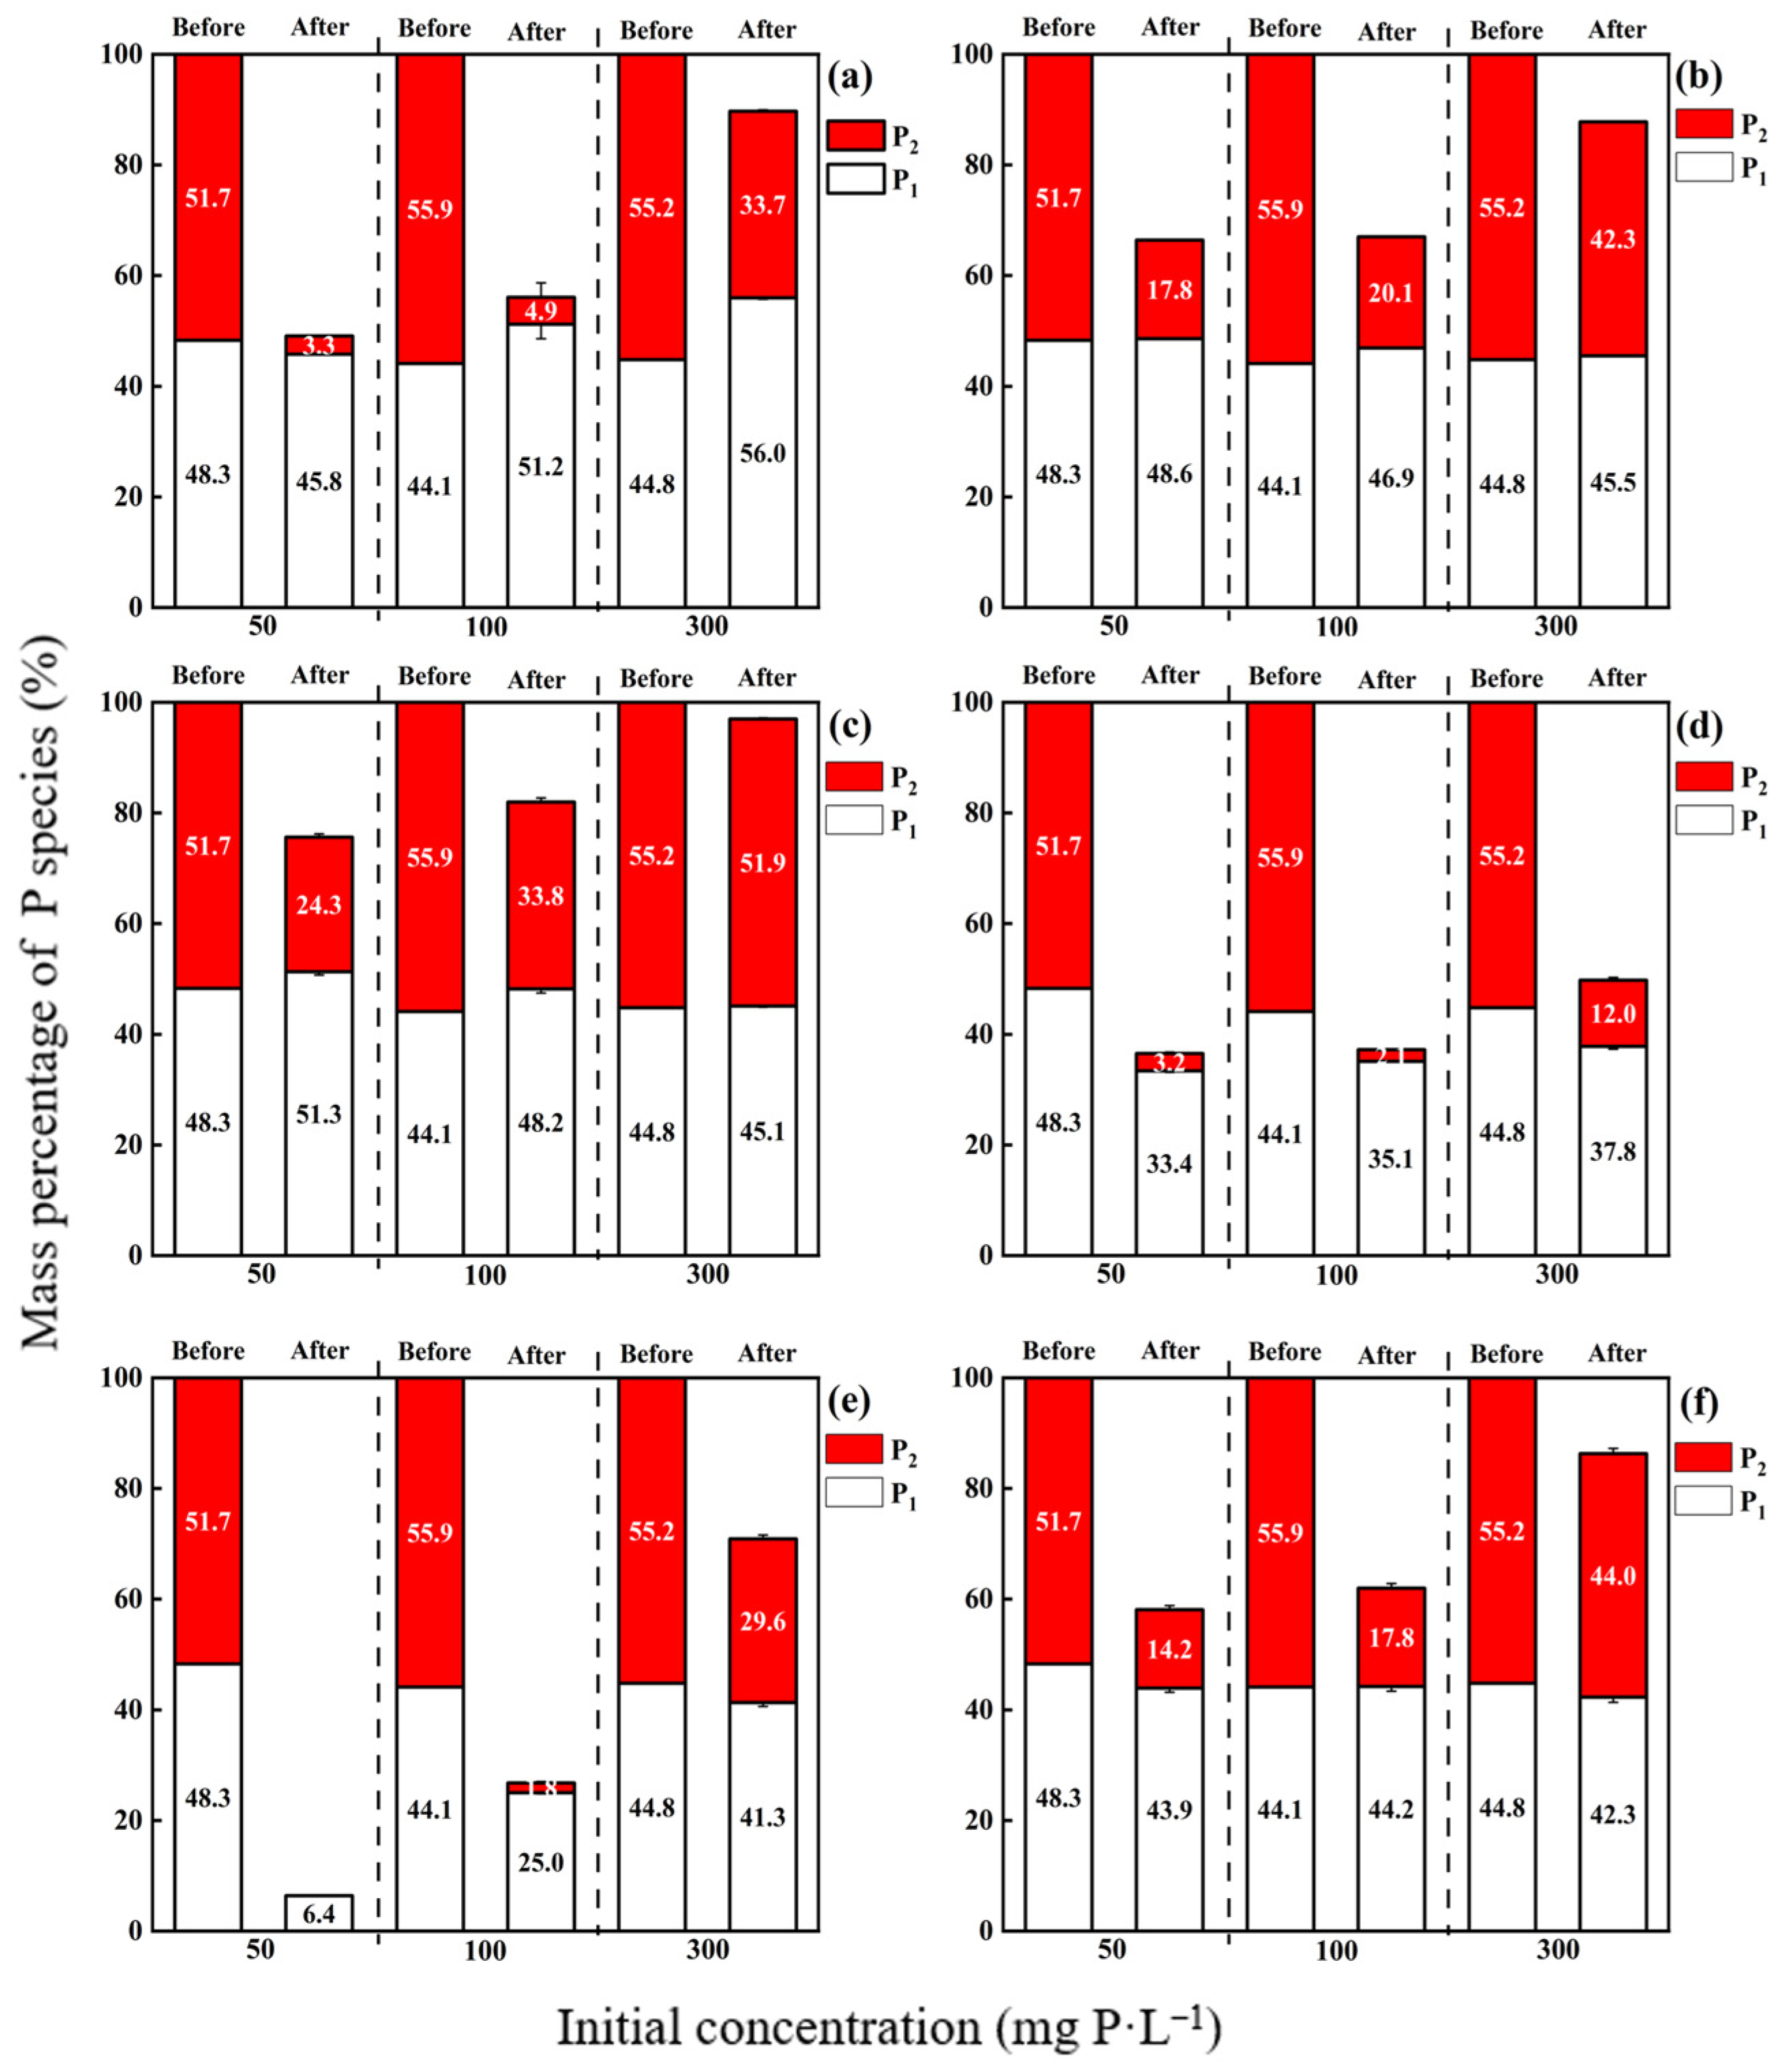
3.2. Sorption of Different P Species in APP

The adsorption isotherms of poly-P in APPs in different soils were similar to their total P adsorption isotherms, except for red soil (Figures S1 and S2). In red soil, the adsorption of poly-P in APPs consistently increased (Figures S1 and S2), while the total P adsorption showed an initial rise followed by a decline with higher P concentrations (Figure 1). Overall, the contribution of poly-P in APPs to total P adsorption was significantly higher than that of P1. In the case of P1 in APP1, adsorption increased and then decreased with rising P concentrations across all six soils, with negative adsorption observed in red, acidic purple, and fluvo-aquic soils (Figure S1). For APP2, P1 adsorption decreased and then stabilized as P concentration increased, with negative adsorption again noted in red, acidic purple, and fluvo-aquic soils. In laterite, calcareous purple, and cinnamon soils, P1 adsorption in APP2 initially increased and then decreased as P concentration rose (Figure S2).
The IC results indicated that the P1 concentration in the adsorption equilibrium solution increased by 16.1% and 25% in red soil, by 9.3% and 0.7% in acid purple soil, and by 6.3% and 1.6% in fluvo-aquic soil, respectively, compared to the initial P1 concentrations in APP1 solution of 100 and 300 mg L−1 (Figure 2a–c). The contribution rate of P2 in APP1 to P adsorption was 100% or nearly 100% at initial APP concentrations of 50, 100, and 300 mg L−1 in the red, acid purple, and fluvo-aquic soils (Figure 2a–c). The contribution rate of P2 in APP1 to P adsorption was 55.3–73.9% in laterite soil and 76.5–86.1% in calcareous purple soil, and this contribution rate increased with rising P concentrations (Figure 2d,e). In cinnamon soil, the contribution of P2 to total P adsorption exceeded 80.0% (Figure 2f).
The contribution rates of different P species in APP2 to total P sorption is shown in Figure 3. In red and acidic purple soils, the contribution hierarchy was P2 > P3 > P4 > poly-Ps (n > 4), with respective contribution ranges of 50.7–62.7%, 22.3–35.0%, 7.8–13.5%, and 2.4–6.4% for red soil (Figure 3a), and 46.1–53.3%, 16.1–32.9%, 9.0–17.2%, and 0.5–11.2% for acidic purple soil (Figure 3c). In fluvo-aquic (Figure 3b) and cinnamon soils (Figure 3f), P2 contributed 54.4–63.8% and 59.7–73.1% to total P sorption, respectively, followed by P3 or P4, with poly-Ps (n > 4) contributing 2.4–6.4% and 0.5–11.2%, respectively. For laterite soil, the contribution rates of P1, P2, P3, P4, and poly-Ps (n > 4) were 16.0–34.7%, 27.4–36.6%, 24.7–28.5%, 9.0–14.2%, and 4.3–5.9%, respectively (Figure 3e). In calcareous purple soil, the contribution rates of P1, P2, P3, P4, and poly-Ps (n > 4) were 10.9–16.3%, 36.1–45.5%, 22.6–29.6%, 12.9–14.4%, and 5.8–6.0%, respectively, and the contribution of P2 increased while that of P1 decreased with rising P concentrations (Figure 3d).

3.3. pH, Metal Ions and DOC in Equilibrium Solutions

3.3.1. pH

The pH of the equilibrium solutions without P were 3.77, 4.68, 4.59, 7.43, 7.15, and 7.30 for red, acid purple, laterite, fluvo-aquic, calcareous purple, and cinnamon soils, respectively (Table S1). In comparison to these baseline levels (Table S1), the pH of MAP adsorption equilibrium solutions slightly increased in red and laterite soils, and decreased in the other four soils (Figure 4). For APP1 and APP2 adsorption equilibrium solutions, the pH significantly rose by 0.8 to 2.9 units in acid soils, with greater increases corresponding to higher P concentrations (Figure 4a,c,e). In calcareous soils, APP1 decreased the equilibrium solution pH, whereas APP2 had minimal impact (Figure 4b,d,f). Compared to MAP, the pH of APP1 and APP2 adsorption equilibrium solutions in acid soils significantly increased by 0.7 to 2.4 units, with greater increases at higher P concentrations (Figure 4a,c,e). In calcareous soils, the pH of APP1 adsorption equilibrium solutions decreased at initial P concentrations of 50 and 100 mg L−1, but increased by 0.3 to 0.5 units at 300 mg L−1 (Figure 4b,d,f). For APP2, pH levels increased by 0.1 to 1.0 units in calcareous soils, except at a P concentration of 100 mg L−1 in fluvo-aquic soil (Figure 4b,d,f). Compared to APP1, APP2 resulted in a significant pH increase of 0.1 to 0.5 units (Figure 4). Overall, using APP as the P source yielded equilibrium solution pH levels closer to 7.0 compared to MAP, particularly for APP2.

3.3.2. Metal Ions

Compared to equilibrium solutions without P (Table S1), the Ca concentration in the MAP adsorption equilibrium solutions of acid soils (excluding the acid purple soil solution with initial P concentration of 300 mg L−1) decreased by 0.3–30.3%, while it increased by 7.7–127.8% in calcareous soils (Table 4). In APP1 and APP2 adsorption equilibrium solutions, the Ca concentration generally decreased by 6.1–86.3% and 15.9–87.1%, respectively. Exceptions were noted for APP2 adsorption equilibrium solutions with a P concentration of 300 mg L−1 in acidic purple, cinnamon, and fluvo-aquic soils, where Ca concentrations increased by 29.5%, 54.7%, and 40.7%, respectively (Table 4). The concentrations of Fe and Al in the MAP adsorption equilibrium solutions showed minimal change across all six soils, while those in the APP adsorption equilibrium solutions increased relative to the no P solution, particularly at high P concentrations and for APP2.
Compared to MAP, APP significantly reduced the Ca concentration by 11.6–84.8% in equilibrium solutions, except in acidic purple soil equilibrium solution with an initial P concentration of 300 mg L−1. However, APP increased Fe and Al concentrations in equilibrium solutions, with more pronounced increases at higher P concentrations. Compared to APP1, APP2 reduced Ca concentration by 9.5–17.3% and 19.9–28.1% in the equilibrium solutions of red and laterite soils at initial P concentrations of 50 and 100 mg L−1, respectively, while it increased Ca concentration by 1.9–195.8% under other conditions, particularly at initial P concentration of 300 mg L−1. APP2 also significantly increased Fe and Al concentrations under most conditions (Table 4).

3.3.3. DOC

Compared to the solution without P (Table S1), the DOC concentration in the MAP adsorption equilibrium solutions increased by 35.1–706.2%, with the exception of the fluvo-aquic soil solution when the initial P concentration was 100 mg L−1. In contrast, DOC concentrations in APP1 and APP2 adsorption equilibrium solutions increased significantly by 89.3–1152.2% and 188.8–1375.7%, respectively. Compared to MAP, APP1 and APP2 substantially increased DOC concentration in the equilibrium solutions by 6.2–478.2% and 9.4–563.6%, respectively, except for the APP1 solution when the initial P concentration was 100 mg L−1 in laterite soil. Furthermore, compared to APP1, APP2 significantly increased DOC concentrations by 5.3–130.8% in the equilibrium solutions, except for the APP2 adsorption equilibrium solution when the initial P concentration was 50 mg L−1 in acidic and calcareous purple soils, and an initial P concentration of 300 mg L−1 in cinnamon soil (Figure 5).

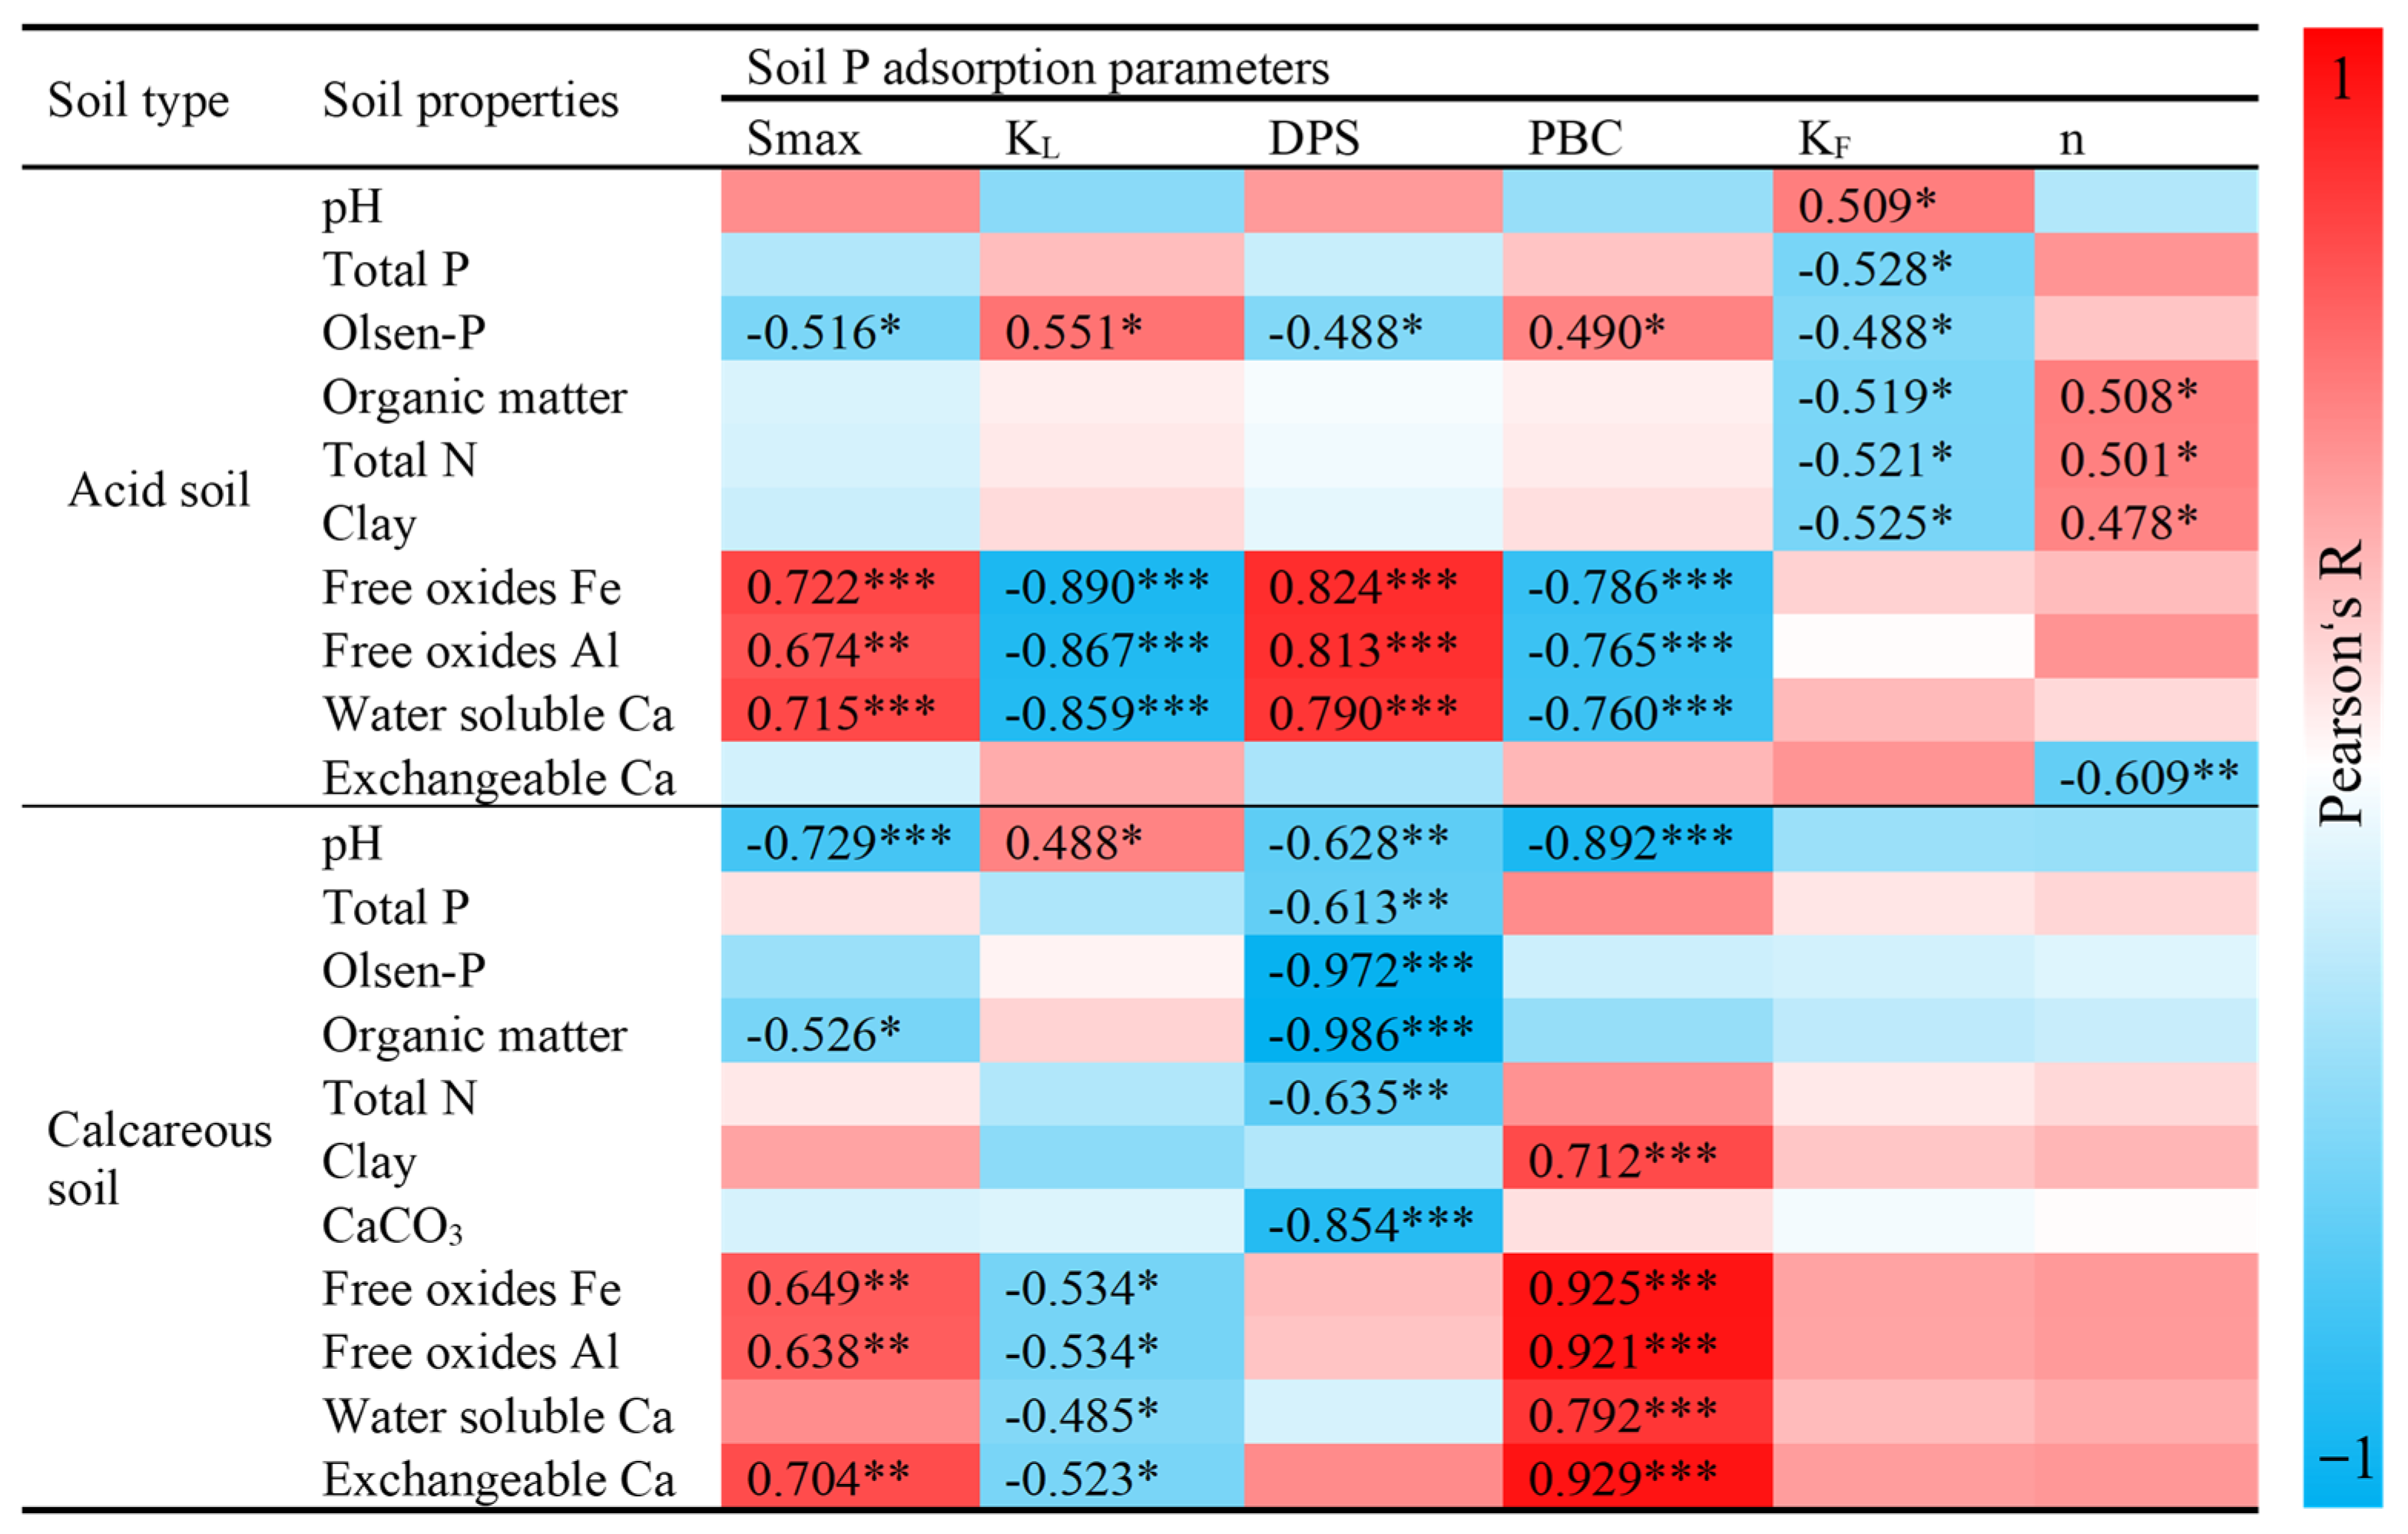
3.4. Relationship Between Soil Properties with Soil P Sorption-Desorption

To examine the effect of soil properties on P adsorption of APP compared to MAP, we calculated the difference in each adsorption parameter for each soil (i.e., Δ P adsorption parameter = [P adsorption parameterAPP] − [P adsorption parameterMAP]). Pearson correlation analysis showed that each soil property significantly correlated with at least one Δ P adsorption parameter (p < 0.05, 0.01, or 0.001, Figure 6). In acid soils, Olsen-P, free oxides Fe and Al (Feox and Alox), and water-soluble Ca (WS-Ca) showed significant correlations with most Δ P adsorption parameters, while, in calcareous soils, pH, Feox, Alox, WS-Ca, and exchangeable Ca (Ex-Ca) were significantly correlated with most Δ P adsorption parameters. Meanwhile, the Adonis test indicated that Olsen-P, Feox, Alox, and WS-Ca significantly influenced the composition of Δ P adsorption parameters (p < 0.05, 0.01 or 0.001) in acid soils, whereas pH, OM, Feox, Alox, WS-Ca, and Ex-Ca significantly affected the composition of Δ P adsorption parameters (p < 0.05 or 0.01) in calcareous soils (Table S2). Furthermore, RDA showed that (Figure 7 and Table S3) in acid soil, Feox and Olsen-P were the main factors explaining 32.8% (ANOVA, p < 0.001) and 21.8% (ANOVA, p < 0.001) of the variances, while in calcareous soil, pH and OM were the main factor explaining 37.9% (ANOVA, p < 0.001) and 11.8% (ANOVA, p < 0.05), respectively.

4. Discussion

4.1. Trend of APP Adsorption by Soil with Increasing Concentration

The adsorption of MAP by soils gradually increased with P concentration increase, except in fluvo-aquic soil, where MAP adsorption first increased and then slightly decreased (Figure 1b). This decrease in MAP adsorption by fluvo-aquic soil, a type of calcareous soil, at high P concentrations could be attributed to some CaCO3 dissolution due to pH decrease (Figure 4b), which can be partly proved by the obvious increase in Ca concentration in the equilibrium solution (Table 4). CaCO3 is a key factor to control P adsorption in calcareous soils. However, this phenomenon was not observed in the other two calcareous soils (i.e., calcareous purple and cinnamon soils), which can be attributed to lower pH and CaCO3 concentration compared to fluvo-aquic soil. The adsorption of APP by soils with high Olsen-P (i.e., red, acidic purple, and fluvo-aquic soils) obviously increased first and then decreased with P concentration increase (Figure 1a–c). APP can chelate medium and trace elements, and the chelating ability can be enhanced at high APP concentrations [46,47]. As APP concentration increased, Fe and Al concentrations in the adsorption equilibrium solution significantly increased (Table 4), indicating an increased chelating ability of APP, which contributed to decreased APP adsorption by soil at high APP concentrations. Meanwhile, the concentration of APP2 at which P adsorption by soil began to decrease was lower than that of APP1 due to its stronger chelating ability. However, the adsorption of APP by soils with low Olsen-P (i.e., laterite, cinnamon, and calcareous purple soils) did not obvious decrease at high APP concentrations (Figure 1d–f), which can be attributed to the high P fixation ability of these soils, which limited the chelation even at high concentrations. However, the adsorption of APP by soils with low Olsen-P (i.e., laterite, cinnamon, and calcareous purple soils) did not obviously decrease at high APP concentrations (Figure 1d–f). Soils with low Olsen-P have a low degree of P saturation and can provide more mineral adsorption sites, contributing to a high capacity for P fixation. Consequently, this limited the chelation effect, even at high concentrations. Thus, the chelating ability of APP affects its sorption by soil, but the magnitude of this effect depends on the soil’s available P content, i.e., the soil’s P fixation capacity.

4.2. Contribution of Different P Species in the APP to Total P Adsorption

McBeath et al. [29] and Blanchar and Hossner [18] reported that soil or minerals had stronger adsorption for P2 or P3 compared to P1. Our previous studies demonstrated that calcite predominantly adsorbed and/or precipitated with P2 in APP solutions where various P species coexist [23], but the coadsorption of different P species occurred, particularly P1 and P2, on goethite [22]. Similarly, in the present study, the contribution of poly-Ps (especially for P2) in APP to total P adsorption by soil was significantly higher than that of P1, accounting for 76.5–100%, with the exception of laterite soil with high Fe and Al oxides, which showed a lower contribution rate of 55.3–87.9% (Figure 2 and Figure 3; Figures S1 and S2).
The selective adsorption and/or precipitation of P2 by calcite or goethite in the APP solution was attributed to P2’s lower steric hindrance compared to poly-Pn (n ≥ 3) [22,23]. Additionally, APP can promote calcite dissolution due to its chelation ability, allowing the dissolved Ca to precipitate with P. The lower Ksp for Ca2P2O4 relative to CaHPO4 results in the preferential precipitation of P2 in APP [23]. Meanwhile, Mnkeni and Mackenzie [31] found that P2 can solubilize OM, facilitating greater P2 sorption by exposing additional mineral surfaces. This was supported by the observed increase in DOC concentration in APP adsorption equilibrium solutions compared to MAP adsorption solutions (Figure 5), suggesting that P2 promoted the solubilization of soil OM, which, in turn, enhanced its adsorption by soils. Negative P1 adsorption was noted in soils with high Olsen-P (i.e., red, acidic purple, and fluvo-aquic soils), indicating that APP can facilitate the release of native P1 from soil [48]. Specifically, the adsorption of red soil for poly-Ps in APP under high P concentration conditions did not significantly decrease, but its substantial decrease in the adsorption of total P in APP was related to the significant promotion of P1 release by red soil. Thus, APP with various P species can maintain P1 supply via promoting its release from the soil rather than reducing its adsorption. McLaughlin et al. [48] also discovered that APP with a high degree of polymerization could compete with P1 for P adsorption sites in soil through adsorption and complexation reactions, simultaneously releasing fixed P in the soil. Furtherly, molecular dynamic (MD) simulations conducted by Ji et al. [22] revealed that, at high P2 concentrations, P2 could displace pre-adsorbed P1 from goethite surfaces. Meanwhile, Yuan et al. [32,41] reported that the desorption rate of P1 in adsorbed APP was higher than that of poly-Ps. Therefore, poly-Ps (especially for P2) in APP are the main contributors to total P adsorption. This process depends on factors such as molecular conformation, solubility product (Ksp), the ability to solubilize OM, and competition among different P species.

4.3. Influence of Soil Properties on APP Adsorption

Soil minerals are key players in P sorption. Generally, in acidic soils, Fe and Al oxides and clay minerals are most influential, whereas in neutral and calcareous soils, CaCO3 and clay minerals predominate in controlling P sorption [24,25]. Our previous studies indicated that goethite had a higher adsorption capacity for APP than for MAP [22], and the adsorption capacity of calcite for APP was greater at low P concentrations but smaller at high P concentrations compared to MAP [23]. In the present study, the studied six soils showed higher adsorption for APP at low concentrations compared to MAP (Figure 1 and Table 3), a trend consistent with mineral studies [22,23]. However, regardless of acidic or calcareous soils, those with high Olsen-P showed lower adsorption for APP1 and/or APP2, while soils with low Olsen-P showed higher adsorption for APPs relative to MAP at high P concentrations (Figure 1). Ji et al. [23] reported that at high P concentrations, calcite displayed stronger fixation for MAP due to Ca5(PO4)3OH precipitate formation, while weaker fixation for APP due to increased calcite dissolution and Ca release, and Ca-poly-Ps complexes formation. But, in the present studied calcareous soils with high calcite content, APP significantly increased the pH of adsorption equilibrium solution at high P concentrations (i.e., initial P concentration of 300 mg L−1, Figure 4b,d,f) together with high water-soluble Ca concentrations in the soil itself (Table 1), which could favor the precipitation between APP and Ca2+ and reduce the chelation of APP for Ca2+. Meanwhile, the Ksp (10−6.90) of CaHPO4 is larger than that of Ca2P2O7 (10−18). Consequently, the calcareous soils with low Olsen-P showed higher fixation for APPs relative to MAP at high P concentrations, as evidenced by the significant decrease in Ca content in the adsorption equilibrium solutions (Table 4). Under most conditions, soil adsorption for APP1 was greater than for APP2 (Figure 1, Figure 2 and Figure 3), which can be attributed to the weaker chelating ability for APP1 relative to APP2 [20]. However, the laterite soil exhibited significantly greater adsorption for APP2 than for APP1, which can be attributed to the high concentrations of free Fe and Al oxides (i.e., 23.9 g Fe kg−1 and 28.3 g Al kg−1; Table 1). Ji et al. [22] reported that more Fe3+ dissolved from goethite, due to the stronger chelation of poly-Ps in APP2, acting as a bridge, contributing to stronger APP2 adsorption on goethite compared to APP1. In the present study, Fe content in APP2 adsorption equilibrium solutions was 2.0–2.9 times higher than that in APP1 solutions (Table 4).
It is evident that P fixation in soils is more complex compared to pure single mineral systems. Further investigation into the adsorption of APP by multimineral systems is warranted. Additionally, P adsorption can also be influenced by factors such as soil Olsen-P, pH, OM, and ions. The present study showed that Feox and Olsen-P were the main factors, explaining 32.8% (ANOVA, p < 0.001) and 21.8% (ANOVA, p < 0.001) of the variance in the compositions of Δ P adsorption parameters (p < 0.05) in acid soil, while pH and OM explained 37.9% (ANOVA, p < 0.001) and 11.8% (ANOVA, p < 0.05) of the variance in calcareous soil (Figure 7 and Table S3). Meanwhile, a significant difference in pH, Fe, and DOC of adsorption equilibrium solutions between APP and MAP solutions was observed (Figure 4, Table 4 and Figure 5). Thus, the difference between APP and MAP adsorption by soil depended on their concentrations and soil properties.

5. Conclusions

This study investigated APP adsorption by different soils, highlighting the influence of P concentration, soil properties, and APP’s P species distribution. APP adsorption was greater than MAP under low P soil and/or low P addition conditions. However, under high P soil and high P addition conditions, APP adsorption decreased relative to MAP when the chelating ability of APP for medium and trace elements strengthened to a certain extent. APP1 adsorption generally exceeded APP2 due to its weaker chelating ability, except in laterite soils with high Fe/Al oxides, where APP2 adsorption was greater. The poly-Ps in APP, especially P2, were the primary contributors to P adsorption and enhanced soil native P1 release. APP affected soil P adsorption by altering pH, Ca, Fe, Al, and organic matter. Redundancy analysis indicated that the differences in adsorption parameters between APP and MAP were mainly explained by Fe oxide and Olsen-P in the acid soils, as well as pH and organic matter in the calcareous soils. Overall, compared to MAP, APP can improve P availability in the soil by reducing adsorption and/or promoting the release of soil native P1 release. Effective APP application requires considering P amount, species distribution, and soil properties.
Further studies are needed to examine the effect of multimineral interactions in soil on P adsorption and the hydrolysis characteristics of APP in soil to better understand the fate and availability of APP in natural environments.

Supplementary Materials

The following supporting information can be downloaded at https://www.mdpi.com/article/10.3390/agriculture15060585/s1, Figure S1: Contribution of different forms of phosphorus in APP1 to phosphorus adsorption in different soils: (a) red soil, (b) fluvo-aquic soil, (c) acidic purple soil, (d) calcareous purple soil, (e) laterite soil, and (f) cinnamon soil. Ortho-P; Orthophosphate; Poly-P, Polyphosphate; Figure S2: Con-tribution of different forms of phosphorus in APP2 to phosphorus adsorption in different soils: (a) red soil, (b) fluvo-aquic soil, (c) acidic purple soil, (d) calcareous purple soil, (e) laterite soil, and (f) cinnamon soil. Ortho-P; Orthophosphate; Poly-P, Polyphosphate; Table S1: pH value and Ca, Fe, Al, dissolved organic carbon (DOC) concentrations (mg L−1) in the adsorption equilibrium solutions without phosphorus addition; Table S2: Adonis test on the effects of soil properties on the compo-sitions of Δ P adsorption parameters (APP versus MAP). Only the significant correlation coeffi-cients are showed. *, ** and *** represent P < 0.05, 0.01 and 0.001, respectively; Table S3: Proportion of variance explained (percentage of total variation) by environmental variables determined by RDA for the soil properties plus Δ P adsorption parameters. * and *** represent P < 0.05 and 0.001, respectively.

Author Contributions

Y.L.: conceptualization; methodology (lead); formal analysis (lead); investigation (lead); data curation (lead); and writing—original draft (lead). M.H.: methodology (supporting); investigation (supporting); data curation (supporting); and writing—original draft (supporting). T.Y.: resources (supporting); investigation (supporting); and writing—original draft (supporting). D.X.: supervision (supporting); and writing—review and editing (supporting). X.W.: supervision (supporting); funding acquisition (lead); and writing—review and editing (supporting). Z.Y.: conceptualization (lead); methodology (lead); supervision (lead); project administration (lead); funding acquisition (supporting); writing—review and editing (lead); and corresponding author. All authors have read and agreed to the published version of the manuscript.

Funding

This work is supported by the Natural Science Foundation of China (Project No. 32172677).

Institutional Review Board Statement

Not applicable.

Data Availability Statement

Data will be made available on request.

Acknowledgments

The authors greatly acknowledge the support from the Sharing Platform of Scientific Equipment, the Ministry of Education’s Research Center for Comprehensive Utilization and Clean Process Engineering of Phosphorus Resources, Sichuan University.

Conflicts of Interest

The authors declare no conflicts of interest.

References

  1. Kuo, S.; Huang, B.; Bembenek, R. Effects of long-term phosphorus fertilization and winter cover cropping on soil phosphorus transformations in less weathered soil. Biol. Fertil. Soils 2004, 41, 116–123. [Google Scholar] [CrossRef]
  2. Erel, R.; Yalin, D.; Kushmaro-Bier, A.; Li, Q.; Gérard, F.; Toren, N. Soil properties and growing duration determine phosphorus phyto-availability dynamics of polyphosphate versus orthophosphate fertilizers. Plant Soil 2023, 485, 299–315. [Google Scholar] [CrossRef]
  3. Tao, L.; Wen, X.; Li, H.; Huang, C.; Jiang, Y.; Liu, D.; Sun, B. Influence of manure fertilization on soil phosphorous retention and clay mineral transformation: Evidence from a 16-year long-term fertilization experiment. Appl. Clay Sci. 2021, 204, 106021. [Google Scholar] [CrossRef]
  4. Getie, A.; Kiflu, A.; Meteke, G.; Abakumov, E. Phosphorus sorption characteristics of Luvisols and Nitisols in North Ethiopian soils. Appl. Environ. Soil Sci. 2021, 2021, 8823852. [Google Scholar] [CrossRef]
  5. Khan, K.S.; Naveed, M.; Qadir, M.F.; Ahmad, A.; Javed, H.H.; Ditta, A. Variation in Soil C and P Fractions Associated with Microbial Biomass. J. Soil Sci. Plant Nutr. 2023, 23, 6573–6583. [Google Scholar] [CrossRef]
  6. Khourchi, S.; Delaplace, P.; Bargaz, A. Polyphosphate fertilizer use efficiency strongly relies on soil physicochemical properties and root-microbial activities. Geoderma. 2023, 429, 116281. [Google Scholar] [CrossRef]
  7. Wang, X.; Wang, C.; Chu, G. Effects of short-chain polyphosphate fertilization on inorganic P transformation and mobilization of Fe, Mn and Zn in soils. Chin. J. Appl. Ecol. 2018, 29, 2970–2978. [Google Scholar]
  8. Chen, X.; Yang, Y.; Gong, L.; Zhang, C. Effect of ammonium polyphosphates with various degree of polymerization on growth of maize seedlings. J. Plant Nutr. Fertil. 2019, 25, 337–342. [Google Scholar]
  9. Mcbeath, T.M.; Armstrong, R.D.; Lombi, E.; Mclaughlin, M.J.; Holloway, R.E. Responsiveness of wheat (Triticum aestivum) to liquid and granular phosphorus fertilisers in southern Australian soils. Soil Res. 2005, 43, 203–212. [Google Scholar] [CrossRef]
  10. Xiong, Z.; Qiu, Y.; Guo, L.; Guo, T.; Shi, W. The availability of ammonium polyphosphate in soil and the impacting factors. J. Plant Nutr. Fertil. 2020, 26, 1473–1480. [Google Scholar]
  11. Hamilton, J.G.; Hilger, D.; Peak, D. Mechanisms of tripolyphosphate adsorption and hydrolysis on goethite. J. Colloid Interface Sci. 2017, 491, 190–198. [Google Scholar] [CrossRef] [PubMed]
  12. Kulakovskaya, T.V.; Vagabov, V.M.; Kulaev, I.S. Inorganic polyphosphate in industry, agriculture and medicine: Modern state and outlook. Process Biochem. 2012, 47, 1–10. [Google Scholar] [CrossRef]
  13. Torres-Dorante, L.O.; Claassen, N.; Steingrobe, B.; Olfs, H.W. Hydrolysis rates of inorganic polyphosphates in aqueous solution as well as in soils and effects on P availability. J. Plant Nutr. Soil Sci. 2005, 168, 352–358. [Google Scholar] [CrossRef]
  14. Al-Kanani, T.; Mackenzie, A.F. Sorption and desorption of orthophosphate and pyrophosphate by mineral fractions of soils, goethite, and kaolinite. Can. J. Soil Sci. 1991, 71, 327–338. [Google Scholar] [CrossRef]
  15. Hashimoto, I.; Hughes, J.D.; Philen, O.D. Reactions of triammonium pyrophosphate with soils and soil minerals. Soil Sci. Soc. Am. J. 1969, 33, 401–405. [Google Scholar] [CrossRef]
  16. Savant, N.K.; Tambe, K.N. The langmuir parameters of orthophosphate and pyrophosphate sorption for ammoniated tropical soils. Commun. Soil Sci. Plant Anal. 2008, 10, 503–511. [Google Scholar] [CrossRef]
  17. Sutton, C.D.; Larsen, S. Pyrophosphate as a source of phosphorus for plants. Soil Sci. 1964, 97, 196–201. [Google Scholar] [CrossRef]
  18. Blanchar, R.W.; Hossner, L.R. Hydrolysis and sorption reactions of orthophosphate, pyrophosphate, tripolyphosphate, and trimetaphosphate anions added to an Elliot soil. Soil Sci. Soc. Am. J. 1969, 33, 141–144. [Google Scholar] [CrossRef]
  19. Blanchar, R.W.; Hossner, L.R. Hydrolysis and sorption of ortho-, pryo-, tripoly-, and trimetaphosphate in 32 Midwestern soils. Soil Sci. Soc. Am. J. 1969, 33, 622–625. [Google Scholar] [CrossRef]
  20. Xu, D. Study on the Chelation and Dissolution of Medium and Trace Elements in Water-Soluble Ammonium Polyphosphate Solution; Sichuan University: Chengdu, China, 2020. [Google Scholar]
  21. Khourchi, S.; Oukarroum, A.; Tika, A.; Delaplace, P.; Bargaz, A. Polyphosphate application influences morpho-physiological root traits involved in P acquisition and durum wheat growth performance. BMC Plant Biol. 2022, 22, 309. [Google Scholar] [CrossRef]
  22. Ji, L.; Ren, G.; Xu, D.; Fan, B.; Zhang, Z.; Yuan, T.; Yan, Z.; Wang, X. Selective adsorption of various phosphorus species coexistence in water-soluble ammonium polyphosphate on goethite: Experimental investigation and molecular dynamics simulation. Chemosphere 2022, 307, 135901. [Google Scholar] [CrossRef]
  23. Ji, L.; Zhang, W.; Xie, W.; Yuan, T.; Wei, Q.; Xu, D.; Zhang, Z.; Yan, Z.; Wang, X. Selective adsorption and precipitation of pyrophosphate from water-soluble ammonium polyphosphate by calcite. J. Environ. Chem. Eng. 2022, 10, 108893. [Google Scholar] [CrossRef]
  24. Dari, B.; Nair, V.D.; Colee, J.; Harris, W.G.; Mylavarapu, R. Estimation of phosphorus isotherm parameters: A simple and cost-effective procedure. Front. Environ. Sci. 2015, 3, 70. [Google Scholar] [CrossRef]
  25. Pizzeghello, D.; Berti, A.; Nardi, S.; Morari, F. Phosphorus-related properties in the profiles of three Italian soils after long-term mineral and manure applications. Agric. Ecosyst. Environ. 2014, 189, 216–228. [Google Scholar] [CrossRef]
  26. Abolfazli, F.; Forghani, A.; Norouzi, M. Effects of phosphorus and organic fertilizers on phosphorus fractions in submerged soil. J. Soil Sci. Plant Nutr. 2012, 12, 349–362. [Google Scholar] [CrossRef]
  27. Joardar, J.C.; Sikder, S.; Hasib, S.B. Influence of Solution Concentration and Equilibrium Time on Phosphorus Sorption in Calcareous and Non-Calcareous Soils. SAARC J. Agri. 2019, 17, 117–126. [Google Scholar]
  28. Du, Z.; Wang, Q.; Liu, F.; Ma, H.; Ma, B.; Malhi, S.S. Movement of phosphorus in a calcareous soil as affected by humic acid. Pedosphere 2013, 23, 229–235. [Google Scholar] [CrossRef]
  29. Mcbeath, T.M.; Lombi, E.; Mclaughlin, M.J.; Bünemann, E.K. Pyrophosphate and orthophosphate addition to soils: Sorption, cation concentrations, and dissolved organic carbon. Soil Res. 2007, 45, 237–245. [Google Scholar] [CrossRef]
  30. Rahmatullah; Gill, M.A.; Wissemeier, A.H.; Steffens, D. Phosphate availability from phosphate rock as related to nitrogen form and the nitrification inhibitor DMPP. J. Plant Nutr. Soil Sci. 2006, 169, 675–678. [Google Scholar] [CrossRef]
  31. Mnkeni, P.N.S.; Mackenzie, A.F. Retention of ortho- and polyphosphates in some Quebec soils as affected by added organic residues and calcium carbonate. Can. J. Soil Sci. 1985, 65, 575–585. [Google Scholar] [CrossRef]
  32. Yuan, T.; Yan, Z.; Huang, C.; Zhang, Z.; Wang, X. Adsorption-desorption characteristics of ammonium polyphosphate in purple soils. Acta Agric. Zhejiangensis 2023, 35, 403–416. [Google Scholar]
  33. Olsen, S.; Cole, C.; Watanabe, F.S.; Dean, L.A. Estimation of Available Phosphorus in Soils by Extraction with Sodium Bicarbonate; US Department of Agriculture: Washington, DC, USA, 1954. [Google Scholar]
  34. Jo, S.; Ja, B. Total and Organic Carbon Soil Sampling and Methods of Analysis; Soil Science Society of Canada: Boca Raton, FL, USA, 2007; pp. 225–237. [Google Scholar]
  35. Thoma, R.; Shear, R.; Moyer, J. Comparison of conventional and automated procedures for nitrogen, phosphorus, and potassium analysis of plant material using a single digestion. Agron. J. 1967, 59, 240–243. [Google Scholar] [CrossRef]
  36. Richards, L.A. Diagnosis and Improvement of Saline and Alkali Soils. Soil Sci. 1954, 78, 154. [Google Scholar] [CrossRef]
  37. Mehra, O.P.; Jackson, M.L. Iron oxide removal from soils and clays by a dithionite citrate system buffered with sodium bicarbonate. Clays Clay Miner. 1960, 7, 313–317. [Google Scholar]
  38. Sequential spectrophotometric determination of water-soluble calcium and magnesium in soils using chlorophosphonazo I. Microchim. Acta. 1983, 81, 1–9. [CrossRef]
  39. Shuman, L.M.; Duncan, R.R. Soil exchangeable cations and aluminum measured by ammonium chloride, potassium chloride, and ammonium acetate. Commun. Soil Sci. Plant Anal. 1990, 21, 13–16. [Google Scholar] [CrossRef]
  40. Xie, W.; Wang, X.; Li, Y.; Xu, D.; Zhong, Y.; Yang, J. Simultaneous determination of various phosphates in water-soluble ammonium polyphosphate. Chromatographia 2019, 82, 1687–1695. [Google Scholar] [CrossRef]
  41. Graetz, D.A.; Nair, V.D. Phosphorus sorption isotherm determination. In Methods of Phosphorus Analysis for Soils, Sediments, Residuals and Water; Pierzynski, G.M., Ed.; North Carolina State University: Manhattan, NY, USA, 2000; Available online: https://citeseerx.ist.psu.edu/document?repid=rep1&type=pdf&doi=4c3a41c92a68147ee77a3fadd9f2632ac7c4ef6c (accessed on 21 January 2025).
  42. Pizzeghello, D.; Berti, A.; Nardi, S.; Morari, F. Phosphorus forms and P-sorption properties in three alkaline soils after long-term mineral and manure applications in north-eastern Italy. Agric. Ecosyst. Environ. 2011, 141, 58–66. [Google Scholar] [CrossRef]
  43. Arnold, E.; Greenberg, L.S.C.; Eaton, A.D. Standard Methods for the Examination of Water and Wastewater; American Public Health Association: Washington, DC, USA, 1992. [Google Scholar]
  44. Yang, X.; Chen, X.; Yang, X. Effect of organic matter on phosphorus adsorption and desorption in a black soil from Northeast China. Soil Till Res. 2019, 187, 85–91. [Google Scholar] [CrossRef]
  45. Jalali, M.; Jalali, M. Relation between various soil phosphorus extraction methods and sorption parameters in calcareous soils with different texture. Sci. Total Environ. 2016, 566–567, 1080–1093. [Google Scholar] [CrossRef]
  46. Wang, Y.; Xu, D.; Wang, X.; Yang, J.; Zhang, Z. Study on the Chelation of Ca2+/Mg2+/Zn2+ in water-soluble ammonium polyphosphate solution. Chemistry 2022, 85, 704–708. [Google Scholar]
  47. Xu, D.; Zhong, B.; Zhang, Z.; Xu, D.; Wang, X. Research progress of preparation and application of water-soluble ammonium polyphosphate. Chem. Ind. Eng. Prog. 2021, 40, 378–385. [Google Scholar]
  48. Mclaughlin, M.J.; Mcbeath, T.M.; Smernik, R.; Stacey, S.P.; Ajiboye, B.; Guppy, C. The chemical nature of P accumulation in agricultural soils—Implications for fertiliser management and design: An Australian perspective. Plant Soil 2011, 349, 69–87. [Google Scholar] [CrossRef]
Figure 1. Adsorption isotherms of total P from different P sources across various soils: (a) red soil, (b) fluvo-aquic soil, (c) acidic purple soil, (d) calcareous purple soil, (e) laterite soil, and (f) cinnamon soil. MAP, monoammonium phosphate; APP1, ammonium polyphosphate with two P species coexistence; and APP2, ammonium polyphosphate with seven P species coexistence.
Agriculture 15 00585 g001
Figure 2. P species changes in APP1 solutions before and after adsorption by soils: (a) red soil, (b) fluvo-aquic soil, (c) acidic purple soil, (d) calcareous purple soil, (e) laterite soil, and (f) cinnamon soil. P1, orthophosphate; P2, pyrophosphate.
Agriculture 15 00585 g002
Figure 3. P species changes in APP2 solutions before and after adsorption by soils: (a) red soil, (b) fluvo-aquic soil, (c) acidic purple soil, (d) calcareous purple soil, (e) laterite soil, and (f) cinnamon soil. P1, orthophosphate; P2, pyrophosphate; P3, tripolyphosphate; P4, tetraphosphate; P5, pentaphosphate; P6, hexaphosphate; and P7, heptaphosphate.
Agriculture 15 00585 g003
Figure 4. pH of adsorption equilibrium solutions of different soils: (a) red soil, (b) fluvo-aquic soil, (c) acidic purple soil, (d) calcareous purple soil, (e) laterite soil, and (f) cinnamon soil. MAP, monoammonium phosphate; APP1, ammonium polyphosphate with two P species coexistence; and APP2, ammonium polyphosphate with seven P species coexistence. The means with same letter indicate no significant differences according to LSD (p < 0.05) by each parameter under the same initial P concentration.
Agriculture 15 00585 g004
Figure 5. Concentrations of dissolved organic carbon (DOC) in the adsorption equilibrium solutions of different soils: (a) red soil, (b) fluvo-aquic soil, (c) acidic purple soil, (d) calcareous purple soil, (e) laterite soil, and (f) cinnamon soil. MAP, monoammonium phosphate; APP1, ammonium polyphosphate with two P species coexistence; and APP2, ammonium polyphosphate with seven P species coexistence. At the same initial P concentration, means followed by the same letter are not significantly different (LSD, p < 0.05) for each parameter assessed.
Agriculture 15 00585 g005
Figure 6. Correlation between soil properties and ΔP adsorption parameters (APP versus MAP). Smax, the P sorption maximum; KL, a constant related to binding energy of P; DPS, the degree of P saturation; PBC, the P buffer capacity; KF, the Freundlich sorption coefficient; and n, a constant related to sorption intensity. Only the significant correlation coefficients are showed. *, **, and *** represent p < 0.05, 0.01 and 0.001, respectively.
Agriculture 15 00585 g006
Figure 7. Redundancy analysis (RDA) showing the relationships between soil properties and Δ P adsorption parameters (APP versus MAP): (a) acidic soil and (b) calcareous soil. Smax, the P sorption maximum; KL, a constant related to binding energy of P; DPS, the degree of P saturation; PBC, the P buffer capacity; KF, the Freundlich sorption coefficient; n, a constant related to sorption intensity; Feox, free oxides Fe; and OM, organic matter.
Agriculture 15 00585 g007
Table 1. Physicochemical properties of soils used in this study.
Soil TypesRed SoilAcidic Purple SoilLaterite SoilFluvo-Aquic SoilCalcareous Purple SoilCinnamon Soil
Sampling SiteHunanSichuanGuangdongHenanSichuanHebei
pH4.074.364.488.58.058.37
Total P (g kg−1)2.260.510.410.860.850.54
Olsen-P (mg kg−1)206.185.42.918.57.22.3
Organic matter (g kg−1)26.44.58.518.78.78.0
Total N (g kg−1)1.780.480.690.890.860.41
Clay (<0.002 mm) (g kg−1)237375715719777
CaCO3 (g kg−1)---45.239.129.7
Free oxides Fe (g kg−1)6.461.9523.892.084.631.64
Free oxides Al (g kg−1)16.034.2228.291.382.541.13
Water soluble Ca (g kg−1)0.030.030.060.120.180.05
Exchangeable Ca (g kg−1)0.220.680.415.869.156.13
- = not detected.
Table 2. P species distribution in different P sources.
P SourcespHEach P Species Percentage in the Total P (%)
P1P2P3P4P5P6P7
MAP5.4100.0
APP16.542.058.0
APP27.023.630.122.212.96.62.91.7
MAP = monoammonium phosphate; APP1 = ammonium polyphosphate with two P species coexistence; and APP2 = ammonium polyphosphate with seven P species coexistence. The pH was measured at 300 mg L−1 of total P. P1 = orthophosphate; P2 = pyrophosphate; P3 = tripolyphosphate; P4 = tetraphosphate; P5 = pentaphosphate; P6 = hexaphosphate; and P7 = heptaphosphate.
Table 3. Langmuir and Freundlich P adsorption parameters across different soils and P sources (P additions ranged from 1 to 100 mg L−1). Means followed by the same letter are not significantly different (LSD, p < 0.05) for a given parameter in each soil.
SoilsP SourcesLangmuir EquationFreundlich Equation
Smax
(mg kg−1)
KL
(L mg−1)
R2DPS
(%)
PBC
(L kg−1)
KF
(L kg−1)
nR2
Acid soilRed soilMAP874 b0.057 a0.897 19.09 a49.49 c60.46 a0.613 b0.965
APP11466 a0.045 b0.898 12.36 b66.11 a64.80 a0.749 a0.909
APP2965 b0.060 a0.983 17.61 a58.17 b52.61 a0.718 a0.907
Acidic purple soilMAP336 c0.070 a0.855 20.31 a23.38 b47.74 c0.394 b0.982
APP1551 a0.079 a0.883 13.45 b43.03 a62.70 b0.494 a0.860
APP2474 b0.103 a0.920 15.27 b48.74 a85.40 a0.363 b0.935
Laterite soilMAP2016 c0.151 a0.993 0.14 a305.09 a315.54 b0.419 c0.823
APP12533 b0.111 b0.977 0.11 b278.48 a308.70 b0.485 b0.757
APP23973 a0.077 c0.925 0.07 c304.91 a376.23 a0.547 a0.779
Calcareous
soil
Fluvo-aquic soilMAP301 c0.053 a0.850 5.88 a15.62 c34.48 b0.431 c0.983
APP11189 a0.025 c0.881 1.56 b29.00 b34.01 b0.752 a0.980
APP2841 b0.042 b0.732 2.16 b35.12 a59.94 a0.542 b0.975
Calcareous purple soilMAP494 c0.070 a0.829 1.44 a34.27 c79.48 c0.344 c0.943
APP12423 b0.038 b0.660 0.30 b92.33 a111.47 b0.683 a0.985
APP23271 a0.026 c0.228 0.22 c85.10 b134.89 a0.617 b0.912
Cinnamon soilMAP215 c0.052 a0.913 1.07 a10.91 b28.25 b0.406 b0.983
APP12343 a0.010 b0.854 0.10 c23.31 a29.86 b0.826 a0.997
APP2484 b0.063 a0.955 0.48 b29.92 a59.44 a0.444 b0.959
MAP = monoammonium phosphate; APP1 = ammonium polyphosphate with two P species coexistence; and APP2 = ammonium polyphosphate with seven P species coexistence. Smax = the P sorption maximum; KL = a constant related to binding energy of P; DPS = the degree of P saturation; and PBC = the P buffer capacity. KF = the Freundlich sorption coefficient and n = a constant related to sorption intensity.
Table 4. Concentrations of Ca, Fe, and Al (mg L−1) in the adsorption equilibrium solutions of different soils.
SoilsP SourcesCaFeAl
501003005010030050100300
Acid soilRed soilMAP5.7 a5.5 a5.1 a0.03 c0.04 c0.06 c1.19 c1.37 c1.70 c
APP13.8 b2.1 b1.5 c0.21 b4.96 b19.66 b2.05 b10.84 b52.71 b
APP23.4 c1.7 c1.9 b1.46 a8.85 a24.41 a6.76 a25.40 a59.13 a
Acidic purple soilMAP13.8 a14.6 a15.6 b0.01 b0.02 b0.04 c0.41 b0.50 b0.61 c
APP19.0 b10.0 c13.8 c1.98 a2.90 a7.19 b7.92 a11.17 a20.99 b
APP29.0 b12.3 b19.0 a2.55 a3.89 a11.08 a9.47 a12.38 a25.56 a
Laterite soilMAP9.3 a8.5 a6.9 a0.01 b0.02 b0.06 c0.01 b0.05 b0.12 c
APP16.7 b1.8 b1.4 c0.01 ab1.68 ab4.23 b0.00 b3.66 ab19.75 b
APP25.4 c1.3 b3.9 b0.03 a3.39 a12.20 a0.03 a6.18 a23.13 a
Calcareous soilFluvo-aquic soilMAP48.5 a56.2 a63.1 a0.00 b0.01 c0.01 c0.00 b0.00 b0.00 c
APP119.1 c15.4 c13.8 c0.18 b0.45 b1.64 b0.40 ab1.23 a2.45 b
APP221.2 b22.9 b39.0 b0.39 a0.73 a4.00 a0.68 a1.48 a5.96 a
Calcareous purple soilMAP95.4 a102.6 a115.0 a0.01 a0.01 b0.01 b0.00 b0.00 b0.00 b
APP165.5 b49.0 b18.2 c0.01 a0.04 a0.42 ab0.05 a0.35 a3.21 a
APP266.7 b48.6 b43.6 b0.01 a0.04 a0.79 a0.05 a0.33 a3.67 a
Cinnamon soilMAP49.6 a58.2 a69.7 a0.00 b0.00 c0.00 c0.00 c0.00 c0.00 c
APP115.8 c12.3 c16.0 c0.11 a0.37 b1.27 b0.57 a1.44 b2.87 b
APP221.7 b24.3 b47.4 b0.10 a0.79 a2.51 a0.33 b2.24 a4.34 a
MAP = monoammonium phosphate; APP1 = ammonium polyphosphate with two P species coexistence; and APP2 = ammonium polyphosphate with seven P species coexistence. The values of 50, 100, and 300 represent the initial P concentrations (mg P L−1) of the solutions prior to soil adsorption. At the same initial P concentration, means followed by the same letter are not significantly different (LSD, p < 0.05) for each parameter in each soil.
Disclaimer/Publisher’s Note: The statements, opinions and data contained in all publications are solely those of the individual author(s) and contributor(s) and not of MDPI and/or the editor(s). MDPI and/or the editor(s) disclaim responsibility for any injury to people or property resulting from any ideas, methods, instructions or products referred to in the content.

