Article

Investigating the Impact of Tillering on Yield and Yield-Related Traits in European Rice Cultivars

by
Argyrios Kalaitzidis
1,
Kalliopi Kadoglidou
1,
Ioannis Mylonas
1,
Sopio Ghoghoberidze
1,
Elissavet Ninou
2 and
Dimitrios Katsantonis
1,*
1
Hellenic Agricultural Organization—“DEMETER”, Institute of Plant Breeding & Genetic Resources, 57001 Thessaloniki, Greece
2
Department of Agriculture, International Hellenic University, 57400 Thessaloniki, Greece
*
Author to whom correspondence should be addressed.
Agriculture 2025, 15(6), 616; https://doi.org/10.3390/agriculture15060616
Submission received: 20 January 2025 / Revised: 11 March 2025 / Accepted: 12 March 2025 / Published: 13 March 2025

Abstract

:
Optimizing rice productivity is crucial for global food security, especially in Mediterranean environments. This study investigated the influence of tillering capacity on yield and other agronomic traits in nine European rice cultivars over two seasons (2021–2022). A split-plot design was used with cultivars as the main factor and five tillering levels: main stems (Mn), primary (T1), secondary (T2), tertiary (T3), and quaternary (T4) as sub-factors. The grain yield, total dry matter, harvest index, 1000-grain weight, and number of stems were measured. Significant differences were revealed among cultivars, tillering levels, and their interaction for all traits. Mn and T1 consistently outyielded later tillers, with Ronaldo’s Mn achieving 4.71 t ha−1. Mare and Olympiada displayed the highest average yields (1.52 t ha−1) through balanced resource allocation across tillers. Strong correlations between tillering levels and yield (R2 = 0.73) demonstrate that early tillers significantly enhance productivity. We conclude that optimizing early tiller productivity—rather than maximizing tiller numbers—should be prioritized in breeding programs. Cultivars combining vigorous Mn and T1 development with efficient resource partitioning offer the most promising approach for improving Mediterranean rice productivity.

1. Introduction

Rice (Oryza sativa L.) is the most important staple food for more than half of the world’s population [1] and the third most important cereal in the world [2]. Global demand for rice is expected to increase by 28% by 2050 [3,4]. Due to the rapid growth of urbanization, land disruption, and environmental degradation, farmable land for rice cultivation is decreasing. Therefore, improving the rice yield per unit area is the most effective way to meet the growing global demand for rice [5,6].
Rice production in Greece amounts to approximately 180,000 to 255,000 tons [7] and is renowned for its high quality. The cultivated area spans between 20,000 and 30,000 hectares [7]. Rice cultivation is predominantly concentrated in the prefectures of Thessaloniki, constituting around 50% of the total production, and in Serres, contributing approximately 16%. The remaining approximately 34% of the cultivated area is distributed across six other prefectures [8]. The rice types are distributed as follows: around 30% Indica, 70% Japonica [9]. A noteworthy advantage of rice cultivation lies in its ability to utilize lands that would otherwise face significant salinity issues and become uncultivable in a few years if not used for rice cultivation [10,11].
Grain yield and quality in crops are affected by a plethora of factors, such as varietal differences, husbandry, and climatic conditions [12,13,14,15]. One of the most important agronomic characteristics affecting grain yield is tillering [16,17,18]. The number of tillers has been reported to have a positive association with plant biomass and the yields of rice [19], oat [20], wheat, and barley [21]. However, excessive tillering in rice plants leads to high tiller abortion, poor grain setting, small panicle size, and reduced grain yield [22,23]. Conversely, a low number of tillers can result in an insufficient number of panicles, leading to lower yields [24].
Moreover, the pattern of panicle development is hierarchical; thus, the grain yield of rice plants deteriorates with each successive tiller [25]. Late-emerging tillers do not contribute significantly to the grain yield of rice [26], making the optimization of tillering crucial for increasing rice yields [27].
Additionally, environmental stress significantly influences tiller formation and grain development in rice. Temperature stress, particularly during critical growth stages, can severely impact tillering patterns and grain filling. High temperatures (>35 °C) during vegetative growth can reduce tiller formation and survival, while elevated night temperatures negatively affect grain filling and the final yield [28,29]. Conversely, low temperatures (<20 °C) can inhibit tiller bud outgrowth and delay panicle development [30,31]. Water stress, whether through drought or flooding, also plays a crucial role in tiller development. Under drought conditions, rice plants typically reduce tiller production as a survival mechanism, while flooding can inhibit early tiller formation by limiting oxygen availability to developing buds [32,33].
The regulation of tiller development is controlled by a complex network of hormonal, genetic, and environmental factors [34]. Plant hormones play central roles in this process, with cytokinins promoting tiller bud outgrowth while strigolactones and auxins generally inhibit tillering [34]. The MONOCULM 1 (MOC1) gene, a positive key regulator of tillering, has been shown to control tiller bud formation and outgrowth [35]. Conversely, the TEOSINTE BRANCHED 1 (TB1) gene functions as a negative regulator of lateral branching [36]. These genetic regulators respond to both environmental cues and internal signals to modulate tiller development.
Nutrient availability, particularly nitrogen, serves as both an environmental factor and a key regulator of tillering. High nitrogen availability promotes tiller formation through enhanced cytokinin production and increased expression of tillering-related genes [37]. However, excessive nitrogen can lead to unproductive tillers, particularly when applied late in the growing season [38].
Furthermore, recent studies have revealed that sugar signaling pathways play a crucial role in coordinating tiller development and grain filling [34,39]. During the transition from vegetative to reproductive growth, altered sugar allocation patterns influence both tiller survival and the grain-filling capacity [40]. Environmental stress can disrupt these sugar signaling pathways, leading to reduced tiller survival and poor grain filling, particularly in late-forming tillers [41,42].
Before the Green Revolution, cereal plants reacted to nitrogen application with excessive tillering and leaf and stem elongation, leading to increased biomass and lodging. During the Green Revolution, factors such as plant height, tiller number, the use of chemical fertilizers, disease-resistant cultivars, and agrochemicals contributed to increase yield potential [43]. Yield improvements in rice and wheat were primarily derived from the adoption of genes that made the plants shorter in stature, more responsive to nitrogen fertilization, and resistant to lodging [44].
The ideal cereal plant would be short, with fewer unproductive tillers, more grains, and erect leaves [45,46]. As a result, tillering is a key feature that breeders aim to manipulate [47]. Productive tillers promote the creation of additional panicles and more grains, but excessive and especially late tillering leads to unproductive tillers and an increase in biomass without a corresponding increase in grains [48,49]. In rice, this ideotype is associated with specific alleles of the wealthy farmer’s panicle (wfp)/ideal plant architecture1 (ipa1) locus, which promotes early tillering but results in fewer overall tillers, leading to larger rice grains and higher yields [50,51,52].
Since the Green Revolution of the 1960s, the average yield of rice has more than doubled [43,53]. According to Rahman et al. (2023) [54], one-third of that increase in Bangladesh can be attributed to genetic improvement and two-thirds to improved management or favorable climate change. An important agronomic factor to study in relation to yield is tillering ability. Various statistical tools have been proposed for the genotype x environment (GxE) interpretation and study of crop stability, including the genotype plus genotype by environment (GGE) biplot model [55,56]. This model measures the distance of a genotype from the “ideal genotype”, which is a measure of its desirability [57].
Subsequently, the aim of this study was to investigate the effect of tillering on four agronomic characteristics and the grain yield of rice plants under field conditions in nine European commercial rice cultivars. More specifically, we intended to reveal whether high-tillering-ability cultivars are advantageous for use in breeding programs.

2. Materials and Methods

2.1. Site Description and Climatic Data

The field experiments were carried out at the Kalochori experimental station of the Institute of Plant Breeding and Genetic Resources (IPGRB) in Thessaloniki, Central Macedonia, Greece (Latitude 40°36′58.75″ N, Longitude 22°49′51.16″ E) for two growing seasons, in 2021 and 2022. Prior to experimentation, soil analyses were performed by collecting six soil samples from each plot. The results showed relatively uniform soil comprising 22% clay, 50% silt, 28% sand, 2.84% organic matter, 1.3 dS m−1, and a pH of 7.5. Furthermore, the nutrient content was also relatively uniform, comprising 22 ppm Ν-NO3, 16 ppm available P, 241 ppm available K, 1720 ppm available Ca, 93.6 ppm available Fe, 0.98 ppm available Zn, 15.13 ppm available Mn, 9.87 ppm available Cu, and 0.69 ppm available B. All the analyses regarding soil nutrients were performed according to methodologies described by Carter and Gregorich (2007) [58].
Throughout the duration of both growing seasons, continuous measurements of temperature and relative humidity were taken within the test plots. These measurements were captured using a HOBO Micro Station (Onset Computer Corporation, Bourne, MA, USA). In 2021, the average monthly temperature ranged from a low of 15 °C in October to a high of 28 °C in July and August (Figure 1). The year 2022 showed a similar trend, with the lowest average temperature being 17 °C in October and the highest being 27 °C in July and August. For the year 2021, the lowest average monthly relative humidity was in July at 58% and highest in October at 71% (Figure 1). In 2022, mean relative humidity ranged from 54% in July to 67% in October (Figure 1).

2.2. Plant Material

Nine rice cultivars of the Indica and Japonica types were used for both experimental years (Table 1). Three cultivars (Dion, Olympiada, and Alexandros) were obtained from the Institute of Plant Breeding and Genetic Resources (IPBGR), in Thessaloniki, Greece. Two (Mare and Luna) are Clearfield® cultivars [59]. The remaining four (Gloria, Galileo, Ronaldo, and Samba) are widely cultivated in the local area and other European rice-producing countries. Apart from the Greek cultivars provided by IPBGR, all others were procured from certified commercial seed production companies and local retailers.

2.3. Field Setup and Cultural Practice

The research was carried out in a field comprising nine experimental plots, each spanning 0.2 hectares and measuring 12 m by 167 m (Figure 2).
The experimental design was a split-plot with cultivar as the main factor and tillering as the sub-factor. Regarding soil preparation prior to sowing, local cultivation practices were applied [61,62,63]. The fertilization strategy involved a three-stage application of 160 kg ha −1 nitrogen (N) units: 40% was incorporated as basal fertilization prior to flooding the fields, another 40% was applied at the tillering stage, and the remaining 20% was administered at the panicle initiation stage. The fertilizer used for basal fertilization was a 32-5-5, comprising 96.41% N-NH2 and 3.59% NH4, while also containing 5% P2O5 and 5% K2O. The fertilizer used for the surface fertilization was 35-0-0, comprising 73.6% N-NH2 and 26.4% NH4. The sowing was conducted on 20 May 2021 and 25 May 2022. The seeding densities were 220 kg ha−1 for Japonica types and 200 kg ha−1 for Indica types, following a 48 h flooding period.
One month after sowing, the plots underwent herbicidal treatment. Profoxydim was applied to all plots except those sown with Clearfield® cultivars, which were treated with Quinclorac and Imazamox. Additionally, algal growth was managed through the application of copper sulfate during the first 30 days post-sowing. No pesticides were required.

2.4. Sample Collection and Processing

During the maturity phase, the samples were obtained by uprooting a total area of 5 m2 from each experimental plot, with each sampling point contributing 1 m2 (5 biological replications of 1 m2 each). To ensure a uniform and representative sampling across the nine experimental plots, an “X” pattern (Figure 2) sampling scheme was utilized. The methodology of using an “X” pattern aligns with proven approaches for capturing spatial variability and reducing sampling biases in experimental plots. This technique ensures a comprehensive spatial coverage, a critical factor in achieving representational accuracy [64,65].
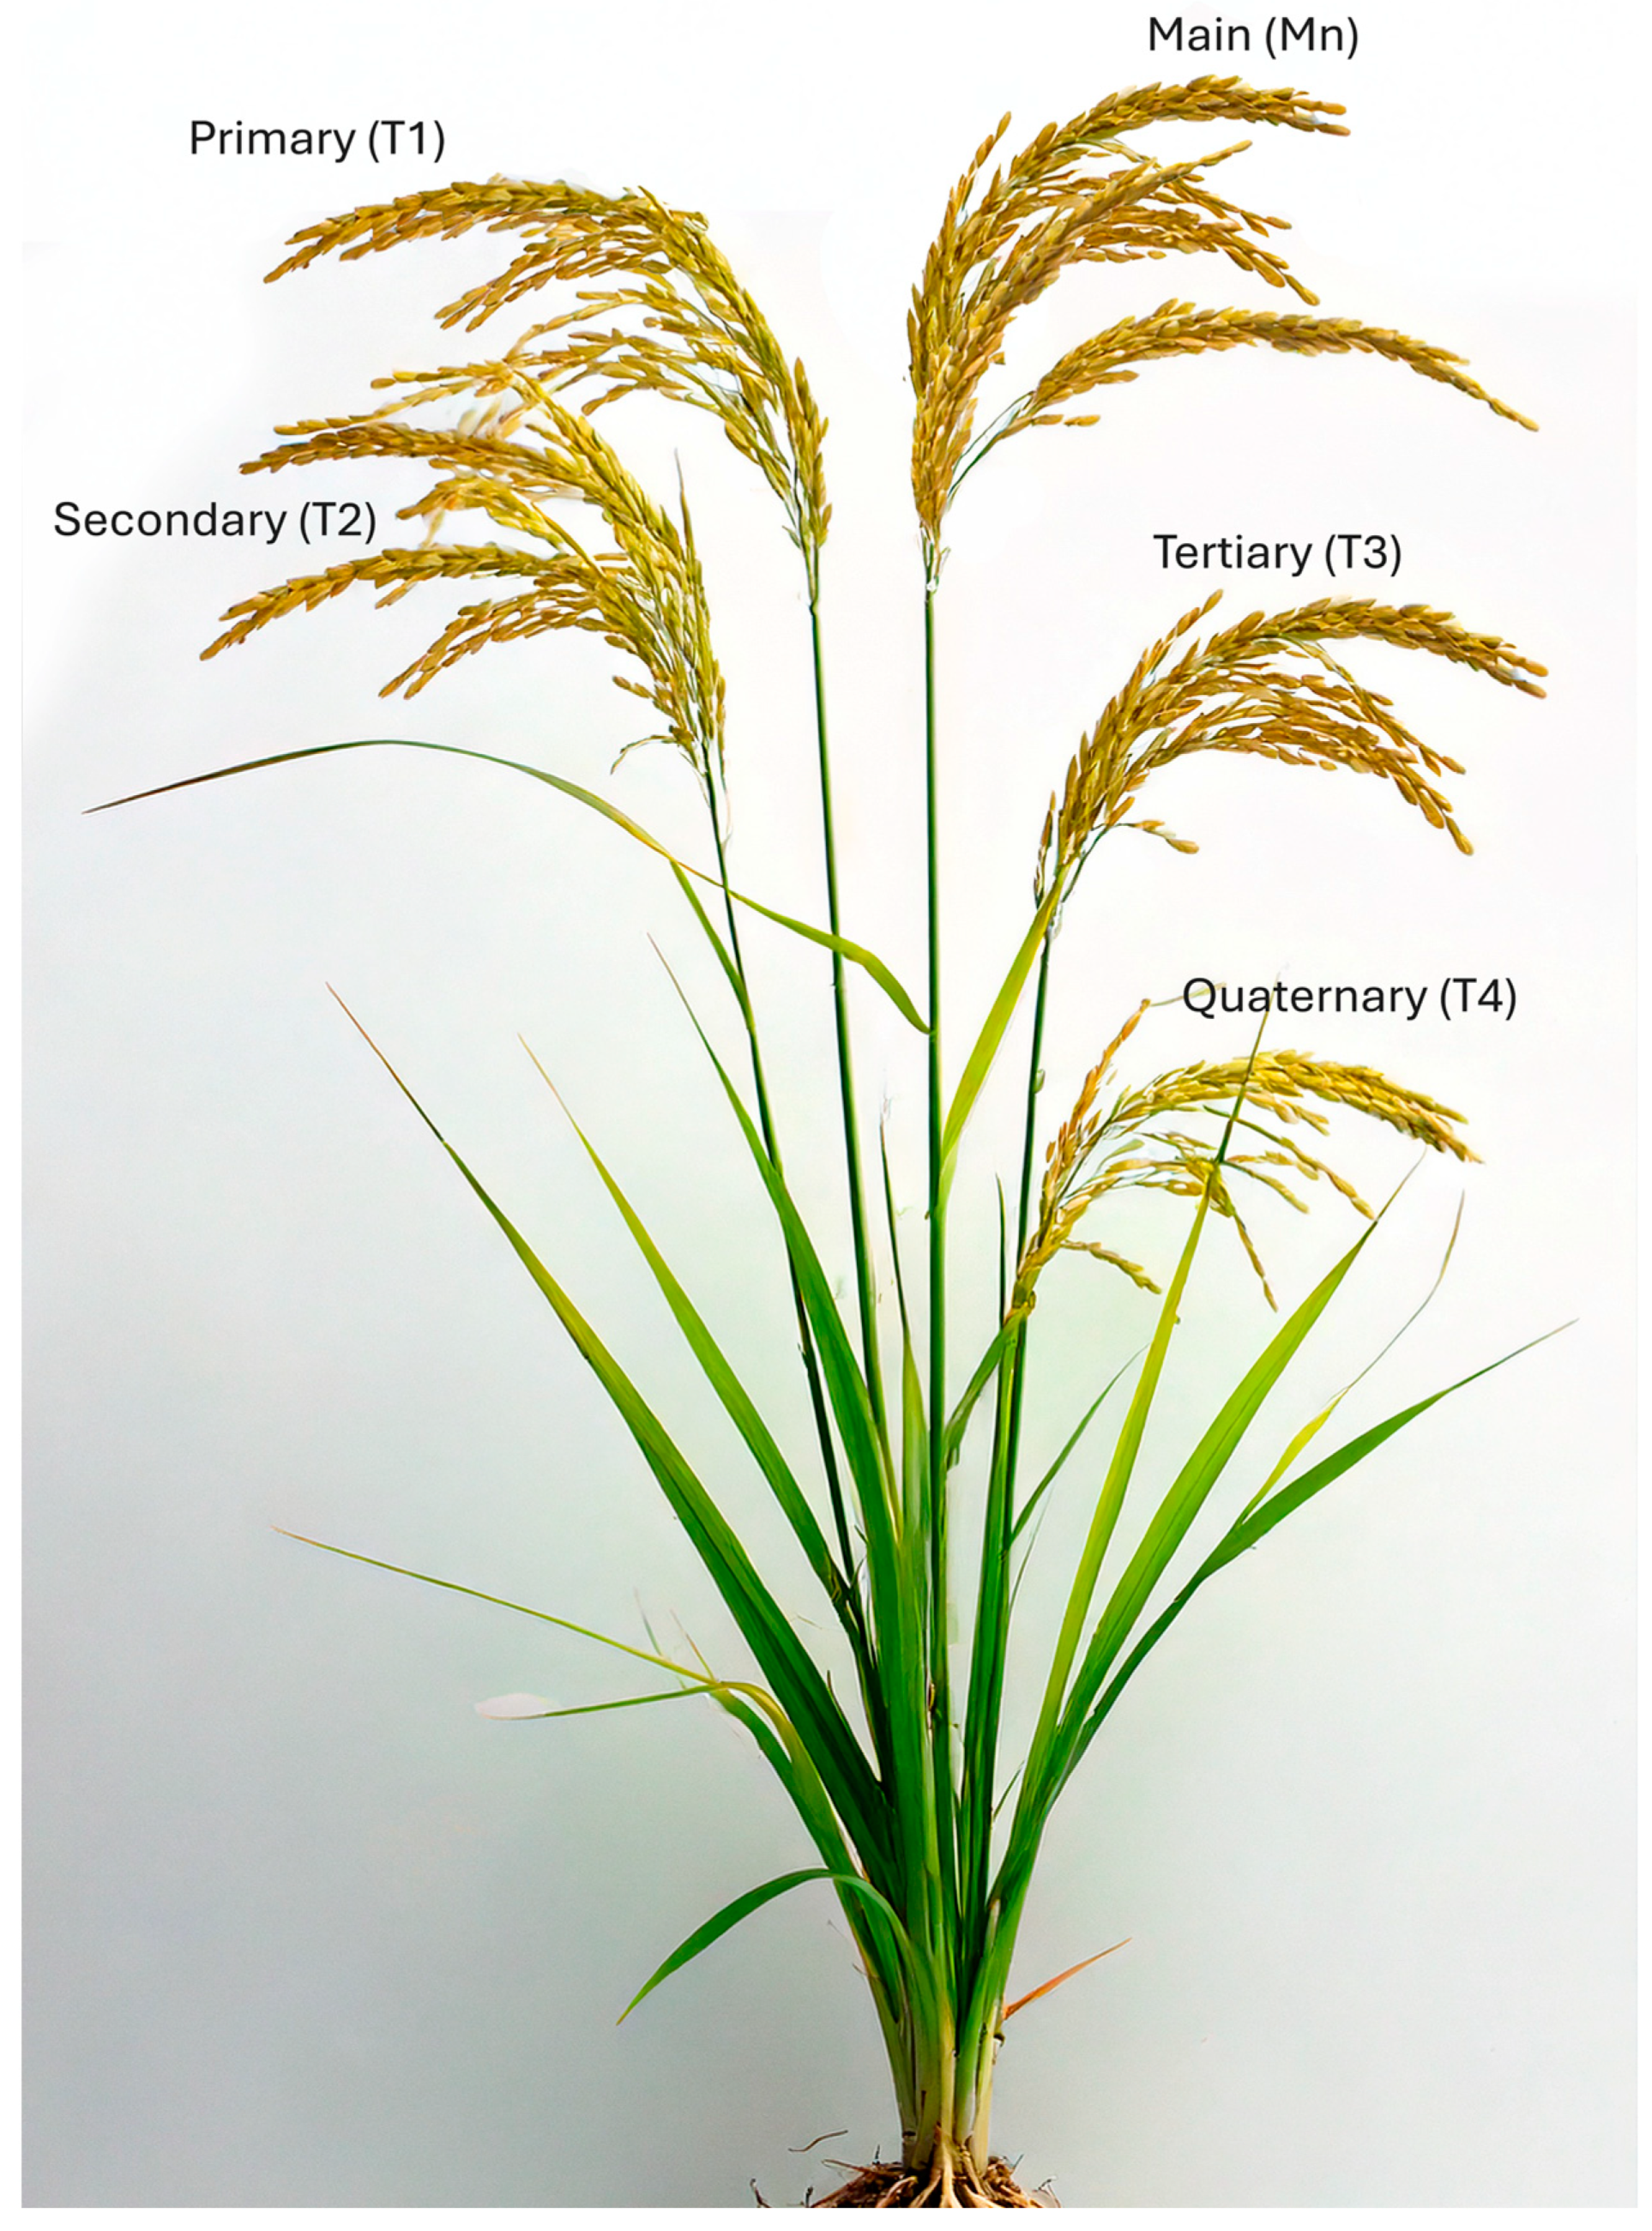
The initial two samples were obtained from areas located 41.75 m in length and 3 m and 9 m in width. The last two samples were collected from areas located 125.25 m in length and 3 m and 9 m in width. The final 1 m2 sample was collected from the middle of the paddy, specifically at 83.5 m in length and 6 m in width (Figure 2). Upon collection, the samples were immediately transported to a designated storage facility. The root systems were washed with tap water to remove soil and any extraneous material. Subsequently, the samples were air-dried under ambient conditions for a period of 48 h prior to further laboratory analysis. After drying, the plant samples were segregated into distinct panicles based on their corresponding tillering level (Figure 3). Harvesting of the panicles was performed using an electric panicle harvester. To conclude the sample preparation, all vegetative samples (post-harvest) were subjected to a drying process in an air oven (Nabertherm LH 60/14, Nabertherm, Lilienthal, Germany) at a temperature of 70 °C for an additional 48 h.

2.5. Yield Metrics’ Assessment

After the harvest, key yield metrics including grain yield, harvest index, and 1000-grain weight were quantitatively assessed.
Post-drying, the roots of the tillers were removed to isolate the above-ground biomass. Each level of tillering was then weighed and counted to determine the number of stems per m2 and the total dry matter.

2.5.1. Assessment of Grain Yield

Each stem from the 5 m−2 of the nine cultivars was detached by hand and allocated to its corresponding tillering level. Further, each tillering level, from each cultivar, was harvested separately. The yield was measured in tons per hectare (t ha−1). The moisture content for each net plot’s grain yield was ascertained using a moisture meter (Kett PM 650, Tokyo, Japan). The final grain yield was then standardized to a 14% moisture level using the appropriate formula [66]:
Grain yield (t ha−1) at 14% moisture = (100 − MC) × Y × 1000 (m2)/((100 − 14) × A)
where MC = moisture content of grain (%).
  • Y = net yield of the plot (t).
  • A = net area of the plot (m2).
  • (100 − MC)/(100 − 14) = conversion factor for grain yield at 14% moisture content.
  • (1000)/A = conversion factor for actual harvested area on a hectare basis.

2.5.2. Assessment of Harvest Index (HI)

The harvest index (HI) was estimated as the ratio of economic yield to biological yield following Yoshida [67]. This metric was considered for the various tillering levels as well as for all cultivars. HI was calculated using the following formula:
HI = economic yield (grain weight)/biological yield (grain + straw weights)

2.5.3. Assessment of 1000-Grain Weight (1000GW)

The 1000GW was determined as the average weight of 1000 fully filled grains sampled from each sampling spot at crop maturity [67]. The grains were separated according to tiller level—main stems (Mn), primary (T1), secondary (T2), tertiary (T3), and quaternary (T4) tillers. Three technical replicates of 1000 filled grains were counted and weighed for each tiller level. The 1000GW provides an estimate of the average grain size and density for each tiller group and cultivar.

2.5.4. Assessment of the Number of Stems (NOS)

To evaluate the tillering ability across the nine rice cultivars, the NOS was quantified as described by Yoshida [67]. The stems from each m−2 were categorized into five tillering levels: Mn, T1, T2, T3, and T4. The NOS was measured during the maturity stage.

2.5.5. Determination of Total Dry Matter (TDM)

The TDM was determined by summing the dry weights of all the vegetative components of the plant (separated into cultivars and tillers). After harvesting the plant material, it was subjected to air-oven drying at a temperature of 70 °C. The drying process continued until a constant weight was achieved, indicating that all moisture had been removed. The material was then weighed to obtain its dry weight [67].

2.6. Statistical Analyses and (GGE) Biplot Analysis

ANOVA was carried out using MSTAT-C ver. 1.41 (Michigan State University, East Lansing, MI, USA), while the correlation analysis was performed by employing the SPSS ver. 21.0 (IBM Corp., Armonk, NY, USA) statistical package. All data were objected to a combined over-year ANOVA, with cultivar as the main factor (Factor A) and tillering as the sub-factor (Factor B). Tukey’s Honestly Significant Difference test (HSD) was used to determine significant differences among the 9 cultivars and 5 levels of tillering, at p < 0.05. The combined analysis of data was justified following Bartlett’s test for homogeneity of variances, which indicated that data were not heterogeneous.
To determine the mean performance in combination with the stability across environments, a genotype × genotype × environment (GGE) biplot analysis [55,56] was performed, with normalized data using Genstat (13) [68]. This model measures the distance of each genotype from the ‘ideal genotype’, i.e., the virtual genotype that has the best combination of mean performance and stability.

3. Results

3.1. Total Dry Matter as Influenced by Cultivar, Tillering, and Their Interaction

Analysis of TDM revealed substantial variation among the nine rice cultivars studied (Figure 4a). Mare demonstrated the highest TDM production (3.44 t ha−1), significantly outperforming Alexandros and Dion, which recorded the lowest TDM (2.06 and 1.98 t ha−1, respectively). Ronaldo and Olympiada exhibited strong TDM accumulation (2.98 and 2.75 t ha−1, respectively), while Gloria, Samba, Luna, and Galileo fell within an intermediate range (2.52–2.62 t ha−1) (Figure 4a). These inter-cultivar differences underscore the influence of genetic background on biomass production potential.
When examining the contributions of different tillering levels, Mn was the dominant source of TDM (7.95 t ha−1), significantly exceeding all other tillering levels (Figure 4b). T1 tillers contributed a considerably smaller amount (3.20 t ha−1), with further reductions observed in T2 (1.26 t ha−1), T3 (0.42 t ha−1), and T4 (0.15 t ha−1) (Figure 4b). This declining trend reflects the prioritization of resource allocation to Mn and the diminishing contribution of later-developing tillers to overall biomass.
The interaction between cultivar and tillering level significantly impacted TDM accumulation, indicating that tillering patterns are cultivar-specific (Table 2). While all cultivars exhibited the highest TDM production in Mn, the relative contribution of subsequent tillering levels varied considerably (Table 2). Mare, for example, maintained relatively high TDM production in T1 tillers compared to other cultivars, suggesting a more efficient contribution from primary branches. In contrast, cultivars like Alexandros, Dion, Galileo, and Gloria displayed a steeper decline in TDM contribution from T1 to T4 (Table 2). This differential response highlights the complex interplay between genetic predisposition and developmental processes in determining final biomass yield.
Therefore, optimizing TDM production requires a comprehensive approach that considers both cultivar selection and management practices influencing tillering dynamics. Choosing cultivars with inherently high TDM potential and the ability to maintain contributions from T1 and potentially T2 can be a crucial strategy for maximizing overall biomass yield. Additionally, optimizing agronomic practices to favor Mn development and resource allocation can further enhance TDM production.

3.2. Harvest Index (HI) as Influenced by Cultivar, Tillering, and Their Interaction

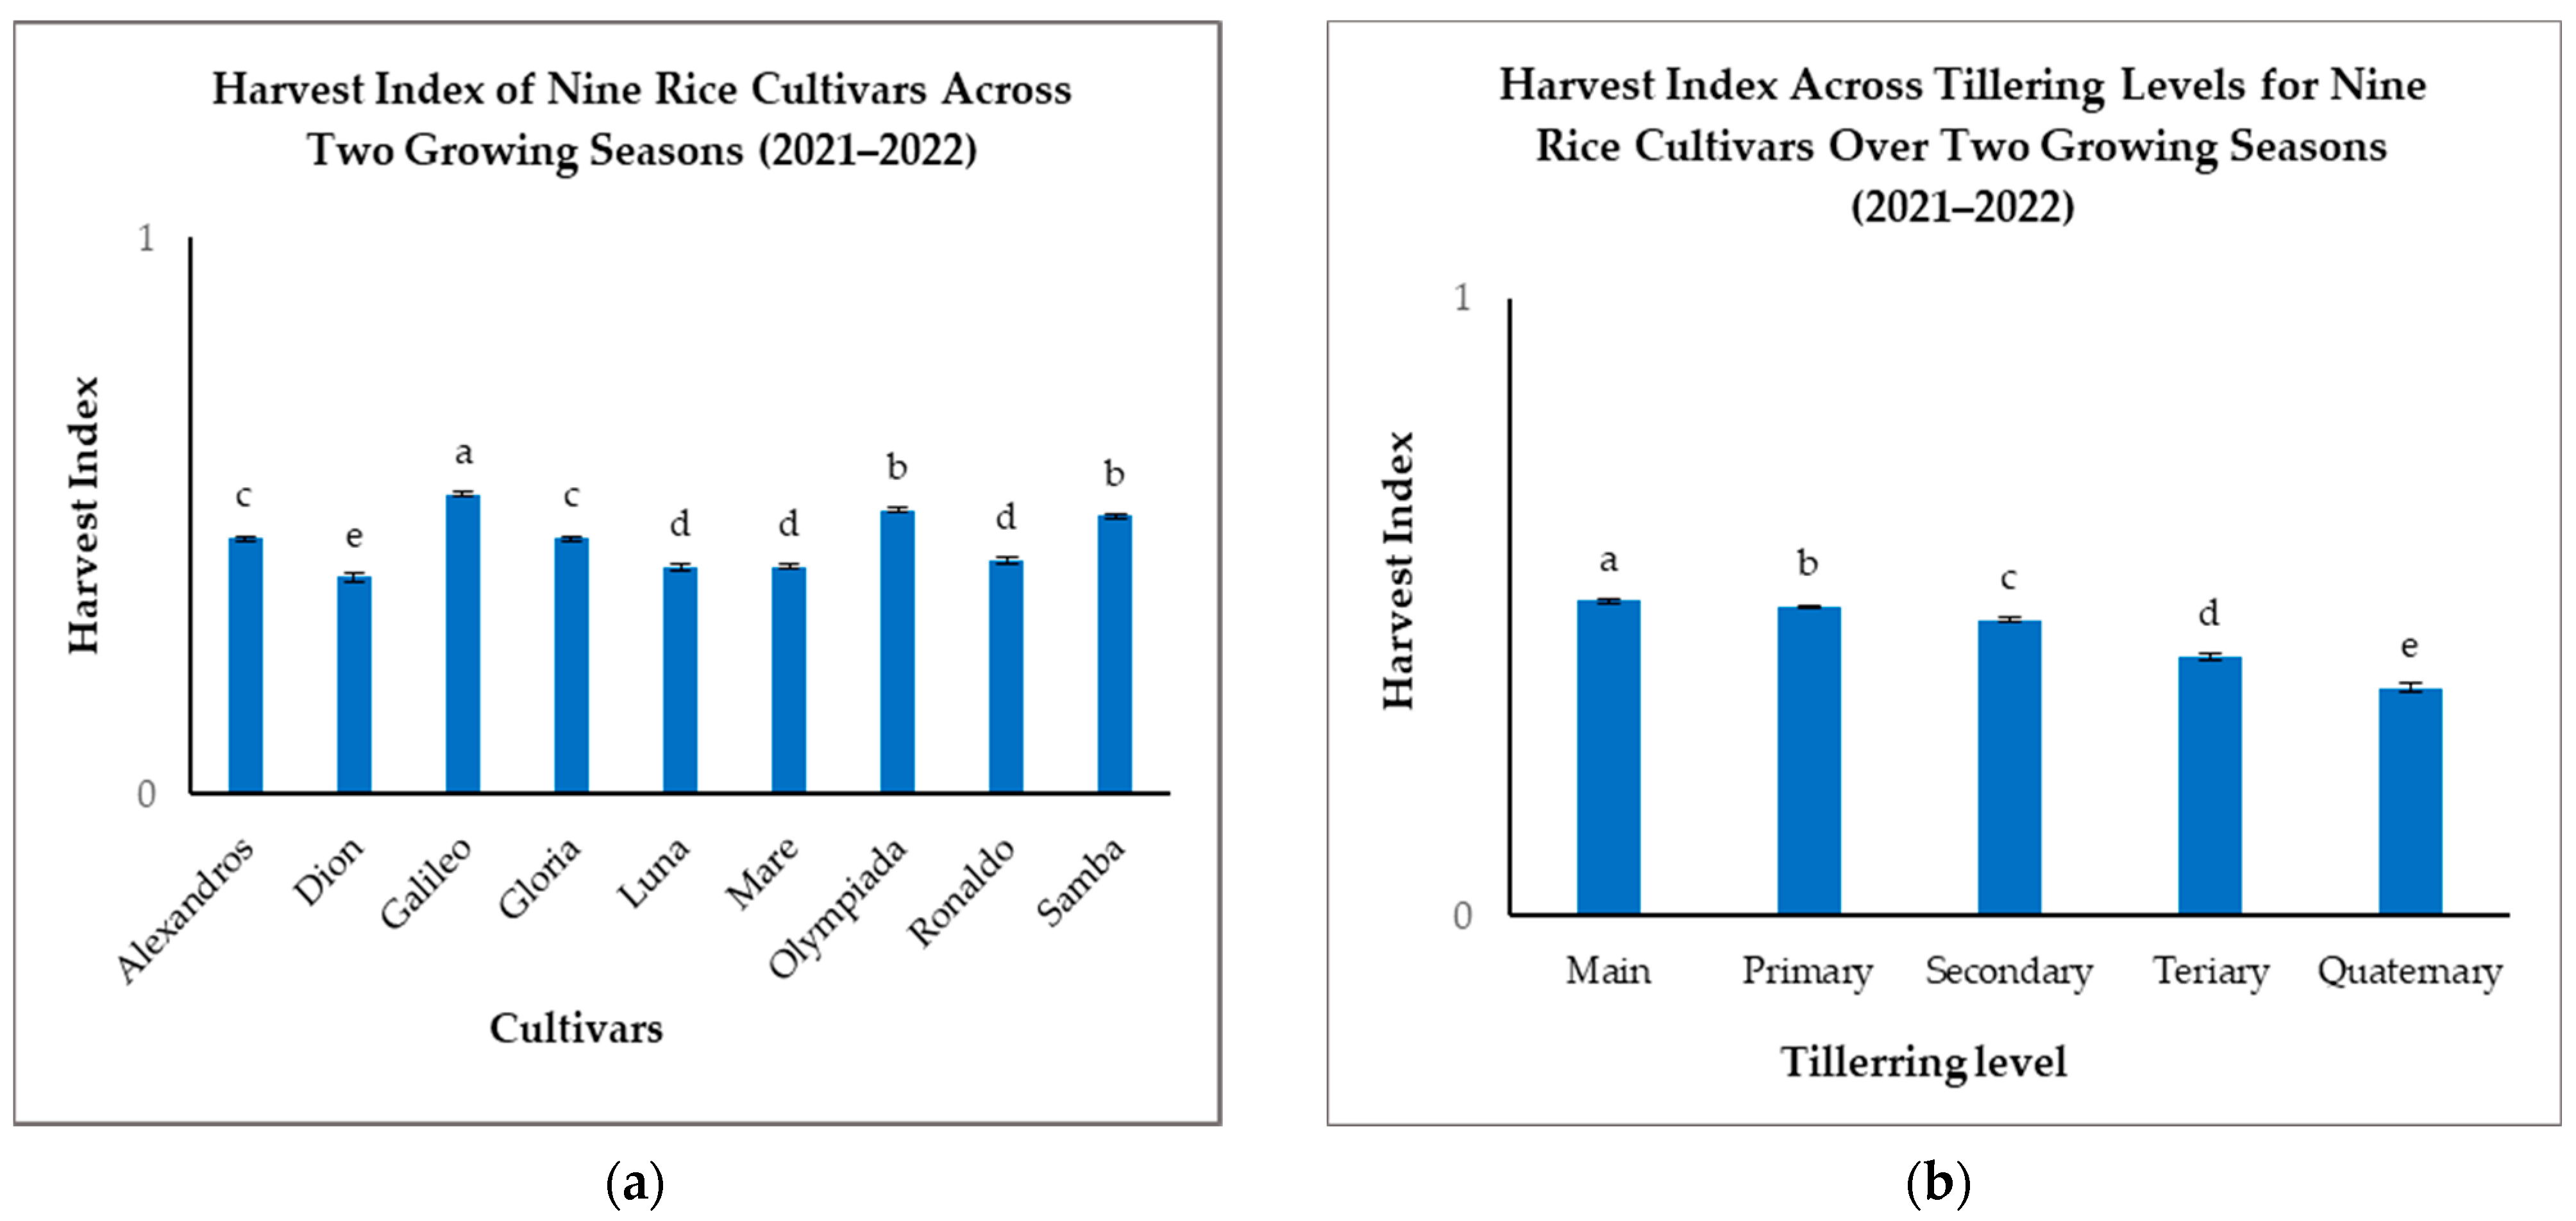
Analysis of the HI revealed significant genotypic variation among the nine rice cultivars (Figure 5a). Galileo exhibited the highest overall HI (0.54), significantly outperforming Dion (0.39), which recorded the lowest (Figure 5a). Samba and Olympiada also demonstrated high HIs (0.50 and 0.51, respectively), indicating efficient partitioning of biomass to grain. Alexandros and Gloria displayed intermediate HIs (0.46), while Luna, Mare, and Ronaldo fell within a lower range (0.41–0.42) (Figure 5a). These differences highlight the genetic influence on resource allocation strategies for grain filling.
When considering the tillering level, we found that Mn consistently exhibited the highest HI (0.51), followed by a gradual decrease with subsequent tillering levels: T1 (0.50), T2 (0.48), T3 (0.42), and T4 (0.37) (Figure 5b). This pattern suggests that Mn prioritizes grain filling more effectively than later-developing tillers, likely due to preferential resource allocation and a longer grain-filling duration.
The interaction between cultivar and tillering level significantly impacted the HI, further emphasizing the complex relationship between genotype and developmental stage. Although Mn generally had the highest HI across all cultivars, the magnitude of decline with subsequent tillering levels varied considerably (Table 3). Galileo, for example, maintained a relatively high HI even in T2 (0.53), indicating consistent resource allocation to grain across different tillering levels. Conversely, Dion showed a pronounced drop in HI from Mn (0.50) to T3 (0.26), suggesting less efficient grain filling in later-developing tillers (Table 3).
These findings underscore the importance of considering both cultivar selection and tillering patterns when aiming to maximize the harvest index. Cultivars with an inherently high HI and the ability to maintain a relatively high HI in T1 and T2 could offer significant advantages for achieving optimal grain production.

3.3. 1000-Grain Weight (1000GW) as Influenced by Cultivar, Tillering, and Their Interaction

Significant variations in 1000GW were observed among the nine rice cultivars (Figure 6a). Galileo exhibited the highest 1000GW (40.08 g), considerably heavier than Mare and Olympiada, which recorded the lowest values (22.9 g and 22.33 g, respectively) (Figure 6a). Samba demonstrated a high 1000GW (38 g), followed by Gloria (36.47 g), Luna (28.66 g), Ronaldo (27.42 g), Alexandros (25.39 g), and Dion (26.52 g) (Figure 6a). This range highlights the substantial genetic influence on grain size.
When analyzing the effect of tillering level, we found that Mn produced the heaviest grains (31.53 g), closely followed by T1 (31.03 g) (Figure 6b). A slight, but statistically significant, reduction was observed in T2 (30.72 g), with more pronounced decreases in T3 (28.9 g) and T4 (26.59 g) (Figure 6b). This pattern suggests that while Mn and T1 maintain similar grain sizes, resource availability or other physiological factors may limit grain filling in later-developing tillers.
The interaction between cultivar and tillering level significantly impacted 1000GW, demonstrating the combined influence of genetics and developmental stage (Table 4). While the general trend of decreasing grain weight with later tillering levels held true for most cultivars, the magnitude of this decrease varied. Galileo consistently produced large grains across all tillering levels, with only a minor reduction from Mn (41.65 g) to T4 (38.52 g) (Table 4). This suggests a strong genetic control over grain size in Galileo, relatively independent of tillering level. Conversely, Luna displayed a more pronounced decline, from 30.85 g in Mn to 25.81 g in T4, indicating greater sensitivity of the grain size to the tillering level in this cultivar (Table 4).
These findings demonstrate the importance of considering both cultivar selection and tillering patterns to maximize grain weight. Selecting cultivars with an inherently high 1000GW and the ability to maintain the grain size across different tillering levels could be a crucial strategy for maximizing yield potential.

3.4. Number of Stems (NOS) as Influenced by Cultivar, Tillering, and Their Interaction

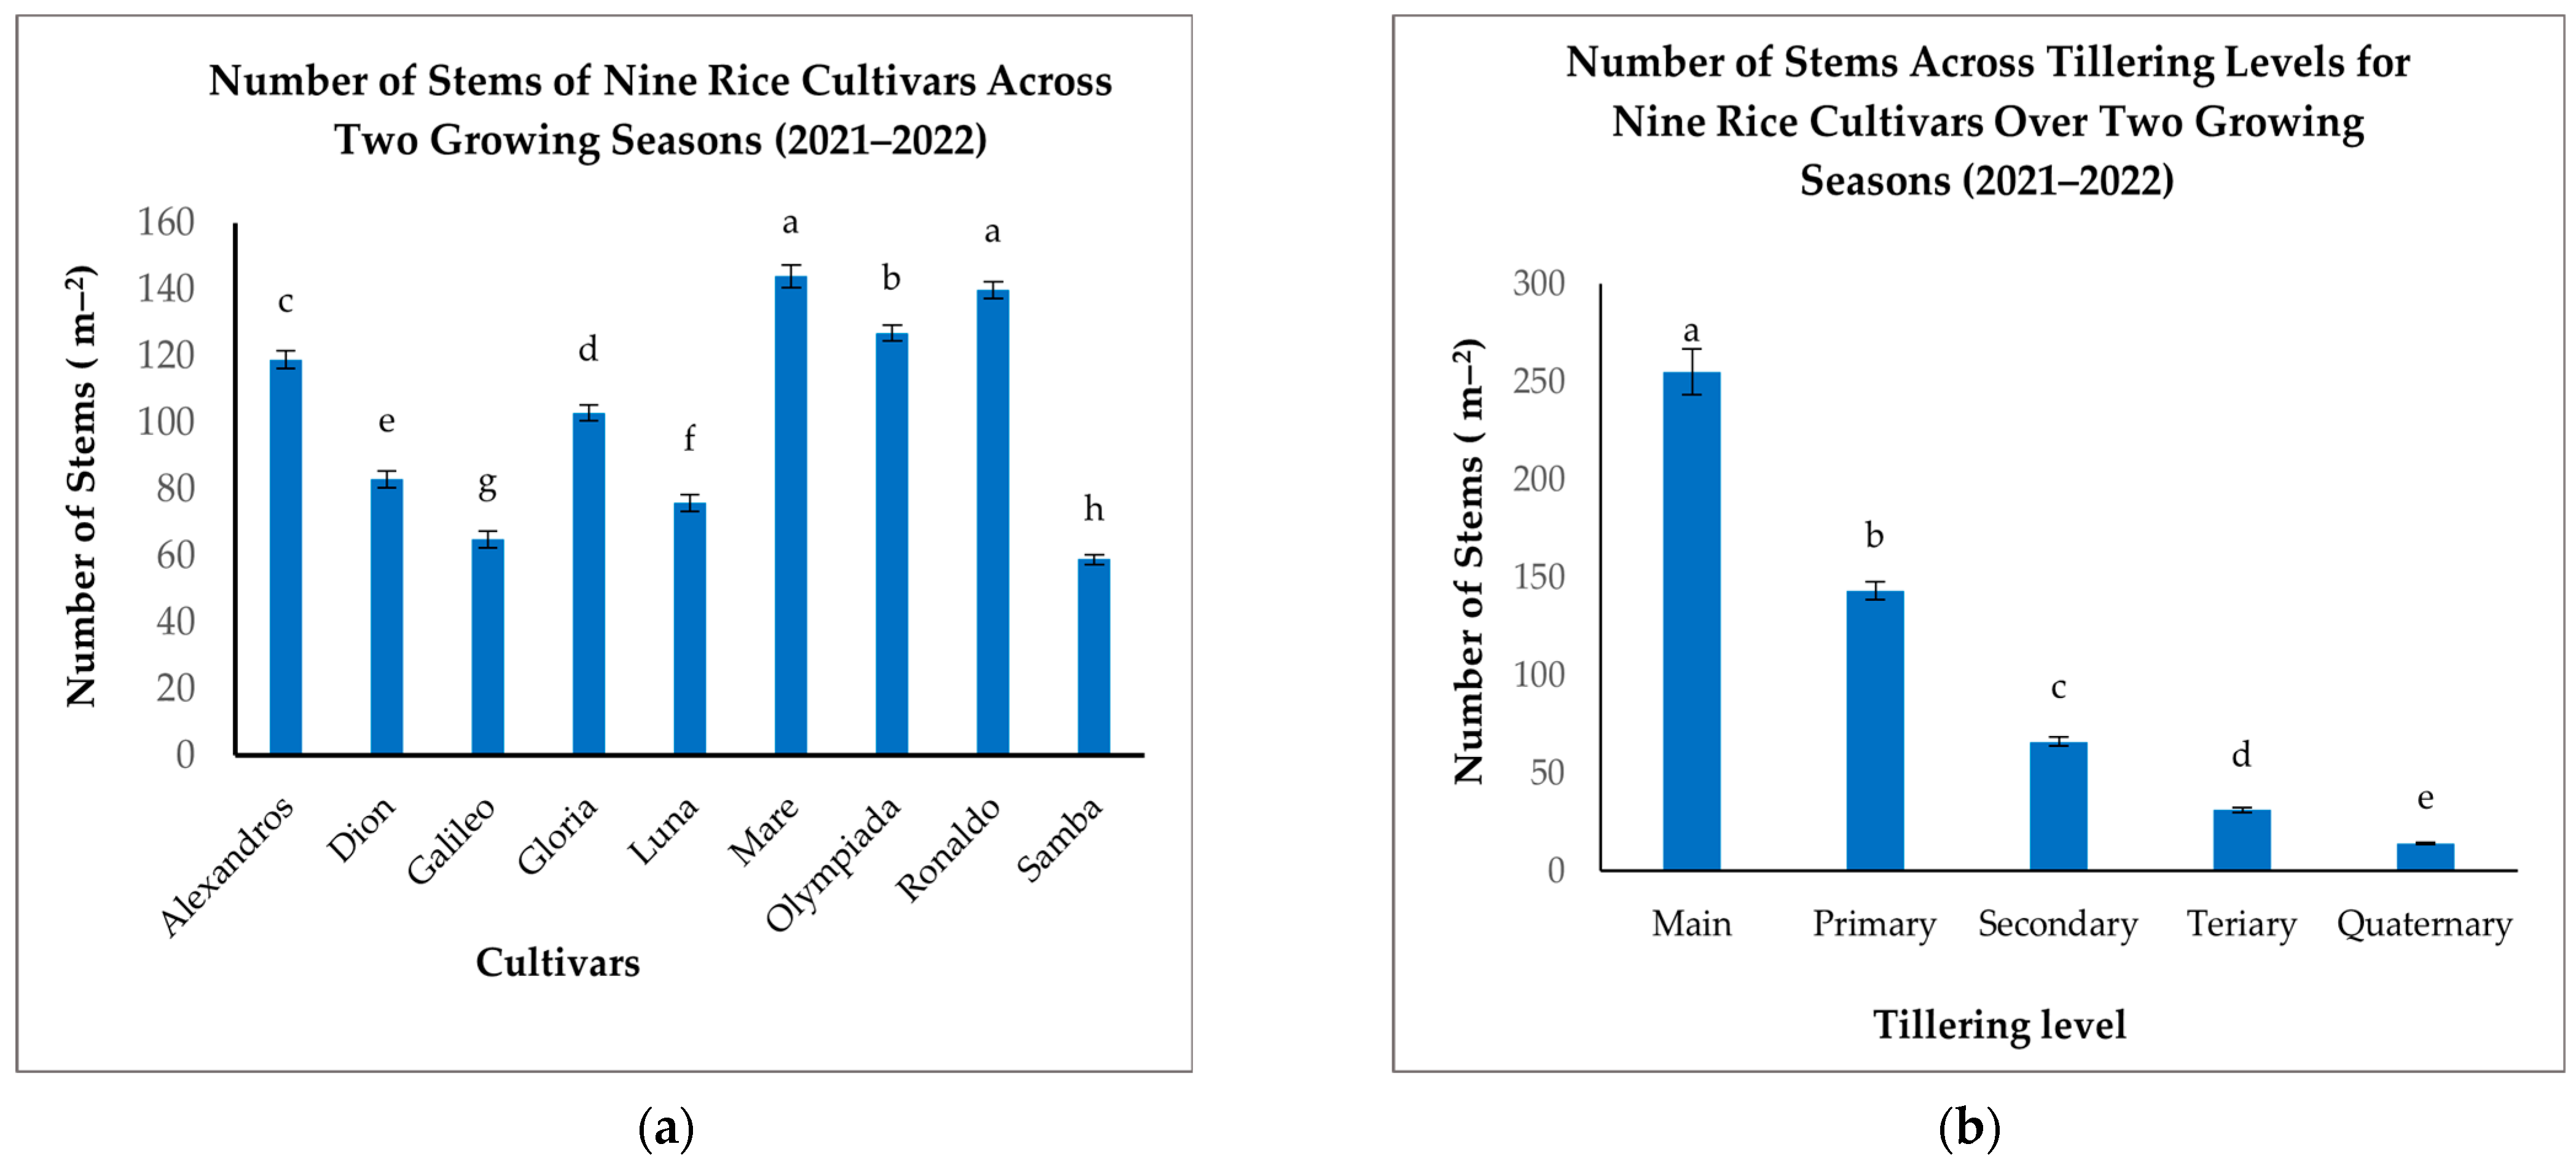
Significant variation in the NOS was observed among the nine rice cultivars (Figure 7a). Mare and Ronaldo exhibited the highest stem densities (144 and 140 m−2, respectively), significantly exceeding Dion and Samba, which recorded the lowest NOS (83 and 59 m−2, respectively) (Figure 7a). Alexandros, Olympiada, Gloria, and Luna displayed intermediate stem densities, ranging from 76 to 127 m−2 (Figure 7a). These results indicate that tillering capacity, a key determinant of the NOS, is significantly influenced by cultivar genetics.
When analyzing the effect of the tillering level, we found that the number of Mn (255 m−2) was substantially higher than all other tillering categories (Figure 7b). T1 comprised a smaller proportion (143 m−2), followed by further decline in T2 (66 m−2), T3 (31 m−2), and T4 (14 m−2) (Figure 7b). This decreasing trend confirms the predominant contribution of Mn to the overall stem density.
The interaction between the cultivar and tillering level also significantly affected the NOS. While Mn was the most numerous across all cultivars, the proportion of subsequent tillers varied considerably (Table 5). For instance, Mare exhibited a relatively high number of T1 (129 m−2) compared to other cultivars, indicating a greater propensity for T1 formation in this cultivar. Conversely, Samba displayed notably low numbers across all tillering levels, particularly in T2 and subsequent tillers, suggesting a restricted tillering capacity (Table 5). These findings highlight the cultivar-specific nature of tillering patterns. Selecting cultivars with appropriate tillering characteristics for specific environments and management practices is crucial for optimizing plant density and maximizing yield potential.

3.5. Grain Yield (Yield) as Influenced by Cultivar, Tillering, and Their Interaction

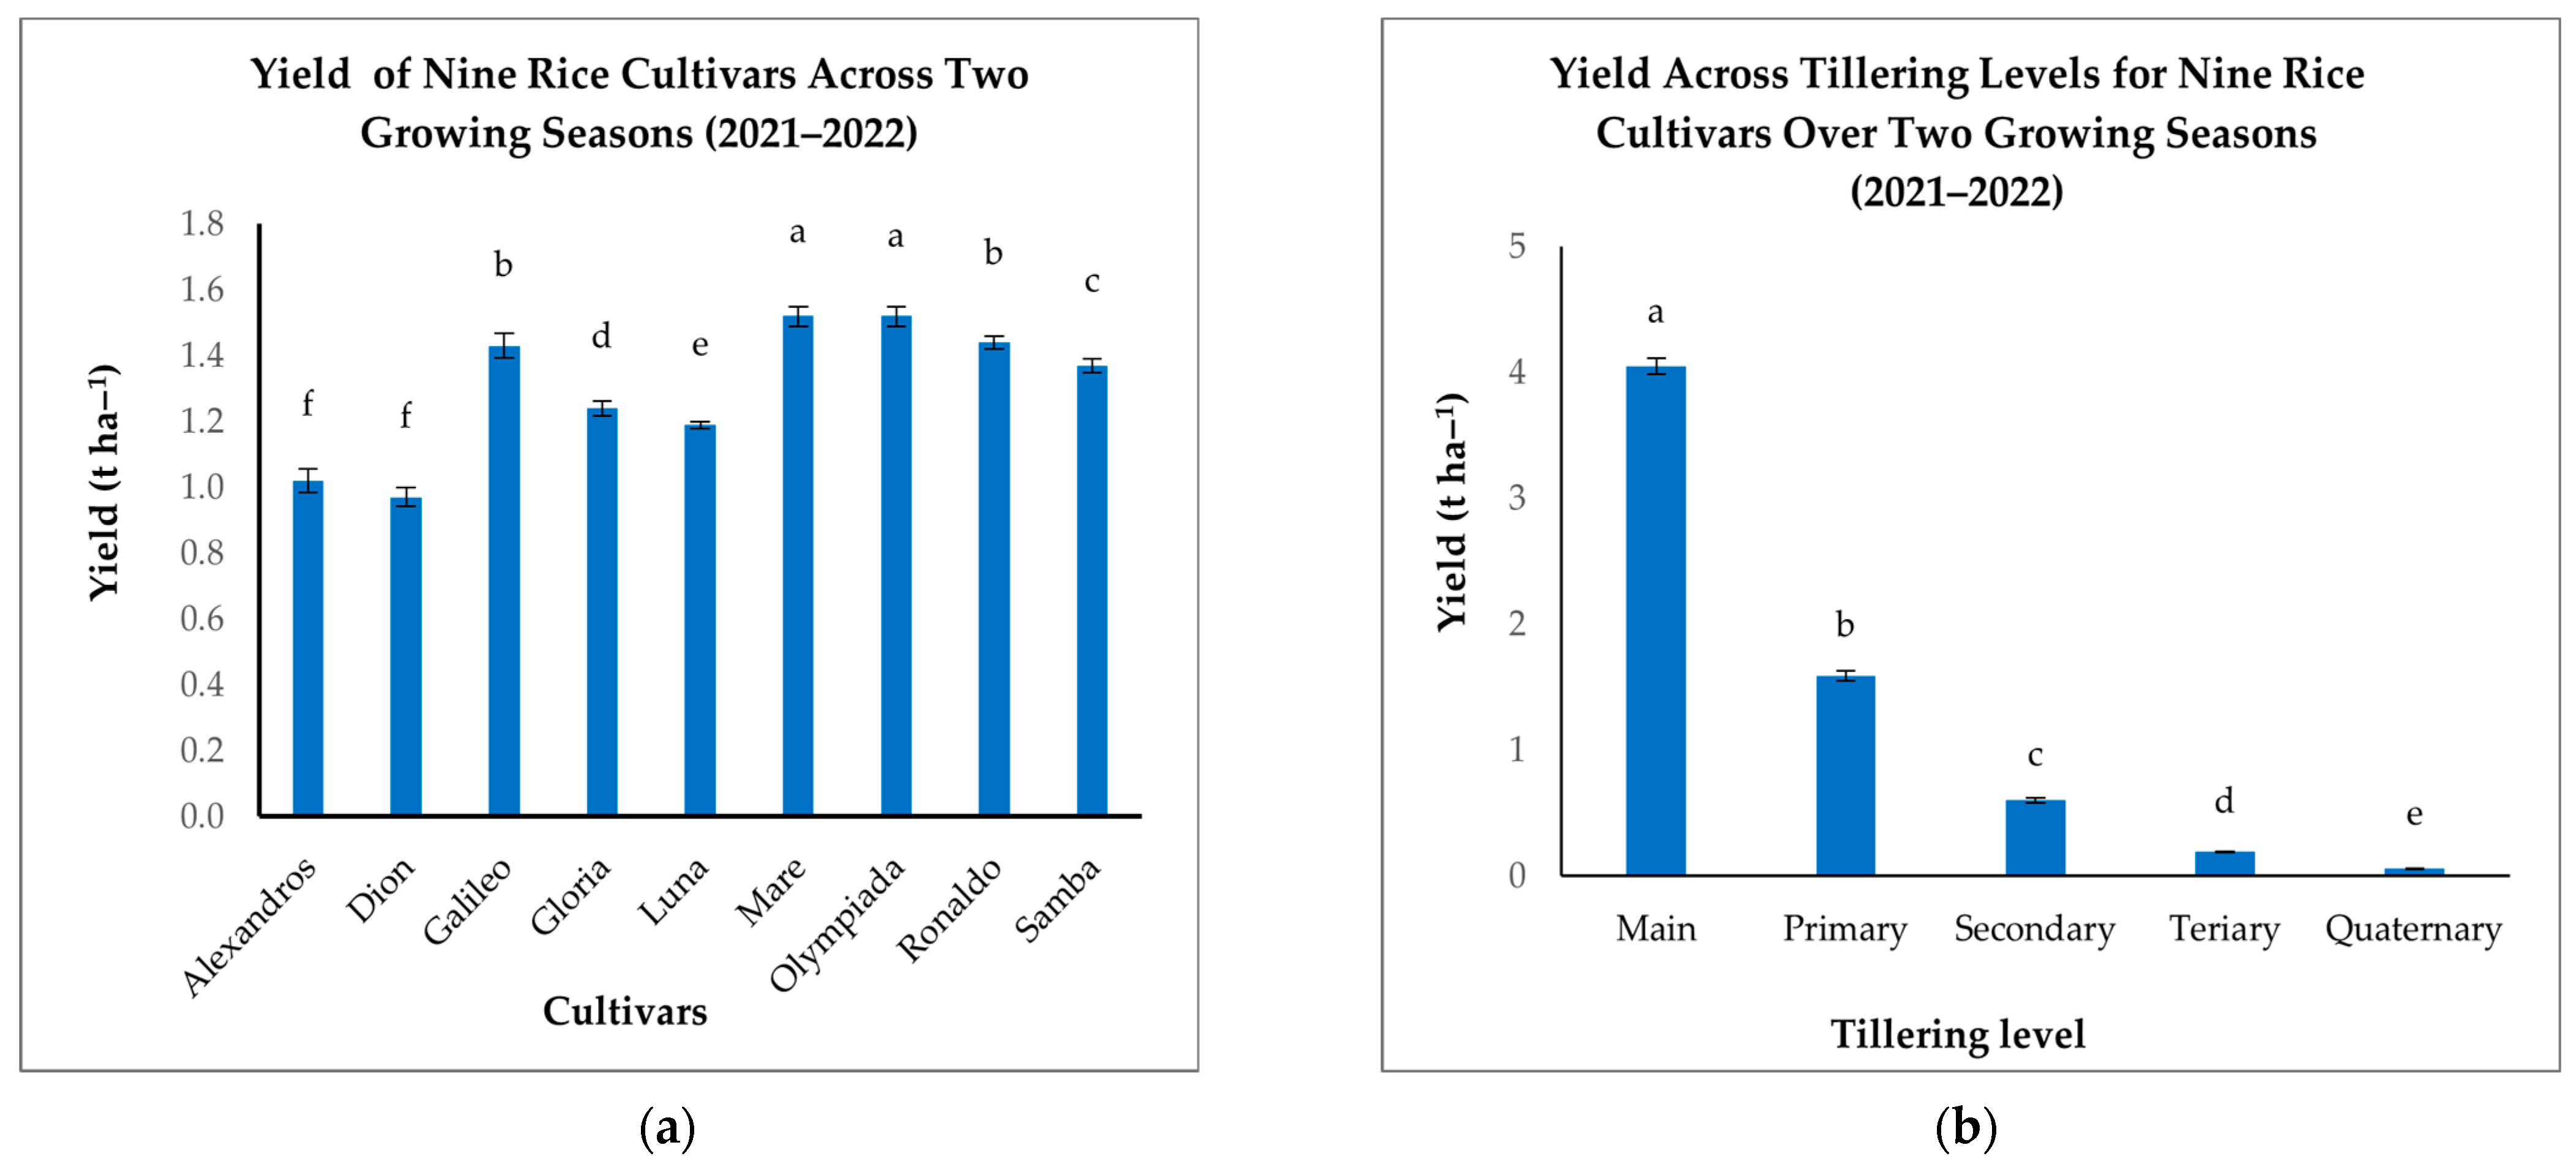
Significant variations in yield were observed among the nine rice cultivars (Figure 8a). Mare and Olympiada achieved the highest yields (1.52 t ha−1 each), significantly outperforming Alexandros and Dion, which recorded the lowest yields (1.02 and 0.97 t ha−1, respectively) (Figure 8a). Galileo and Ronaldo also demonstrated high yields (1.43 and 1.44 t ha−1, respectively), while Samba, Gloria, and Luna fell within an intermediate range (1.37–1.24 t ha−1) (Figure 8a). These results highlight the substantial influence of cultivar genetics on yield potential.
When analyzing the contributions of different tillering levels, we found that Mn was the predominant source of grain yield (4.05 t ha−1), exceeding all other tillering levels (Figure 8b). T1 contributed a considerably smaller amount (1.59 t ha−1), with further reductions in T2 (0.6 t ha−1), T3 (0.19 t ha−1), and T4 (0.06 t ha−1) (Figure 8b). This decline emphasizes the critical role of Mn in determining the overall yield and the diminishing contribution of later-developing tillers.
The interaction between cultivar and tillering level significantly affected grain yield, indicating cultivar-specific tillering patterns and their influence on productivity (Table 6). While Mn consistently provided the highest yield across all cultivars, the relative contributions of subsequent tillers varied. Mare, for example, maintained a relatively high yield contribution from T1 (2.12 t ha−1) compared to other cultivars, suggesting a more effective contribution of primary branches to overall yield. In contrast, cultivars like Alexandros and Dion showed a steeper drop in yield contribution from T1 to T4, indicating a greater reliance on Mn production (Table 6). This differential response highlights the complex interplay between genetic background, developmental processes, and resource allocation in determining the final grain yield.
Therefore, maximizing rice yield necessitates a comprehensive approach considering both cultivar selection and management strategies that influence tillering dynamics. Choosing cultivars with high yield potential and the ability to maintain contributions from T1, and potentially T2, tillers is crucial. Furthermore, optimizing agronomic practices to promote robust Mn development and efficient resource allocation can further enhance grain yield.

3.6. Correlation Analysis of Tillering and Agronomic Traits

The correlation analysis illuminates the strong positive association between the tillering and both yield and TDM production in rice (Figure 9a,b). This relationship is highly significant (p < 0.000), as evidenced by correlation coefficients (ρ) of 0.881 for yield and 0.899 for TDM (Figure 9a,b). These high correlation values indicate a clear trend: a greater number of tillers generally corresponds to increased yield and enhanced biomass accumulation. This positive correlation aligns with the physiological understanding that tillers contribute significantly to the overall photosynthetic capacity of the rice plant. With more tillers, the plant can capture more light energy, leading to increased carbohydrate production through photosynthesis. This surplus in carbohydrates fuels greater biomass accumulation and ultimately contributes to higher grain yields.
In contrast, the relationship between tillering and the harvest index (HI) is more subtle (Figure 9c). While a positive correlation is observed (ρ = 0.444, p < 0.000), its strength is considerably weaker compared to the correlations with yield and TDM (Figure 9a,b). This disparity suggests that although increasing the number of tillers can boost yield, it does not automatically guarantee a proportionally higher HI. The HI, defined as the ratio of grain yield to total plant biomass, reflects the efficiency of the plant in partitioning its resources towards grain production. The weaker correlation between tiller number and the HI indicates that factors beyond tillering, such as environmental conditions and varietal characteristics, play a significant role in determining the balance between vegetative growth and reproductive output. For instance, under stressful conditions like nutrient deficiency or water stress, the plant might prioritize survival and allocate more resources to vegetative growth, even at the expense of HI. Similarly, certain rice cultivars might inherently favor vegetative growth over grain filling, leading to a lower HI despite having a higher number of tillers.
In contrast, a weak negative correlation was observed between tiller number and 1000GW (ρ = − 0.013, p = 0.843) (Figure 9d). This correlation, however, was not statistically significant, indicating a lack of a strong direct relationship between tillering and individual grain weight. This observation implies that the resources allocated to producing and maintaining tillers might not significantly compete with the resources required for grain filling. Other factors, such as genetic predisposition, nutrient availability during grain filling, and environmental conditions, appear to have a greater influence on grain size.

3.7. Regression Analysis: Quantifying the Impact of Tillering on Yield

The regression analysis translated the observed correlations into quantitative relationships, allowing for a more precise estimation of the impact of tillering on yield. The regression equation linking NOS and yield (number of tillers = 26.98 + 57.59 yield) (Figure 9e) indicated that for every unit increase in yield, there was a corresponding increase of approximately 57.59 tillers (Figure 9e). This positive slope quantified the contribution of each additional tiller to the overall yield, suggesting that increasing the tiller number is an effective strategy for enhancing rice productivity.
The regression equation for TDM and NOS (number of tillers = 23.74 + 30.03 TDM) revealed a similar trend (Figure 9f), with each unit increase in TDM associated with an increase of 30.03 tillers. This further substantiated the strong link between tillering and biomass accumulation, indicating that tillers contribute significantly to the overall plant size and TDM production.
The regression analysis for HI (number of tillers = − 144.6 + 540.3 HI) (Figure 9g) showed a much smaller slope compared to yield and TDM (Figure 9e,f), consistent with the weaker correlation observed between tillering and the HI (Figure 9c). This further emphasizes the complex interplay of factors influencing the HI, with tillering being just one piece of the puzzle. While tillering contributes to the yield, its impact on the proportion of biomass partitioned to grain is less pronounced and can be influenced by other genetic, environmental, and management practices.
The regression analysis for 1000GW (Number of tillers = 107.6 − 0.1960 1000GW) (Figure 9h) indicated that for every increase in 1000GW, there was a corresponding decrease in 1000GW. This decrease in 1000GW signified that as the number of tillers increases, the weight of the grains decreases. This suggests that earlier tillers have much heavier grains, while late-appearing tillers have much lighter grains.

3.8. General Linear Model: Deciphering the Influence of the Tiller Type and Cultivar

The general linear model analysis highlighted the importance of considering both developmental and genetic factors when evaluating the impact of tillering on rice performance. The model revealed that both the tiller type (Mn, T2, T3, T4, T5) and cultivar have a significant effect on the tiller number. Mn exhibited the largest number of stems when compared to other tiller types, affirming its crucial role in rice development and yield determination. This aligns with the observation that Mn typically emerges earlier and has a competitive advantage in accessing resources.
The significant cultivar effect underscores the genetic control of tillering capacity. Different rice cultivars possess inherent variations in their tillering potential, which can be exploited through breeding programs to develop cultivars with optimal tillering characteristics for specific environments and management practices.

3.9. Integrating the Results: A Holistic Perspective on Tillering in Rice

These combined analyses provide a comprehensive understanding of the complex interactions between tillering and key agronomic traits in rice. The key takeaways are the following:
Tillering and Yield: A strong positive correlation and regression relationship indicate that increasing the tiller number generally leads to a higher yield and TDM production.
Tillering and Harvest Index: A weaker positive correlation suggests that while tillering contributes to the yield, its influence on the HI is less direct and can be modified by other factors.
Tillering and Grain Weight: The lack of a significant correlation indicates that tillering has minimal direct impact on individual grain weight.
Genetic and Developmental Control: The general linear model reveals the significant influence of both the tiller type and cultivar on the tillering capacity.
These findings have practical implications for rice improvement. Breeding strategies can focus on the following:
  • Optimizing Tiller Number: While maximizing the tiller number is generally beneficial for the yield, breeders need to consider the trade-offs with the HI and potential lodging issues.
  • Enhancing Tiller Productivity: Improving the individual productivity of tillers, particularly later-emerging tillers, can further enhance yield potential.
  • Cultivar Selection: Choosing cultivars with optimal tillering characteristics for specific environments and management practices is crucial for maximizing the yield.
  • Resource Management: Optimizing resource management, such as nitrogen fertilization and water availability, can influence tiller production and resource allocation patterns.

3.10. Multivariate Analysis of Tillering Levels Across the Nine Cultivars

3.10.1. Principal Component Analysis (PCA)

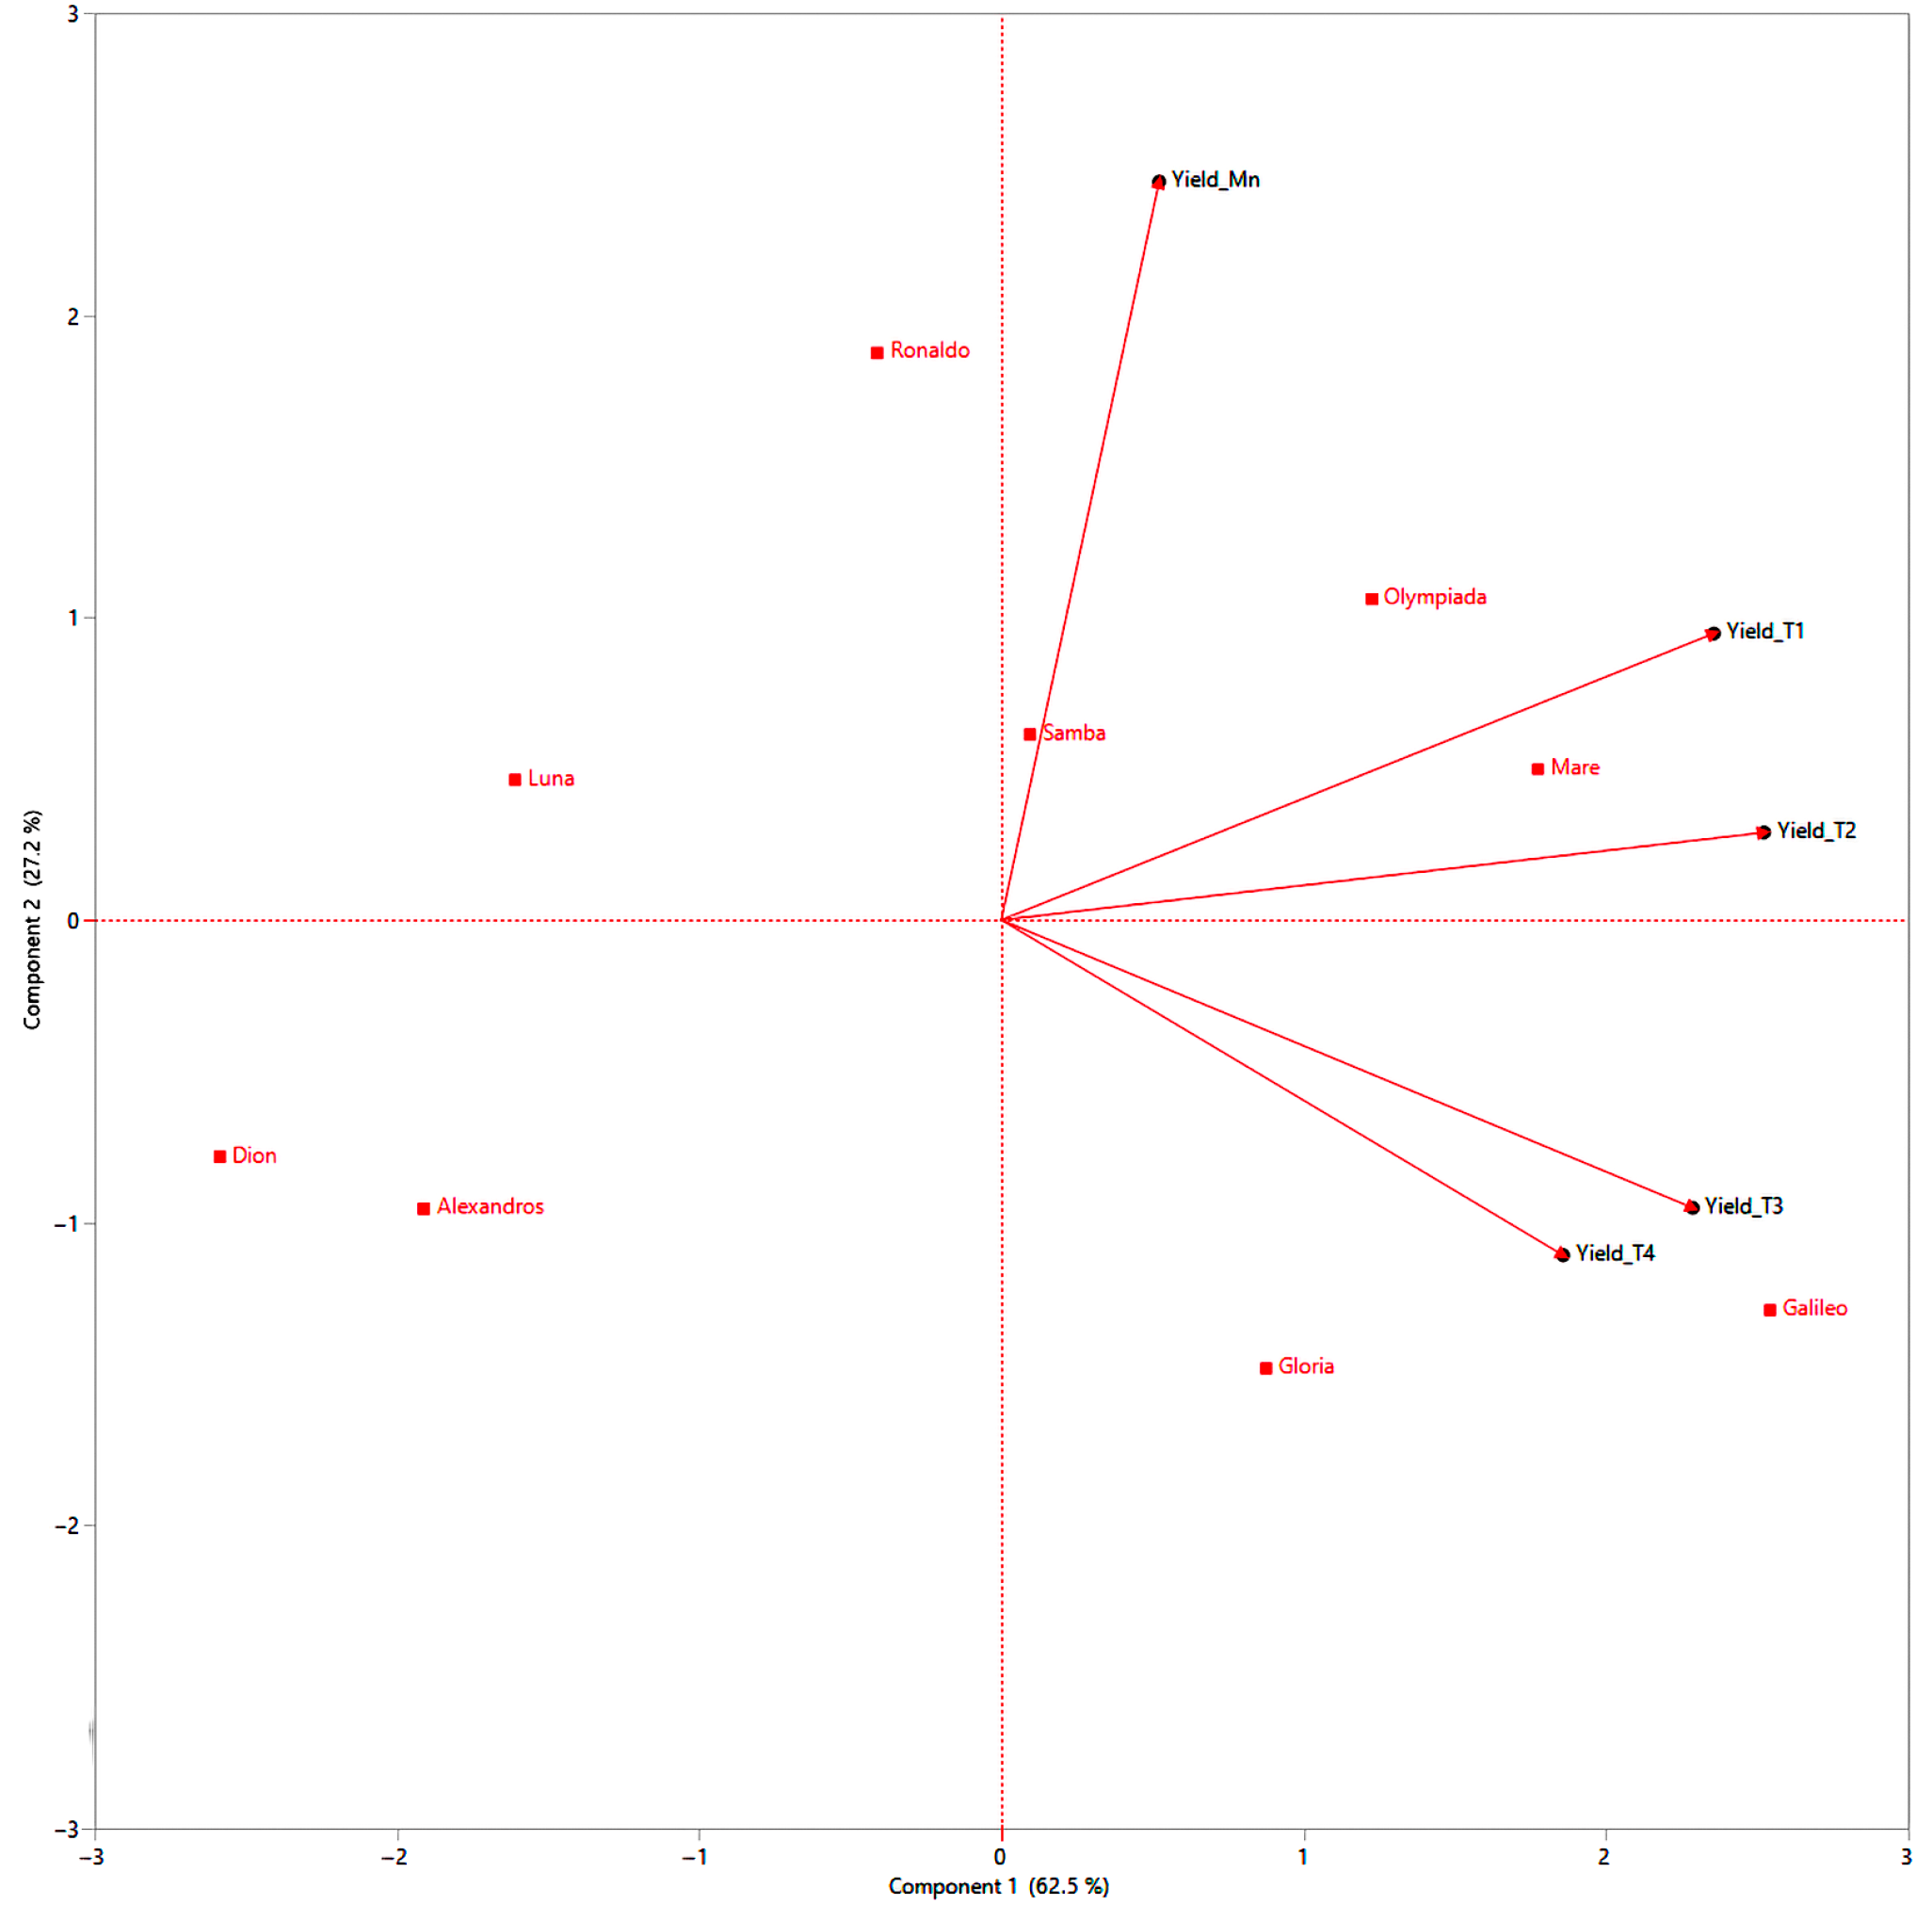
The PCA biplot elucidates the complex relationships between rice cultivars and their tiller-level yields, offering crucial insights into the complex interplay of tillering ability and yield components (Figure 10). The vectors representing yield components (Yield_Mn, Yield_T1, Yield_T2, Yield_T3, Yield_T4) indicate the direction and strength of the correlation between each tiller level’s yield and the principal components (Figure 10). A prominent observation is the clustering of Mn for all cultivars in the upper-right quadrant, characterized by high positive loadings on both principal components (Figure 10). This signifies their significant contribution to overall yield and aligns with established research highlighting the dominance of Mn in rice productivity [64]. The vectors for Yield_Mn point strongly towards this cluster, further emphasizing the positive correlation between Mn yield and overall performance (Figure 10).
T1 generally clusters near the origin, indicating a moderate contribution to the yield compared to Mn. The Yield_T1 vector points towards the positive side of PC1, suggesting a positive, albeit weaker, correlation with overall yield (Figure 10). T2 exhibits a more dispersed distribution, with some cultivars like Mare and Olympiada positioned closer to the Mn cluster, implying relatively higher yields from their T2, while others like Alexandros and Dion fall further away, indicating lower T2 yields (Figure 10). The Yield_T2 vector generally points towards the positive side of PC1 but with a smaller magnitude than Yield_Mn and Yield_T1, reflecting the diminishing contribution of T2 to overall yield (Figure 10).
Tertiary and quaternary tillers are primarily located on the negative side of PC1, indicating their low contribution to overall yield. The vectors for Yield_T3 and Yield_T4 are relatively short and point towards the negative side of PC1, confirming their negative or negligible impact on overall yield (Figure 10). The biplot reveals that cultivars like Ronaldo, Mare, and Olympiada, while exhibiting high Mn yields, show a pronounced decline in yield with increasing tiller order. This suggests a strategy of prioritizing resource allocation to Mn, potentially at the expense of later tillers (Figure 10). In contrast, cultivars like Galileo, Samba, and Gloria, though having moderate Mn yields, exhibit a less dramatic decline in yield across tillers, implying a more balanced resource allocation. Finally, cultivars like Alexandros, Dion, and Luna demonstrate lower yields across all tillering levels, indicating limitations in their overall yield potential (Figure 10).
Based on the PCA biplot and considering the importance of tillering for yield, we can categorize the rice cultivars into three distinct clusters:
  • Cluster 1: Mn Dominant: This cluster includes Samba and Ronaldo, characterized by high Mn yields and a steep decline in subsequent tiller yields. This suggests a focus on maximizing Mn productivity, making them suitable for environments where maximizing the individual plant yield is paramount. Breeding efforts could explore ways of improving the performance of early tillers or suppressing late, unproductive tillers (Figure 10).
  • Cluster 2: Balanced Tillering: This cluster comprises Mare, Olympiada, Galileo, and Gloria, demonstrating moderate Mn yields and a more gradual decline in tiller yields. This indicates a more balanced resource allocation strategy, potentially advantageous in environments where consistent performance across tillers is favored over maximizing the individual plant yield. Further enhancing the yield potential of all tillers could be a breeding target for this group (Figure 10).
  • Cluster 3: Low Overall Yield: This cluster includes Alexandros, Dion, and Luna, exhibiting consistently lower yields across all tillering levels. This suggests fundamental limitations in yield potential, possibly related to nutrient use efficiency or stress tolerance. Breeding strategies should focus on improving the overall yield capacity of these cultivars, rather than manipulating tillering patterns (Figure 10).

3.10.2. Hierarchical Clustering on Principal Components (HCPC)

HCPC revealed distinct groupings of rice cultivars based on their tillering levels and associated agronomic traits, offering valuable insights into the relationship between tillering ability and yield components (Figure 11). Three primary clusters emerge from the dendrogram (Figure 11). Cluster I predominantly consists of Mn (Mn) across almost all cultivars, exhibiting high values (indicated by red shades in the heatmap) for yield, ΤDM, and NOS, indicating their dominant contribution to overall plant productivity (Figure 11). This corroborates previous research emphasizing the importance of Mn in TDM accumulation and yield [64]. The inclusion of some early tillers (T1) of Gloria (Gl), Galileo (Ga), and Samba (S) within this cluster suggests that these cultivars may also achieve substantial productivity from their T1, approaching the levels observed in Mn of other cultivars (Figure 11).
Cluster II comprises a mix of late-emerging tillers (T2, T3, and T4) from Ronaldo (R), Dion (Di), Luna (L), and Alexandros (Al), along with some T3 and T4 tillers of Mare (M) and Olympiada (O) (Figure 11). This cluster is characterized by generally lower values for all traits, reflecting the decline in productivity observed in later tillers, consistent with previous studies [21,22]. The inclusion of Mare and Olympiada’s later tillers in this cluster suggests that these otherwise high-yielding cultivars experience a more significant drop in productivity in their later tiller compared to their Mn and early tillers (Figure 11).
Finally, Cluster III presents a more complex grouping, encompassing the T1 tillers of all cultivars, along with the T2, T3, and T4 of Galileo, Samba, and Gloria (Figure 11). This cluster generally exhibits moderate values for yield, TDM, and NOS, while showing relatively higher values for HI and 1000GW, especially in T1. This suggests that while T1 of these cultivars might not achieve the same high yields as Mn of Cluster I cultivars, they exhibit efficient resource allocation towards grain filling, resulting in heavier grains (Figure 11). The grouping of later tillers of Galileo, Samba, and Gloria within this cluster reinforces their overall lower productivity compared to other cultivars (Figure 11).
This hierarchical clustering analysis reveals that a high tillering ability, solely based on tiller number, is not necessarily linked to a high yield. While Mn consistently contributes significantly, the productivity of subsequent tillers varies depending on the cultivar’s genetic background. This highlights the importance of considering not only the number of tillers but also their individual contribution to the yield when assessing a cultivar’s overall productivity. Breeding efforts should focus on optimizing the performance of both Mn and early tillers while potentially suppressing the formation of less productive late tillers to maximize resource utilization and achieve higher yields.

3.10.3. Genotype Main Effect–Genotype by Environment Interaction Analysis (GGE)

The GGE biplot analysis explained 100% of the total variability, indicating a strong explanatory power of the model (Figure 12). Cultivars such as Olympiada and Mare exhibited close alignment with the average environment coordinate (AEC), reflecting their high stability and adaptability across both years (Figure 12). Conversely, Alexandros and Dion were positioned further away from the ideal genotype vector, highlighting their lower yield potential (Figure 12).

4. Discussion

4.1. Tillering Performance and Implications for Breeding

Tillering, a complex and dynamic process in rice, plays a crucial role in determining yield potential. Our findings reveal significant heterogeneity among tillers concerning physiological parameters, consistent with previous reports [26]. This heterogeneity underscores the complexity of tillering and its impact on overall plant performance.
Our results clearly demonstrate a hierarchical pattern of tiller contribution to both TDM and grain yield. Consistent with the findings of Wu et al. (1998) [69], Mn and T1 exhibited significantly higher TDM accumulation compared to later-emerging tillers (T2, T3, and T4). This pattern was observed across all cultivars evaluated, highlighting the dominance of Mn and T1 in biomass production.
The performance of specific cultivars, such as Ronaldo and Mare, provides further insights into optimal tillering strategies. Ronaldo, exhibiting the highest Mn yield (4.71 t ha−1), exemplifies the potential of maximizing Mn productivity. This suggests that breeding programs focused on enhancing individual Mn yield could offer a viable strategy for increasing overall productivity. Mare, on the other hand, demonstrated a different approach, achieving a high average grain yield (1.52 t ha−1). This likely reflects a more balanced resource allocation strategy across tillers. These contrasting strategies—maximizing the individual Mn yield (Ronaldo) versus maintaining a consistent performance across tillers (Mare)—offer valuable insights for breeding programs, highlighting different approaches to optimizing yield depending on environmental conditions and target traits.
In addition, the observed decline in yield and TDM with an increasing tiller order, coupled with the consistently higher values for Mn and T1 across all cultivars, strongly emphasizes the critical role of early tiller development in maximizing yield potential.
The consistent decline in yield with late-appearing tillers aligns with the concept of hierarchical grain filling [70], where earlier-emerging tillers have a competitive advantage in resource acquisition and grain development [71]. This reinforces the importance of optimizing early-season tillering for maximizing the overall yield potential.
This study acknowledges the limited contribution of late-emerging tillers to the overall yield. This is attributed to several factors, including increased competition for resources from earlier, more established tillers, weaker root systems in late tillers, and limited time for grain filling and maturation before harvest [26,72].
The relationship between the number of stems and grain yield was also investigated. The positive correlation between the stem number and yield, observed in most cultivars, agrees with previous findings [73]. However, the case of Alexandros, which exhibited high stem numbers but low yield, highlights that effective tillering, not just the total tiller number, is crucial for yield optimization [74].
This study’s findings on the harvest index (HI) are consistent with prior research [75], demonstrating the limited contribution of late-emerging tillers to grain yield due to immature panicles at harvest. This further emphasizes the importance of optimizing Mn and T1 to maximize the HI and overall yield. The low numbers of T3 and T4 observed in our study are also in line with previous reports [63,69], confirming their limited role in yield determination. The findings on the relationship between nitrogen management and the HI [72], highlighting the negative impact of excessive late tiller formation on the HI, underscore the need for balanced nitrogen application strategies.

4.2. Cultivar Performance and Implications for Breeding

Rice cultivars exhibit inherent genetic and phenotypic variations, which influence their yield. Our findings corroborate previous research [69] demonstrating significant variations in TDM accumulation among rice cultivars. In our study, Mare and Ronaldo exhibited the highest TDM, correlating with their superior tillering capacity. Conversely, Alexandros and Dion, despite moderate tillering, produced lower TDM, underscoring that the tiller number alone does not dictate biomass accumulation. Similarly, our results align with previous findings [69] showing significant cultivar differences in grain yield.
Olympiada and Mare consistently achieved the highest yields, significantly outperforming other cultivars. These two cultivars also demonstrated greater stability across the two growing seasons, as revealed by GGE biplot analysis. This reinforces the value of GGE biplot analysis as a tool for assessing genotype stability and performance [76,77].
Genotype–environment interactions (GxE) are crucial considerations in rice breeding, particularly for enhancing performance across diverse climates [62,78]. Our study captured some level of GxE interaction. Future research explicitly incorporating GxE analysis, using multiple locations or controlled environment studies, would further strengthen our understanding of cultivar responses to environmental variations.
Our findings contribute to the evolving understanding of the ideal plant architecture in rice. Specifically, while cultivars like Mare and Ronaldo demonstrated a high tillering capacity, their success was not solely attributable to the tiller number. Rather, their efficient conversion of tillers into biomass and grain yield, combined with the stability of Mare across seasons, suggests that a balanced approach to tillering is more effective than simply maximizing tiller counts. This aligns with previous studies [74] showing that effective tillers, rather than the total tiller number, are crucial for maximizing the grain yield. The contrasting performance of cultivars like Alexandros, with high tiller numbers but low yields, further reinforces this point.
The harvest index (HI), a crucial indicator of resource partitioning efficiency [79], also exhibited significant cultivar variations. While several studies have highlighted the role of crop management and environmental factors in influencing the HI [80,81], our findings, consistent with previous research [62,82], demonstrate a strong genetic component. The contrasting HI values observed among cultivars grown under the same environmental conditions underscore the genetic basis for this trait. For instance, Samba, despite having the lowest number of stems, exhibited a high HI and good yield, indicating the efficient transfer of assimilates to grains. Conversely, Mare, despite high tillering and yield, had a low HI, suggesting the potential for improvement in resource allocation. Furthermore, the observed variations in HI support previous research [83] showing that the HI can be negatively correlated with TDM under high biomass production. This highlights the complex interplay between biomass accumulation and resource partitioning and emphasizes the need for a balanced approach in breeding programs.
The study also evaluated the 1000-grain weight (1000GW), another important yield component. The observed differences in 1000GW among cultivars confirm the genetic influence on this trait [82,84]. While environmental factors can also affect 1000GW, the consistent differences among cultivars grown under similar conditions suggest a strong genetic basis. This aligns with previous research [85] showing that Japonica cultivars tend to have a higher 1000GW than Indica cultivars. However, in our study, the distinction between Japonica and Indica types was less clear, with both types exhibiting considerable variation in 1000GW.

4.3. The Interactions Between Cultivar and Tillering in Determining the Rice Yield

The interaction between cultivar and tillering level significantly influences yield components. Consistent with previous research [26,70], grain yield generally declined with an increasing tiller order (Mn > T1 > T2 > T3 > T4). However, the magnitude of this decline varied among cultivars, indicating genotype-specific tillering efficiencies. For instance, while Alexandros, Dion, Luna, Ronaldo, and Samba exhibited similar yields across T3 and T4, other cultivars showed more pronounced declines.
The performance of Ronaldo and Mare offers contrasting examples of successful tillering strategies. Ronaldo achieved the highest Mn yield (4.71 t ha−1), demonstrating the potential of maximizing Mn productivity. Conversely, Mare achieved a high overall yield (1.52 t ha−1) through a more balanced contribution across tillers, indicating a different optimization strategy. These contrasting patterns highlight the possibility of either maximizing the individual Mn yield or achieving balanced contributions from multiple tillers. The consistent dominance of Mn and T1 for these metrics across most cultivars underscores the importance of early tiller development for maximizing productivity.
The tiller number has been linked to the rice yield [63,69], but our study reinforces that the effective, rather than total, tiller number is crucial. This aligns with the importance of effective tillers, as highlighted by Dutta et al. (2002) [74]. Our observation that only four cultivars (Gloria, Mare, Olympiada, and Ronaldo) exceeded the mean number of T3 and T4, while also exhibiting high grain yields, suggests a link between the capacity to produce later tillers and overall yield potential. This nuance could be further investigated to determine if specific cultivars are better at utilizing later-emerging tillers.

4.4. Multivariate Analysis of Tillering and Cultivar Performance

Multivariate analyses, including PCA, HCPC, and GGE biplot, provided a comprehensive view of the complex relationships between cultivars, tillering levels, and agronomic traits. These analyses confirmed the dominance of Mn for yield, the substantial contribution of T1, and the diminishing role of later tillers (T2, T3, T4) in most cultivars. This hierarchical pattern was consistently observed across the multivariate analyses, reinforcing the importance of early tiller development.
The contrasting performance of Ronaldo and Mare offers valuable insights into optimal tillering strategies. Ronaldo, with the highest Mn yield (4.71 t ha−1), exemplifies a strategy focused on maximizing individual Mn productivity. This approach could be particularly effective in environments where conditions favor strong Mn development. Conversely, Mare, while having a slightly lower Mn yield, demonstrated a high average yield (1.52 t ha−1). This suggests a more balanced resource allocation strategy across tillers, which might be advantageous in environments with fluctuating conditions.
The consistent trend of a declining yield and TDM with later tiller orders, coupled with the superior performance of Mn and T1 across most cultivars, directly supports the conclusion that prioritizing early tiller development is crucial for maximizing productivity.
Investigating traits like tiller emergence timing, resource allocation patterns [26,72], and sink capacity could shed light on the mechanisms underlying cultivar-specific tillering efficiencies. Moreover, explicitly comparing the observed tillering patterns with the “new plant type” ideotype [44] would contextualize the findings within current breeding paradigms.

5. Conclusions

This study reveals critical insights into tillering dynamics in Mediterranean rice cultivation, demonstrating that main stems and primary tillers consistently outperform later-forming tillers across all measured traits. Our findings show that the yield potential depends on efficient resource allocation patterns. The superior performance of Mare and Olympiada (both 1.52 t ha−1) resulted from balanced resource distribution across tillers, while Ronaldo (1.44 t ha−1) achieved comparable productivity through an exceptionally high main stem yield (4.71 t ha−1), demonstrating that multiple tillering strategies can achieve high productivity.
Multivariate analyses identified distinct cultivar clusters based on tillering patterns, providing novel criteria for cultivar selection in breeding programs. These findings suggest that breeding strategies for Mediterranean environments should prioritize optimizing early tiller productivity rather than maximizing tiller numbers. Future breeding efforts should focus on cultivars exhibiting strong main stem and primary tiller development, coupled with efficient resource allocation, to enhance yield stability under Mediterranean conditions.

Author Contributions

Conceptualization, D.K.; Methodology, A.K., I.M., and D.K.; Software, K.K., I.M., S.G., E.N., and D.K.; Validation, K.K., I.M., S.G., E.N., and D.K.; Formal Analysis, A.K., I.M., S.G., E.N., and D.K.; Data Curation, A.K., K.K., I.M., E.N., and D.K.; Writing—Original Draft, A.K.; Writing—Review and Editing, K.K., I.M., S.G., E.N., and D.K.; Visualization, D.K.; Supervision, D.K.; Project Administration, D.K.; Funding Acquisition, D.K. All authors have read and agreed to the published version of the manuscript.

Funding

This research was funded under the ‘Innovation Investment Schemes’ in the framework of the Operational Program of Central Macedonia 2014–2020 and co-funded by the European Social Fund through the National Strategic Reference Framework. Project code ΚΜΡ6-0234326, MIS 5136522, project acronym “RICECUBE”.

Institutional Review Board Statement

Not applicable.

Data Availability Statement

The original contributions presented in this study are included in the article. Further inquiries can be directed to the corresponding author(s).

Acknowledgments

This research would not have been possible without the invaluable contributions of Dimitris Ntanos, whose initial idea laid the foundation for this paper. We also extend our gratitude to Vasiliki Ampatzi, Paschalini Ampatzi, Christos Plastiras, Nikos Plasstiras, and Athanasios Koumkoudis for their essential support and contributions.

Conflicts of Interest

The authors declare no conflicts of interest. The funders had no role in the design of this study; in the collection, analyses, or interpretation of data; in the writing of the manuscript; or in the decision to publish the results.

References

  1. Khush, G.S. What It Will Take to Feed 5.0 Billion Rice Consumers in 2030. Plant. Mol. Biol. 2005, 59, 1–6. [Google Scholar] [CrossRef] [PubMed]
  2. Organisation for Economic Co-Operation and Development (OECD). Available online: https://www.oecd.org/en/publications/oecd-fao-agricultural-outlook-2021-2030_19428846-en.html (accessed on 23 August 2024).
  3. Alexandratos, N.; Bruinsma, J. FAO World Agriculture Towards 2030/2050: The 2012 Revision; ESA Working paper No. 12-03; FAO: Rome, Italy, 2012; Available online: https://www.fao.org/global-perspectives-studies/resources/detail/en/c/411108/ (accessed on 11 July 2024).
  4. Zhu, C.; Kobayashi, K.; Loladze, I.; Zhu, J.; Jiang, Q.; Xu, X.; Liu, G.; Seneweera, S.; Ebi, K.L.; Drewnowski, A.; et al. Carbon Dioxide (CO2) Levels This Century Will Alter the Protein, Micronutrients, and Vitamin Content of Rice Grains with Potential Health Consequences for the Poorest Rice-Dependent Countries. Sci. Adv. 2018, 4, eaaq1012. [Google Scholar] [CrossRef] [PubMed]
  5. Sandhu, S.S.; Mahal, S.S.; Vashist, K.K.; Buttar, G.S.; Brar, A.S.; Singh, M. Crop and Water Productivity of Bed Transplanted Rice as Influenced by Various Levels of Nitrogen and Irrigation in Northwest India. Agric. Water Manag. 2012, 104, 32–39. [Google Scholar] [CrossRef]
  6. Ata-Ul-Karim, S.T.; Yao, X.; Liu, X.; Cao, W.; Zhu, Y. Development of Critical Nitrogen Dilution Curve of Japonica Rice in Yangtze River Reaches. Field Crops Res. 2013, 149, 149–158. [Google Scholar] [CrossRef]
  7. Cereals for Grain—ELSTAT. Available online: https://www.statistics.gr/en/statistics/-/publication/SPG06/- (accessed on 11 December 2024).
  8. Map of Rice Cultivation in Greece. Available online: http://wwww.minagric.gr/greek/agro_pol/Maps/rizi1.htm (accessed on 19 August 2024).
  9. Cereal Statistics—Greece. Available online: https://www.minagric.gr/for-farmer-2/crop-production/dimitriaka/946-statistikadimitriakon (accessed on 11 December 2024).
  10. Ali, O.A.M.; Zayed, B.A.; Abou El-Enin, M.M.M.; Sheikha, A.F.E.; Kheir, A.M.S.; El-Tahlawy, Y.A.; Nada, W.M.; Shaaban, A. Fusing Genotype and Soil Organic/Inorganic Amendment to Improve Saline-Sodic Properties and Rice Productivity. J. Soil Sci. Plant Nutr. 2024, 24, 2413–2436. [Google Scholar] [CrossRef]
  11. Sikder, M.R.; Khan, M.H.R. Mitigation of Salt Stress in Rice (Oryza sativa L.) Growth and Yield in Coastal Saline Soil Using Crop Residue-Driven Organic Amendments under Varying Moisture Conditions. Dhaka Univ. J. Biol. Sci. 2024, 33, 1–13. [Google Scholar] [CrossRef]
  12. Cappelli, A.; Oliva, N.; Cini, E. A Systematic Review of Gluten-Free Dough and Bread: Dough Rheology, Bread Characteristics, and Improvement Strategies. Appl. Sci. 2020, 10, 6559. [Google Scholar] [CrossRef]
  13. Guerrini, L.; Napoli, M.; Mancini, M.; Masella, P.; Cappelli, A.; Parenti, A.; Orlandini, S. Wheat Grain Composition, Dough Rheology and Bread Quality as Affected by Nitrogen and Sulfur Fertilization and Seeding Density. Agronomy 2020, 10, 233. [Google Scholar] [CrossRef]
  14. Zhou, N.; Wei, H.; Zhang, H. Response of Milling and Appearance Quality of Rice with Good Eating Quality to Temperature and Solar Radiation in Lower Reaches of Huai River. Agronomy 2021, 11, 77. [Google Scholar] [CrossRef]
  15. Xu, Y.; Guan, X.; Han, Z.; Zhou, L.; Zhang, Y.; Asad, M.A.U.; Wang, Z.; Jin, R.; Pan, G.; Cheng, F. Combined Effect of Nitrogen Fertilizer Application and High Temperature on Grain Quality Properties of Cooked Rice. Front. Plant Sci. 2022, 13, 874033. [Google Scholar] [CrossRef]
  16. Counce, P.A.; Wells, B.R. Rice Plant Population Density Effect on Early-Season Nitrogen Requirement. J. Prod. Agric. 1990, 3, 390–393. [Google Scholar] [CrossRef]
  17. del Moral, M.B.G.; del Moral, L.F.G. Tiller Production and Survival in Relation to Grain Yield in Winter and Spring Barley. Field Crops Res. 1995, 44, 85–93. [Google Scholar] [CrossRef]
  18. Lafarge, T.A.; Broad, I.J.; Hammer, G.L. Tillering in Grain Sorghum over a Wide Range of Population Densities: Identification of a Common Hierarchy for Tiller Emergence, Leaf Area Development and Fertility. Ann. Bot. 2002, 90, 87–98. [Google Scholar] [CrossRef] [PubMed]
  19. Deng, F.; Wang, L.; Ren, W.-J.; Mei, X.-F.; Li, S.-X. Optimized Nitrogen Managements and Polyaspartic Acid Urea Improved Dry Matter Production and Yield of Indica Hybrid Rice. Soil Till. Res. 2015, 145, 1–9. [Google Scholar] [CrossRef]
  20. Deiss, L.; Moraes, A.; Pelissari, A.; Skora Neto, F.; Oliveira, E.B.; Silva, V.P. Oat Tillering and Tiller Traits under Different Nitrogen Levels in an Eucalyptus Agroforestry System in Subtropical Brazil. Cienc. Rural 2014, 44, 71–78. [Google Scholar] [CrossRef]
  21. Alzueta, I.; Abeledo, L.G.; Mignone, C.M.; Miralles, D.J. Differences between Wheat and Barley in Leaf and Tillering Coordination under Contrasting Nitrogen and Sulfur Conditions. Eur. J. Agron. 2012, 41, 92–102. [Google Scholar] [CrossRef]
  22. Cassman, K.G. Breaking the Yield Barrier. In Proceedings of the Workshop on Rice Yield Potential in Favorable Environments, Manila, Philippines, 29 November–4 December 1993. [Google Scholar]
  23. Ahmad, S.; Hussain, A.; Ali, H.; Ahmad, A. Transplanted Fine Rice (Oryza sativa L.) Productivity as Affected by Plant Density and Irrigation Regimes. Int. J. Agric. Biol. 2005, 7, 445–447. [Google Scholar]
  24. Cu, R.M. Effect of Sheath Blight on Yield in Tropical, Intensive Rice Production System. Plant Dis. 1996, 80, 1103. [Google Scholar] [CrossRef]
  25. Sahu, K.C.; Ekamber, K.; Mohapatra, P. Tiller Dominance in Rice Is Dependent on Assimilate Concentration of the Panicle during Grain Filling. Indian J. Plant Physiol. 2004, 9, 402–406. [Google Scholar]
  26. Wang, F.; Cheng, F.-M.; Zhang, G. Difference in Grain Yield and Quality among Tillers in Rice Genotypes Differing in Tillering Capacity. Rice Sci. 2007, 14, 135–140. [Google Scholar] [CrossRef]
  27. Mohanan, K.V.; Pavithran, K. Chronology of Tiller Emergence and Tiller Orientation in Rice (Oryza sativa L.). Int. J. Rice Res. 2007, 44, 4. [Google Scholar]
  28. Sakai, H.; Cheng, W.; Chen, C.P.; Hasegawa, T. Short-Term High Nighttime Temperatures Pose an Emerging Risk to Rice Grain Failure. Agric. For. Meteorol. 2022, 314, 108779. [Google Scholar] [CrossRef]
  29. Jyothsna, K.; Aakash; Reddy, P.M.; Setty, J. Impact of Temperature Variations on Rice Production. Int. J. Environ. Clim. 2024, 14, 1–9. [Google Scholar] [CrossRef]
  30. Hussain, S.; Khaliq, A.; Ali, B.; Hussain, H.A.; Qadir, T.; Hussain, S. Temperature Extremes: Impact on Rice Growth and Development. In Plant Abiotic Stress Tolerance: Agronomic, Molecular and Biotechnological Approaches; Hasanuzzaman, M., Hakeem, K.R., Nahar, K., Alharby, H.F., Eds.; Springer International Publishing: Cham, Switzerland, 2019; pp. 153–171. ISBN 978-3-030-06118-0. [Google Scholar]
  31. Guo, E.; Wang, L.; Jiang, S.; Xiang, H.; Shi, Y.; Chen, X.; Cheng, X.; Wang, X.; Zhang, T.; Wang, L.; et al. Impacts of Chilling at the Tillering Phases on Rice Growth and Grain Yield in Northeast China. J. Agron. Crop Sci. 2022, 208, 510–522. [Google Scholar] [CrossRef]
  32. Zhang, W.; Shi, H.; Cai, S.; Guo, Q.; Dai, Y.; Wang, H.; Wan, S.; Yuan, Y. Rice Growth and Leaf Physiology in Response to Four Levels of Continuous Drought Stress in Southern China. Agronomy 2024, 14, 1579. [Google Scholar] [CrossRef]
  33. Jarin, A.S.; Islam, M.M.; Rahat, A.; Ahmed, S.; Ghosh, P.; Murata, Y. Drought Stress Tolerance in Rice: Physiological and Biochemical Insights. Int. J. Plant Biol. 2024, 15, 692–718. [Google Scholar] [CrossRef]
  34. Yuan, R.; Mao, Y.; Zhang, D.; Wang, S.; Zhang, H.; Wu, M.; Ye, M.; Zhang, Z. The Formation of Rice Tillers and Factors Influencing It. Agronomy 2024, 14, 2904. [Google Scholar] [CrossRef]
  35. Li, X.; Qian, Q.; Fu, Z.; Wang, Y.; Xiong, G.; Zeng, D.; Wang, X.; Liu, X.; Teng, S.; Hiroshi, F.; et al. Control of Tillering in Rice. Nature 2003, 422, 618–621. [Google Scholar] [CrossRef]
  36. Takeda, T.; Suwa, Y.; Suzuki, M.; Kitano, H.; Ueguchi-Tanaka, M.; Ashikari, M.; Matsuoka, M.; Ueguchi, C. The OsTB1 Gene Negatively Regulates Lateral Branching in Rice. Plant J. 2003, 33, 513–520. [Google Scholar] [CrossRef]
  37. Zhang, W.; Tao, J.; Chang, Y.; Wang, D.; Wu, Y.; Gu, C.; Tao, W.; Wang, H.; Xie, X.; Zhang, Y. Cytokinin Catabolism and Transport Are Involved in Strigolactone-Modulated Rice Tiller Bud Elongation Fueled by Phosphate and Nitrogen Supply. Plant Physiol. Biochem. 2024, 215, 108982. [Google Scholar] [CrossRef]
  38. Wang, Y.; Lu, J.W.; Ren, T.; Li, P.F.; Liu, Q.X.; Li, X.K. Effects of Exogenous Cytokinin on Photosynthesis, Senescence, and Yield Performance of Inferior Rice Tillers Grown under Different Nitrogen Regimes. Photosynthetica 2020, 58, 137–145. [Google Scholar] [CrossRef]
  39. Yang, J.; Luo, D.; Yang, B.; Frommer, W.B.; Eom, J.-S. SWEET11 and 15 as Key Players in Seed Filling in Rice. New Phytol. 2018, 218, 604–615. [Google Scholar] [CrossRef]
  40. Dubois, M. Sugar Transport from Sheaths to Seeds: A Role for the Kinase SnRK1. Plant Physiol. 2022, 189, 1196–1198. [Google Scholar] [CrossRef]
  41. Varshney, V.; Singh, J.; Salvi, P. Sugar Signaling and Their Interplay in Mitigating Abiotic Stresses in Plant: A Molecular Perspective. In Smart Plant Breeding for Field Crops in Post-Genomics Era; Sharma, D., Singh, S., Sharma, S.K., Singh, R., Eds.; Springer Nature: Singapore, 2023; pp. 369–393. ISBN 978-981-19821-8-7. [Google Scholar]
  42. Ren, Y.; Huang, Z.; Jiang, H.; Wang, Z.; Wu, F.; Xiong, Y.; Yao, J. A Heat Stress Responsive NAC Transcription Factor Heterodimer Plays Key Roles in Rice Grain Filling. J. Exp. Bot. 2021, 72, 2947–2964. [Google Scholar] [CrossRef] [PubMed]
  43. Khush, G.S. Green Revolution: Preparing for the 21st Century. Genome 1999, 42, 646–655. [Google Scholar] [CrossRef] [PubMed]
  44. Khush, G.S. Breaking the Yield Frontier of Rice. GeoJournal 1995, 35, 329–332. [Google Scholar] [CrossRef]
  45. Donald, C.M. The Breeding of Crop Ideotypes. Euphytica 1968, 17, 385–403. [Google Scholar] [CrossRef]
  46. Khush, G.S. Green Revolution: The Way Forward. Nat. Rev. Genet. 2001, 2, 815–822. [Google Scholar] [CrossRef]
  47. Kebrom, T.H.; Richards, R.A. Physiological Perspectives of Reduced Tillering and Stunting in the Tiller Inhibition (Tin) Mutant of Wheat. Funct. Plant Biol. 2013, 40, 977–985. [Google Scholar] [CrossRef]
  48. Sakamoto, T.; Matsuoka, M. Generating High-Yielding Varieties by Genetic Manipulation of Plant Architecture. Curr. Opin. Biotechnol. 2004, 15, 144–147. [Google Scholar] [CrossRef]
  49. Mäkelä, P.; Muurinen, S. Uniculm and Conventional Tillering Barley Accessions under Northern Growing Conditions. J. Agric. Sci. 2012, 150, 335–344. [Google Scholar] [CrossRef]
  50. Jiao, Y.; Wang, Y.; Xue, D.; Wang, J.; Yan, M.; Liu, G.; Dong, G.; Zeng, D.; Lu, Z.; Zhu, X.; et al. Regulation of OsSPL14 by OsmiR156 Defines Ideal Plant Architecture in Rice. Nat. Genet. 2010, 42, 541–544. [Google Scholar] [CrossRef]
  51. Miura, K.; Ikeda, M.; Matsubara, A.; Song, X.-J.; Ito, M.; Asano, K.; Matsuoka, M.; Kitano, H.; Ashikari, M. OsSPL14 Promotes Panicle Branching and Higher Grain Productivity in Rice. Nat. Genet. 2010, 42, 545–549. [Google Scholar] [CrossRef] [PubMed]
  52. Wang, H.; Tong, X.; Tang, L.; Wang, Y.; Zhao, J.; Li, Z.; Liu, X.; Shu, Y.; Yin, M.; Adegoke, T.V.; et al. RLB (RICE LATERAL BRANCH) Recruits PRC2-Mediated H3K27 Tri-Methylation on OsCKX4 to Regulate Lateral Branching. Plant Physiol. 2022, 188, 460–476. [Google Scholar] [CrossRef]
  53. Wang, H.; Chen, M.; Zhang, D.; Meng, X.; Yan, J.; Chu, J.; Li, J.; Yu, H. Shaping Rice Green Revolution Traits by Engineering ATG Immediate Upstream 5′-UTR Sequences of OsSBI and OsHTD1. Plant Biotechnol. J. 2024, 22, 532–534. [Google Scholar] [CrossRef] [PubMed]
  54. Rahman, N.M.F.; Malik, W.A.; Kabir, M.S.; Baten, M.A.; Hossain, M.I.; Paul, D.N.R.; Ahmed, R.; Biswas, P.S.; Rahman, M.C.; Rahman, M.S.; et al. 50 Years of Rice Breeding in Bangladesh: Genetic Yield Trends. Theor. Appl. Genet. 2023, 136, 18. [Google Scholar] [CrossRef]
  55. Yan, W. GGEbiplot—A Windows Application for Graphical Analysis of Multienvironment Trial Data and Other Types of Two-Way Data. Agron. J. 2001, 93, 1111–1118. [Google Scholar] [CrossRef]
  56. Yan, W. Singular-Value Partitioning in Biplot Analysis of Multienvironment Trial Data. Agron. J. 2002, 94, 990–996. [Google Scholar] [CrossRef]
  57. Yan, W.; Kang, M.S.; Ma, B.; Woods, S.; Cornelius, P.L. GGE Biplot vs. AMMI Analysis of Genotype-by-Environment Data. Crop Sci. 2007, 47, 643–653. [Google Scholar] [CrossRef]
  58. Carter, M.R.; Gregorich, E.G. (Eds.) Soil Sampling and Methods of Analysis, 2nd ed.; CRC Press: Boca Raton, FL, USA, 2007; ISBN 978-0-429-12622-2. [Google Scholar]
  59. Sudianto, E.; Beng-Kah, S.; Ting-Xiang, N.; Saldain, N.E.; Scott, R.C.; Burgos, N.R. Clearfield® Rice: Its Development, Success, and Key Challenges on a Global Perspective. Crop Prot. 2013, 49, 40–51. [Google Scholar] [CrossRef]
  60. Council Regulation (EC) No 1785/2003 of 29 September 2003 on the Common Organisation of the Market in Rice; 2003; p. 113. Available online: https://eur-lex.europa.eu/legal-content/EN/TXT/?uri=CELEX:32003R1785 (accessed on 23 August 2024).
  61. Kadoglidou, K.; Kalaitzidis, A.; Stavrakoudis, D.; Mygdalia, A.; Katsantonis, D. A Novel Compost for Rice Cultivation Developed by Rice Industrial By-Products to Serve Circular Economy. Agronomy 2019, 9, 553. [Google Scholar] [CrossRef]
  62. Ntanos, D.A.; Koutroubas, S.D. Dry Matter and N Accumulation and Translocation for Indica and Japonica Rice under Mediterranean Conditions. Field Crops Res. 2002, 74, 93–101. [Google Scholar] [CrossRef]
  63. Martinez-Eixarch, M.; Català, M.d.M.; Tomàs, N.; Pla, E.; Zhu, D. Tillering and Yield Formation of a Temperate Japonica Rice Cultivar in a Mediterranean Rice Agrosystem. Span. J. Agric. Res. 2015, 13, e0905. [Google Scholar] [CrossRef]
  64. Alexander, C.J.; Holland, J.M.; Winder, L.; Woolley, C.; Perry, J.N. Performance of Sampling Strategies in the Presence of Known Spatial Patterns. Ann. Appl. Biol. 2005, 146, 361–370. [Google Scholar] [CrossRef]
  65. Badar, M.A.; Raman, S.; Pulat, P.S. Experimental Verification of Manufacturing Error Pattern and Its Utilization in Form Tolerance Sampling. Int. J. Mach. Tools Manuf. 2005, 45, 63–73. [Google Scholar] [CrossRef]
  66. Karki, S.; Poudel, N.S.; Bhusal, G.; Simkhada, S.; Regmi, B.R.; Adhikari, B.; Poudel, S. Growth Parameter and Yield Attributes of Rice (Oryza sativa L.) as Influenced by Different Combination of Nitrogen Sources. World J. Agric. Res. 2018, 6, 58–64. [Google Scholar] [CrossRef]
  67. Yoshida, S. Fundamentals of Rice Crop Science; International Rice Research Institute: Los Baños, Philippines, 1981; ISBN 978-971-10-4052-9. [Google Scholar]
  68. Payne, R.W. GenStat. WIREs Comp. Stats 2009, 1, 255–258. [Google Scholar] [CrossRef]
  69. Wu, G.; Wilson, L.; McClung, A. Contribution of Rice Tillers to Dry Matter Accumulation and Yield. Agron. J. 1998, 90, 317–323. [Google Scholar] [CrossRef]
  70. Counce, P.A.; Siebenmorgen, T.J.; Poag, M.A.; Holloway, G.E.; Kocher, M.F.; Lu, R. Panicle Emergence of Tiller Types and Grain Yield of Tiller Order for Direct-Seeded Rice Cultivars. Field Crops Res. 1996, 47, 235–242. [Google Scholar] [CrossRef]
  71. Mohapatra, P.; Ekamber, K. Time of Emergence Determines the Pattern of Dominance of Rice Tillers. Aust. J. Crop Sci. 2008, 1, 53–62. [Google Scholar]
  72. Wang, Y.; Lu, J.; Ren, T.; Hussain, S.; Guo, C.; Wang, S.; Cong, R.; Li, X. Effects of Nitrogen and Tiller Type on Grain Yield and Physiological Responses in Rice. AoB Plants 2017, 9, plx012. [Google Scholar] [CrossRef]
  73. Hossain, M.B.; Islam, M.; Hasanuzzaman, M. Influence of Different Nitrogen Levels on the Performance of Four Aromatic Rice Varieties. Int. J. Agric. Biol. 2008, 10, 693–696. [Google Scholar]
  74. Dutta, R.K.; Mia, M.; Khanam, S. Plant Architecture and Growth Characteristics of Fine Grain and Aromatic Rices and Their Relation with Grain Yield. Int. Rice Comm. Newsl. 2002, 51, 51–56. [Google Scholar]
  75. Hussain, S.; Fujii, T.; McGoey, S.; Yamada, M.; Ramzan, M.; Akmal, M. Evaluation of Different Rice Varieties for Growth and Yield Characteristics. J. Anim. Plant Sci. 2014, 24, 1504–1510. [Google Scholar]
  76. Ninou, E.; Tsivelika, N.; Sistanis, I.; Katsenios, N.; Korpetis, E.; Vazaneli, E.; Papathanasiou, F.; Didos, S.; Argiriou, A.; Mylonas, I. Assessment of Durum Wheat Cultivars’ Adaptability to Mediterranean Environments Using G × E Interaction Analysis. Agronomy 2024, 14, 102. [Google Scholar] [CrossRef]
  77. Mylonas, I.; Sinapidou, E.; Remountakis, E.; Sistanis, I.; Pankou, C.; Ninou, E.; Papadopoulos, I.; Papathanasiou, F.; Lithourgidis, A.; Gekas, F.; et al. Improved Plant Yield Efficiency Alleviates the Erratic Optimum Density in Maize. Agron. J. 2020, 112, 1690–1701. [Google Scholar] [CrossRef]
  78. Anshori, M.F.; Musa, Y.; Farid, M.; Jayadi, M.; Padjung, R.; Kaimuddin, K.; Huang, Y.C.; Casimero, M.; Bogayong, I.; Suwarno, W.B.; et al. A Comprehensive Multivariate Approach for GxE Interaction Analysis in Early Maturing Rice Varieties. Front. Plant Sci. 2024, 15, 1462981. [Google Scholar] [CrossRef]
  79. Sinclair, T.R. Historical Changes in Harvest Index and Crop Nitrogen Accumulation. Crop Sci. 1998, 38, 638–643. [Google Scholar] [CrossRef]
  80. Peltonen-Sainio, P.; Muurinen, S.; Rajala, A.; Jauhiainen, L. Variation in Harvest Index of Modern Spring Barley, Oat and Wheat Cultivars Adapted to Northern Growing Conditions. J. Agric. Sci. 2008, 146, 35–47. [Google Scholar] [CrossRef]
  81. D’Andrea, K.E.; Otegui, M.E.; de la Vega, A.J. Multi-Attribute Responses of Maize Inbred Lines across Managed Environments. Euphytica 2008, 162, 381–394. [Google Scholar] [CrossRef]
  82. Hasan, M.; Khan, M.A.; Islam, M.M.; Haque, M. Growth and Productivity of Short Duration Aman Rice Genotype. Bangladesh Agron. J. 2018, 20, 27. [Google Scholar] [CrossRef]
  83. Saito, H.; Fukuta, Y.; Obara, M.; Tomita, A.; Ishimaru, T.; Sasaki, K.; Fujita, D.; Kobayashi, N. Two Novel QTLs for the Harvest Index That Contribute to High-Yield Production in Rice (Oryza sativa L.). Rice 2021, 14, 18. [Google Scholar] [CrossRef] [PubMed]
  84. Lim, S.; Onoda, A.; Orn, C.; Iwamoto, H.; Ishikawa, R.; Saito, H.; Sato, Y.; Ishii, T. Variations in Grain Traits among Local Rice Varieties Collected More Than Half-Century Ago in Indochinese Countries. Plants 2023, 12, 133. [Google Scholar] [CrossRef]
  85. Sun, T.; Yang, X.; Tan, X.; Han, K.; Tang, S.; Tong, W.; Zhu, S.; Hu, Z.; Wu, L. Comparison of Agronomic Performance between Japonica/Indica Hybrid and Japonica Cultivars of Rice Based on Different Nitrogen Rates. Agronomy 2020, 10, 171. [Google Scholar] [CrossRef]
Figure 1. Monthly temperature and relative humidity during the rice-growing seasons in 2021 and 2022 at the experimental site. Bars represent minimum (light blue), maximum (black), and average (grey) temperature, while lines represent minimum (light blue), maximum (black), and average (grey) relative humidity.
Agriculture 15 00616 g001
Figure 2. Methodology used to take five samples of 1 m2 from each experimental plot. The samples were collected in an “X” pattern.
Agriculture 15 00616 g002
Figure 3. Pictorial representation of a rice plant with five levels of tillering. Main (Mn) represents the main stem, Primary (T1) the primary tiller, Secondary (T2) the secondary tiller, Tertiary (T3) the tertiary tiller, and Quaternary (T4) the quaternary tiller.
Agriculture 15 00616 g003
Figure 4. (a): Total dry matter (t ha−1) of the nine rice cultivars. (b): Total dry matter (t ha−1) across different tillering levels (Main, Primary, Secondary, Tertiary, Quaternary). The figures illustrate the variations in means of the total dry matter yield with significant differences indicated by distinct letters (p < 0.05).
Agriculture 15 00616 g004
Figure 5. (a): Harvest indexes (HIs) of nine rice cultivars across two growing seasons. (b): HIs across tillering levels for nine rice cultivars over two growing seasons. The figures illustrate the variations in means of the harvest index with significant differences indicated by distinct letters (p < 0.05).
Agriculture 15 00616 g005
Figure 6. (a): 1000-grain weights (g) of nine rice cultivars across two growing seasons. (b): 1000-grain weight (g) across tillering levels for nine rice cultivars over two growing seasons. The figures illustrate the variations in means of the 1000-grain weight with significant differences indicated by distinct letters (p < 0.05).
Agriculture 15 00616 g006
Figure 7. (a): Number of stems per square meter for nine rice cultivars across two growing seasons. (b): Number of stems per square meter across tillering levels for nine rice cultivars over two growing seasons. The figures illustrate the variations in the mean number of stems with significant differences indicated by distinct letters (p < 0.05).
Agriculture 15 00616 g007
Figure 8. (a): Mean yields (t ha−1) of nine rice cultivars across two growing seasons. (b): Mean yields (t ha−1) across tillering levels for nine rice cultivars over two growing seasons (2021–2022). The figures illustrate the variation in mean yields, with significant differences indicated by distinct letters (p < 0.05).
Agriculture 15 00616 g008
Figure 9. Correlations between (a) number of stems (NOS) and yield, (b) NOS and total dry matter (TDM), (c) NOS and harvest index (HI), and (d) NOS and 1000-grain weight (1000GW). (e) Linear regressions of NOS on yield, (f) NOS on TDM, (g) NOS on HI, and (h) NOS on 1000GW. The red line represents the simple linear regression of the predicted versus observed data.
Agriculture 15 00616 g009
Figure 10. Principal component analysis biplot analysis of nine rice cultivars, evaluating the contributions of different tillering levels (Mn, T1, T2, T3, T4) to the overall yield. Cultivars and tillering levels are represented as points, with proximity indicating similarity in performance. Yield vectors indicate the direction and strength of correlations. The length and direction of yield vectors indicate the strength and direction of the correlation.
Agriculture 15 00616 g010
Figure 11. Hierarchical clustering on principal components analysis of nine rice cultivars. The heatmap depicts standardized values for yield, harvest index (HI), total dry matter (TDM), 1000-grain weight (1000GW), and number of stems (NOS) across five tillering levels (Mn, T1, T2, T3, T4). Dendrograms represent hierarchical clustering using complete linkage, revealing distinct cultivar groups based on tillering and trait performance. Cultivar codes: Al (Alexandros), Di (Dion), Ga (Galileo), Gl (Gloria), L (Luna), M (Mare), O (Olympiada), R (Ronaldo), S (Samba).
Agriculture 15 00616 g011
Figure 12. GGE biplot analysis showing genotype × environment interactions. Blue numbers represent the different environments (1: 2021 and 2: 2022), while green numbers represent the different cultivars (1: Alexandros, 2: Dion, 3: Galileo, 4: Gloria, 5: Luna, 6: Mare, 7: Olympiada, 8: Ronaldo and 9: Samba). AEC (green arrowhead) represents stability.
Agriculture 15 00616 g012
Table 1. Name, type, growth cycle, and grain classification * of the cultivars used during experimentation.
CultivarType of CultivarGrowth CycleEU Grain Classification
AlexandrosIndicaMedium–LongLong B
DionJaponicaMediumMedium
GalileoJaponicaLongLong A
GloriaJaponicaMedium Long A
LunaJaponicaLongLong A
MareIndicaMedium–LongLong B
OlympiadaIndicaMedium–LongLong B
RonaldoJaponicaLongMedium
SambaJaponicaMediumLong A
* In the EU, brown rice grains are classified into four categories depending on their length and length/width ratio [60].
Table 2. Mean total dry matter yield (t ha−1) across tillering levels for nine rice cultivars over two growing seasons (2021–2022).
Tillering LevelCultivars
AlexandrosDionGalileoGloriaLunaMareOlympiadaRonaldoSamba
Mn6.86 g7.32 f7.06 g6.86 g8.63 c9.16 b7.98 e9.45 a8.25 d
T12.44 mn1.76 o3.42 jk3.29 k2.61 m4.88 h3.59 j3.85 i2.98 l
T20.69 rs0.49 st1.62 op1.52 p0.74 r2.33 n1.57 op1.28 q1.07 q
T30.24 u0.17 u0.71 rs0.74 r0.26 u0.67 rs0.51 st0.27 u0.24 u
T40.06 u0.15 u0.31 tu0.18 u0.09 u0.18 tu0.11 u0.07 u0.21 u
LSD 10.20
1 LSD for the “Cultivar × Tillering” interaction. Means not sharing the same letter differ significantly at p < 0.05.
Table 3. Mean harvest index across tillering levels for nine rice cultivars over two growing seasons (2021–2022).
Tillering LevelCultivars
AlexandrosDionGalileoGloriaLunaMareOlympiadaRonaldoSamba
Mn0.51 f0.50 f0.55 bc0.51 f0.49 ghi0.46 lm0.56 ab0.50 fg0.54 de
T10.49 ghi0.48 jk0.56 a0.49 ghi0.48 jk0.43 p0.56 ab0.47 l0.55 bc
T20.45 no0.46 lm0.54 de0.48 jk0.45 no0.41 q0.54 de0.45 no0.54 de
T30.39 s0.26 v0.55 bc0.47 l0.40 qr0.39 s0.49 ghi0.40 qr0.43 p
T40.46 lm0.24 w0.49 ghi0.37 t0.25 v0.37 t0.41 q0.30 u0.44 op
LSD 10.36
1 LSD for the “Cultivar × Tillering” interaction. Means not sharing the same letter differ significantly at p < 0.05.
Table 4. 1000-grain weight across tillering levels for nine rice cultivars over two growing seasons (2021–2022).
Tillering LevelCultivars
AlexandrosDionGalileoGloriaLunaMareOlympiadaRonaldoSamba
Mn27.53 l27.45 l41.65 a38.90 cde30.85 i23.43 rst23.25 rst30.78 i39.91 bc
T127.52 l28.59 k40.85 ab37.10 fg30.08 ij24.15 pqr22.82 stu29.75 j38.41 de
T226.65 lmn27.55 l41.45 a36.44 g29.42 jk23.35 rst22.52 tu29.70 j39.38 cd
T324.57 pq26.15 mn37.90 ef35.11 h27.16 lm23.58 qrs22.69 stu24.89 op38.02 ef
T420.68 v22.87 stu38.52 de34.83 h25.81 no19.97 v20.35 v21.96 u34.30 h
LSD 11.03
1 LSD for the “Cultivar × Tillering” interaction. Means not sharing the same letter differ significantly at p < 0.05.
Table 5. Number of stems (m−2) according to cultivar and tiller combined for the two years of experimentation (2021/2022).
Tillering LevelCultivars
AlexandrosDionGalileoGloriaLunaMareOlympiadaRonaldoSamba
Mn312.0 c220.0 f145.0 k206.0 g243.0 e322.0 b302.0 d394.0 a149.0 k
T174.0 i123.0 l96.0 m160.0 j89.0 mno206.0 g172.0 i185.0 h85.0 mno
T262.0 p51.0 qr52.0 qr83.0 o28.0 vw129.0 l92.0 mn58.0 pq38.0 tu
T335.0 uv15.0 yz23.0 wx50.0 rs11.0 z43.0 stu46.0 rst43.0 stu12.0 z
T411.0 z6.0 z11.0 z16.0 xyz9.0 z18.0 xyz21.0 wxy22.0 wxy11.0 z
LSD 18.6
1 LSD for the “Cultivar × Tillering” interaction. Means not sharing the same letter differ significantly at p < 0.05.
Table 6. Yield (t ha−1) across tillering levels for nine rice cultivars over two growing seasons (2021–2022).
Tillering LevelCultivars
AlexandrosDionGalileoGloriaLunaMareOlympiadaRonaldoSamba
Mn3.46 f3.68 e3.87 d3.44 f4.23 c4.19 c4.46 b4.71 a4.44 b
T11.19 k0.84 mn1.90 h1.62 j1.24 k2.12 g1.99 h1.79 i1.63 j
T20.31 pqr0.23 rs0.86 lm0.73 n0.34 pq0.95 l0.85 lm0.57 o0.58 o
T30.09 tu0.04 tu0.39 p0.35 pq0.11 tu0.26 qr0.25 qrs0.11 tu0.10 tu
T40.03 u0.04 u0.15 st0.07 tu0.02 u0.07 tu0.05 tu0.02 u0.09 tu
LSD 1 0.11
1 LSD for the “Cultivar × Tillering” interaction. Means not sharing the same letter differ significantly at p < 0.05.
Disclaimer/Publisher’s Note: The statements, opinions and data contained in all publications are solely those of the individual author(s) and contributor(s) and not of MDPI and/or the editor(s). MDPI and/or the editor(s) disclaim responsibility for any injury to people or property resulting from any ideas, methods, instructions or products referred to in the content.