Abstract
With the rapid advancement of deep learning technology, the residual networks technique (ResNet) has made significant strides in the field of image processing, and its application in soil science has been steadily increasing. ResNet outperforms traditional methods by effectively mitigating the vanishing gradient problem, enabling deeper network training, enhancing feature extraction, and improving accuracy in complex pattern recognition tasks. ResNet, as an efficient deep learning model, can automatically extract features from complex soil image data, enabling accurate soil classification and assessment of soil health. Recent research is increasingly applying ResNet to various fields, including soil type classification and health assessment. Firstly, this manuscript outlines various methods for collecting soil data, highlighting the significance of employing diverse data sources to comprehensively understand soil characteristics. These methods include the acquisition of soil microscopic images, which provide high-resolution insights into the soil’s particulate structure at the cellular level; remote sensing images, which offer valuable information regarding large-scale soil properties and spatial variations through satellite or drone-based technologies; and high-definition images, which capture fine-scale details of soil features, enabling more precise and detailed analysis. By integrating these techniques, a solid foundation is established for subsequent soil image analysis, thereby enhancing the accuracy of soil classification, health assessments, and environmental impact evaluations. Furthermore, this approach contributes to advancements in precision agriculture, land use planning, soil erosion monitoring, and contamination detection, ultimately supporting sustainable soil management and ecological conservation efforts. Then, the advantages of using ResNet in soil science are analyzed, and its performance across different soil image processing tasks is explored. Finally, potential future development directions are proposed.
1. Introduction
The rapid development of deep learning technology, particularly the successful application of Convolutional Neural Networks (CNNs) in image recognition and processing, has significantly expanded its potential applications in soil science. Among various deep learning architectures, ResNet has been widely utilized not only for soil classification and fertility assessment but also in plant leaf disease detection [1]. However, soil is an important natural resource on the earth’s surface, its physical and chemical properties, humidity, types and other information are of great significance for agricultural production, ecological protection, land use planning and so on. The diversity and complexity of soil make its data show obvious spatial heterogeneity [2] and temporal dynamics [3], which brings several challenges to traditional soil analysis methods. For instance, conventional methods often rely on sampling and experimental analysis, which can be inefficient and inadequate for handling large-scale data. Additionally, gathering soil information usually depends on manual ground observations, which not only consumes a lot of time and resources, but also makes it difficult to accurately reflect the distribution characteristics of soil across varying spatial scales [4]. Therefore, how to use efficient and accurate techniques for automatic analysis and large-scale monitoring of soil data has emerged as a crucial topic in soil science research.
ResNet effectively addresses the problem of gradient disappearance that can occur during the training of deep networks. By introducing a residual learning mechanism, it allows the network to maintain high accuracy when processing complex and high-dimensional data. Compared to traditional convolutional neural networks, the ResNet architecture can extract feature information from images more deeply and accurately. This results in significant advantages for tasks such as soil type classification and soil health assessment. ResNet’s advanced feature learning capability makes it well-suited for handling complex data in soil research, particularly in the analysis of remote sensing images and the evaluation of soil health [5].
Additionally, ResNet has become extensively utilized in the fields of soil species identification and soil health assessment. By integrating remote sensing image data, ResNet not only aids researchers in accurately identifying soil types and analyzing soil health status but also offers more scientifically sound and precise decision support for soil protection and management. Regarding dataset construction, the ongoing advancements in remote sensing technology are making it increasingly feasible to obtain high-quality soil data. Specifically, remote sensing image data serves as a valuable new resource for large-scale soil monitoring. When combined with ResNet and other deep learning models, it allows for the extraction of meaningful information from vast and complex datasets, significantly enhancing the efficiency and accuracy of soil research.
This paper provides a comprehensive review of ResNet’s application in soil science, focusing on its advancements in soil type classification and soil health assessment. It explores key aspects such as dataset acquisition, preprocessing techniques, and feature extraction performance, highlighting ResNet’s advantages over traditional models. Additionally, the study critically examines challenges and limitations, including data heterogeneity, computational demands, and model interpretability, which may impact its practical implementation. Looking ahead, the paper discusses future research directions, emphasizing multi-source data fusion, model optimization, and real-time monitoring applications. By summarizing these focal points, this review aims to offer a structured perspective on the role of ResNet in soil research and provide valuable insights for advancing deep learning applications in the field.
2. Data Acquisition
The data technologies used in soil image analysis primarily include soil microscopic observation, remote sensing technology, and high-definition image acquisition. Soil microscopic observation allows for the examination of the physical and chemical properties of soil particle structures and microbial activities through detailed microscopic analysis. This provides essential data for assessing soil quality and studying biodiversity. Remote sensing technology, utilizing the extensive coverage capabilities of satellite and UAVs (Unmanned Aerial Vehicles), facilitates the rapid monitoring of parameters such as soil moisture, temperature, and vegetation coverage, thereby offering valuable insights for agricultural production and ecological conservation. Meanwhile, high-definition image acquisition enhances the accuracy of soil surface morphology analysis, allowing for improved capture of fine details such as color and texture. The integration of these technologies has significantly advanced soil science and provides multi-dimensional support for the sustainable management of soil resources.
ResNet’s feature extraction process varies across different soil imaging modalities, leveraging its deep hierarchical structure to capture texture, color, shape, and structural properties. In scanning electron microscopy (SEM) images, ResNet extracts fine-grained surface details, identifying soil particle morphology, porosity, and mineral aggregation through its convolutional layers. For optical microscopy, it processes color variations, geometric shapes, and spectral properties, enabling accurate differentiation of sandy, loamy, and clay soil while also assessing organic matter content. When applied to micro-CT scanner data, ResNet, particularly in 3D adaptations, learns volumetric representations of soil porosity, compaction, and structural connectivity, providing insights into water retention and permeability. By integrating these diverse data sources, ResNet effectively captures multi-scale and multi-modal features, enhancing soil type classification and health assessment with greater accuracy and reliability.
2.1. Collection of Soil Microscopic Images
When applying the ResNet model to soil microimages, the data acquisition process is crucial due to the rich details and high resolution inherent in these images, which can reveal the microstructure and particle composition of the soil. Acquiring such high-quality images necessitates specialized equipment and precise operational protocols to ensure the data’s suitability for training and validating deep learning models, such as ResNet, for tasks like automated soil classification and feature extraction. Typically, the acquisition of microscopic images requires high-precision microscopy equipment capable of magnifying soil details and producing high-resolution images for subsequent model training. Commonly used equipment includes scanning electron microscopes (SEM) [6,7,8], optical microscopes [9,10,11,12], and micro-CT scanners [13,14,15], with a comparative overview provided in Table 1.

Table 1.
Comparison table of microscopic image acquisition devices.
The image acquisition process is a critical step in microscopy, aiming to capture clear, accurate, and representative high-resolution images for subsequent analysis [16]. This process involves several essential steps, each of which significantly influences the final image quality. To ensure comprehensive and high-quality data acquisition, techniques such as multi-view acquisition [17], multi-magnification imaging [18], and multi-illumination and contrast adjustments [19] are often employed.
To maintain the clarity and consistency of microscopic images, soil samples undergo a specific preparation process [20], as illustrated in Figure 1. Initially, soil samples are collected and transported to the laboratory, where they are subjected to drying procedures such as air drying, low-temperature drying, or freeze-drying. Subsequently, the samples are fixed using immersion solutions, embedded in resin, and coated with a thin metal layer. The samples are then sliced and polished to achieve the desired texture and structure. Finally, additional treatments, such as staining, freezing, or vacuum processing, may be applied based on experimental requirements.
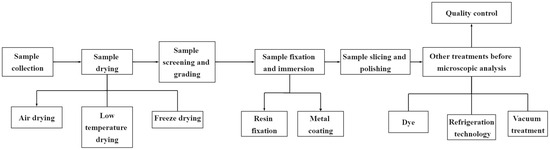
Figure 1.
Soil sample preparation process.
After completing the aforementioned preparation steps, the soil sample is prepared for microscopic image acquisition. High-quality sample preparation not only enhances the clarity and detail of the microscopic images but also establishes a solid foundation for subsequent feature extraction. During the image acquisition process, it is essential to fine-tune the light source, magnification, and shooting angle of the microscope to ensure that the acquired image accurately reflects the structural characteristics and physical properties of the soil samples. These optimized images provide valuable support for further feature extraction, thereby improving the accuracy and reliability of the analysis.
Feature extraction involves transforming the visual features of soil images into numerical forms that can be processed by computational models. Key methods of feature extraction include color, texture, morphological, and deep learning-based features. Color feature extraction typically relies on color histograms and color space transformations (such as RGB to HSV) to identify soil types [21]. Texture features, which describe the size and distribution of soil particles, are often extracted using the gray-level co-occurrence matrix (GLCM) and local binary patterns (LBP). Morphological features, related to the shape and arrangement of soil particles, are derived using image dilation and erosion operations. In recent years, deep learning techniques, such as ResNet, have become essential tools for automatic feature extraction. These high-dimensional features offer superior expressive power compared to traditional manually designed features. The integration of these methods provides a solid foundation for soil analysis and classification [22].
2.2. Collection of Soil Remote Sensing Image
The acquisition of soil remote sensing images is a vital method for studying soil properties, monitoring changes, and assessing soil health. Remote sensing technology enables researchers to gather extensive information about soil, which is crucial for agricultural management, environmental protection, and land use planning. The primary acquisition technologies include satellite remote sensing [23] and UAV remote sensing [24]. Satellite remote sensing, such as Landsat [25] and Sentinel-2 [26], offers wide-area coverage and provides multispectral or hyperspectral images, making it suitable for large-scale soil monitoring. In contrast, UAV remote sensing captures high-resolution images over smaller areas, making it ideal for detailed soil analysis and local monitoring.
The process of satellite remote sensing acquisition [27] begins with target determination and demand analysis, followed by the definition of the research area and the selection of appropriate satellites and sensors. The next step involves planning the optimal acquisition time to avoid meteorological interference, collecting data via satellite sensors, and transmitting the raw data to ground stations for storage and preliminary quality assessment. Subsequently, radiometric, atmospheric, and geometric corrections are applied to enhance image quality. After preprocessing, the remote sensing images are ready for analysis, including the extraction of soil characteristics and land change monitoring. The final results are typically presented in reports or visualizations to support decision-making and resource management. This comprehensive process ensures the accuracy and effectiveness of remote sensing data, contributing to more scientific and efficient environmental monitoring and resource management. The entire procedure is illustrated in Figure 2.

Figure 2.
Satellite remote sensing data acquisition process.
In the acquisition process, selecting the appropriate sensor and optimal shooting time is crucial. Depending on the specific requirements, sensors such as optical, infrared, or LiDAR [28] can be chosen to capture soil information across different spectral bands. The selection of the shooting time should take into account seasonal variations and meteorological conditions to ensure the accuracy and consistency of the data. Following data acquisition, several preprocessing steps are generally required, including radiometric correction, atmospheric correction, and geometric correction, all of which serve to enhance image quality. After these corrections, researchers can extract important soil characteristics such as spectral features and texture information, providing a strong foundation for subsequent analyses.
During the preprocessing stage of satellite remote sensing data, radiometric correction [29], atmospheric correction [30], and geometric correction [31] are critical steps. Radiometric correction aims to eliminate sensor errors, convert the received digital signals into physical radiation, and ensure the consistency of images obtained from different sensors and at different times. Atmospheric correction accounts for the effects of gases and aerosols in the atmosphere, removing scattering and absorption effects to enhance the accuracy of surface information. Geometric correction addresses positional discrepancies in the image, aligning it with the geographic coordinate system and compensating for geometric distortions caused by satellite orbits and the Earth’s curvature. These three steps collectively ensure that remote sensing images are suitable for high-precision analysis.
UAV remote sensing technology offers an efficient and comprehensive solution for soil image acquisition, covering multiple dimensions such as multispectral/hyperspectral data, RGB images, thermal infrared data, digital elevation models, and time series data. The multispectral or hyperspectral sensors mounted on UAVs can capture the physical and chemical properties of soil based on reflected light from different spectral bands. For example, visible and near-infrared bands can be used to analyze soil types, while shortwave infrared bands are valuable for assessing soil health. Additionally, high-resolution images obtained from standard RGB cameras provide clear details of the soil surface, including color, texture, and cracks, which are essential for soil classification and health assessment. The process begins with mission planning, followed by drone preparation and sensor calibration to ensure optimal data collection. Once these steps are completed, the flight execution phase takes place, during which data are captured through data acquisition. The collected data then undergo image preprocessing before reaching the final stage of data analysis, where insights are derived.
The process of UAV remote sensing soil image acquisition involves several key steps, including mission planning, UAV preparation, sensor calibration, flight execution, data acquisition, image preprocessing, and data analysis. Initially, the target area and flight route are determined during the mission planning phase. Subsequently, UAV equipment is prepared, and sensors are calibrated to ensure the accuracy of the data. The UAV then follows the designated flight route, collecting various soil data, including multispectral, thermal infrared, and RGB images. The acquired images undergo preprocessing, which includes noise removal and contrast enhancement. Finally, the soil characteristics are extracted through analysis for purposes such as classification, humidity evaluation, and other related research.
In comparison to UAV remote sensing, satellite remote sensing is more suited for large-scale and macro-level soil monitoring. It offers advantages such as global coverage and long-term observation, making it useful for applications like drought monitoring, land degradation assessment, and regional soil dynamic change analysis. However, satellite remote sensing typically provides lower resolution and has limited flexibility. On the other hand, UAV remote sensing excels in high resolution and operational flexibility. It enables fine-scale monitoring of local soil conditions, capturing details such as cracks and particle distribution, and allows for flexible adjustment of flight time and coverage area to meet specific needs. These two methods are highly complementary. While satellite remote sensing provides macro-level background and trend analysis, UAV remote sensing offers in-depth, detailed observations. The combination of both techniques allows for comprehensive soil monitoring, spanning from macro-level trends to micro-level details. A comparison between satellite remote sensing and UAV remote sensing in soil image acquisition is presented in Table 2.
Table 2.
Comparison of satellite remote sensing and unmanned aerial vehicle remote sensing in soil image acquisition.
2.3. Acquisition of Soil HD Image
The acquisition of high-definition soil images is primarily carried out through photographic techniques aimed at capturing the fine details and characteristics of the soil surface. Common methods for acquiring these images include handheld camera shooting, UAV aerial photography, and the use of specialized professional photography equipment. These technologies provide valuable visual information that aids researchers in analyzing soil conditions, identifying soil types, and monitoring environmental changes.
In the image acquisition process, selecting the appropriate equipment and methods is crucial, which depends on the target area and specific objectives. Handheld cameras are well-suited for focused observations in small areas, enabling the capture of detailed soil surface features such as texture, color, and moisture variations. These cameras require stable lighting and appropriate shooting angles, making them ideal for fine-scale analysis of flat terrain and localized regions. In contrast, UAV aerial photography is more appropriate for large-scale soil monitoring. UAVs can cover broader geographical areas and capture high-resolution images, offering the advantage of quickly obtaining extensive soil data. This is particularly valuable in complex terrains or areas that are difficult to access, providing an efficient means of monitoring. Additionally, selecting the optimal shooting time is essential. Factors such as lighting conditions, weather changes, and soil moisture levels must be considered to ensure clear and usable images. The process of acquiring high-definition soil images is illustrated in Figure 3.

Figure 3.
Collection process of high-definition soil images.
After acquisition, high-definition soil images typically undergo post-processing procedures, such as color correction, denoising, and contrast enhancement, to enhance their visual quality. These processed images are invaluable for analyzing soil characteristics, monitoring plant growth, and assessing soil health. Not only do they provide crucial data support for soil research, but they also offer a scientific foundation for decision-making in agricultural management and environmental protection. With advancements in imaging technologies and the continuous development of image processing software, the collection and application of high-definition soil images will become increasingly efficient and precise.
Color correction aims to address distortions caused by variations in light sources or equipment discrepancies, ensuring that soil features are represented in their true colors. Common techniques for color correction include white balance adjustment, color space conversion, and the use of standard reference materials. These methods improve the authenticity and usability of the image, ensuring that the representation of soil characteristics is as accurate as possible.
Denoising is crucial to eliminate noise introduced during image acquisition [38], thereby enhancing the clarity and readability of the image. Standard denoising techniques include spatial filtering, frequency domain filtering, and adaptive denoising. These methods effectively reduce random noise while preserving essential edges and details, making soil features more prominent and easier to analyze.
Contrast enhancement improves the visualization of different elements in the image, facilitating the differentiation between soil and other components. Techniques such as histogram equalization [39], local contrast enhancement [40], and gamma correction [41] are employed to heighten the visual impact of the image and accentuate key features. These post-processing steps ensure that high-definition soil images are of the highest quality, providing reliable and accurate data for subsequent analysis and research.
Contrast enhancement techniques such as histogram equalization, local contrast enhancement, and gamma correction play a crucial role in improving soil image quality for analysis. Histogram equalization (HE) redistributes pixel intensity values to enhance contrast, making fine soil textures and variations more distinguishable. Local contrast enhancement, including methods like adaptive histogram equalization (AHE) and contrast-limited adaptive histogram equalization (CLAHE), adjusts contrast in smaller image regions, effectively handling uneven lighting and improving microstructure visibility. Gamma correction modifies image brightness non-linearly, preserving subtle variations in color and texture to ensure accurate soil composition analysis. By applying these techniques, soil images achieve better clarity, facilitating more precise classification, health assessments, and environmental monitoring.
3. Learning Model
The ResNet model (Residual Network) demonstrates exceptional performance in soil image analysis, particularly when compared to other deep learning models such as VGG, GoogLeNet, PReLU Net, and plain networks. The depth and stability of ResNet provide significant advantages in a variety of critical tasks. A longitudinal comparison of VGG, GoogLeNet, PReLU Net, and plain models is shown in Table 3. This table provides both horizontal comparisons of the error (ERR) at iteration 1 (epoch 1) and iteration 5 (epoch 5), as well as vertical comparisons among the different models. ResNet-50, ResNet-101, and ResNet-152 are variants of the ResNet architecture, with the numbers indicating the number of layers in each network.
Table 3.
Error rate comparison chart.
To quantitatively evaluate the performance of different deep learning models, training error metrics were recorded at specific training cycles, focusing on epochs 1 and 5, to assess both the initial learning efficiency and final accuracy of each model. The training error, representing the deviation between predicted and actual values, served as the primary metric to evaluate model performance. A rapid decrease in training error between epochs indicates efficient learning, where the model effectively optimizes parameters and extracts meaningful features. Conversely, models with slower convergence require more iterations to achieve comparable accuracy, potentially indicating limitations in feature extraction. Comparing error reduction trends across different architectures further reveals the impact of network depth and optimization strategies. Deeper models, such as ResNet, leverage residual connections to enhance gradient flow and improve long-term learning stability, leading to progressive error reduction and superior accuracy. Meanwhile, shallower architectures like VGG-16 and GoogLeNet often exhibit faster initial learning, but their final performance may be constrained by limited depth and feature extraction capabilities. This quantification approach highlights the advantages of deeper architectures in achieving lower final errors, better convergence, and overall improved accuracy.
From the comparison in Table 3, the following conclusions can be drawn:
- (a)
- The error in the first training cycle (epoch 1) for VGG-16 and GoogLeNet is relatively high (VGG-16 at 28.07 and GoogLeNet at 24.27). However, by the fifth training cycle (epoch 5), both models show significant error reduction, with GoogLeNet achieving a lower error (7.38) compared to VGG-16 (9.33). This suggests that GoogLeNet converges faster during the learning process.
- (b)
- PReLU Net also demonstrated good performance, with an initial error of 9.15 in the first training cycle, and a decrease to 7.38 in the fifth cycle, indicating a stable improvement in performance over time.
- (c)
- In the ResNet series, performance varies with the increase in network depth. The errors for ResNet-34 A and ResNet-34 B at the fifth training cycle are relatively low (7.40 and 7.46, respectively), suggesting good convergence for the ResNet-34 series. As the network depth increases further, the error for ResNet-50 decreases to 6.71, for ResNet-101 it is 6.05, and for ResNet-152, the error is 5.71, indicating progressively better performance. Notably, ResNet-152 outperforms the other models, achieving the lowest error of 5.71 in the fifth cycle. While VGG-16 and GoogLeNet perform well in early training stages, their final error rates are comparatively higher. In contrast, the ResNet series, particularly the deeper models, shows a clear advantage in enhancing accuracy.
The comparison of different depth models is shown in Table 4.
Table 4.
Comparison of Deep Learning Models.
In the task of soil image recognition, the training performance of ResNet was compared with its plain network counterpart, which lacks residual connections. Notably, the introduction of residual connections in ResNet does not increase the number of parameters, thereby preserving the relative simplicity of the network architecture. Figure 4 illustrates the performance of ResNet and plain networks at different depths (18 and 34 layers).
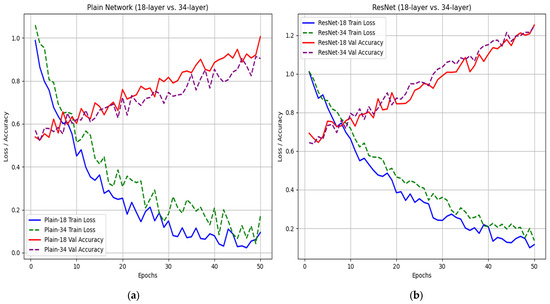
Figure 4.
Comparison of Plain and ResNet Training. (a) illustrates the training loss and validation accuracy of plain networks with 18 and 34 layers; (b) presents the training loss and validation accuracy of ResNet with 18 and 34 layers.
Figure 4a illustrates the training loss and validation accuracy of plain networks with 18 and 34 layers. The blue solid line represents the training loss of Plain-18, the red solid line represents the validation accuracy of Plain-18, the purple dotted line represents the validation accuracy of Plain-34, and the green dotted line represents the training loss of Plain-34, with the x-axis denoting the number of epochs. It is evident that as the network depth increases, the training error for Plain-34 rises, and the validation set exhibits a higher validation error. This suggests that deeper plain networks are susceptible to challenges such as vanishing gradients, leading to performance degradation.
Figure 4b presents the training loss and validation accuracy of ResNet with 18 and 34 layers. The blue solid line represents the training loss of ResNet-18, the red solid line represents the validation accuracy of ResNet-18, the purple dotted line represents the validation accuracy of ResNet-34, and the green dotted line represents the training loss of ResNet-34, with the x-axis representing the number of epochs. The inclusion of residual connections in ResNet ensures low training and validation errors even at a depth of 34 layers, demonstrating the stability and effectiveness of residual connections in deep network architectures. Comparatively, ResNet networks exhibit lower training and validation errors than their plain network counterparts at the same depth, underscoring their superior feature learning and generalization capabilities in soil image recognition tasks.
Furthermore, compared to VGG-16, GoogLeNet, and PReLU Net, ResNet addresses the vanishing gradient problem effectively through the use of residual connections [41]. This enhancement allows ResNet to achieve greater feature learning and generalization capabilities in deeper structures without increasing the number of parameters. By contrast, VGG-16 employs a relatively simple structure but requires a large number of parameters. GoogLeNet improves multi-scale feature extraction through its inception modules, while PReLU Net enhances non-linear expression via its adaptive activation functions. Figure 5 illustrates the training performance comparison among ResNet, VGG-16, GoogLeNet, and PReLU Net.
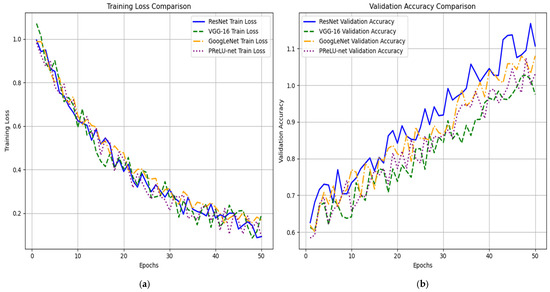
Figure 5.
Comparison of ResNet Training with VGG-16, GoogLeNet, and PreLU-net. (a) illustrates the training loss of the ResNet network compared to VGG-16, GoogLeNet, and PReLU Net; (b) compares the accuracy of these models, with the colors corresponding to those used in Figure 5a.
Figure 5a illustrates the training loss of the ResNet network compared to VGG-16, GoogLeNet, and PReLU Net. The blue solid line represents the training loss of ResNet, the green dotted line corresponds to VGG-16, the yellow dotted line represents GoogLeNet, and the purple dotted line indicates PReLU Net. The x-axis denotes the number of epochs. Figure 5b compares the accuracy of these models, with the colors corresponding to those used in Figure 5a.
The comparison reveals that ResNet, owing to its residual learning mechanism, effectively mitigates the vanishing gradient problem. It consistently achieves the lowest training loss and converges rapidly, reaching an accuracy of over 97%. In contrast, while VGG-16 demonstrates strong performance across various tasks, its high parameter complexity and depth result in a higher training loss, typically around 95%. GoogLeNet, leveraging its inception modules, maintains high accuracy with stable training loss, generally around 93%, which is lower than that of VGG-16. PReLU Net, with its learnable activation function, exhibits favorable convergence speed and accuracy, and its training loss sometimes falls below that of VGG-16, making it particularly suitable for specific tasks. Among these models, ResNet stands out not only for its superior training loss but also for achieving the highest accuracy.
When compared to traditional machine learning models, the advantages of the ResNet deep learning model lie in its feature extraction capabilities and data requirements. ResNet utilizes a deep convolutional neural network to automatically learn complex features, necessitating a substantial amount of labeled data for training to achieve high accuracy and generalization. Traditional machine learning models, such as decision trees and support vector machines, rely on manual feature extraction and can perform effectively with smaller datasets. They feature simpler structures, are easier to implement and debug, and often offer better interpretability. However, their performance may be limited in handling complex tasks. Deep learning models, while achieving higher accuracy in such tasks, are often considered “black boxes” due to the difficulty in intuitively understanding their decision-making processes. ResNet demonstrates remarkable stability across varying data volumes, making it a robust deep learning model for diverse applications. Its residual learning framework mitigates the vanishing gradient problem, allowing for effective training even with limited data, where traditional deep networks often struggle with overfitting or degraded performance. Unlike architectures such as VGG, which tend to be highly sensitive to data volume, ResNet maintains strong generalization by efficiently propagating gradients and leveraging hierarchical feature extraction. As dataset size increases, ResNet scales effectively, with deeper versions like ResNet-50, ResNet-101, and ResNet-152 showing continuous improvements in accuracy while avoiding significant performance fluctuations. Additionally, batch normalization further enhances stability by normalizing feature distributions and ensuring consistent convergence across different dataset sizes. While the model benefits from larger data volumes, diminishing returns may occur beyond a certain point, emphasizing the importance of data augmentation and preprocessing. Table 5 provides a comparative overview of ResNet deep learning models and traditional machine learning models.
Table 5.
ResNet, comparison between unsupervised machine learning models and traditional supervised machine learning models.
4. Data Evaluation
The evaluation of soil images is critical in advancing soil research. In recent years, the adoption of deep learning models, particularly Residual Neural Networks (ResNet) and other Convolutional Neural Networks (CNNs), has become increasingly prevalent in tasks such as soil image classification, feature extraction, and quantitative analysis. The implementation of these models has substantially enhanced the automation and accuracy of soil type classification and feature extraction, addressing key challenges in traditional soil analysis.
In soil image analysis, robust data evaluation methodologies play a pivotal role. Common practices include dataset augmentation, advanced model evaluation techniques, and the application of standardized evaluation metrics. Dataset augmentation involves techniques such as rotation, scaling, and flipping to artificially expand the training dataset, mitigating overfitting and improving model generalization. Model evaluation technologies assess the performance of deep learning models through methods such as cross-validation, confusion matrix analysis, and statistical significance testing, ensuring robustness and reliability. Commonly used evaluation indicators include accuracy, precision, recall, F1-score, and area under the receiver operating characteristic curve (AUC-ROC), which collectively provide a comprehensive understanding of model performance in soil image analysis.
Integrating diverse soil information such as moisture, temperature, and nutrient content with ResNet presents challenges due to data heterogeneity, varying spatial resolutions, and inconsistencies across different sources. Differences in data formats—ranging from soil images, sensor readings, and spectral data—require pre-processing techniques to ensure compatibility. Normalization and standardization help align numerical values, while spatial interpolation and data resampling synchronize multi-resolution datasets. To address missing or inconsistent data, interpolation techniques such as kriging [68] for geospatial data and deep learning-based inpainting for images can be applied. Additionally, dimensionality reduction methods like Principal Component Analysis (PCA) [69] can extract essential features from high-dimensional data. For effective integration, multi-branch CNN architectures can process different modalities separately before feature fusion at deeper layers, ensuring that distinct data characteristics are preserved while improving model performance. By leveraging these pre-processing and fusion techniques, ResNet can effectively handle multi-source soil data, enhancing soil type classification and health assessment in precision agriculture and environmental monitoring.
4.1. Dataset Enhancements
The construction of soil image datasets forms the foundation for deep learning tasks in soil analysis. Typical soil image datasets consist of diverse soil samples captured using microscopes, remote sensing technologies, or high-definition photography. These datasets encapsulate key attributes such as color, shape, texture, and other essential characteristics of soil particles. Commonly represented soil types include sandy soil, loam, and clay. The high resolution of these datasets allows for detailed visualization of the microscopic features of soil particles.
Among the various attributes analyzed in past studies, certain key features have proven particularly useful for determining soil particle size distribution (PSD). The most widely used attributes include particle shape descriptors (e.g., circularity, aspect ratio, and roundness), texture features (e.g., surface roughness and grain arrangement), and color-based properties (e.g., hue and saturation, which may indicate mineral composition). Additionally, fractal dimension analysis and Fourier descriptors have been employed to capture finer details of particle boundaries. While numerous variables have been explored in PSD studies, emphasizing the most reliable and commonly used attributes ensures more accurate and efficient soil classification and analysis [70,71].
One of the challenges in creating soil image datasets is the prevalence of class imbalance, where certain soil types are overrepresented compared to others. To address this issue, data augmentation techniques are often employed to balance class distributions and enrich the dataset. Traditional augmentation methods include operations such as rotation, translation, scaling, flipping, cropping, grayscale adjustment, adding noise, blurring, and radiometric transformations. These techniques are effective in increasing dataset diversity without introducing significant computational complexity.
In addition to traditional approaches, non-traditional data augmentation methods have gained prominence. These include active learning-based enhancement and model-based generation techniques. Among model-based methods, Generative Adversarial Networks (GANs) [67] are widely recognized. GANs consist of two components: a generator and a discriminator. The generator produces synthetic data, while the discriminator evaluates the authenticity of the data. Through an adversarial training process, both components iteratively optimize, resulting in synthetic data that closely resembles real data. GANs have demonstrated significant utility in image generation, style transfer, and data augmentation; however, they may encounter challenges such as mode collapse and training instability.
Variational Autoencoders (VAEs) [72] represent another advanced data generation method. Unlike traditional autoencoders, VAEs introduce probabilistic modeling in the latent space, which enhances the diversity and continuity of generated data. VAEs comprise two components: an encoder and a decoder. The encoder maps input data to a probability distribution in the latent space, while the decoder samples from this distribution to reconstruct the data. This probabilistic framework allows VAEs to excel in applications such as image generation, dimensionality reduction, and anomaly detection.
Figure 6 illustrates the primary methods employed for data augmentation, highlighting both traditional and non-traditional approaches.
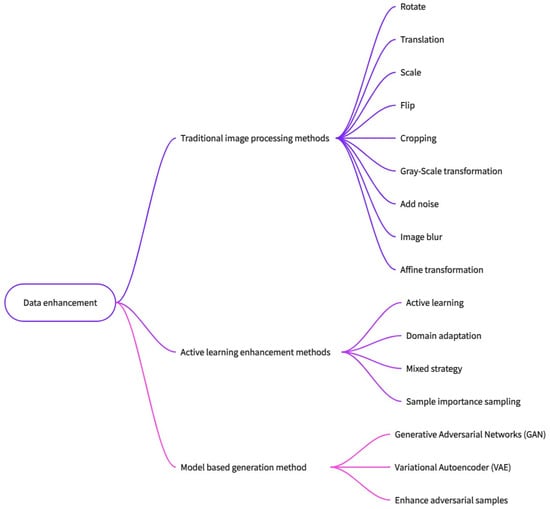
Figure 6.
Methods for enhancing image data.
4.2. Data Evaluation Method
To accurately assess the performance of deep learning models, commonly used evaluation strategies include splitting datasets into training and test sets, typically using an 8:2 or 7:3 ratio. To mitigate the risk of overfitting, cross-validation techniques such as k-fold cross-validation are frequently employed. The k-fold cross-validation method [73,74,75,76,77,78] involves partitioning the dataset into k equally sized subsets. Each subset is iteratively used as the validation set, while the remaining k−1 subsets serve as the training set. This process ensures that every subset is used once for validation. The final model evaluation metric is derived by averaging the performance metrics across all k iterations. A typical choice for k is 10, as it provides a robust balance between computational efficiency and model evaluation accuracy. By testing the model’s performance on various combinations of training and validation sets, this method effectively evaluates the model’s generalization capability [79].
Hyperparameter optimization, such as tuning the learning rate, network depth, and batch size, is another critical strategy for enhancing model performance [80]. These optimizations can significantly affect convergence speed, accuracy, and overall model robustness.
For soil image datasets, alternative methods such as the holdout method and bootstrap method are also valuable. The holdout method plays a pivotal role in modeling and evaluating soil datasets, especially for image data. This approach involves splitting the dataset into three mutually exclusive parts: training, validation, and test sets. For soil image datasets, the training set is utilized to learn soil features (e.g., particle structure and color distribution), the validation set is used for hyperparameter tuning, and the test set evaluates the model’s generalization performance on unseen data. A common allocation is 60–80% for the training set, and 10–20% each for the validation and test sets.
This method is particularly suitable for handling large-scale soil image datasets, such as those derived from remote sensing or microscopic imaging. Its simplicity and computational efficiency make it ideal for preliminary model evaluations. However, class imbalance issues often observed in soil image datasets—where certain soil types are underrepresented—can compromise the representativeness of the training or test sets. This, in turn, may reduce the reliability of the evaluation outcomes. Addressing this challenge often requires stratified sampling or synthetic data augmentation techniques.
The complete workflow of the holdout method for soil image data processing is depicted in Figure 7, illustrating the division of datasets and the corresponding steps in model training, validation, and evaluation.
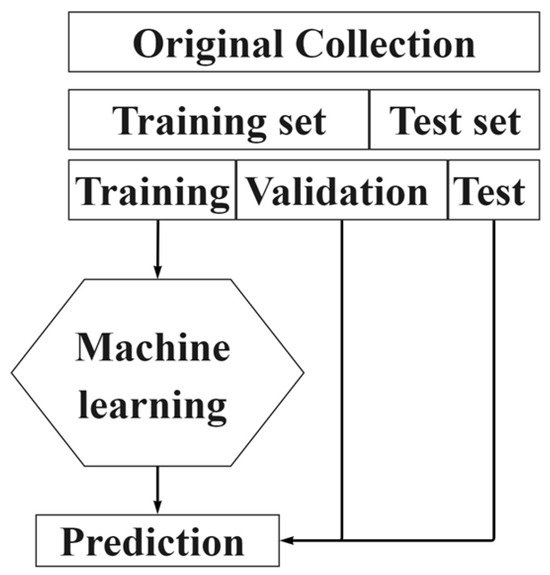
Figure 7.
Division of dataset for the training process.
4.3. Evaluation Index
The bootstrap method, a resampling technique, is extensively applied in model evaluation and statistical analysis. This method involves randomly selecting samples from the original dataset to generate multiple bootstrap sample sets. Each bootstrap sample set is typically the same size as the original dataset. However, due to the resampling process, certain data points may be selected multiple times, while others may not be included at all [81]. This inherent characteristic enables the bootstrap method to provide robust evaluations by leveraging diverse subsets of the data.
The primary advantage of the bootstrap method is its capacity to maximize the utility of limited samples, particularly in scenarios where the dataset size is small or acquiring additional data is challenging. By repeatedly resampling, the method facilitates training and validating models on various sample combinations, yielding a more comprehensive assessment of model performance. Furthermore, the bootstrap method effectively reduces the risk of overfitting by providing repeated evaluations, thereby enhancing the reliability of the results.
Beyond model evaluation, the bootstrap method is also employed to estimate the distribution of statistical metrics and construct confidence intervals. By generating a large number of bootstrap replicates, it becomes possible to quantify the uncertainty associated with model predictions or statistical estimates. This flexibility and versatility make the bootstrap method a valuable tool in machine learning and statistical applications.
Table 6 lists common model performance indicators in machine learning, each playing a crucial role in evaluating ResNet-based soil classification. Accuracy, while intuitive, is less reliable in imbalanced soil datasets, where ResNet may classify dominant soil types well but struggle with rare categories. Precision is useful for identifying specific soil types, such as saline-alkali soil, reducing misclassification, but it may overlook less-frequent categories. Recall ensures critical soil types, like cultivated land, are not missed, though a high recall may introduce false positives. To balance these trade-offs, the F1-score is particularly beneficial in ResNet applications, as it provides a harmonic mean of precision and recall, effectively handling imbalanced classifications. The AUC-ROC curve is advantageous for binary classifications, such as distinguishing cultivated from non-cultivated land, showcasing ResNet’s ability to differentiate complex patterns, though multi-class applications increase its computational complexity. Meanwhile, the Confusion Matrix helps analyze misclassification patterns, offering insights into how ResNet confuses different soil types and guiding model optimization. Given ResNet’s deep feature extraction capabilities, a combination of F1-score, AUC-ROC, and Confusion Matrix provides a comprehensive evaluation, ensuring robust and precise soil classification across diverse datasets. The quantitative analysis indicators for soil identification based on ResNet are shown in Figure 8.
Table 6.
Comparison table of performance evaluation indicators for deep learning models.
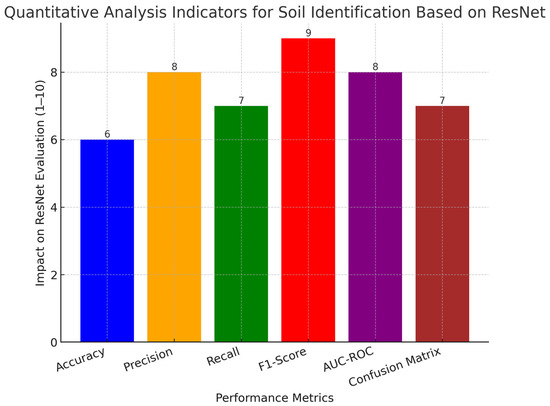
Figure 8.
Quantitative analysis indicators for soil identification based on ResNet.
5. Application Scenarios
The application of ResNet (Residual Network) in soil science has emerged as a pivotal tool for addressing challenges related to soil monitoring, analysis, and prediction. Leveraging its deep network architecture and residual learning mechanism, ResNet demonstrates exceptional capability in processing complex soil data. Its applications span diverse domains, including soil classification, soil moisture monitoring, pollution detection, and soil quality assessment.
Through deep learning, ResNet can autonomously extract features from soil images and sensor data, enabling the integration and effective fusion of multi-source datasets. This capability enhances the precision and reliability of predictions and analytical outcomes. The adaptability and robustness of ResNet make it highly suitable for precision agriculture, environmental monitoring, and ecological restoration.
By facilitating intelligent and automated approaches to soil research, ResNet is driving significant advancements in the field, paving the way for innovative solutions to critical environmental and agricultural challenges.
5.1. Classification of Soil Types
The principle of soil type classification using ResNet primarily relies on the deep residual network’s robust feature extraction capabilities. ResNet addresses challenges such as gradient vanishing and degradation, commonly encountered in deep networks, through the “skip connection” structure within residual blocks. This mechanism allows the network to effectively learn subtle and intricate features from soil images at deeper levels.
Specifically, when a soil image is input into the network, the initial layers focus on extracting basic features such as edges and textures. As the data progresses through deeper residual blocks, the network captures increasingly complex and abstract features. These features are subsequently integrated and analyzed in the classification layer, enabling the model to accurately differentiate between various soil types.
The operational principle of soil type classification with ResNet is visually illustrated in Figure 9.

Figure 9.
Schematic diagram of cross ResNet-based soil type classification.
Traditional soil classification usually depends on physical and chemical laboratory analysis, such as the determination of particle size distribution, soil organic matter content, pH value, salinity, nitrogen, phosphorus, potassium and other nutrients. These methods require a large number of field samplings, experimental operations and data analyses, which are time-consuming, high-cost, and the results are easily affected by human subjective factors. For example, the world soil classification system [95] (WRB) and the United States soil classification system [96] (USDA soil taxonomy) classify soils through a series of standardized features. Compared with traditional methods, image-based soil classification has the following advantages: (A) non-invasive and wide range: using remote sensing images or UAV ground images can obtain soil surface features non-invasively, covering a large area, especially in large-scale agricultural production. (B) Fast and efficient: compared with traditional manual analysis and laboratory testing, image-based soil classification methods can significantly improve the efficiency of data processing and reduce human interference. (C) Diversity of data sources: remote sensing images, UAV images and ground sensor data can be used at the same time to provide multi-dimensional and multi-level information and improve the accuracy of soil type classification. With the rapid development of deep learning, especially the success of ResNet in the task of image recognition, the potential of soil image classification using these technologies is gradually emerging. The comparison between traditional soil classification methods and ResNet soil image classification methods is shown in Table 7.
Table 7.
Comparison table of traditional soil classification methods and ResNet soil image classification methods.
The soil image dataset for classification is sourced from Kaggle [98]. The dataset is divided into two categories: the training set and the test set. Data collection is a crucial step in any data-related task, requiring careful and organized gathering of relevant information from various sources. This process involves determining the specific information needed and identifying the appropriate sources for obtaining it [99]. The process of soil type classification is illustrated in Figure 10.

Figure 10.
Flowchart of soil type classification.
In their research into soil classification, scholars worldwide have extensively explored the application of artificial intelligence and deep learning technologies to replace traditional manual methods. Internationally, research has primarily focused on developing universal and cross-regional soil classification algorithms [100]. Foreign scholars have employed models such as ResNet to enhance the model’s generalization ability by utilizing a large volume of annotated data. ResNet and other models have shown superiority in extracting fine features from high-resolution remote sensing [101] and satellite images [102]. Additionally, foreign researchers have integrated ResNet with convolutional neural networks (CNN), generative adversarial networks (GAN), and other technologies to develop innovative frameworks that address the loss of detail in complex soil images. European and American countries also use ResNet to monitor soil pollution and detect organic matter and heavy metal content in the soil through multispectral data, thus supporting soil environmental monitoring efforts. For example, foreign researchers conducting soil type recognition tests based on subgraph selection have demonstrated that decision-making using the highest subgraph recognition probability yields stable classification results. This approach has been shown to significantly enhance the accuracy of soil type recognition in machine vision applications, ensuring more reliable and consistent identification outcomes [103].
In contrast, China focuses more on localization and practicality in applying deep learning to soil classification. Domestic researchers widely use ResNet to automatically identify soil types and optimize the model for complex terrains and diverse soil types. For instance, some domestic scholars have enhanced ResNet by adding convolution layers and feature extraction modules to improve the model’s adaptability to regional soil characteristics. Additionally, there is an increasing use of ResNet for high-resolution remote sensing and UAV images, which boosts its practical value in farmland classification, land resource management, and other applications. In precision agriculture, ResNet aids in farmland soil classification, providing intelligent support for agricultural planting and water resource management.
Validation methods for large-scale soil type classification are essential to ensure model accuracy and generalizability across diverse regions. Cross-validation, particularly k-fold cross-validation, is commonly used to assess model robustness by training and testing on different dataset partitions. Independent test set evaluation further validates performance by using unseen soil data to measure real-world applicability. Field validation, involving on-site soil sampling and expert analysis, provides ground-truth verification by comparing predicted classifications with actual soil properties. Remote sensing validation, using satellite or UAV imagery, helps assess classification accuracy over extensive areas. Additionally, statistical metrics such as confusion matrix, F1-score, AUC-ROC, and kappa coefficient quantify classification performance and highlight potential misclassifications. A combination of these methods ensures comprehensive validation, supporting reliable large-scale soil type classification [104].
ResNet should deliver satisfactory classification performance after validation, demonstrating high accuracy, strong generalization, and effective feature extraction across diverse soil datasets. Through cross-validation, independent test set evaluation, and field validation, its performance can be measured using precision, recall, F1-score, and AUC-ROC metrics. A well-validated ResNet model should consistently minimize misclassification errors, accurately distinguish between soil types, and maintain stability even in complex or imbalanced datasets. Furthermore, successful validation against ground-truth soil samples and remote sensing data would confirm its reliability for large-scale soil classification, ensuring its practical applicability in real-world scenarios.
In China, the integration of deep learning with traditional soil analysis methods is also emphasized, with the optimization of classification models being supported by soil physical and chemical properties. For example, by combining physical analysis with the ResNet model, soil chemical composition or physical properties are used as auxiliary input data to improve model classification accuracy. These practices highlight the different emphases in soil classification research and application between China and abroad, with China focusing more on the localization, adaptability, and practical use of models, while foreign research tends to prioritize universality and cross-regional optimization.
5.2. Soil Health Assessment
The principle of soil health assessment based on ResNet involves analyzing the soil’s health status using deep learning models, typically utilizing remote sensing images or soil sample images. ResNet’s unique residual structure addresses the gradient vanishing problem in deep networks by introducing residual connections, enabling effective extraction of key soil characteristics such as soil type, structural changes, pollution levels, and other factors impacting soil health. This capability allows ResNet to perform exceptionally well in processing large-scale, complex soil image data. By training the ResNet model, it can identify and classify the physical, chemical, and biological characteristics of soil, including organic matter content, nutrient distribution, microbial activity, and potential pollution, providing a scientific basis for soil health assessments. The ResNet method can efficiently process complex image data, quickly and accurately assess soil health, and is especially effective for remote sensing image analysis and large-scale soil monitoring. This contributes to dynamic monitoring and management decision-making for soil quality. The training process follows the same procedure as outlined in the previous section, with the assessment of soil health being a more in-depth interpretation and understanding of the images.
ResNet can also be applied to the assessment of soil fertility, utilizing its deep feature extraction capabilities to analyze key soil properties such as texture, organic matter content, moisture levels, and nutrient distribution from high-resolution soil images. By training on large-scale soil datasets, ResNet can effectively classify fertility levels based on spectral, structural, and morphological characteristics. Through multi-modal data integration, including remote sensing imagery, microscopic soil images, and laboratory-tested soil parameters, ResNet enhances the accuracy of fertility assessments. Additionally, quantitative validation using ground-truth measurements ensures the model’s reliability in predicting soil productivity. The ability of ResNet to learn complex patterns in soil composition makes it a valuable tool for precision agriculture, land management, and sustainable farming practices, supporting efficient decision-making for soil improvement strategies [105].
Compared with traditional soil health assessment methods, deep learning-based methods such as ResNet offer significant advantages. Traditional methods rely heavily on physical, chemical, and biological analysis of soil samples, which are labor-intensive, localized, time-consuming, and prone to human error. In contrast, ResNet and similar deep learning models can quickly process a vast amount of soil data through remote sensing or soil sample images, automatically extract critical features such as soil type, pollution levels, and nutrient distribution, thus improving both the accuracy and efficiency of the evaluation. The residual structure of ResNet effectively mitigates the gradient vanishing issue in deep networks, ensuring excellent performance in processing complex and large-scale data. This makes it highly suitable for large-scale soil health monitoring, providing real-time, scientific decision support for soil management. The comparison table is shown in Table 8.
Table 8.
Comparison table of traditional methods and soil health assessment methods combined with deep learning.
The research on soil health assessment, both domestically and internationally, has made rapid progress, particularly with the application of remote sensing technology, deep learning, and data fusion methods. Remote sensing, especially high-resolution satellite and UAV images, combined with machine learning and deep learning techniques, is widely used in foreign research to assess soil health. For instance, studies in the United States and Europe utilize remote sensing images to extract the physical and chemical characteristics of soil and apply methods such as support vector machines and random forests for analysis. In recent years, the accuracy and efficiency of soil health assessments have been significantly improved through the use of deep learning, particularly convolutional neural networks (CNN) and the ResNet model. Additionally, multidimensional data fusion has become a key research direction abroad, combining remote sensing data, climate data, soil sampling data, and GIS to enhance the comprehensiveness of soil health assessments [112].
In China, research on soil health assessment primarily focuses on agricultural production and ecological environmental protection. With the growing demand for precision agriculture, remote sensing technology and geographic information systems (GIS) are gradually being incorporated into domestic research for monitoring and evaluating soil quality, particularly in arid and saline-alkali regions. The application of deep learning techniques for soil health assessment has gradually emerged in China, with researchers applying methods like CNN and long short-term memory networks (LSTM) to improve the accuracy of assessments using UAV and ground sampling images. More recently, domestic research has been exploring the use of ResNet and other deep neural network models to analyze remote sensing images, thereby extracting multidimensional soil characteristics.
By leveraging ResNet and other deep learning models to analyze soil images, key features can be effectively identified and evaluated, providing a scientific basis for soil health evaluation and management. Soil health can be accurately assessed through classification (e.g., health, damage) or regression (e.g., organic matter content) using trained models, optimized with appropriate loss functions and optimizers. The model’s effectiveness in soil health analysis is verified through evaluation on an independent test set, offering valuable insights for agricultural management and sustainable development. The general process is shown in Figure 11.
Figure 11.
Flowchart of soil health assessment.
6. Conclusions and Prospects
With the continuous advancement of deep learning technologies, particularly the application of the residual network (ResNet) in soil science, significant progress has been made. ResNet, through its unique residual learning mechanism, effectively addresses the gradient vanishing problem encountered during the training of traditional deep neural networks, allowing the model to perform deeper learning and extract complex features from soil data. This mechanism ensures that information flow is maintained in deeper network structures, preventing the loss of important features as the network depth increases, making ResNet highly effective in processing soil image data.
In soil science, the application potential of ResNet is primarily evident in soil type classification and soil health assessment. In soil type classification, ResNet extracts soil features from images, enabling the rapid and accurate differentiation of soil types, thus providing a scientific basis for agricultural management and land use planning. In soil health assessment, when combined with remote sensing images, soil sensor data, and other multi-source data, ResNet can more accurately evaluate soil health, detect pollution, nutrient deficiencies, and other issues, offering valuable data support for land governance and ecological restoration.
Additionally, with the continuous progress in remote sensing and soil sensor technologies, ResNet can integrate more diverse soil information, including moisture, temperature, and nutrient content. This enables more accurate, real-time decision support for agricultural production, precision irrigation, environmental protection, and other sectors. By fusing multimodal data, ResNet not only enhances the accuracy of soil information extraction but also plays a critical role in improving the sustainable management of land resources. These technological advancements not only drive the in-depth study of soil science but also provide a robust technical foundation for practical applications.
While ResNet demonstrates significant advantages in soil science applications, it is equally important to address the challenges and limitations associated with its implementation. One notable challenge is data heterogeneity, as soil data come from various sources, including remote sensing images, field sensors, and laboratory analyses, each with different resolutions, formats, and noise levels. The integration of such diverse datasets requires extensive preprocessing techniques to ensure consistency and compatibility. Additionally, high computational demands pose another limitation, particularly in real-time monitoring and edge computing applications. Deep ResNet architectures require substantial processing power and memory, making deployment on low-resource devices challenging. Furthermore, interpretability and model transparency remain concerns, as deep learning models, including ResNet, often function as “black boxes,” making it difficult to understand their decision-making process. This can hinder trust and adoption in scientific and agricultural communities. Lastly, domain-specific limitations, such as the scarcity of high-quality labeled soil datasets, can affect the model’s generalization ability. Addressing these challenges through data standardization, model optimization, and explainability methods will be crucial for advancing the practical applications of ResNet in soil science.
Looking ahead, the application of ResNet in soil science will expand further with advances in remote sensing, sensor technology, and big data analysis. Multi-source data fusion has become crucial for improving the accuracy of soil information extraction. By integrating multi-modal data such as remote sensing images, soil sensors, and meteorological data, ResNet will offer more precise soil analysis across various dimensions and scales. As computational demands increase, model optimization and lightweight techniques become essential for enhancing ResNet’s efficiency in soil science applications. Pruning reduces model complexity by removing redundant neurons and filters, enabling faster inference while maintaining accuracy, which is particularly beneficial for real-time soil classification and field-based analysis. Quantization further improves efficiency by reducing the precision of model weights and activations, making ResNet more suitable for low-power edge computing and remote sensing applications. Additionally, knowledge distillation transfers knowledge from a larger, more complex ResNet model to a smaller, more efficient version, ensuring that high-level features relevant to soil texture, moisture content, and fertility assessment are retained. By integrating these optimization techniques, ResNet can achieve higher processing speed, lower energy consumption, and greater adaptability, making it a practical tool for large-scale soil monitoring and precision agriculture. Furthermore, real-time monitoring and prediction are poised to be key areas of research. Leveraging deep learning and real-time data, ResNet will enable the real-time prediction of critical indicators such as soil moisture and health status, providing vital support for agricultural and environmental management decisions. Simultaneously, as computational demands increase, model optimization and lightweight technologies will become essential research directions to enhance computational efficiency [113].
Author Contributions
Conceptualization, G.Y.; investigation, W.W. and H.L.; resources, X.L.; data curation, W.W. and X.L.; writing—original draft preparation, W.W.; visualization, L.H.; supervision, G.Y.; funding acquisition, G.Y. and L.H. All authors have read and agreed to the published version of the manuscript.
Funding
The research was funded by the Scientific and Technological Cooperation and Exchange Project of Shanxi Province (202204041101018), the Special Fund for Science and Technology Innovation Teams of Shanxi Province (202304051001016 and 202204051002026), the Central Guidance on Local Science and Technology Development Fund of Shanxi Province (YDZJSX2024D051), the Graduate Joint Training Demonstration Base (2024JD11), and the Graduate Research Innovation Project in Shanxi Province (2024KY651).
Data Availability Statement
The data are available on request from the authors. The data are not publicly available due to confidentiality agreements.
Conflicts of Interest
The authors declare that the research was conducted in the absence of any commercial or financial relationships that could be construed as potential conflicts of interest.
References
- Pandian, A.J.; Kanchanadevi, K.; Rajalakshmi, N.R.; Arulkumaran, G. An Improved Deep Residual Convolutional Neural Network for Plant Leaf Disease Detection. Comput. Intell. Neurosci. 2022, 2022, 5102290. [Google Scholar] [CrossRef]
- Wu, L.; Wang, M.; Mao, D.; Li, X.; Wang, Z. Temperature related to the spatial heterogeneity of wetland soil total nitrogen content in a frozen zone. Soil Tillage Res. 2024, 244, 106254. [Google Scholar] [CrossRef]
- Schofield, E.J.; Brooker, R.; Rowntree, J.K. Plant-plant competition influences temporal dynamism of soil microbial enzyme activity. Soil Biol. Biochem. 2019, 139, 107615. [Google Scholar] [CrossRef]
- Hu, Z.; Zhang, J.; Ge, Y. Handling Vanishing Gradient Problem Using Artificial Derivative. IEEE Access 2021, 9, 22371–22377. [Google Scholar] [CrossRef]
- Borawar, L.; Kaur, R. ResNet: Solving Vanishing Gradient in Deep Networks; Springer Nature: Singapore, 2022; Volume 600, p. 11t. [Google Scholar]
- Chen, Y.; Tarchitzky, J.; Brouwer, J.; Morin, J.; Banin, A. Scanning Electron-microscope Observations on Soil Crusts and Their Formation. Soil Sci. 1980, 130, 49–55. [Google Scholar] [CrossRef]
- Shin, S.; Lee, I.; Park, B.C.; Song, J. Applications of deep learning-based denoising methodologies for scanning electron microscope images. Meas. Sci. Technol. 2025, 36, 15406. [Google Scholar] [CrossRef]
- Delpupo, F.V.B.; Liberti, E.A.; Baptista, J.D.S.; de Oliveira, F. Light and scanning electron microscope characterization of mandibular symphysis tissue as a functional adaptation in the mandible development of human fetuses. J. Anat. 2025, 246, 222–233. [Google Scholar] [CrossRef]
- Zhou, S.; Xiao, Y.; Song, E. Generalized model of the cracks in the expansive soil and the slope stability based on the long-distance optical microscope system. Acta Microsc. 2020, 29, 3190–3199. [Google Scholar]
- Attota, R.; Silver, R. Optical microscope angular illumination analysis. Opt. Express 2012, 20, 6693–6702. [Google Scholar] [CrossRef]
- Dolleiser, M.; Hashemi-Nezhad, S. A fully automated optical microscope for analysis of particle tracks in solids. Nucl. Instrum. Methods Phys. Res. Sect. B-Beam Interact. Mater. Atoms 2002, 198, 98–107. [Google Scholar] [CrossRef]
- Lee, T.C.; Hung, W.C.; Tsai, M.; Lin, C.; Hsiao, F. Defect detection of optical microscope images in semiconductor fabrication process based on pre-trained convolution neural network. IET Conf. Proc. 2025, 2024, 102–103. [Google Scholar] [CrossRef]
- Boulc’H, P.; Clouet, V.; Ghukasyan, G.; Niogret, M.; Leport, L.; Musse, M. Microscopy and Transcriptomic Datasets for Investigating the Drought-stress Response and Recovery in Young and Early Senescent-old Leaves from Brassica Napus. Data Brief 2024, 57, 111130. [Google Scholar] [CrossRef] [PubMed]
- Kim, K.; Kim, K.; Kim, J.; Min, J.; Lee, H.; Lee, J. Development of the 3D volumetric micro-CT scanner for preclinical animals. 3D Res. 2011, 2, 1–6. [Google Scholar] [CrossRef]
- Panetta, D.; Belcari, N.; Del Guerra, A.; Bartolomei, A.; Salvadori, P.A. Analysis of image sharpness reproducibility on a novel engineered micro-CT scanner with variable geometry and embedded recalibration software. Phys. Medica 2012, 28, 166–173. [Google Scholar] [CrossRef]
- Baginski, S. Principles of Fluorescence Microscopy. Folia. Morphol. 1964, 23, 347–355. [Google Scholar]
- Son, J.; Saveljev, V.V.; Kim, K.; Park, M.; Kim, S. Comparisons of Perceived Images in Multiview and Integral Photography Based Three-Dimensional Imaging Systems. Jpn. J. Appl. Phys. 2007, 46, 1057–1059. [Google Scholar] [CrossRef]
- Nozdriukhin, D.; Kalva, S.K.; Ozsoy, C.; Reiss, M.; Li, W.; Razansky, D.; Dean-Ben, X.L. Multi-Scale Volumetric Dynamic Optoacoustic and Laser Ultrasound (OPLUS) Imaging Enabled by Semi-Transparent Optical Guidance. Adv. Sci. 2024, 11, 2306087. [Google Scholar] [CrossRef]
- Usuki, S.; Kuwae, K.; Sekine, T.; Miura, K.T. Super-Resolution and Optical Phase Retrieval Using Ptychographic Structured Illumination Microscopy. Int. J. Precis. Eng. Manuf. 2024, 25, 1813–1821. [Google Scholar] [CrossRef]
- Carter, M.R.; Gregorich, E.G. Soil Sampling and Methods of Analysis. Eur. J. Soil Sci. 2008, 59, 22. [Google Scholar] [CrossRef]
- Alves, V.; Dos Santos, J.M.; Pinto, E.; Ferreira, I.M.P.L.; Lima, V.A.; Felsner, M.L. Digital Image Processing Combined with Machine Learning: A New Strategy for Brown Sugar Classification. Microchem. J. 2024, 196, 109604. [Google Scholar] [CrossRef]
- Adugna, T.D.; Ramu, A.; Haldorai, A. A Review of Pattern Recognition and Machine Learning. J. Mach. Comput. 2024, 4, 210–220. [Google Scholar] [CrossRef]
- Gong, Z.; Ge, W.; Guo, J.; Liu, J. Satellite remote sensing of vegetation phenology: Progress, challenges, and opportunities. Isprs-J. Photogramm. Remote Sens. 2024, 217, 149–164. [Google Scholar] [CrossRef]
- Liu, H.; Hu, B.; Hou, X.; Yu, T.; Zhang, Z.; Liu, X.; Liu, J.; Wang, X. Real-Time Registration of Unmanned Aerial Vehicle Hyperspectral Remote Sensing Images Using an Acousto-Optic Tunable Filter Spectrometer. Drones 2024, 8, 329. [Google Scholar] [CrossRef]
- Mann, J.; Maddox, E.; Shrestha, M.; Irwin, J.; Czapla-Myers, J.; Gerace, A.; Rehman, E.; Raqueno, N.; Coburn, C.; Byrne, G.; et al. Landsat 8 and 9 Underfly International Surface Reflectance Validation Collaboration. Remote Sens. 2024, 16, 1492. [Google Scholar] [CrossRef]
- Senty, P.; Guzinski, R.; Grogan, K.; Buitenwerf, R.; Ardoe, J.; Eklundh, L.; Koukos, A.; Tagesson, T.; Munk, M. Fast Fusion of Sentinel-2 and Sentinel-3 Time Series over Rangelands. Remote Sens. 2024, 16, 1833. [Google Scholar] [CrossRef]
- Attard, M.R.G.; Phillips, R.A.; Bowler, E.C.P.J.; Cubaynes, H.; Johnston, D.W.; Fretwell, P.T. Review of Satellite Remote Sensing and Unoccupied Aircraft Systems for Counting Wildlife on Land. Remote Sens. 2024, 16, 627. [Google Scholar] [CrossRef]
- Kemppinen, J.; Niittynen, P.; Riihimaki, H.; Luoto, M. Modelling soil moisture in a high-latitude landscape using LiDAR and soil data. Earth Surf. Process. Landf. 2018, 43, 1019–1031. [Google Scholar] [CrossRef]
- Qin, B.; Cao, B.; Roujean, J.; Gastellu-Etchegorry, J.P.; Ermida, S.L.; Bian, Z.; Du, Y.; Hu, T.; Li, H.; Xiao, Q.; et al. A thermal radiation directionality correction method for the surface upward longwave radiation of geostationary satellite based on a time-evolving kernel-driven model. Remote Sens. Environ. 2023, 294, 113599. [Google Scholar] [CrossRef]
- Han, H.; Lee, H. Inter-satellite atmospheric and radiometric correction for the retrieval of Landsat sea surface temperature by using Terra MODIS data. Geosci. J. 2012, 16, 171–180. [Google Scholar] [CrossRef]
- Zhang, W.; Wu, W.; Cui, Y.; Wang, W. HJ-1-A/B Optical Satellite Image Geometric Correction. In Proceedings of the 35th International Symposium on Remote Sensing of Environment (ISRSE35), Beijing, China, 22–26 April 2013; p. 12221. [Google Scholar]
- Crespo, N.; Padua, L.; Santos, J.A.; Fraga, H. Satellite Remote Sensing Tools for Drought Assessment in Vineyards and Olive Orchards: A Systematic Review. Remote Sens. 2024, 16, 2040. [Google Scholar] [CrossRef]
- Ji, Z.; Xu, J.; Yan, L.; Ma, J.; Chen, B.; Zhang, Y.; Zhang, L.; Wang, P. Satellite Remote Sensing Images of Crown Segmentation and Forest Inventory Based on BlendMask. Forests 2024, 15, 1320. [Google Scholar] [CrossRef]
- Wang, H.; Zhang, G.; Yang, Z.; Xu, H.; Liu, F.; Xie, S. Satellite Remote Sensing False Forest Fire Hotspot Excavating Based on Time-Series Features. Remote Sens. 2024, 16, 2488. [Google Scholar] [CrossRef]
- Cheng, J.; Deng, C.; Su, Y.; An, Z.; Wang, Q. Methods and Datasets on Semantic Segmentation for Unmanned Aerial Vehicle Remote Sensing Images: A Review. ISPRS-J. Photogramm. Remote Sens. 2024, 211, 1–34. [Google Scholar] [CrossRef]
- Hao, G.; Dong, Z.; Hu, L.; Ouyang, Q.; Pan, J.; Liu, X.; Yang, G.; Sun, C. Biomass Inversion of Highway Slope Based on Unmanned Aerial Vehicle Remote Sensing and Deep Learning. Forests 2024, 15, 1564. [Google Scholar] [CrossRef]
- Li, Y.; Du, C.; Zhang, T.; Ge, Y.; Liu, W.; Yuan, S.; Liu, X. Estimation of citrus leaves’ nitrogen content by multispectral unmanned aerial vehicle remote sensing based on semi-supervised twin neural network regression. J. Appl. Remote Sens. 2024, 18, 1117. [Google Scholar] [CrossRef]
- Yang, S.; Gao, J.; Zhang, J.; Xu, C. Wrapped Phase Denoising Using Denoising Diffusion Probabilistic Models. IEEE Geosci. Remote Sens. Lett. 2024, 21, 1–5. [Google Scholar] [CrossRef]
- Wang, W.; Yang, Y. A histogram equalization model for color image contrast enhancement. Signal Image Video Process. 2024, 18, 1725–1732. [Google Scholar] [CrossRef]
- Singh, A.; Kumar, N. A Global-Local Contrast based Image Enhancement Technique based on Local Standard Deviation. Int. J. Comput. Appl. 2014, 93, 975–8887. [Google Scholar] [CrossRef]
- Li, X.; Liu, M.; Ling, Q. Pixel-Wise Gamma Correction Mapping for Low-Light Image Enhancement. IEEE Trans. Circuits Syst. Video Technol. 2024, 34, 681–694. [Google Scholar] [CrossRef]
- Handayani, V.W.; Yudianto, A.; Sylvia, M.A.R.M.; Rulaningtyas, R.; Caesarardhi, M.R. Classification of Indonesian adult forensic gender using cephalometric radiography with VGG16 and VGG19: A Preliminary research. Acta Odontol. Scand. 2024, 83, 308–316. [Google Scholar] [CrossRef]
- Lu, X.; Wang, H.; Zhang, J.; Zhang, Y.; Zhong, J.; Zhuang, G. Research on J wave detection based on transfer learning and VGG16. Biomed. Signal Process. Control 2024, 95, 106420. [Google Scholar] [CrossRef]
- Rajab, M.A.; Abdullatif, F.A.; Sutikno, T. Classification of grapevine leaves images using VGG-16 and VGG-19 deep learning nets. TELKOMNIKA (Telecommun. Comput. Electron. Control.) 2024, 22, 445–453. [Google Scholar] [CrossRef]
- Hasan, S.H.; Hasan, S.H.; Khan, U.A.; Hasan, S.H. Containerized deep learning in agriculture: Orchestrating GoogleNet with Kubernetes on high performance computing. Concurr. Comput.-Pract. Exp. 2024, 36, 8116. [Google Scholar] [CrossRef]
- Wang, L. Multimodal robotic music performance art based on GRU-GoogLeNet model fusing audiovisual perception. Front. Neurorobotics 2024, 17, 1324831. [Google Scholar] [CrossRef]
- Wang, Y.; Zou, Y.; Hu, W.; Chen, J.; Xiao, Z. Intelligent fault diagnosis of hydroelectric units based on radar maps and improved GoogleNet by depthwise separate convolution. Meas. Sci. Technol. 2024, 35, 25103. [Google Scholar] [CrossRef]
- Dasari, H.A.; Rammohan, A. A Novel Image Recognition Based Fault Diagnostics of Customized EV Battery Pack Using Optimized GoogLeNet. Eng. Res. Express 2024, 6, 35363. [Google Scholar] [CrossRef]
- Al-Qudah, S.; Yang, M. Effective Hybrid Structure Health Monitoring through Parametric Study of GoogLeNet. Ai 2024, 5, 1558–1574. [Google Scholar] [CrossRef]
- Ma, L.; Wu, H.; Samundeeswari, P. GoogLeNet-AL: A fully automated adaptive model for lung cancer detection. Pattern Recognit. 2024, 155, 110657. [Google Scholar] [CrossRef]
- He, K.; Zhang, X.; Ren, S.; Sun, J. Delving Deep into Rectifiers: Surpassing Human-Level Performance on ImageNet Classification. In Proceedings of the 2015 IEEE International Conference on Computer Vision (ICCV), Santiago, Chile, 13–16 December 2015. Volume 2015 International Conference on Computer Vision, ICCV 2015. [Google Scholar]
- Shafiq, M.; Gu, Z. Deep Residual Learning for Image Recognition: A Survey. Appl. Sci. 2022, 12, 8972. [Google Scholar] [CrossRef]
- Bello, I.; Fedus, W.; Du, X.; Cubuk, E.D.; Srinivas, A.; Lin, T.Y.; Shlens, J.; Zoph, B. Revisiting ResNets: Improved Training and Scaling Strategies. In Proceedings of the 35th Neural Information Processing Systems Conference, Online, 6–14 December 2021; Volume 2021, p. 35. [Google Scholar]
- Razavi, M.; Mavaddati, S.; Koohi, H. ResNet deep models and transfer learning technique for classification and quality detection of rice cultivars. Expert Syst. Appl. 2024, 247, 123276. [Google Scholar] [CrossRef]
- Veit, A.; Wilber, M.; Belongie, S. Residual networks behave like ensembles of relatively shallow networks. In Proceedings of the 30th Annual Conference on Neural Information Processing Systems, Barcelona, Spain, 5–10 December 2016. [Google Scholar]
- Zagoruyko, S.; Komodakis, N. Wide Residual Networks. arXiv 2016. [Google Scholar] [CrossRef]
- Chhapariya, K.; Buddhiraju, K.M.; Kumar, A. A Deep Spectral-Spatial Residual Attention Network for Hyperspectral Image Classification. IEEE J. Sel. Top. Appl. Earth Observ. Remote Sens. 2024, 17, 15393–15406. [Google Scholar] [CrossRef]
- Arabiat, M.; Abuowaida, S.; Al-Momani, A.; Alshdaifat, N.; Chan, H.Y. Depth Estimation Method Based on Residual Networks and Se-net Model. J. Theor. Appl. Inf. Technol. 2024, 102, 871–886. [Google Scholar]
- Lin, F.; Zhang, H.; Wang, J.; Wang, J. Unsupervised image enhancement under non-uniform illumination based on CNNs. Neural Netw. 2024, 170, 202–214. [Google Scholar] [CrossRef]
- Zhang, Y.; Fang, Z.; Fan, J. Generalization analysis of deep CNNs under maximum correntropy criterion. Neural Netw. 2024, 174, 106226. [Google Scholar] [CrossRef]
- Wang, X.; Liu, J. Spatially Regularized Leaky Relu In Dual Space for Cnn Based Image Segmentation. Inverse Probl. Imaging 2024, 18, 1320–1342. [Google Scholar] [CrossRef]
- Wang, W.; Kumm, Z.; Temerit Ho, C.; Zanesco-Fontes, I.; Texiera, G.; Reis, R.M. Unsupervised machine learning models reveal predictive clinical markers of glioblastoma patient survival using white blood cell counts prior to initiating chemoradiation. Neuro-Oncol. Adv. 2024, 6, 140. [Google Scholar] [CrossRef]
- Casimiro-Artes, M.A.; Hileno, R.; Garcia-De-Alcaraz, A. Applying Unsupervised Machine Learning Models to Identify Serve Performance Related Indicators in Women’s Volleyball. Res. Q. Exerc. Sport 2024, 95, 47–53. [Google Scholar] [CrossRef]
- Nagururu, N.V.; Lemaitre, C.; Wang, Z.; Lacy, A.; Balaji, N.; Hung, J.; Greenstein, J.L.; Taylor, C.O. Development of supervised and unsupervised machine learning models to differentiate cutaneous syndromes in post-stem cell transplant patients. J. Investig. Dermatol. 2024, 144, 40. [Google Scholar] [CrossRef]
- Jannat, J.N.; Islam, A.R.M.T.; Mia, M.Y.; Pal, S.C.; Biswas, T. Using unsupervised machine learning models to drive groundwater chemistry and associated health risks in Indo-Bangla Sundarban region. Chemosphere 2024, 351, 141217. [Google Scholar] [CrossRef]
- Shung, D.; Onofrey, J.; Viana, A.; Aslanian, H.R. Unsupervised Machine Learning Models for Polyp Image Databases Used for Computer-aided Diagnosis. Gastroenterology 2020, 158, 370–371. [Google Scholar] [CrossRef]
- Veeramani, M.; Doss, S.S.; Narasimhan, S.; Bhatt, N. Semi-supervised machine learning approach for reaction stoichiometry and kinetic model identification using spectral data from flow reactors. React. Chem. Eng. 2024, 9, 355–368. [Google Scholar] [CrossRef]
- Wang, Z.; Wang, Z.; Sun, J.; Li, Z.; Xi, S.; Wei, X.; Huang, W.; Zhou, C. Surrogate Model of Solved Poisson Kriging Method for Radiation Field Reconstruction. Nucl. Technol. 2025, 211, 332–343. [Google Scholar] [CrossRef]
- Thomas, J.C.; Shin, K.; Xie, X.J. Principal Component Analysis in Dental Research. Int. J. Oral Maxillofac. Implant. 2025, 40, 13–20. [Google Scholar] [CrossRef]
- Fu, X.; Leng, G.; Zhang, Z.; Huang, J.; Xu, W.; Xie, Z.; Wang, Y. Enhancing soil nitrogen measurement via visible-near infrared spectroscopy: Integrating soil particle size distribution with long short-term memory models. Spectroc. Acta Part A-Molec. Biomolec. Spectr. 2025, 327, 125317. [Google Scholar] [CrossRef] [PubMed]
- Marhoul, A.M.; Herza, T.; Kozak, J.; Janku, J.; Jehlicka, J.; Boruvka, L.; Mmecek, K.; Jetmar, M.; Polak, P. Approximation of the soil particle-size distribution curve using a NURBS curve. Soil Water Res. 2025, 20, 16–31. [Google Scholar] [CrossRef]
- Pandiri, D.N.; Kiran Murugan, R.; Goel, T. Smart soil image classification system using lightweight convolutional neural network. Expert Syst. Appl. 2024, 238, 122185. [Google Scholar] [CrossRef]
- Shiddiq, M.; Candra, F.; Anand, B.; Rabin, M.F. Neural network with k-fold cross validation for oil palm fruit ripeness prediction. TELKOMNIKA (Telecommun. Comput. Electron. Control.) 2024, 22, 164–174. [Google Scholar] [CrossRef]
- Liland, K.H.; Skogholt, J.; Indahl, U.G. A New Formula for Faster Computation of the K-Fold Cross-Validation and Good Regularisation Parameter Values in Ridge Regression. IEEE Access 2024, 12, 17349–17368. [Google Scholar] [CrossRef]
- Shebl, A.; Abriha, D.; Dawoud, M.; Ali, M.A.H.; Csamer, A. PRISMA vs. Landsat 9 in lithological mapping—A K-fold Cross-Validation implementation with Random Forest. Egypt. J. Remote Sens. Space Sci. 2024, 27, 577–596. [Google Scholar] [CrossRef]
- Tchakoucht, T.A.; Elkari, B.; Chaibi, Y.; Kousksou, T. Random forest with feature selection and K-fold cross validation for predicting the electrical and thermal efficiencies of air based photovoltaic-thermal systems. Energy Rep. 2024, 12, 988–999. [Google Scholar] [CrossRef]
- Hakmi, T.; Hamdi, A.; Laouissi, A.; Abderazek, H.; Chihaoui, S.; Yallese, M.A. Mathematical Modeling Using ANN Based on k-fold Cross Validation Approach and MOAHA Multi-Objective Optimization Algorithm During Turning of Polyoxymethylene POM-C. Jordan J. Mech. Ind. Eng. 2024, 18, 179–190. [Google Scholar] [CrossRef]
- Le, N.; Männel, B.; Jarema, M.; Luong, T.T.; Bui, L.K.; Vy, H.Q.; Schuh, H. K-Fold Cross-Validation: An Effective Hyperparameter Tuning Technique in Machine Learning on GNSS Time Series for Movement Forecast. In International Conference on Mediterranean Geosciences Union; Springer: Cham, Switzerland, 2021. [Google Scholar]
- Lei, L.; Yang, Q.; Yang, L.; Shen, T.; Wang, R.; Fu, C. Deep learning implementation of image segmentation in agricultural applications: A comprehensive review. Artif. Intell. Rev. 2024, 57, 1–59. [Google Scholar] [CrossRef]
- Bathurst, R.J.; Chenari, R.J. Estimation of Confidence in The Calculated Resistance Factor for Simple Limit States with Limited Data for Load and Resistance Model Bias. Can. Geotech. J. 2024, 61, 1968–1976. [Google Scholar] [CrossRef]
- Powers, W.D.M. Evaluation: From Precision, Recall and F-measure to Roc, Informedness, Markedness & Correlation. J. Mach. Learn. Technol. 2011, 2, 37–63. [Google Scholar] [CrossRef]
- Zhang, L.; Csanyi, G.; van der Giessen, E.; Maresca, F. Efficiency, accuracy, and transferability of machine learning potentials: To dislocations and cracks in iron. Acta Mater. 2024, 270, 119788. [Google Scholar] [CrossRef]
- Uwanuakwa, I.D.; Akpinar, P. Enhancing the reliability and accuracy of machine learning models for predicting carbonation progress in fly ash-concrete: A multifaceted approach. Struct. Concr. 2024, 25, 3020–3034. [Google Scholar] [CrossRef]
- Zontul, M.; Ersan, Z.; Gokalp Yelmen, I.; Cevik, T.; Anka, F.; Gesoglu, K. Enhancing GPS Accuracy with Machine Learning: A Comparative Analysis of Algorithms. Trait. Signal 2024, 41, 1441–1450. [Google Scholar] [CrossRef]
- Wu, J.; Singleton, S.S.; Bhuiyan, U.; Krammer, L.; Mazumder, R. Multi-omics approaches to studying gastrointestinal microbiome in the context of precision medicine and machine learning. Front. Mol. Biosci. 2024, 10, 1337373. [Google Scholar] [CrossRef]
- Kassab, M.; Zitar, R.A.; Barbaresco, F.; Seghrouchni, A.E.F. Drone Detection With Improved Precision in Traditional Machine Learning and Less Complexity in Single-Shot Detectors. IEEE Trans. Aerosp. Electron. Syst. 2024, 60, 3847–3859. [Google Scholar] [CrossRef]
- Pourtabib, J.; Hull, M.L. Significantly better precision with new machine learning versus manual image registration software in processing images from single-plane fluoroscopy to determine tibiofemoral kinematics following total knee replacement. J. Eng. Med. 2024, 238, 332–339. [Google Scholar] [CrossRef] [PubMed]
- Jaroy, E.G.; Risa, G.T.; Farstad, I.N.; Emblem, R.; Ougland, R. A recall-optimised machine learning framework for small data improves risk stratification for Hirschsprung’s disease. Inform. Med. Unlocked 2024, 48, 101530. [Google Scholar] [CrossRef]
- Hu, Y.; Ghadimi, P. In-depth analysis of recall initiators of medical devices with a Machine Learning-Natural language Processing workflow. arXiv 2024. [Google Scholar] [CrossRef]
- Villacis, A.H.; Badruddoza, S.; Mishra, A.K.; Mayorga, J. The role of recall periods when predicting food insecurity: A machine learning application in Nigeria. Glob. Food Secur.-Agric. Policy 2023, 36, 100671. [Google Scholar] [CrossRef]
- Parekh, D.H.; Dahiya, V. Predicting Breast Cancer using Machine Learning Classifiers and Enhancing the Output by Combining the Predictions to Generate Optimal F1-Score. Biomed. Biotech. Res. J. 2021, 5, 331–334. [Google Scholar] [CrossRef]
- Mudawi, N.A. Developing a Model for Parkinson’s Disease Detection Using Machine Learning Algorithms. Comput. Mater. Contin. 2024, 79, 4945–4962. [Google Scholar] [CrossRef]
- Markoulidakis, I.; Markoulidakis, G. Probabilistic Confusion Matrix: A Novel Method for Machine Learning Algorithm Generalized Performance Analysis. Technologies 2024, 12, 113. [Google Scholar] [CrossRef]
- Mijwil, M.M.; Aljanabi, M. A Comparative Analysis of Machine Learning Algorithms for Classification of Diabetes Utilizing Confusion Matrix Analysis. Baghdad Sci. J. 2024, 21, 1712–1728. [Google Scholar] [CrossRef]
- Olaniran, O.R.; Alzahrani, A.R.R.; Alzahrani, M.R. Eigenvalue Distributions in Random Confusion Matrices: Applications to Machine Learning Evaluation. Mathematics 2024, 12, 1425. [Google Scholar] [CrossRef]
- Zhou, J.; Yang, Y.; Zhang, M.; Xing, H. Constructing ECOC based on confusion matrix for multiclass learning problems. Sci. China (Inf. Sci.) 2016, 59, 135–148. [Google Scholar] [CrossRef]
- Muir, J.W.; Hardie, H.G.M.; Inkson, R.H.E.; Anderson, A.J. the Classification of Soil Profiles by Traditional and Numerical Methods. Geoderma 1970, 4, 81. [Google Scholar] [CrossRef]
- Mururgan, T.K.; Revanth, P. Soil classification, crop prediction, and disease detection using ML and DL-“agro insights”. J. Plant Dis. Prot. 2024, 131, 2161–2179. [Google Scholar] [CrossRef]
- Raju, C.; Ashoka, D.V.; Vijaya, A.P.B. HybridTransferNet: Soil image classification through comprehensive evaluation for crop suggestion. IAES Int. J. Artif. Intell. 2024, 13, 1702–1710. [Google Scholar] [CrossRef]
- Bojer, C.S.; Meldgaard, J.P. Kaggle Forecasting Competitions: An Overlooked Learning Opportunity. Int. J. Forecast. 2021, 37, 587–603. [Google Scholar] [CrossRef]
- Pham, V.; Weindorf, D.C.; Dang, T. Soil profile analysis using interactive visualizations, machine learning, and deep learning. Comput. Electron. Agric. 2021, 191, 106539. [Google Scholar] [CrossRef]
- Chung, S.; Cho, K.; Cho, J.; Jung, K.; Yamakawa, T. Soil Texture Classification Algorithm Using RGB Characteristics of Soil Images. J. Fac. Agric. Kyushu Univ. 2012, 57, 393–397. [Google Scholar] [CrossRef]
- Abeje, B.T.; Salau, A.O.; Gela, B.M.; Mengistu, A.D. Soil type identification model using a hybrid computer vision and machine learning approach. Multimed. Tools Appl. 2023, 83, 575–589. [Google Scholar] [CrossRef]
- Liu, C.; Ku, C.; Wu, T.; Ku, Y. An Advanced Soil Classification Method Employing the Random Forest Technique in Machine Learning. Appl. Sci. 2024, 14, 7202. [Google Scholar] [CrossRef]
- Xi, S. Transforming urban industrial wastelands using a CNN-based land classification model. Soft Comput. 2024, 28, 903–916. [Google Scholar] [CrossRef]
- de Castro Raulino, G.T.; Oliveira, L.D.S.; Do Nascimento, I.V. Assessing the soil color by traditional method and a smartphone: A comparison. Rev. Cienc. Agric. 2021, 38, 75–85. [Google Scholar] [CrossRef]
- Jia, X.; Zhao, C.; Wang, Y.; Zhu, Y.; Wei, X.; Shao, M. Traditional dry soil layer index method overestimates soil desiccation severity following conversion of cropland into forest and grassland on China’s Loess Plateau. Agric. Ecosyst. Environ. 2020, 291, 106794. [Google Scholar] [CrossRef]
- Jourgholami, M.; Majnounian, B. Traditional mule logging method in Hyrcanian Forest: A study of the impact on forest stand and soil. J. For. Res. 2013, 24, 755–758. [Google Scholar] [CrossRef]
- Sun, H.; Gu, X.; Zhang, Y.; Sun, F.; Zhang, S.; Wang, D.; Yu, H. An enhanced ResNet deep learning method for multimodal signal-based locomotion intention recognition. Biomed. Signal Process. Control 2025, 101, 107254. [Google Scholar] [CrossRef]
- Li, Z.; Guo, J.; Zhang, B. ResNet Deep Learning-Based Inversion Method for Sea Surface Wind Field. J. Sens. 2024, 2024, 1155. [Google Scholar] [CrossRef]
- Yan, Y.; Sun, Z.; Mahmood, A.; Cong, Y.; Xu, F.; Sheng, Q.Z. ST-Resnet: A deep learning-based privacy preserving differential publishing method for location statistics. Computing 2023, 105, 2363–2387. [Google Scholar] [CrossRef]
- Chun, B.; Lee, T.; Jeong, K.; Shin, Y. Estimation and Spatial Distribution of Monthly FDSI Using AMSR2 Satellite Image-based Soil Moisture in South Korea. J. Korean Soc. Agric. Eng. 2022, 64, 31–43. [Google Scholar] [CrossRef]
- Liu, S.; Lin, W.; Wang, Y.; Yu, D.Z.; Peng, Y.; Ma, X. Convolutional Neural Network-Based Bidirectional Gated Recurrent Unit-Additive Attention Mechanism Hybrid Deep Neural Networks for Short-Term Traffic Flow Prediction. Sustainability 2024, 16, 1986. [Google Scholar] [CrossRef]
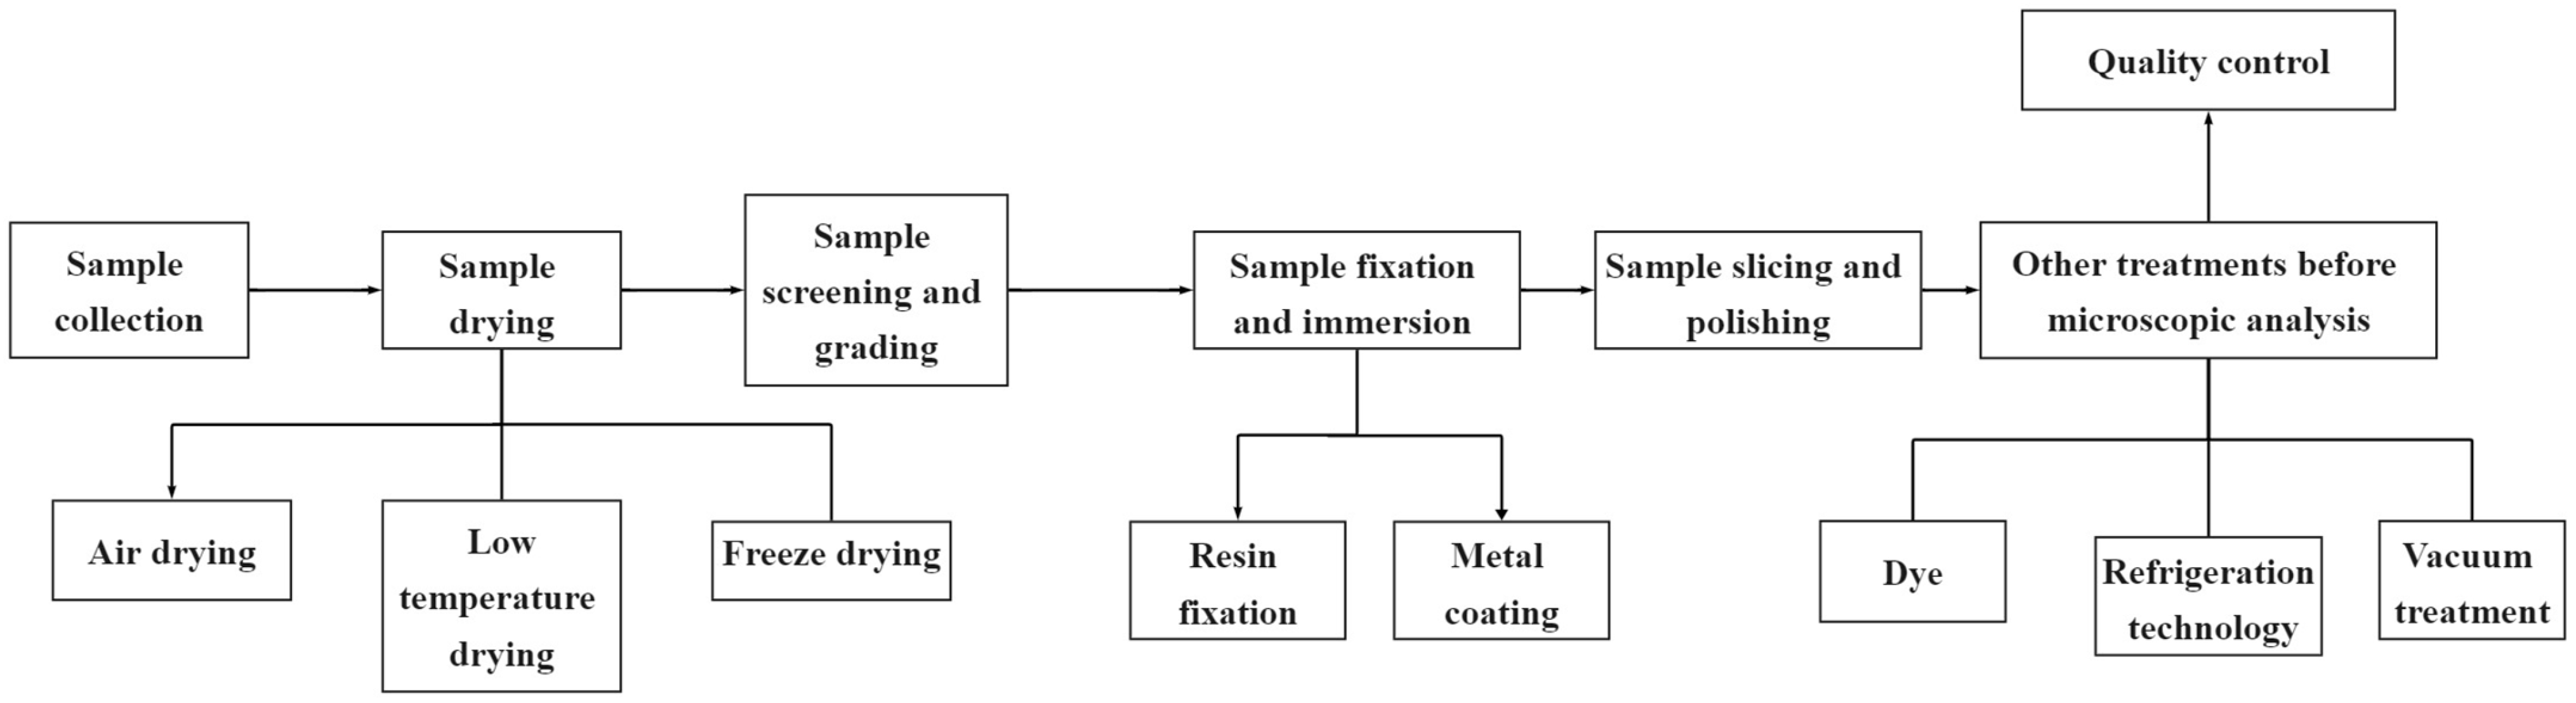


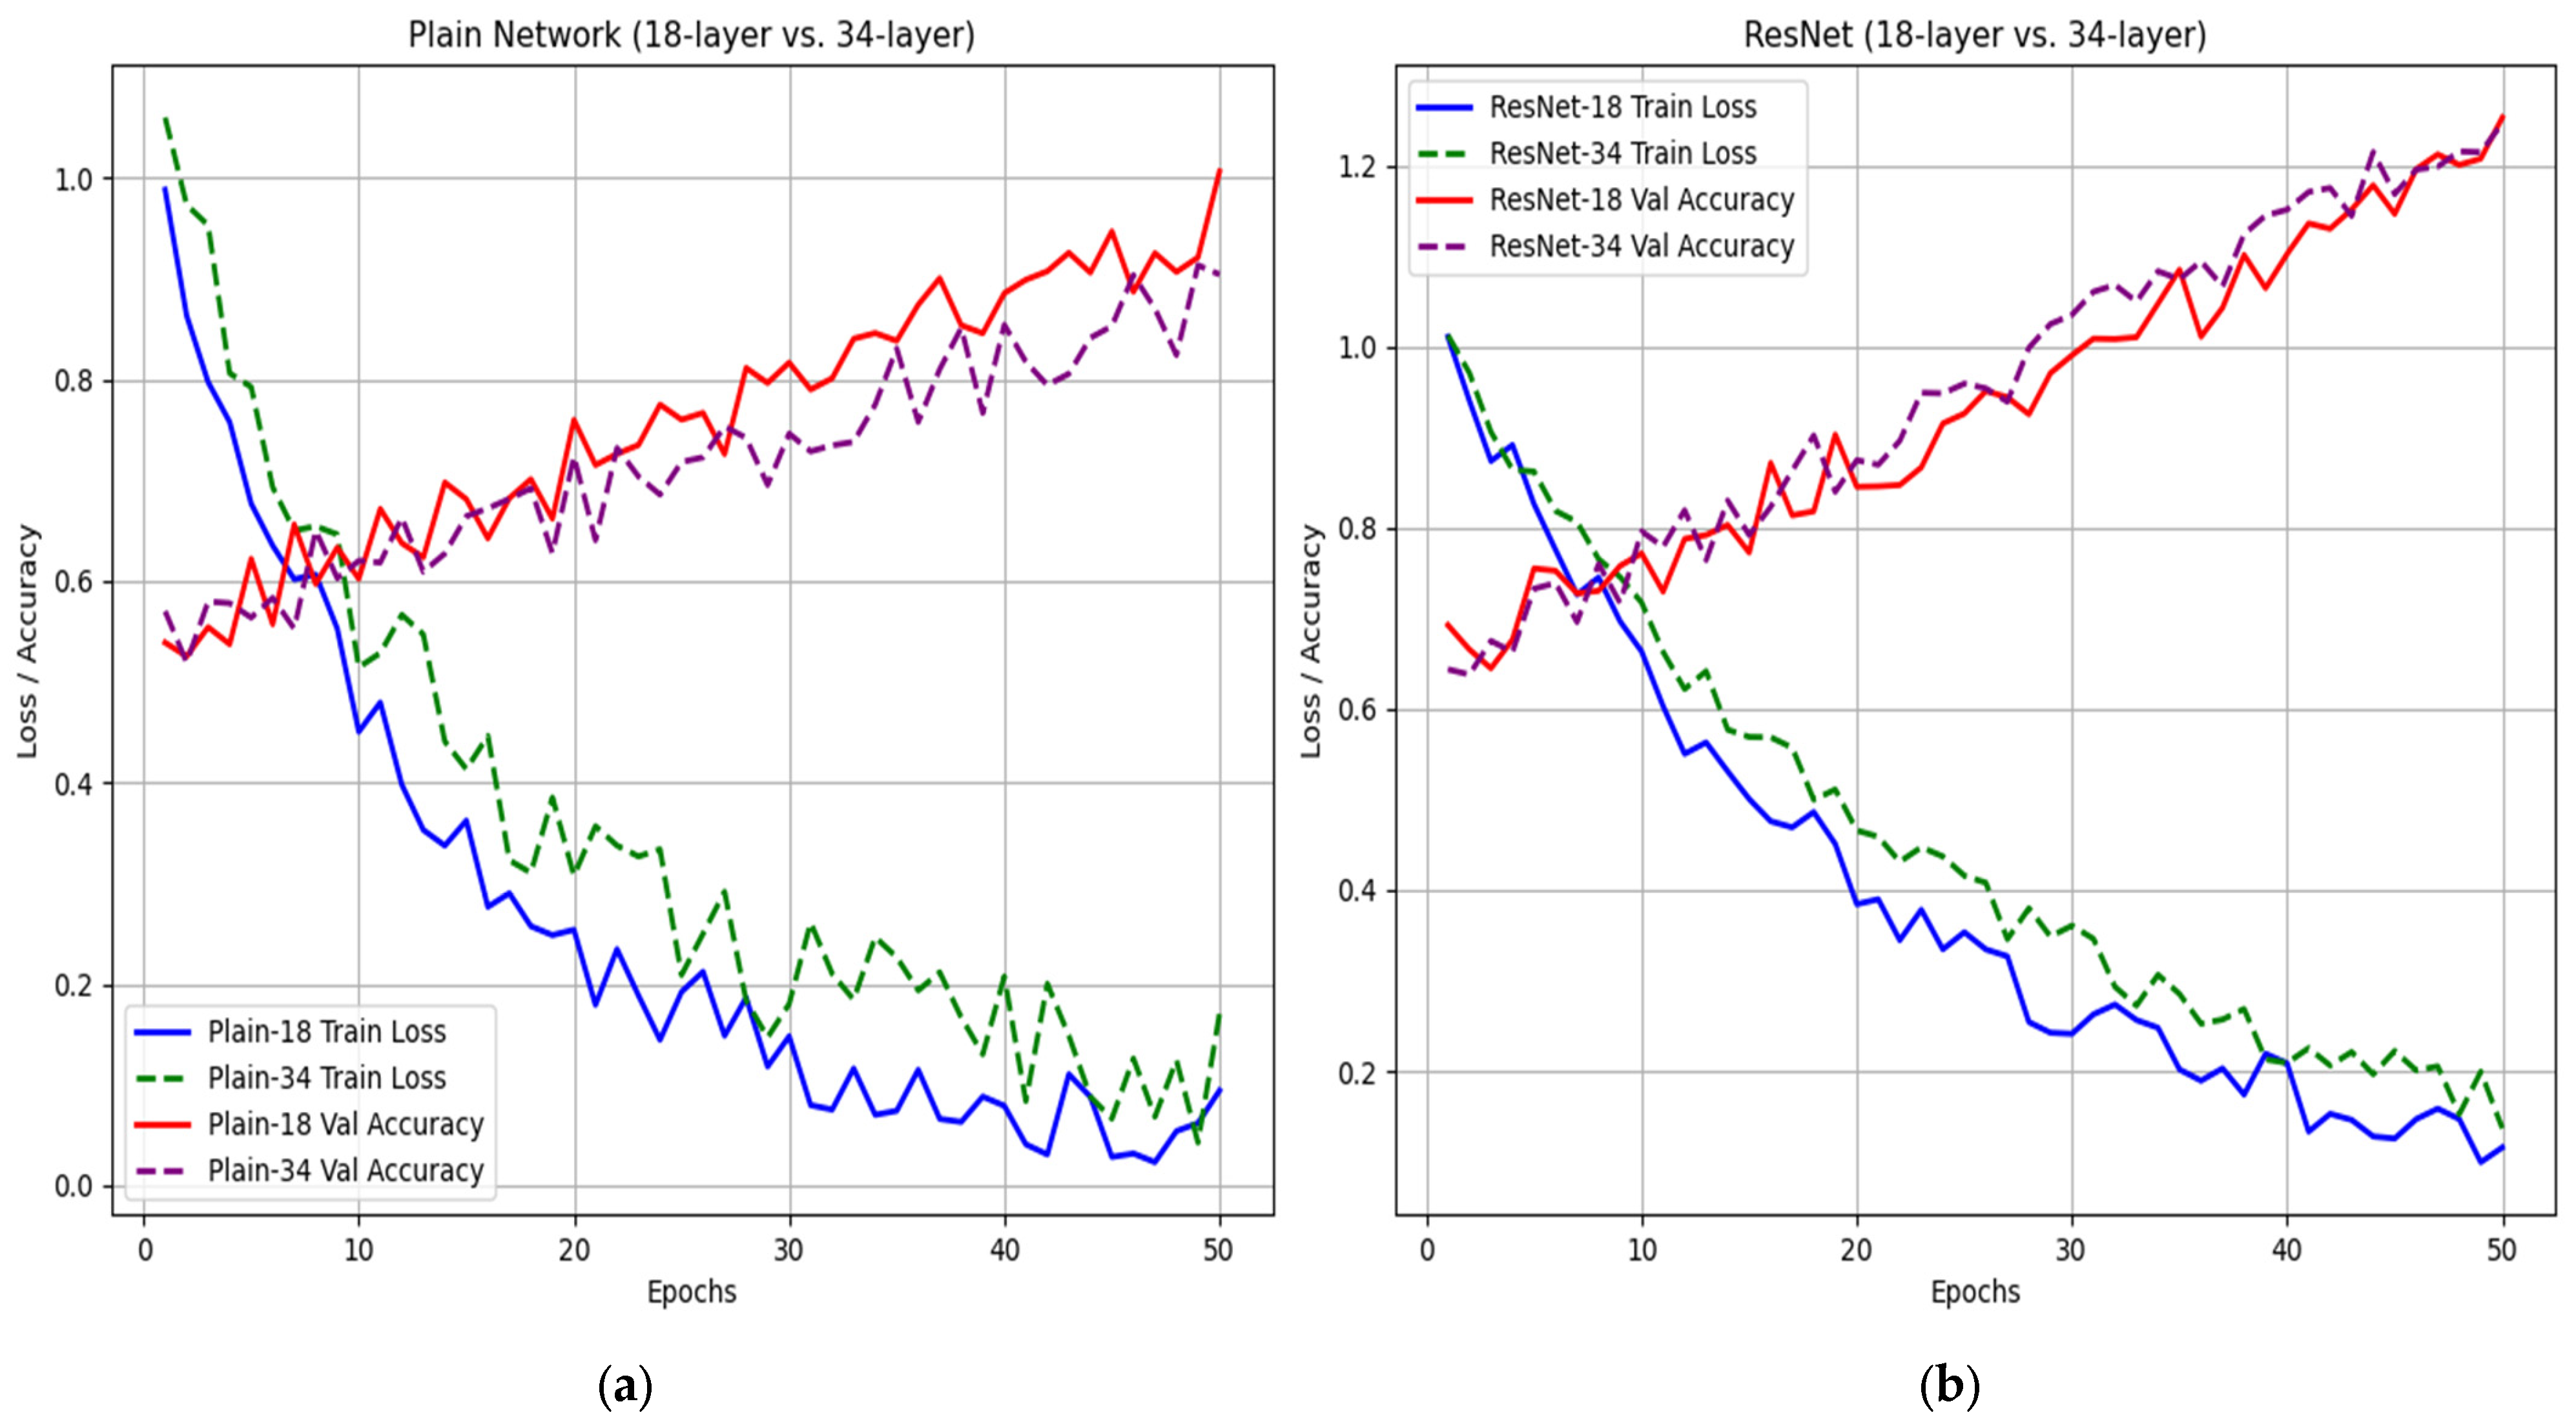
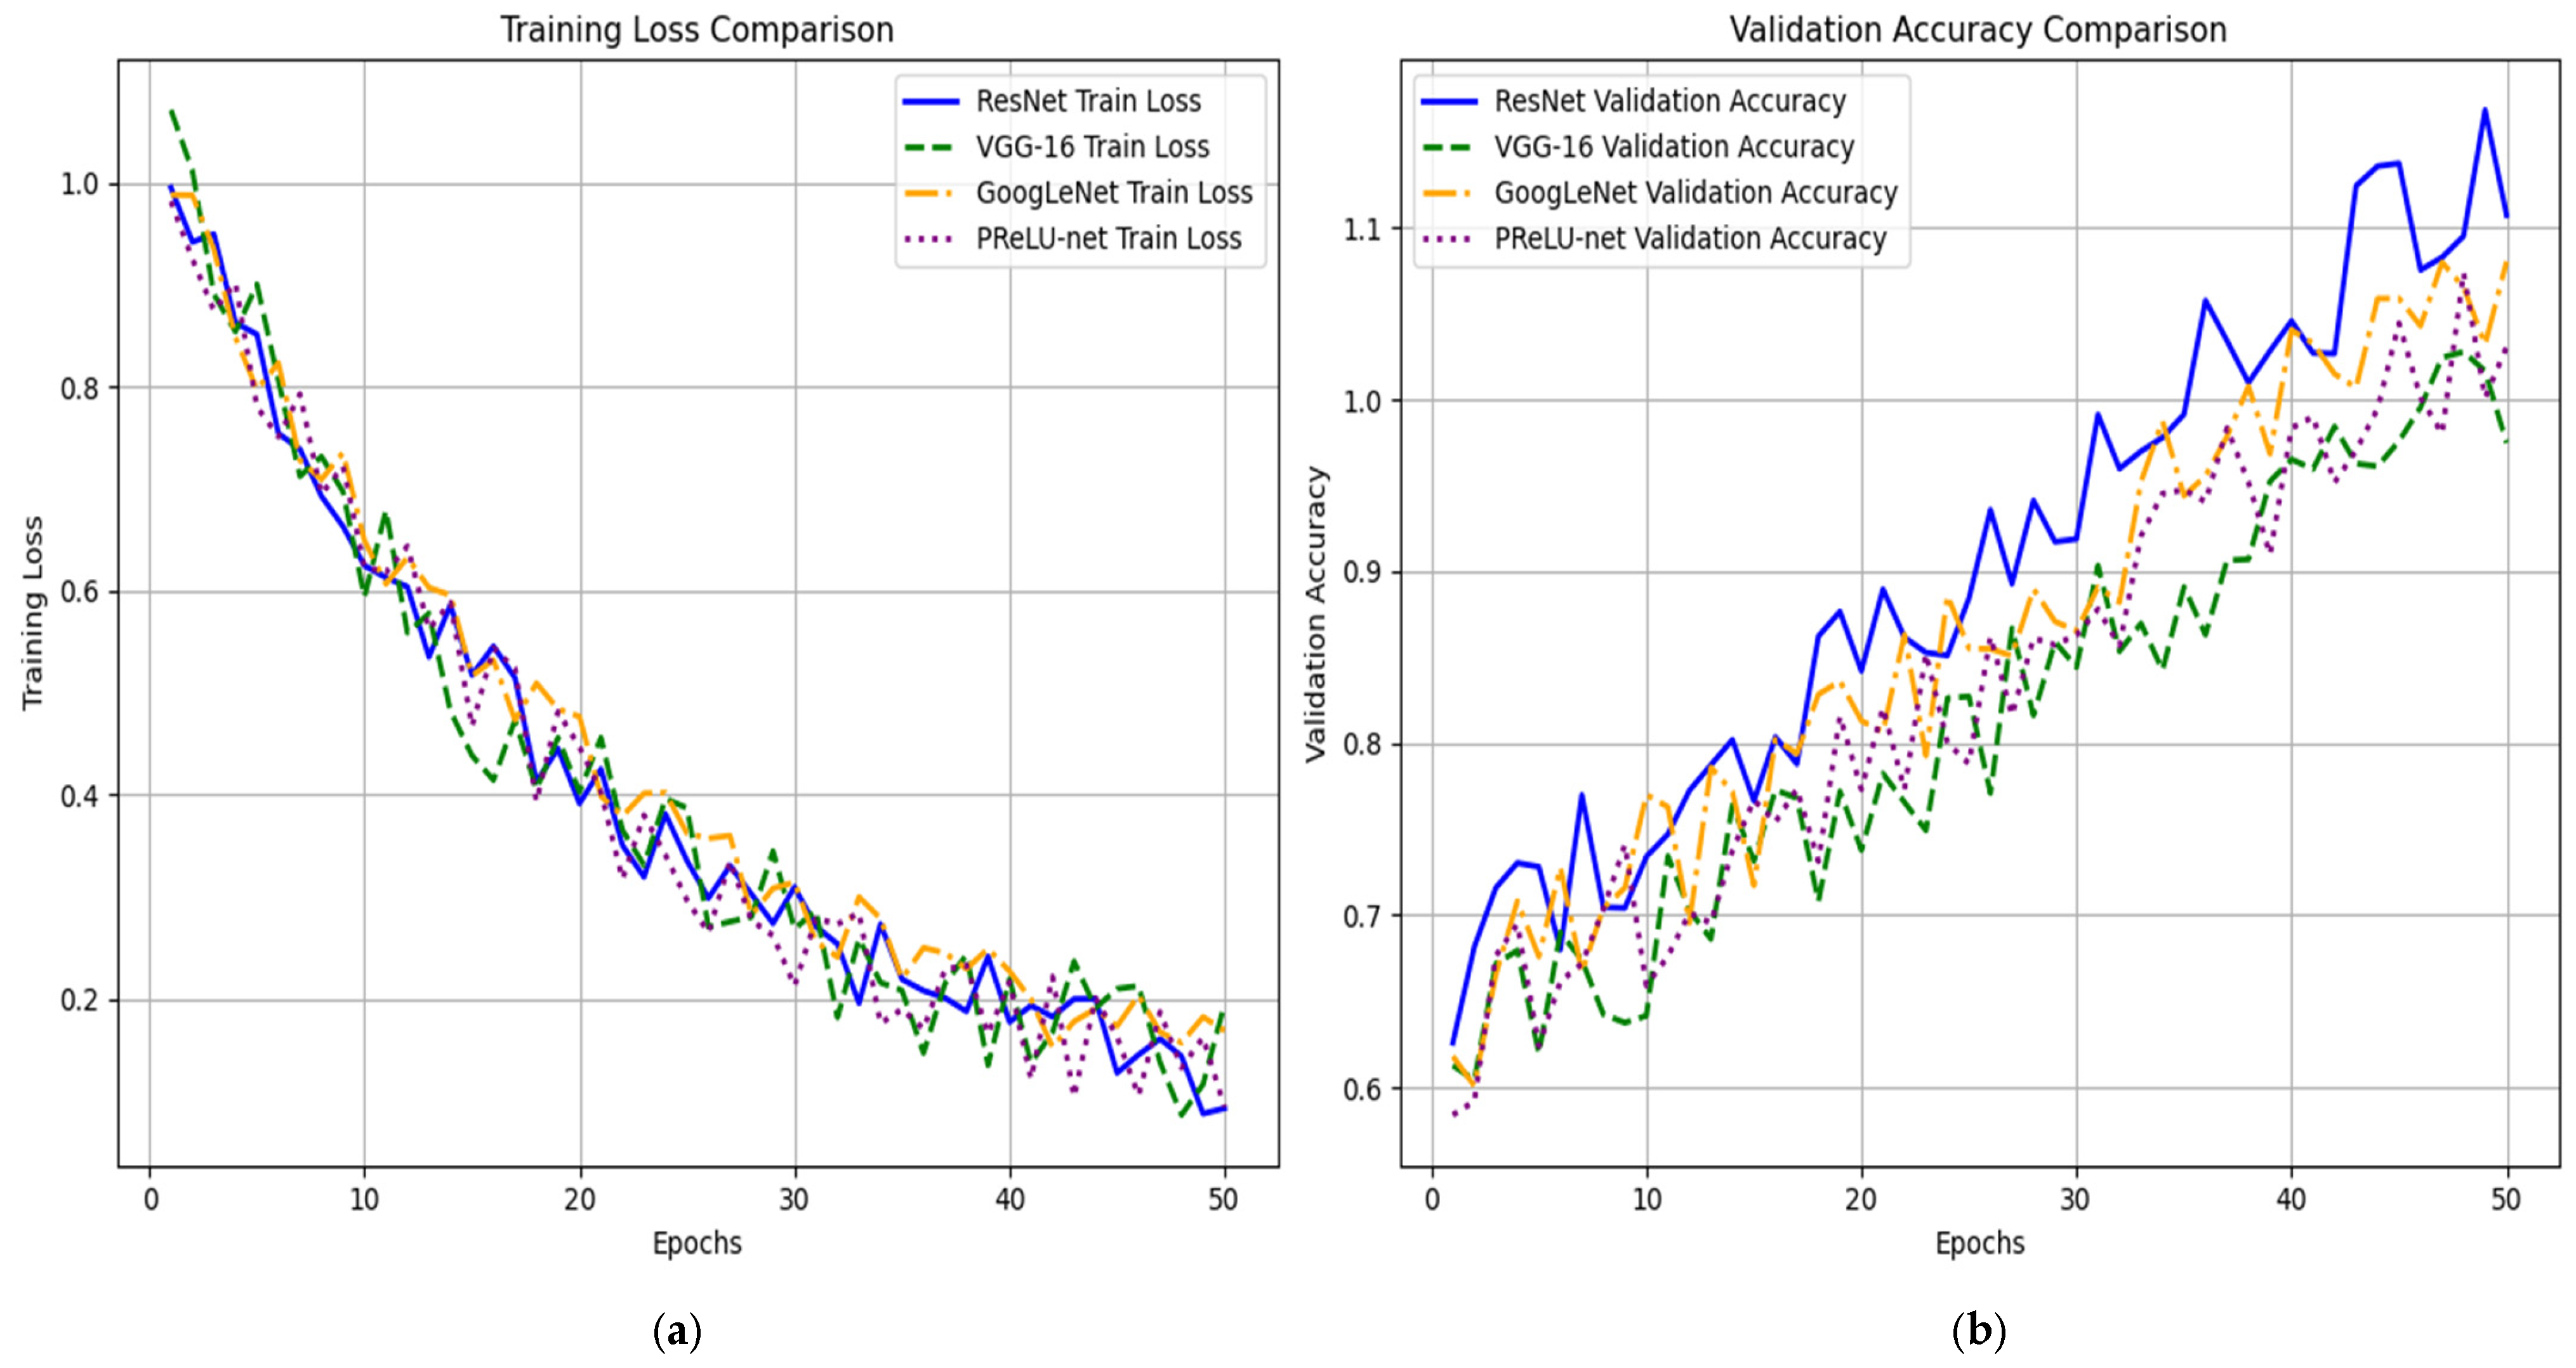
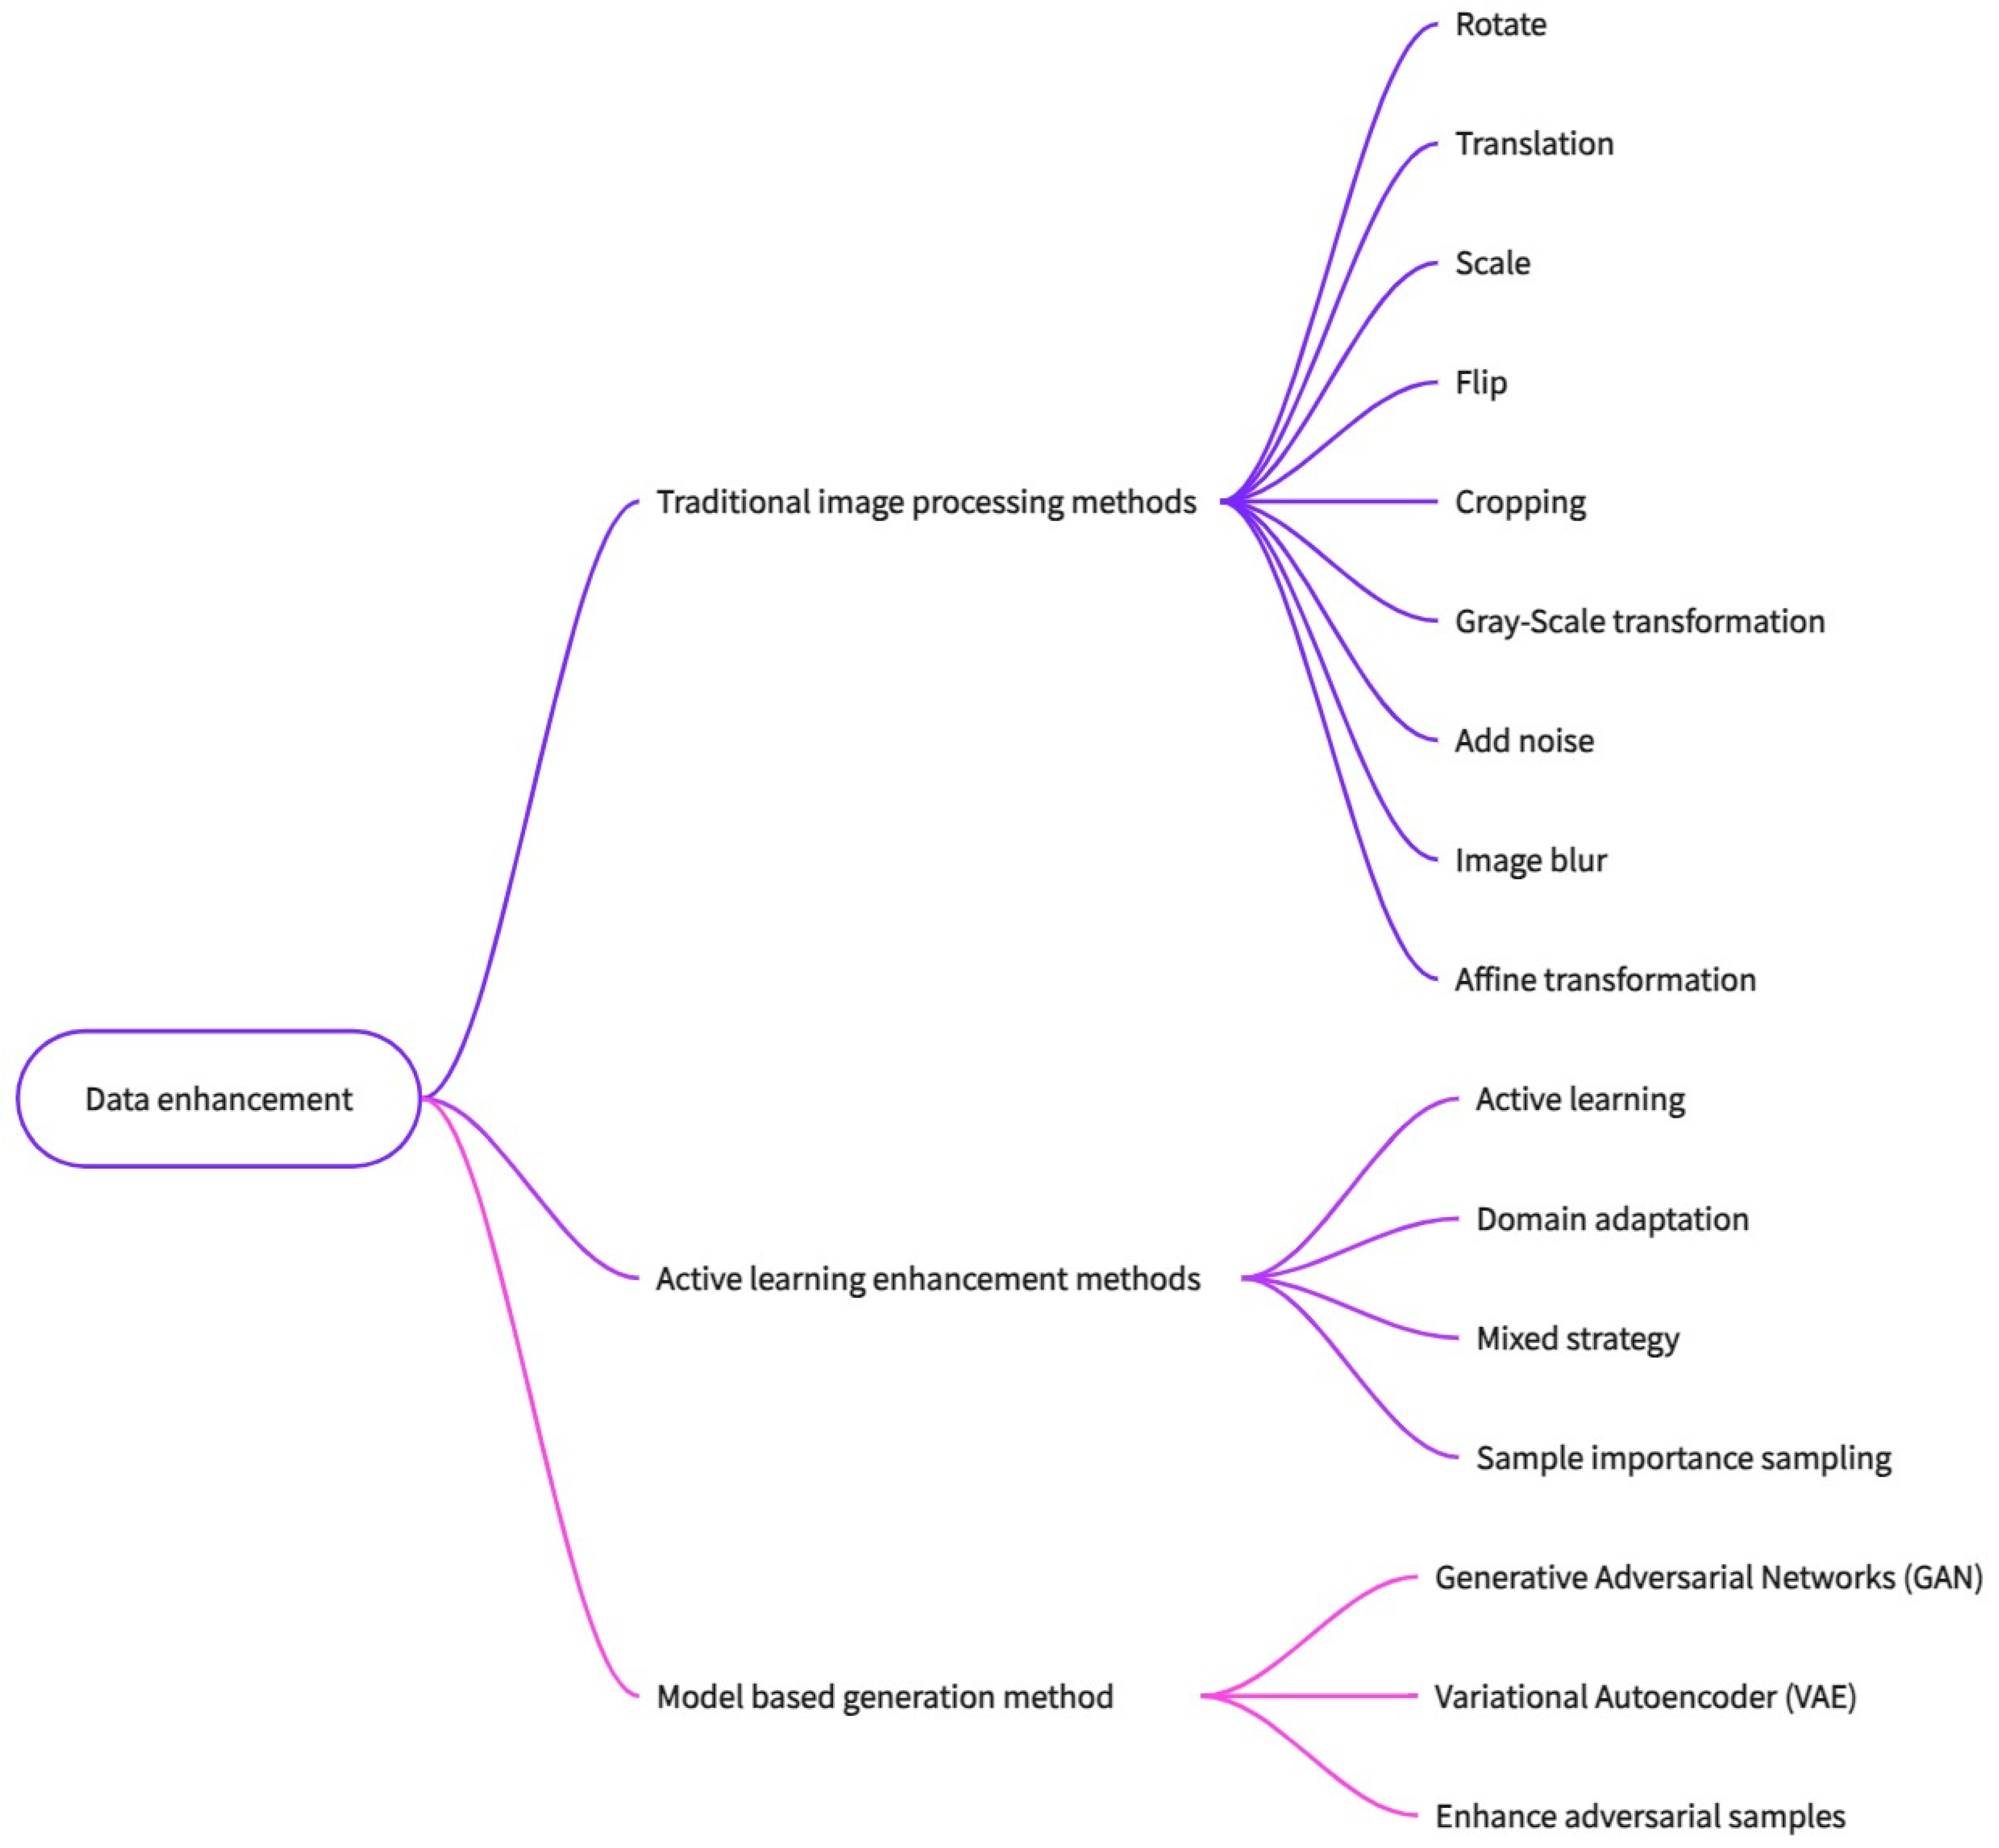


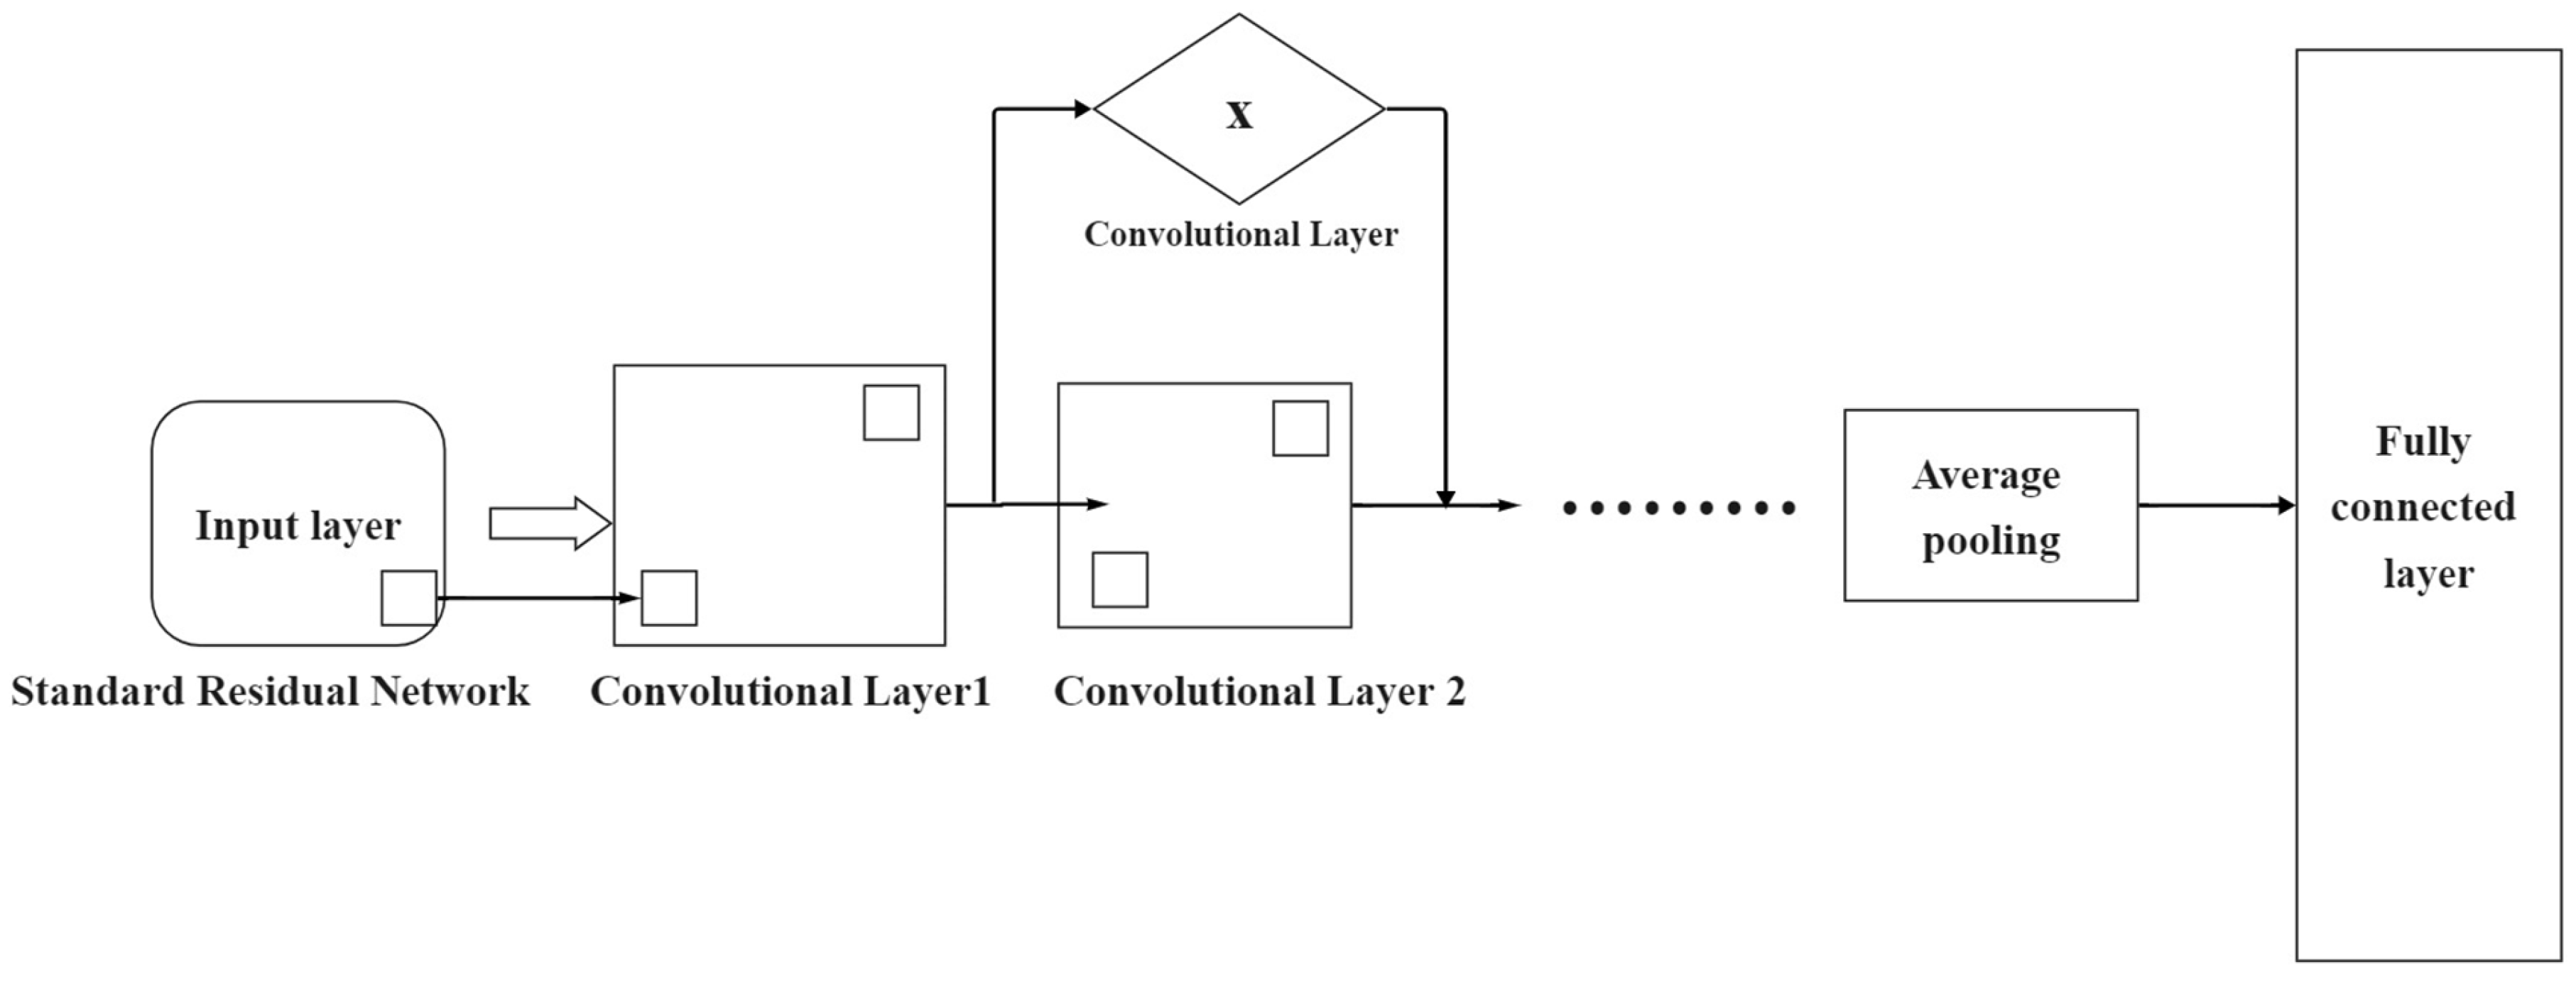


Disclaimer/Publisher’s Note: The statements, opinions and data contained in all publications are solely those of the individual author(s) and contributor(s) and not of MDPI and/or the editor(s). MDPI and/or the editor(s) disclaim responsibility for any injury to people or property resulting from any ideas, methods, instructions or products referred to in the content. |
© 2025 by the authors. Licensee MDPI, Basel, Switzerland. This article is an open access article distributed under the terms and conditions of the Creative Commons Attribution (CC BY) license (https://creativecommons.org/licenses/by/4.0/).