Article

Early Warning and Management Measures for the Non-Agriculturalization of Cultivated Land in Shaanxi Province of China Based on a Patch-Generated Land Use Simulation Model

by
Huiting Yan
1,2,
Hao Chen
1,3,
Fei Wang
1,3,*,
Linjing Qiu
4 and
Rui Li
2
1
College of Soil and Water Conservation Science and Engineering, Northwest A&F University, Yangling 712100, China
2
Institute of Land Comprehensive Science, Northwest Research Institute of Engineering Investigations and Design, Xi’an 710003, China
3
Institute of Soil and Water Conservation, Chinese Academy and Sciences and Ministry of Water Resources, Yangling 712100, China
4
Department of Earth and Environmental Science, School of Human Settlements and Civil Engineering, Xi’an Jiaotong University, Xi’an 710049, China
*
Author to whom correspondence should be addressed.
Agriculture 2025, 15(7), 672; https://doi.org/10.3390/agriculture15070672
Submission received: 15 February 2025 / Revised: 12 March 2025 / Accepted: 19 March 2025 / Published: 21 March 2025
(This article belongs to the Section Agricultural Systems and Management)

Abstract

:
This study aimed to analyze the spatiotemporal trends of the non-agriculturalization of cultivated land (NACL) and evaluate the effectiveness of land management strategies in Shaanxi Province, China. First, geostatistical analysis was conducted to examine NACL dynamics, revealing that most areas remained in a mild early warning state from 2000 to 2010. However, warning levels escalated to severe or extreme in northern Shaanxi, parts of Guanzhong, and southern Shaanxi between 2010 and 2020. Subsequently, the Patch-Generated Land Use Simulation Model (PLUS) was employed to simulate NACL under different land management scenarios, using 2020 as the baseline and 2035 as the target year. The scenarios include natural growth (NG), cultivated land protection (CP), and ecological protection (EP), which were designed based on national and provincial land use planning objectives for 2035. The results indicated that, under the NG scenario, the overall NACL area is projected to decline by 2035, although northern and southern Shaanxi will remain highly susceptible to NACL. The CP scenario effectively mitigated NACL, reducing warning levels to moderate or mild in parts of Guanzhong and northern Shaanxi. Spatial clustering analysis further revealed that NACL in northern Shaanxi consistently exhibited high–high clustering in both historical periods and across different management scenarios. These findings establish a research framework for identifying and forecasting NACL while providing a scientific basis for optimizing land resource allocation and informing policy decisions.

1. Introduction

Cultivated land is a vital land use type that not only underpins food production but also plays a critical role in ensuring social stability and promoting sustainable development. In the context of rapid urbanization and industrialization in China, the non-agriculturalization of cultivated land (NACL), which refers to the conversion of cultivated land originally used for agricultural production (such as growing food crops, vegetables, and cash crops) into non-agricultural uses, has become increasingly widespread. This transformation is primarily driven by socio-economic development, population growth, and land use policies, leading to the transition of cultivated land to other land use types. As a result, it fundamentally alters land cover structures and functions, reshaping the material and energy flows within the “nature-economy-society” complex system [1]. Such changes not only affect agricultural production but also significantly alter the ecological functions of land in terms of spatial layout [2,3]. Therefore, a comprehensive understanding of the temporal and spatial dynamics of NACL, the identification of regions with a pronounced conversion tendency, and the development of effective early warning systems are crucial for optimizing land management policies.
Land management measures are one of the primary factors influencing the process of NACL [4]. Variations in regional development plans and land management policies directly impact the rate and extent of land conversion [5]. For instance, certain regions may undergo concentrated NACL as a result of factors such as industrial planning and population growth [6], while other areas may experience slower rates of non-agriculturalization due to policies such as cultivated land protection, ecological preservation, or land use restrictions [7]. Proper land management strategies can effectively mitigate the pace of NACL, ensuring the sustainable use of land resources. In the face of increasing global cultivated land scarcity and growing ecological pressures, the absence of effective land-use planning and management can lead to widespread NACL, further exacerbating resource depletion and environmental degradation [8,9]. As such, it is critical to explore the effects of different land management measures on the NACL, evaluate the effectiveness of various management scenarios, and determine the roles and applicability of different policies in mitigating this process. These studies would help formulate more targeted and actionable land management strategies, thereby effectively curbing NACL and ensuring the sustainable use of land resources.
Shaanxi Province (SP), located in a water-scarce and ecologically sensitive region, plays a key role in China’s food security and serves as an essential ecological barrier in the Yellow River Basin. In recent years, with the combined effects of new urbanization, the expansion of energy bases, and ecological restoration efforts, the NACL in this region has exhibited significant spatial variability [10,11]. Existing studies indicate that since 2000, the rate of cultivated land loss in SP has exceeded the national average [12]. Research has highlighted several factors influencing non-agriculturalization in SP, including economic development, population migration, land policies, and urban–rural planning [10,11,13]. Some scholars report that rapid industrialization and urbanization are the primary drivers of extensive non-agriculturalization, while others highlight regional differences in these driving forces. In response, the government has implemented a series of policy measures, such as land requisition compensation, cultivated land protection policies, and rural revitalization initiatives, aimed at mitigating the negative effects of non-agriculturalization. Research suggests that while promoting intensive land use and agricultural modernization, SP has progressively strengthened policies supporting cultivated land protection and ecological restoration [14,15]. However, there is still insufficient research on how land management measures influence non-agriculturalization at the regional or local levels, the regulatory effects of land management policies, and the potential for predictive early warning systems. Under the dual challenges of the “dual-carbon” strategy [16] and food security, identifying potential trends in non-agriculturalization in SP, and understanding the interactions between natural constraints and policy interventions, has emerged as a critical scientific challenge in the optimization of land use planning.
The study of NACL commonly employs methods such as remote sensing, geographic information systems (GISs), geostatistical analysis, and land-use models [6,11,17]. Among these, land-use models, particularly those based on law of land use evolution, provide a more in-depth and comprehensive perspective on the study of non-agriculturalization. The Patch-Generating Land Use Simulation (PLUS) model, with its robust capabilities for scenario analysis and policy simulation, has become an important tool for investigating the impacts of land use management on NACL in recent years [18]. The PLUS model is capable of simulating both the temporal and spatial dynamics of NACL under various land management strategies and forecasting trends in non-agriculturalization across different scenarios. Additionally, it can be integrated with multi-objective planning techniques to predict land-use structures under different conditions, offering innovative approaches and methodologies for researching the processes of NACL and the associated management strategies [19]. This study adopted an integrated approach combining remote sensing, GISs, and the PLUS model to construct a comprehensive framework for “multi-source data fusion, spatiotemporal pattern analysis, and scenario simulation with early warning”. This research first explored the spatiotemporal evolution and spatial differentiation patterns of NACL in SP. Then, it identified regional variations in non-agriculturalization and evaluate corresponding early warning levels. Finally, this study assessed the impacts of different land use management strategies on the NACL. This research is expected to establish a universally applicable early warning framework for NACL, which would provide valuable insights for sustainable land management in similarly ecologically vulnerable regions.

2. Materials and Methods

2.1. Study Area

SP is located in the northern part of central China, with geographic coordinates ranging from 105°29′ to 111°15′ east longitude and 31°42′ to 39°35′ north latitude. It covers a total area of 205,624.3 km2 and is administratively divided into 107 county-level regions (Figure 1). The province has a varied topography, characterized by a high terrain in the north and south, with a low central region. Its landscape includes plateaus, mountains, plains, and basins, with an average elevation ranging from 168.6 to 3771.2 m. Geographically, SP can be divided into three major regions: Loess Plateau in northern SP, covering approximately 82,200 km2; the Guanzhong Plain in the center, spanning about 49,400 km2; and the Qinling–Daba Mountains in the south, which covers around 74,000 km2. SP has significant climatic differences between its northern and southern regions. The Guanzhong plain and northern SP areas predominantly have a temperate warm climate, while southern SP has a northern subtropical climate. The annual average temperature ranges from 9 °C to 16°C [20], gradually increasing from north to south. Precipitation also increases from north to south, with an annual average ranging from 340 to 1240 mm [21]. In terms of land use, the largest areas are occupied by forest land, followed by cultivated land, grass land, build-up land, and water bodies.

2.2. Data Source and Process
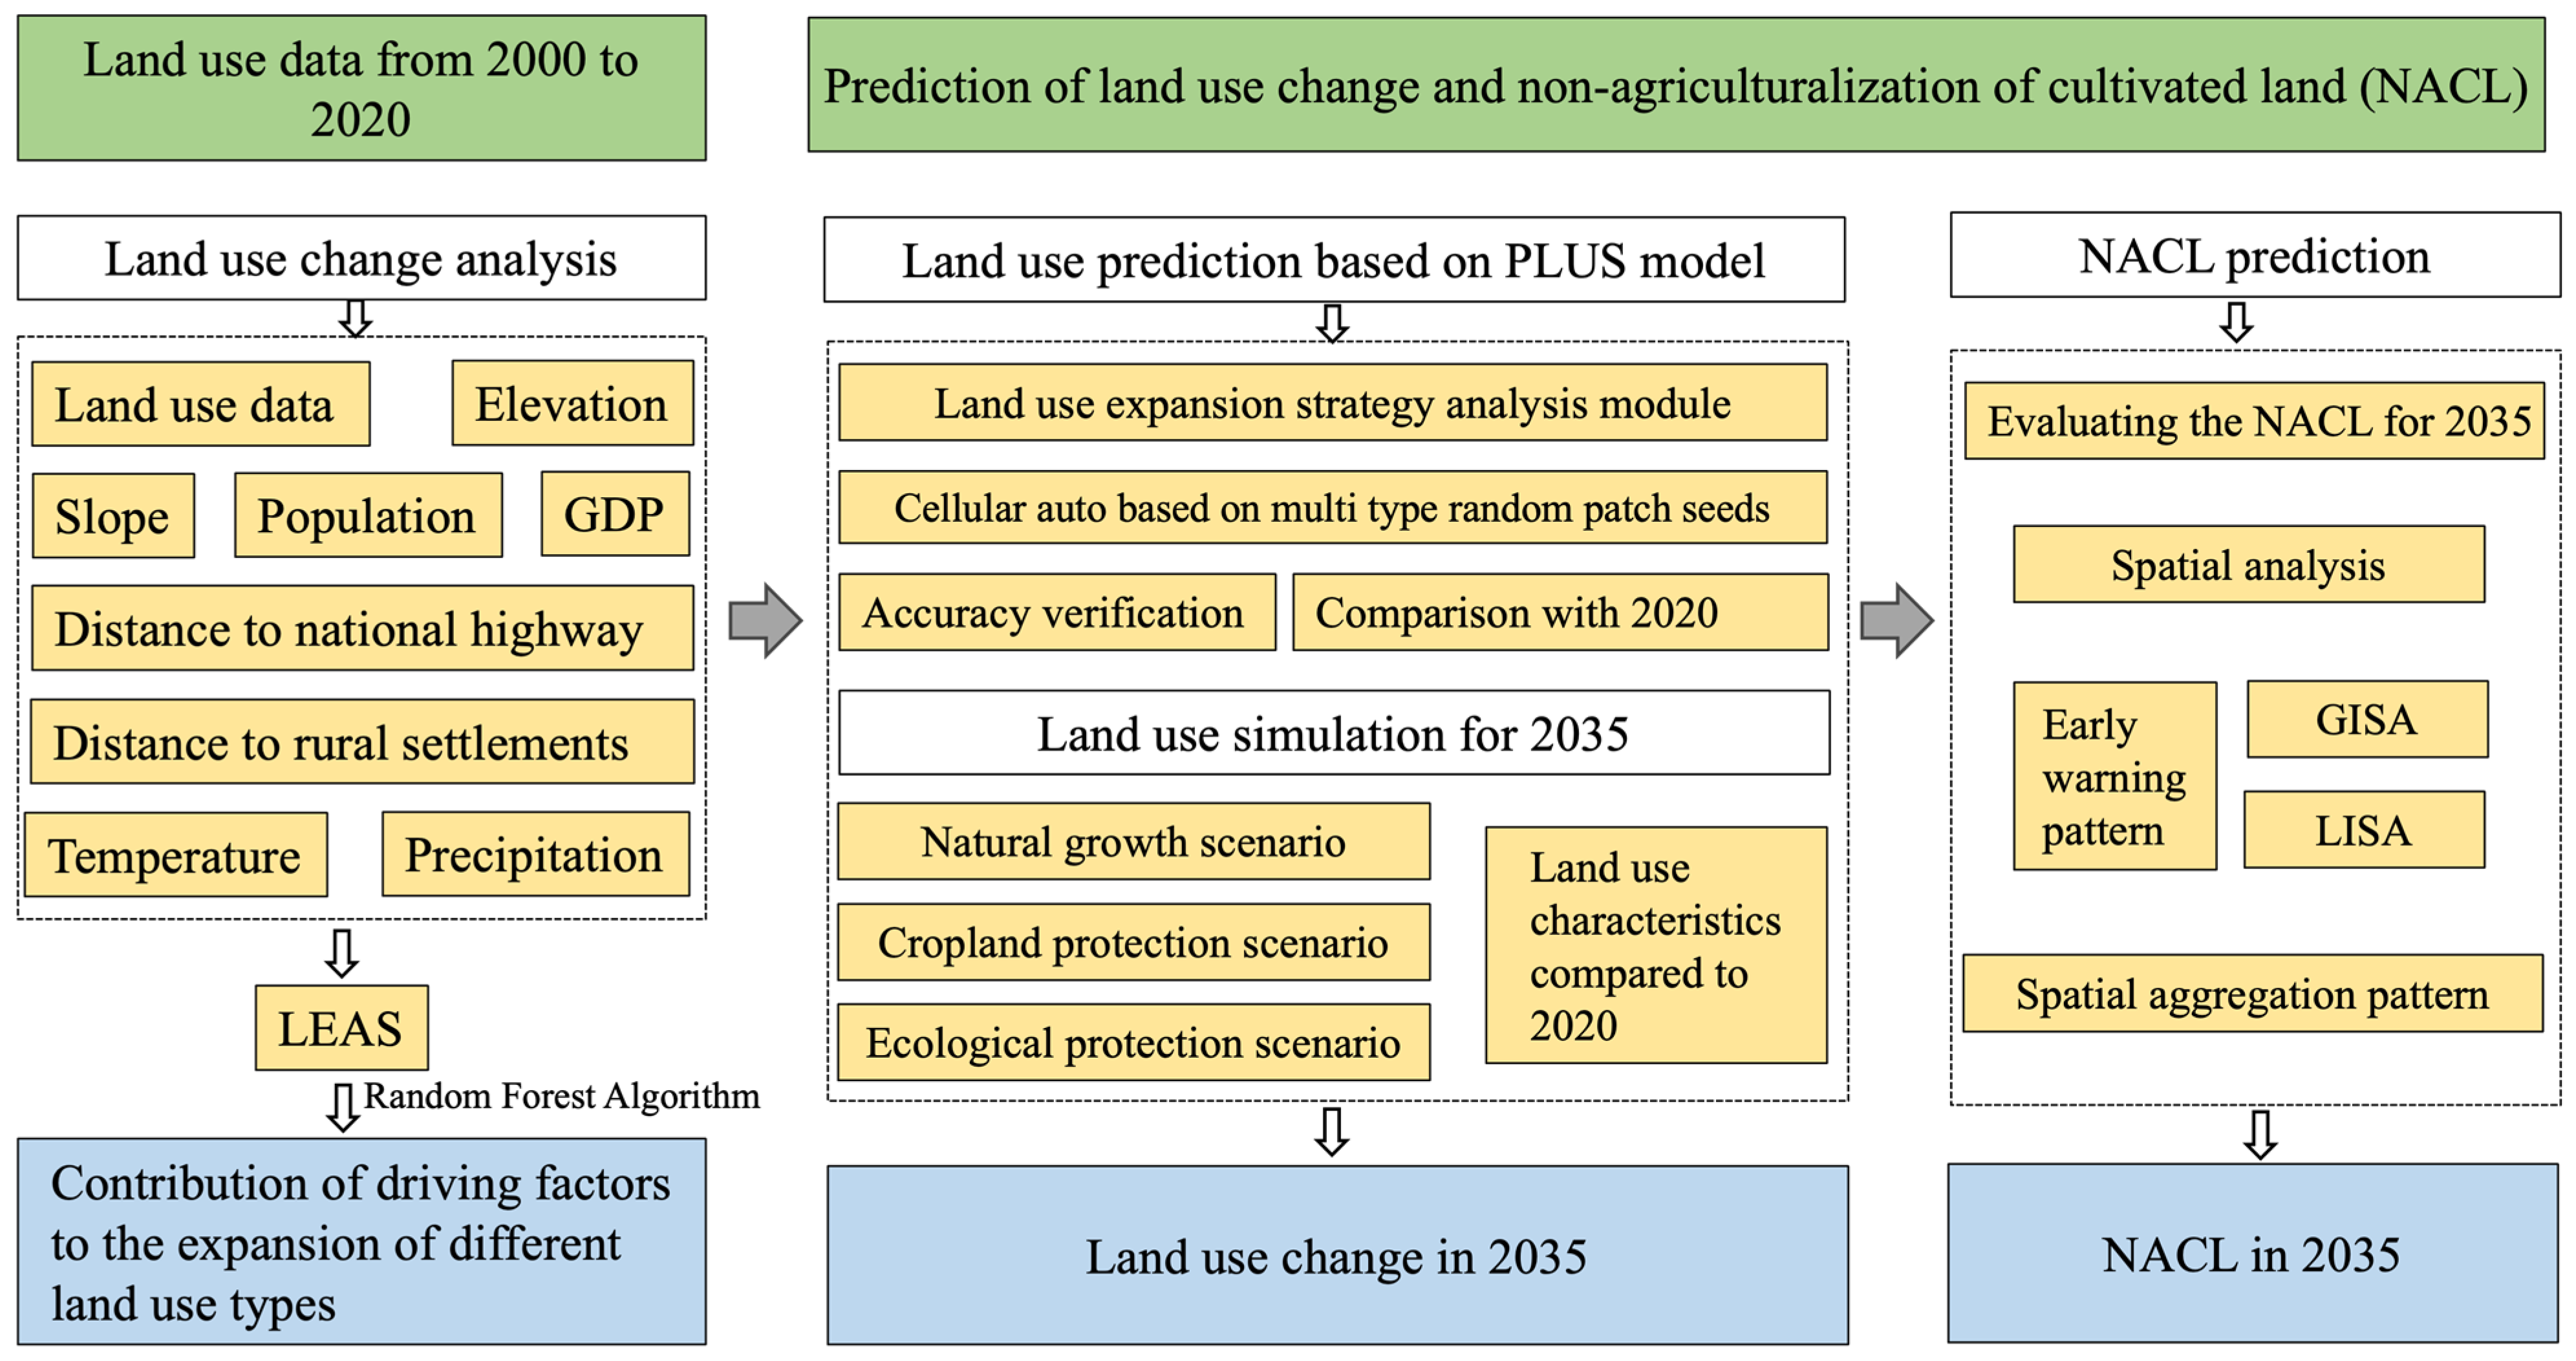
The data used in this study include land use data for three time periods in SP (2000, 2010, and 2020), topographic data, socio-economic data, accessibility factor data, and climate data. The sources and resolutions of these datasets are provided in Table 1. We used this dataset to extract the characteristics of NACL from 2001 to 2020. Initially, the data were converted into vector format. Next, using the intersection tool in ArcGIS 10.8, cultivated land data at time T0 was overlaid with non-cultivated land data at time T1 to obtain the spatiotemporal characteristics of NACL at different time periods.
The global Moran’s I index was employed to analyze the aggregation characteristics of NACL. This index characterizes aggregation patterns by calculating spatial autocorrelation, with values ranging from −1 to 1 [22]. When the index is positive (close to 1), it indicates spatial positive autocorrelation in NACL; when the index is negative (close to −1), it indicates spatial negative autocorrelation; and when the index is close to 0, it suggests that the distribution of NACL is random. The Z-score is used to assess spatial clustering or dispersion, while the p-value is used to determine statistical significance. When the calculated Z-score exceeds 2.58 and the p-value is less than 0.01, it indicates a highly significant spatial autocorrelation [23]. Based on this, we employed the local Moran’s I (LISA) to assess the degree of association between the non-agriculturalization level at specific locations and its neighboring areas, further identifying the spatial clustering patterns of NACL in different counties of SP. When the local Moran’s I index is greater than 0, it indicates spatial clustering of NACL with neighboring areas, and the larger the value, the more pronounced the clustering effect [24]. When the local Moran’s I index is less than 0, it indicates spatial dispersion, with a stronger radiation effect as the value decreases. If the index equals 0, it suggests no spatial correlation, indicating a random distribution. This index allows us to determine different types of spatial clustering: high–high, where both the region and its neighboring areas are high-value areas, indicating spatial clustering of high-value regions; high–low, where the region is a high-value area, but the neighboring areas are low-value, revealing a relatively unbalanced spatial structure; low–high, where the region is a low-value area and neighboring areas are high-value, reflecting an unbalanced spatial distribution; low–low, where both the region and its neighbors are low-value areas, indicating spatial clustering of low-value regions; and non-significant, indicating that the clustering characteristics in the area are not significant.
The conversion rate from cultivated land to non-cultivated land was calculated to assess the degree of non-agriculturalization. The conversion rate was determined as follows: first, the area of non-cultivated land between time points T0 and T1 was calculated. This non-cultivated land area was then divided by the cultivated land area at time T0 to derive the conversion rate. The conversion rate was used to assess the warning level of non-agriculturalization. Due to the uneven distribution of conversion rate data, we first applied the Jenks’ Natural Breaks method in ArcGIS to classify the data. Then, we rounded the classification results, ultimately obtaining five categories: 1–10%, 11–30%, 31–50%, 51–70%, and greater than 70%, which correspond to the five warning levels: mild, moderate, high, severe, and extreme.

2.3. PLUS Model

This study utilizes the Patch-Generated Land Use Simulation Model (PLUS) to simulate the land use patterns of SP under different future development scenarios. PLUS is a next-generation simulation tool developed by Liang et al. [19,25], based on the CA-Markov and FLUS models, and incorporating the random forest algorithm. The model aims to predict complex land use changes and reveal the underlying change mechanisms. It consists primarily of the Land Use Expansion Analysis Strategy (LEAS) module and the Cellular Automata model based on a multi-type random seed mechanism (CARS). The LEAS module extracts the land use expansion portion between two periods and performs sampling, utilizing the random forest algorithm to mine and obtain the contribution rates and development probabilities of driving factors for each land use type. The CARS module simulates future land use scenarios under the constraints of development probabilities, combining random seed generation, transition matrices, and threshold decrement mechanisms.
In the LEAS module, a random sampling mechanism is employed to reduce the computational cost of the model, while the random forest algorithm calculates the development probabilities for each land use type. The calculation formula is as follows:
P i , k ( x ) d = n = 1 M I [ h n X = d ] M
where P i , k ( x ) d represents the transition probability of land use type k at spatial unit i; x is a vector composed of several driving factors; M is the total number of decision trees; d takes a value of 1 when other land use types can transition to land use type k, and takes a value of 0 when land use types can transition to other land use types excluding type k. h n ( X ) represents the predicted land use type of the nth decision tree for vector x; I [ h n X = d ] is the indicator function of the decision tree.
In CARS, the neighborhood weight parameters are determined under the constraints of different land use development probabilities obtained in the early stages. These parameters represent the expansion potential of various land use types driven by different influencing factors. The specific calculation formula is as follows:
W i = T i T m i n T m a x T m i n
where Wi is the neighborhood weight parameter for a specific land use type i; Ti is the change in area for land use type i during the study period. Tmin and Tmax represent the minimum and maximum changes in area for land use type i during the study period, respectively. The value of Wi ranges from 0 to 1; the closer the value is to 1, the stronger the expansion capacity of that land use type, indicating it is less likely to be converted into other land use types. Based on land use characteristics in 2010 and 2020, the computed neighborhood weights for cultivated land, forest land, grassland, water bodies, built-up areas, and bare land are 0.282, 0.142, 0.508, 0.024, 0.98, and 0.02, respectively.

2.4. Model Performance Evaluation

The PLUS model was used to obtain land use expansion data for the period 2010–2020, which was then input into the LEAS module. Land use simulation was carried out using eight driving factors. These driving factors encompass natural geographic conditions, socio-economic factors, and transportation and location characteristics, including elevation, slope, annual precipitation, annual average temperature, population density, per capita GDP, national highways, and rural residential areas. The development probabilities and contributions of driving factors for each land use type were calculated using the random forest algorithm within the LEAS module. The advantage of the PLUS model lies in its ability to avoid strict constraints on simulation timeframes while allowing flexible iteration settings to accommodate different forecasting needs.
In the CARS module, 2010 land use data, along with the previously computed development probabilities, were input to simulate land use characteristics for 2020. The simulated results were then compared with the 2020 land use data. The simulation accuracy was evaluated using the FOM statistical tool and the Kappa coefficient [26]. The Kappa coefficient assesses the overall accuracy of land use classification by quantifying the agreement between predicted and actual data. A Kappa coefficient greater than 0.75 generally considered acceptable prediction. The FOM specifically evaluates the accuracy of predicted land use changes by comparing predicted changes to total observed changes. An FOM value greater than 0.2 is typically regarded as acceptable accuracy. In this study, the final Kappa coefficient obtained in this study was 0.798, and the FOM value was 0.46.
The following are the formulas:
K a p p a = P o P e 1 P e
where P o represents the proportion of correctly simulated grid cells (i.e., the percentage of correctly classified cells along the diagonal of the confusion matrix); P e denotes the expected proportion of correctly classified grid cells, derived based on the overall category proportions.
F O M = A c o r r e c t A c o r r e c t + A o v e r p r e d i c t e d + A u n d e r p r e d i c t e d + A w r o n g l y p r e d i c t e d
where A c o r r e c t represents the correctly predicted change areas, referring to actual land use change regions accurately captured by the model. A o v e r p r e d i c t e d stands for overpredicted areas, where the model falsely predicted land use change in regions that remained unchanged in reality. A u n d e r p r e d i c t e d represents underpredicted areas, where actual land use changes occurred but were not identified by the model. A w r o n g l y p r e d i c t e d denotes incorrectly predicted areas, where the model predicted a land use change, but the predicted transition type was incorrect.

2.5. Land Management Scenario Design

This study used the 2020 land use data as the baseline and sets 2035 as the target year to predict land use changes under different land management scenarios. The year 2035 was chosen as it marks a critical milestone in China’s long-term land use planning, encompassing key objectives such as cultivated land protection, urban expansion, and ecological restoration. For instance, the 14th Five-Year Plan and the 2035 Vision Goals Outline for Shaanxi Province emphasizes the dual goals of ensuring food security and promoting ecological sustainability, with strict cultivated land protection as a fundamental principle. Similarly, the National Territorial Spatial Planning Outline (2021–2035) highlights the need to protect prime cultivated land, regulate construction land expansion, and optimize spatial land use to safeguard national food security. To align with these policies, we designed three scenarios: natural growth (NG), cultivated land protection (CP), and ecological protection (EP). By evaluating the characteristics of NACL in SP at this pivotal moment, this study aims to provide insights to support land use planning and policy optimization. The land use transition matrices (Table 2) under different scenarios are used to simulate the land use characteristics of SP in 2035.
The NG scenario continues the historical land use change trends from 2000 to 2020. The land use transition probabilities, transition matrices, and domain factor weights are consistent with those used in the simulation of 2020 land use changes. In this scenario, water bodies are designated as restricted conversion areas. The CP scenario integrates considerations of food security and resource-environmental carrying capacity in SP, aiming to strengthen the protection of cultivated land in the study area. In the simulation, regions that were cultivated land in 2000, 2010, and 2020 are designated as long-term stable cultivated land, with lands having a slope of less than 6° classified as high-quality cultivated land. These stable and high-quality cultivated lands are then merged into a non-conversion zone. Additionally, the Markov transition probability matrix is adjusted to restrict the transition probability of cultivated land to other land use types. Specifically: the probability of cultivated land converting to built-up land is reduced by 70%; the probability of cultivated land converting to grassland or water bodies is reduced by 40%; the probability of unused land converting to cultivated land is increased by 50%. The EP scenario focuses on the protection of ecological lands such as forests, grasslands, and water bodies, prioritizing ecological conservation. In the simulation, ecological protection areas and water bodies are set as restricted conversion zones. The conversion probabilities of forests and grasslands to built-up land are reduced by 20%, and the probability of water bodies converting to built-up land is reduced by 30%.

3. Results

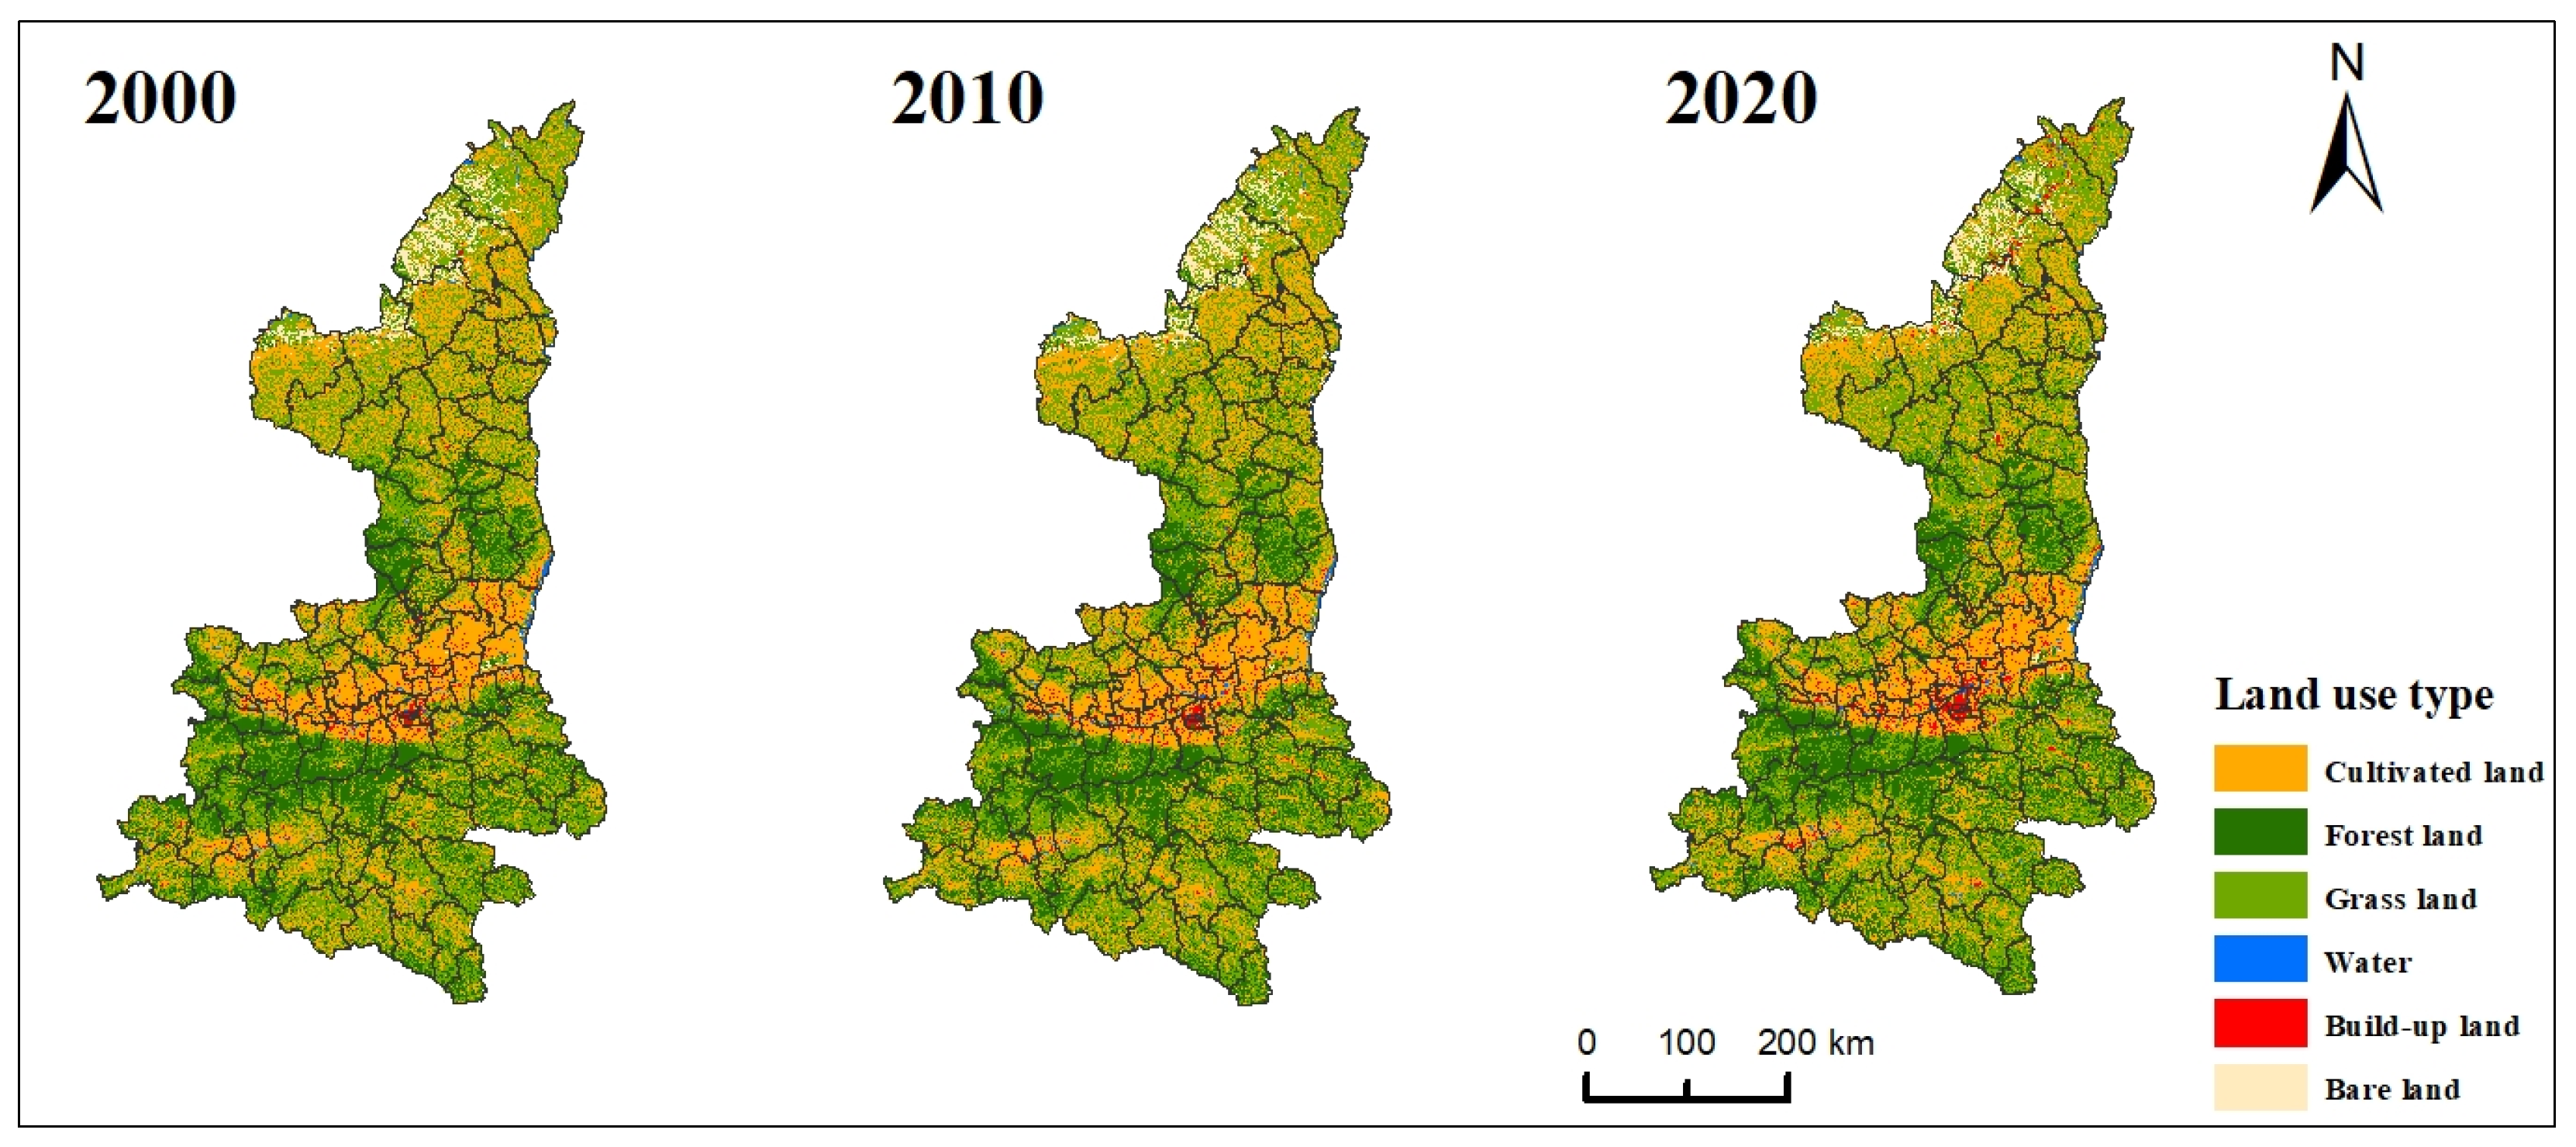
3.1. Spatiotemporal Changes in Land Use Pattern in SP from 2000 to 2020

The land use types in SP were primarily grassland, cultivated land, and forest land (Table 3). Grassland occupied the largest proportion, covering approximately 38% of the province’s total area. Cultivated land and forest land account for about 32–35% and 23–24% of the province’s area, respectively. The proportion of build-up land and bare land was around 2%, while water bodies occupied the smallest share, less than 1% of the total area. Cultivated land was mainly concentrated in the Guanzhong Plain in the central part of SP, while forest land was predominantly distributed in the southern region of the province. Grassland was more extensively distributed in the northern and southern parts of SP (Figure 2). From 2000 to 2020, the areas of different land use types underwent significant changes. The area of cultivated land in SP decreased from 71,994.33 km2 to 66,600.16 km2, a reduction of 5394.17 km2, accounting for approximately 7.5% of the cultivated land area in 2000. The area of forest land exhibited a slight increase, rising from 46,268.80 km2 to 48,620.22 km2, reflecting an increase of approximately 5.1%. The increase in grassland area was relatively small, with a growth of approximately 1181.99 km2. Construction land increased significantly, from 3015.48 km2 to 5298.65 km2, an increase of 2283.17 km2, which accounted for approximately 75.7% of the construction land in 2000. The area of bare land decreased by approximately 439.59 km2, a reduction of about 9.0% compared to the bare land area in 2000. Comparing the two periods, 2000–2010 and 2010–2020, land use conversion was more frequent in the latter period (Figure 2). Cultivated land decreased by 3534.41 km2 from 2010 to 2020, which was significantly greater than the decrease of 1859.76 km2 in the previous decade (2000–2010). This reduction mainly occurred in the Guanzhong and northern SP regions. Further analysis revealed that the reduction in cultivated land in northern SP was primarily converted to forest and grassland, while in the Guanzhong region, the decreased cultivated land was mainly transformed into grassland, forest land, and residential areas.

3.2. Spatiotemporal Dynamics and Early Warning Pattern of NACL from 2000 to 2020 in SP

The NACL in SP was evident with distinct spatial characteristics observed during different periods (Figure 3). Between 2000 and 2010, the area of NACL was 2067 km2, accounting for 1.01% of the total area of SP. The degree of NACL was more pronounced in the northern part of the province compared to other regions, with most counties experiencing a conversion area of 100–200 km2 (Figure 3a). Zichang County had the largest NACL area among all counties, with a conversion area ranging from 200 to 500 km2. The Guanzhong Plain in central SP and the Qinba Mountains in the southern part of the province had a NACL area of less than 100 km2 during the 2000–2010 period, with only one county (Chang’an County) showing a conversion area between 100 and 200 km2. From 2010 to 2020, the NACL in SP accelerated evidently, reaching an area of 31,657 km2, which accounted for 15.41% of the total area of the province (Figure 3b). The degree of NACL was the highest in northern SP, with approximately two-thirds of the region experiencing a conversion area of 500–1000 km2, and one-third exceeding 1000 km2, mainly concentrated in the western and northern parts of the Yulin region. The southern part of SP exhibited the second-highest degree of NACL, especially in the southern part of Hanzhong, where the conversion area at the county scale was about 500–1000 km2. The degree of NACL in the central Guanzhong region was relatively mild, with most areas showing a conversion area of 200–500 km2, and a few areas exceeding 500 km2, primarily in the regions of Xi’an and Baoji. Overall, from 2000 to 2020 (Figure 3c), the area of NACL reached 33,179 km2, accounting for 16.15% of the total area of SP. Specifically, the northern part of the province exhibited the highest degree of NACL, with most counties showing a conversion area greater than 1000 km2, primarily in the northern and western parts of Yulin and the northwestern part of Yan’an. The eastern part of Yulin also showed a relatively high degree of NACL, ranging from 500 to 1000 km2. The southern part of SP exhibited a degree of NACL second only to the northern region, with most areas experiencing a conversion of 500–1000 km2, mainly in several counties in the Hanzhong and the western part of Ankang. The eastern part of the southern SP, particularly the Shangluo region, had a lower degree of NACL, around 200–500 km2. The NACL in the Guanzhong region was relatively mild, with approximately half of the areas showing a conversion of 100–500 km2 at the county scale, while the other half had a conversion area of 500–1000 km2.
We further examined the early warning levels of NACL in different periods and found that between 2000 and 2010, the conversion rate of NACL in most regions of SP was below 10%, indicating a mild early warning level (Figure 3d). However, in the northern SP, four counties in the Yan’an region had a non-agricultural conversion rate between 10% and 30%, indicating a moderate early warning level. In the central Guanzhong region, more than ten counties had a conversion rate greater than 10%, indicating a moderate to high early warning level. In the southern SP, the non-agricultural conversion rate was below 10%, with a mild early warning level. Between 2010 and 2020, the non-agricultural conversion rate in many regions of SP showed an increasing trend (Figure 3e). In the northern SP, three counties had a non-agricultural conversion rate exceeding 70%, reaching an extreme early warning level, while four counties had a conversion rate between 50% and 70%, with a severe early warning level. The non-agricultural conversion rate in the Guanzhong region also increased, especially in several counties in the western part of Guanzhong, where the conversion rate exceeded 30%, reaching a high early warning level. In the southern SP, particularly in the western part of Shangluo and the northeastern part of Ankang, the non-agricultural conversion rate ranged from 50% to 70%, indicating a severe early warning level. From 2000 to 2020 (Figure 3f), only seven counties had a non-agricultural conversion rate between 10% and 30%, corresponding to a moderate early warning level, while the early warning level in the remaining areas was high or extreme. Particularly in northern SP, most areas had a non-agricultural conversion rate exceeding 70%, indicating an extreme early warning level. In the Guanzhong region, except for a few counties where the conversion rate was below 30%, most areas had a conversion rate greater than 70%, corresponding to an extreme early warning level. In the southern part of SP, most areas had a non-agricultural conversion rate between 50% and 70%, indicating a severe early warning level.

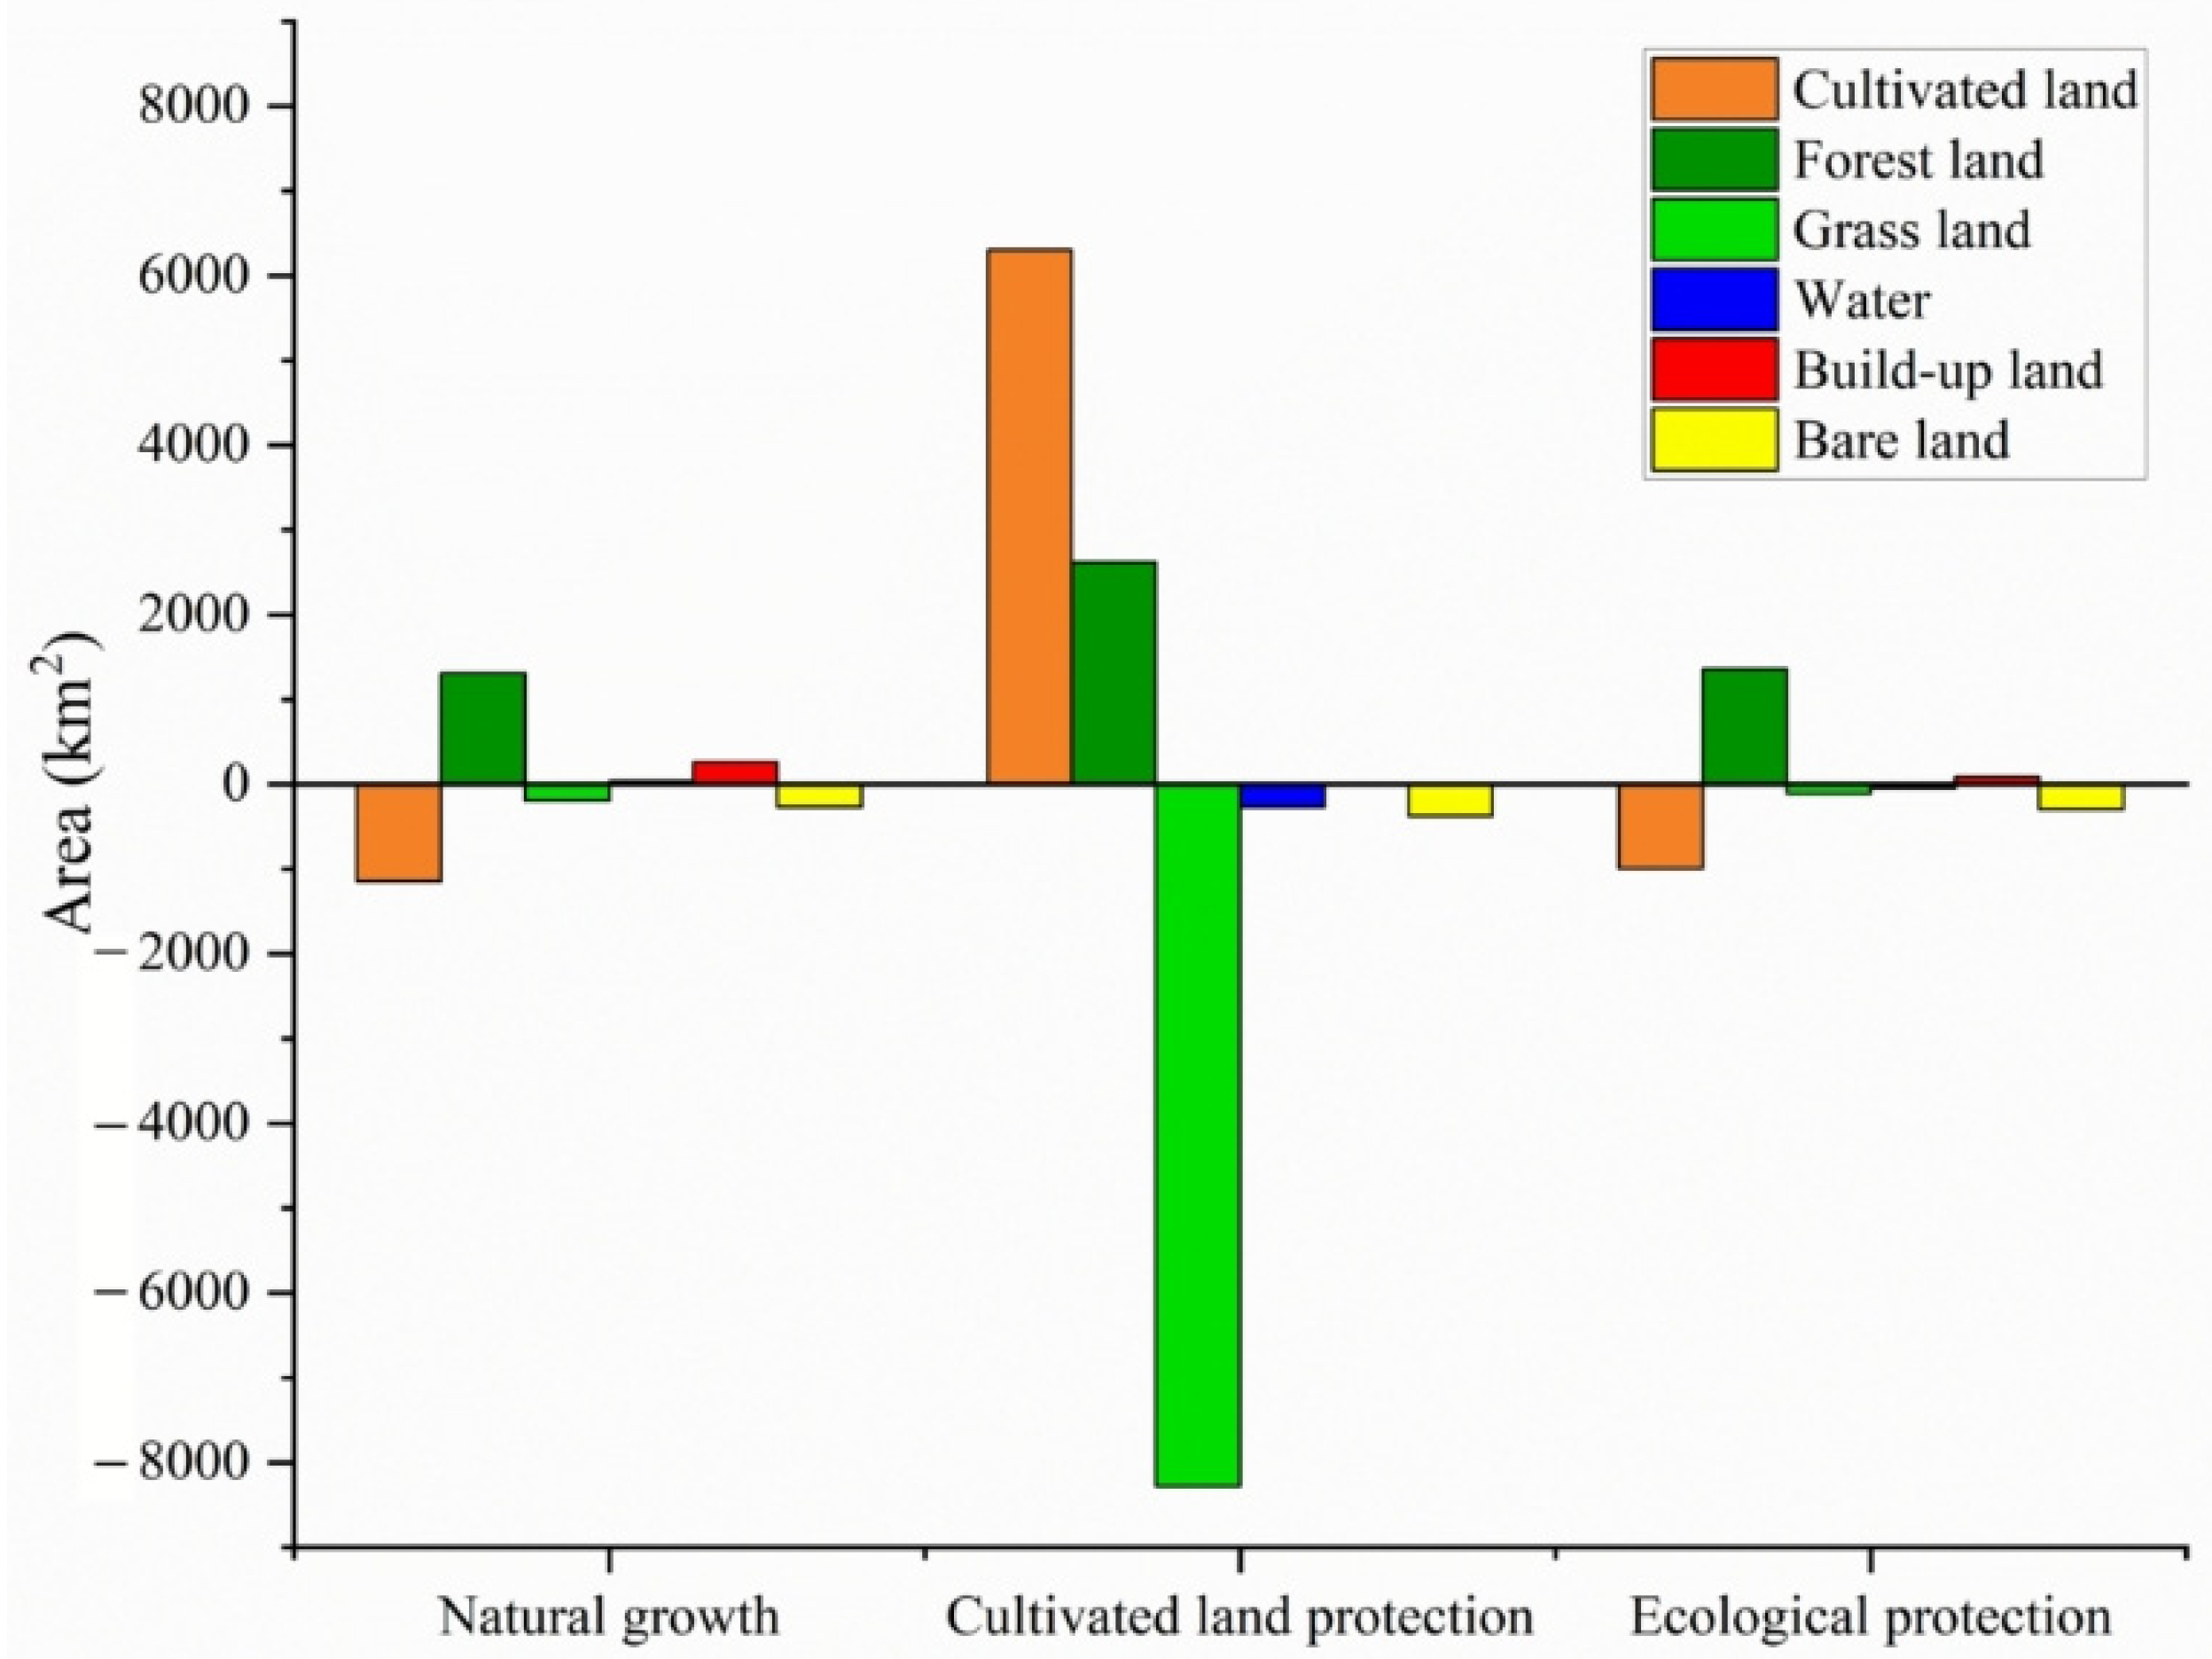
3.3. Potential Impacts of Land Management Measures on the Future NACL in SP

Based on the PLUS model, the land use patterns for 2035 under three different land management scenarios were predicted (Table 4). Under the NG scenario, the land use pattern in SP did not undergo significant changes, with grassland occupying the largest proportion (38.22%), followed by cultivated land (31.84%) and forest land (24.29%). Compared to 2020, the areas of cultivated land, grassland, and bare land decreased by 1146.08 km2, 189.39 km2, and 268.62 km2, respectively, while the areas of forest land and construction land increased by 1308.30 km2 and 268.62 km2, respectively (Figure 4). Under the CP scenario, the land use pattern in 2035 changed evidently. Cultivated land became the dominant land use type, occupying 35.47% of the province’s area, followed by grassland (34.28%) and forest land (24.93%). In this scenario, the areas of both cultivated land and forest land increased significantly, rising by 6305.34 km2 and 2622.40 km2, respectively, compared to 2020. In contrast, the grassland area decreased by 8284.38 km2. These changes could be explained as follows: under the CP scenario, reducing the probability of cultivated land converting to grassland by 40% led to an inevitable increase in cultivated land, primarily at the expense of grassland. As the total land use area remains unchanged, this shift is expected to cause a significant decline in grassland area by 2035. Specifically, the increase in cultivated land and forest land accounted for 9.5% and 5.4% of their respective 2020 areas, while the decrease in grassland represented 10.5% of its 2020 area. Under the EP scenario, the land use pattern was generally consistent with that of the NG scenario (Table 4).
Further analysis was conducted to examine the spatial characteristics of NACL under different land management scenarios (Figure 5). In the NG scenario, the area of NACL in SP from 2020 to 2035 was 15,778.48 km2, a decrease of 17,400.52 km2 compared to the 2000–2020 period. In this scenario, non-agricultural conversion was most prominent in northern SP, especially in the northwestern counties of Yulin and Yan’an, where the conversion area at the county scale exceeded 400 km2. In the Guanzhong region, non-agricultural conversion was relatively light, with most counties showing conversion areas less than 200 km2. In southern SP, most regions had NACL areas less than 300 km2, with only a few southernmost counties exhibiting conversion areas between 300 and 400 km2. Under the CP scenario, the area of NACL from 2020 to 2035 in SP was 13,520.90 km2, which was a reduction of 19,658.10 km2 compared to the 2000–2020 period. In terms of spatial distribution (Figure 5b), most counties in northern SP had NACL areas below 400 km2. In the Guanzhong region, many counties experienced a decrease in NACL, with areas dropping below 100 km2. In southern SP, the NACL area also decreased evidently, with most counties showing areas below 200 km2, except for a few in the southernmost part, where the conversion ranged between 200 and 300 km2. Under the EP scenario, the spatial pattern of NACL was close to that under the NG scenario, except for some counties in the western part of northern SP, where a reduction in non-agricultural conversion occurred, and some counties in southern SP, where the conversion intensified (Figure 5c).
The early warning levels of NACL under different management scenarios were also assessed. In the NG scenario (Figure 5d), the highest non-agricultural conversion rates, ranging from 30% to 50%, were observed in three counties in western Yan’an, seven counties in Guanzhong region, and three counties in southern SP, corresponding to a high early warning level. The non-agricultural conversion rates in seven counties in eastern Yulin were between 10% and 30%, indicating a moderate early warning level, while the remaining areas exhibited a low early warning level. In the CP scenario (Figure 5e), the non-agricultural conversion rates in many areas decreased significantly, with rates in the Yan’an region, the Guanzhong region, and much of southern SP dropping to between 10% and 30%, resulting in a moderate early warning level. Only a few counties in Yan’an, Xi’an, and Shangluo had conversion rates between 30% and 50%. In the EP scenario (Figure 5f), the non-agricultural conversion rates and early warning levels in SP were generally consistent with those under the NG scenario.

3.4. Spatial Aggregation Characteristics of NACL Under Different Management Measures in SP

To clarify the spatial characteristics of NACL under different management measures in the future, the Moran’s I index was used to assess the spatial autocorrelation of non-agricultural conversion under three management scenarios (Table 5). During the historical period (2000–2020) under the three management scenarios, the calculated GISA values ranged from 0.54 to 0.62, with Z-values greater than 2.58 and p-values less than 0.05. This indicated a significant spatial autocorrelation in the NACL in SP under different management measures.
Further analysis using the LISA identified the spatial clustering patterns of non-agricultural conversion under the three management scenarios (Table 6). The results showed that, during the 2000–2020 period, non-agricultural conversion was primarily characterized by high–high clustering, covering an area of 94,199.75 km2, mainly concentrated in the northern SP region (Figure 6). This suggested that adjacent counties in northern SP exhibited higher levels of non-agricultural conversion. Under both the NG and CP scenarios, the area of high–high clustering decreased by 16,558.67 km2 and 13,345.47 km2, respectively, with the reductions primarily occurring in northern SP. In contrast, under the EP scenario, the area of high–high clustering increased by 2635.5 km2, with the expansion mainly occurring in the southern parts of Ankang and Hanzhong in southern SP.
During the 2000–2020 period, seven counties exhibited low–low clustering in non-agricultural conversion, covering an area of 12,201.34 km2. This pattern was mainly observed in several counties in the Guanzhong region, including Xi’an and Baoji, indicating a lower level of non-agricultural conversion in this area. Among the three management scenarios, the area of low–low clustering in Guanzhong decreased only under the NG scenario, while in the CP and EP scenarios, the areas of low–low clustering increased by 5198.42 km2 and 3001.96 km2, respectively. This suggested that even in areas where cultivated land or ecological protection measures were implemented, low-intensity, localized non-agricultural land conversion might still occur. This indicated a mismatch between conservation goals and land management measures, highlighting the need for more targeted and effective management strategies.

4. Discussion

4.1. Regional Differences in NACL in SP

The spatiotemporal analysis of NACL in SP revealed evident temporal variations. The area of NACL was relatively small from 2000 to 2010, with most regions classified under a mild warning level. The higher-intensity non-agricultural conversion were concentrated in northern SP, where some counties reached a moderate warning level. However, during the 2010–2020 period, the cultivated land underwent a large-scale non-agricultural conversion, particularly in the northern and southern region of SP. In some regions, the NACL showed conversion rates exceeding 70%, raising the warning level to extreme. Previous studies have also reported an intensifying trend of cultivated land non-agricultural conversion in SP [11,27,28]. Additionally, our findings revealed clear regional differences in the extent of NACL across SP, particularly among the northern, Guanzhong, and southern regions. Between 2000 and 2020, the degree of non-agricultural conversion was most severe in northern SP, particularly in some counties in the western parts of Yulin and Yan’an, where the proportion of converted land was high and conversion rates exceeded 70%, reaching an extreme warning level. Previous studies have also expressed concerns about the issue of non-agriculturalization in northern SP [28,29,30]. In contrast, the Guanzhong region exhibited a relatively smaller area of non-agricultural conversion, but the conversion rate in most counties was over 50%, with warning levels classified as severe or higher, which aligns with previous studies. The southern SP region showed localized intensification of NACL, particularly in the southern parts of Hanzhong and Ankang, where conversion rates ranged from 50% to 70%, and the warning level reached severe. Overall, the conversion rate of NACL in northern SP and Guanzhong region accelerated significantly, while the conversion process in southern SP remained relatively slow.
Numerous studies have confirmed that the regional disparities in NACL are closely related to economic development levels, land resource pressures, and policy orientations [31,32,33]. In northern SP, especially in Yulin and Yan’an, land use pressure is low. However, due to inadequate infrastructure and poor agricultural water conditions [34], large areas of cultivated land have been converted into forests and grasslands, leading to an exacerbation of non-agricultural conversion. In contrast, the Guanzhong region, which has abundant agricultural resources and vast cultivated land, is also the economic and population center of SP [35]. With the acceleration of urbanization and the increasing land demand driven by industrialization, the pace of NACL is also intensified [36]. Southern SP has actively implemented national EP policies, and in some areas, cultivated land has been converted into grasslands or forests. Despite the implementation of cultivated land protection measures, non-agricultural conversion continued to rise sharply, due to the limited availability of cultivated land resources and natural constraints [37]. Particularly in certain regions of Hanzhong and Ankang, the conflict between local economic development needs and ecological protection goals has led to a localized intensification of non-agricultural conversion.

4.2. Regulatory Role of Land Management in NACL

Predictive analysis of different management scenarios for 2035 showed that land management strategies played a crucial role in mitigating the NACL. In the NG scenario, the non-agricultural conversion process in SP was expected to continue its rapid pace, particularly in northern and southern SP. In some regions, the area of non-agricultural conversion was predicted to exceed 30%, reaching a high warning level. This phenomenon was primarily driven by rapid regional economic development and increased demand for land for construction [38,39]. Although the pace of non-agricultural conversion in this scenario remained relatively fast, it slowed compared to past trends, indicating that land management measures in certain areas were beginning to take effect. However, these measures, which were based on NG, have not yet fully adapted to the demands of rapid urbanization.
In the CP scenario, the area of NACL in SP was expected to decrease markedly, with conversion rates clearly lower than those in the NG scenario, effectively curbing the process. This was particularly evident in northern SP, where counties in Yulin and western Yan’an, facing higher non-agricultural conversion pressure, were expected to have conversion rates drop below 30%, with the warning level decreasing from extreme to moderate or lower. This change was attributed to the strengthening of cultivated land protection measures in the region, which reduced the encroachment of construction land on cultivated land effectively [31,40]. The influence of management measures on the non-agricultural conversion process was also notable in the Guanzhong region. Under the CP scenario, it was anticipated that the area of non-agricultural conversion in Guanzhong would evidently decrease in the 2035, with conversion rates in some counties in Xi’an and Baoji dropping to below 10%, suggesting that enhanced land planning, optimized land resource allocation, and stronger enforcement of cultivated land protection policies have better safeguarded cultivated land resources, effectively curbing the expansion of non-agricultural conversion. This was consistent with the results of previously reported study [41].
Under the EP scenario, the non-agricultural conversion process followed a trend similar to that of the NG scenario, though some acceleration was still observed. Predictions indicated that in 2035, some counties in southern SP, particularly in the southern parts of Hanzhong and Ankang, would experience non-agricultural conversion rates above 30%. This suggested that ecological protection measures might have limited effectiveness in mitigating non-agricultural conversion, especially in areas with strong economic development demands. Existing research suggests that policies regulating the conversion of agricultural land vary across regions. Some countries mandate compensation for lost agricultural income or require the provision of alternative farmland [42,43,44]. However, the effectiveness of these policies is often constrained by competing land demands, leading to inconsistencies in their implementation [45]. Additionally, alternative strategies, such as urban densification and the promotion of sustainable land-use practices, are frequently overlooked [46,47]. In southern SP, ecological protection measures were inadequate in addressing the conflicts between land use and the demands of industrialization and urbanization, resulting in the continued intensification of non-agricultural conversion. Therefore, targeted cultivated land protection measures appear to be more effective than ecological protection strategies in controlling the NACL.

5. Conclusions

This study analyzed the spatiotemporal evolution of NACL in SP and evaluated the impact of different land management scenarios on the future progression of non-agricultural conversion (Figure A1). The results indicated that the NACL in SP intensified gradually from 2000 to 2020, exhibiting evident regional differences. The most severe non-agricultural conversion occurred in northern SP, where the majority of regions were under extreme warning levels; in the Guanzhong region, most areas were classified as above heavy warning levels; while in southern SP, the conversion process was relatively mild, though localized intensification was observed. Based on predictions of land-use patterns for 2035 under different land management scenarios, the CP scenario significantly reduces the conversion rate of cultivated land to non-agricultural use, particularly in northern SP and Guanzhong region, where the warning levels were lowered to moderate. However, the high–high clustering of non-agricultural conversion remains prominent in northern SP. Although non-agricultural conversion in SP decreased under both the NG and EP scenarios, the issue remains critical. To more effectively mitigate the process of NACL, future land management strategies should prioritize regional and integrated management approaches. In northern SP, efforts should focus on strengthening cultivated land protection to ensure the sustainable use of land resources. In the Guanzhong region, further control of non-agricultural conversion can be achieved by developing rational land-use plans and enhancing cultivated land quality. In southern SP, while continuing to implement ecological protection measures, more flexible land management strategies should be explored, such as the promotion of ecological agriculture, which can help balance food production with local economic development.

Author Contributions

Conceptualization, H.Y. and F.W.; methodology, H.Y. and F.W.; formal analysis, H.Y. and R.L.; funding acquisition, F.W.; visualization, H.Y. and L.Q.; writing—original draft, H.Y.; writing—review and editing, F.W. and H.C. All authors have read and agreed to the published version of the manuscript.

Funding

This study was funded by the National Natural Science Foundation of China (42177344) and the International Partnership Program of the Chinese Academy of Sciences (16146kysb20200001).

Institutional Review Board Statement

Not applicable.

Data Availability Statement

The data presented in this study are available on request from the corresponding author for research purposes.

Acknowledgments

We would like to thank the Institute of Land Comprehensive Science, Northwest Research Institute of Engineering Investigations and Design, for their support in data collection and mapping. We also express our gratitude to the Department of Natural Resources of Shaanxi Province for their guidance and valuable suggestions in the analysis of the results.

Conflicts of Interest

The authors declare no conflicts of interest.

Appendix A

Figure A1. Flowchart of the methodology in this study.
Agriculture 15 00672 g0a1

References

  1. Lyu, X.; Peng, W.; Niu, S.; Qu, Y.; Xin, Z. Evaluation of sustainable intensification of cultivated land use according to farming households’ livelihood types. Ecol. Indic. 2022, 138, 108848. [Google Scholar] [CrossRef]
  2. Deng, X.; Huang, J.; Rozelle, S.; Uchida, E. Cultivated land conversion and potential agricultural productivity in China. Land Use Policy 2006, 23, 372–384. [Google Scholar] [CrossRef]
  3. Francis, C.A.; Hansen, T.E.; Fox, A.A.; Hesje, P.J.; Nelson, H.E.; Lawseth, A.E.; English, A. Farmland conversion to non-agricultural uses in the US and Canada: Current impacts and concerns for the future. Int. J. Agric. Sustain. 2012, 10, 8–24. [Google Scholar] [CrossRef]
  4. Su, Y.; Qian, K.; Lin, L.; Wang, K.; Guan, T.; Gan, M. Identifying the driving forces of non-grain production expansion in rural China and its implications for policies on cultivated land protection. Land Use Policy 2020, 92, 104435. [Google Scholar] [CrossRef]
  5. Li, S.; Nadolnyak, D.; Hartarska, V. Agricultural land conversion: Impacts of economic and natural risk factors in a coastal area. Land Use Policy 2019, 80, 380–390. [Google Scholar] [CrossRef]
  6. Chen, Y.; Wang, S.; Wang, Y. Spatiotemporal evolution of cultivated land non-agriculturalization and its drivers in typical areas of southwest China from 2000 to 2020. Remote Sens. 2022, 14, 3211. [Google Scholar] [CrossRef]
  7. Cui, X.; Zhou, T.; Xiong, X.; Xiong, J.; Zhang, J.; Jiang, Y. Farmland suitability evaluation oriented by non-agriculturalization sensitivity: A case study of Hubei Province, China. Land 2022, 11, 488. [Google Scholar] [CrossRef]
  8. Zhang, Y.; Long, H.; Ma, L.; Ge, D.; Tu, S.; Qu, Y. Farmland function evolution in the Huang-Huai-Hai Plain: Processes, patterns and mechanisms. J. Geogr. Sci. 2018, 28, 759–777. [Google Scholar] [CrossRef]
  9. Li, W.; Wang, D.; Liu, S.; Zhu, Y. Measuring urbanization-occupation and internal conversion of peri-urban cultivated land to determine changes in the peri-urban agriculture of the black soil region. Ecol. Indic. 2019, 102, 328–337. [Google Scholar] [CrossRef]
  10. Liu, Y.; Zhou, Y. Reflections on China’s food security and land use policy under rapid urbanization. Land Use Policy 2021, 109, 105699. [Google Scholar] [CrossRef]
  11. Yan, H.; Chen, H.; Wang, F.; Qiu, L. Dynamics of cropland non-agriculturalization in Shaanxi Province of China and its attribution using a machine learning approach. Land 2025, 14, 190. [Google Scholar] [CrossRef]
  12. Zhou, Y.; Zhong, Z.; Cheng, G. Cultivated land loss and construction land expansion in China: Evidence from national land surveys in 1996, 2009 and 2019. Land Use Policy 2023, 125, 106496. [Google Scholar] [CrossRef]
  13. Yang, Q.; Gao, Y.; Yang, X.; Zhang, J. Rural transformation driven by households’ adaptation to climate, policy, market, and urbanization: Perspectives from livelihoods-land use on Chinese Loess Plateau. Agriculture 2022, 12, 1111. [Google Scholar] [CrossRef]
  14. Shi, Z.; Ma, L.; Wang, X.; Wu, S.; Bai, J.; Li, Z.; Zhang, Y. Efficiency of agricultural modernization in China: Systematic analysis in the new framework of multidimensional security. J. Clean. Prod. 2023, 432, 139611. [Google Scholar] [CrossRef]
  15. Wang, J.; Liu, Y.; Li, Y. Ecological restoration under rural restructuring: A case study of Yan’an in China’s loess plateau. Land Use Policy 2019, 87, 104087. [Google Scholar] [CrossRef]
  16. Zhu, Y.; Hu, Y.; Zhu, Y. Can China’s energy policies achieve the “dual carbon” goal? A multi-dimensional analysis based on policy text tools. Environ. Dev. Sustain. 2024. [Google Scholar] [CrossRef]
  17. Huang, L.; Yang, P.; Zhang, B.; Hu, W. Spatio-Temporal coupling characteristics and the driving mechanism of population-land-industry urbanization in the Yangtze River Economic Belt. Land 2021, 10, 400. [Google Scholar] [CrossRef]
  18. Chen, M.; Samat, N.; Tilaki, M.J.M.; Duan, L. Land use/cover change simulation research: A system literature review based on bibliometric analyses. Ecol. Indic. 2025, 170, 112991. [Google Scholar] [CrossRef]
  19. Liang, X.; Guan, Q.; Clarke, K.C.; Liu, S.; Wang, B.; Yao, Y. Understanding the drivers of sustainable land expansion using a patch-generating land use simulation (PLUS) model: A case study in Wuhan, China. Comput. Environ. Urban Syst. 2021, 85, 101569. [Google Scholar] [CrossRef]
  20. Zhang, Q.X.; Li, F. Correlation between land use spatial and functional transition: A case study of Shaanxi Province, China. Land Use Policy 2022, 119, 106194. [Google Scholar] [CrossRef]
  21. Liu, S.; Yao, S. The effect of precipitation on the Cost-Effectiveness of Sloping land conversion Program: A case study of Shaanxi Province, China. Ecol. Indic. 2021, 132, 108251. [Google Scholar] [CrossRef]
  22. Zhang, G.; Li, X.; Zhang, L.; Wei, X. Dynamics and causes of cropland Non-Agriculturalization in typical regions of China: An explanation Based on interpretable Machine learning. Ecol. Indic. 2024, 166, 112348. [Google Scholar] [CrossRef]
  23. Anselin, L.; Bera, A.K. Spatial dependence in linear regression models with an introduction to spatial econometrics. Handb. Appl. Econ. Stat. 1998, 155, 237–289. [Google Scholar]
  24. Anselin, L. Local indicators of spatial association—LISA. Geogr. Anal. 1995, 27, 93–115. [Google Scholar] [CrossRef]
  25. Liang, X.; Liu, X.; Li, D.; Zhao, H.; Chen, G. Urban growth simulation by incorporating planning policies into a CA-based future land-use simulation model. Int. J. Geogr. Inf. Sci. 2018, 32, 2294–2316. [Google Scholar] [CrossRef]
  26. Cai, G.; Xiong, J.; Wen, L.; Weng, A.; Lin, Y.; Li, B. Predicting the ecosystem service values and constructing ecological security patterns in future changing land use patterns. Ecol. Indic. 2023, 154, 110787. [Google Scholar] [CrossRef]
  27. Chou, J.; Dong, W.; Wang, S.; Fu, Y. Quantitative analysis of agricultural land use change in China. Phys. Chem. Earth 2015, 87–88, 3–9. [Google Scholar] [CrossRef]
  28. Gutiérrez Rodríguez, L.; Hogarth, N.J.; Zhou, W.; Xie, C.; Zhang, K.; Putzel, L. China’s conversion of cropland to forest program: A systematic review of the environmental and socioeconomic effects. Environ. Evid. 2016, 5, 21. [Google Scholar] [CrossRef]
  29. Fu, B.; Wang, S.; Liu, Y.; Liu, J.; Liang, W.; Miao, C. Hydrogeomorphic ecosystem responses to natural and anthropogenic changes in the Loess Plateau of China. Annu. Rev. Earth Planet. Sci. 2017, 45, 223–243. [Google Scholar] [CrossRef]
  30. Cao, S.X. Impact of China’s large-scale ecological restoration program on the environment and society in arid and semiarid areas of China: Achievements, problems, synthesis, and applications. Crit. Rev. Environ. Sci. Technol. 2011, 41, 317–335. [Google Scholar] [CrossRef]
  31. Chen, B.; Yao, N. Evolution characteristics of cultivated land protection policy in China based on Smith policy implementation. Agriculture 2024, 14, 1194. [Google Scholar] [CrossRef]
  32. Jin, G.; Deng, X.; Chu, X.; Li, Z.; Wang, Y. Optimization of land-use management for ecosystem service improvement: A review. Phys. Chem. Earth 2017, 101, 70–77. [Google Scholar] [CrossRef]
  33. Liu, J.; Guo, Q. A spatial panel statistical analysis on cultivated land conversion and chinese economic growth. Ecol. Indic. 2015, 51, 20–24. [Google Scholar] [CrossRef]
  34. Xu, W.; Sun, T. Evaluation of rural habitat environment in under-developed areas of Western China: A case study of Northern Shaanxi. Environ. Dev. Sustain. 2022, 24, 10503–10539. [Google Scholar] [CrossRef]
  35. Newton, A.C.; Coward, F.; Elliott, S.; Jenkins, E.; Linden, M.V.; Riris, P.; Silva, F. Understanding long-term human ecodynamics through the lens of ecosystem collapse. Holocene 2024, 34, 1439–1453. [Google Scholar] [CrossRef]
  36. Zhang, X.; Zhang, Y.; Shi, P.; Bi, Z.; Shan, Z.; Ren, L. The deep challenge of nitrate pollution in river water of China. Sci. Total Environ. 2021, 770, 144674. [Google Scholar] [CrossRef]
  37. Chen, S.; Yao, S. Evaluation and dynamic prediction of ecological security from the perspective of sustainable development: A case study of Shaanxi Province, China. Environ. Sci. Pollut. Res. 2022, 29, 42331–42346. [Google Scholar] [CrossRef]
  38. Chien, S.-S. Local farmland loss and preservation in China A perspective of quota territorialization. Land Use Policy 2015, 49, 65–74. [Google Scholar] [CrossRef]
  39. Li, Y.; Zhang, X.; Cao, Z.; Liu, Z.; Lu, Z.; Liu, Y. Towards the progress of ecological restoration and economic development in China’s Loess Plateau and strategy for more sustainable development. Sci. Total Environ. 2021, 756, 143676. [Google Scholar] [CrossRef]
  40. Zhou, Y.; Li, X.; Liu, Y. Cultivated land protection and rational use in China. Land Use Policy 2021, 106, 105454. [Google Scholar] [CrossRef]
  41. Wang, L.Y.; Zheng, W.W.; Tang, L.P.; Zhang, S.Y.; Liu, Y.L.; Ke, X.L. Spatial optimization of urban land and cropland based on land production capacity to balance cropland protection and ecological conservation. J. Environ. Manag. 2021, 285, 112054. [Google Scholar] [CrossRef]
  42. Pe’er, G.; Zinngrebe, Y.; Moreira, F.; Sirami, C.; Schindler, S.; Mueller, R.; Bontzorlos, V.; Clough, D.; Bezak, P.; Bonn, A.; et al. A greener path for the EU Common Agricultural Policy. Science 2019, 365, 449–451. [Google Scholar] [CrossRef] [PubMed]
  43. Kleemann, L.; Thiele, R. Rural welfare implications of large-scale land acquisitions in Africa: A theoretical framework. Econ. Model. 2015, 51, 269–279. [Google Scholar] [CrossRef]
  44. Kurosaki, T. Crop choice, farm income, and political control in Myanmar. J. Asia Pac. Econ. 2008, 13, 180–203. [Google Scholar] [CrossRef]
  45. Haberl, H. Competition for land: A sociometabolic perspective. Ecol. Econ. 2015, 119, 424–431. [Google Scholar] [CrossRef]
  46. Naess, P.; Saglie, I.-L.; Richardson, T. Urban sustainability: Is densification sufficient? Eur. Plan. Stud. 2020, 28, 146–165. [Google Scholar] [CrossRef]
  47. Aznar-Sánchez, J.A.; Piquer-Rodríguez, M.; Velasco-Muñoz, J.F.; Manzano-Agugliaro, F. Worldwide research trends on sustainable land use in agriculture. Land Use Policy 2019, 87, 104069. [Google Scholar] [CrossRef]
Figure 1. Location and elevation of SP in China.
Agriculture 15 00672 g001
Figure 2. Spatial distribution of land use in SP from 2000 to 2020.
Agriculture 15 00672 g002
Figure 3. Spatial distribution characteristics and early warning patterns of cultivated land non-agriculturalization in SP from 2000 to 2020. (ac) represent the distribution characteristics of cultivated land non-agriculturalization during the periods 2000–2010, 2010–2020, and 2000–2020, respectively; (df) represent the distribution characteristics of the early warning levels based on conversion rates of non-agriculturalization during the periods 2000–2010, 2010–2020, and 2000–2020, respectively. The conversion rates of 1–10%, 11–30%, 31–50%, 51–70%, and greater than 70% corresponded to mild, moderate, high, severe, and extreme early warning levels, respectively (same as below).
Agriculture 15 00672 g003
Figure 4. Area changes of different land use types in SP in 2035 under different land use management scenarios compared to 2020.
Agriculture 15 00672 g004
Figure 5. Spatial characteristics and early warning patterns of cultivated land non-agriculturalization in SP by 2035 under different land use management scenarios.
Agriculture 15 00672 g005
Figure 6. LISA patterns of NACL in SP by 2035 under different land use management scenarios.
Agriculture 15 00672 g006
Table 1. Data information and sources.
Data TypeDriving FactorsData SourceSpatial Resolution
Land use dataLand use data in 2000, 2010, 2020 https://www.resdc.cn/ (accessed on 12 July 2024)1 km
Topographic dataElevation, Slopehttp://www.gscloud.cn/ (accessed on 12 July 2024)30 m
Socio-economic dataPopulation densityhttps://www.worldpop.org/ (accessed on 15 July 2024)1 km
Per capita GDPhttps://www.resdc.cn/ (accessed on 15 July 2024)1 km
Accessibility factor dataNational highwayshttp://www.webmap.cn/ (accessed on 16 July 2024)1 km
Rural residential areashttp://www.webmap.cn/ (accessed on 15 July 2024)1 km
Climate dataAnnual temperaturehttp://www.geodata.cn (accessed on 12 July 2024)1 km
Annual precipitationhttp://www.geodata.cn (accessed on 13 July 2024)1 km
Table 2. Parameter settings of land use transition matrices under different management scenarios.
Natural GrowthCultivated Land ProtectionEcological Protection
abcdefabcdefabcdef
a111111100000111010
b111011111011111011
c111111111111111111
d001100101111101111
e111011001010001110
f111111111111111111
Note: a, b, c, d, e, and f represent cultivated land, forest land, grassland, water bodies, build-up land, and bare land, respectively. 0 indicates no conversion between two land use types, and 1 indicates possible conversion.
Table 3. Changes in the area (km2) of different land use types in SP from 2000 to 2020.
Cultivated LandForest LandGrass LandWaterBuild-Up LandBare Land
2000Area (km2)71,994.3346,268.8077,573.521748.693015.484893.21
Proportion (%)35.0322.5237.750.851.472.38
2010Area (km2)70,134.5747,597.6577,826.131789.383380.734765.59
Proportion (%)34.1323.1637.870.871.652.32
2020Area (km2)66,600.1648,620.2278,755.511838.255298.654453.62
Proportion (%)32.4123.6638.320.892.582.17
Table 4. Predicted area (km2) and proportion (%) of different land use types in SP for 2035 under different management scenarios.
Land Use TypesNatural GrowthCultivated Land ProtectionEcological Protection
Area
(km2)
Proportion
(%)
Area
(km2)
Proportion
(%)
Area
(km2)
Proportion
(%)
Cultivated land65,454.0831.8472,905.5035.4765,605.4731.91
Forest land49,928.5224.2951,242.6224.9349,979.8524.31
Grass land78,566.1238.2270,471.1334.2878,646.4038.26
Water 1872.760.911570.610.761790.000.87
Build-up land5559.932.705300.872.585387.512.62
Bare land4185.002.044075.691.984157.182.02
Table 5. GISA of cultivated land non-agriculturalization in SP from 2000 to 2020 under different management scenarios.
2000–2020Natural GrowthCultivated Land ProtectionEcological Protection
p-value<0.01<0.01<0.01<0.01
Z-score8.6398.6479.9968.163
GISA0.5370.5380.6230.506
Table 6. Area (km2) occupied by different aggregation types of NACL based on LISA in SP under different management scenarios.
Aggregation Types2000–2020Natural GrowthCultivated Land ProtectionEcological Protection
High–High94,199.75 (16)77,641.08 (11)80,854.28 (12)96,835.25 (16)
High–Low1856.66 (1)6666.37 (2)6017.36 (2)2314.71 (1)
Low–High4168.77 (2)7302.56 (3)7302.56 (3)3802.44 (2)
Low–Low12,201.34 (7)8037.55 (12)17,399.76 (19)15,203.3 (17)
Note: The data in parentheses represents the number of counties with a specific aggregation type.
Disclaimer/Publisher’s Note: The statements, opinions and data contained in all publications are solely those of the individual author(s) and contributor(s) and not of MDPI and/or the editor(s). MDPI and/or the editor(s) disclaim responsibility for any injury to people or property resulting from any ideas, methods, instructions or products referred to in the content.

