Abstract
Invasive species pose a growing threat to global biodiversity, agricultural productivity, and ecosystem health, as climate change worsens their spread. This study focused on modelling the current and projected distribution of the Japanese beetle (Popillia japonica Newman), an invasive pest with potentially devastating impacts on crops and natural vegetation across Europe. Using the MaxEnt species distribution model, we integrated beetle occurrence data with bioclimatic variables, analyzing current and future climate scenarios based on Shared Socio-economic Pathways (SSP1-2.6, SSP2-4.5, SSP5-8.5) for near-term (2021–2040) and mid-term (2041–2060) periods. By reclassifying the model results, we identified European regions with negligible, low, medium, and high exposure to this invasive pest under climate change pathways. The results identified regions in central Europe covering an area of 83,807 km2 that are currently at medium to high risk of Japanese beetle infestation. Future projections suggest northward expansion with suitable areas potentially increasing to 120,436 km2 in the worst-case scenario, particularly in northern Italy, southern Germany, the Western Balkans, and parts of France. These spatially explicit findings can inform targeted monitoring, early detection, and management strategies to mitigate the economic and ecological threats posed by the Japanese beetle. Integrating species distribution modelling with climate change scenarios is imperative for science-based policies to tackle the growing challenge of biological invasions. This research provides a framework for assessing invasion risks at the European scale and guiding adaptive responses in agricultural and natural systems.
1. Introduction
Emerging biological invasions are one of the greatest threats to human health, global biodiversity, and agricultural systems [1,2]. Climate change and degradation of ecosystems are expected to accelerate the ongoing expansion of invasive plant and animal species. This issue is further exacerbated by increased human movement and global trade. These combined pressures enhance the establishment, spread, and survival of invasive species by creating expanded ecological niches and enlarging natural barriers, posing a greater threat to ecosystem stability [3].
Invasive species not only endanger local ecosystems but also change wildlife dynamics and introduce new infections and pathogens, modify host–pathogen dynamics, and affect established ecological relationships in ecosystems. Additionally, this leads to substantial damage to agricultural systems, significantly threatening food security [4,5]. In 2019, the global annual economic cost attributable to invasive species was estimated to exceed $USD 423 billion [6].
The interconnected challenges posed by invasive species underscore the need to adopt a One Health perspective, which recognizes the integral relationship between the health of humans, animals, and ecosystems. This highlights the need for integrated management strategies in addressing the impacts caused by invasive species, notably in the context of a changing climate [7].
One notable example of a non-native invasive species is Popillia japonica Newman (Coleoptera: Scarabaeidae; hereafter P. japonica) commonly known as the Japanese beetle [8]. Native to Asia, P. japonica is a highly polyphagous pest with an extensive host range, encompassing over 400 species of plants belonging to 94 families, many of which are economically important, including maize, soybean, grapevine, and various fruit trees [9]. Generally, it takes one year to develop from an egg to the adult stage, although in central and northern Europe, the life cycle may extend to two years [10]. A single female beetle deposits 3–5 eggs in the soil at a time for a total of about 60 eggs, with eggs hatching in approximately 2 weeks, depending on the temperature. During the spring season, beetle larvae primarily feed on plant roots. After emerging from pupae from mid-May to mid-July, adults (size of 8–12 mm) are active during the summer months, feeding voraciously on plant tissues and reproducing [11].
This insect exhibits a high level of adaptability to diverse climatic conditions, enabling its survival in a broad range of environments. The population dynamics of P. japonica are primarily influenced by climatic factors, such as temperature and precipitation. However, the mechanisms behind its long-distance dispersal and the establishment of new populations remain unclear [12]. P. japonica not only damages agricultural crops but also poses a threat to urban parks, private gardens, and natural ecosystems, where it can disrupt plant–pollinator interactions and alter vegetation dynamics. Accidentally introduced in North America in the early 1900s, this species has spread to other countries and is now considered a potential worldwide pest species [13].
This pest was officially recorded in Europe in July 2014 within the Ticino River Natural Park in Italy [14]. Since its initial detection, it has expanded across large areas in northern Italy. Recently, newly established populations were detected north of the Alps and in Slovenia, demonstrating their ability for dispersal and migration (actively and passively through human-mediated dispersal) across broader geographic regions [15]. P. japonica is classified as a quarantine pest under Regulation (EU) 2019/2072 and has also been listed among the 20 priority pests under Regulation (EU) 2019/1702. Member states are required to conduct particularly thorough investigations to prevent its introduction and ensure early detection. For further details, readers can refer to the ‘Integrated Pest Management IPM-Popillia project’, https://www.popillia.eu/ (accessed on 30 September 2024).
Given its high dispersal potential and adaptation to various environmental conditions, the spread of P. japonica across Europe poses a serious threat to both commercial agriculture and natural vegetation. A recent study by Straubinger et al. [16] reported that P. japonica infestations in northern Italian vineyards could result in significant economic losses, with a net income reduction of up to EUR 2727 per hectare. These losses can be attributed to increased labor costs, reduced yields, and additional expenses for pest control measures.
The magnitude of these impacts underscores the urgent need for effective monitoring and management strategies. Several studies have explored the invasion of P. japonica at local [17], European [18], and global scales [10,19,20,21] using various species distribution models. These models predict potentially suitable areas across landscapes by integrating occurrence and environmental data [22]. Common models include Maximum Entropy (MaxEnt), Bio-Climatic (Bioclim), Climate Model for Species Distribution (CLIMEX), Boosted Regression Tree, Random Forest, and Genetic Algorithm for Rule-set Prediction (GARP).
Despite the growing body of literature, there is a lack of studies exploring the potential distribution of P. japonica using the MaxEnt model [23,24], especially in the context of future climate scenarios using the narratives of Shared Socio-economic Pathways (SSPs) for future society [25]. Moreover, previous studies have often relied on limited observations, such as the Kistner-Thomas study [10], which used only six occurrences for European projections until 2018. Similarly, Della Rocca et al. [20] utilized data updated to 2020 and applied a different model based on RCP scenarios. In contrast, Borner et al. [21] used data updated to November 2021 but did not conduct climate projections. Although the MaxEnt model can integrate limited occurrence data with a wide range of environmental variables, obtaining reliable and accurate predictions across various ecological contexts requires large datasets. Based on the outline above, this study aimed to map the current suitability of P. japonica across Europe and project its potential distribution under future climatic scenarios. By leveraging the most up-to-date occurrence data collected until 2024, the study offers new insights into the species’ distribution. By employing the MaxEnt model, we utilized presence data to identify vulnerable regions where this pest could be established, thereby informing pest management strategies and policy interventions for more effective control measures. Given the increasing impact of climate change on species distribution, accurate model predictions are essential for effective management and adaptation strategies, ensuring the protection of agricultural systems and biodiversity.
2. Materials and Methods
2.1. Occurrence Data on P. japonica
Data on the distribution of P. japonica in Europe were retrieved from the Global Biodiversity Information Facility (GBIF) website [26]. The website database was searched for geolocalized sightings recorded through human observation or trap collections by phytosanitary services until 2024 across the whole European continent (Figure S1). The dataset was then reviewed to remove entries with missing information or duplicates, minimizing potential biases. After this refinement, the final dataset comprised 684 georeferenced points (Table S1). Analysis of these records revealed an increasing frequency of insect observations over time, with a peak in the observations occurring in June and July, along with a gradual expansion of its range into neighboring geographical areas.
2.2. Bioclimatic Variables
Following methodologies outlined in relevant literature [27,28,29,30,31], 19 bioclimatic variables (Table S2) were obtained from the WorldClim repository [32]. The WorldClim variables, derived from monthly temperature (BIO1-BIO11) and precipitation data (BIO12-BIO19), capture environmental conditions and seasonal extremes that constrain species’ geographic ranges. These climate metrics serve as standard predictors in understanding species distribution patterns, as they reflect the environmental tolerances that limit where organisms can persist.
Bioclimatic variables were obtained for a contemporary scenario with a grid resolution of 30 arc seconds (~1 km). Similarly, these variables were acquired for three future scenarios, covering near-term (2021–2040) and mid-term (2041–2060) periods. Among the available global climate models, the CMCC Earth System Model developed by Fondazione Centro Euro-Mediterraneo sui Cambiamenti Climatici (CMCC) was selected.
This model is based on the Coupled Model Intercomparison Project Phase (CMIP) 6 framework and incorporates projections derived from the SSPs [25]. The SSPs are a set of reference pathways that describe alternative patterns in the evolution of society and ecosystems over a century, assuming no change in climate trends or climate policies [33]. Climate change projections were conducted using the socio-economic pathways SSP1-2.6 (sustainable pathway), SSP2-4.5 (intermediate pathway), and SSP5-8.5 (high-growth pathway). Table 1 reports a synthesis of the seven scenarios used in this study

Table 1.
List of scenarios implemented in this study.
2.3. MaxEnt Model
The habitat suitability analysis for P. japonica employed the MaxEnt model (Version 3.4.4), an open-source Java application for species distribution modelling. MaxEnt estimates the suitability of a species by finding the likelihood distribution of maximum entropy (closest to geographically uniform) subject to constraints obtained from environmental conditions at known occurrence locations [34]. MaxEnt considers first species occurrence points (locations where the species has been observed) and bioclimatic variables as indicated above.
For each variable, the model calculates the mean and variance at the species’ occurrence, setting these statistical patterns as constraints. MaxEnt then iteratively adjusts the distribution to fit these constraints, trying to generate it as uniform as possible across the landscape, returning a probability of presence between 0 and 1. This approach yields a relative probability of occurrence for each location, reflecting how similar the environmental conditions are to those at the known occurrence points. The strength of MaxEnt lies in the fact that it elaborates scenarios starting from presence-only data, which makes it very efficient and limits incorrect assumptions about areas where the species may not be present.
2.4. Model Setup and Analysis
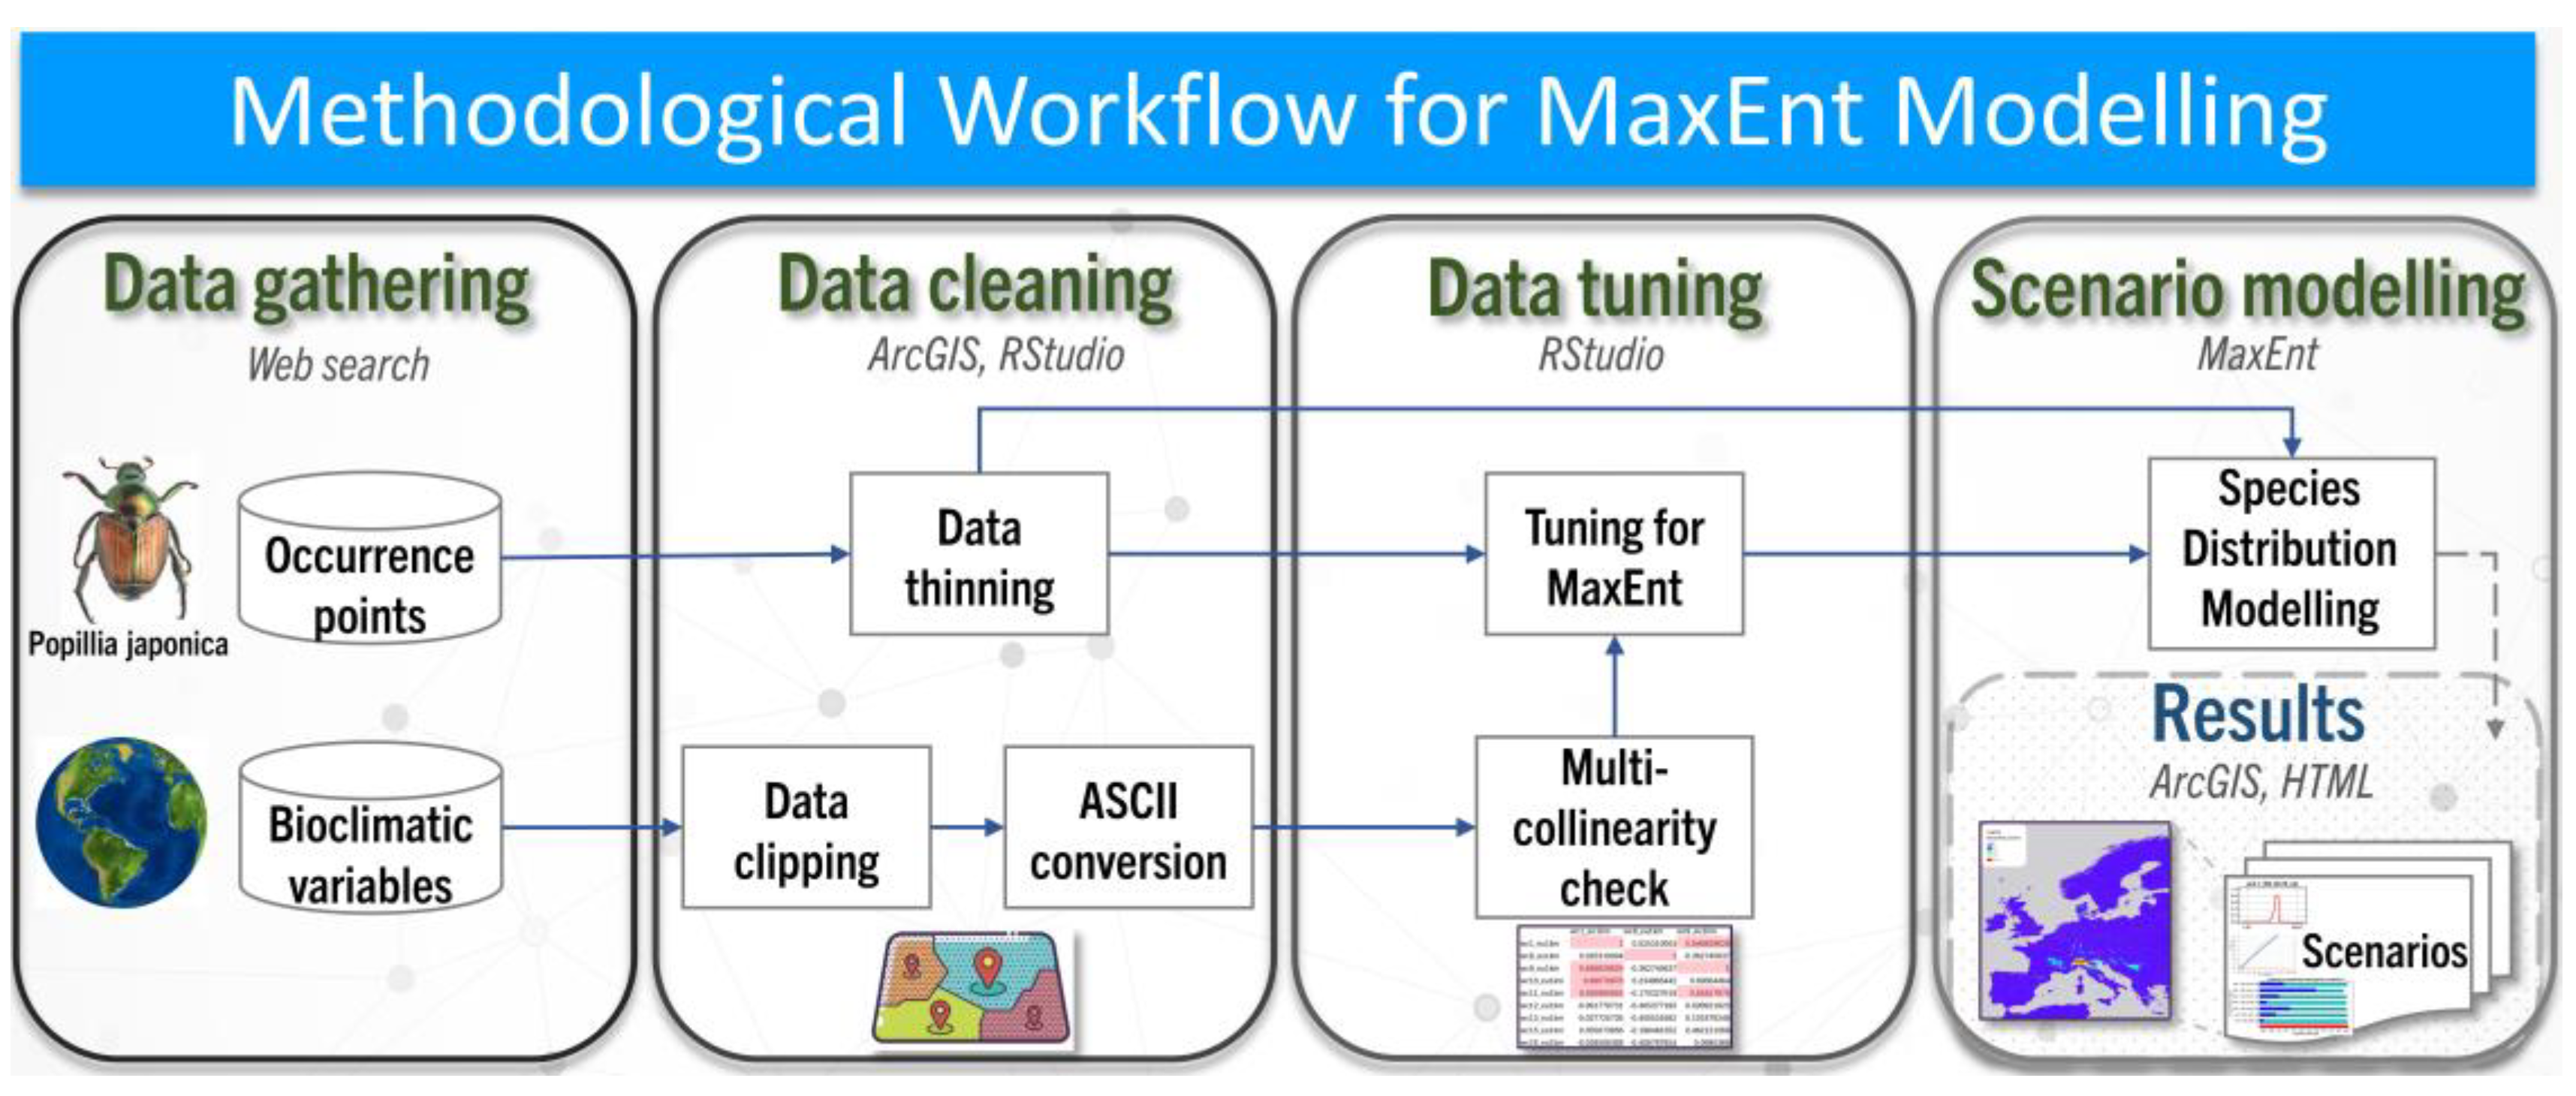
The presence data for P. japonica and the bioclimatic variables needed further refinement to be used in the MaxEnt scenario modelling phases. Data pre-processing, data tuning and spatial representation were performed using ArcGIS Pro 3.2 and RStudio (Version 2024.04) to ensure data accuracy and consistency for the MaxEnt modelling analysis. The workflow diagram in Figure 1 provides a comprehensive overview of the methodological steps employed in this study.
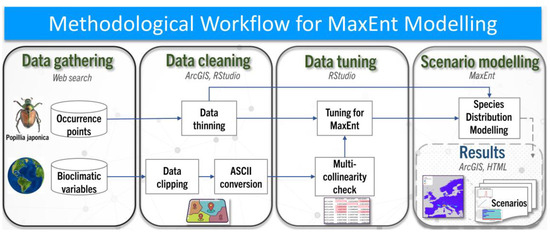
Figure 1.
Methodological workflow for MaxEnt modelling of P. japonica in Europe under current and future climate change scenarios based on Shared Socio-economic Pathways (SSP1–2.6, SSP2–4.5, SSP5–8.5) for near-term (2021–2040) and mid-term (2041–2060) periods.
Presence data were spatially thinned in RStudio using the package spThin to avoid pseudo-replication and prevent model overfitting [35]. The algorithm was run 10 times (reps = 10) and the points further apart by one kilometer were retained (Thin.par = 1). This was done to account for the possibility that the excessive proximity of two points would not mean that two insects had been spotted, but rather that the same insect had been spotted twice. This process further reduced the number of occurrences within the dataset from 684 to 454 points. Bioclimatic data layers were clipped to the European continental boundaries in ArcGIS and converted to ASCII format, obtaining 133 files (19 for each of the 7 scenarios).
Since the correlation between the bioclimatic variables could hinder the fitness of the MaxEnt model, a multicollinearity check was performed in RStudio using the package ENMTools [36]. Pearson’s correlation coefficient was calculated for the seven datasets, and only those variables with less than 75% correlation in a pairwise comparison with the others were selected to be employed in the later stages of the exercise. MaxEnt model parameters were further optimized in RStudio using the package ENMeval to identify the optimal parameter settings that balance model complexity with predictive performance. The package evaluated 30 iterations of species distribution models for each climate scenario. The iteration with the lowest delta Akaike Information Criterion (AIC) reflects the model with the highest goodness-of-fit to the data and explanatory variables.
Following parameter optimization, P. japonica presence data and the bioclimatic variables were loaded in the MaxEnt model with a combination of linear, quadratic, product, threshold, and hinge features to capture complex, nonlinear relationships between the environmental conditions and the species’ ecological niche. Regarding the basic settings, the regularization multiplier was fixed to 1, the maximum number of background points was fixed to 10,000, the replicated run time was set to cross-validate, and the number of replicates was set to 10. No bias file was required as the occurrence points had already been thinned. The model was configured to create response curves and produce prediction maps as ASCII files, and a cross-validation jackknife test of variable importance was used to evaluate the performance of species distribution models. All the results for each scenario were compiled into an HTML file.
After modelling the species distribution of P. japonica in Europe for baseline and two-time bracket future scenarios, the three scenarios concerning the near-term future (2021–2040) and mid-term future (2041–2060) were mapped in comparison to the present condition. The ASCII file of the average distribution for each scenario mapped the likelihood of the presence of the pest by attributing a decimal number, ranging from 0 (0% likelihood) to 1 (100% likelihood), to each of their grid cells. To improve the readability of the results, the maps were reclassified on a scale from 1 to 10, and the decimals were converted into integers. The symbology of the baseline and near-term scenario maps was set to identify four levels of presence of P. japonica across European regions (NUTS 2): negligible (<2); low exposure (2–4); medium exposure (5–7), and high exposure (>8). These reclassified maps were overlaid on the NUTS 2 regions to evaluate the potential impact of the insect on major crops in the short term.
A second set of maps was produced to reveal the variation in the presence of P. japonica for each of the three near-term scenarios. The resulting map symbology was set to classify possible categories as negative differences between future and present scenarios, positive differences between future and present scenarios, and no change.
Lastly, a third set of maps was produced to display the intensity and spread of P. japonica presence for each of the three near-term future scenarios across NUTS2. The statistical function and zonal histogram function were employed to summarize the number and value of cells indicating the presence of each European region. The results were displayed through bivariate color symbology and natural breaks (Jenks) classification. All the files can be found in the attachment Supporting Materials.
3. Results
3.1. Dominant Environmental Variables
Pearson’s correlation coefficient and the results of the jackknife test identified 7 bioclimatic variables that played dominant roles in the distribution of the fitness zones (Table S3). These variables included BIO7 (temperature annual range), BIO8 (mean temperature of wettest quarter), BIO10 (mean temperature of warmest quarter), BIO11 (mean temperature of coldest quarter), BIO15 (precipitation seasonality), BIO18 (precipitation of warmest quarter), and BIO19 (precipitation of coldest quarter) (Table 2). Among them, the percentage contribution of BIO11, BIO10, and BIO18 amounted to 72.9%, accounting for more than two-thirds of the total contributions of the environmental variables to the model under the historical scenario.
Table 2.
Estimates of relative contributions of the environmental variables to the MaxEnt model under the historic scenario.
Across the future scenarios, these variables exhibited the highest contribution, with BIO11 explaining more than 70% of the model variance relative to other bioclimatic parameters (Tables S4–S10). The tables also present response curves, which show the quantitative relationship between each environmental predictor and the probability of species occurrence. They illustrate how the model’s predicted probability of presence changes when each variable is varied, while keeping all others at their average value. In these curves, the X-axis shows the range of environmental variables, and the Y-axis shows the probability of species presence (from 0 to 1), with higher values on the Y-axis depicting more suitable conditions. Overall, P. japonica showed a decline in suitability at higher temperatures and avoidance of extremely wet or dry conditions.
3.2. Model Performance
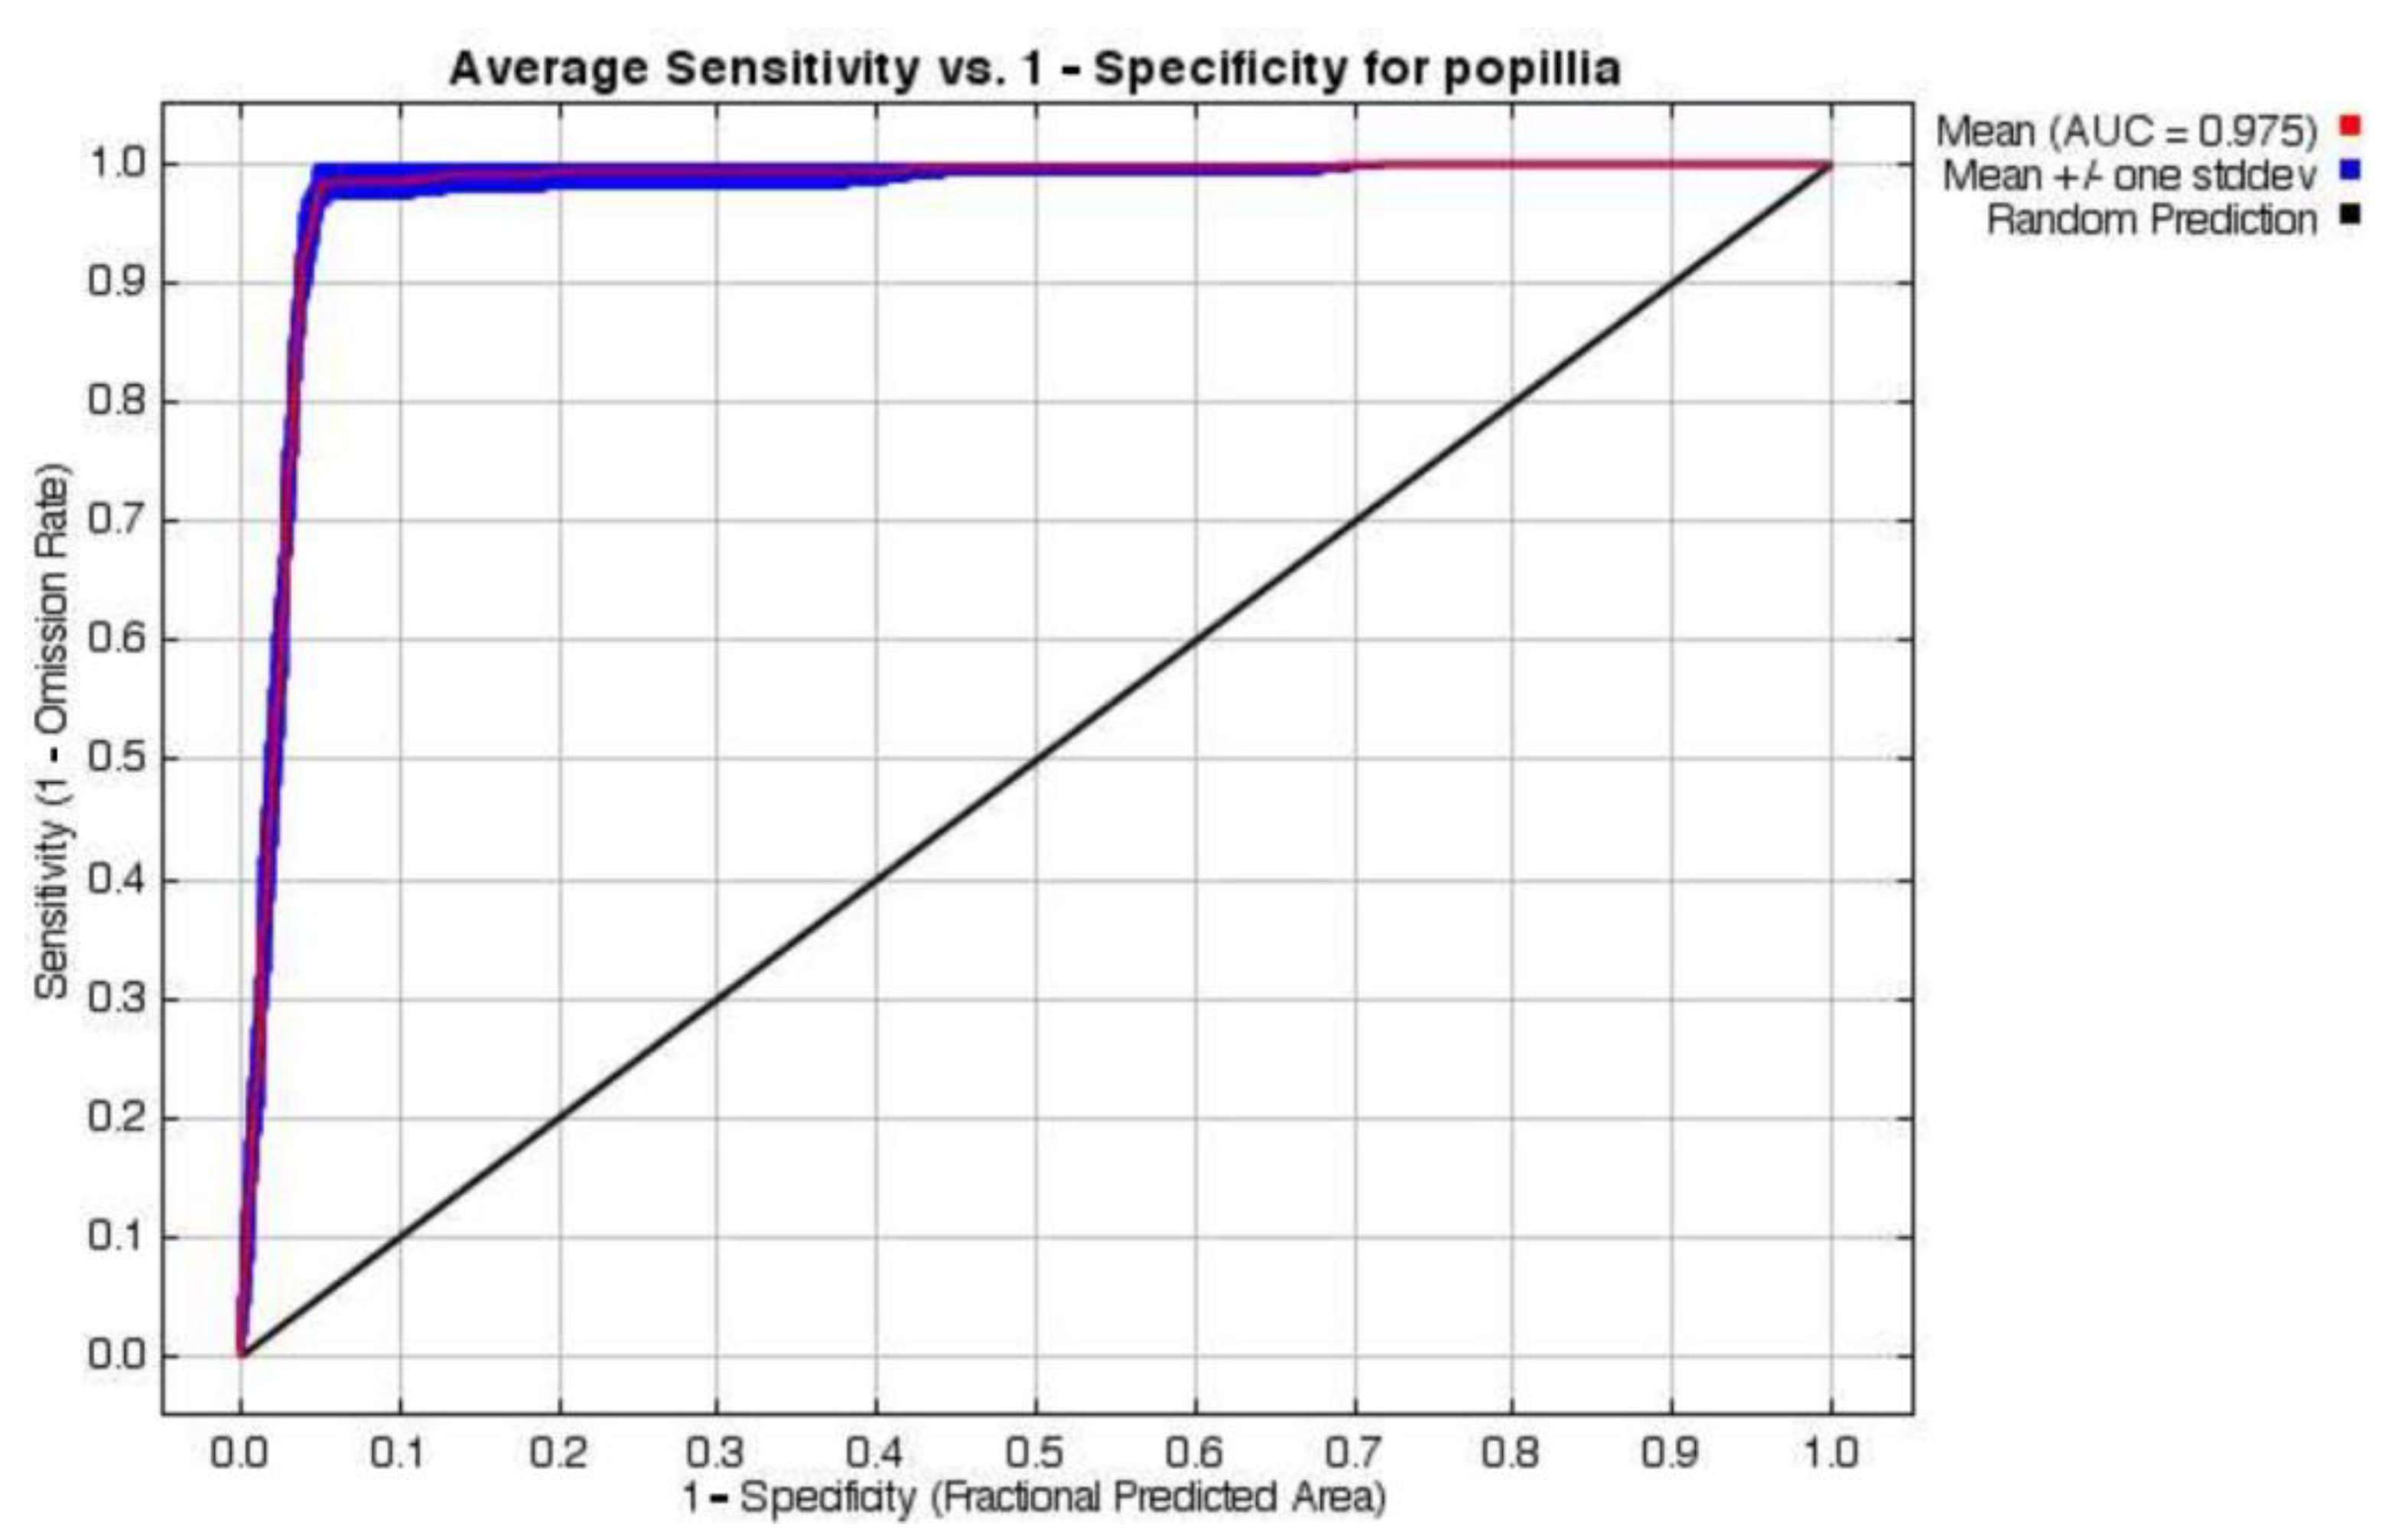
The MaxEnt model demonstrated robust predictive performance, with an average test area under the curve (AUC) of 0.975 across 10-fold cross-validation runs under the historical scenario (Table S4). An AUC close to 1 indicates the accuracy of the model in predicting the species distribution. The low standard deviation (sd = 0.007) indicates high consistency among replicates, supporting the model’s reliability and stability (Figure 2). The model successfully captured species–environment relationships, as evidenced by the close alignment between the training and test omission rates.
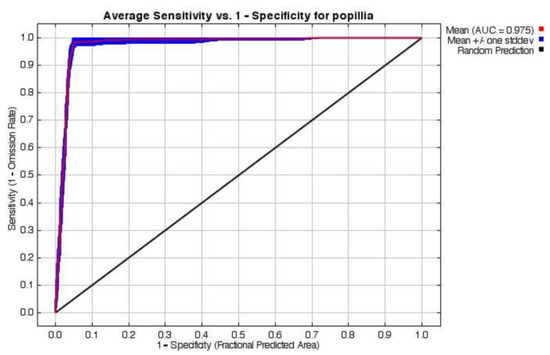
Figure 2.
The receiver operating characteristic curve (ROC) for the P. japonica species distribution model under the baseline scenario in Europe.
Notably, the consistency between marginal and isolated response curves suggests limited multicollinearity effects among the selected bioclimatic variables, supporting the robustness of the model’s ecological interpretations. Across future scenarios, all models demonstrate high predictive performance for the P. japonica species distribution.
3.3. Potentially Suitable Area Under Baseline Scenario
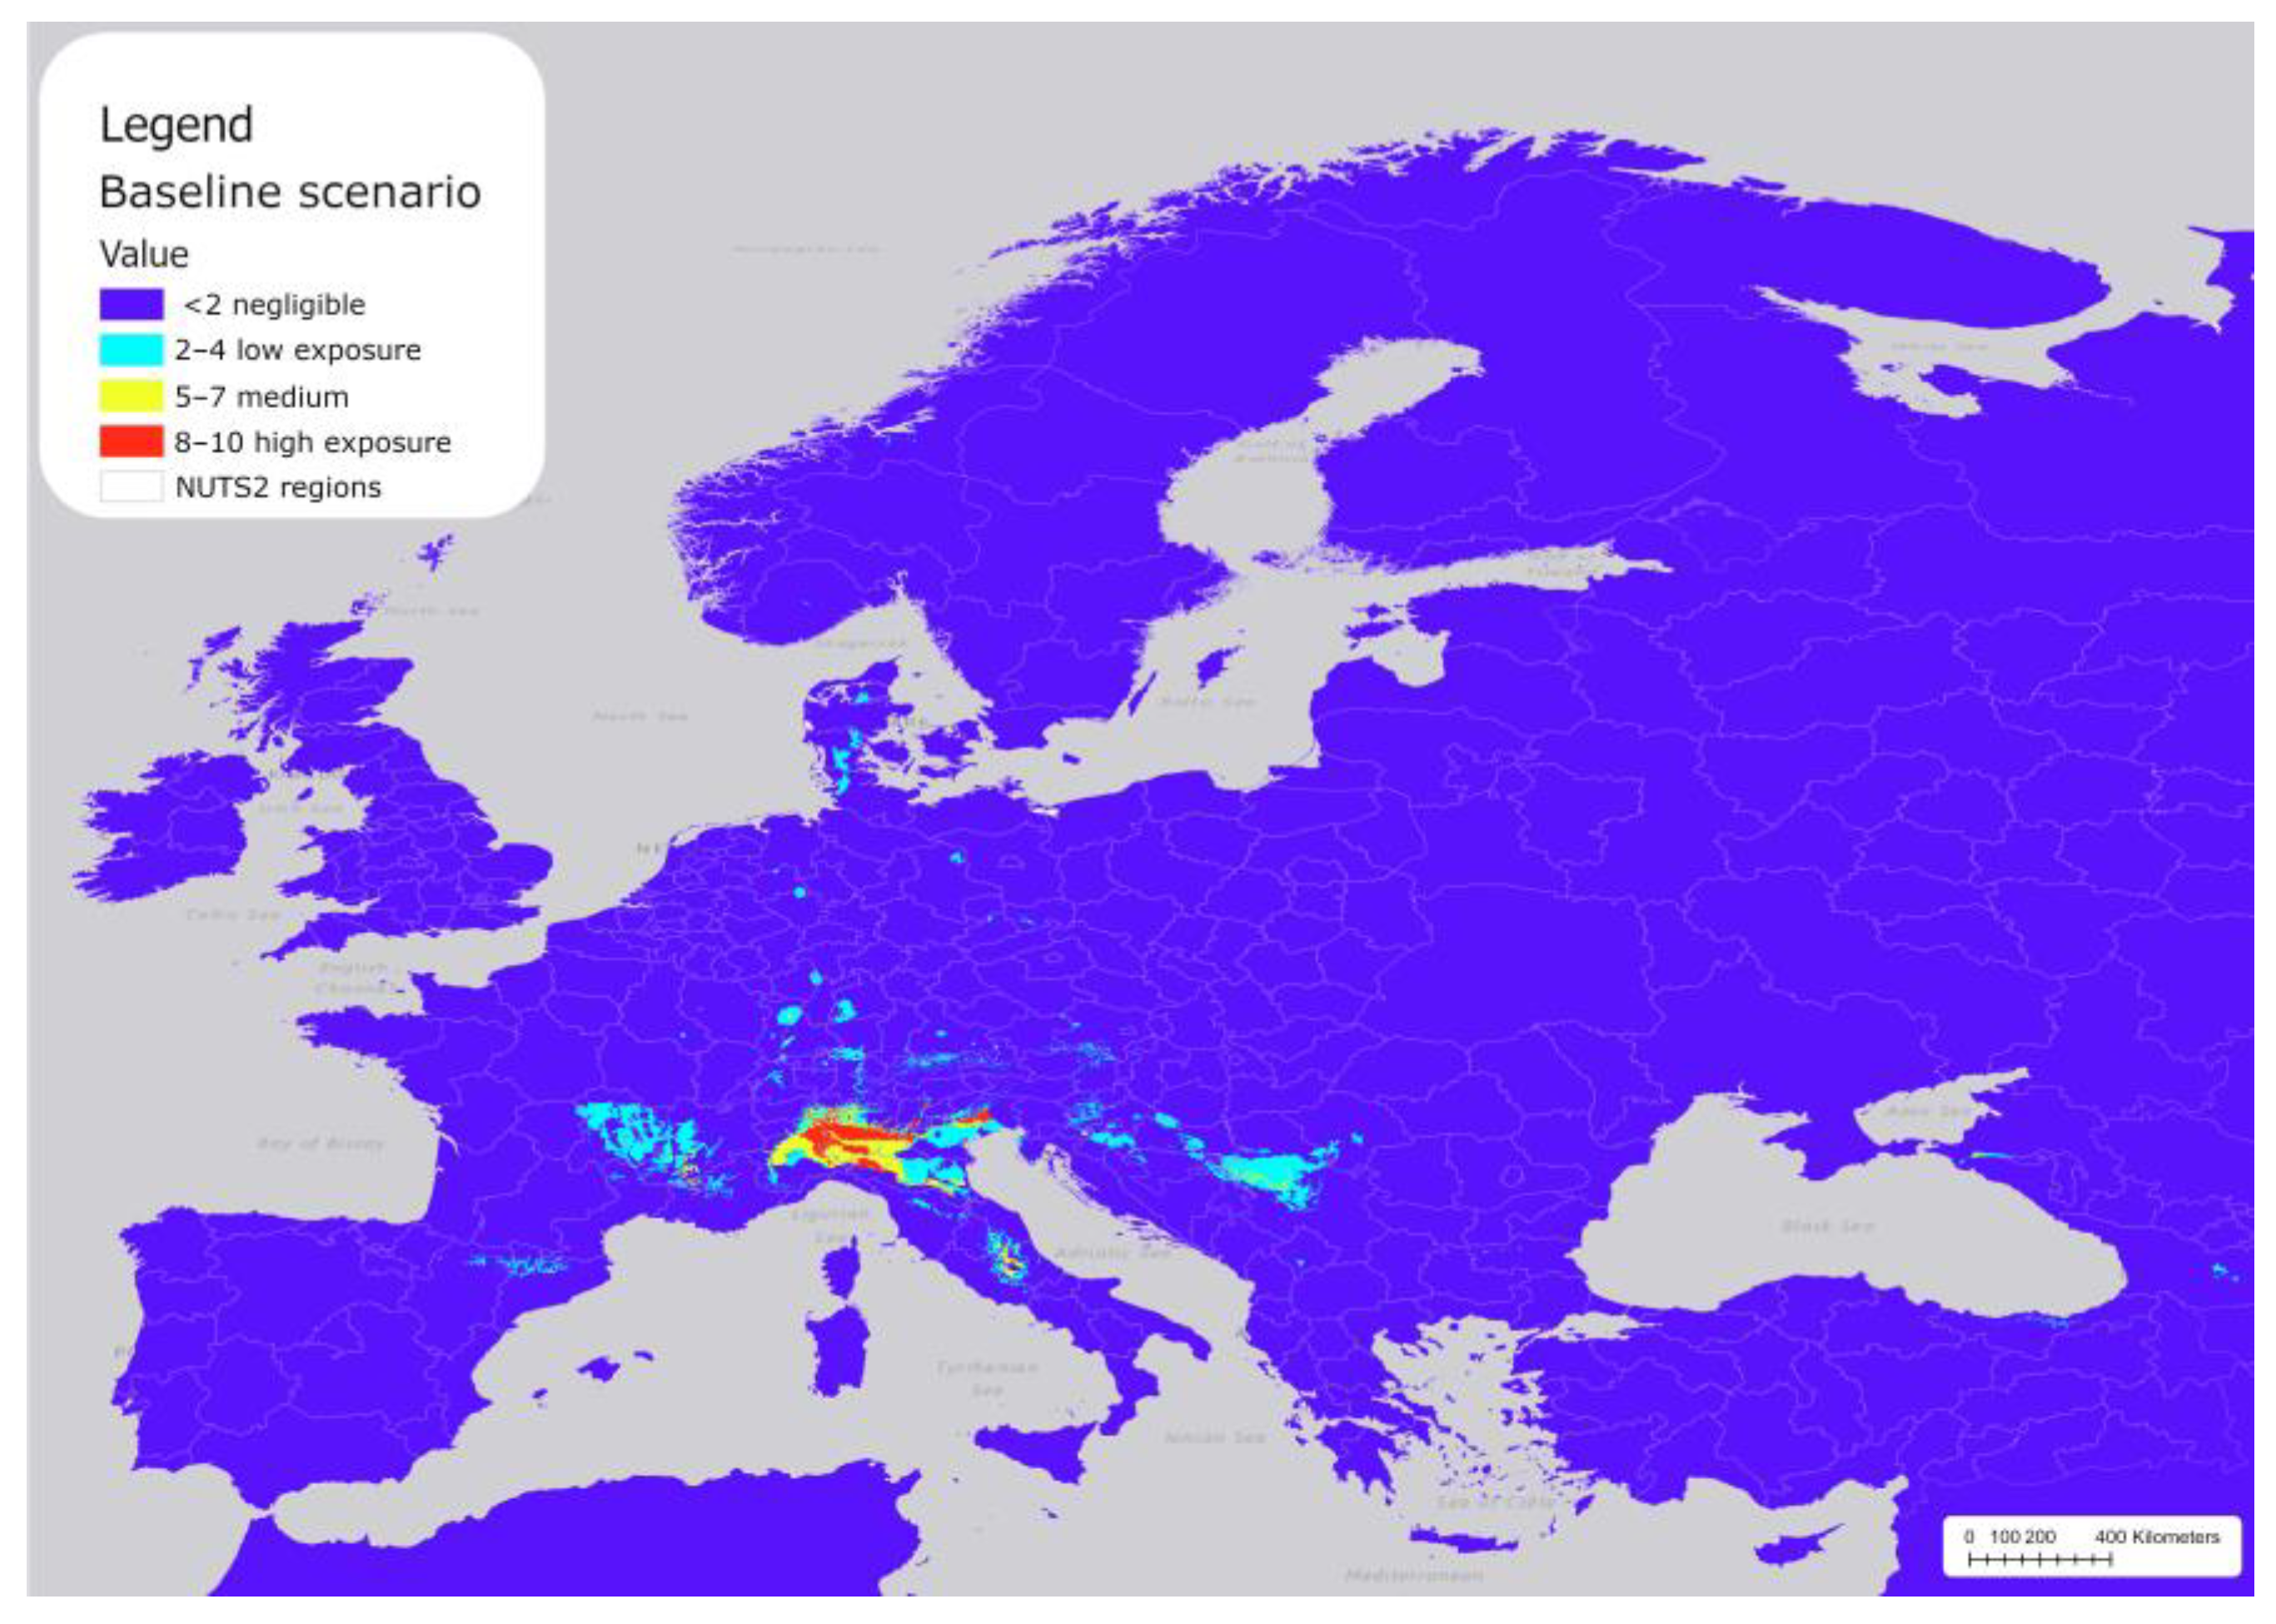
Figure 3 shows the reclassified areas in Europe across the NUTS2 regions, where P. japonica populations are likely to be established under baseline climatic conditions (not reclassified map in Table S4). Most of Europe shows negligible exposure (purple), including the coastal regions bordering the Mediterranean Sea, and all areas below 41.5° north latitude (e.g., Zaragoza in Spain, across Rome in Italy, and northern regions in Greece). The model predicted extensive hotspot areas with threshold value >0.4 (red and yellow areas) in northern Italy and along the Alpine valley floors, and other less extensive areas in central Italy (Abruzzo), France (Rhône Alpes), and Serbia (the Šumadija and Western Serbia).
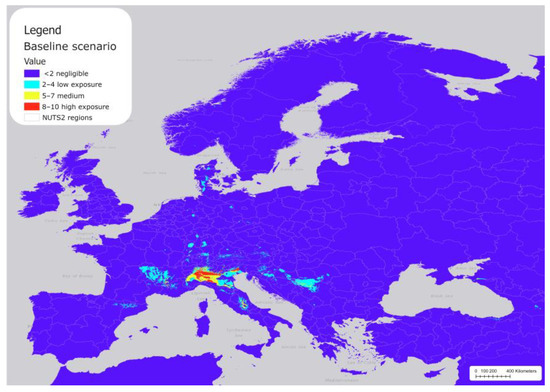
Figure 3.
Distribution of P. japonica under the current baseline scenario in Europe.
Scattered areas of low exposure (light blue) appear in subalpine areas, northeastern Italy, France (western Rhône Alpes and Auvergne), Spain (north Cataluña), Serbia (the Šumadija and Western Serbia), some areas in northern Europe (Denmark), and small patches in central Europe. Most of the areas with medium to high exposure covered the areas where P. japonica was initially reported and where the majority of subsequent observations have been recorded. Overall, the total area of potentially suitable areas was approximately 83,807 km2, including 40,529 km2 classified as low exposure, 24,934 km2 as medium exposure, and 18,344 km2 with high exposure (Table 3).
Table 3.
Projected suitable areas for P. japonica under baseline and future climate change scenarios derived from MaxEnt modelling. Values in km2.
3.4. Potentially Suitable Area Under Future Climate
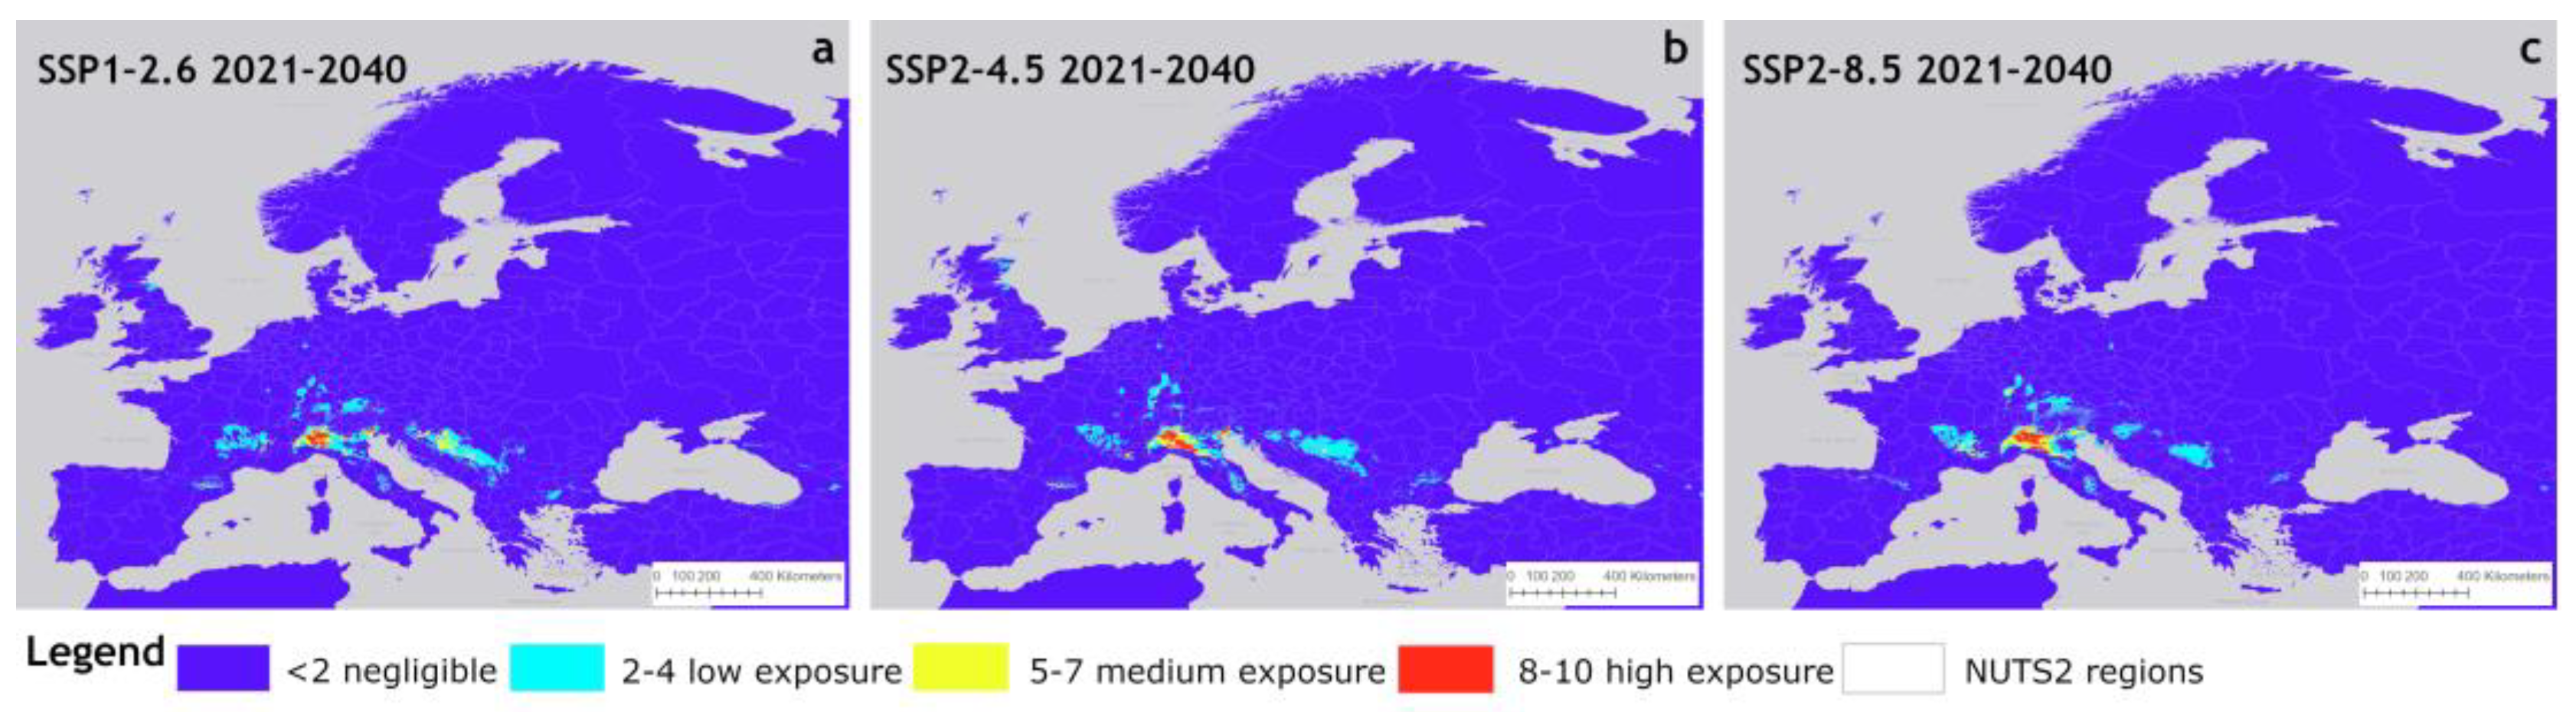
The potential distribution of P. japonica under the three near-term climate scenarios is shown in Figure 4, presented as reclassified areas across NUTS2 regions. Compared to the baseline climate scenario, the SSP1-2.6 scenario (Figure 4a) showed an eastward expansion of low exposure areas (light blue), with inside large patches of medium exposure (yellow) appearing in Eastern Europe. These areas lie between approximately 46° north latitude (near Zagreb, Croatia) and 44° north latitude (near Sarajevo, Bosnia-Herzegovina). In contrast, high and medium exposure areas in most of the Po Valley (Italy) showed a contraction. Other expansions of low exposure areas were observed in France, southern Germany, and Austria. Overall, the pattern remained largely stable, suggesting that SSP1-2.6 (a conservative climate scenario) has a limited impact on the extent and distribution of these areas. Compared to the baseline scenario, the differences between the SSP2-4.5 scenario were relatively slight (Figure 4b), whereas the SSP2-8.5 scenario exhibited an expansion in Germany and France, along with a decline in the Balkans (Figure 4c).
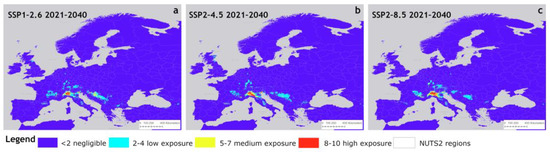
Figure 4.
Suitable areas of P. japonica in Europe under future climate conditions of SSP1-2.6 (a), SSP2-4.5 (b), and SSP5-8.5 (c) for the period 2021–2040.
In particular, high exposure areas showed a reduction, particularly in the Po Valley, but with an increase in the Emilia-Romagna region. In Eastern European countries, the extent of these areas remains largely unchanged, while in southwestern Germany, low-exposure areas expanded, and eastern Scotland emerged as a new region of low exposure.
Overall, this scenario did not indicate an increasing trend in suitability for the expansion of P. japonica. In contrast, the SSP2-8.5 scenario showed a further expansion of medium and high exposure areas in the Po Valley, along with an increase in low exposure zones in southern Germany, with a patch of medium suitability areas inside. Additionally, in France (western Rhône Alpes and Auvergne regions), there was an increase in medium exposure areas.
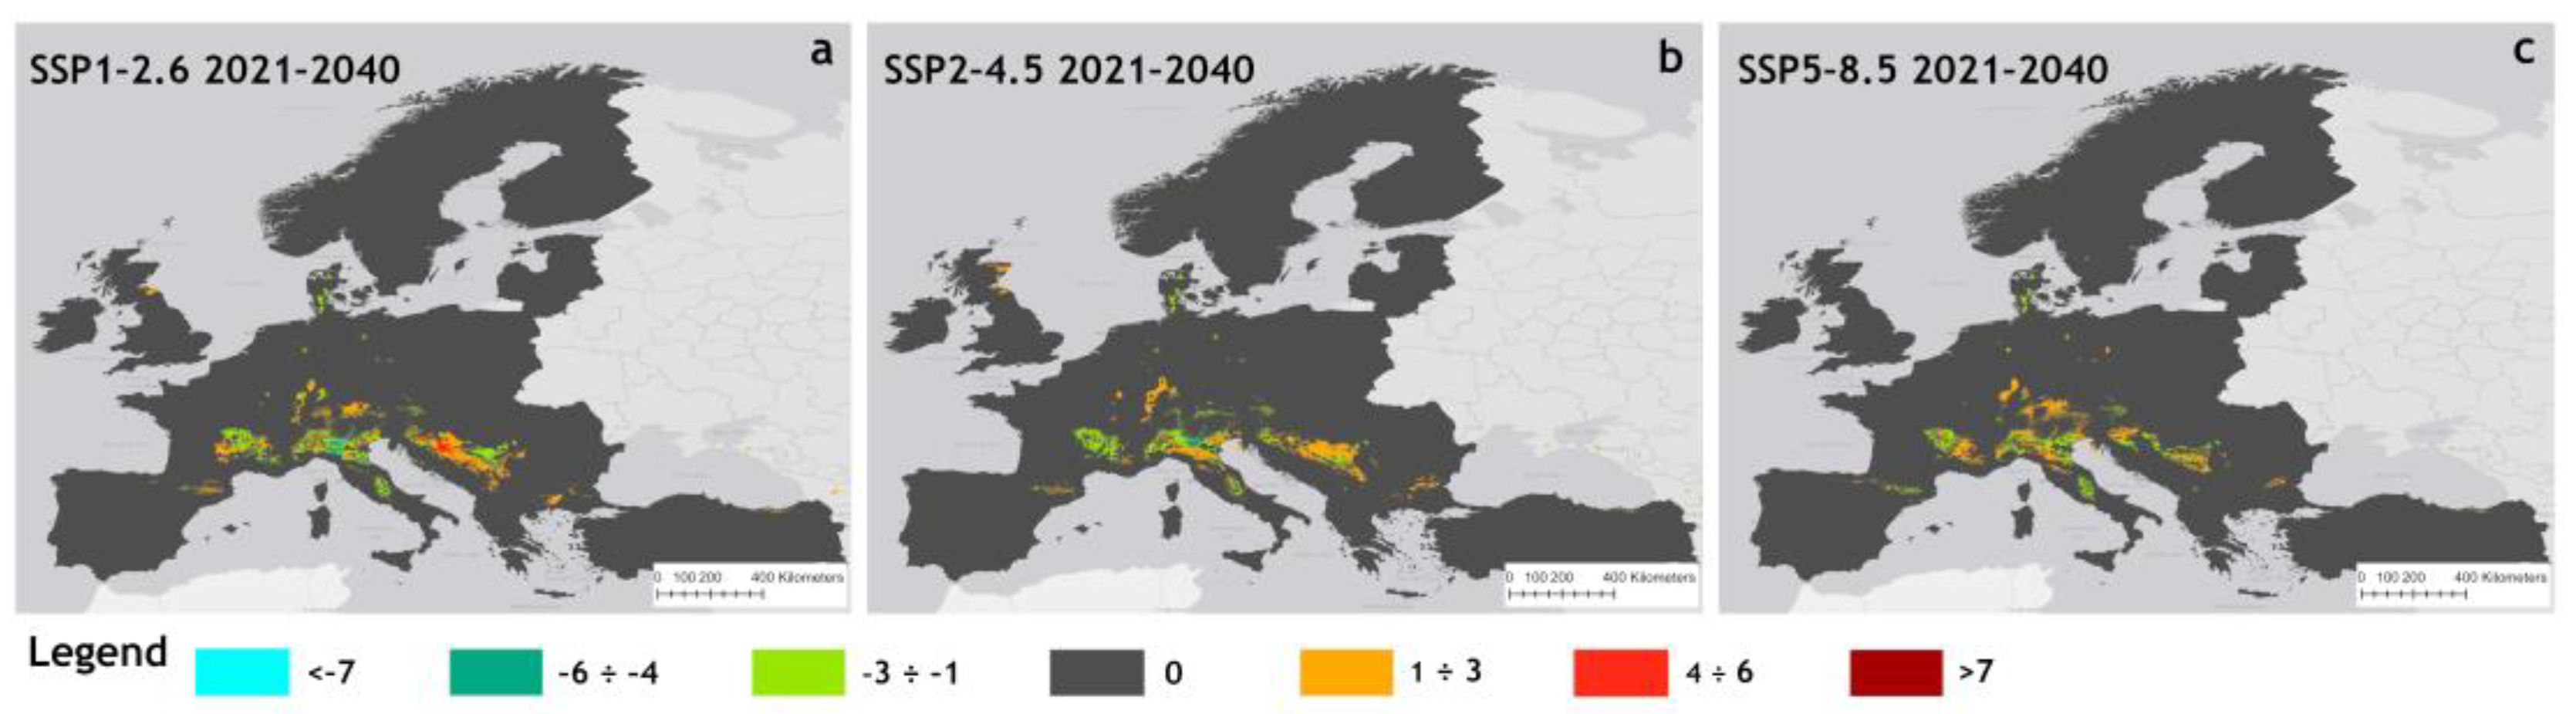
Figure 5 illustrates the patterns of potential changes in suitable areas for each of the three near future scenarios, calculated as differences from the baseline. In this map, positive values, represented by an orange-to-red gradient color scheme, indicate an expansion of suitable areas. Negative values, shown as a light blue-to-green gradient, indicate contraction, while zero denotes no change. Overall, each scenario demonstrated distinct patterns of change in suitable areas as reported in Table S11.

Figure 5.
Changes of suitable areas of P. japonica in Europe compared to baseline under the scenarios SSP1–2.6 (a), SSP2–4.5 (b), and SSP5–8.5 (c) for the period 2021–2040.
Lastly, the intensity and spread of P. japonica under the baseline and near-term scenarios were mapped as presence data at the NUTS 2 regional level, summarizing the number and value of cells indicating its presence within each region (Figures S2–S5). Starting from the baseline scenario, these maps highlight that northern Italy is the epicenter of the potential spread of this pest. Neighboring regions display transitional gradients, suggesting potential dispersal pathways for future expansion.
At the end of the near-term scenario, future projections indicate that suitable areas were approximately 96,304 km2 for the SSP1-2.6 scenario, 92,981 km2 for the SSP2-4.5 scenario, and 93,688 km2 for the SSP5-8.5 scenario (Table 3). The results for mid-term scenarios (2041–2060) indicate a more pronounced expansion, up to 120,436 km2 for the SSP1-2.6 scenario, 96,248 km2 for the SSP2-4.5, and 105,219 km2 for the SSP5-8.5. These variations are further visible in the maps reported in Tables S6, S8, and S10.
4. Discussion
This study provides a comprehensive analysis of the potential distribution of P. japonica across Europe, integrating current and future climate scenarios to better understand the ecological implications and adaptive responses in a changing environment. The MaxEnt model demonstrated high predictive performance (AUC = 0.975), successfully identifying temperature and precipitation as primary drivers of species distribution. Seven key bioclimatic variables (BIO7, BIO8, BIO10, BIO11, BIO15, BIO18, and BIO19) strongly influenced model performance. Notably, the mean temperature of the coldest quarter (BIO11) emerged as the most influential factor, explaining over 70% of model variance across all scenarios, highlighting the crucial role of winter survival in P. japonica establishment [11,37]. As suggested by various studies, temperature-related variables are typically the most important, as insects are ectotherms and their physiological activities and consequent adaptation are strongly influenced by temperature [38].
These results are consistent with findings from other studies [10,18,39], which have also reported that annual temperature and soil temperature are the main factors driving the spread of the pest on a large scale as they determine the minimum number of degree-days required to complete the development from larva to adult. At the landscape to local scales, other factors such as land cover type, soil moisture, humidity, and natural controls (e.g., predators and parasites) seem to influence spread and dispersal [12,17].
Under current climate conditions, approximately 83,807 km2 of suitable habitat was identified across Europe, with highly suitable areas concentrated in northern Italy and along Alpine valley floors. This distribution pattern aligns with documented occurrences [14,17] and reflects the combination of favorable climatic conditions and established populations serving as dispersal sources. These results are also consistent with other studies [20,21], which reported that the potential distribution of P. japonica in Europe is likely to expand rapidly in the future due to increasing annual temperatures. Unfortunately, their findings are somewhat difficult to compare in detail, as they were derived using a different species distribution model, alternative variables, and climate change data based on representative concentration pathways (RCPs). Nevertheless, their study indicates that under current climate conditions, approximately 62,000 km2 aligns with the habitat requirements of P. japonica in Europe, which closely corresponds to our results from class values >0.2 (Table 3). Similarly, Kistner-Thomas [10] examined the potential distribution of the pest using the CLIMEX model and RCPs data on the global scale. Their projections also identified extensive favorable areas in Europe for both current and future climates. However, these results are not directly comparable due to differences in modelling approaches, environmental datasets, and the limited dataset used.
Synthesizing the key findings, several important considerations emerge. Regions with medium to high suitability for P. japonica populations are predominantly concentrated in northern Italy, in the foothills of alpine valleys, Rhône Alpes region in France, and parts of the Balkans. These regions share climatic conditions characterized by moderate temperatures and sufficient soil moisture, which align with the species’ ecological requirements. This finding is further supported by Simonetto et al. [40], who highlighted the role of soil and weather variables in driving the pest distribution. Conversely, prolonged drought periods reduce the probability of the presence affecting adult oviposition and larval survival, which explains the negligible suitability observed in coastal regions and the Mediterranean climate areas.
Additionally, the most suitable zones overlap with areas of intensive agriculture, horticulture, and managed landscapes, such as gardens and parks [39]. It is interesting to note in Figure 3, a hotspot of potential suitability at a lower latitude in the Fucino Valley and Valle dell’Aterno (Abruzzo region, Italy). The Fucino Valley is a significant agricultural plain characterized by intensive farming practices, extensive irrigation systems, and a moderate climate influenced by its elevation and geographic location. These conditions closely align with those in areas where P. japonica is currently established, suggesting that these areas represent critical risk zones for potential invasion.
Climate projections reveal distinct spatial patterns of habitat expansion. Under the SSP1-2.6 pathway, the projected suitable habitat expanded to 96,304 km2 in the near term (2021–2040) and further increased to 120,436 km2 by the mid-term (2041–2060). The SSP2-4.5 scenario showed moderate expansion with some habitat contraction in the Po Valley, while new suitable areas emerged in eastern Scotland. The SSP5-8.5 scenario projected the most extensive changes, with increased suitability in the Po Valley and new suitable areas in southern Germany and France. In this scenario, the total area of potential spread expanded predominantly in regions characterized by low to moderate habitat suitability.
Changes in rainfall and temperature patterns as a consequence of climate change may have a direct or indirect influence on pest survival and can vary depending on geographical location. While increased temperatures may positively affect the metabolic rate and number of pest generations, decreased rainfall during critical developmental dynamics could significantly limit population growth [41].
Despite differences in magnitude, the consistency in predicted range expansion suggests that P. japonica is likely to expand its range regardless of the specific climate pathway. This projection raises concerns not only for agricultural systems but also for biodiversity and ecosystems. As highlighted by Bosio et al. [39], this pest has shown a preference for a wide variety of plant species, including key crops, such as grapevine, apple, Actinidia, maize, and soy, ornamental, and wild plants. Its broad host range suggests the potential for widespread impacts on natural vegetation communities and ecosystem functioning. Of particular concern is the potential damage to the specialized agricultural value chains, which could trigger cascading effects on productivity, crop yields, and farmers’ income [42].
This risk is pronounced in invaded niches where native communities lack an evolutionary history with this invasive pest or similar scarabs. For instance, in countries with large grape production, like Italy and France, the potential economic damage may potentially reach EUR68 million and EUR92 million per year, respectively [43]. Our findings emphasize the need for coordinated European management approaches. The cross-border nature of projected expansion necessitates international cooperation in monitoring and control efforts. The identification of potential invasion corridors and high-risk areas can inform strategic monitoring networks and resource allocation for prevention and control measures.
Several limitations should be considered when interpreting these results. The model relies on current occurrence data and may not fully capture the species’ fundamental niche, as well as sampling bias in occurrence records may affect model predictions. Moreover, the resolution of climate data may miss fine-scale environmental variation. Finally, human-mediated dispersal pathways and land use interactions were not explicitly modelled.
In spite of modelling uncertainties, the projection of suitable areas across climate scenarios provides valuable insights for pest management, and offers an opportunity for preventive action, potentially reducing the costs of containment and control. Early detection and rapid response systems will be crucial in suitable regions, while established infestations will require sustained management efforts to minimize economic and ecological impacts. Future research addressing the identified limitations would enhance our understanding of invasion dynamics and improve management strategies. The projected expansion of suitable areas highlights the need for adaptive management strategies that can respond to changing conditions while protecting both agricultural systems and natural ecosystems from this invasive pest.
5. Conclusions
This study predicted suitable areas of potential invasion of P. japonica in Europe under current and future climatic scenarios using MaxEnt modelling with observation data and climate variables. The results showed that under the current climate conditions, the potential suitable areas were distributed in northern Italy, in the foothills of alpine valleys, Rhône Alpes region in France, and parts of the Balkans. Suitable areas were projected to expand under high-emission scenarios, interesting northern Italy, southern Germany, the Western Balkans, and parts of France.
The findings of this study suggest that these areas in central Europe share climatic conditions characterized by moderate temperatures and sufficient soil moisture, which are suitable for oviposition, larval development, and adult spread. On the contrary, geographical areas with prolonged drought periods, such as coastal regions and the Mediterranean areas, showed negligible suitable areas.
Overall, these findings suggest that climate change and human activities could potentially expand the presence under certain climatic conditions, posing potential risks to ornamental and agricultural crops, especially in areas that lack an evolutionary history with this pest or a similar beetle. Despite limitations related to sample bias and model uncertainty, the study suggests that the MaxEnt species distribution model is a valuable tool for predicting potential habitat suitability for invasive species, supporting pest management authorities regarding preventive and containment efforts.
Supplementary Materials
The following supporting information can be downloaded at: https://www.mdpi.com/article/10.3390/agriculture15070684/s1, Figure S1: Geolocalized sightings recorded in Europe; Figure S2: Concentrations and spreading of P. japonica at baseline scenario.; Figure S3: Concentrations and spreading of P. japonica at NUTS 2 scenario SSP1–2.6 2021-2040; Figure S4: Concentrations and spreading of P. japonica at NUTS 2 scenario SSP2–4.5 2021-2040; Figure S5: Concentrations and spreading of P. japonica at NUTS 2 scenario SSP5–8.5 2021-2040; Table S1: Occurrence data of P. japonica; Table S2: Climatic variables; Table S3: Correlations; Table S4: Baseline results of 10-fold cross-validation; Table S5: SSP1–2.6 2021-2040 results of 10-fold cross-validation; Table S6: SSP1–2.6 2041-2060 results of 10-fold cross-validation; Table S7: SSP2–4.5 2021-2040 results of 10-fold cross-validation; Table S8: SSP2–4.5 2041-2060 results of 10-fold cross-validation; Table S9: SSP5–8.5 2021-2040 results of 10-fold cross-validation; Table S10: SSP5–8.5 2041-2060 results of 10-fold cross-validation; Table S11: Suitable areas in km2 for all scenarios 2021-2040.
Author Contributions
Conceptualization, G.P. and F.L.; methodology, G.P., F.L. and V.M.; software, G.P. and V.M.; validation, G.P. and V.M.; formal analysis, G.P. and F.L.; investigation, V.M.; resources, G.P. and F.L.; data curation, V.M.; writing—original draft preparation, G.P.; writing—review and editing, G.P., F.L. and V.M.; visualization, G.P. and V.M.; supervision, G.P. and F.L.; project administration, G.P. and F.L. All authors have read and agreed to the published version of the manuscript.
Funding
This research received no external funding.
Institutional Review Board Statement
Not applicable.
Data Availability Statement
The occurrence data on the distribution of P. japonica in Europe are available in the Supporting information in Table S1. Raw data are available at: https://www.gbif.org/species/4425774 (accessed on 10 June 2024). The bioclimate data were obtained from the Wordlclim database and can be freely downloaded at https://worldclim.org (accessed on 10 June 2024).
Acknowledgments
The authors sincerely thank Francesco Paoli for his valuable suggestions.
Conflicts of Interest
The authors declare no conflicts of interest.
Abbreviations
The following abbreviations are used in this manuscript:
| AIC | Akaike Information Criterion |
| AUC | Area Under the Curve |
| ASCII | American Standard Code for Information Interchange |
| BIO | Bioclimatic Variables |
| BioClim | Bio-Climatic |
| CLIMEX | Climate Model for Species Distribution |
| CMCC | Euro-Mediterranean Center on Climate Change Foundation |
| EU | European Union |
| GBIF | Global Biodiversity Information Facility |
| HTML | Hypertext Markup Language |
| MAXENT | Maximum Entropy |
| NUTS | Nomenclature of Territorial Units for Statistics |
| RCPs | Representative Concentration Pathways |
| ROC | Receiver Operating Characteristic |
| SSPs | Shared Socioeconomic Pathways |
| WHO | World Health Organization |
References
- Turbelin, A.J.; Cuthbert, R.N.; Essl, F.; Haubrock, P.J.; Ricciardi, A.; Courchamp, F. Biological Invasions Are as Costly as Natural Hazards. Perspect. Ecol. Conserv. 2023, 21, 143–150. [Google Scholar] [CrossRef]
- Vantarová, K.H.; Eliáš, P.; Jiménez-Ruiz, J.; Tokarska-Guzik, B.; Cires, E. Biological Invasions in the Twenty-First Century: A Global Risk. Biologia 2023, 78, 1211–1218. [Google Scholar] [CrossRef]
- John, A.; Riat, A.K.; Ahmad Bhat, K.; Ganie, S.A.; Endarto, O.; Nugroho, C.; Handoko, H.; Wani, A.K. Adapting to Climate Extremes: Implications for Insect Populations and Sustainable Solutions. J. Nat. Conserv. 2024, 79, 126602. [Google Scholar] [CrossRef]
- Paini, D.R.; Sheppard, A.W.; Cook, D.C.; De Barro, P.J.; Worner, S.P.; Thomas, M.B. Global Threat to Agriculture from Invasive Species. Proc. Natl. Acad. Sci. USA 2016, 113, 7575–7579. [Google Scholar] [CrossRef] [PubMed]
- Sileshi, G.W.; Gebeyehu, S. Emerging Infectious Diseases Threatening Food Security and Economies in Africa. Glob. Food Sec. 2021, 28, 100479. [Google Scholar] [CrossRef]
- IPBES. Invasive Alien Species and Their Control; IPBES: Bonn, Germany, 2023; ISBN 9783947851379. [Google Scholar]
- WHO. A Health Perspective on the Role of the Environment in One Health; WHO Regional Office for Europe: Copenhagen, Denmark, 2022.
- Bragard, C.; Dehnen-Schmutz, K.; Di Serio, F.; Gonthier, P.; Jacques, M.; Jaques Miret, J.A.; Justesen, A.F.; Magnusson, C.S.; Milonas, P.; Navas-Cortes, J.A.; et al. Pest Categorisation of Popillia Japonica. EFSA J. 2018, 16, e05438. [Google Scholar] [CrossRef]
- Tayeh, C.; Poggi, C.; Desneuex, N.; Jactel, H.; Verheggen, F. Host Plants of Popillia Japonica: A Review. Data INRAE 2023. [Google Scholar] [CrossRef]
- Kistner-Thomas, E.J. The Potential Global Distribution and Voltinism of the Japanese Beetle (Coleoptera: Scarabaeidae) Under Current and Future Climates. J. Insect Sci. 2019, 19, 16. [Google Scholar] [CrossRef]
- Klein, M. Popillia Japonica (Japanese beetle). CABI Compend. 2022, 14, 1. [Google Scholar] [CrossRef]
- Gilioli, G.; Sperandio, G.; Simonetto, A.; Ciampitti, M.; Cavagna, B.; Bianchi, A.; Battisti, A.; Mori, N.; De Francesco, A.; Gervasio, P. Predicting the Spatio-Temporal Dynamics of Popillia Japonica Populations. J. Pest Sci. 2024, 97, 2059–2071. [Google Scholar] [CrossRef]
- Althoff, E.R.; Rice, K.B. Japanese Beetle (Coleoptera: Scarabaeidae) Invasion of North America: History, Ecology, and Management. J. Integr. Pest Manag. 2022, 13, 2. [Google Scholar] [CrossRef]
- Pavesi, M. Popillia Japonica Specie Aliena Invasiva Segnalata in Lombardia. L’informatore Agrar. 2014, 32, 53–55. [Google Scholar]
- EPPO Popillia Japonica (POPIJA)—Overview. Available online: https://gd.eppo.int/taxon/POPIJA (accessed on 24 October 2024).
- Straubinger, F.B.; Venus, T.E.; Benjamin, E.O.; Sauer, J. Private Management Costs of Popillia Japonica: A Study of Viticulture in Italy. Front. Insect Sci. 2023, 3, 1176405. [Google Scholar] [CrossRef] [PubMed]
- Borgogno-Mondino, E.; Lessio, F.; Bianchi, A.; Ciampitti, M.; Cavagna, B.; Alma, A. Modelling the Spread of Popillia Japonica Newman (Coleoptera: Scarabaeidae) from a Recently Infested Area. Entomol. Gen. 2022, 42, 713–721. [Google Scholar] [CrossRef]
- Della Rocca, F.; Milanesi, P. The Spread of the Japanese Beetle in a European Human-Dominated Landscape: High Anthropization Favors Colonization of Popillia Japonica. Diversity 2022, 14, 658. [Google Scholar] [CrossRef]
- Zhu, G.; Li, H.; Zhao, L. Incorporating Anthropogenic Variables into Ecological Niche Modeling to Predict Areas of Invasion of Popillia Japonica. J. Pest Sci. 2017, 90, 151–160. [Google Scholar] [CrossRef]
- Della Rocca, F.; Milanesi, P. The New Dominator of the World: Modeling the Global Distribution of the Japanese Beetle under Land Use and Climate Change Scenarios. Land 2022, 11, 567. [Google Scholar] [CrossRef]
- Borner, L.; Martinetti, D.; Poggi, S. A New Chapter of the Japanese Beetle Invasion Saga: Predicting Suitability from Long-Invaded Areas to Inform Surveillance Strategies in Europe. Entomol. Gen. 2023, 43, 951–960. [Google Scholar] [CrossRef]
- Melo-Merino, S.M.; Reyes-Bonilla, H.; Lira-Noriega, A. Ecological Niche Models and Species Distribution Models in Marine Environments: A Literature Review and Spatial Analysis of Evidence. Ecol. Modell. 2020, 415, 108837. [Google Scholar] [CrossRef]
- Phillips, S.J.; Anderson, R.P.; Schapire, R.E. Maximum Entropy Modeling of Species Geographic Distributions. Ecol. Modell. 2006, 190, 231–259. [Google Scholar] [CrossRef]
- Elith, J.; Phillips, S.J.; Hastie, T.; Dudík, M.; Chee, Y.E.; Yates, C.J. A Statistical Explanation of MaxEnt for Ecologists. Divers. Distrib. 2011, 17, 43–57. [Google Scholar] [CrossRef]
- Riahi, K.; van Vuuren, D.P.; Kriegler, E.; Edmonds, J.; O’Neill, B.C.; Fujimori, S.; Bauer, N.; Calvin, K.; Dellink, R.; Fricko, O.; et al. The Shared Socioeconomic Pathways and Their Energy, Land Use, and Greenhouse Gas Emissions Implications: An Overview. Glob. Environ. Chang. 2017, 42, 153–168. [Google Scholar] [CrossRef]
- GBIF. GBIF—The Global Biodiversity Information Facility. Available online: https://www.gbif.org/ (accessed on 7 November 2024).
- Tu, W.; Xiong, Q.; Qiu, X.; Zhang, Y. Dynamics of Invasive Alien Plant Species in China under Climate Change Scenarios. Ecol. Indic. 2021, 129, 107919. [Google Scholar] [CrossRef]
- Mao, M.; Chen, S.; Ke, Z.; Qian, Z.; Xu, Y. Using MaxEnt to Predict the Potential Distribution of the Little Fire Ant (Wasmannia auropunctata) in China. Insects 2022, 13, 1008. [Google Scholar] [CrossRef]
- Hou, J.; Xiang, J.; Li, D.; Liu, X. Prediction of Potential Suitable Distribution Areas of Quasipaa Spinosa in China Based on MaxEnt Optimization Model. Biology 2023, 12, 366. [Google Scholar] [CrossRef]
- Pintilioaie, A.-M.; Sfîcă, L.; Baltag, E.S. Climatic Niche of an Invasive Mantid Species in Europe: Predicted New Areas for Species Expansion. Sustainability 2023, 15, 10295. [Google Scholar] [CrossRef]
- Zhao, Z.; Yang, L.; Chen, X. Globally Suitable Areas for Lycorma Delicatula Based on an Optimized Maxent Model. Ecol. Evol. 2024, 14, e70252. [Google Scholar] [CrossRef]
- Fick, S.E.; Hijmans, R.J. WorldClim 2: New 1-km Spatial Resolution Climate Surfaces for Global Land Areas. Int. J. Climatol. 2017, 37, 4302–4315. [Google Scholar] [CrossRef]
- O’Neill, B.C.; Kriegler, E.; Riahi, K.; Ebi, K.L.; Hallegatte, S.; Carter, T.R.; Mathur, R.; van Vuuren, D.P. A New Scenario Framework for Climate Change Research: The Concept of Shared Socioeconomic Pathways. Clim. Change 2014, 122, 387–400. [Google Scholar] [CrossRef]
- Phillips, S.J.; Anderson, R.P.; Dudík, M.; Schapire, R.E.; Blair, M.E. Opening the Black Box: An Open-source Release of Maxent. Ecography Cop. 2017, 40, 887–893. [Google Scholar] [CrossRef]
- Aiello-Lammens, M.E.; Boria, R.A.; Radosavljevic, A.; Vilela, B.; Anderson, R.P. SpThin: An R Package for Spatial Thinning of Species Occurrence Records for Use in Ecological Niche Models. Ecography Cop. 2015, 38, 541–545. [Google Scholar] [CrossRef]
- Warren, D.; Dinnage, R. ENMTools: Analysis of Niche Evolution Using Niche and Distribution Models. CRAN Contrib. Packag. 2020. Available online: https://cran.r-project.org/web/packages/ENMTools/ (accessed on 1 June 2024).
- Potter, D.A.; Held, D.W. Biology and Management of the Japanese Beetle. Annu. Rev. Entomol. 2002, 47, 175–205. [Google Scholar] [CrossRef] [PubMed]
- Zhao, Y.; Zhang, L.; Wang, C. Predicting Possible Distribution of Rice Leaf Roller (Cnaphalocrocis medinalis) under Climate Change Scenarios Using MaxEnt Model in China. Sci. Rep. 2024, 14, 21245. [Google Scholar] [CrossRef]
- Bosio, G.; Piazza, E.; Giacometto, E. Popillia Japonica, Una Specie in Progressiva Diffusione. L’informatore Agrar. 2022, 21, 53–58. [Google Scholar]
- Simonetto, A.; Sperandio, G.; Battisti, A.; Mori, N.; Ciampitti, M.; Cavagna, B.; Bianchi, A.; Gilioli, G. Exploring the Main Factors Influencing Habitat Preference of Popillia Japonica in an Area of Recent Introduction. Ecol. Inform. 2022, 70, 101749. [Google Scholar] [CrossRef]
- Skendžić, S.; Zovko, M.; Živković, I.P.; Lešić, V.; Lemić, D. The Impact of Climate Change on Agricultural Insect Pests. Insects 2021, 12, 440. [Google Scholar] [CrossRef]
- Pulighe, G.; Di Fonzo, A.; Gaito, M.; Giuca, S.; Lupia, F.; Bonati, G.; De Leo, S. Climate Change Impact on Yield and Income of Italian Agriculture System: A Scoping Review. Agric. Food Econ. 2024, 12, 23. [Google Scholar] [CrossRef]
- Straubinger, F.B.; Benjamin, E.O.; Venus, T.E.; Sauer, J. The Economic Importance of Early Pest Control: New Insights from Potential Popillia Japonica Infestation in Europe. agriRxiv 2022, 20220316785. [Google Scholar] [CrossRef]
Disclaimer/Publisher’s Note: The statements, opinions and data contained in all publications are solely those of the individual author(s) and contributor(s) and not of MDPI and/or the editor(s). MDPI and/or the editor(s) disclaim responsibility for any injury to people or property resulting from any ideas, methods, instructions or products referred to in the content. |
© 2025 by the authors. Licensee MDPI, Basel, Switzerland. This article is an open access article distributed under the terms and conditions of the Creative Commons Attribution (CC BY) license (https://creativecommons.org/licenses/by/4.0/).