Article

Effects of Energy Intake on Nutrient Digestibility, Nitrogen Metabolism, Energy Utilization, Serum Biochemical Indices, and Rumen Microbiota in Lanzhou Fat-Tailed Sheep

School of Life Sciences and Engineering, Northwest Minzu University, Lanzhou 730030, China
*
Author to whom correspondence should be addressed.
These authors contributed equally to this work.
Agriculture 2025, 15(7), 698; https://doi.org/10.3390/agriculture15070698
Submission received: 7 February 2025 / Revised: 18 March 2025 / Accepted: 24 March 2025 / Published: 26 March 2025
(This article belongs to the Section Farm Animal Production)

Abstract

:
This study sought to investigate the impact of different levels of dietary maintenance energy metabolism on nutrient digestibility, rumen microbiota composition, and serum biochemical parameters in Lanzhou fat-tailed sheep rams. A total of twenty rams, each aged eight months and with an initial mean body weight of 27.81 ± 3.38 kg, were selected and randomly assigned to one of four experimental groups. These groups were administered with different levels of metabolizable energy (MEM): low energy (LE), intermediate energy (IE), high energy (HE), and extra high energy (EHE), corresponding to 6.77, 7.22, 7.72, and 8.20 MJ/d, respectively. The results showed a linear increase (p < 0.001) in average daily gain (ADG), dry matter (DM) intake, apparent DM digestibility, and crude protein (CP) digestibility. Conversely, the intake of nitrogen (NI), fecal nitrogen (FN), and manure nitrogen (MN) exhibited a significant linear decrease (p < 0.001). The N utilization efficiency rations of FN/NI and MN/NI linearly decreased (p < 0.001), while RN/NI linearly increased (p < 0.001). Additionally, the intake of gross energy (GE), methane energy (CH4-E), digestible energy (DE), and metabolizable energy (ME) exhibited a linear increase, whereas the ration of FE/GE intake linearly decreased (p < 0.001). The efficiency of energy utilization expressed as a proportion of GE intake (DE/GE intake, ME/GE intake, ME/DE intake, and CH4-E/GE intake) showed linear alterations (p < 0.05) with the increase in the dietary energy supplementation level. The dietary energy level did not exert a significant impact on serum biochemical indices (p > 0.05). At the phylum level, the average abundances of Verrucomicrobiota were significantly reduced in the EHE group compared to the IE group, while the average abundances of Desulfobacterota were significantly lower in the EHE group relative to the LE group. At the genus level, the average abundances of Succiniclasticum were significantly higher in the HE and EHE groups compared to the LE group. In conclusion, the energy level (8.20 MJ/d) significantly enhanced nutrient digestibility, energy, and nitrogen metabolism, and it significantly increased the relative abundances of Succiniclasticum.

1. Introduction

Lanzhou fat-tailed sheep are typically long fat-tailed sheep with the usual advantages, such as rapid growth and resistance to roughage feeding, high production, and slaughter performance; it is one of the famous local sheep breeds in China [1]. However, during the breeding process, the irrational dietary energy levels lead to low utilization rates of forage, high breeding costs, and low economic benefits of sheep farming. These issues seriously hinder the large-scale and industrial development of Lanzhou fat-tailed sheep. Energy is a critical nutrient necessary for sustaining normal physiological functions, health, and performance in animals. It also has an important impact on the digestion, absorption, and utilization of other nutrients [2]. Metabolizable energy (ME) are essential nutrients for an animal’s survival. Research by Wang et al. demonstrated that enhancing dietary energy levels improved growth performance and serum biochemical indices of female Hu lambs [3]. Ewes receiving a dietary energy level of 10.52 MJ/kg were equipped to fulfill their growth and lactation requirements [4]. Zhou et al. observed that the apparent digestibility of DM, OM, and GE increased linearly, whereas the apparent digestibility of ADF and NDF decreased linearly with the increase in dietary energy level. Additionally, the CP digestibility in Tibetan sheep increased linearly with the increase in dietary energy level, while it remained constant in small-tailed Han sheep [5]. Furthermore, the digestibility of NDF and ADF decreased with increasing energy levels, whereas the digestibility of DM, CP, and EE increased linearly with increasing energy levels [6]. Zhu et al. demonstrated that yaks provided with a diet of higher metabolizable energy (ME = 8.58 MJ/kg) exhibited a significantly increased DMI, although no significant differences were observed in ADG across the three dietary treatments [7]. In contrast, Azmi et al. reported that the ADG and feed conversion ratio (FCR) of buffalo calves were significantly influenced by the energy level of the diet, with calves in the high energy group showing a notably higher ADG compared to those in the low energy group [8]. Similarly, Kang et al. found that increasing dietary energy levels in Tibetan sheep led to improved GE digestibility, enhanced nitrogen balance, and higher nitrogen retention rates, along with a linear decrease in UN excretion [9]. These findings underscore the importance of understanding the impact of dietary energy levels on digestive metabolism and nutrient utilization in ruminants, which is crucial for optimizing nutritional strategies and improving feeding efficiency.
The rumen micro-ecosystem in sheep exhibits a relatively stable composition, comprising bacteria, fungi, protozoa, and archaea [10]. The microbial community within the rumen is primarily influenced by factors such as the animal’s breed, the nutritional content of the feed, and the feeding environment. Variations in the energy content of the feed can alter the rumen’s pH, subsequently affecting the composition of rumen microbes. In growing female Hu sheep, dietary energy levels have been shown to modify the composition and function of the rumen microbiota [11]. In contrast, the alpha and beta diversity of the rumen microbes in Tibetan sheep remained unaffected by dietary energy levels [12]. Ge et al. [13] reported that the ACE and Chao indices were highest in the low energy group (8.67 MJ/kg). As dietary energy levels increased, the relative abundance of Firmicutes and Bacteroidetes in the rumen microbiota of yaks also increased [14]. Furthermore, Cui et al. observed that low energy diets significantly enhanced the relative abundance of Fibrobacteres, Butyrivibrio, and Prevotella [15]. Consequently, examining the impact of dietary energy levels on rumen microbiota composition is crucial for advancing nutritional strategies in ruminant production systems.
Prior research predominantly concentrated on assessing growth performance, the fibroblast growth factor receptor, and genes associated with fat metabolism, while comparatively less emphasis was placed on energy requirements [16,17]. Therefore, our study aimed to investigate the impact of varying dietary ME levels on nutrient digestibility, rumen microbiota composition, and serum biochemical indices of Lanzhou fat-tailed sheep.

2. Materials and Methods

2.1. Experimental Design, Diet, and Feeding Management

In this experiment, twenty 8-month-old Lanzhou fat-tailed rams with an initial body weight of 27.81 ± 3.38 kg were randomly assigned to four groups, each comprising five animals (20 pens, one ram/pen). The rams in the four groups were fed four diets with metabolizable energy: 6.77 MJ/d for the low energy (LE) group, 7.22 MJ/d for the intermediate energy (IE) group, 7.72 MJ/d for the high energy (HE) group, and 8.20 MJ/d for the extra high energy (EHE) group. The diet formulations were developed in accordance with the requirements of the Chinese Feeding Standard of Sheep (NY/T816-2021 [18]) for sheep. All diets included wheat straw, alfalfa hay, corn, soybean meal, and wheat bran. The diet formulations and nutrient compositions are shown in Table 1. Although there were differences in starch content among the diets, the experimental protocol ensured that the total energy intake was standardized across all groups. Prior to the commencement of the experiment, the rams underwent deworming and vaccination procedures to mitigate the effect of diseases on the test subjects. Additionally, the sheep housing and metabolic cages were thoroughly sterilized. The rams were randomly assigned to 20 homemade metabolic cages and fed twice daily at 07:00 and 18:00 during a 30-day trial. The first 23 days served as a preliminary period for the rams to adjust to the diets, while the final 7 days constituted the formal experimental phase. Throughout the study, all rams were granted ad libitum access to water.

2.2. Feed, Fecal and Urine Collection

From days 23 to 30, residual feed samples were collected each morning prior to feeding. The samples were homogenized and weighed, followed by drying at 65 °C until a constant weight was attained and recorded. Subsequently, the dried samples were ground using a 1 mm sieve for nutrient analysis. Concurrently, feces and urine were collected from each sheep over a continuous 24 h period. The feces were weighed, and two samples constituting 10% of the fecal volume were extracted: one sample remained untreated, while the other was treated with 10% H2SO4 to stabilize nitrogen content and stored at −20 °C. Urine volume was measured using a graduated cylinder, and a sample comprising 10% of the urine volume was extracted. To this sample, 10% HCl was added, thoroughly mixed, and stored at −20 °C. These samples were utilized to evaluate the apparent digestibility of nutrients, as well as energy and nitrogen metabolism.

2.3. Measurements

All rams were weighed at seven-day intervals prior to feeding using an electronic digital scale (BOSCHR, Gerlingen, Germany) in order to calculate the average daily gain (ADG). Feeds and fecal samples were dried in a forced-air oven at 65 °C for 48 h and ground to pass through a 1 mm screen before analysis. Crude protein (CP), fecal nitrogen (FN), and urinary nitrogen (UN) were determined using the Kjeldahl nitrogen tester (K9840 Shandong Haineng, China). A fat tester (SOX406 Shandong Haineng, China) was used for the determination of ether extract (EE). The concentrations of neutral detergent fiber (NDF) and acid detergent fiber (ADF) were measured using a crude fiber tester (F800 Shandong Haineng, China). Gross energy (GE), fecal energy (FE), and urinary energy (UE) were measured using a calorimetric tester (Parr6400, Beijing, China). The apparent digestibility of nutrients and energy metabolism are calculated as follows [19]:
Apparent digestibility of nutrients (%) = (Nutrient content in feed −
Nutrient content in feces)/Nutrient content in feed × 100%
Digestive energy (DE, MJ/d) = Gross energy (GE) − Fecal energy (FE)
Methane energy (CH4-E, MJ/d) = 0.050 × Intake gross energy (GEI) + 0.17
Metabolizable energy (ME, MJ/d) = Gross energy (GE) − Fecal energy (FE)
− Urinary energy (UE) − CH4-E

2.4. Determination of Serum Biochemical Indices

Blood samples of 10 mL were collected using anticoagulant blood collection tubes prior to morning feeding, following a 12 h fasting period at the conclusion of the experimental phase. The serum was obtained by centrifugation at 3000× g for 10 min and subsequently stored at −20 °C until analysis. The serum concentrations of total protein (TP), albumin (ALB), globulin (GLB), total cholesterol (TC), triglycerides (TG), urea nitrogen (UREA), and glucose (GLU) in the serum were measured using an automatic biochemical analyzer (Hitachi Valve Co., Ltd., model 7600, Tokyo, Japan).

2.5. Rumen Fluid Collection and Rumen Microbial Analysis

On the 28th day of the experimental period, rumen fluid was collected using a rumen catheter and strained through four layers of cheesecloth. The rumen fluid was portioned into 10 mL sterile centrifuge tubes, and a total of 20 rumen fluid samples (5 in each group) were stored at −80 °C and sent to Beijing Biomarker Technologies Co (Beijing, China) for bacterial sequencing. After extracting the total DNA of the samples, PCR amplification was performed according to 16S full-length primers 27F (5′-AGRGTTTGATYNTGGCTCAG-3′) and 1492R (5′-TASGGHTACCTTGTTASGACTT-3′). PCR products were detected via 1% agar-gel electrophoresis. Then, separation and purification were performed; PCR products were paired using double-end sequencing, and sequences with more than 97% similarity were selected for microbial diversity and composition analysis. The α-diversity indices, including ACE, Chao1, Simpson, and Shannon, are calculated at the OTU level. At the same time, β-diversity is evaluated using principal coordinate analysis (PCoA) to understand species complexity across samples. One-way ANOVA was employed to assess the differences in bacterial abundance and diversity.

2.6. Statistical Analysis

The data obtained were analyzed using SPSS statistical software (version 22.0, Chicago, IL, USA). Differences between groups were examined using one-way analysis of variance (ANOVA), and means were compared using Duncan’s multiple range test. All data were expressed as means ± standard error of the mean (SEM). Differences were considered statistically significant at p < 0.05 or <0.001. Veen images and species distribution bar charts were provided through the Biomarker Technologies Co platform after bioinformatics analysis (Beijing Biomec Biotechnology Co., Beijing, China). Raw sequencing reads were deposited in the National Center for Biotechnology Information Sequence Read Archive (SRA) database (accession number: PRJNA1189598).

3. Results

3.1. Growth Performance and Nutrient Apparent Digestibility

The effects of different energy levels of diets on growth performance and nutrient apparent digestibility of rams are presented in Table 2. The ADG, DMI, DM digestibility, and CP digestibility linearly increased with the increase in the energy supplementation level (p < 0.001), whereas NDF and ADF digestibility were not significant (p > 0.05).

3.2. Nitrogen Metabolism

The nitrogen utilization of rams under different treatments is illustrated in Table 3. The NI, FN output, and MN output linearly decreased with the increase in the dietary energy level, respectively (p < 0.001), whereas RN increased (p < 0.05). Nitrogen supplementation efficiency, expressed as a proportion of N intake (FN/NI, MN/NI, RN/NI), exhibited linear changes (p < 0.001) with the increase in the dietary energy supplementation level. Meanwhile, an increase in the level of dietary energy led to no significant effects on UN/NI (p > 0.05).

3.3. Energy Utilization

Table 4 details the energy utilization of the rams under different treatments. With the increase in the dietary energy supplementation level, the intakes of GE, CH4-E, DE, and ME linearly increased (p < 0.001), whereas the FE output linearly decreased. Energy utilization efficiency, expressed as a proportion of GE intake (DE/GE intake, ME/GE intake, ME/DE intake, and CH4-E/GE intake), increased, respectively (p < 0.001), with the increase in the dietary energy supplementation level, whereas the FE/GE intake linearly decreased. Meanwhile, an increase in the level of dietary energy led to no significant effects on UE/GE intake (p > 0.05).

3.4. Serum Biochemical Indices

The effects of the different metabolism energy levels of diet supplementation treatments on the serum biochemical indices of rams are shown in Table 5. The results show that the TP, ALB, GLB, ALB/GLB ratio, UREA, GLU, TG, and TC were unaffected by supplementation of the different energy levels of diets (p > 0.05).

3.5. Rumen Microbial Composition

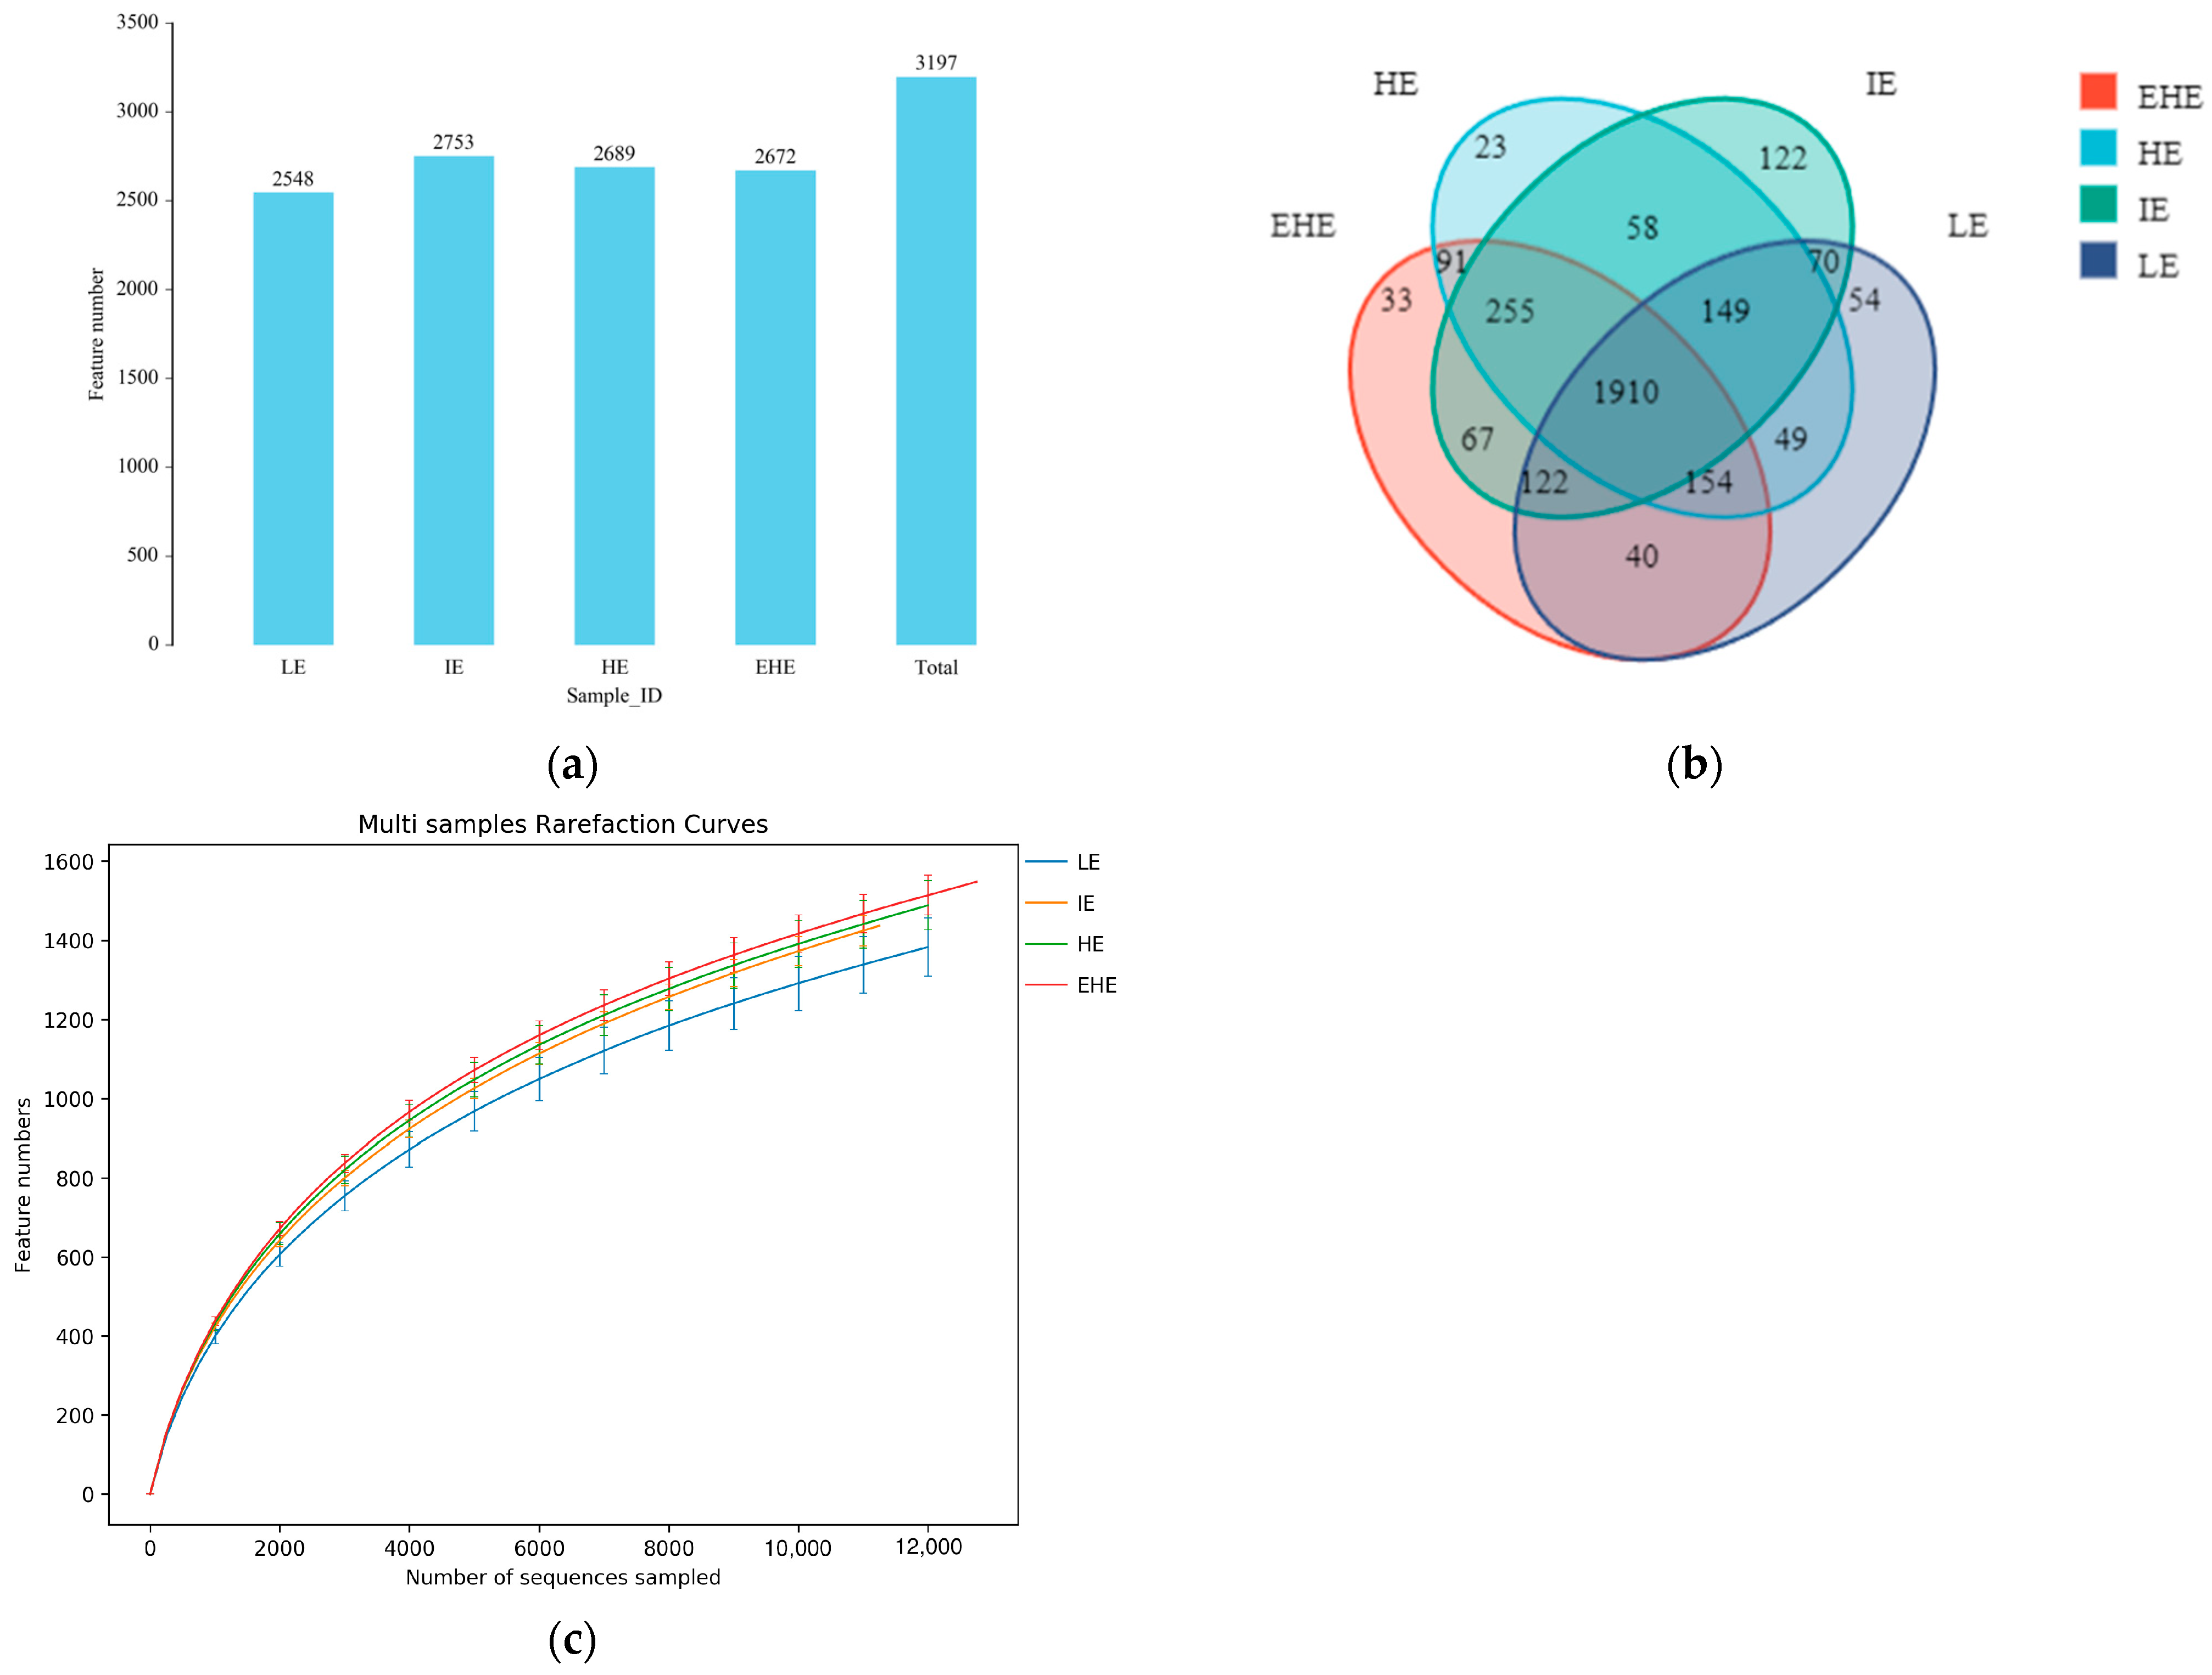
3.5.1. Sample Sequencing Results

In total, 274,597 raw reads (an average of 13,730 sequences per sample) were obtained from bacterial 16S rRNA sequencing of 20 samples. In Figure 1a, it can be observed that the operational taxonomic unit (OTU) in the four groups was not significant (p > 0.05). The Venn diagram analysis of bacterial communities at the operational taxonomic unit (OTU) level disclosed that a core set of 1910 OTUs was consistently present across all groups. Furthermore, the analysis highlighted the presence of distinct OTUs within each group: 54 unique to the LE group, 122 to the IE group, 23 to the HE group, and 33 to the EHE group (Figure 1b). The rarefaction curve depicted the species diversity and species richness of each sample, which leveled off at 12,000 reads, demonstrating that the sequencing coverage was saturated (Figure 1c).

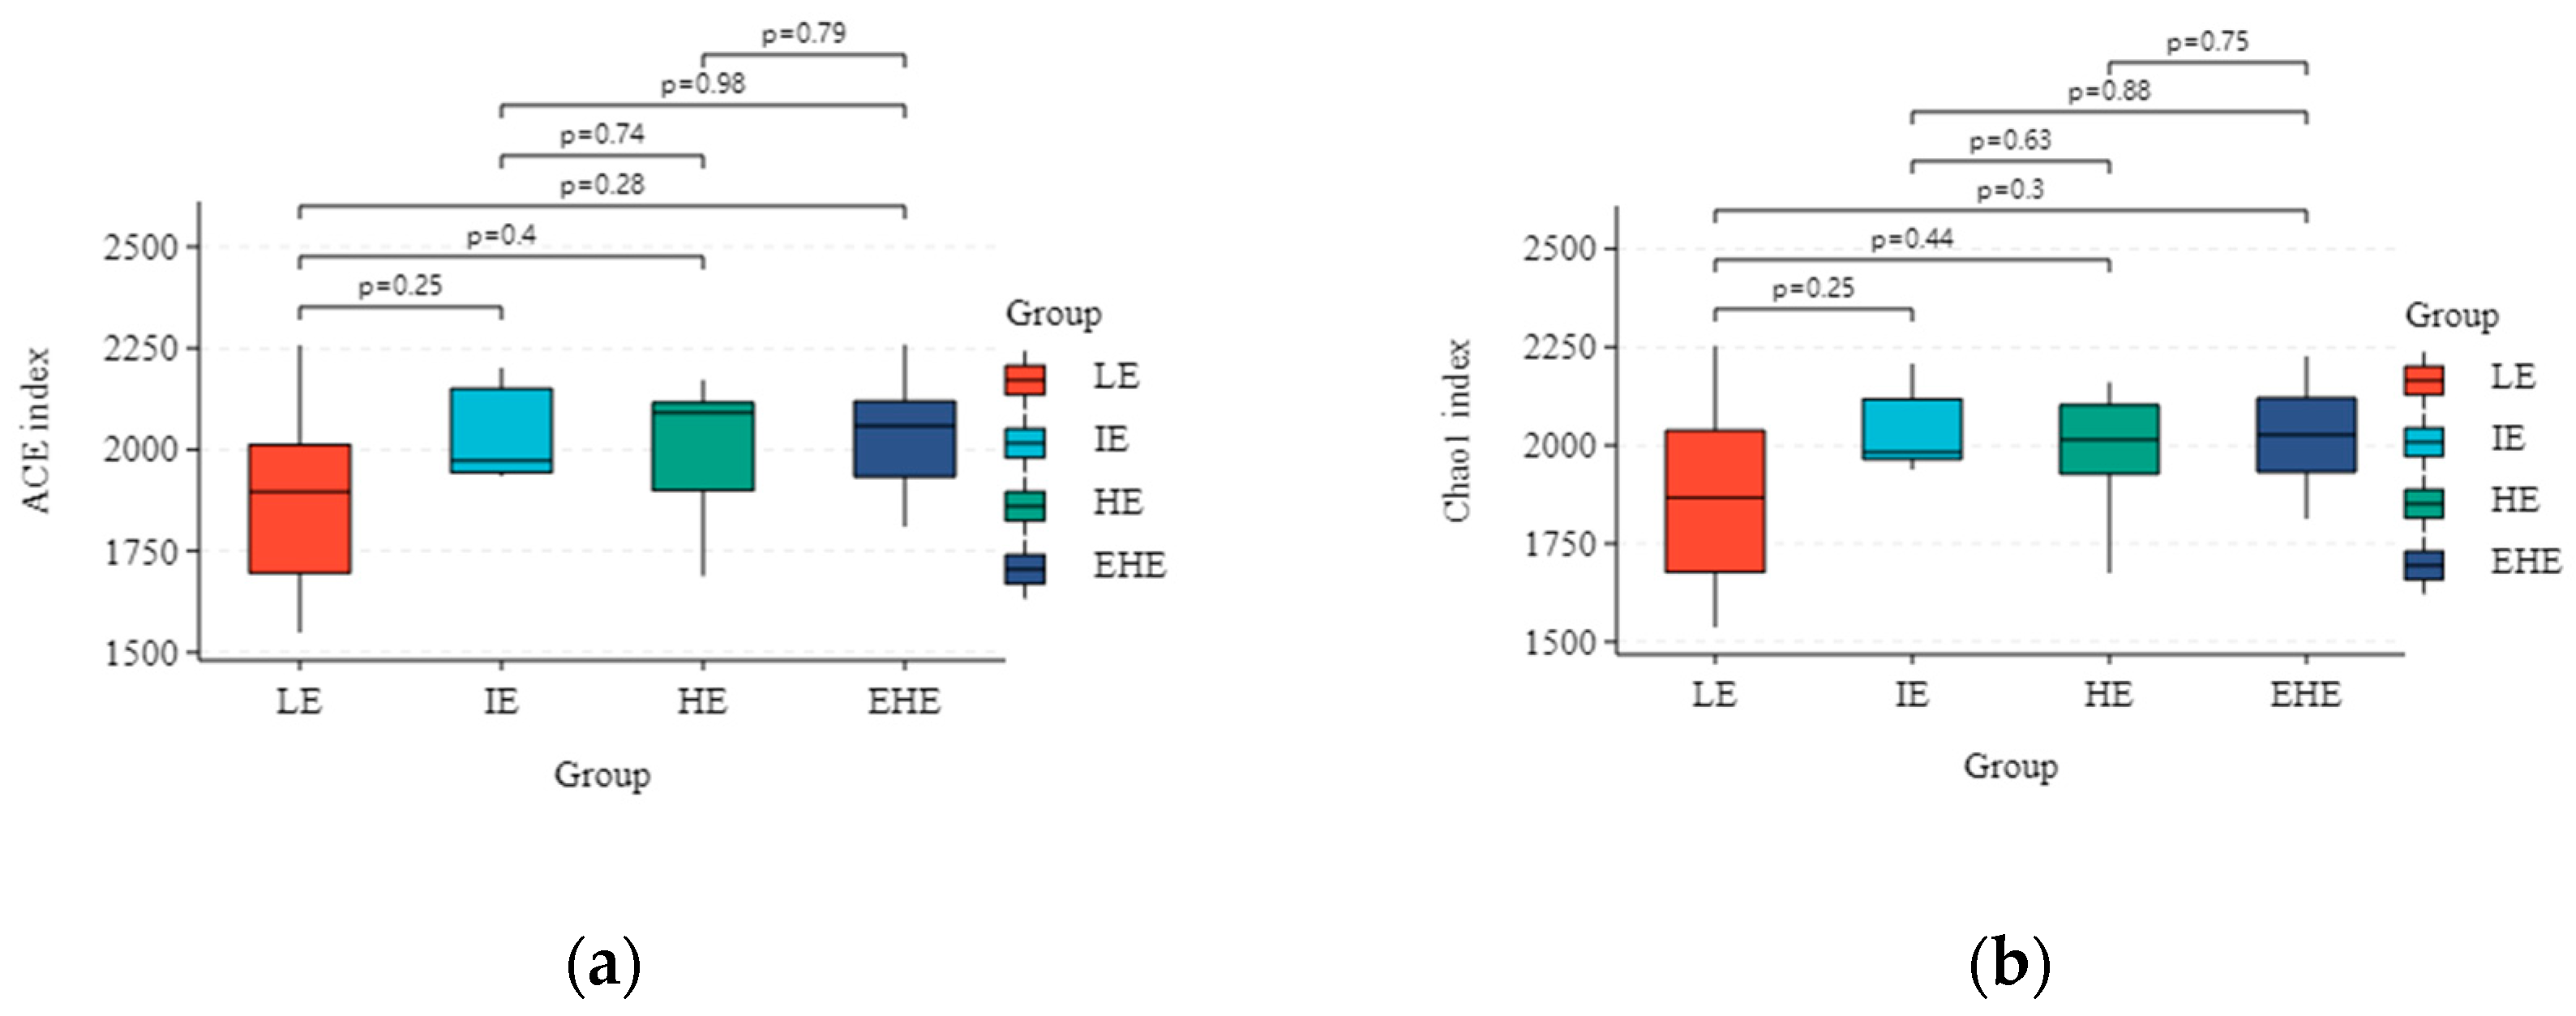
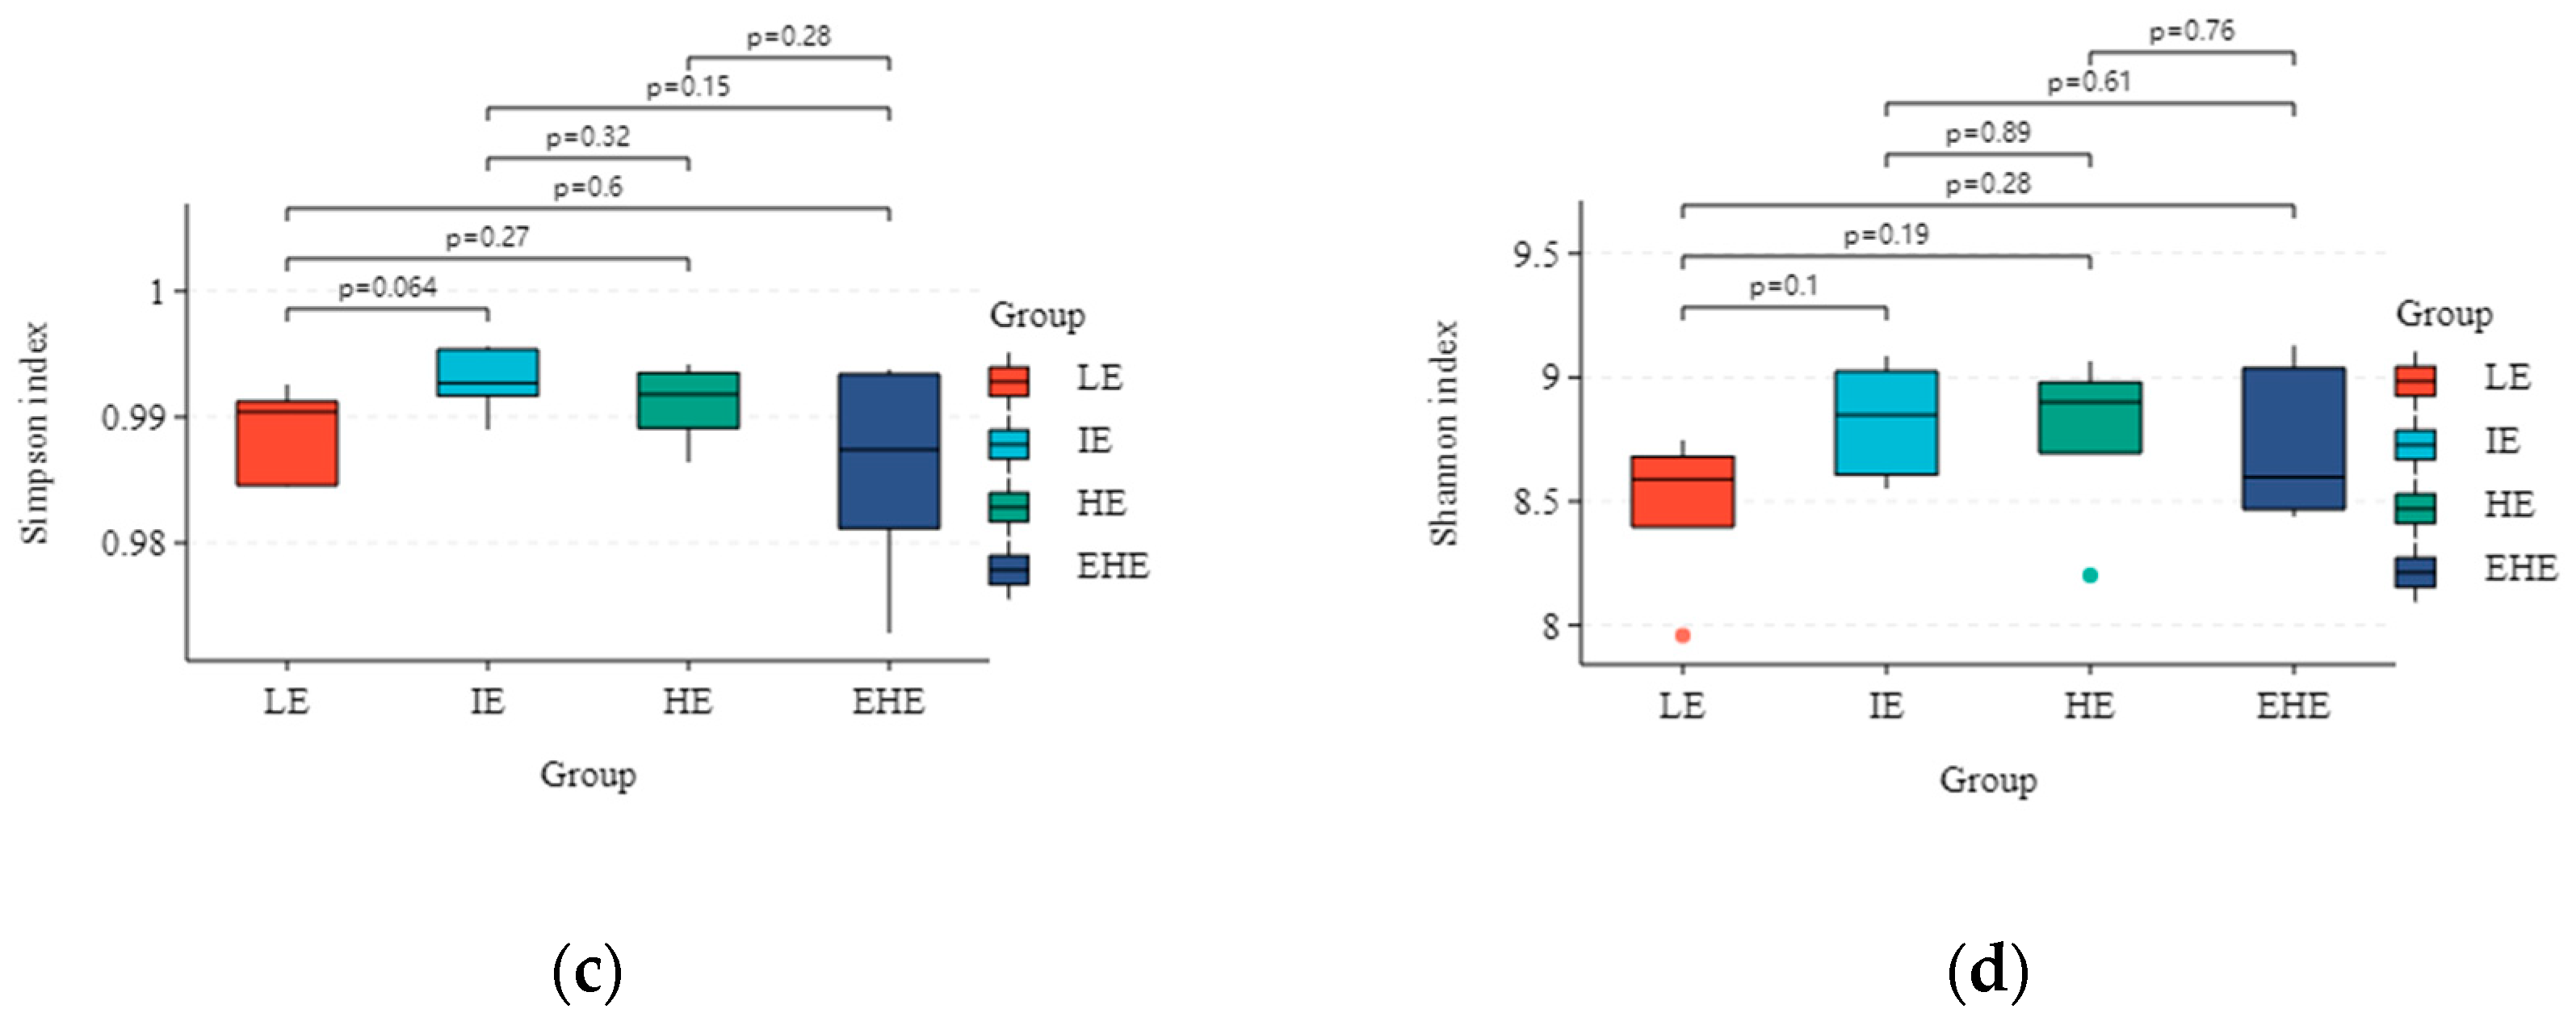
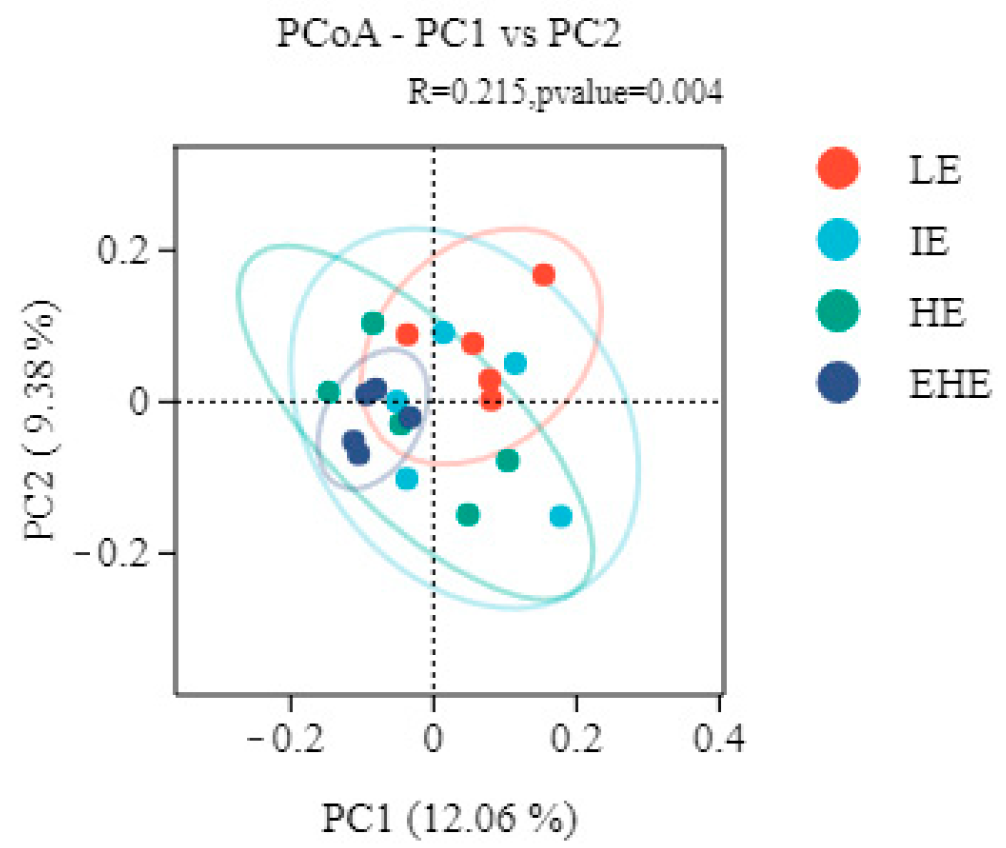
3.5.2. Alpha Diversity and Beta Diversity

The α-diversity of ram rumen microbiota was not affected by the different energy levels of diets (Figure 2). As dietary energy levels increased, the differences in ACE, Chao1, Simpson, and Shannon between the four energy groups of rams were not significant (p > 0.05). As dietary energy increased, ACE and Chao1 gradually decreased; Simpson first decreased and then increased; and Shannon increased.
Beta diversity’s principal coordinate analysis revealed substantial variations in microbiota composition and structure under varying energy diets, which were evident from the two initial principal component scores contributing 12.06% and 9.38%, respectively, to the overall variations (Figure 3).

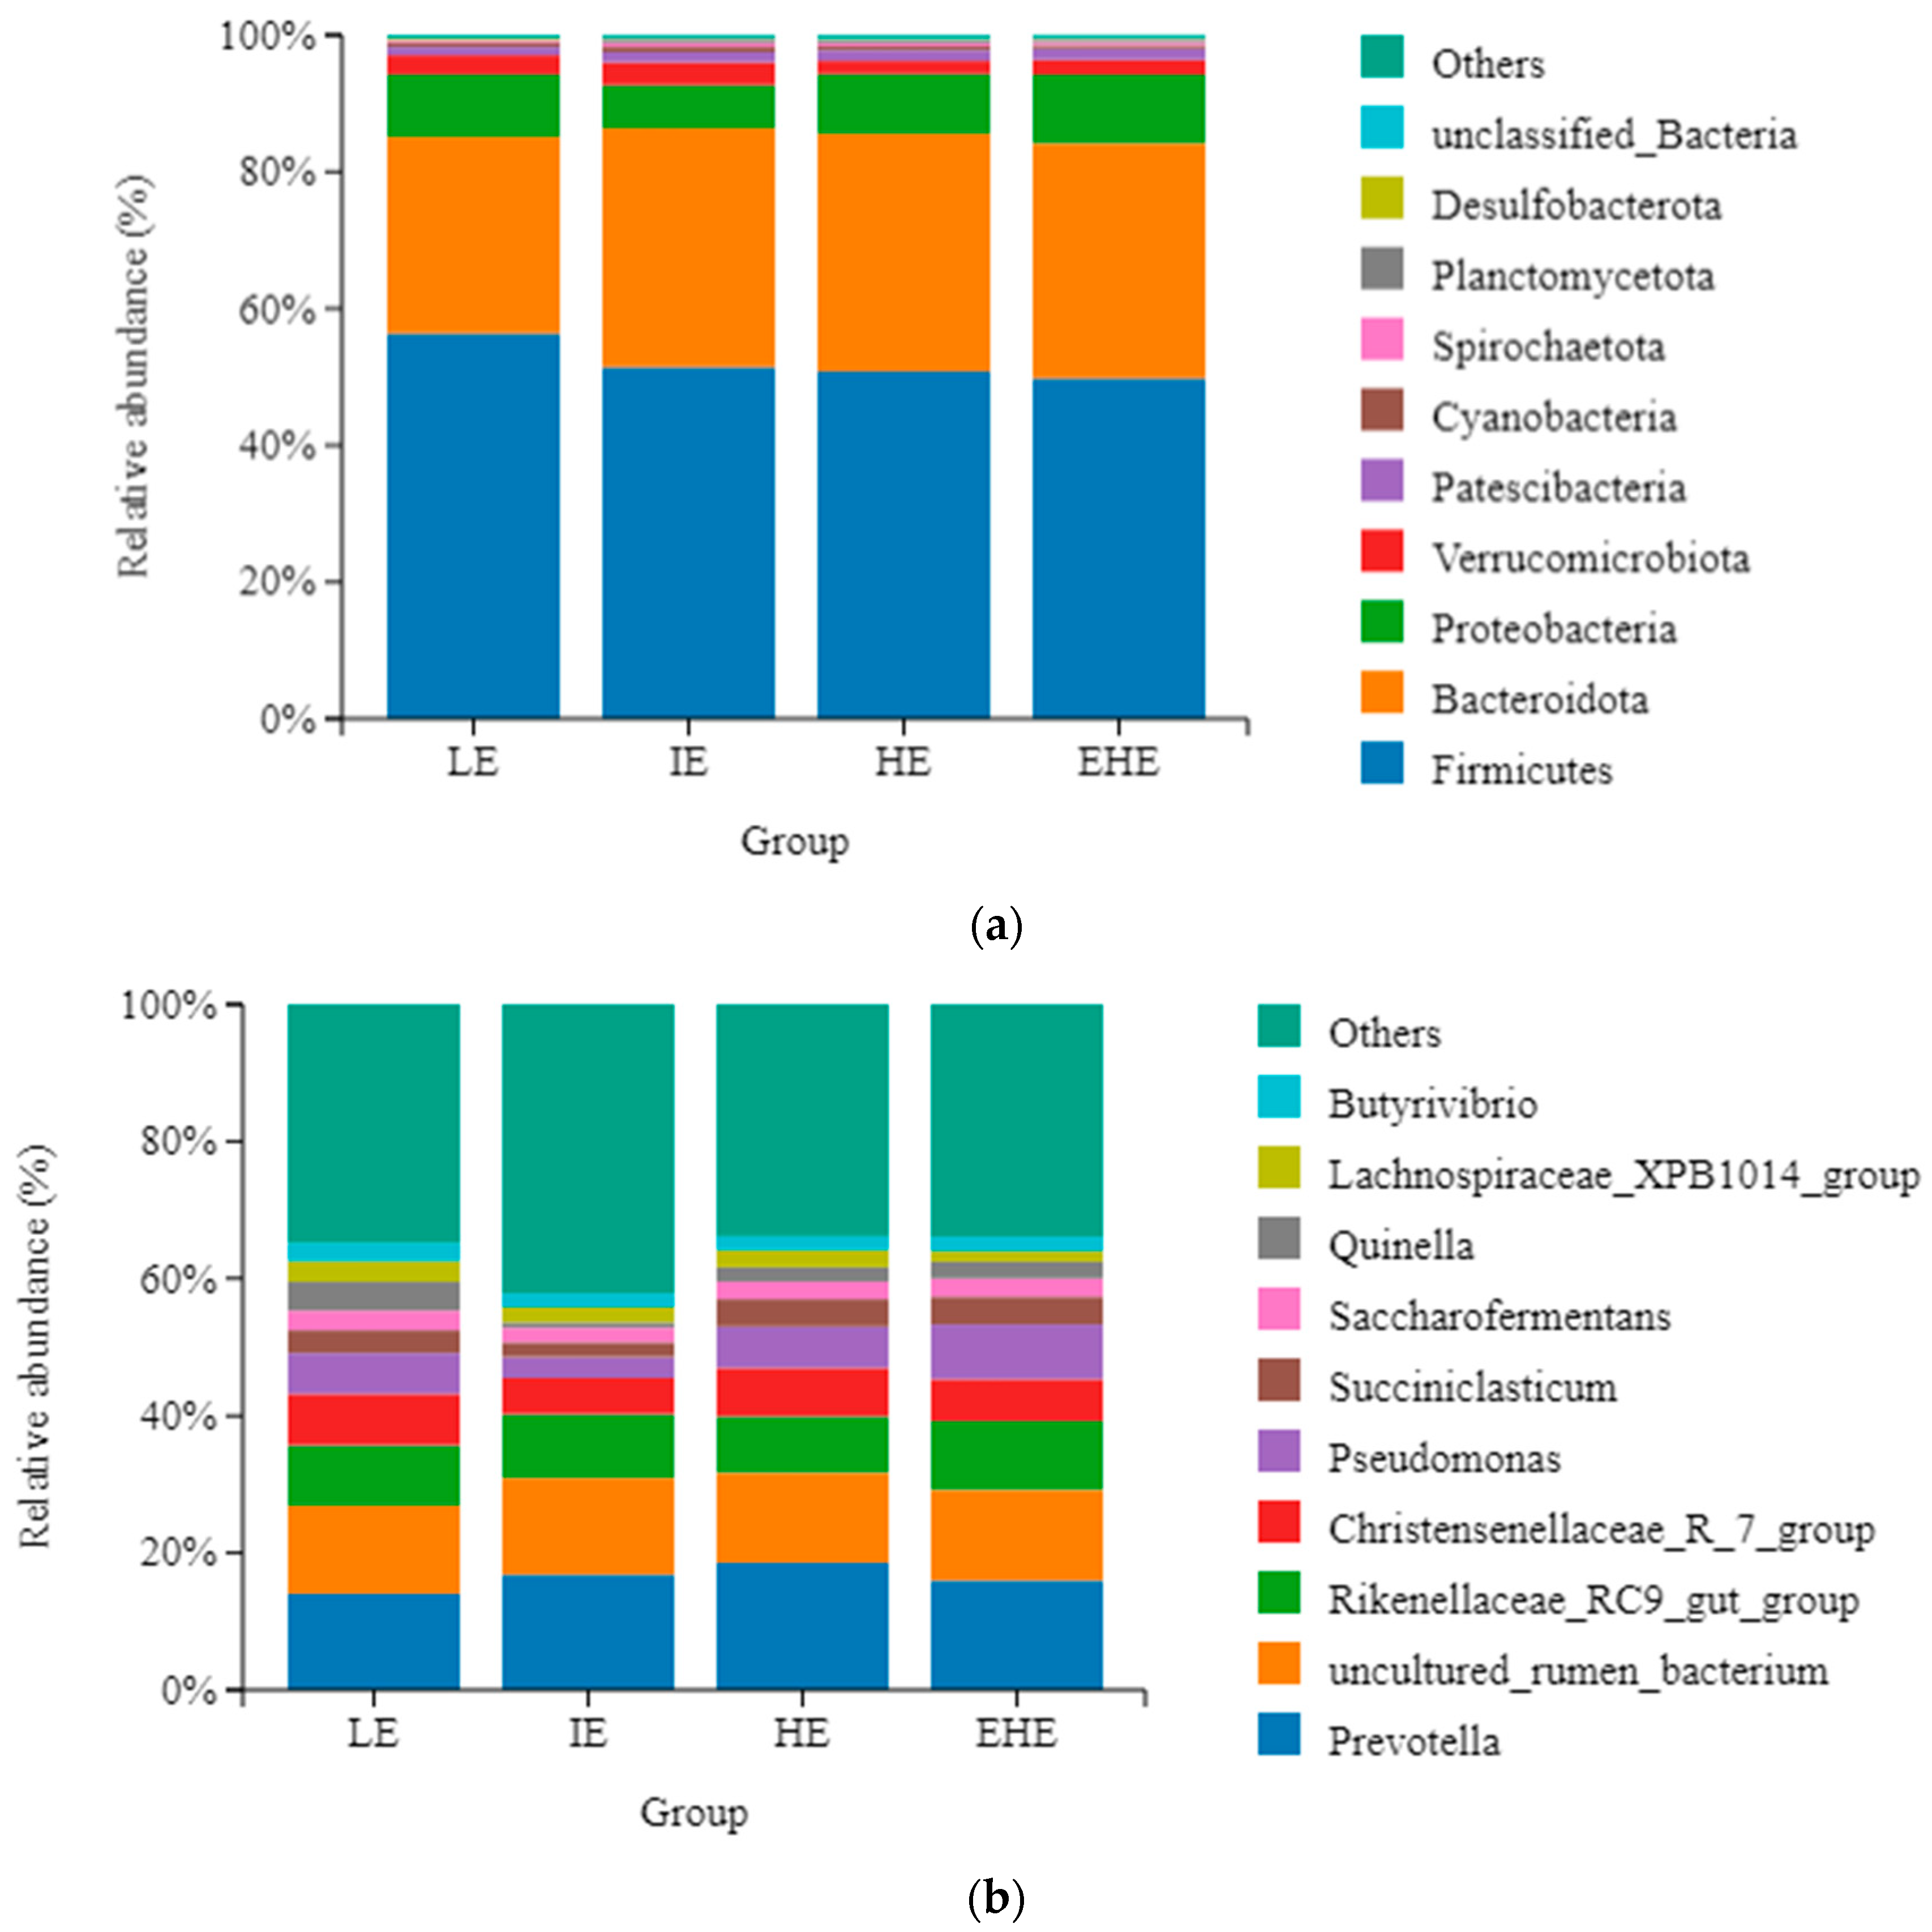
3.5.3. Taxonomy of Rumen Bacterial Composition

At the phylum level, the dominant bacteria phyla were Firmicutes, Bacteroidota, Proteobacteria, and Verrucomicrobiota. In the LE group, the average abundances of the dominant species were 56.39%, 28.71%, 9.15%, and 2.83%. In the IE group, the average abundances of the dominant species were 51.46%, 34.89%, 6.32%, and 3.36%. In the HE group, the average abundances of the dominant species were 50.84%, 34.72%, 8.74%, and 1.93%. In the EHE group, the average abundances of the dominant species were 49.82%, 34.34%, 10.05%, and 2.17%. Moreover, there were significant differences in the average abundances of Verrucomicrobiota and Desulfobacterota at different dietary energy levels (p < 0.05). Among them, Verrucomicrobiota had the highest average abundance in the IE group, while Desulfobacterota had the highest average abundance in the LE group (Figure 4a, Table 6).
At the genus level, 298 genera were identified in all samples. Christensenellaceae_R_7_group (7.52%) was the dominant genus in the LE group; uncultured_rumen_bacterium (14.08%) was the dominant genus in the IE group; Prevotella (18.58%) was the dominant genus in the HE group; Rikenellaceae_RC9_gut_group (10.06%) was the dominant genus in the EHE group. Moreover, under varying dietary energy levels, the average abundance of Succiniclasticum exhibited significant variations, with the lowest levels observed in the IE group and the highest levels detected in both HE and EHE groups (Figure 4b, Table 7).

4. Discussion

4.1. Effect of Dietary Energy Level on Growth Performance and Nutrient Apparent Digestibility

Animal growth performance is closely linked to DMI, which is significantly influenced by the nutritional composition of their diet, particularly the energy levels [20]. Wang et al. reported a notable increase in the DMI of lambs with elevated dietary metabolizable energy levels [21]. In our study, we observed a significant increase in DMI in rams as metabolizable energy (ME) levels were raised from 6.77 to 8.20 MJ/kg. Optimal energy levels are crucial for enhancing growth efficiency in animals. Wang et al. also found that the ADG of female Hu lambs increased significantly as dietary energy levels increased [21]. Similarly, increasing dietary metabolizable energy levels led to a significant rise in ADG [3]. Yang et al. demonstrated that yak ADG during the 30–60-day period exhibited a quadratic response, initially increasing and then decreasing with higher dietary energy levels [22]. Our research further indicated that the dietary energy levels increased with ADG in rams. Thus, optimizing dietary energy levels within an appropriate range can effectively enhance the ADG of sheep [20]. As it reflects the balance of the ration and the digestion and absorption of nutrients, nutrient digestibility is a crucial metric for evaluating the nutritional value of the ration. Apparent DM digestibility can be improved by increasing the energy content of the ration [23]. Numerous studies have demonstrated that elevating the dietary energy level enhances DMI [3,20]. Enhanced dietary energy levels may improve the efficiency of nutrient utilization, potentially leading to increased DMI. In our study, we observed a significant increase in the apparent digestibility of DM and CP with higher dietary energy levels, aligning with findings in Tibetan sheep [24]. Diets with high energy content (e.g., 8.20 MJ/d) stimulate feeding frequency and total intake by enhancing rumen microbial activity, such as the proliferation of Succiniblasticum, accelerating the degradation rates of fiber and starch, and reducing chyme retention time [15]. These indicated that the higher energy levels may indirectly affect DMI and CP digestibility via increased feed intake. Appropriate energy levels promote gut health and support the growth of beneficial microflora, thereby likely enhancing nutrient absorption and overall gastrointestinal health. Conversely, a reduction in NDF and ADF intake was associated with inhibition of the activity of fiber-degrading bacteria, resulting in decreased digestibility of NDF and ADF [25].

4.2. Effect of Dietary Energy Level on Nitrogen Metabolism

Increasing the energy levels in the diet can increase protein deposition in animals and reduce the catabolism of amino acids within the organism [26]. As dietary energy levels increased, there was a significant decrease in expired nitrogen. This finding contradicts the results of Hanlon et al. [27], who investigated FN in dairy cows and suggested that dietary energy levels impact nitrogen metabolism, which is influenced by factors such as animal species and experimental conditions. In our research, as dietary energy levels increased, nitrogen intake and MN decreased significantly, while RN increased. This aligns with the findings of Liu et al. [28] regarding nitrogen metabolism in grassland red steers, indicating that higher energy intake promotes increased nitrogen deposition [29]. However, UN decreased, albeit not significantly, with increasing dietary energy levels. Dietary metabolizable energy did not affect UN in growing pigs [30]. Similarly, no significant changes in the UN of dairy cows were observed with increased dietary energy levels (10.5–10.8 MJ/kg) [27]. Overall, dietary energy levels do not have a significant impact on UN.

4.3. Effect of Dietary Energy Level on Energy Utilization

Energy is crucial for ruminant activities; it is primarily sourced from carbohydrates, proteins, and fats in their diet. A minor proportion of this energy is lost as fecal, urinary, and methane energy. In our study, as the dietary energy level increased, GE intake, CH4-E, ME, and DE also increased, while FE decreased. These findings were consistent with those of Hu et al. [31], who reported significant increases in GE intake, ME, and DE with elevated energy levels, indicating that higher energy levels substantially impact energy metabolism. The rations of DE/GE and ME/GE serve as critical indicators of an animal’s capacity to digest the energy present in its feed. In our research, as dietary energy levels increased, both DE/GE intake and ME/GE intake showed a tendency to increase, reflecting an improvement in energy utilization efficiency with high energy feeds. Furthermore, as the ME requirement for maintenance increased, DE/GE intake and ME/GE intake also tended to rise in Zebu cattle [32]. Similarly, the apparent digestibility of GE in Yunshang black goats improved with an increase in dietary energy intake [33]. Consequently, high energy feeds more effectively satisfy the energy requirements of ruminants and enhance their energy utilization. Bao et al. found that the ration of ME/DE in sika deer was unaffected by dietary levels [34]. However, our study demonstrated that the ME/DE ration increased with higher dietary energy levels. This discrepancy may be attributed to variations in animal breed and diet composition.

4.4. Effect of Dietary Energy Level on Serum Biochemical Indicators

Serum biochemical indicators serve as diagnostic markers of health by reflecting the extent of lipid mobilization, energy balance, and pathophysiological processes within the body [35]. The serum levels of TP, GLB, and ALB provide an approximate indication of protein absorption, synthesis, and degradation, thereby serving as markers of the liver’s protein production. The findings of the current study showed that dietary energy did not significantly affect protein metabolism, as evidenced by the observed increase in serum TP, GLB, and ALB levels with increased dietary energy intake. This phenomenon may be attributed to the relatively abundant and consistent levels of dietary protein across all groups, which did not significantly influence these indices [36]. A decrease in serum GLU concentration was noted in the event of insufficient nutritional energy intake, indicating a reduction in the utilization of nutrients. The GLU serum content can reflect the energy metabolism of the body. Wang et al. [3] found that GLU in serum increased in step with dietary energy level increases. The results of this experiment are very similar to the results of this research. The levels of TG and TC in serum serve as crucial biomarkers for assessing lipid metabolism [37]. In our study, we observed that the serum concentrations of TG and TC remained within the normal limits, suggesting that the dietary energy intake ranging from 6.77 to 8.20 MJ/d did not exert a significant impact on the fat metabolism of the rams.

4.5. Effect of Dietary Energy Level on Rumen Microbial Composition

The rumen microbiota plays an essential role in maintaining ruminant health and facilitating normal digestive processes [38]. In the current study, the HE group (7.72 MJ/d) exhibited a reduced number of OTUs compared to other groups. Chen et al. have demonstrated that high energy diets can diminish microbial diversity within the ruminal microbiota [17]. It has also been shown that microbial diversity is affected by dietary energy levels. Our findings indicated that at a dietary energy level of 8.20 MJ/d, the ACE and Chao1 indices were elevated. These results indicated that varying energy levels in diets alter the relative abundance of rumen microbial communities in Lanzhou fat-tailed sheep. Consequently, appropriate dietary energy levels are essential for ensuring the normal growth and gastrointestinal health of ruminants [11]. The rumen microbiota is predominantly composed of Firmicutes and Bacteroidetes [13,39], with Firmicutes being primarily responsible for the degradation of fibrous materials [40]. Therefore, lowering the diet’s energy level increased the abundance of Firmicutes in weaned lambs [41]. Bacteroidetes are thought to produce enzymes that degrade plant cell wall components, such as cellulose and pectin, resulting in the release of VFA, primarily acetate, propionate, and butyrate [42]. Our research indicated Firmicutes, Bacteroidetes, and Verrucomicrobiota as the dominant microbial phyla across all four groups, suggesting that the rumen microbiota of sheep remained relatively stable at the phylum level. Previous studies have similarly indicated that Firmicutes and Bacteroidetes were the predominant phyla in rumen microbiota [11,43]. Verrucomicrobia play a crucial role in cellulose degradation [44]. The significantly higher relative abundance of Verrucomicrobia observed in the IE group compared to the other three experimental groups implies that moderate and low dietary energy levels may enhance fiber degradation capacity in the rumen of dairy sheep. Additionally, Desulfobacterota are sulfate-reducing bacteria capable of reducing sulfate to hydrogen sulfide [45]. In this study, the relative abundance of Desulfobacterota exhibited a progressive decline with increasing dietary energy levels, indicating that energy levels within the range of 6.77–8.20 MJ/d may contribute to maintaining host health and enhancing the feeding environment. Prevotella plays a crucial role in the degradation of starch and cellulose [46]. The lower starch and fiber content in the LE group compared to the IE, HE, and EHE groups may account for the increased abundance of Prevotella observed in the LE group. Mao et al. [47] found that Prevotella abundance was higher in groups on lower-concentrate rations, suggesting a relationship between Prevotella abundance and animal species. Succiniclasticum primarily utilizes starch, cellulose, or cellobiose as fermentation substrates, with succinate and acetate as its main metabolic products [48]. In this study, the relative abundance of Succiniclasticum was highest in the HE group. It is hypothesized that under high energy feeding conditions, the gut microbiota of Lanzhou fat-tailed sheep extensively utilize starch-rich substrates, thereby promoting the proliferation of Succiniclasticum.

5. Conclusions

In conclusion, this study indicated that the energy level (8.20 MJ/d) in the diet significantly increased DMI and ADG, reducing the excretion of FN, MN, UN, FE, and UE, thereby improving the utilization efficiency of deposited nitrogen and energy. Meanwhile, the high energy level significantly increased the relative abundance of Succiniclasticum while decreasing the relative abundance of Verrucomicrobiota and Desulfobacterota.

Author Contributions

W.F. and J.Z. (Juanshan Zheng): Writing—Original draft, Writing—Review and editing; N.J.: Writing—Review and editing; J.Z. (Junsong Zhang), C.M., H.L. and X.F.: Data curation; J.Y., X.C., H.X., Y.C. and D.G.: Investigation; P.G.: Writing—Review and editing, Project administration. All authors have read and agreed to the published version of the manuscript.

Funding

This study was supported by the following research grants: the Gansu Province University young doctor support project (no. 2023QB-002), the Talent innovation and entrepreneurship project in Lanzhou, Gansu Province (no. 2023-RC-47), the Gansu Province Science and Technology Innovation Guidance Program Project (Special Special for Science and Technology Commissioners) (no. 23CXNA0045), the Northwest Minzu University basic research expenses of central universities (no. 31920230027), the Lanzhou science and technology planning project (no. 2024JSCX0002), and the Germplasm resources protection and utilization and animal product quality control innovation team project of Northwest Minzu University (no. 10017648).

Institutional Review Board Statement

The Animal Welfare Committee of Northwest Minzu University, Lanzhou, China, approved this study (XBMU-SM-2020010, date: 1 May 2023).

Data Availability Statement

Raw sequencing reads were submitted to the NCBI SRA database under accession number PRJNA1189598.

Acknowledgments

The authors would like to express their gratitude to the national-level Lanzhou Fat-Tailed Sheep Conservation Center for providing the Lanzhou fat-tailed sheep rams used as experimental materials in this study.

Conflicts of Interest

The authors declare no actual or potential conflicts of interest.

References

  1. Chen, H.F.; Wei, T.; Zhang, J.S.; Xu, H.W.; Gao, D.D.; Cao, X.; Cai, Y.; Yang, J.T.; Wang, R.; Guo, P.H. A suitable prediction model of body weight and trait measurements of Lanzhou fat-tailed sheep. Pratacult. Sci. 2023, 40, 1648–1655. [Google Scholar]
  2. Bai, J.; Zhao, E.L.; Li, M.F.; Xin, J.P.; Xu, L.J.; Qu, M.R.; Yi, Z.H.; Yang, S.T.; Yang, J.J.; Li, Y.J. Effects of Dietary Energy Level on Growth Performance, Nutrient Digestionand Energy Metabolism of Jinjiang Steers in Early Stage of Fattening. Chin. J. Anim. Nutr. 2019, 31, 692–698. [Google Scholar]
  3. Wang, Q.; Wang, Y.; Hussain, T.; Dai, C.; Li, J.; Huang, P.; Li, Y.; Ding, X.; Huang, J.; Ji, F.; et al. Effects of dietary energy level on growth performance, blood parameters and meat quality in fattening male Hu lambs. J. Anim. Physiol. Anim. Nutr. 2020, 104, 418–430. [Google Scholar]
  4. Luo, S.-F.; Wang, Y.-C.; Wang, X.; Dai, C.-P.; Wang, Q.-Y. Dietary energy and protein levels on lactation performance and progeny growth of Hu sheep. J. Appl. Anim. Res. 2022, 50, 526–533. [Google Scholar]
  5. Zhou, J.; Wang, W.; Jing, X.; Degen, A.; Guo, Y.; Kang, J.; Shang, Z.; Yu, Z.; Qiu, Q.; Guo, X.; et al. Effect of dietary energy on digestibilities, rumen fermentation, urinary purine derivatives and serum metabolites in Tibetan and small-tailed Han sheep. J. Anim. Physiol. Anim. Nutr. 2019, 103, 977–987. [Google Scholar]
  6. Liu, H.; Zhou, J.; Degen, A.; Liu, H.; Cao, X.; Hao, L.; Shang, Z.; Ran, T.; Long, R. A comparison of average daily gain, apparent digestibilities, energy balance, rumen fermentation parameters, and serum metabolites between yaks (Bos grunniens) and Qaidam cattle (Bos taurus) consuming diets differing in energy level. Anim. Nutr. 2023, 12, 77–86. [Google Scholar]
  7. Zhu, Y.; Sun, G.; Luosang-dunzhu; Li, X.; Luosang-zhaxi; Suolang-zhaxi; Suolang; Ciyang; Cidan-yangji; Basang-wangdui; et al. High energy level diet improves the growth performance and rumen fermentation of yaks in cold weather. Front. Vet. Sci. 2023, 10, 1212422. [Google Scholar] [CrossRef]
  8. Mohd Azmi, A.F.; Hafandi, A.; Mohd Nor, N.; Goh, Y.; Saad, M.; Abu Bakar, M.Z.; Abdullah, P.; Jayanegara, A.; Abu Hassim, H. Effects of Concentrate and Bypass Fat Supplementations on Growth Performance, Blood Profile, and Rearing Cost of Feedlot Buffaloes. Animals 2021, 11, 2105. [Google Scholar] [CrossRef]
  9. Kang, J.; Wang, W.; Guo, Y.; Jing, X.; Zhong, C.; Guo, W.; Long, R.; Zhou, J. Effects of different dietary energy levels on apparent digestibility, nitrogen metabolism and growth performance of Tibetan sheep under low nitrogen conditions. Acta Pratacult. Sin. 2018, 27, 166–174. [Google Scholar]
  10. Huws, S.A.; Creevey, C.J.; Oyama, L.B.; Mizrahi, I.; Denman, S.E.; Popova, M.; Muñoz-Tamayo, R.; Forano, E.; Waters, S.M.; Hess, M.; et al. Addressing Global Ruminant Agricultural Challenges Through Understanding the Rumen Microbiome: Past, Present, and Future. Front. Microbiol. 2018, 9, 2161. [Google Scholar]
  11. Wang, Q.; Wang, Y.; Wang, X.; Dai, C.; Tang, W.; Li, J.; Huang, P.; Li, Y.; Ding, X.; Huang, J.; et al. Effects of dietary energy levels on rumen fermentation, microbiota, and gastrointestinal morphology in growing ewes. Food Sci. Nutr. 2020, 8, 6621–6632. [Google Scholar] [CrossRef] [PubMed]
  12. Wu, X.; Zhang, G.; Zhang, W.; Zhou, J.; Cong, H.; Yang, G.; Liu, G. Rumen microbiota helps Tibetan sheep obtain energy more efficiently to survive in the extreme environment of the Qinghai–Tibet Plateau. Front. Microbiol. 2024, 15, 1431063. [Google Scholar]
  13. Ge, T.; Yang, C.; Li, B.; Huang, X.; Zhao, L.; Zhang, X.; Tian, L.; Zhang, E. High-energy diet modify rumen microbial composition and microbial energy metabolism pattern in fattening sheep. BMC Vet. Res. 2023, 19, 32. [Google Scholar] [CrossRef] [PubMed]
  14. Ahmad, A.A.; Yang, C.; Zhang, J.; Kalwar, Q.; Liang, Z.; Li, C.; Du, M.; Yan, P.; Long, R.; Han, J.; et al. Effects of Dietary Energy Levels on Rumen Fermentation, Microbial Diversity, and Feed Efficiency of Yaks (Bos grunniens). Front. Microbiol. 2020, 11, 625. [Google Scholar]
  15. Cui, K.; Qi, M.; Wang, S.; Diao, Q.; Zhang, N. Dietary energy and protein levels influenced the growth performance, ruminal morphology and fermentation and microbial diversity of lambs. Sci. Rep. 2019, 9, 16612. [Google Scholar]
  16. Song, S.Z.; Zhu, C.Y.; Liu, L.S.; Gong, X.Y.; Luo, R.R. The effect of tail-docking on adipocyte structure and lipid metabolism-related gene expression in Lanzhou fat-tailed sheep. Acta Pratacult. Sin. 2024, 33, 94–104. [Google Scholar]
  17. Chen, K.; Shui, Y.; Deng, M.; Guo, Y.; Sun, B.; Liu, G.; Liu, D.; Li, Y. Effects of different dietary energy levels on growth performance, meat quality and nutritional composition, rumen fermentation parameters, and rumen microbiota of fattening Angus steers. Front. Microbiol. 2024, 15, 1378073. [Google Scholar]
  18. NY/T816-2021; Nutrient Requirements of Meat-Type Sheep and Goat. Ministry of Agriculture and Rural Affairs of the People’s Republic of China: Beijing, China, 2021.
  19. An, X.; Zhang, L.; Luo, J.; Zhao, S.; Jiao, T. Effects of Oat Hay Content in Diets on Nutrient Metabolism and the Rumen Microflora in Sheep. Animals 2020, 10, 2341. [Google Scholar] [CrossRef]
  20. Wang, X.; Zhou, J.; Lu, M.; Zhao, S.; Li, W.; Quan, G.; Xue, B. Effects of Dietary Energy Levels on Growth Performance, Nutrient Digestibility, Rumen Barrier and Microflora in Sheep. Animals 2024, 14, 2525. [Google Scholar] [CrossRef]
  21. Wang, Y.; Wang, Q.; Dai, C.; Li, J.; Huang, P.; Li, Y.; Ding, X.; Huang, J.; Hussain, T.; Yang, H. Effects of dietary energy on growth performance, carcass characteristics, serum biochemical index, and meat quality of female Hu lambs. Anim. Nutr. 2020, 6, 499–506. [Google Scholar] [CrossRef]
  22. Yang, C.; Zhang, J.; Ahmad, A.A.; Bao, P.; Guo, X.; Long, R.; Ding, X.; Yan, P. Dietary Energy Levels Affect Growth Performance through Growth Hormone and Insulin-Like Growth Factor 1 in Yak (Bos grunniens). Animals 2019, 9, 39. [Google Scholar] [CrossRef] [PubMed]
  23. Sileshi, G.; Mitiku, E.; Mengistu, U.; Adugna, T.; Fekede, F. Effects of dietary energy and protein levels on nutrient intake, digestibility, and body weight change in Hararghe highland and Afar sheep breeds of Ethiopia. J. Adv. Vet. Anim. Res. 2021, 8, 185–194. [Google Scholar] [CrossRef] [PubMed]
  24. Jing, X.P.; Zhou, J.W.; Wang, W.J.; Degen, A.A.; Guo, Y.M.; Kang, J.P.; Xu, W.X.; Liu, P.P.; Yang, C.; Shi, F.Y.; et al. Tibetan sheep are better able to cope with low energy intake than Small-tailed Han sheep due to lower maintenance energy requirements and higher nutrient digestibilities. Anim. Feed Sci. Technol. 2019, 254, 114200. [Google Scholar] [CrossRef]
  25. Huo, L.M.; Cao, Y.F.; Gao, Y.X.; Li, Y.; Li, Q.F.; Li, J.G. The Effect of Dietary Energy Levels on Growth Performance and Rumen Fermentation in Chinese Holstein Heifers. Acta Vet. Zootech. Sin. 2019, 50, 332–342. [Google Scholar]
  26. Schroeder, G.F.; Titgemeyer, E.C.; Awawdeh, M.S.; Smith, J.S.; Gnad, D.P. Effects of energy source on methionine utilization by growing steers1. J. Anim. Sci. 2006, 84, 1505–1511. [Google Scholar] [CrossRef]
  27. Hanlon, M.; Moorby, J.; McConochie, H.; Foskolos, A. Effects of addition of nutritionally improved straw in dairy cow diets at 2 starch levels. J. Dairy Sci. 2020, 103, 10233–10244. [Google Scholar] [CrossRef]
  28. Liu, J.W.; Zhang, X.L.; Li, X.; Wang, L.; Qin, L.H.; Ban, Z.B.; Wu, J.; Zhang, G.L.; Wan, F.C. Effects of Dietary Energy Levels on Metabolism and Serum Parameters of Steppe Red Cattle. Sci. Agric. Sin. 2020, 53, 2502–2511. [Google Scholar]
  29. Su, H.; Akins, M.S.; Esser, N.M.; Ogden, R.; Coblentz, W.K.; Kalscheur, K.F.; Hatfield, R. Effects of feeding alfalfa stemlage or wheat straw for dietary energy dilution on nutrient intake and digestibility, growth performance, and feeding behavior of Holstein dairy heifers. J. Dairy Sci. 2017, 100, 7106–7115. [Google Scholar] [CrossRef]
  30. Liu, H.; Chen, Y.; Li, Z.; Li, Y.; Lai, C.; Piao, X.; Milgen, J.; Wang, F. Metabolizable energy requirement for maintenance estimated by regression analysis between body weight gain and metabolizable energy intake in growing pigs. Asian-Australas. J. Anim. Sci. 2019, 32, 1397. [Google Scholar] [CrossRef]
  31. Hu, H.W.; Cui, H.T.; Zhao, Y.J. Study on Energy Requirement of Huanghuai Goat Ram in Growing Period. China Herbiv. Sci. 2024, 44, 52–58. [Google Scholar]
  32. Subepang, S.; Suzuki, T.; Phonbumrung, T.; Sommart, K. Enteric methane emissions, energy partitioning, and energetic efficiency of zebu beef cattle fed total mixed ration silage. Asian-Australas. J. Anim. Sci. 2018, 32, 548–555. [Google Scholar] [PubMed]
  33. Gao, H.; Yu, Y.; Yin, Y.; Zhao, Q.; Wu, H.; Li, H.; Chen, L.; Lv, Y.; Zhang, Y.; Leng, J. Study on Energy Requirement of Yunshang Black Goat Growing and Fattening Rams. Chin. J. Anim. Nutr. 2023, 35, 1740–1748. [Google Scholar]
  34. Bao, K.; Wang, X.; Wang, K.; Li, G.; Liu, H. Energy and Protein Requirements for the Maintenance of Growing Male Sika Deer (Cervus nippon). Front. Vet. Sci. 2021, 8, 745426. [Google Scholar] [CrossRef] [PubMed]
  35. Cui, X.; Wang, Z.; Yan, T.; Chang, S.; Hou, F. Modulation of feed digestibility, nitrogen metabolism, energy utilisation and serum biochemical indices by dietary Ligularia virgaurea supplementation in Tibetan sheep. Animal 2023, 17, 100910. [Google Scholar]
  36. Ren, J.G.; Guan, P.; Huang, J.Z.; Sheng, Y.Y.; Bao, T.Z.; Ma, Z.P.; Qian, W.X. Effects of Dietary Energy Level on Growth-fattening Performance and Serum Biochemical Indices of Angus Bulls. China Anim. Husb. Vet. Med. 2023, 50, 966–976. [Google Scholar]
  37. Zhang, Q.X.; Gao, A.Q.; Shi, X.X.; Niu, Z.Y.; Li, G.; Xing, C.; Zhu, Y.X.; Zhang, R.H. Effect of Different Linseed Oil Forms Supplementation on Growth Performance, Slaughter Performance and Serum Biochemical Indexes of Mutton Sheep. China Anim. Husb. Vet. Med. 2018, 45, 415–421. [Google Scholar]
  38. Ley, R.E.; Lozupone, C.A.; Hamady, M.; Knight, R.; Gordon, J.I. Worlds within worlds: Evolution of the vertebrate gut microbiota. Nat. Rev. Microbiol. 2008, 6, 776–788. [Google Scholar]
  39. Cheng, Z.; Liu, J.; Yu, Y.; Liu, W.; Li, X.; Li, F.; Zang, C.; Yang, K. Niacin alters ruminal microbial composition and metabolites in sheep fed a high-concentrate diet. Front. Vet. Sci. 2025, 12, 1510617. [Google Scholar]
  40. Evans, N.J.; Brown, J.M.; Murray, R.D.; Getty, B.; Birtles, R.J.; Hart, C.A.; Carter, S.D. Characterization of Novel Bovine Gastrointestinal Tract Treponema Isolates and Comparison with Bovine Digital Dermatitis Treponemes. Appl. Environ. Microbiol. 2011, 77, 138–147. [Google Scholar] [CrossRef]
  41. Lv, X.; Cui, K.; Qi, M.; Wang, S.; Diao, Q.; Zhang, N. Ruminal Microbiota and Fermentation in Response to Dietary Protein and Energy Levels in Weaned Lambs. Animals 2020, 10, 109. [Google Scholar] [CrossRef]
  42. Thomas, F.; Hehemann, J.-H.; Rebuffet, E.; Czjzek, M.; Michel, G. Environmental and Gut Bacteroidetes: The Food Connection. Front. Microbiol. 2011, 2, 93. [Google Scholar] [CrossRef] [PubMed]
  43. Zhang, J.; Zheng, N.; Shen, W.; Zhao, S.; Wang, J. Synchrony Degree of Dietary Energy and Nitrogen Release Influences Microbial Community, Fermentation, and Protein Synthesis in a Rumen Simulation System. Microorganisms 2020, 8, 231. [Google Scholar] [CrossRef] [PubMed]
  44. Gharechahi, J.; Vahidi, M.F.; Bahram, M.; Jianlin, H.; Salekdeh, G.H. Metagenomic analysis reveals a dynamic microbiome with diversified adaptive functions to utilize high lignocellulosic forages in the cattle rumen. ISME J. 2021, 15, 1108–1120. [Google Scholar] [PubMed]
  45. Lan, W.; Yang, C. Ruminal methane production: Associated microorganisms and the potential of applying hydrogen-utilizing bacteria for mitigation. Sci. Total Environ. 2019, 654, 1270–1283. [Google Scholar]
  46. Kotarski, S.F.; Waniska, R.D.; Thurn, K.K. Starch hydrolysis by the ruminal microflora. J. Nutr. 1992, 122, 178–190. [Google Scholar]
  47. Mao, S.Y.; Zhang, R.Y.; Wang, D.S.; Zhu, W.Y. Impact of subacute ruminal acidosis (SARA) adaptation on rumen microbiota in dairy cattle using pyrosequencing. Anaerobe 2013, 24, 12–19. [Google Scholar]
  48. An, D.; Dong, X.; Dong, Z. Prokaryote diversity in the rumen of yak (Bos grunniens) and Jinnan cattle (Bos taurus) estimated by 16S rDNA homology analyses. Anaerobe 2005, 11, 207–215. [Google Scholar]
Figure 1. (a) Operational taxonomic unit (OTU) distribution; (b) Venn diagrams describing the number of OTUs that were distinct and shared across the groups; and (c) rarefaction curves of each treatment at the 97% similarity level. The dietary ME levels of LE, ME, HE, and EHE groups were 6.77, 7.20, 7.72, and 8.20 MJ/d, respectively; the same below (n = 5).
Agriculture 15 00698 g001
Figure 2. Alpha diversity indices of rumen microbiota in Lanzhou fat-tailed sheep fed with different dietary energy levels: ACE (a), Chao 1 (b), Simpson (c), Shannon (d) (n = 5). The red and green dots in (d) indicate outliers.
Agriculture 15 00698 g002aAgriculture 15 00698 g002b
Figure 3. Principal coordinate analysis (PCoA) for four dietary energy treatments. X-axis: first principal component; Y-axis: second principal component (n = 5).
Agriculture 15 00698 g003
Figure 4. Relative bacterial abundance in rumen fluid samples at phylum (a) and genus (b) levels in Lanzhou fat-tailed sheep receiving diets with different energy levels. Only the top 10 phyla and the top 10 genera are shown (n = 5).
Agriculture 15 00698 g004
Table 1. Formulation and chemical composition of the experimental diets (DM basis).
ItemTreatments
LEIEHEEHE
Ingredients, %
Wheat straw59.0052.0047.0042.00
Alfalfa11.0018.0020.0020.00
Corn7.0013.6022.5028.00
Soybean meal8.006.005.504.50
Wheat bran13.178.573.173.67
Sodium bicarbonate0.070.070.070.07
Salt0.760.760.760.76
Premix1.001.001.001.00
Total100100100100
Nutrition level
ME MJ/d6.777.227.728.20
Starch, %13.5022.6433.6336.39
CP10.5210.5310.5210.52
EE, %2.282.272.322.47
ADF, %41.8540.0040.3439.58
NDF, %61.0062.3459.5058.34
Ca, %0.510.640.680.67
P, %0.290.270.230.25
DM = dry matter; CP = crude protein; ME = metabolizable energy; EE = crude fat; ADF = acid detergent fiber; NDF = neutral detergent fiber. The dietary ME levels of LE, IE, HE, and EHE groups were 6.77, 7.20, 7.72, and 8.20 MJ/d, respectively; the same below.
Table 2. Effects of Lanzhou fat-tailed sheep fed with different dietary energy levels on growth performance and apparent digestibility of nutrients (n = 5).
ItemsTreatmentsp-Value
LEIEHEEHE
IBW, kg27.22 ± 2.3027.34 ± 1.0626.70 ± 1.3027.26 ± 1.580.993
FBW, kg27.61 ± 2.2827.78 ± 1.1827.54 ± 1.4828.38 ± 1.520.984
ADG, g/d9.12 ± 10.04 c18.52 ± 4.57 bc42.12 ± 7.42 ab47.0 ± 11.14 a0.019
DMI, kg/d1.26 ± 0.01 d1.31 ± 0.00 c1.34 ± 0.00 b1.36 ± 0.00 a<0.001
Apparent digestibility, %
DM48.03 ± 0.73 c50.50 ± 0.59 b52.61 ± 0.51 a53.00 ± 0.87 a<0.001
CP57.05 ± 1.04 c59.81 ± 1.18b c62.17 ± 1.31 b65.95 ± 0.77 a<0.001
ADF53.75 ± 0.7653.95 ± 0.7753.04 ± 0.4951.94 ± 0.980.248
NDF55.90 ± 0.6756.27 ± 0.5854.69 ± 0.5354.24 ± 0.880.114
IBW = initial body weight; FBW = final body weight; DMI = dry matter intake; DM = dry matter; ADF = acid detergent fiber; NDF = neutral detergent fiber. a, b, c, d = means within the same row with different superscripts are significantly different (p < 0.001).
Table 3. Effects of Lanzhou fat-tailed sheep fed with different dietary energy levels on nitrogen utilization (n = 5).
ItemTreatmentsp-Value
LEIEHEEHE
NI (g/d)10.83 ± 0.07 a10.56 ± 0.03 b10.18 ± 0.03 c10.10 ± 0.01 c<0.001
FN output (g/d)5.75 ± 0.08 a5.27 ± 0.06 b4.91 ± 0.06 c4.75 ± 0.09 c<0.001
UN output (g/d)1.09 ± 0.041.07 ± 0.031.03 ± 0.031.04 ± 0.030.454
MN output (g/d)6.83 ± 0.09 a6.33 ± 0.06 b5.93 ± 0.07 c5.79 ± 0.10 c<0.001
RN (g/d)3.99 ± 0.08 b4.22 ± 0.06 a4.25 ± 0.06 a4.32 ± 0.10 a0.020
Efficiency, %
FN/NI53.10 ± 0.67 a49.91 ± 0.60 b48.17 ± 0.51 bc47.00 ± 0.90 c<0.001
UN/NI10.07 ± 0.3610.11 ± 0.2710.07 ± 0.2610.27 ± 0.270.960
MN/NI63.16 ± 0.71 a60.02 ± 0.58 b58.24 ± 0.59 ab57.27 ± 0.96 b<0.001
RN/NI36.83 ± 0.71 a39.98 ± 0.58 ab41.76 ± 0.59 b42.74 ± 0.96 c<0.001
NI = nitrogen intake; FN = fecal nitrogen; UN = urinary nitrogen; MN = manure nitrogen; RN = retained nitrogen. a, b, c = means within the same row with different superscripts are significantly different (p < 0.050 or <0.001).
Table 4. Effects of Lanzhou fat-tailed sheep fed with different dietary energy levels on energy utilization (n = 5).
ItemTreatmentsp-Value
LEIEHEEHE
GE intake, MJ/d14.59 ± 0.10 d15.26 ± 0.04 c16.01 ± 0.05 b16.74 ± 0.02 a<0.001
FE output, MJ/d6.79 ± 0.11 a6.85 ± 0.09 a6.28 ± 0.08 b5.96 ± 1.11 c<0.001
UE output, MJ/d0.31 ± 0.010.31 ± 0.020.30 ± 0.020.35 ± 0.010.154
CH4-E, MJ/d0.90 ± 0.01 d0.93 ± 0.00 c0.97 ± 0.00 b1.01 ± 0.00 a<0.001
DE, MJ/d7.80 ± 0.11 d8.40 ± 0.09 c9.73 ± 0.07 b10.79 ± 0.11 a<0.001
ME, MJ/d6.59 ± 0.11 d7.16 ± 0.09 c8.46 ± 0.07 b9.43 ± 0.11 a<0.001
Efficiency
DE/GE intake, %53.46 ± 0.69 c55.08 ± 0.58 c60.77 ± 0.46 b64.42 ± 0.64 a<0.001
ME/GE intake, %45.18 ± 0.70 d46.92 ± 0.57 c52.82 ± 0.45 b56.35 ± 0.64 a<0.001
ME/DE84.42 ± 0.28 c85.15 ± 0.23 b86.90 ± 0.17 a87.43 ± 0.17 a<0.001
FE/GE intake, %46.54 ± 0.69 c44.92 ± 0.58 b39.23 ± 0.46 a35.58 ± 0.64 a<0.001
UE/GE intake, %2.11 ± 0.092.04 ± 0.111.89 ± 0.092.06 ± 0.080.357
CH4-E/GE intake, %6.17 ± 0.01 a6.11 ± 0.00 b6.06 ± 0.00 c6.02 ± 0.00 d<0.001
GE = gross energy; FE = fecal energy; UE = urinary energy; CH4-E = methane energy; DE = digestible energy; ME = metabolizable energy. a, b, c, d = means within the same row with different superscripts are significantly different (p < 0.001).
Table 5. Effects of Lanzhou fat-tailed sheep fed with different dietary energy levels on serum biochemical indices (n = 5).
ItemTreatmentsp-Value
LEIEHEEHE
TP (g/L)68.46 ± 1.0569.04 ± 2.9769.88 ± 0.9670.14 ± 2.300.929
ALB (g/L)26.02 ± 0.3826.84 ± 0.6325.00 ± 1.1325.36 ± 1.020.481
GLB (g/L)42.20 ± 2.5342.44 ± 1.0943.32 ± 0.8445.14 ± 1.310.559
ALB/GLB ratio0.38 ± 0.010.39 ± 0.010.36 ± 0.010.36 ± 0.010.445
UREA (mmol/L)7.77 ± 0.397.08 ± 0.447.06 ± 0.367.35 ± 0.660.704
GLU (mmol/L)1.63 ± 0.201.68 ± 0.141.72 ± 0.051.90 ± 0.550.923
TG (mmol/L)0.20 ± 0.010.26 ± 0.030.21 ± 0.030.24 ± 0.030.320
TC (mmol/L)1.64 ± 0.152.03 ± 0.121.90 ± 0.221.99 ± 0.140.373
TP = total protein; ALB = albumin; GLB = globulin; UREA = urea nitrogen; GLU = glucose; TC = total cholesterol; TG = triglyceride.
Table 6. Effects of Lanzhou fat-tailed sheep fed with different dietary energy levels on the phylum levels of the bacteria community (n = 5).
ItemTreatmentsp-Value
LEIEHEEHE
Firmicutes56.26 ± 3.1151.48 ± 1.8250.89 ± 3.1549.82 ± 1.520.312
Bacteroidota28.79 ± 1.7534.99 ± 1.7034.70 ± 2.6734.44 ± 2.060.149
Proteobacteria9.14 ± 1.516.21 ± 1.628.72 ± 0.899.95 ± 2.140.415
Verrucomicrobiota2.86 ± 0.48 ab3.37 ± 1.11 a1.94 ± 0.12 c2.17 ± 0.26 bc0.010
Patescibacteria1.22 ± 0.141.45 ± 0.361.57 ± 0.211.67 ± 0.250.635
Cyanobacteria0.68 ± 0.080.77 ± 0.170.56 ± 0.140.51 ± 0.090.460
Spirochaetota0.31 ± 0.100.59 ± 0.140.47 ± 0.050.44 ± 0.080.305
Planctomycetota0.00 ± 0.000.56 ± 0.230.46 ± 0.190.39 ± 0.260.251
Desulfobacterota0.24 ± 0.06 a0.12 ± 0.02 b0.14 ± 0.04 ab0.15 ± 0.02 ab0.034
unclassified_Bacteria0.10 ± 0.020.12 ± 0.020.20 ± 0.070.15 ± 0.030.349
The dietary ME levels of LE, ME, HE, and EHE groups were 6.77, 7.20, 7.72, and 8.20 MJ/d, respectively (n = 5). a, b, c = means within the same row with different superscripts are significantly different (p < 0.05).
Table 7. Effects of Lanzhou fat-tailed sheep fed with different dietary energy levels on the genus levels of the bacteria community (n = 5).
ItemTreatmentsp-Value
LEIEHEEHE
Prevotella14.08 ± 0.9916.97 ± 1.5818.56 ± 2.5216.06 ± 1.800.390
uncultured_rumen_bacterium12.83 ± 0.9314.04 ± 1.0113.04 ± 1.2313.26 ± 0.670.832
Rikenellaceae_RC9_gut_group8.88 ± 0.879.28 ± 1.748.23 ± 0.5610.06 ± 0.350.651
Christensenellaceae_R_7_group7.54 ± 2.015.21 ± 0.827.03 ± 0.816.03 ± 0.460.528
Pseudomonas5.89 ± 1.633.01 ± 1.105.98 ± 0.817.90 ± 2.380.231
Succiniclasticum3.34 ± 0.48 ab2.18 ± 0.41 b4.07 ± 0.73 a4.05 ± 0.54 a0.027
Saccharofermentans2.83 ± 0.222.11 ± 0.412.52 ± 0.332.66 ± 0.340.485
Lachnospiraceae_XPB1014_group3.05 ± 0.462.23 ± 0.482.64 ± 1.191.58 ± 0.350.514
Quinella0.42 ± 1.820.73 ± 0.532.15 ± 1.142.32 ± 2.120.472
Butyrivibrio5.59 ± 0.482.00 ± 0.351.98 ± 0.262.13 ± 0.400.648
The dietary ME levels of LE, ME, HE, and EHE groups were 6.77, 7.20, 7.72, and 8.20 MJ/d, respectively (n = 5). a, b = means within the same row with different superscripts are significantly different (p < 0.05).
Disclaimer/Publisher’s Note: The statements, opinions and data contained in all publications are solely those of the individual author(s) and contributor(s) and not of MDPI and/or the editor(s). MDPI and/or the editor(s) disclaim responsibility for any injury to people or property resulting from any ideas, methods, instructions or products referred to in the content.

