Abstract
This study presents the evaluation of tools for weed analysis and management to support agroecological practices in organic farming, emphasizing agriculture digitalization, and remote sensing. The main aim was to provide techniques for monitoring and predicting weed spread using multispectral satellite and drone data, without the use of chemical inputs. Key findings indicate that VV and VH channels of Sentinel-1 and B2, B3, B4, and B8 channels of Sentinel-2 are not different regarding tillage, herbicide use, or sowing density. However, RE and NIR channels of drone detected significant variations and proved effectiveness for weediness monitoring. The NIR channel is sensitive to agrotechnical factors such as cultivation type, making it valuable for field monitoring. Correlation and regression analyses revealed that B2, B3, B8 channels of Sentinel-2, and RE and NIR drone channels are the most reliable for predicting weed levels. Conversely, Sentinel-1 showed limited predictive utility. Random effect models confirmed that Sentinel-2 and drone channels can accurately account for site characteristics and timing of weed proliferation. Taken together, these tools provide effective organic weed monitoring systems, enabling rapid identification of problem areas and adjustments in agronomic practices.
Keywords:
agroecological farming; digitalization; drone; herbicide; organic agriculture; sentinel; weediness 1. Introduction
Effective weed management is an important component of sustainable agricultural development in modern organic farming [1]. Organic production requires strong reduction or complete avoidance of the use of chemical herbicides, which stimulates the development of alternative, environmentally safe methods of weed control [2,3,4,5]. The use of remote sensing (RS) data in precision agriculture is an important tool in modern agronomic management. Using RS technologies and geospatial data processing, it becomes possible to conduct accurate monitoring of the state of crops. Such analysis of images from Sentinel-1 and Sentinel-2 satellites and data from drones opens new opportunities for monitoring vegetation, including the assessment of weediness [6].
Using remote sensing for the monitoring of weed infestations on large farms allows us to take effective weed control measures quickly, minimizing the damage they do to maize growth and yield. This is especially important because weed infestations can be very different in space and time, and traditional monitoring is very expensive. In addition, remote sensing allows us to reduce weed control costs due to its timely detection and local control capabilities, which reduces the cost of crop care and the pesticide load on the environment.
RS data might be also used to identify areas with extensive weediness and analyze the effectiveness of herbicide-free agrotechnical methods. Remote sensing is the basis of modern approaches [7,8]. The use of spectral data from satellites or drones allows the analysis of light reflectance by vegetation in near-infrared (NIR) and mid-infrared (MIR) spectral ranges. In addition, the distribution of spectral reflectance can serve as useful indicator of different types of vegetation, including weeds [9,10,11].
The use of vegetation indices such as normalized difference vegetation index (NDVI), soil-adjusted vegetation index (SAVI) and green normalized difference vegetation index (GNDVI) showed high efficiency in separating weeds from crops [12,13,14,15,16]. Recent advances in machine learning and artificial intelligence have significantly improved the accuracy of weed identification [17,18]. Algorithms such as random forest, support vector machines (SVM), and neural networks are effectively used to analyze large amounts of RS data [18,19,20,21].
Maize is extensively used in such types of studies because it is one of the key agricultural crops where the accurate determination of weed infestation level is critical for ensuing high yields. According to earlier studies, the spectral properties of weeds are significantly different from those of maize, which allows effective RS use for their identification [10,22,23]. The use of unmanned aerial vehicles (UAVs) and satellite imagery combined with high-precision indices allows for the assessment of weed infestation levels over large areas with minimal cost [24,25,26]. Mkhize et al. (2024) proved the efficacy of the Sentinel-2 sensor for weed detection during the early growth stages of maize. Sentinel-2 spectrum data attained great accuracy in weed detection, comparable to that of hyperspectral sensors, as the NIR, SWIR, and red-edge bands effectively distinguished between weed-infested plots and maize [27]. Jiao and colleagues (2024) have reviewed the list of effective methods and results of global weed detection for some crops. For maize, they provide a moderate accuracy of weed detection when using a UAV with a multispectral sensor-about 61%, and a rather high one with an RGB sensor of 94.5%. The use of Sentinel-1A and Sentinel-2A with multispectral sensors for maize gives the measurement accuracy of 85–95% with an advantage over random forest recognition algorithms [28].
Organic production of maize requires a tool that helps predict weed levels based on historical data. The model, which includes the coefficient of weediness as an integrated indicator that considers the density and height of grass, broadleaf, and root weeds, can be the basis for planning agrotechnical measures. This allows us to evaluate the effectiveness of weed control measures and to improve management systems in agroecological farming. Thus, the goal of this study was to develop and substantiate new approaches to weed management based on agriculture digitalization and RS technologies. The study was designed to evaluate the possibilities of analyzing the state of weeding using multispectral images from satellites and drones, to identify key factors affecting the level of weediness, and to create a model that will allow effective monitoring and forecasting of weeding without the use of chemicals.
The outcomes of using remote sensing and drone data may be very different, depending on the crop being analyzed, the processing technologies, the density of the plantation, and other technological factors. Therefore, we elucidated the potential applications of Sentinel-1, Sentinel-2, and drone images taken at different spectral channels for determining the extent of weed infestation in areas with varying plowing methods, sowing density, and natural protection, among other factors.
2. Materials and Methods
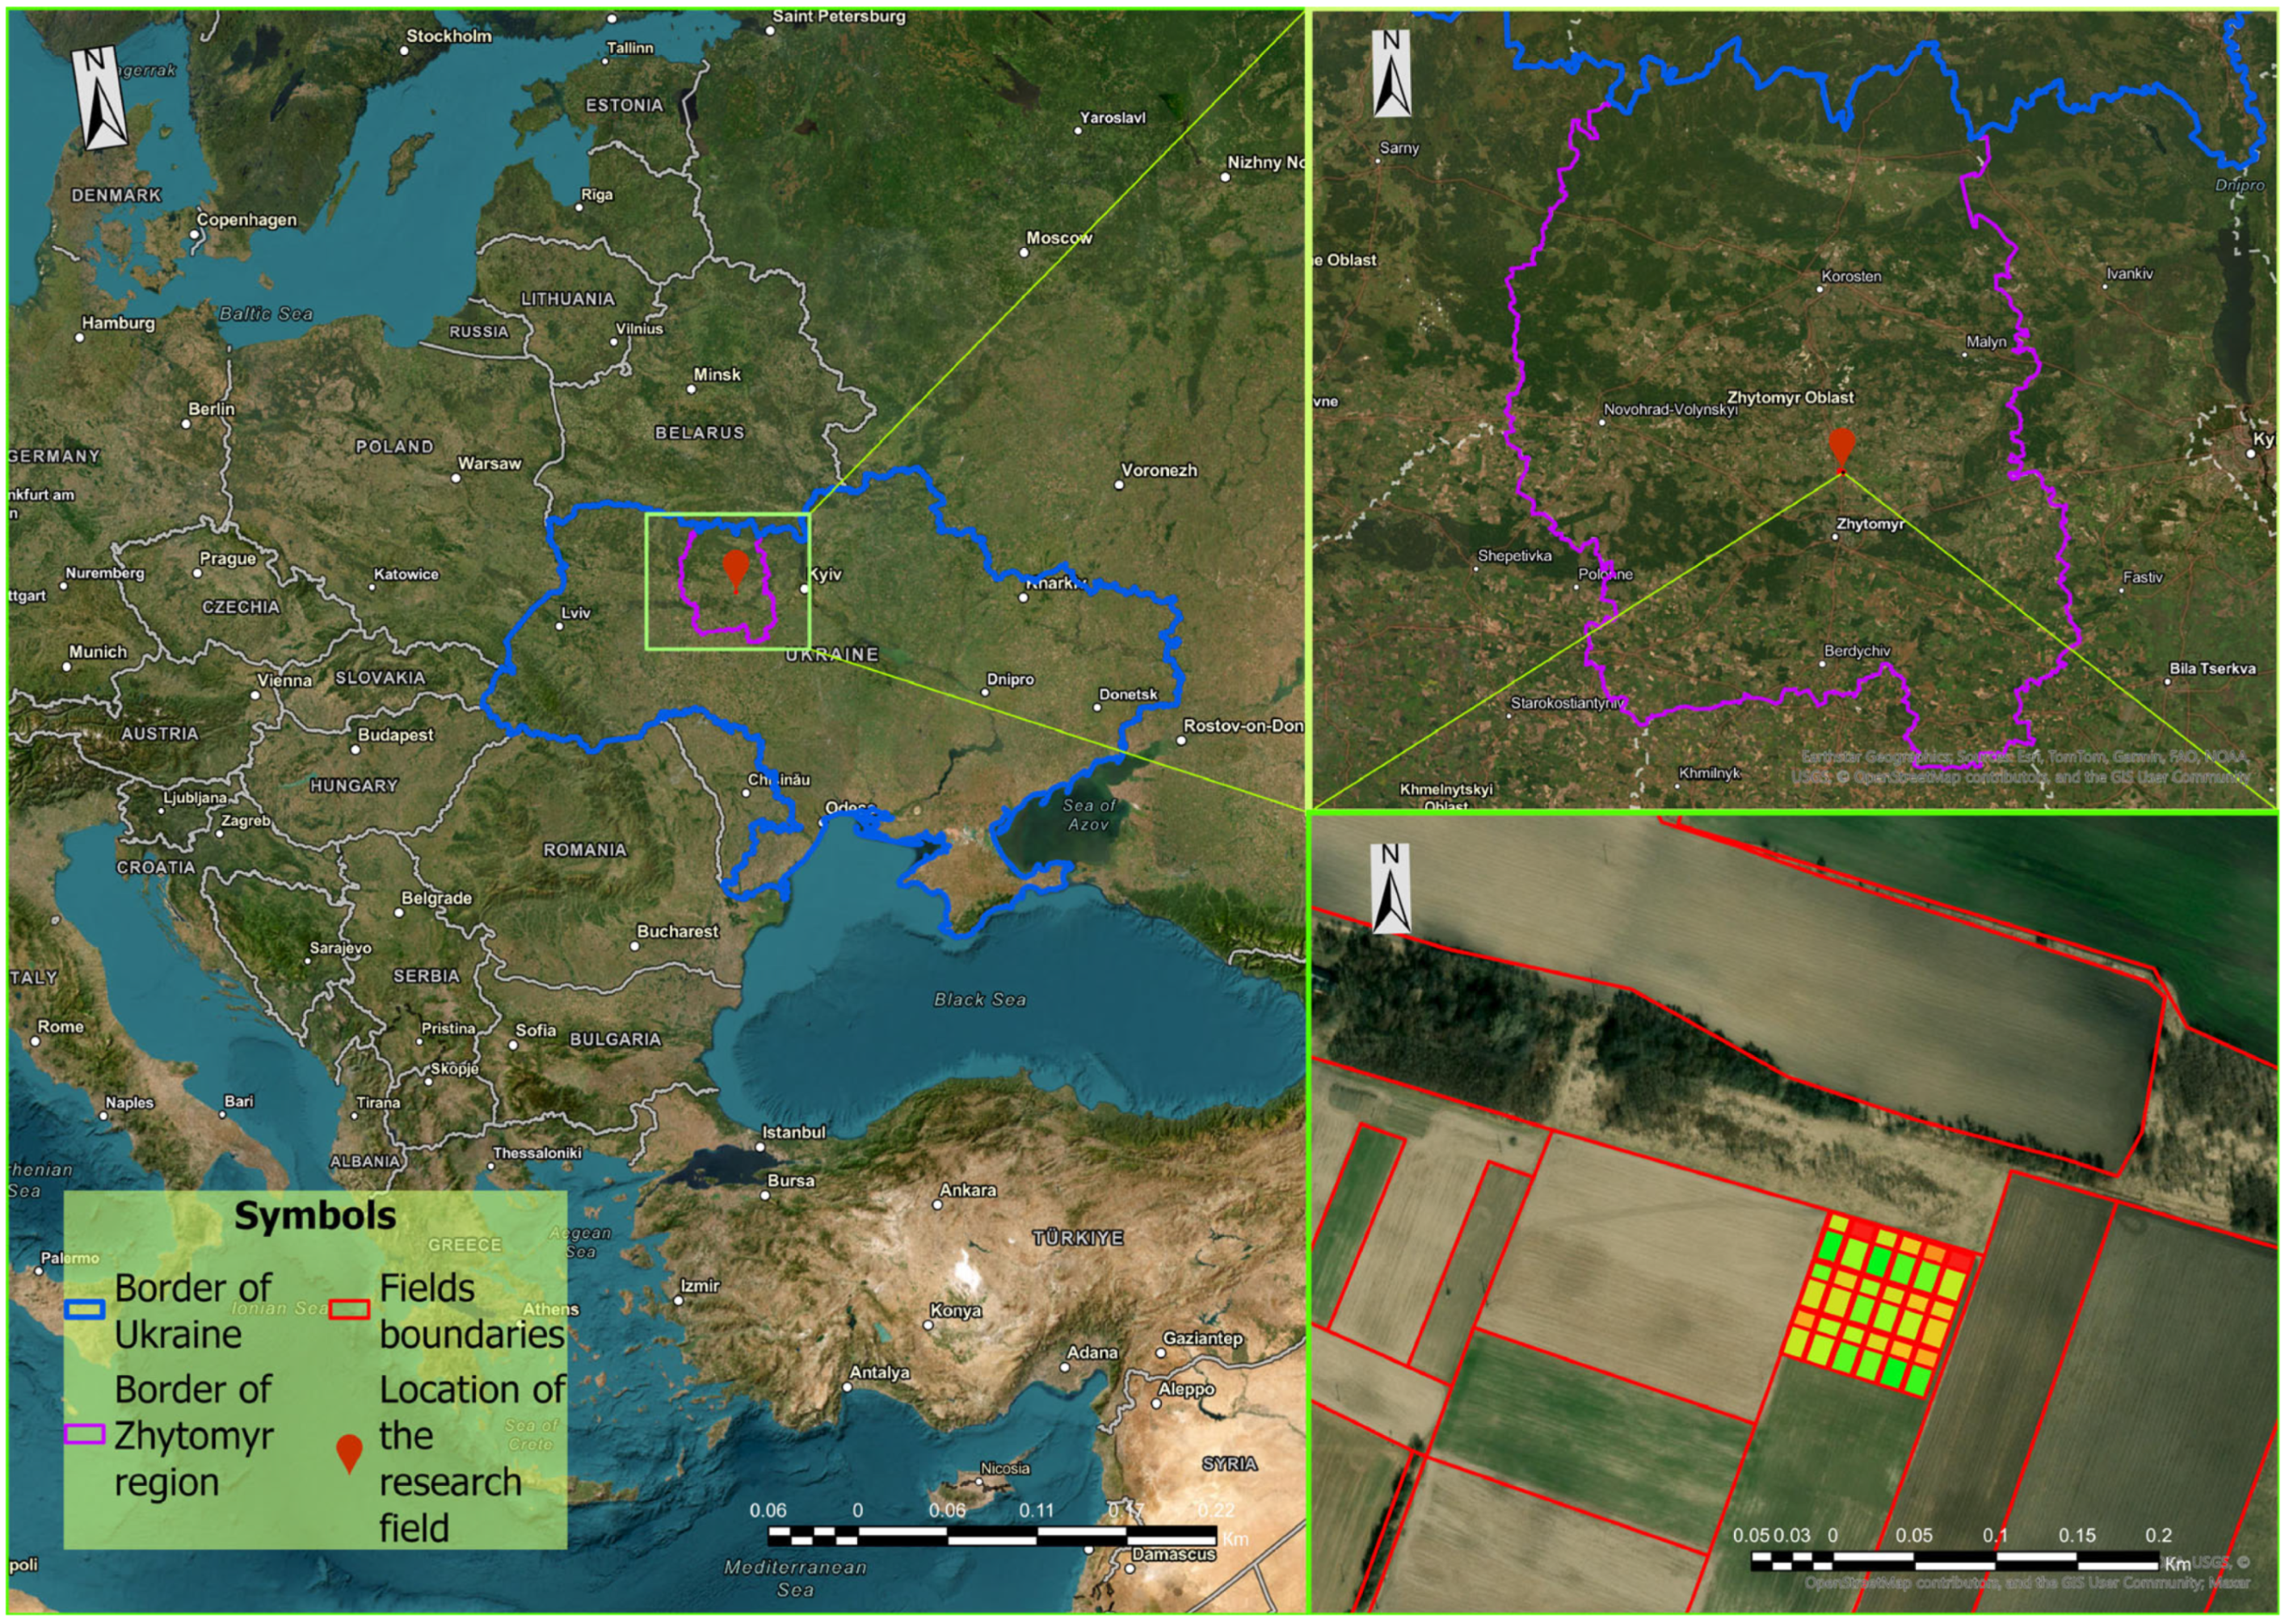
Key characteristics of the study area. The experimental plot was a part of the larger experimental field of the Polissia National University (N 50°26′; E 28°4′) (Figure 1). The site has predominantly Gleic Albic Luvisol (Endoclayic, Cutanic, Differentic, Katogleyic, Ochric type of soil according to PrWRB (2022) [29].

Figure 1.
Location of the study area.
Weather conditions significantly affect the quality of both space shooting and shooting from drones. It should be noted that the weather of the research area is moderately continental with humid conditions. The average annual air temperature is about 7–8 °C, and the average temperature in January is about 5 °C. The summer temperature usually ranges between 18 and 20 °C. The amount of precipitation varies between 600 and 700 mm per year, with most of it falling during the summer period. The relative air humidity is then significantly raised.
Analysis of variance is used to evaluate the effects of factors F1, F2, F3, and their interactions. Experiment was tested in three replications to minimize experimental error and improve result validity.
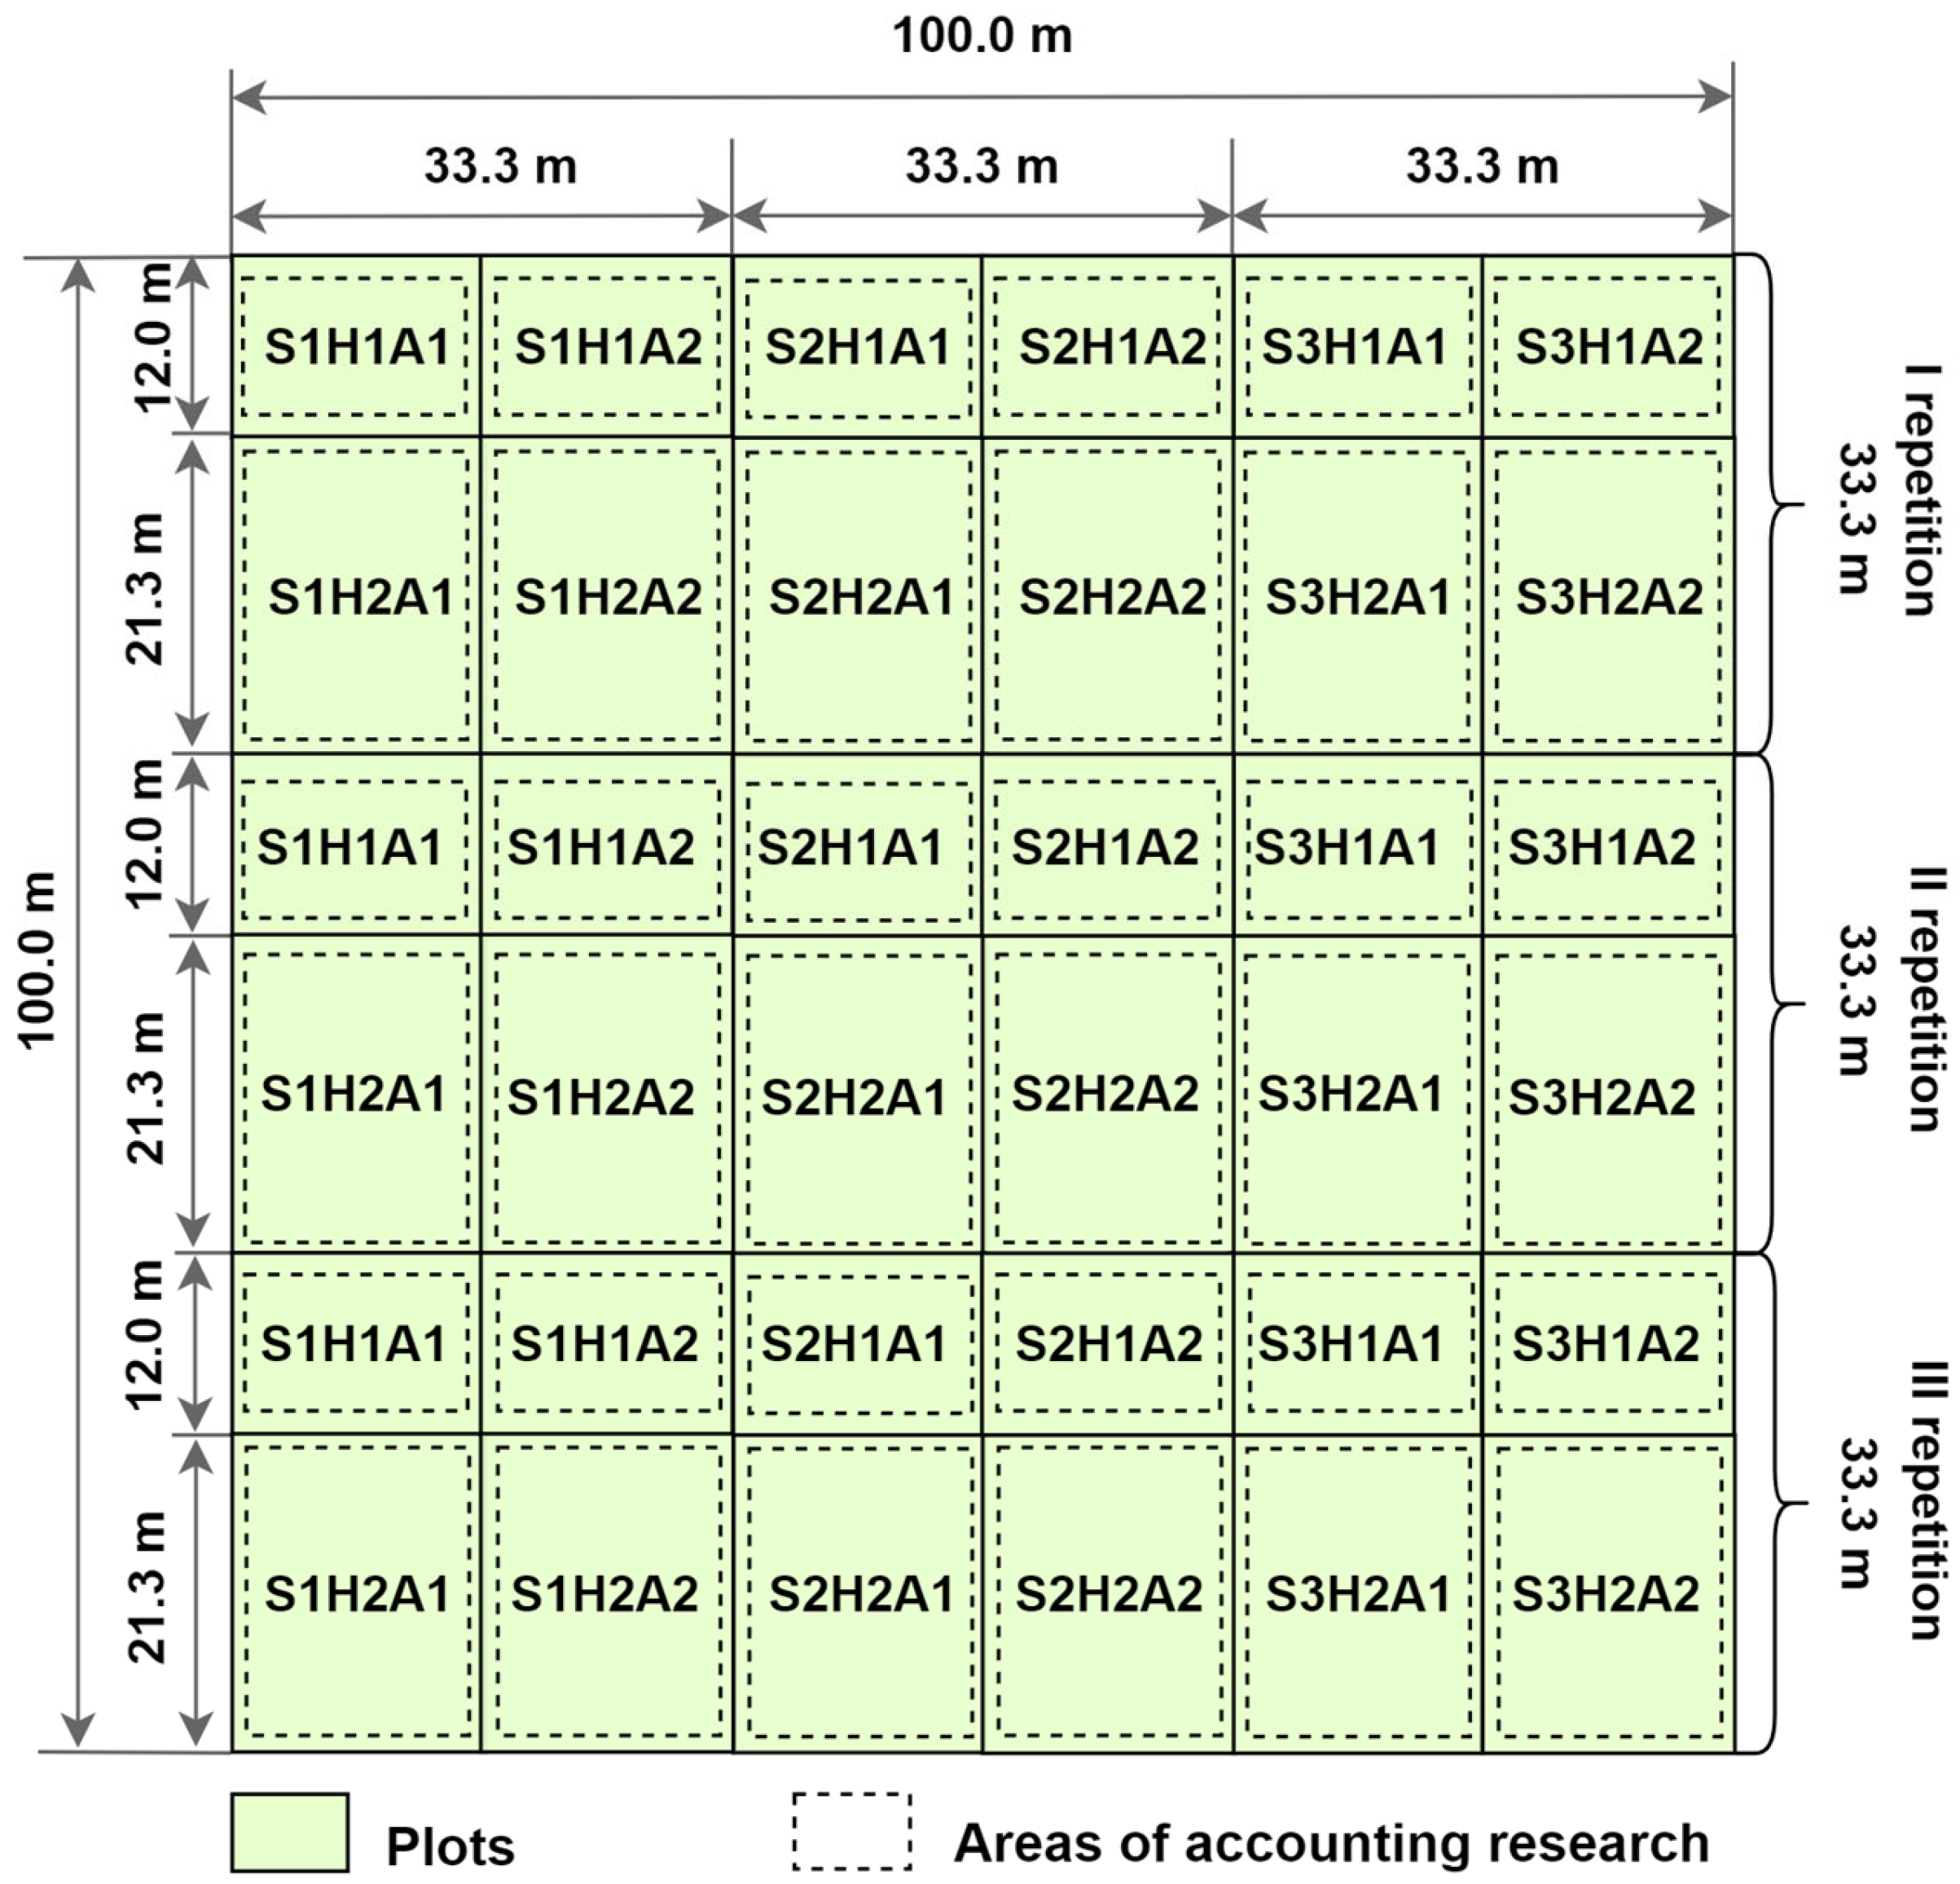
A plot of about 1 hectare was divided into 12 experimental plots with three replications (Figure 2). The research employed a factorial experimental design where F1, F2, F3 were combined. Each combination of F1 × F2 × F3 was implemented in three replicates. The study explored the impact of the following factors: F1—tillage systems: S1—deep soil plowing on 18–20 cm (standard), S2—soil disking on 10–12 cm (AES), S3—soil milling on 5–7 cm (AES); F2—sowing density: A1—1.1 sowing units/ha (standard); A2—1.3 sowing units/ha (AES); F3—herbicide application: H1—herbicide application (standard); H2—herbicide nonapplication (AES).
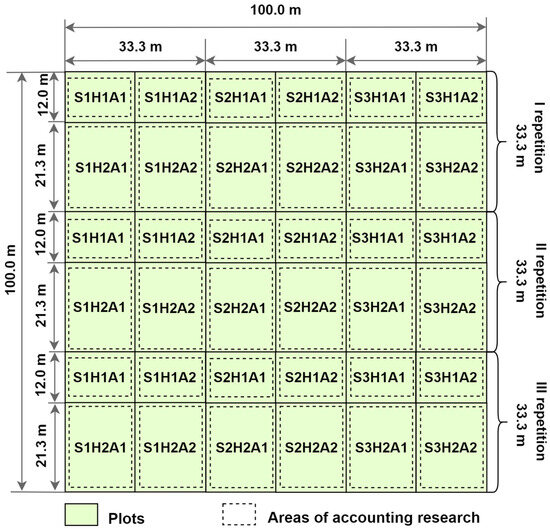
Figure 2.
Experiment design.
Data were collected weekly from each source. During field research, the parameters of main crops, cereal weeds, broadleaf, and short-leaved weeds were measured for height and density in each plot.
To conduct aviation research, copter-type DJI Mavic 3M drone was used with a multispectral camera with the following characteristics: image sensor—1/2.8-inch CMOS, effective pixels—5 Mn; lens—FOV: 73.91° (61.2° × 48.10°); equivalent focal length—25 mm; aperture—f/2.0; fixed focus; image format—TIFF; video resolution—H.264 FHD: 1920 × 1080@30 fps.
Preprocessing of remote sensing data. Images were obtained in the following spectral ranges based on the results from aerial photography: green (G): 560 ± 16 nm; red (R): 650 ± 16 nm; red edge (RE): 730 ± 16 nm; near infrared range (NIR): 860 ± 26 nm. We determined the average values of radiation intensity in the specified spectral ranges, made calculations, and determined the average values of the NDVI vegetation index for each site over a five-week interval during the geoinformation analysis of the obtained images.
Space research was conducted using data received from Sentinel-1 and Sentinel-2 spacecrafts. The satellite channels were chosen based on their ability to provide images with the highest spatial resolution (10 m) and the frequency of spacecraft passing over the research area, which ensured comparable observation conditions. During Sentinel-1 measurements, space images were obtained in the radio wave range in the IWS mode with a resolution of 5 × 5 m, a bandwidth of 20 × 20 km with VV and VH polarization. As a result of data processing, the average values of the radiation intensity for the middle of each section were determined.
Obtaining and preprocessing satellite imagery. Satellite data were acquired using the Copernicus Open Access Hub–an open platform for downloading Sentinel-1 and Sentinel-2 images.
- Sentinel-1 (radar images) were used because of their ability to penetrate clouds and provide consistent data regardless of weather conditions.
- Sentinel-2 (optical images) offered multispectral information, which is critically important for vegetation classification.
Preprocessing of the satellite images was performed in the SNAP (Sentinel Application Platform) environment and included the following steps:
- Orbit correction—applying orbital files to correct satellite positioning.
- Speckle filtering—reducing radar noise for Sentinel-1.
- Atmospheric correction (Sen2Cor)—for Sentinel-2, removing atmospheric effects on spectral characteristics.
- Terrain correction—ensuring accurate image geolocation.
- Cloud masking—automatically masking cloud pixels.
- Image cropping to the boundaries of the study areas (Subset).
The influence of weather conditions was adjusted by choosing the same shooting conditions for satellite images: a similar percentage of cloud cover per image (no more than 10%) and synchronizing the time of the satellite’s passage over the research site and the drone shots.
UAV data processing stage:
1. Alignment of images. The camera position for each frame is determined relative to the others. A preliminary model of the territory coverage is formed (Sparse Point Cloud). The result is a sparse point cloud and correct spatial alignment of the images.
2. Construction of a point cloud.
3. Creation of digital surface and terrain models (DSM and DTM)
4. Creation of an orthophotomap (Orthomosaic).
The reception of images from the Sentinel-2 optical-electronic observation spacecraft was carried out in Band 2 (blue) spectral ranges of 490 nm; Band 3 (green) 560 nm; Band 4 (red) 665 nm; Band 8 (NIR) 842 nm. The processing of the data from the space shooting was carried out according to the methodology like the processing of the data from the aerophotography by spectral channels with the determination of the vegetation index NDVI.
Statistical tools. ANOVA and other tests were used to assess the influence of the tillage system, herbicides, and sowing density on each spectral channel image. The correlation analysis was used to determine the strength and relationship between channels and the integral WI. Regression analysis was used to construct models for the prediction of weed level.
Moran’s I statistic was used to test the spatial structure of the weed index [30].
The Benjamini–Hochberg method was used to correct the false discovery rate (FDR), thereby reducing the risk of false positive results from multiple testing. Only factors that remained statistically significant after correction (Pr_adj_fdr < 0.05) were thought to be reliable.
Database description. To effectively conduct the experiment, we formed a panel database that incorporated the results of physical examinations of plants and soil, data from Sentinel-1 and Sentinel-2 satellites, and indicators from a drone. We collected data for five time points at each experimental site. This ensured the two-dimensionality of the data, enabling the analysis of the object’s individual features and their changes over time. Additionally, we ensured the stability of the sample when forming the panel database. Observation took place in the same areas, which do not change over time in terms of size and type of observation.
The object of the sample was 36 plots, which were formed from one experimental field where maize was sown. The database formation process provided the sample depth, which determined the number of observations for a specific research field. Indeed, we observed each of the 36 sites five times. Three indicators determined the type of plot cultivation, ten indicators stemmed from a visual survey, six indicators derived from data from Sentinel-1 and Sentinel-2 satellites, five indicators came from a drone survey of experimental plots, and the remaining indicators came from soil tests at the experimental site (Table 1).

Table 1.
Database indicators.
Data from various sources, including space and drone images, were processed as shown in Figure 3. The NDVI coefficients were used to create models that help identify how weedy the crops are. The measurements were carried out 5 times at different phases of the maize plant development.
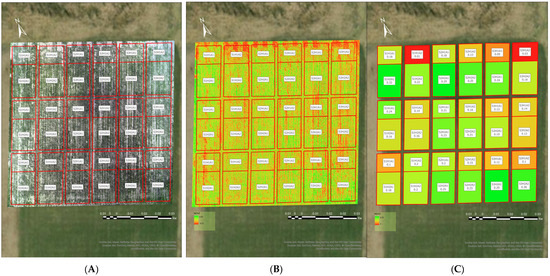
Figure 3.
The procedure for processing space images and images from drones. Flowering stage (shooting from a drone DJI Mavic 3M). (A) image in pseudo-color; (B) NDVI coefficient per pixel distribution; (C) averaged values of the NDVI coefficient by fields.
Consequently, the database using 8460 unique indicators for each research area was formed.
3. Results
3.1. Employing Satellite and Drone Imagery for Weed Identification
Since organic farming is pesticide-free, effective weed management is crucial to ensuring high yields. Using agroecological methods like changing tillage practices, adjusting planting density, and adding natural pest controls might significantly affect weed growth.
However, regional conditions often determine the effectiveness of these methods, as this requires accurate measurements that are taken often. That can only be done by ground monitoring. Modern RS methods, like images from Sentinel-1 and Sentinel-2 satellites and data from drones, allow for rapid checks of field conditions. This research aims to find out if RS data can show how different farming methods, natural materials, and planting amounts affect crops, and if images from Sentinel-1, Sentinel-2, and drones can show these differences.
ANOVA was used to determine the differences in VV, VH, B2, B3, B4, B8, G, R, RE, and NIR channels within different types of tillage (Tillage_system), herbicide application (Herbicides), and sowing density (Sowing_density) (Table 2). An ANOVA test was used to see how important each factor was in the channels and if this information can be used to keep track of weediness levels in organic farming.
Table 2.
Variance analysis (ANOVA) for all channels of Sentinel-1, Sentinel-2 and drones for weed detection.
To account for the risk of false positives due to multiple significance tests, we applied the false discovery rate (FDR) correction using the Benjamini–Hochberg method. The adjusted p-values (Pr_adj_fdr) are reported in Table 2, alongside the unadjusted p-values (Pr(>F)). Additionally, we tested the results using the Bonferroni and Holm–Bonferroni corrections to verify their robustness. These alternative methods showed similar results, with no substantial differences in the identification of significant effects. This confirms that the FDR adjustment is appropriate and reliable, ensuring that the reported significant differences are robust and not caused by random variation.
Consequently, the use of VV and VH channels of Sentinel-1 for all three factors reveals no changes. The most likely reason for this is that the physiological traits of weeds that were recorded in the experimental plot can show where they are in the study projections, both vertical and horizontal. Also, the restricted relationship between Sentinel-1 VV and VH channels and weediness levels arises from the radar signal’s greater sensitivity to surface roughness and wetness rather than to minor vegetation. Weeds may be concealed behind maize cover, diminishing their impact on radar reflectivity, whereas optical channels (B8, NIR) more accurately reflect vegetation biomass. This indicates that these tools are not sufficiently effective for discerning variations in tillage systems, sowing density, and the application of herbicides. We also identified no statistically significant variations concerning all these factors for the Sentinel-2 channels. Sentinel-2 channels demonstrate restricted sensitivity to differing tillage practices and planting techniques.
Using G, R, RE, NIR drone channels to study tillage systems shows a significant difference (p = 0.003) indicating that the tillage system has a strong effect. Herbicide application and sowing density are not statistically significant. Variation in the R channel showed substantial impact of herbicide application with suggesting a possible impact of tillage (p = 0.061).
The RE channel related to herbicides is significant (p = 0.022), demonstrating the impact of herbicide treatment, and three factors are statistically significant for NIR channel: tillage system (p < 0.001), herbicides (p < 0.001), and sowing density (p = 0.002). Thus, the NIR drone channel is the most sensitive and appropriate for detecting the effects of all three agrotechnical parameters.
Thus, we can conclude that the VV and VH channels of Sentinel-1 did not yield statistically significant findings for any of the three criteria, rendering them less useful in discerning differences. We found the same results for bands 2, 3, 4 and 8 of Sentinel-2; these channels also do not show any significant impact on tillage, herbicide, and sowing density parameters.
The G drone channel exhibited sensitivity to the processing method employed. Channel R demonstrated importance for herbicides and approached significance about tillage system, while RE is significant solely for the herbicide component. The NIR channel is the most informative and exhibits high sensitivity to all three parameters, rendering it the most promising for weed monitoring.
After applying the FDR correction, the significance of some factors changed. While raw p-values suggested several potential effects, only the NIR drone channel remained significantly affected by all three agronomic parameters (tillage system, herbicides, sowing density) with strong evidence (adjusted p < 0.05). The G channel also retained significance for the tillage system, while R and RE channels remained significant for herbicides. In contrast, all Sentinel-1 and Sentinel-2 channels were the same after correction, confirming their limited utility for weed monitoring in organic farming.
3.2. Estimation of the Weediness Level in Maize Based on Sentinel-1, Sentinel-2 and Drone Images
This study aims to find out if RS images from these sources can be used to check weed levels by using information from different channels. To meet this goal, we used the same dataset as in Section 3.1.
To accomplish this, we computed the WI, a composite metric that considers the density and height of various weed species. Regression analysis was employed to assess the data and estimate the value of the RS channels of the landscape concerning the integrated WI defined as the cumulative product of the height of all weed species on their projective coverage. Following the formulation of the WI variable, defined as:
WI = (grass weeds, quantity ’ grass weeds density, m2) + (I Dicotyledoneae weeds, quantity ’ I Dicotyledoneae weeds density, m2) + (II Dicotyledoneae weeds, quantity ’ I Dicotyledoneae weeds density, m2) + (Root weeds, quantity ’ Root weeds density, m2).
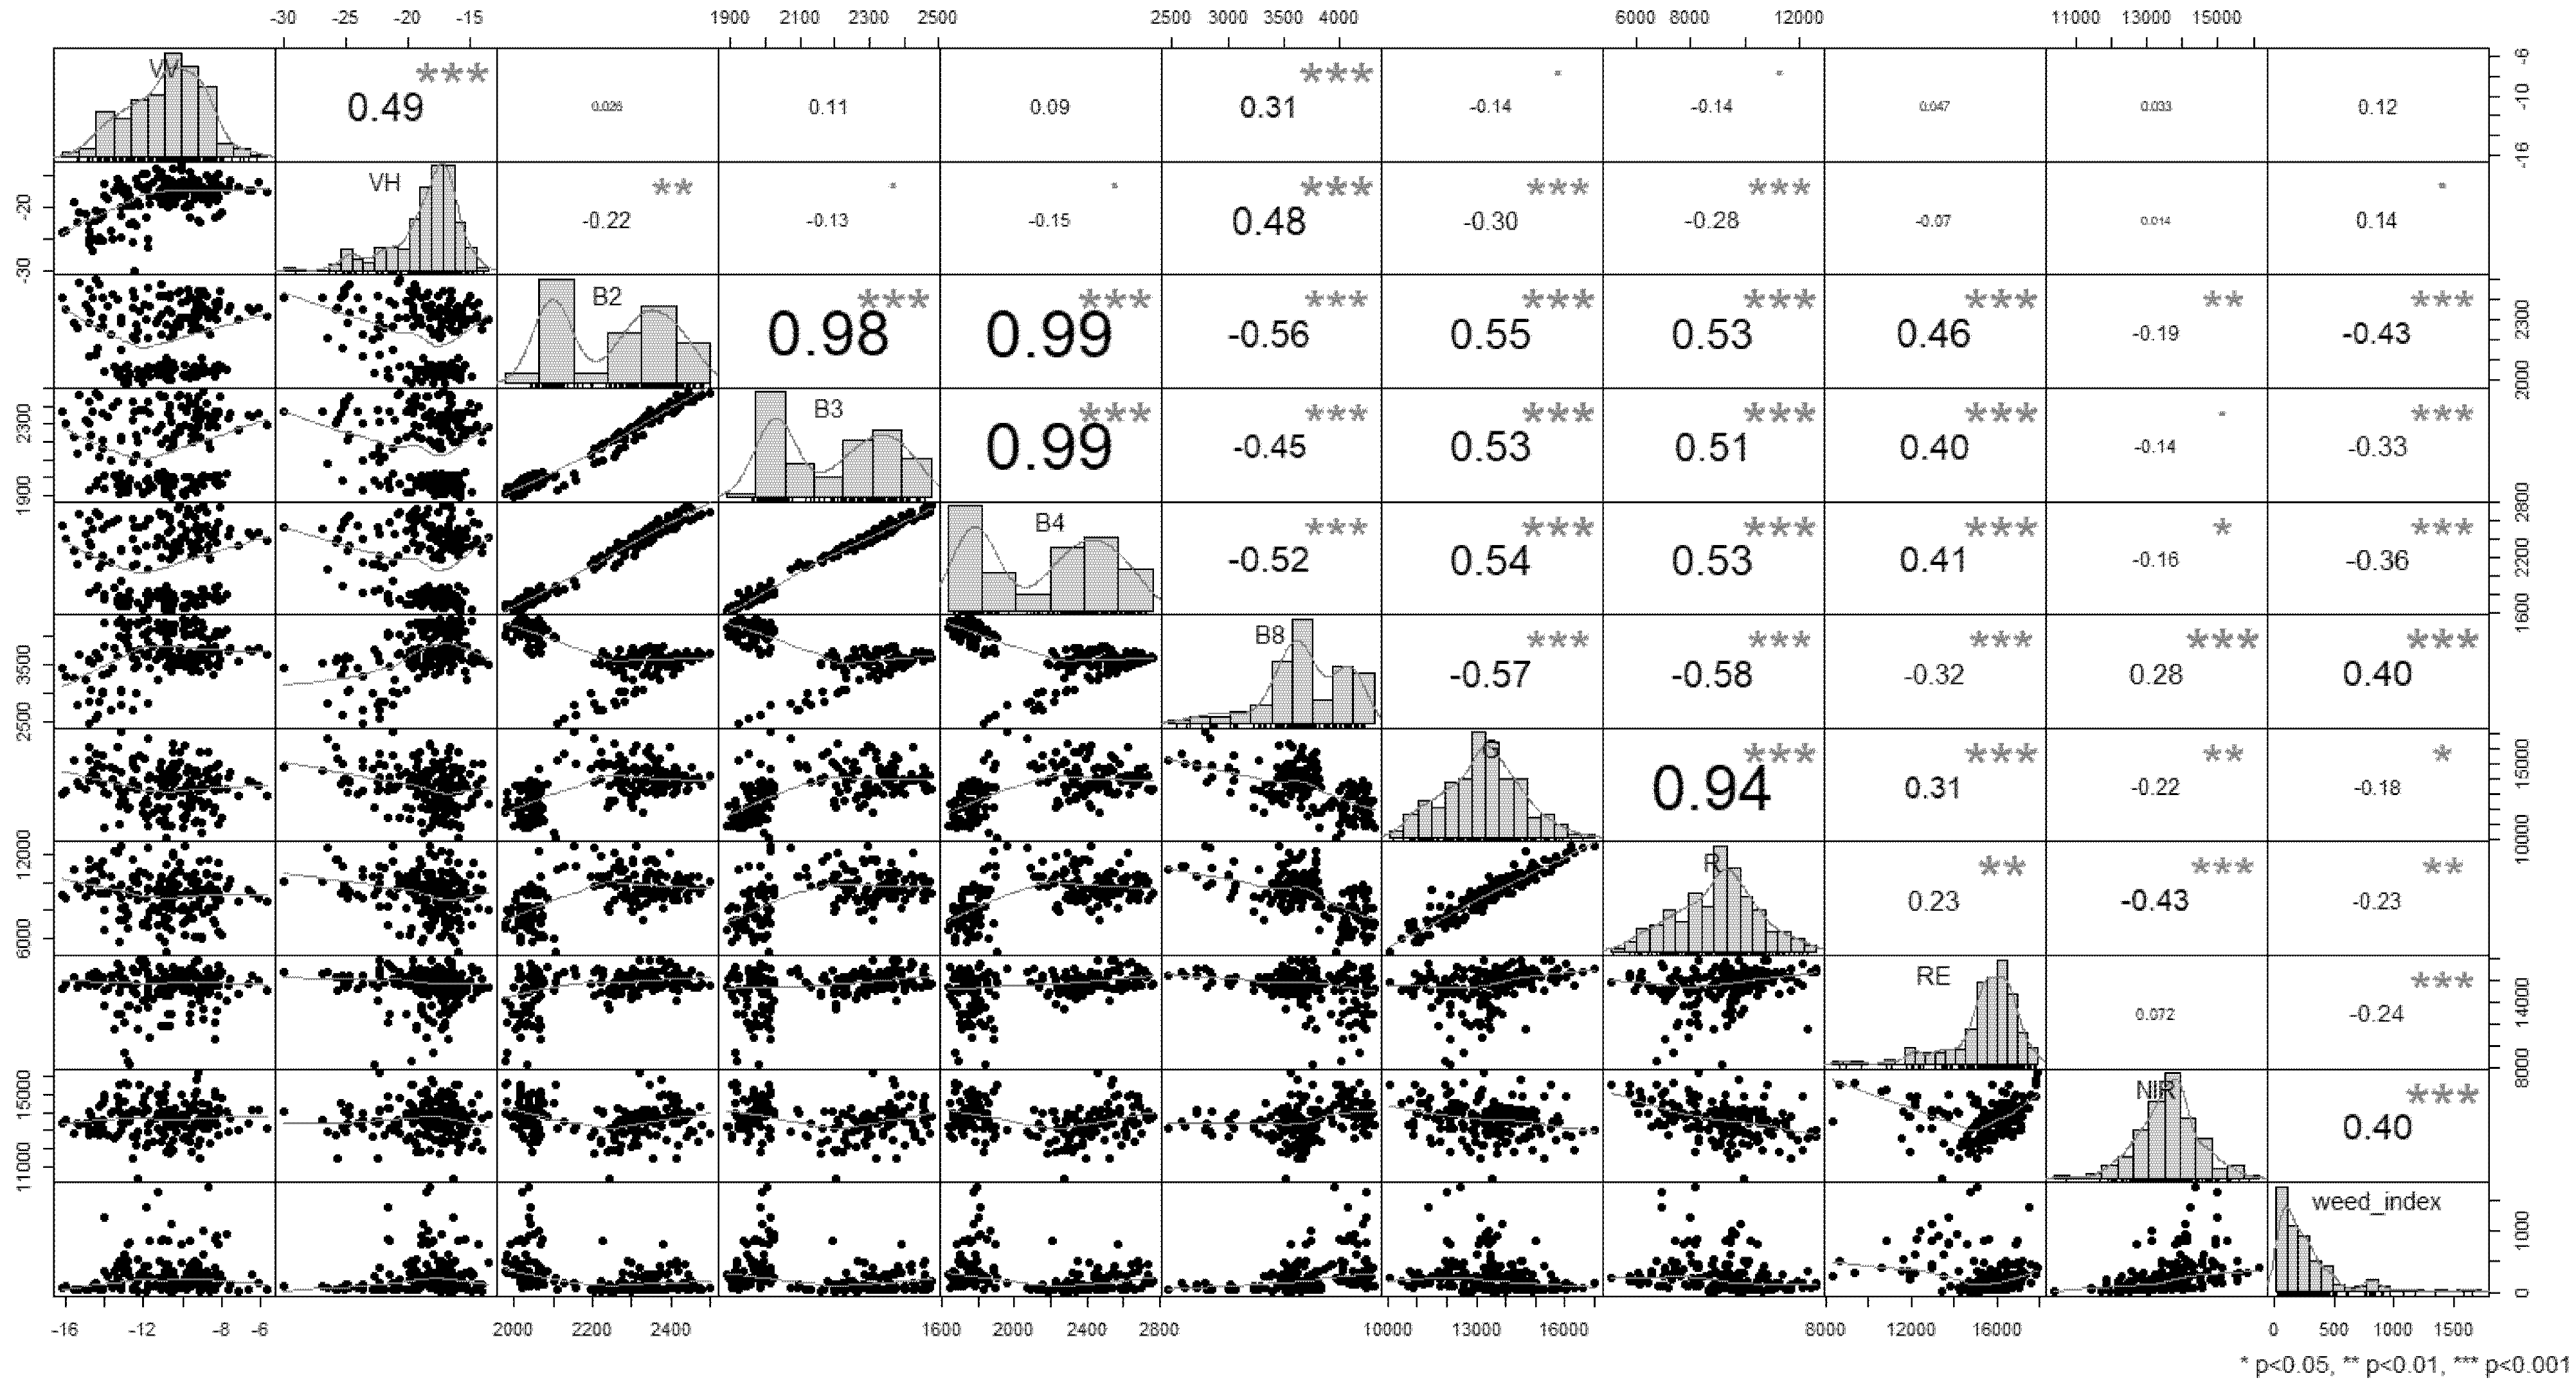
A correlation and regression analysis were conducted between Sentinel-1, Sentinel-2, and drone channels and the level of weediness (Figure 4).

Figure 4.
Correlation analysis between the channels and the level of weediness.
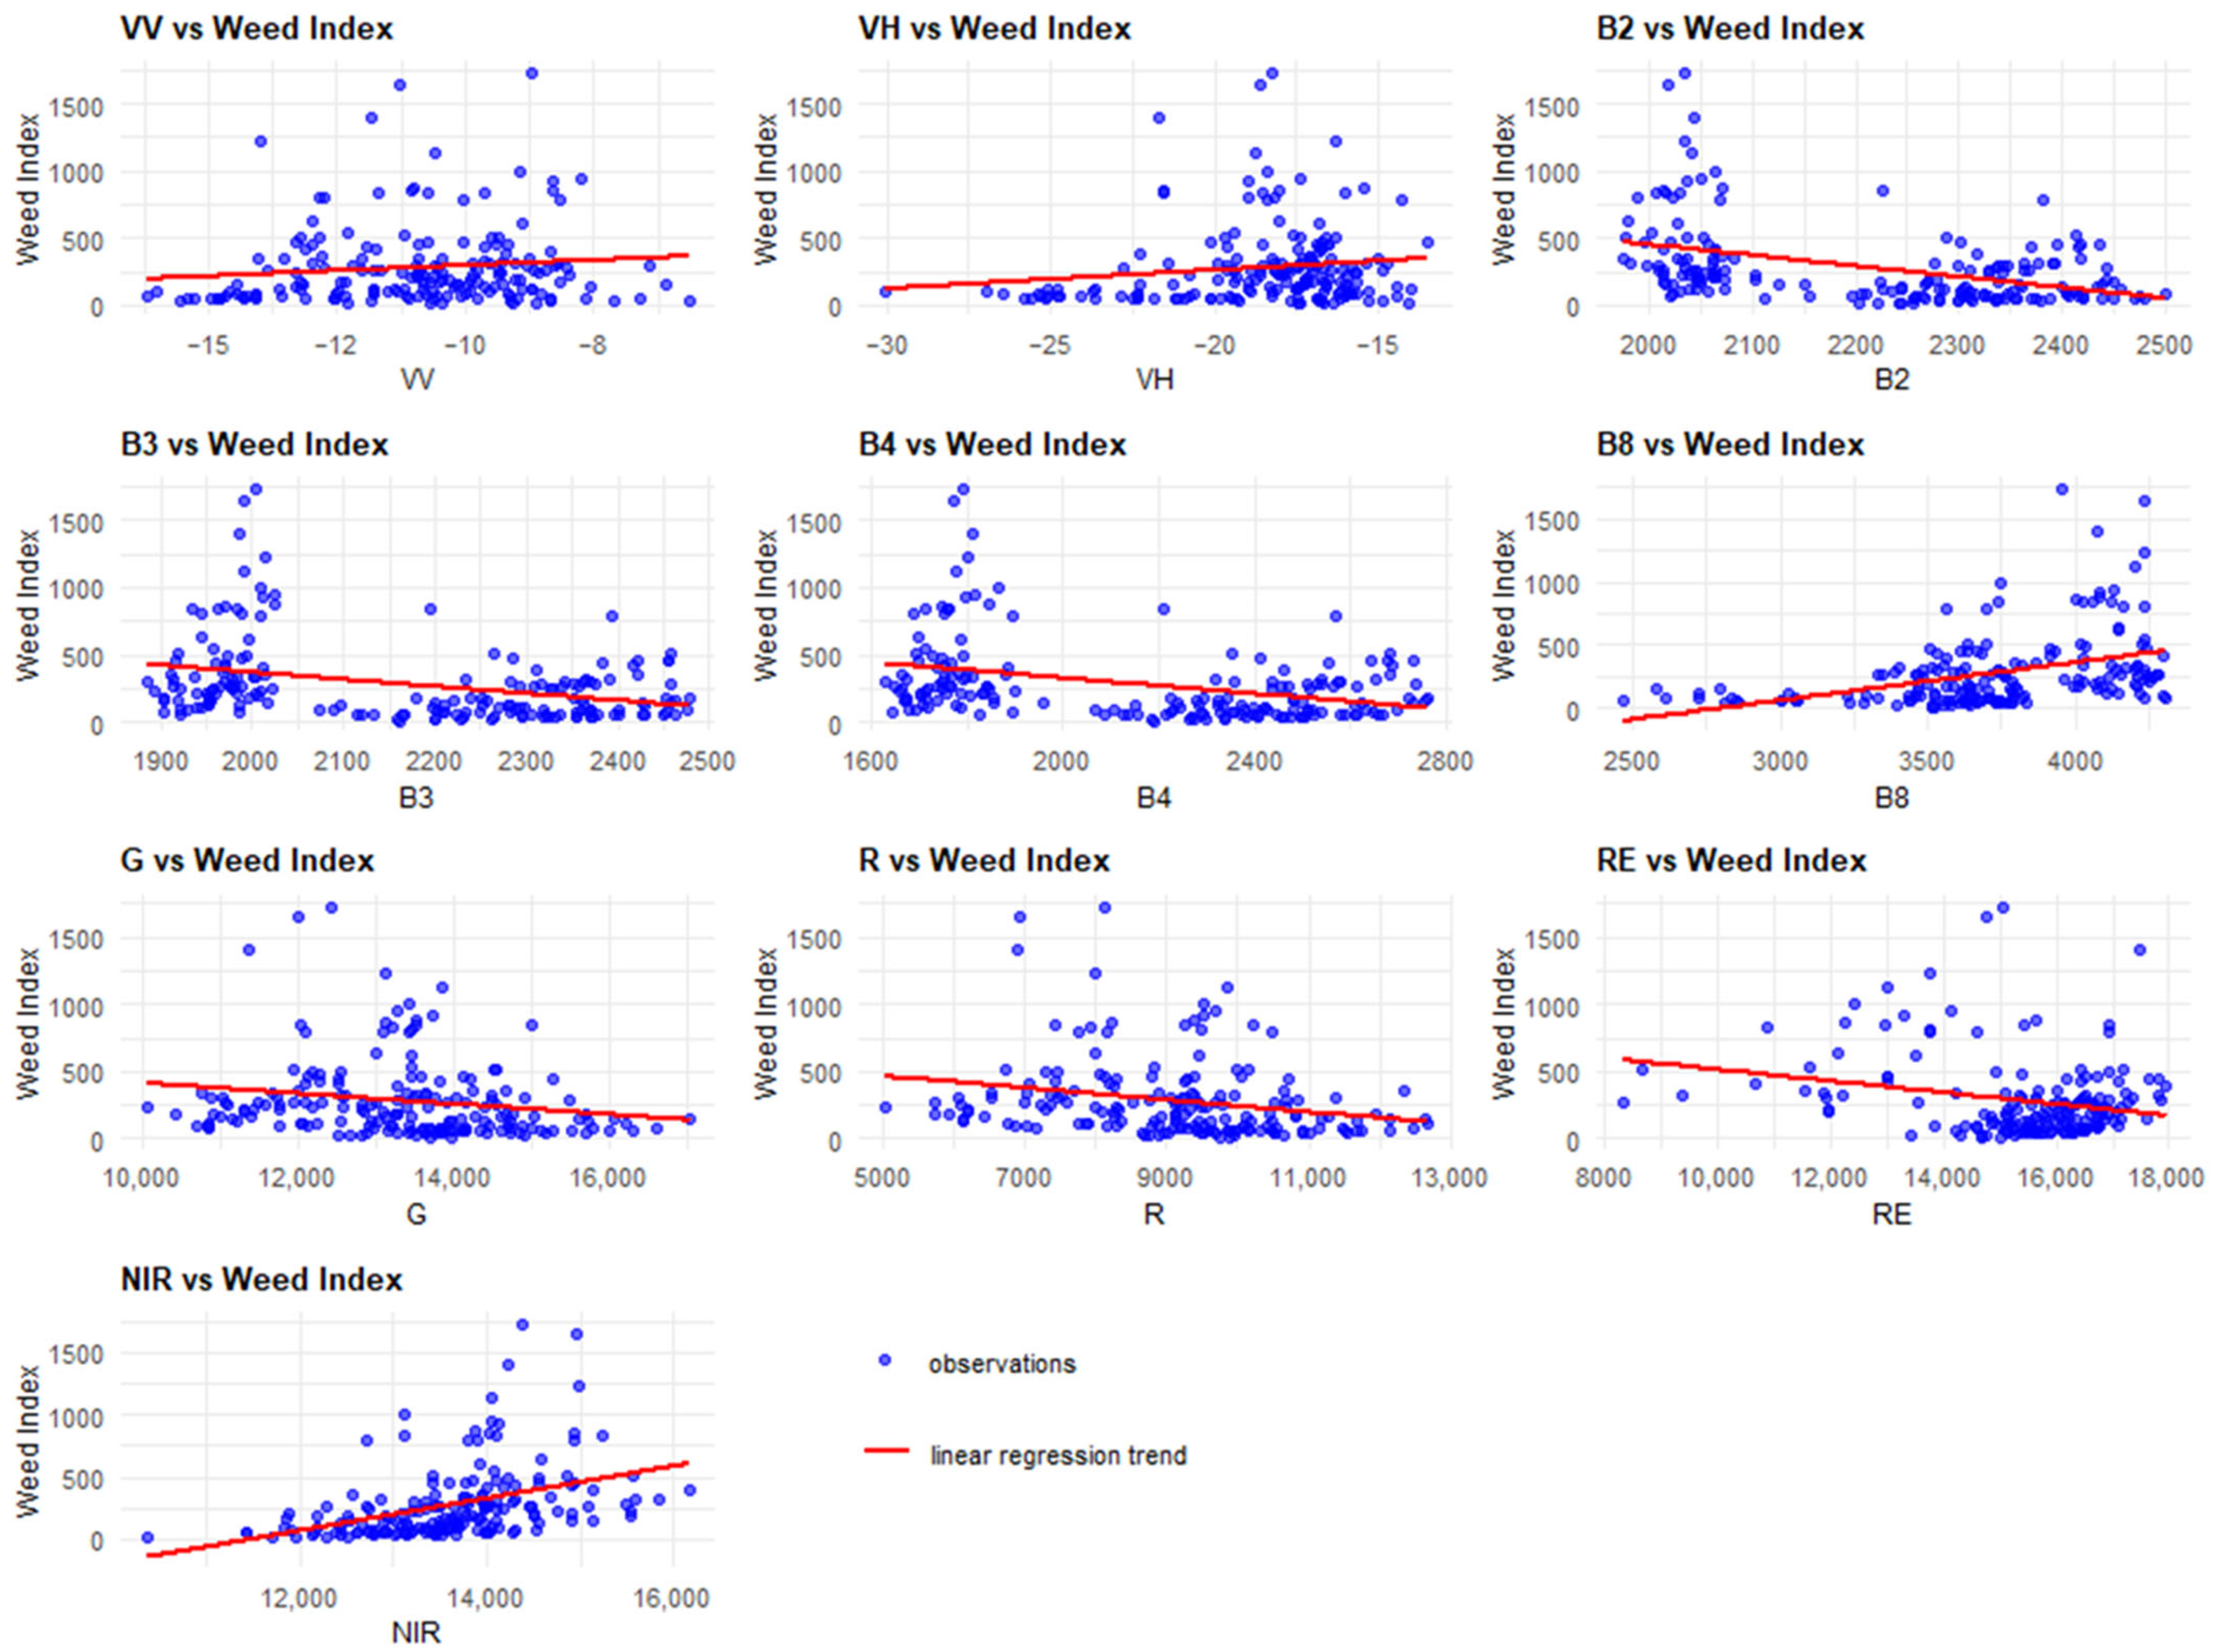
Sentinel-1: channels VV and VH have a weak correlation with WI (0.116 and 0.137, respectively). Channels B2, B3, B4, and B8 of Sentinel-2 exhibit an average correlation level, with B2 (−0.428) and B8 (0.399) being the most informative. The RE drone channel (−0.244) and the NIR channel (0.401) have a more robust correlation with the weediness score, signifying their substantial informativeness. The graphs show the results of the correlation analysis, specifically the above values of the correlation coefficients. They visually illustrate the relationship between each spectral channel and the WI (Figure 5).
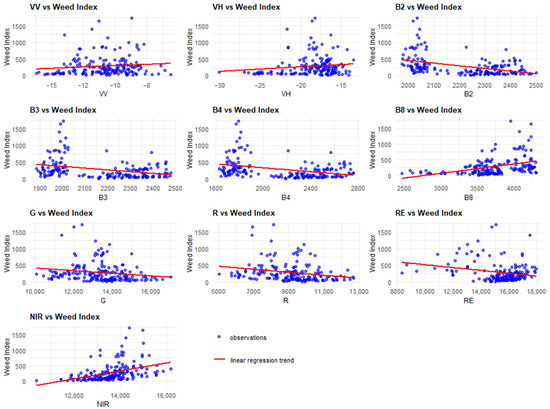
Figure 5.
Correlation analysis between spectral channels and WI.
Regression analysis was used to assess the relationship between WI and spectral channels from Sentinel-1, Sentinel-2, and drones (Table 3).
Table 3.
Regression analysis for Sentinel-1, Sentinel-2, and drone channels.
The comprehensive model includes Sentinel-1, Sentinel-2, and drone channels. The model using all accessible channels (VV, VH from Sentinel-1; B2, B3, B4, B8 from Sentinel-2; G, R, RE, NIR from drones) yields a coefficient of determination R2 = 0.539. It is essential to note that VH (Sentinel-1), B2, B3, and B8 (Sentinel-2), along with RE (drone), are statistically significant (p < 0.05) and validated by the adjusted p-value.
The channels VV, G, and R of drone exhibited insignificance and were marked by considerable error levels, evidenced by the MAE (143.16), MSE (40,229.97), and RMSE (200.57) values. The model demonstrates reliability, evidenced by the low overall p-value (0.0003) and adjusted p-value (0.0004).
Sentinel-1 satellite. The Sentinel-1 data (channels VV and VH) exhibited a R2 value of 0.022. This indicates that these routes can only partially elucidate the variations in weediness. Although the model’s total p-value is negligible (0.0002), the coefficients VV and VH lack statistical significance and therefore do not enhance forecasting accuracy. The elevated MSE (85,273.43) and RMSE (292.02) values indicate that Sentinel-1 channels are ineffective in forecasting weediness.
Sentinel-2 satellite. Significant R2 value of 0.467 was found for Sentinel-2 channels B2, B3, B4, and B8. These channels exhibited statistical significance (p < 0.05). B2 and B3 must be recorded individually, as they possess the highest coefficients regarding modulus and substantially influence the variation in weediness. The error metrics (MAE = 157.13, MSE = 46,443.85, RMSE = 215.51) signify a moderate degree of error. Also, p-value (0.0002) and adjusted p-value (0.0004) indicated the validity of the results and the significance of these channels.
Drone. The model constructed solely on drone channels G, R, RE, and NIR exhibited a R2 value of 0.239. The overall explanatory capacity was inferior to that of Sentinel-2; however, the individual RE and NIR channels (p < 0.05, verified by the adjusted p-value) exhibited statistical significance, indicating a substantial impact on elucidating variations in weediness. The G and R channels did not exert a meaningful influence. The MAE (168.9971) and RMSE (257.59) values indicated considerable model precision.
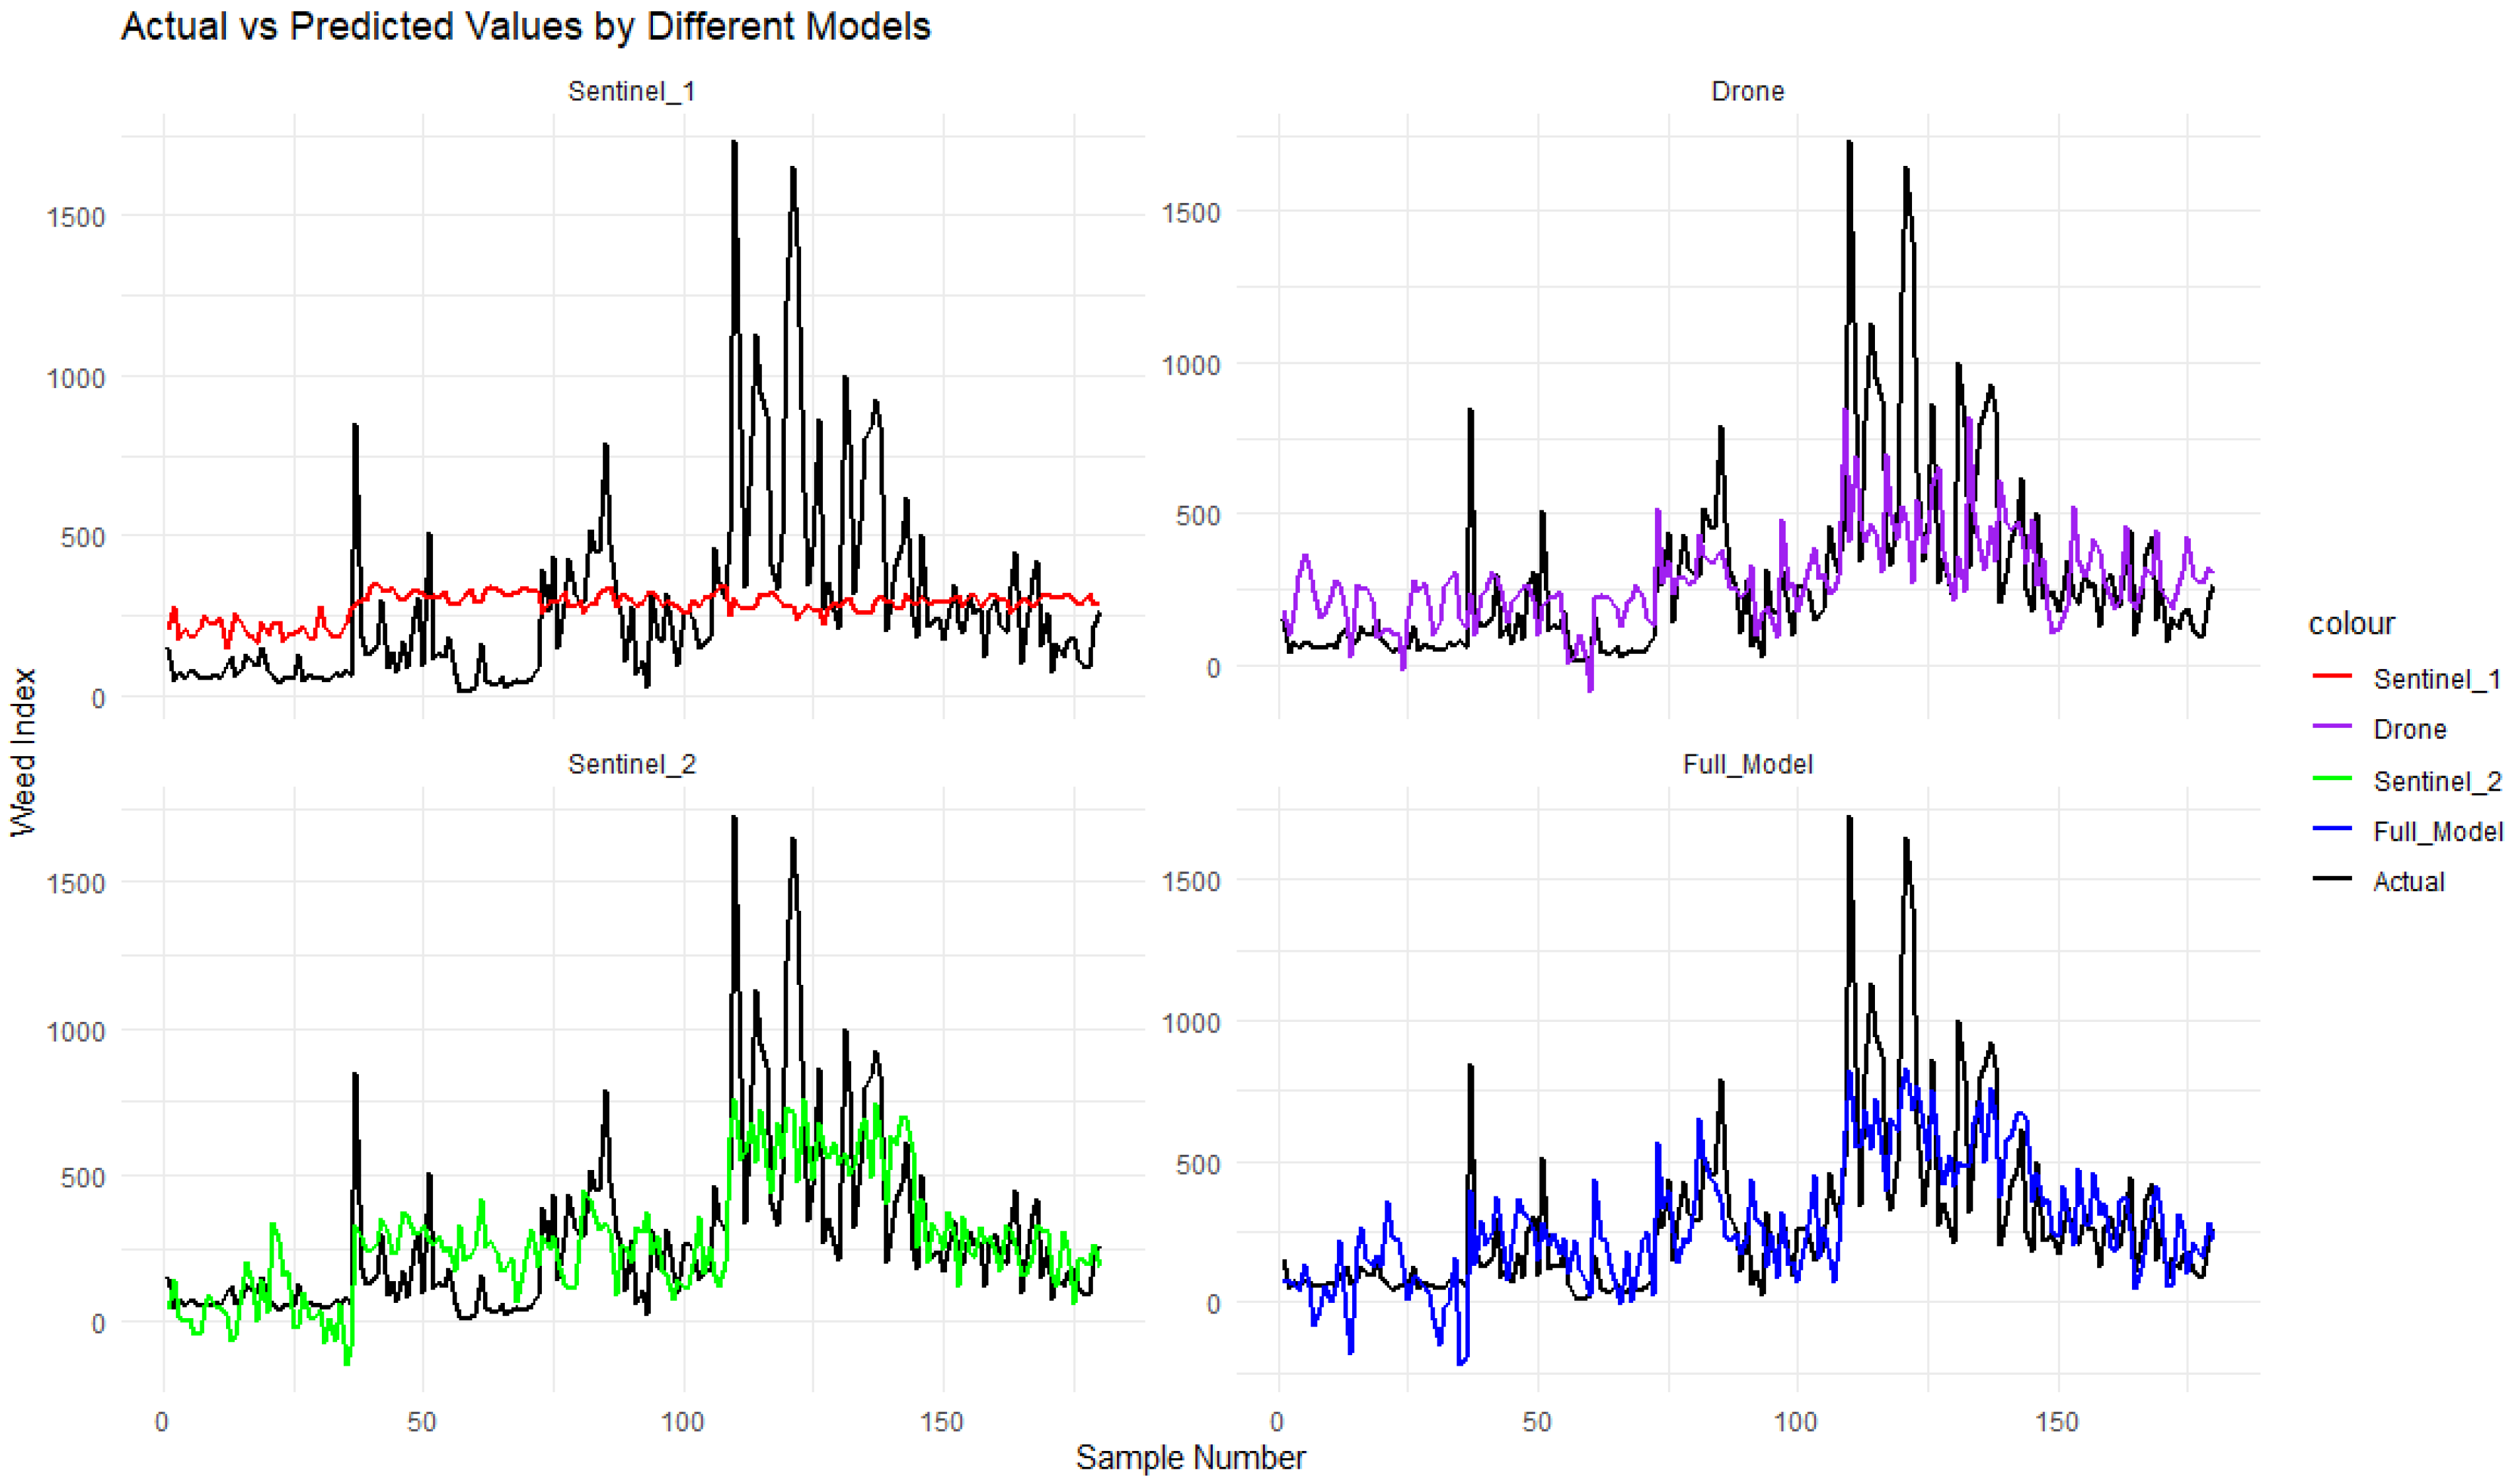
The results indicate that the Sentinel-1 channels, VV and VH, offer minimal utility for weediness evaluation (Figure 6). The Sentinel-2 channels, particularly B2, B3, and B8, have a significant association with weediness indices, resulting in enhanced model accuracy. Despite reduced R2, drone data demonstrated that the RE and NIR channels were significant and could be advantageous when ground-based or low-altitude studies are possible. The adjusted p-value (FDR) validated that the observed differences remained significant despite the consideration of multiple comparisons. Consequently, integrating the most effective channels (B2, B3, RE, NIR) could represent an excellent approach for precisely forecasting weediness and facilitating agroecological monitoring.

Figure 6.
Actual (black) and simulated (color) WI ratio.
3.3. RS Factors for the Model Construction of Weediness
This study evaluated the outcomes of four models (utilizing Sentinel-1, Sentinel-2, drones, and a comprehensive model integrating all channels) using classical multivariate regression analysis and panel models. This comparison revealed a full concordance of the final estimates and statistical significance. This coincidence suggests a lack of substantial spatial or temporal influences that might impact the results.
Panel analysis often examines inter-individual (inter-plot) heterogeneity and temporal variations in variables, considering the unique characteristics of each plot. Panel models, considering random or fixed effects, yield identical conclusions to simple linear regressions. Consequently, they demonstrate that factors such as field specificity or variations in observation times exert minimal influence on the weediness indicator or its correlation with spectral channels. Temporal influences, such as variations caused by phenological phases or observation periods, do not significantly influence the outcomes, and the observed patterns remain consistent over time.
The coefficient estimates, R2 values, and conclusions regarding statistical significance (p-value and modified p-value) remain consistent regardless of whether traditional regression or panel methods are employed for data modeling. Practically, this suggests that the multivariate regression applied to this dataset yields reasonably trustworthy results, and potential unexplained elements (geographical, climatic, individual features of the plots) do not compromise the conclusions. In the context of agroecological monitoring, this indicates that within a certain sample, more intricate statistical models do not inherently yield more precise or substantially different outcomes.
4. The Limitations of This Study
A multisensor technique, utilizing both satellites and drones, was employed to mitigate the effects of inaccuracies in assessing the weediness of maize crops. Nonetheless, in gathering data from these sources, several types of errors may arise due to different causes. The initial category of errors, linked to meteorological circumstances (clouding, fog, aerosols), might distort the image and compromise the integrity of the original data.
The first block of study limitations—the influence of weather conditions—was mitigated by standardizing the shooting conditions for satellite images, maintaining a comparable cloud cover percentage (not exceeding 10%) and synchronizing the timing of the satellite’s passage over the research site with the drone captures. The incorrect resolution of satellite imaging can hinder the identification of weeds. Consequently, the satellite channels were selected based on their capacity to deliver images with the maximum spatial resolution (10 m) and the frequency of spacecraft traversing the research area, thereby ensuring comparable observational conditions. Spectral offsets may influence the precision of vegetation type classification; hence, the study included calibrated sensors and multispectral analysis.
The second block may encompass data-collecting and processing flaws, including georeferencing mistakes (deficiencies in ascertaining coordinates). RTK-GNSS was employed for accurate positioning to mitigate mistakes. Noise and artefacts, including reflections, shadows, and inconsistent lighting, were rectified by picture pre-processing and lighting normalization. Additionally, discrepancies may arise when employing various formats and methodologies for processing data from satellites and disparate sources, leading to inconsistencies. The methods and timing of data collection, processing techniques, and the use of standardized algorithms were coordinated. Also, the same conditions and time of observations were chosen; in particular, the drone flyby was carried out from 11 to 12 AM. Orbit 109 of the satellite passage was chosen for Sentinel-1; orbit 50 (the cloudiness not exceeding 10%) and processing level S2MSI2A for Sentinel-2.
The third category of errors may relate to potential misclassifications of weeds, stemming from the analogous spectral properties of cultivated plants and weeds. The danger was mitigated through sampling (5–8 pixels per microfield) and triplicate experimentation, employing machine learning, deep neural networks, and supplementary spectral indices (NDVI, GNDVI, MSAVI). The many stages of weed growth further complicate their identification; hence, we employed multitemporal data, conducting the study during five distinct vegetative periods. Moreover, the human element may influence outcomes, particularly through errors in model training or result interpretation. To avert this, all data were confirmed under field validation using independent test sets. Drones were routinely calibrated, and sensors were inspected before the flight to prevent technical problems.
5. Discussion
The comparison of the studies by Mkhize et al. (2024), Jiao et al. (2024), and this research reveals significant insights into the use of remote sensing for weed detection in maize fields [27,28]. While all these studies highlight the effectiveness of remote sensing tools, they differ in terms of the technologies used, the scope of their analyses, and the accuracy of weed detection.
Mkhize et al. (2024) demonstrated the strong potential of Sentinel-2 in detecting weed infestations, particularly during early maize growth stages [27]. Those results indicated that the Sentinel-2 spectral bands (NIR, SWIR, and red-edge) provided weed detection accuracy comparable to hyperspectral sensors. Jiao et al. (2024) provided a broader review of weed detection technologies and reported that UAV-based RGB sensors achieved the highest accuracy (94.5%), while multispectral UAVs had moderate accuracy (61%) [28]. They also found that Sentinel-1A and Sentinel-2A multispectral sensors provided reliable accuracy of 85–95%, particularly in combination with random forest recognition algorithms.
This study extends on this by evaluating Sentinel-1, Sentinel-2, and drone-based remote sensing for weed monitoring in organic maize farming. It demonstrated that VV and VH channels of Sentinel-1 had limited predictive utility, while B2, B3, and B8 channels of Sentinel-2, along with drone-based NIR and red-edge (RE) channels, were the most effective for detecting weed infestation levels. Correlation and regression analyses confirmed that Sentinel-2 and drone channels could accurately predict weed levels and that Sentinel-1 was less useful for this purpose.
A key outcome from all highlighted studies is that Sentinel-2 consistently proves to be an effective tool for weed detection. However, Jiao et al. (2024) noted that UAV-based RGB sensors could outperform multispectral sensors in some cases [28]. New research backed up the use of Sentinel-2 but pointed out that the RE and NIR bands of drone imagery gave more accurate and statistically significant results for finding weeds in organic maize farming. This aligns with Mkhize et al. (2024), who emphasize the value of NIR and red-edge bands for distinguishing weed-infested plots from maize [27].
These studies collectively suggest that a multisensor approach may be the most effective strategy for weed detection in maize fields.
The results have a wide range of practical applications in the field of precision agriculture and crop condition monitoring. The use of Sentinel-1 and Sentinel-2 satellite data in conjunction with ground-based measurements allows rapid detection and mapping of weed infestation levels in fields, which can help farmers optimize herbicide use and minimize crop losses. The statistical models that were made can also be added to digital farming platforms so that risk analysis and crop management suggestions can be made automatically based on spatial and temporal data.
The analysis of the spatial distribution of weed infestation levels in agricultural fields revealed spatial autocorrelation, as evidenced by the Moran’s I statistic value of 0.293 and statistical significance. This signifies a cluster of fields exhibiting a comparable degree of weed infestation, which may consequently impact the precision of regression models and the feasibility of generalizing the findings. The identified autocorrelation suggests the necessity of incorporating geographical elements in future analyses, such as employing spatial panel models or geostatistical techniques (SAR, SEM, kriging, etc.). This method will rectify any biases in the sample and more precisely delineate the patterns of weed distribution.
The absence of substantial differences between panel and traditional regression models (refer to Section 3.3) suggests that “global” individual and temporal influences do not affect the correlation between spectral channels and weediness. Nevertheless, spatial clusters identified with Moran’s I suggest that the local aggregation of fields may significantly influence the amplification of findings or the incremental adjustments in weed management strategies.
Future research prospects include improving the accuracy of the models by using artificial intelligence and deep learning to analyze multispectral images, as well as integrating additional data sources, such as drone imaging and meteorological indicators. This will allow the creation of a comprehensive field condition monitoring system that will contribute to increased efficiency of agricultural production, reducing costs for chemical plant protection, and reducing the negative impact on the environment.
6. Conclusions
This study evaluated various critical factors using satellite and drone imaging for weed identification and estimation of weediness level in maize fields.
The research established that Sentinel-2 channels (B2, B3, B8) and drone channels (RE, NIR) are the most efficient for identifying and forecasting weed infestation levels in maize. Their strong connection with WI and statistically significant regression coefficients, even post-FDR correction, highlights the utility of these channels for accurate monitoring.
Channels VV and VH of Sentinel-1 exhibited a weak correlation and were ineffective in accurately predicting weediness. Their diminished sensitivity to canopy variations renders them less appropriate for precise weed control in the context of this study.
Despite the drone-based model exhibiting a lower R2 than Sentinel-2, the RE and NIR channels demonstrated significant sensitivity to fluctuations in tillage, herbicide treatment, and sowing density. This underscores their practical utility in scenarios requiring high spatial resolution or focused in-field assessments.
Moderate spatial autocorrelation suggests that weediness may be aggregated in clusters within the field. Although conventional and panel regression models produced analogous findings for channel significance, subsequent research ought to include spatial panel models or geostatistical methodologies (e.g., SAR, SEM, kriging) to address local clustering and perhaps enhance predictive accuracy.
The capacity to identify weed proliferation without chemical inputs is essential in agroecological settings. The results indicate that the integration of satellite (Sentinel-2) and drone images (RE, NIR) can establish an efficient monitoring system that swiftly detects significant “hot spots”. This presents an opportunity for targeted intervention—either by mechanical control or alternative non-chemical methods—thereby enhancing resource efficiency and safeguarding environmental integrity.
7. Patents
Station for Receiving Information from Space Apparatus for Remote Sensing of the Earth. Utility model patent No. 158094 (application No. u202400885), published 1 January 2025 Terminated Inventors: Oleh V. Skydan, Petro V. Pyvovar, Pavlo P. Topolnytskyi and 4 others. Owner: Polissia National University (UA) URL: https://iprop-ua.com/inv/3tjnh0sz/ (accessed on 10 January 2024).
Author Contributions
Conceptualization, P.V.P. and T.P.F.; methodology, P.V.P. and P.P.T.; software, P.V.P.; validation, O.O.R., M.M.K., T.V.P. and P.P.T.; formal analysis, T.P.F. and O.V.S.; investigation, O.O.R. and V.M.P.; resources, M.M.K.; data curation, O.O.R. and T.V.P.; writing—original draft preparation, P.V.P., P.P.T., V.M.P. and T.P.F.; writing—review and editing, V.M.P. and O.V.S.; visualization, M.M.K.; supervision, T.P.F.; project administration, T.P.F. All authors have read and agreed to the published version of the manuscript.
Funding
This research was funded by the EU-Horizon Europe Framework Programme (HORIZON-CL6–2022-FARM2FORK-02–01), Proposal ID: 101084084, AGROSUS (AGROecological strategies for SUStainable weed management in key European crops).
Institutional Review Board Statement
Not applicable.
Data Availability Statement
Dataset available on request from the authors.
Conflicts of Interest
The authors declare no conflicts of interest.
References
- Monteiro, A.; Santos, S. Sustainable approach to weed management: The role of precision weed management. Agronomy 2022, 12, 118. [Google Scholar] [CrossRef]
- Rawat, L.; Bisht, T.S.; Naithani, D.C. Plant disease management in organic farming system: Strategies and challenges. In Emerging Trends in Plant Pathology; Springer: Berlin/Heidelberg, Germany, 2021; pp. 611–642. [Google Scholar]
- Fedoniuk, T.P.; Pyvovar, P.V.; Skydan, V.; Melnychuk, T.V.; Topolnytskyi, P.P. Spatial structure of natural landscapes within the Chornobyl Exclusion Zone. J. Water Land Dev. 2024, 60, 79–90. [Google Scholar] [CrossRef]
- Fuentes-Peñailillo, F.; Gutter, K.; Vega, R.; Silva, G.C. Transformative technologies in digital agriculture: Leveraging Internet of Things, remote sensing, and artificial intelligence for smart crop management. J. Sens. Actuator Netw. 2024, 13, 39. [Google Scholar] [CrossRef]
- Getahun, S.; Kefale, H.; Gelaye, Y. Application of Precision Agriculture Technologies for Sustainable Crop Production and Environmental Sustainability: A Systematic Review. Sci. World J. 2024, 2024, 2126734. [Google Scholar] [CrossRef]
- Vidican, R.; Mălinaș, A.; Ranta, O.; Moldovan, C.; Marian, O.; Ghețe, A.; Ghișe, C.R.; Popovici, F.; Cătunescu, G.M. Using remote sensing vegetation indices for the discrimination and monitoring of agricultural crops: A critical review. Agronomy 2023, 13, 3040. [Google Scholar] [CrossRef]
- Radočaj, D.; Jurišić, M.; Gašparović, M. The role of remote sensing data and methods in a modern approach to fertilization in precision agriculture. Remote Sens. 2022, 14, 778. [Google Scholar] [CrossRef]
- Wang, J.; Wang, Y.; Li, G.; Qi, Z. Integration of Remote Sensing and Machine Learning for Precision Agriculture: A Comprehensive Perspective on Applications. Agronomy 2024, 14, 1975. [Google Scholar] [CrossRef]
- Che’Ya, N.N.; Dunwoody, E.; Gupta, M. Assessment of weed classification using hyperspectral reflectance and optimal multispectral UAV imagery. Agronomy 2021, 11, 1435. [Google Scholar] [CrossRef]
- Lou, Z.; Quan, L.; Sun, D.; Li, H.; Xia, F. Hyperspectral remote sensing to assess weed competitiveness in maize farmland ecosystems. Sci. Total Environ. 2022, 844, 157071. [Google Scholar] [CrossRef]
- Xia, F.; Quan, L.; Lou, Z.; Sun, D.; Li, H.; Lv, X. Identification and comprehensive evaluation of resistant weeds using unmanned aerial vehicle-based multispectral imagery. Front. Plant Sci. 2022, 13, 938604. [Google Scholar] [CrossRef]
- Maresma, A.; Chamberlain, L.; Tagarakis, A.; Kharel, T.; Godwin, G.; Czymmek, K.J.; Shields, E.; Ketterings, Q.M. Accuracy of NDVI-derived corn yield predictions is impacted by time of sensing. Comput. Electron. Agric. 2020, 169, 105236. [Google Scholar] [CrossRef]
- Sarvakar, K.; Thakkar, M. Different Vegetation Indices Measurement Using Computer Vision. In Applications of Computer Vision and Drone Technology in Agriculture 4.0; Springer Nature: Singapore, 2024; pp. 133–163. [Google Scholar]
- Pasternak, M.; Pawluszek-Filipiak, K. The evaluation of spectral vegetation indexes and redundancy reduction on the accuracy of crop type detection. Appl. Sci. 2022, 12, 5067. [Google Scholar] [CrossRef]
- Fedonyuk, T.P.; Galushchenko, O.M.; Melnichuk, T.V.; Zhukov, O.V.; Vishnevskiy, D.O.; Zymaroieva, A.A.; Hurelia, V.V. Prospects and main aspects of the GIS-technologies application for monitoring of biodiversity (on the example of the Chornobyl Radiation-Ecological Biosphere Reserve). Space Sci. Technol. 2020, 26, 75–93. [Google Scholar]
- Skydan, O.; Danyk, Y.; Fedoniuk, T.; Nykolyuk, O.; Pyvovar, P.; Bruhno, I.; Dankevych, V.; Yanchevskyi, S. Space and Geoinformation Support for Decision-Making in Key Areas of National Security and Defense of Ukraine; Monografy; Poliskyi Natsionalnyi Universytet: Zhytomyr, Ukraine, 2022; 280p, ISBN 978-617-7684-81-6. (In Ukrainian) [Google Scholar]
- Rai, N.; Zhang, Y.; Ram, B.G.; Schumacher, L.; Yellavajjala, R.K.; Bajwa, S.; Sun, X. Applications of deep learning in precision weed management: A review. Comput. Electron. Agric. 2023, 206, 107698. [Google Scholar]
- Adhinata, F.D.; Sumiharto, R. A comprehensive survey on weed and crop classification using machine learning and deep learning. Artif. Intell. Agric. 2024, 13, 45–63. [Google Scholar]
- Adugna, T.; Xu, W.; Fan, J. Comparison of random forest and support vector machine classifiers for regional land cover mapping using coarse resolution FY-3C images. Remote Sens. 2022, 14, 574. [Google Scholar] [CrossRef]
- Espejo-Garcia, B.; Mylonas, N.; Athanasakos, L.; Fountas, S.; Vasilakoglou, I. Towards weeds identification assistance through transfer learning. Comput. Electron. Agric. 2020, 171, 105306. [Google Scholar]
- Oliveira, I.C.d.; Gava, R.; Santana, D.C.; Seron, A.C.d.S.C.; Teodoro, L.P.R.; Cotrim, M.F.; Santos, R.G.d.; Alvarez, R.d.C.F.; Junior, C.A.d.S.; Baio, F.H.R.; et al. Detection of Irrigated and Non-Irrigated Soybeans Using Hyperspectral Data in Machine-Learning Models. Algorithms 2024, 17, 542. [Google Scholar] [CrossRef]
- Xu, B.; Meng, R.; Chen, G.; Liang, L.; Lv, Z.; Zhou, L.; Sun, R.; Zhao, F.; Yang, W. Improved weed mapping in corn fields by combining UAV-based spectral, textural, structural, and thermal measurements. Pest Manag. Sci. 2023, 79, 2591–2602. [Google Scholar]
- Quan, L.; Lou, Z.; Lv, X.; Sun, D.; Xia, F.; Li, H.; Sun, W. Multimodal remote sensing application for weed competition time series analysis in maize farmland ecosystems. J. Environ. Manag. 2023, 344, 118376. [Google Scholar]
- Harle, S.; Bhagat, A.; Dash, A.K. Remote Sensing Revolution: Mapping Land Productivity and Vegetation Trends with Unmanned Aerial Vehicles (UAVs). Curr. Appl. Mater. 2024, 3, e070224226752. [Google Scholar] [CrossRef]
- Fedoniuk, T.; Zhuravel, S.; Kravchuk, M.; Pazych, V.; Bezvershuck, I. Historical sketch and current state of weed diversity in continental zone of Ukraine. Agric. Nat. Resour. 2024, 58, 631–642. [Google Scholar]
- Skydan, O.V.; Fedoniuk, T.P.; Pyvovar, P.V.; Dankevych, V.Y.; Dankevych, Y.M. Landscape fire safety management: The experience of Ukraine and the EU. News Natl. Acad. Sci. Repub. Kazakhstan Ser. Geol. Tech. Sci. 2021, 6, 125–132. [Google Scholar] [CrossRef]
- Mkhize, Y.; Madonsela, S.; Cho, M.; Nondlazi, B.; Main, R.; Ramoelo, A. Mapping weed infestation in maize fields using Sentinel-2 data. Phys. Chem. Earth Parts A/B/C 2024, 134, 103571. [Google Scholar] [CrossRef]
- Jiao, J.; Zang, Y.; Chen, C. Key Technologies of Intelligent Weeding for Vegetables: A Review. Agriculture 2024, 14, 1378. [Google Scholar] [CrossRef]
- IUSS Working Group WRB. World Reference Base for Soil Resources. In International Soil Classification System for Naming Soils and Creating Legends for Soil Maps, 4th ed.; International Union of Soil Sciences (IUSS): Vienna, Austria, 2022. [Google Scholar]
- Moran, P.A.P. Notes on Continuous Stochastic Phenomena. Biometrika 1950, 37, 17–23. [Google Scholar] [CrossRef]

Disclaimer/Publisher’s Note: The statements, opinions and data contained in all publications are solely those of the individual author(s) and contributor(s) and not of MDPI and/or the editor(s). MDPI and/or the editor(s) disclaim responsibility for any injury to people or property resulting from any ideas, methods, instructions or products referred to in the content. |
© 2025 by the authors. Licensee MDPI, Basel, Switzerland. This article is an open access article distributed under the terms and conditions of the Creative Commons Attribution (CC BY) license (https://creativecommons.org/licenses/by/4.0/).