Article

Experimental Study on Loosening and Vibration Characteristics of Vibrating Screen Bolts of Combine Harvester

1
School of Agricultural Engineering, Jiangsu University, Zhenjiang 212013, China
2
School of Transportation Engineering, Jiangsu Shipping College, Nantong 226010, China
3
Xinjiang Production and Construction Corps Fourth Division Chuangjin Agricultural Development Group Co., Kokdala 835219, China
4
School of Energy and Power Engineering, Jiangsu University, Zhenjiang 212013, China
5
Key Laboratory of Modern Agricultural Equipment and Technology, Ministry of Education, Jiangsu University, Zhenjiang 212013, China
*
Author to whom correspondence should be addressed.
Agriculture 2025, 15(7), 749; https://doi.org/10.3390/agriculture15070749
Submission received: 27 February 2025 / Revised: 28 March 2025 / Accepted: 28 March 2025 / Published: 31 March 2025
(This article belongs to the Section Agricultural Technology)

Abstract

:
Due to the complex operating environment of combine harvesters, uneven terrain, multiple vibration sources, and complex transmission systems, failures easily occur in critical working components, especially the bolted connections of the vibrating screen. To address these issues, this study first established a bolt-tightening mechanical model. Secondly, a finite element simulation of the preload force was performed using Ansys Workbench software (2023R2). The simulation results showed that the bolt head area exhibits a ring-shaped strain distribution. To determine the critical state of bolt loosening, a single-bolt loosening test was conducted. The experimental results indicated that when the bolt pressure decreased to 78.4 N and the torque decreased to 0.5 N·m, bolt loosening intensified, and the pressure value showed a sharp decreasing trend. These pressure and torque values can be defined as the bolt loosening threshold, providing an important reference basis for subsequent monitoring and early warning. Finally, to more realistically simulate actual working conditions, a combine harvester field vibration test was conducted. By arranging triaxial acceleration sensors on the bolted connections of the vibrating screen, acceleration signals were collected under both low-speed and high-speed field operating conditions. Time–frequency analysis was performed on the signals to extract characteristic values for each measurement point. The field vibration test results showed that the characteristic values of the transmission shaft bolt structure of the vibrating screen were at a relatively high level, indicating that this part is subjected to a large vibration load. Furthermore, frequency domain feature analysis revealed that the vibration frequency components in this area are complex, which further increases the risk of bolt loosening. This study provides an in-depth analysis of the loosening characteristics and vibration characteristics of the vibrating screen’s bolted connections in combine harvesters. The results provide an important theoretical basis and technical support for the online monitoring of failures in the vibrating screen’s bolt structure.

1. Introduction

As core machinery in modern agricultural equipment, combine harvesters’ operational efficiency and reliability directly impact the quality and timeliness of grain harvesting. However, field operating environments generally present complex conditions, such as poor ground flatness and large fluctuations in crop feed rate [1,2,3,4,5]. Coupled with the inherent structural complexity of combine harvesters and the coupling of multiple vibration sources (such as the engine, threshing cylinder, and vibrating screen), critical connecting components are subjected to non-stationary vibration loads for extended periods [6,7,8]. Among these, the bolted connections of the vibrating screen, due to their direct participation in high-frequency sieving motion, are more susceptible to loosening failures caused by preload attenuation. In severe cases, this can lead to screen body fracture and machine shutdown, threatening operational safety and causing economic losses [9,10].
The essence of bolt loosening is the coupled process of preload attenuation and fretting wear on the thread contact surfaces. Currently, domestic and international scholars have achieved numerous research results in the analysis of bolted structures under static load conditions. These studies mainly focus on the calculation of critical parameters within the allowable range of material performance indicators, the calculation of bolt elastoplastic deformation, the finite element simulation analysis of threads, and the distribution of axial force in bolts. In the early 1980s, Sakai et al. [11] derived the minimum slip displacement of the contact surface to characterize the contact surface by analyzing the interaction of forces between the contact surfaces of the bolted structure. Yamamoto et al. [12] simplified the threaded section into frictional contact surfaces with contact for analysis and calculation. Based on the loosening mechanism of bolted joints, Jiang et al. [13] proposed a calculation model for bolt preload under transverse cyclic loading. By analyzing the thread contact state and thread stress distribution, they explained the loosening process of bolted joints under transverse cyclic loading. Sun et al. [14,15] studied the mechanical properties of fully grouted bolts under combined axial and transverse loads using structural mechanics principles. They developed a semi-span, tension-shear-coupled bolted (TSCB) connection model and proposed an analytical method to evaluate its resistance contribution and deformation length at elastic and plastic limit states. Zhang et al. [16,17] experimentally investigated the ultimate tensile behavior of 16 bolted T-stub connections and two bolted angle-cleat connections with respect to horizontal plate thickness, bolt diameter, bolt pitch, and bolt preload. Jiménez-Peña, C. [18,19] researched and developed a novel non-contact method for monitoring bolt preload based on the digital image correlation measurement of bolt elongation. The resolution of the method for each bolt class was estimated to be less than 2.25% and 1.8% of the recommended bolt preload value, respectively. Zhao et al. [20,21] studied and evaluated finite element modeling methods for bolted connections, establishing three finite element models for bolted connections: a solid bolt connection model, a beam element connection model, and a rigid element connection model. Modal testing and stress analysis showed that the solid bolt connection model and the beam element connection model have wide applicability. Current research on bolt loosening is mostly focused on static or single load conditions; however, there is a lack of systematic analysis on the dynamic loosening behavior of bolts under the multi-vibration-source, wide-frequency excitation of combine harvesters.
In addition to static mechanical behavior analysis, the vibration characteristics of bolts are also considered to be an important indicator of their condition [22,23,24,25]. Research has shown that the vibration characteristics of bolts change significantly upon failure, and these changes can be quantified by changes in time–frequency features. Commonly used time–frequency features include the kurtosis factor, skewness factor, and margin factor [26,27]. Therefore, bolt loosening fault diagnosis methods based on vibration signals have also been widely used. Huda et al. [28] used a non-contact laser excitation experiment to prove that this method can detect the location of loosened bolts. Xu et al. [29] studied the nonlinear vibration mechanism of C-C under partially loosened bolt conditions and established the kinematic equation of a conical–cylindrical coupled shell using the Lagrange energy equation. The vibration characteristics of C-C were analyzed using the Rayleigh–Ritz method in conjunction with the displacement admissible functions of orthogonal polynomials. Wu et al. [30] developed a semi-analytical FFT algorithm for the Jacobian matrix to achieve a frequency–time analysis of the stochastic vibration response of bolted structures with interfacial friction hysteresis behavior. Wu et al. [31,32] proposed an efficient and dynamic Bolted Flange Joint Dynamics System (BFJDS) model, revealing frequency veering and coupled vibration phenomena. The established theoretical model can predict the vibration characteristics of BFJDS under bolted and unbolted conditions relatively well. Rhandall [33,34] established a vibration behavior dataset for turbine foundation bolt loosening under different conditions. Abouzar et al. [35,36] investigated the vibration characteristics of plates with six-bolt, single-lap joints, including natural frequencies, energy parameters, kurtosis, and standard deviation, in experimental tests and finite element (FE) methods. In addition to bolt fault diagnosis based on vibration signal analysis, there are also acoustic emission techniques, ultrasonic propagation time methods, piezoelectric impedance methods, and fiber grating sensing. Aayush et al. [37] explored the use of acoustic signals from wheel–rail interactions to detect bolt loosening. Wang et al. [38,39] combined acoustic emission (AE) monitoring with machine learning to determine bolt loosening levels and wear mechanisms. Tong et al. [40] proposed a bolt loosening detection method based on the phase change of Lamb waves during propagation, deriving a monotonic relationship between Lamb wave phase delay and the degree of bolt loosening. Tan et al. [41,42] proposed a bolt loosening monitoring method based on piezoelectric active sensing and dynamic mode decomposition (DMD). Liu et al. [43] greatly reduced the impact of background noise through data cleaning and data fusion. In addition, the use of an improved Deep Convolutional Neural Network (DCNN) algorithm can significantly improve monitoring accuracy and speed. Du et al. [44] performed time reversal on the received wave signals captured from the monitored bolted structure and calculated the refocused signal based on the time-reversed signal and the Frequency Response Function (FRF) in the intact state. Liu et al. [45,46] proposed new acoustic fingerprint features and classifiers to mitigate sample shortages that are robust to noise interference, namely the all-pole group delay function (APGDF) and prototype networks. The applicability and reliability of the existing monitoring methods under variable field conditions are also to be verified. In addition, the critical threshold of bolt loosening has not been quantitatively correlated with the real operating load spectrum, which restricts the engineering application of the failure warning algorithm.
Researchers at home and abroad have found that the vibration and loosening characteristics can be integrated into the bolt monitoring system, which provides a theoretical basis for the health monitoring of mechanical key joint structures. Liu [47] established a semi-analytical dynamic model of cylindrical shell structures with bolt-connected composite flanges under arbitrary connection conditions, focusing on the free vibration characteristics of local loose structures. Liu [48] developed a general semi-analytical modeling method for bolt-connected composite flanged cylindrical shells, introducing material nonlinearity by considering the frequency–strain dependence of the material parameters. A joint model with non-uniform distribution parameters and dynamic boundary is proposed to simulate the interfacial pressure distribution and the nonlinear mechanical behavior of bolt joints. Fan [49] designed an innovative hybrid monitoring system based on strain gauges, Fiber Bragg grating (FBG), and Brillouin Optical time domain analysis (BOTDA). A special dynamometer with a temperature compensation function was used to collect axial force data under step load conditions. This provides practical significance for improving the accuracy and reliability of the evaluation of the mechanical properties of underground engineering anchors.
In response to the aforementioned issues, this study focuses on the bolted connections of the vibrating screen in combine harvesters to investigate their loosening and vibration characteristics. By establishing a bolt-tightening mechanical model, the distribution of preload is revealed. The loosening critical threshold is determined by combining finite element simulation and a single-bolt loosening test. Furthermore, multi-condition acceleration signals are obtained through field vibration tests to analyze the dynamic load characteristics of the vibrating screen bolts. This can provide a theoretical basis for the health monitoring of critical connecting structures in combine harvesters and is of great significance for improving the intelligent operation and maintenance level of agricultural equipment.

2. Materials and Methods

2.1. Mechanical Model of Bolt Tightening

The total torque required to tighten the bolt includes the friction torque (ML) of the bolt-nut mating thread pair and the friction torque (MK) between the nut or bolt head and the connection plate. The corresponding bolt parameters are shown in Figure 1. The red lines in the image trace the thread profile of the bolt (including the thread crest and thread root), clearly marking the cylindrical diameter of thread root, (d1), theoretical fit diameter of thread(d2), and pitch (p) of the thread. where L: total length, k: head height, s: hexagon head parallel plane spacing, μ b : friction coefficient of contact surface between bolt rod and connector, μ t h : comprehensive friction coefficient of thread meshing surface, μ n : friction coefficient between nut end face and connector, d1: cylindrical diameter of thread root, d2: theoretical fit diameter of thread, ds: nominal diameter, α : profile angle, P: screw pitch.
(1)
Friction Torque of the Bolt-Nut Mating Thread Pair (ML)
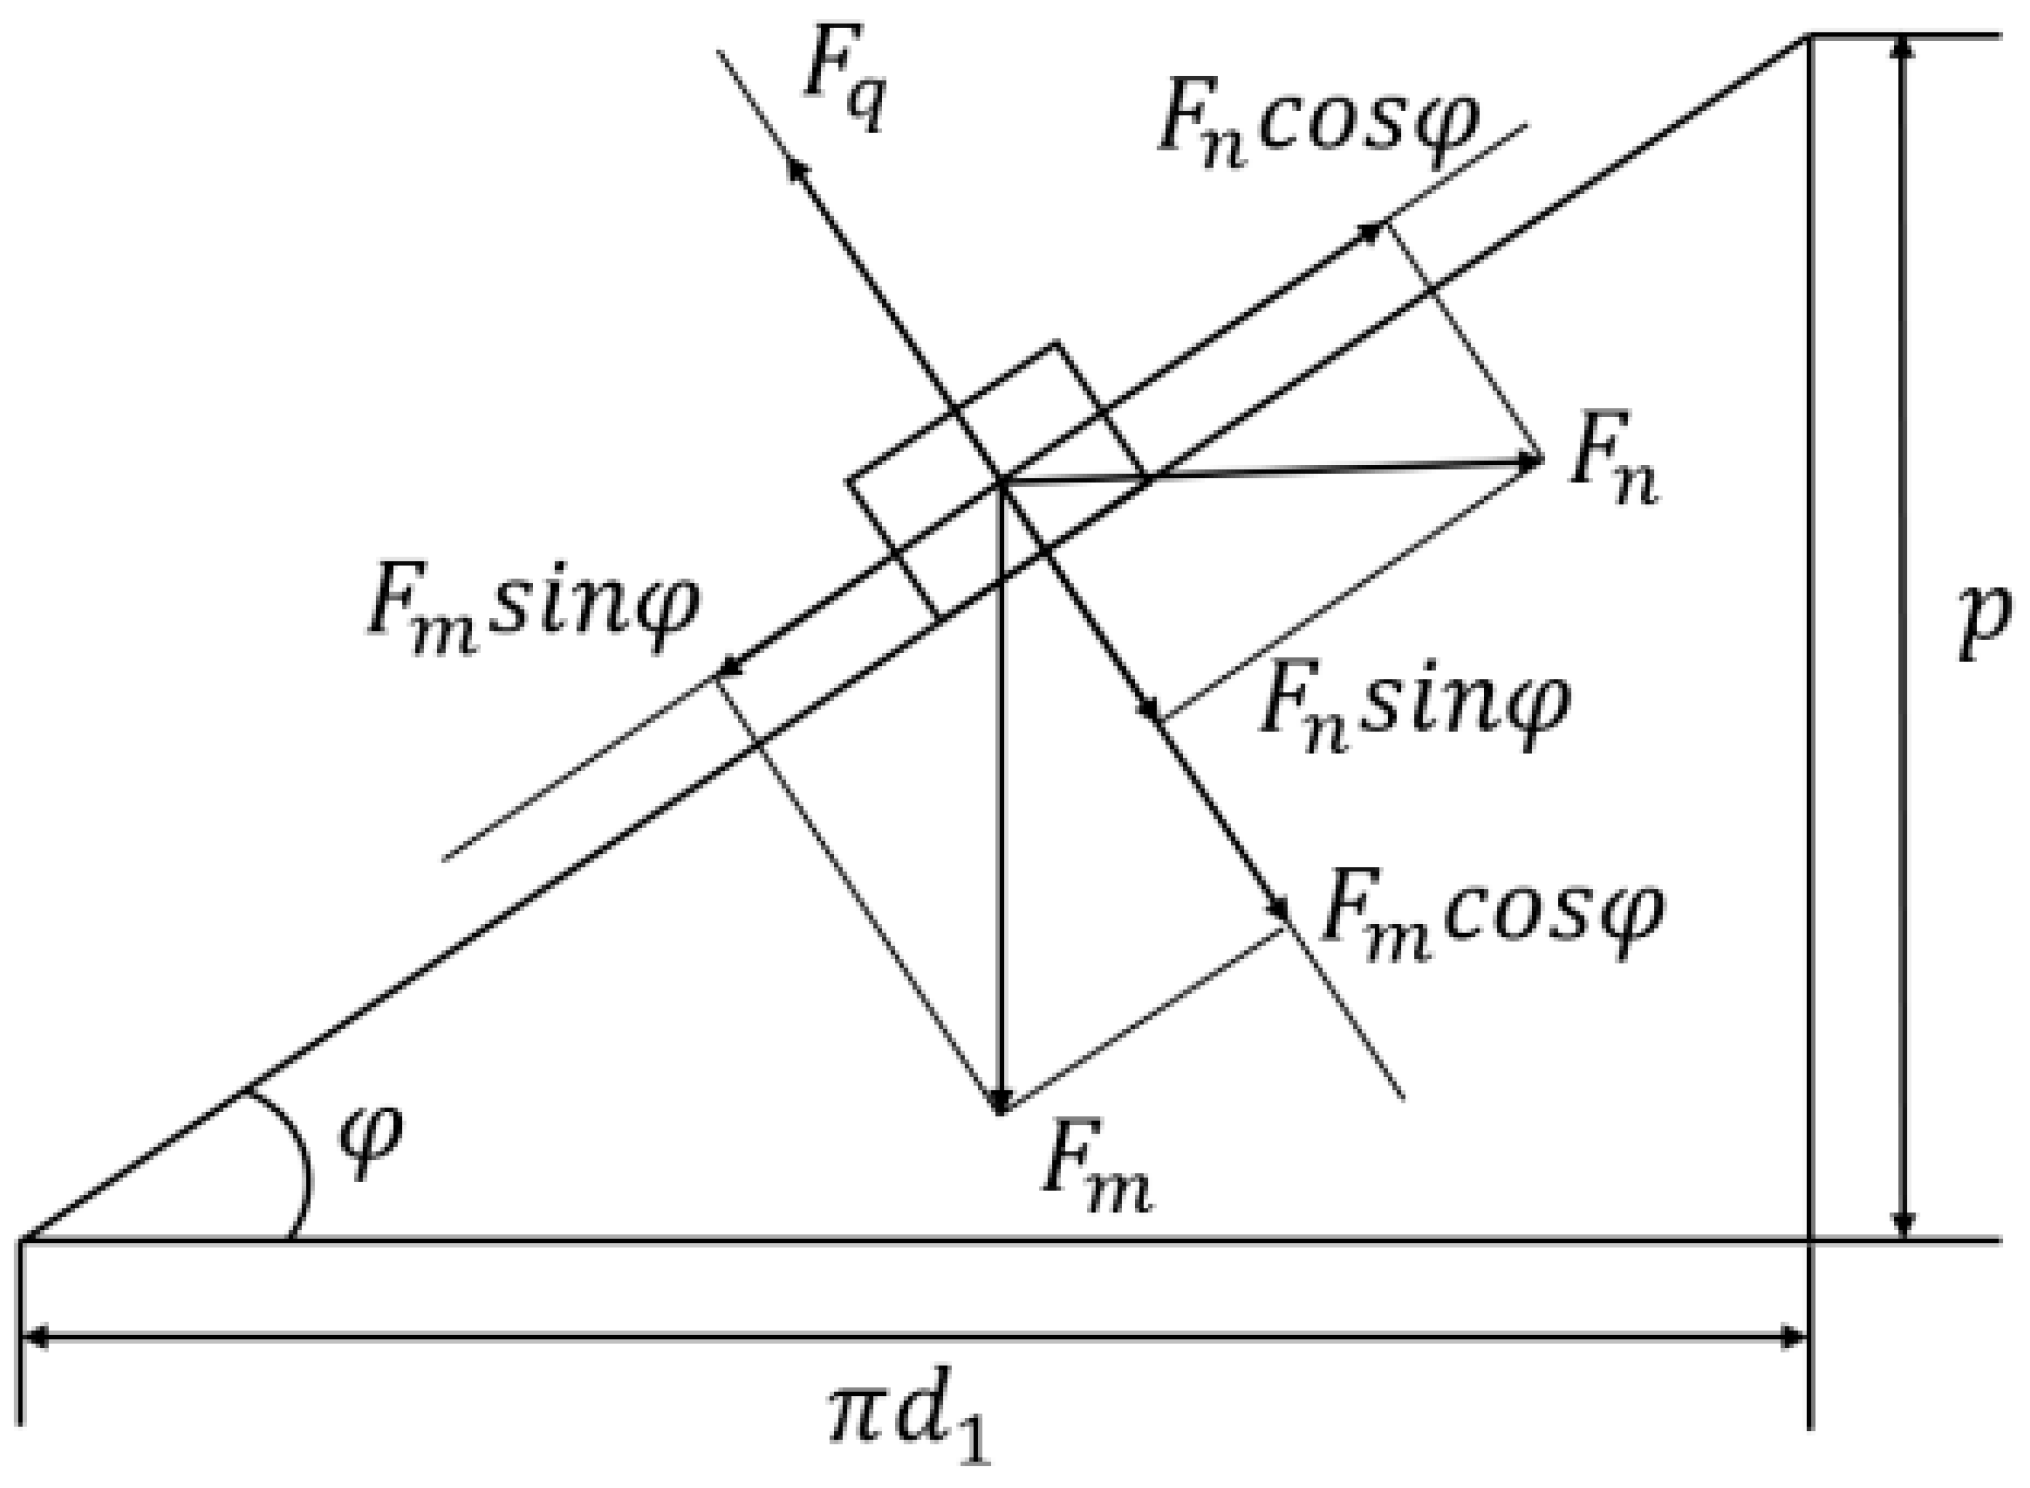
The friction torque of the thread pair (ML) is calculated using the inclined plane slider model. The thread is unwrapped along the mean diameter into a right-angled triangle, as shown in Figure 2. During the bolt clamping process, the bolt’s own weight is ignored. The slider is subjected to an upward pushing force (Fn) along the inclined plane, as well as the resistance of the axial preload force (Fm) and the supporting force (Fq) of the inclined plane on the slider. When the slider is stationary, the force equilibrium condition is satisfied.
F n c o s φ F m s i n φ μ s F n s i n φ + F m c o s φ = 0
where μ s is the friction coefficient between the thread pair, which is replaced by tan α . The above equation can be simplified to obtain the relationship between Fn and Fm:
F n = F m · tan γ + tan φ 1 + tan γ · tan φ = F m · tan γ + φ
The friction torque between the bolt and nut mating threads is:
M L = F n d 1 2 = d 1 2 · F m · t a n γ + φ
The formula can be simplified to:
t a n γ + φ t a n γ + t a n φ = P π d 1 + μ s c o s ( α / 2 )
The thread friction torque can be simplified to:
M L = d 1 2 · F m · P π d 1 + μ s cos α / 2 = F m 2 P π + μ s d 1 cos α / 2
(2)
Friction Torque (MK) Between the Nut or Bolt Head and the Connection Plate
When the bolt is connected, the friction torque between the nut and the connection plate can be equated to the friction torque between the bolt head and the connection plate, which can be represented by MK. At any point on the annulus, the radius is r, and the amount of change in the radius is dr. Then, the annular pressure on the nut is:
d N = F d s = 2 π r F d r
where the annular pressure N is equal to the bolt preload Fm, we can obtain:
N = F m = r 1 r 2 2 π r F d r = π F ( r 2 2 r 1 2 )
where r2 is the outer thread contact radius of the bolt and r1 is the radius of the bolt-hole in the connection plate; the friction torque MK between the nut or bolt head and the connection plate is then:
M K = 2 μ b π F r 2 d r = 2 3 μ b π F r 2 3 r 1 3 = 2 3 μ b F m · r 2 3 r 1 3 r 2 2 r 1 2
Then, the total torque M required to tighten the bolt is:
M = M L + M K = F m 2 ( P π + μ s d 1 c o s ( α / 2 ) ) + 2 μ b F m 3 · r 2 3 r 1 3 r 2 2 r 1 2

2.2. Finite Element Simulation of Bolt Preload

Determination of Bolt Preload

In order to study the stress state of the bolt during the actual working process, the relationship between bolt torque and axial preload is obtained from:
M Z = F m P 2 π + μ s d 1 2 c o s α / 2 + d w μ n 2
The selected bolt specification in this document is M10. According to the standard “ISO 4014:2014 Ordinary Thread Hexagon Head Bolt” [50] provided by the enterprise, for M10 bolts, the minimum friction coefficient is used to make the bolt more safely stressed when calculating the tightening torque. The bolt parameters are: P = 1.5 mm,   μ s = μ n = 0.08, thread mean diameter d1 = 9.026mm, α = 60°, d4 = 16.2mm, and bolt connecting plate hole diameter d3 = 11mm. dw can be calculated as:
d w = 2 d 4 3 d 3 3 3 d 4 2 d 3 2 = 2 16.2 3 11 3 3 16.2 2 11 2 = 20.65   mm
Substituting the relevant parameters, we can obtain:
M Z = F m P 2 π + μ s d 1 2 c o s α / 2 + d w μ n 2 = F m 0.24 + 0.58 × 9.026 × 0.08 + 20.65 2 × 0.08 = 1.49 F m
The formula for calculating the tensile load is:
F m = A × R m
where A is the nominal stress area of the thread and Rm is the tensile strength. According to the enterprise standard, the tensile strength range of the furnace test bar at room temperature during aging treatment is:
800   MPa R m 1200   MPa
The range of the bolt axial tensile force can be calculated as:
F m , m i n = A × R m , m i n = 58 × 10 6 × 800 × 10 6 = 46.4   kN
F m , m a x = A × R m , m a x = 58 × 10 6 × 1200 × 10 6 = 69.6   kN
Then, the bolt torque is:
M Z , m i n = 75.4 × 0.16 × 1.5 + 0.58 × 9.026 × 0.08 + 12.78 2 × 0.08 = 54.286   N · m
M Z , m a x = 92.8 × 0.16 × 1.5 + 0.58 × 9.026 × 0.08 + 12.78 2 × 0.08 = 81.432   N · m
From the calculation results, it can be seen that the ultimate torque of the bolt is between 54.286 and 81.432 N·m. Exceeding this torque value may lead to over-stretching or even fracture of the bolt. Choosing a lower maximum torque prioritizes the long-term durability and performance of the bolt and connecting components. Therefore, we choose 35 N·m as a more conservative and safer upper limit for the maximum torque. This value is intended to reduce the risk of bolt damage and deformation of the connection plate while ensuring sufficient clamping force to achieve a reliable connection.

2.3. Simulation Analysis of Bolt Axial Preload

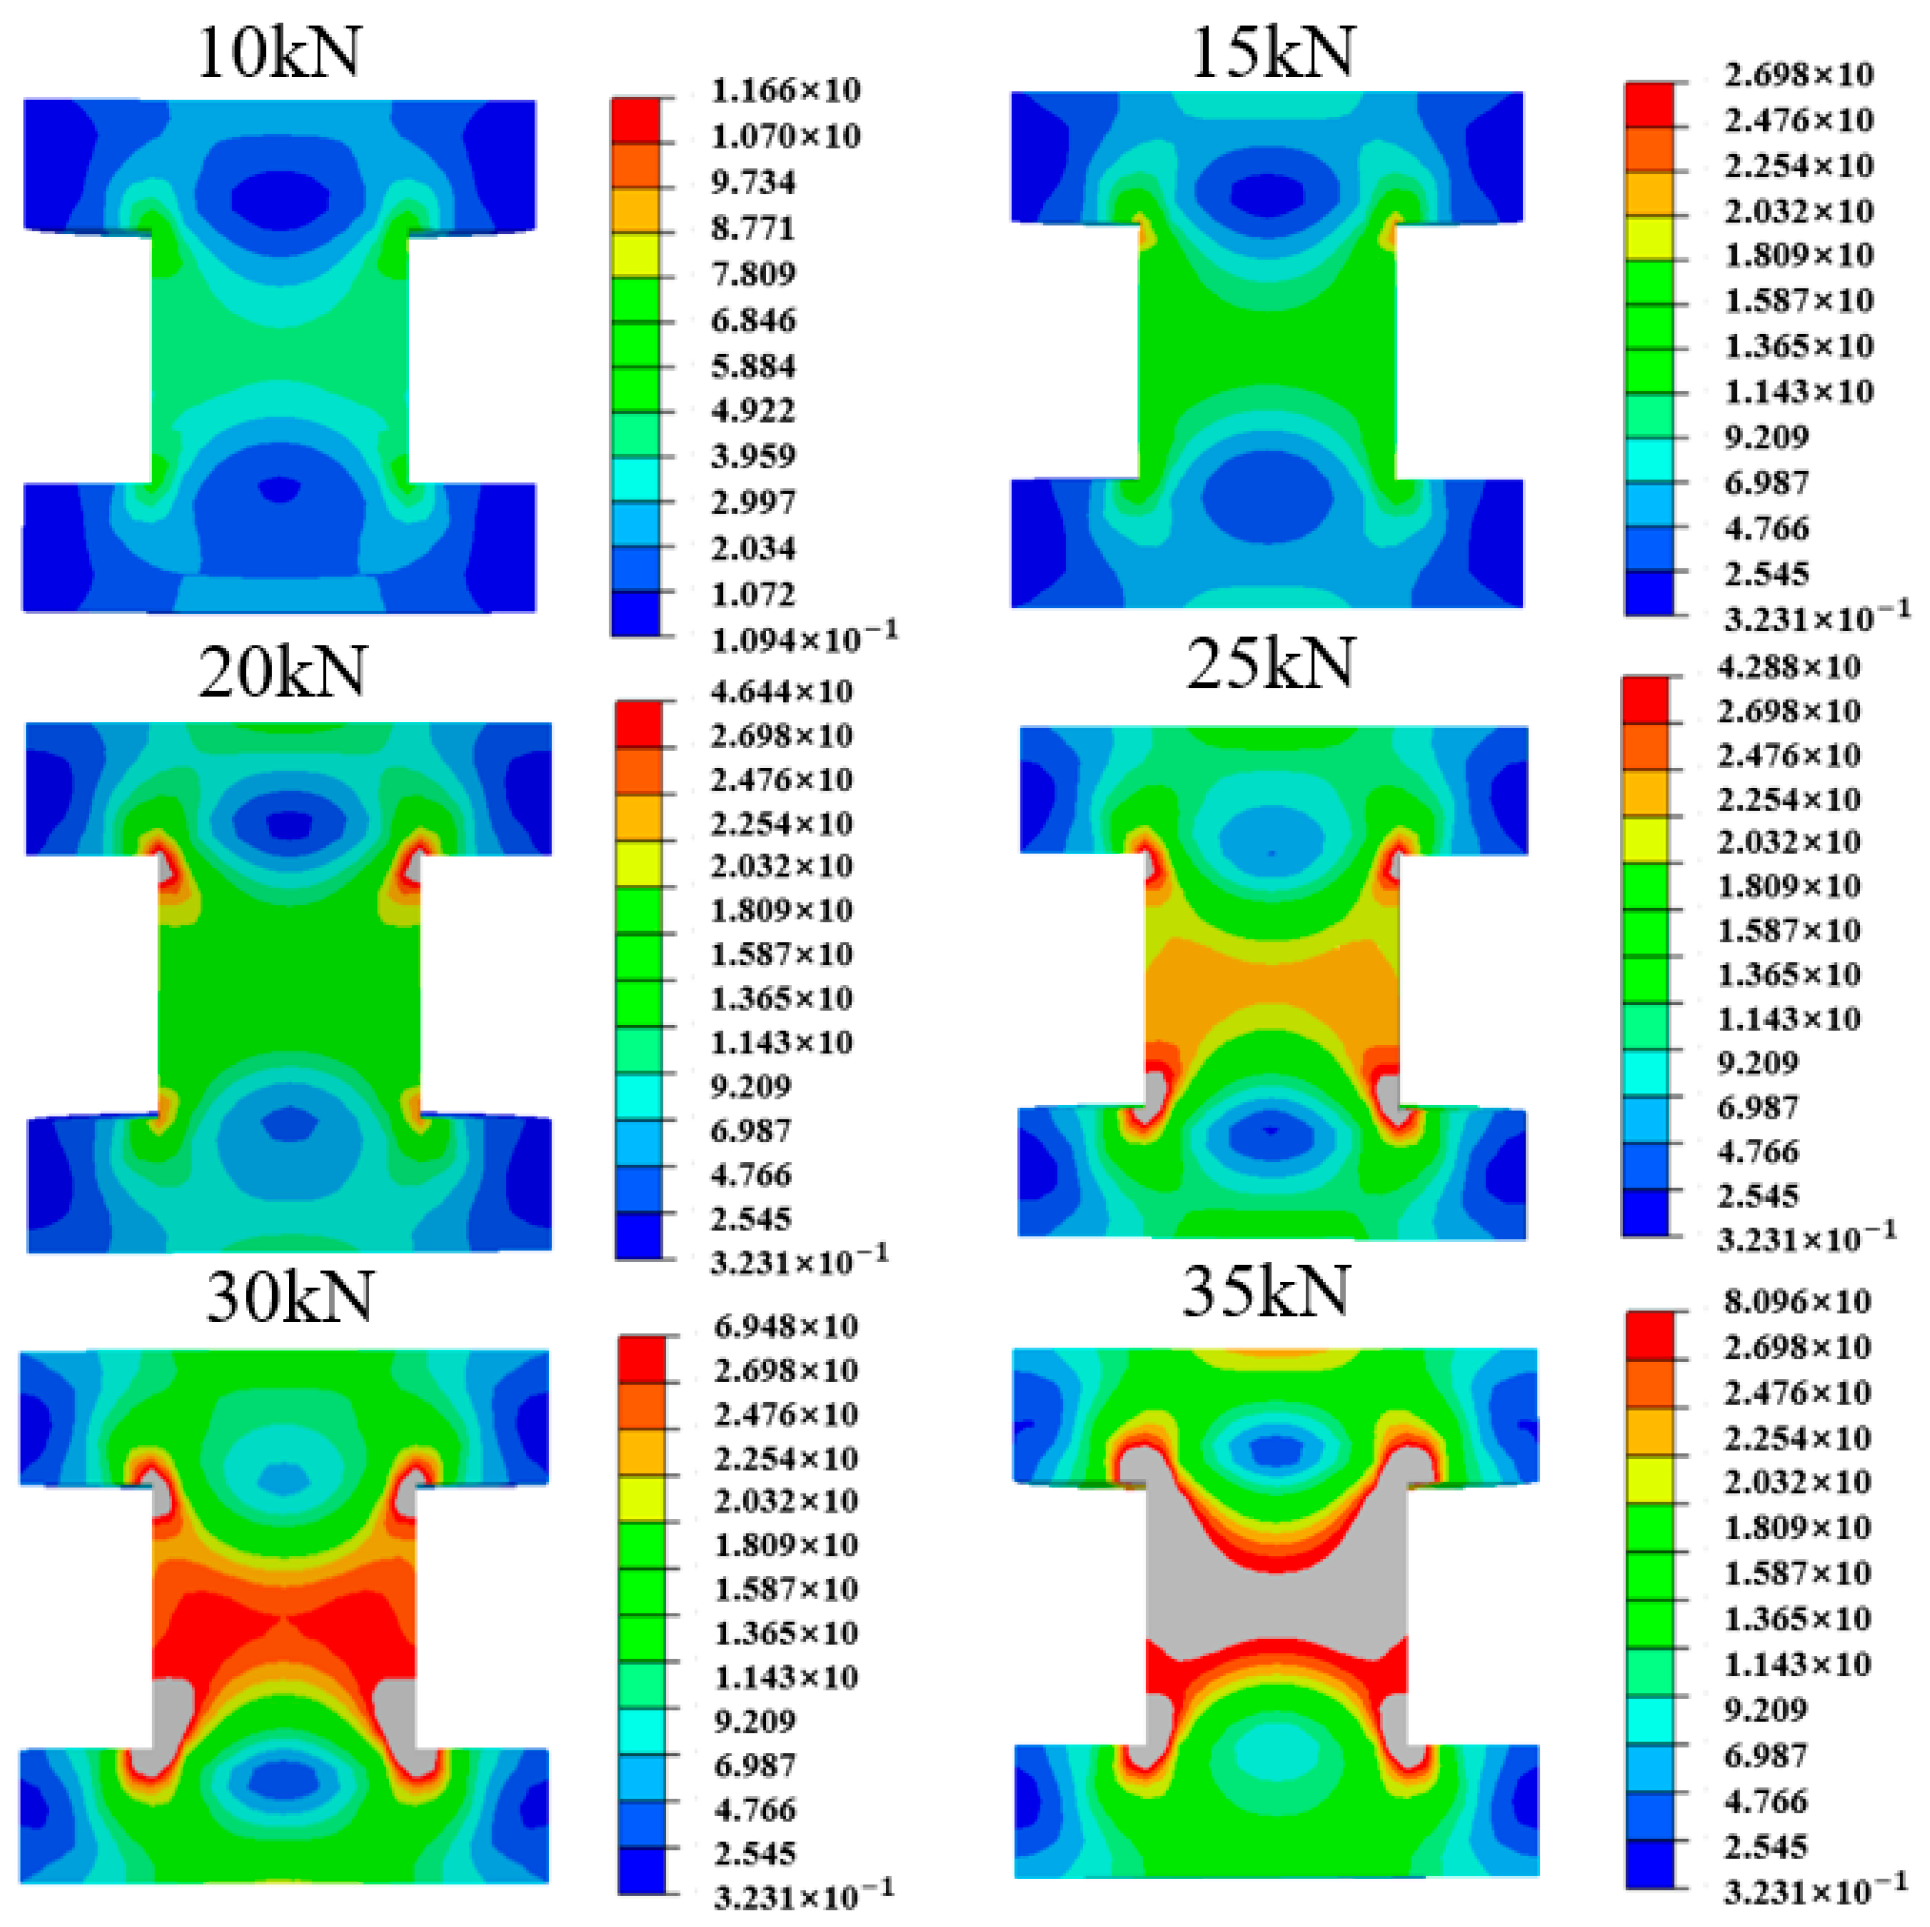
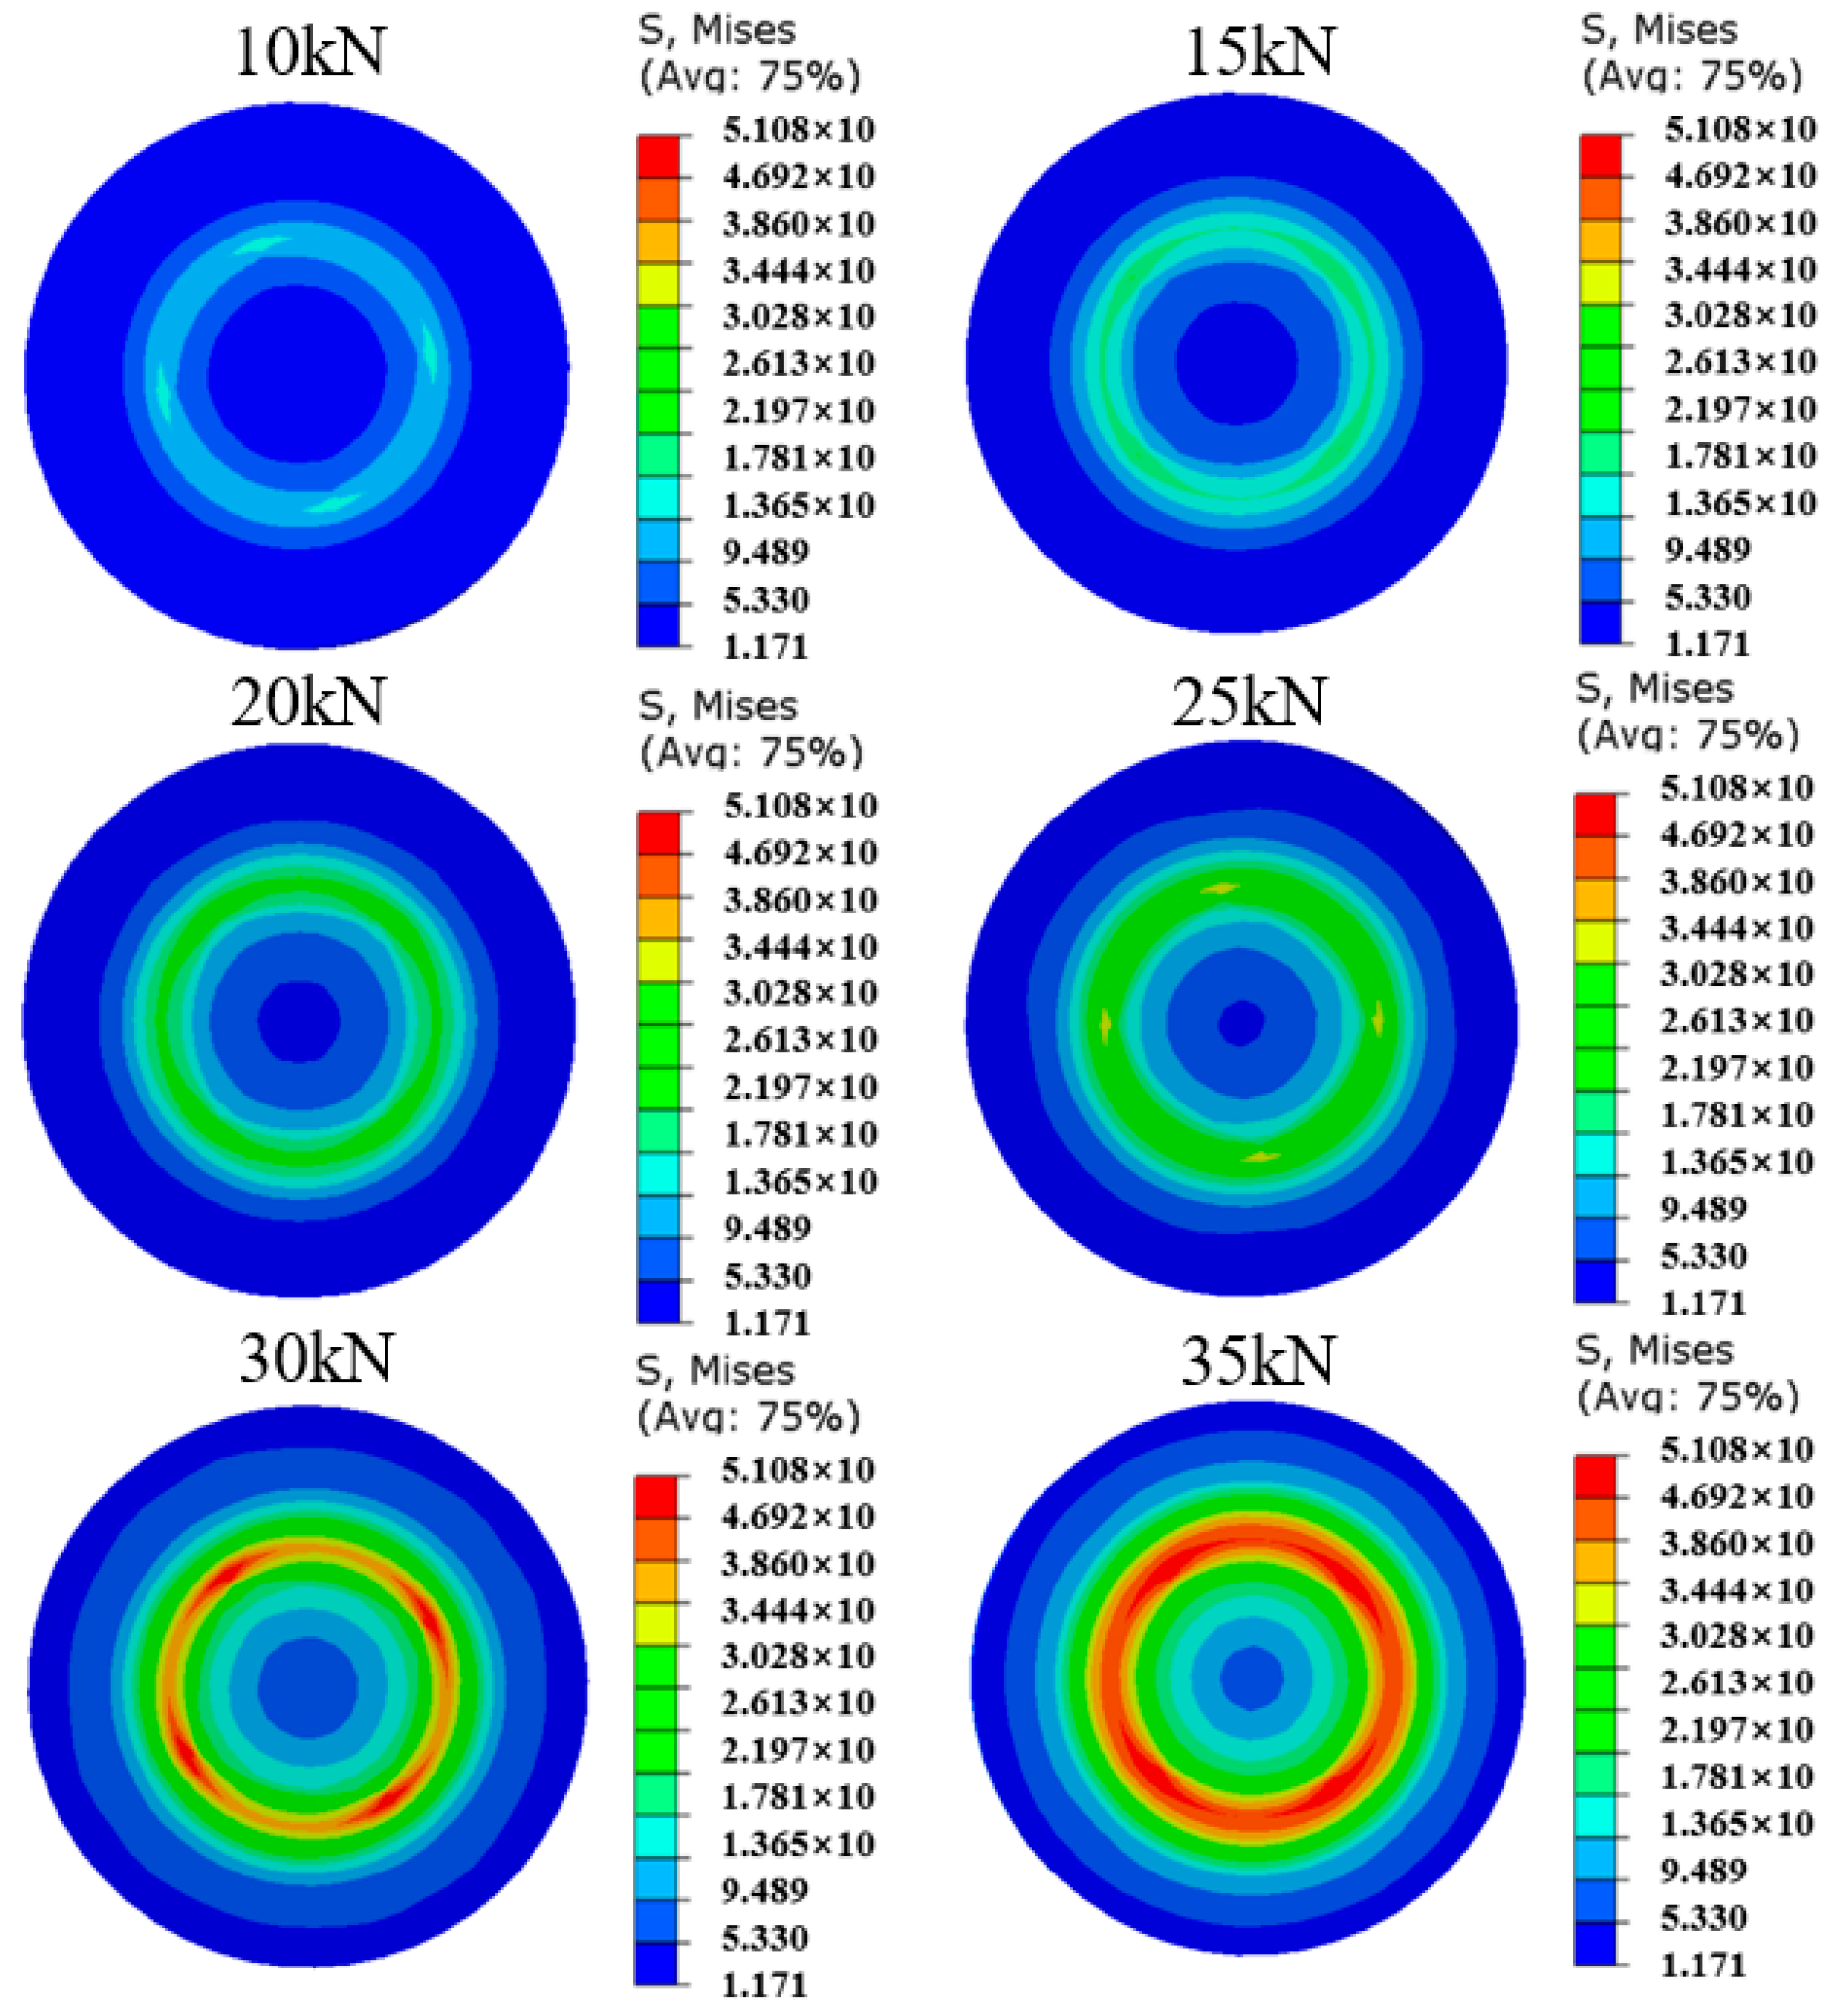
During assembly, the bolt shank is in a stretched state. Six preload forces of 10 kN, 15 kN, 20 kN, 25 kN, 30 kN, and 35 kN were selected for simulation analysis, and the results are shown in Figure 3. From the stress cloud diagram, it can be seen that as the preload force value increases, the stress on the bolt shank also increases. This also verifies that the preload force selected in this experiment will not cause destructive stretching of the bolt and is within the safe value range. Since the piezoelectric film sensor is fabricated on the lower surface of the bolt head, the stress state on the surface of the bolt head was also simulated and analyzed, as shown in Figure 4.
During the process of loading the bolt, it can be seen from the stress cloud diagram of the bolt head that the area around the bolt head exhibits a ring-shaped strain distribution. The strain first increases and then decreases radially outward from the center and is in a state of compression. In addition, as the applied torque load increases, the ring-shaped strain also shows an increasing trend. According to the characteristics of the piezoelectric materials, piezoelectric materials output voltage when compressed, and the greater the pressure, the greater the output voltage. This also indicates that it is possible to monitor whether the bolt is loosening by monitoring the change in bolt stress.

2.4. Single-Bolt Loosening Test

Single-Bolt Loosening Condition Setting

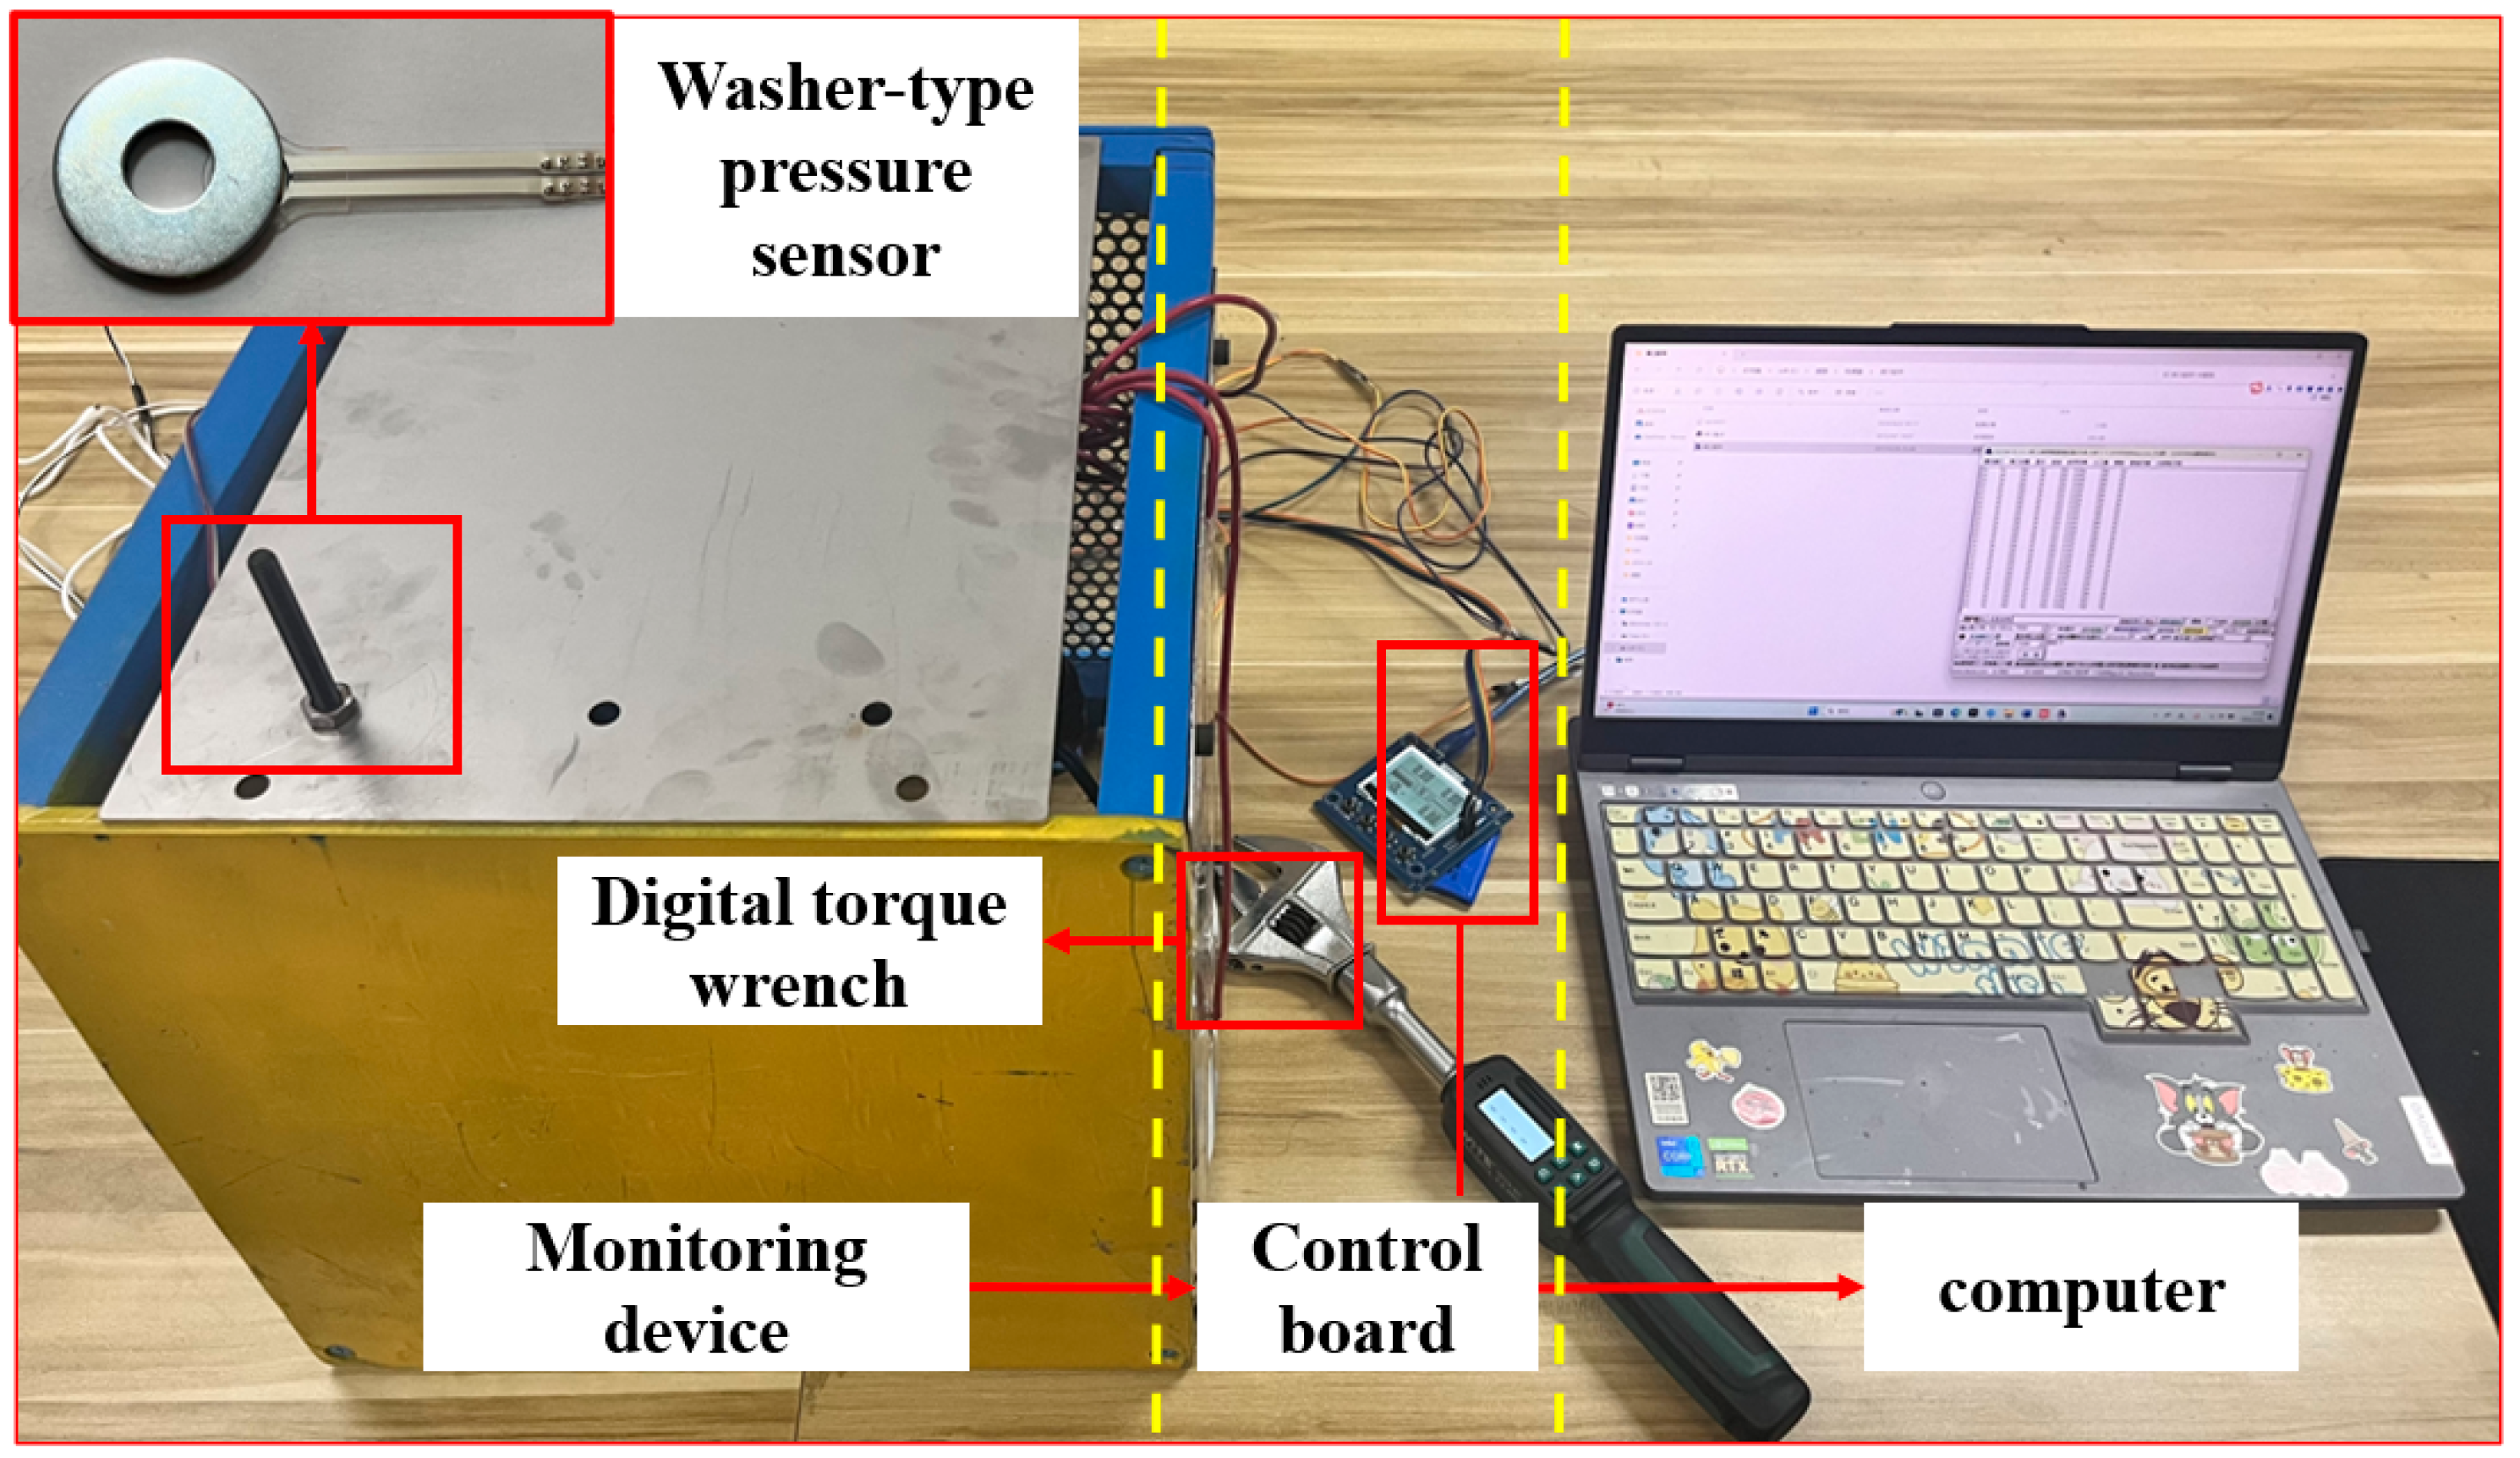
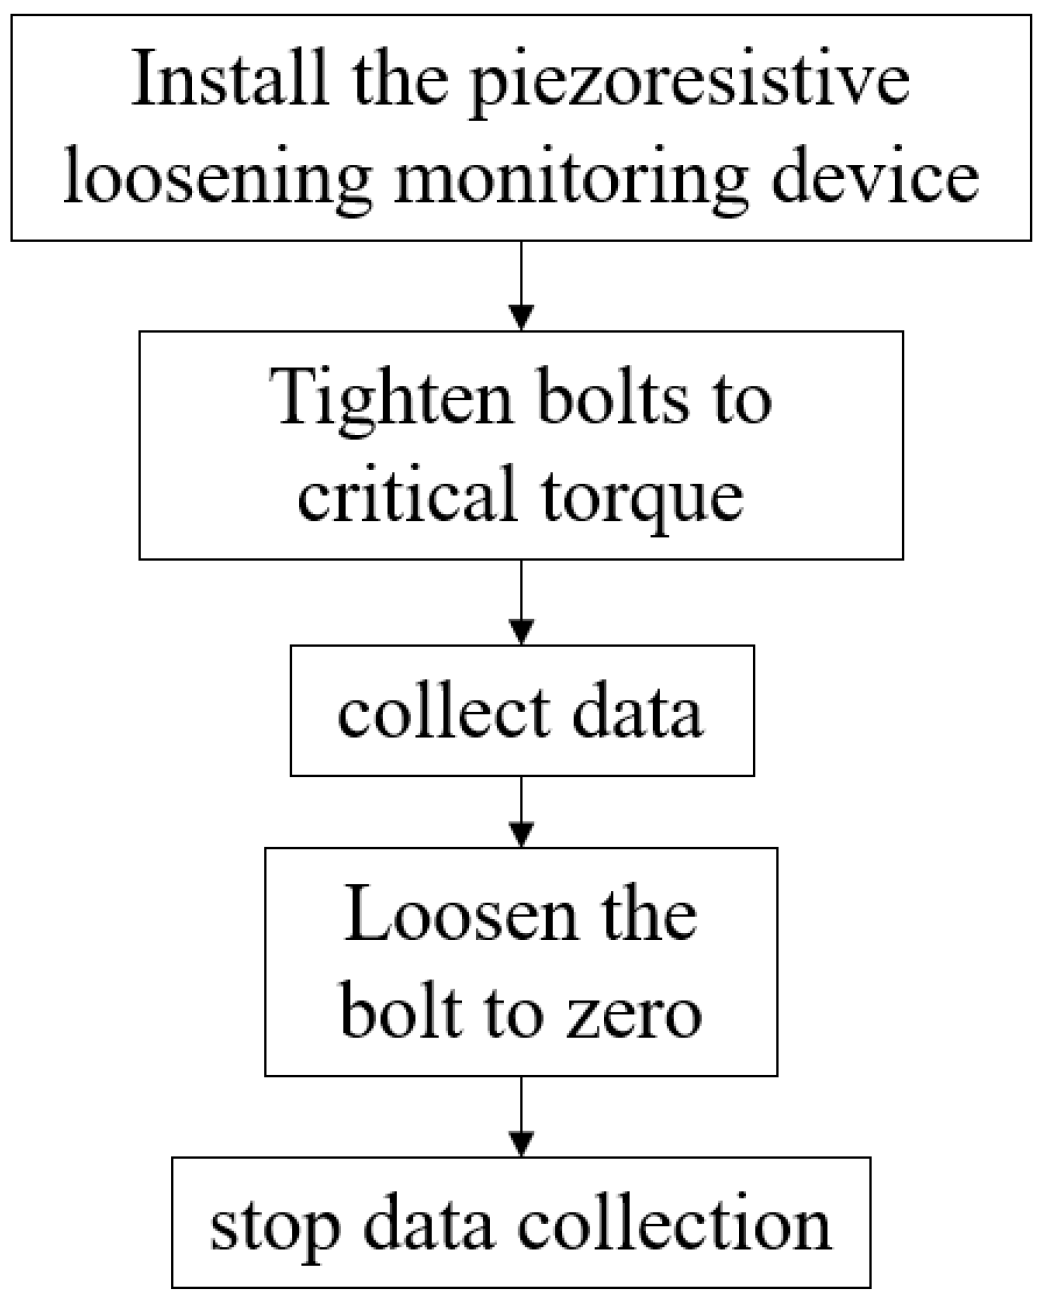
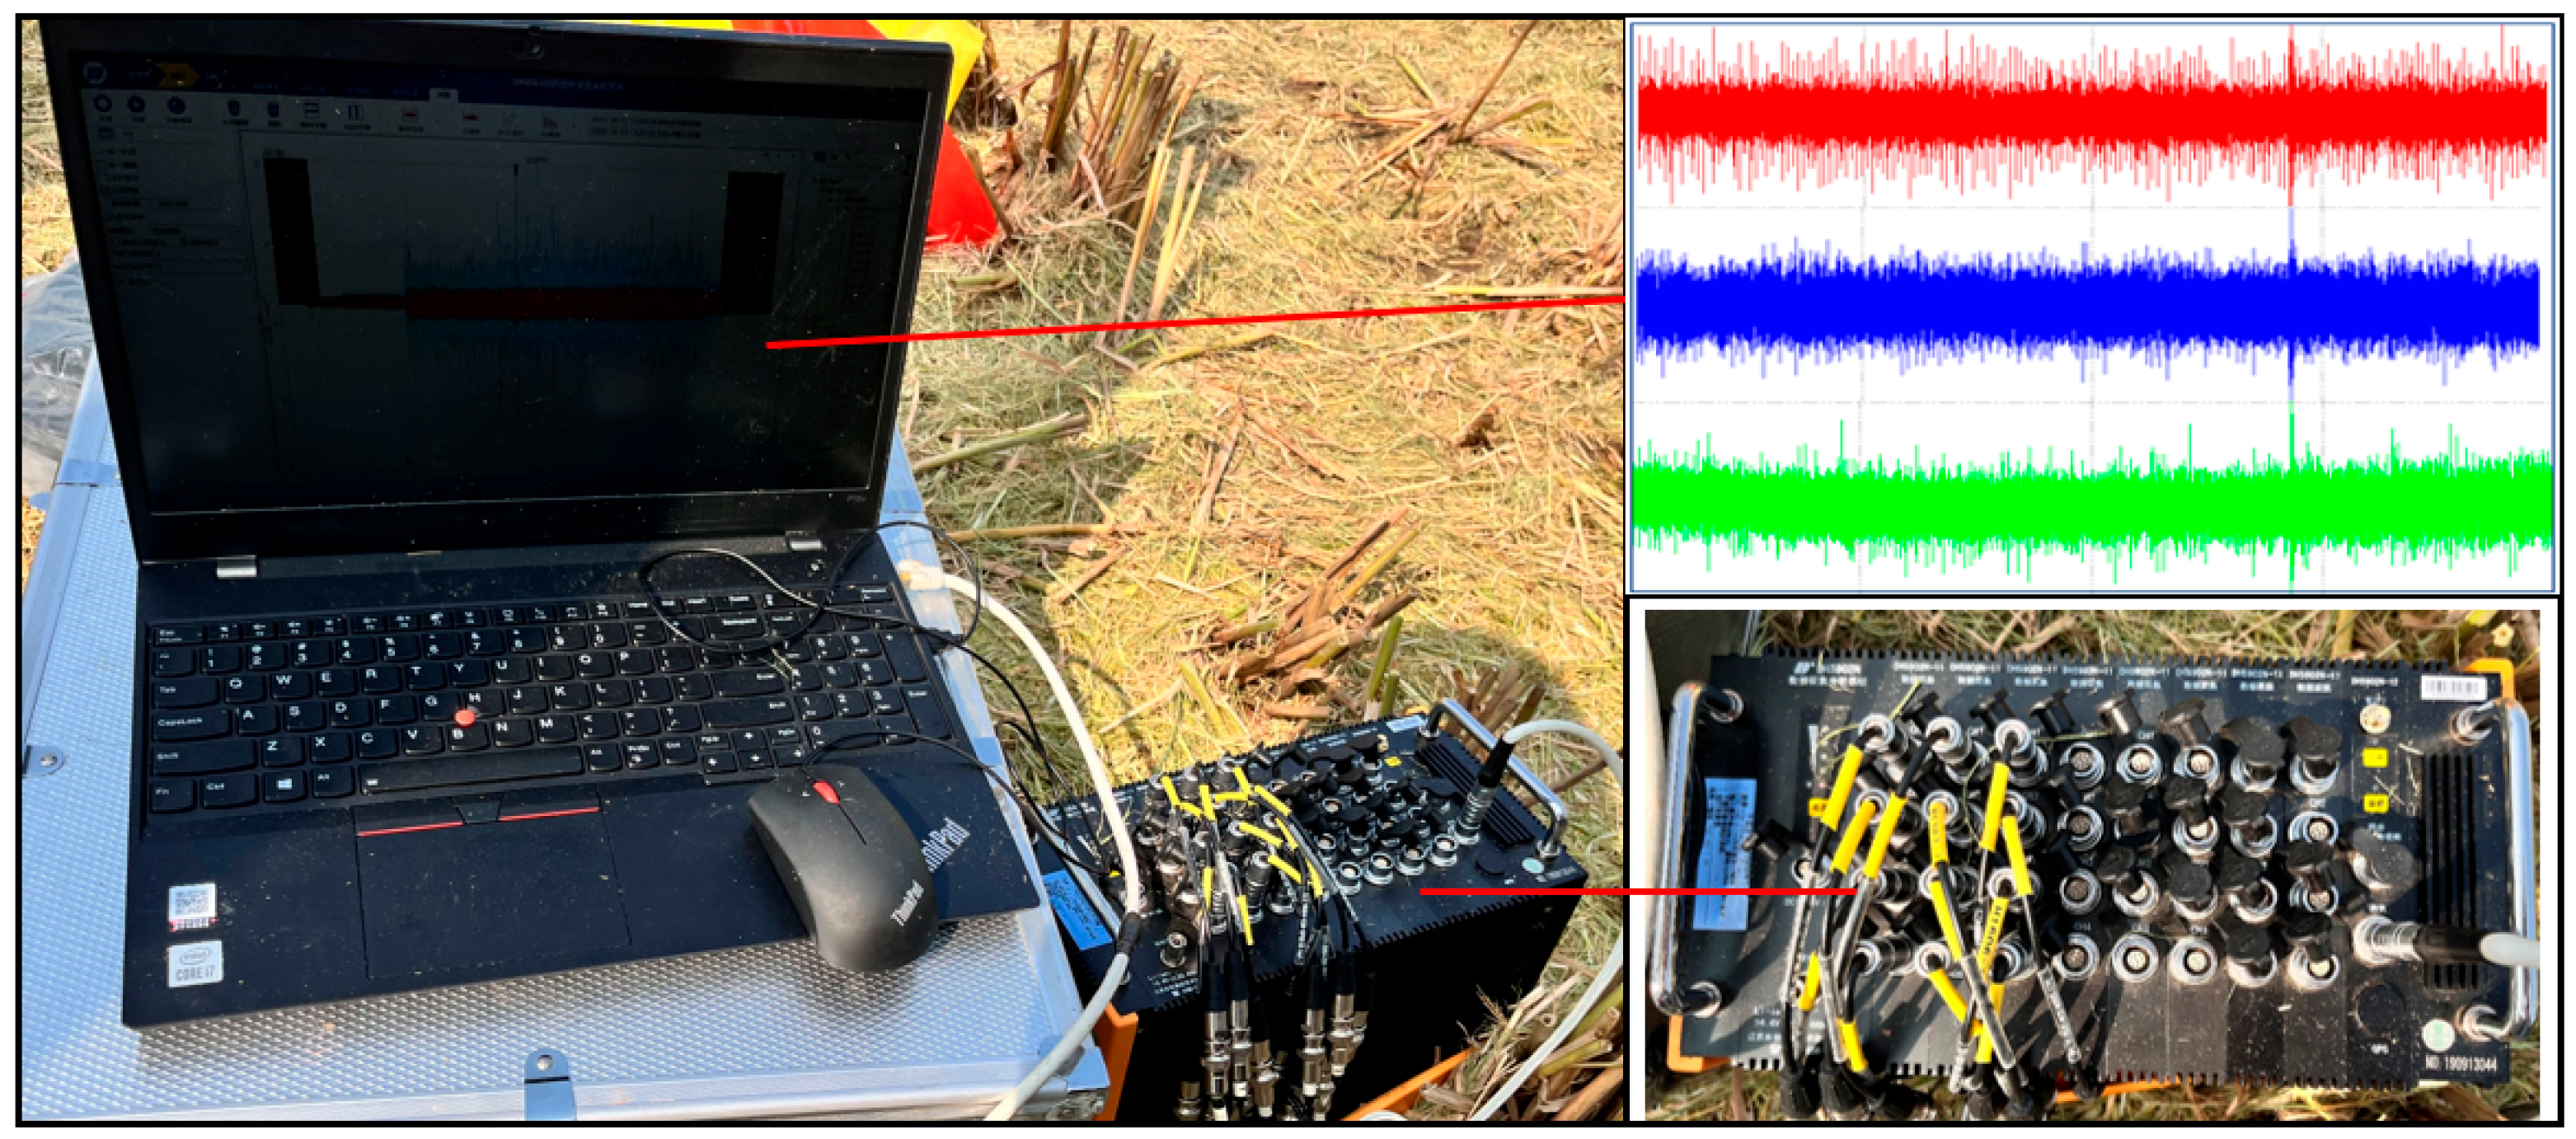
The combine harvester structure connection bolt loosening test system uses a computer as the control core. In this experiment, a computer equipped with STC-ISP software (V6.92) is connected to the STM32 control board through a USB cable. A swept sine wave signal is used as the excitation signal, with a frequency range from 100 kHz to 300 kHz, a voltage amplitude of 3.3 V, and a duration of 1 s. The pre-set excitation signal is emitted through the STM32 control board output channel and the piezoelectric film sensor connected to the output channel in the form of a stress wave, which is transmitted to the test specimen and finally received by the piezoelectric film sensor. It is fed back to the STM32 control board in the form of an electrical signal through the input channel and presented on the computer control panel. The process of bolt pre-tightening and loosening is achieved using a digital display torque wrench and an adjustable wrench. The digital display torque wrench has the advantage of having an accurate display and is suitable for precise assembly and control of thread torque. The maximum range of the digital display torque wrench used in this experiment is 84 N·m, and the measurement division is 0.1 N·m. The experimental procedure is shown in Figure 5. First, install the piezoelectric film sensor, then tighten the bolt to the critical torque, turn on the control board to start collecting data, and use the digital display wrench to loosen the bolt to gradually reduce the torque to 0. At this point, stop collecting data. The on-site test diagram is shown in Figure 6.

2.5. Vibration Test of Vibrating Screen Connection Bolts

2.5.1. Composition of Vibration Testing System

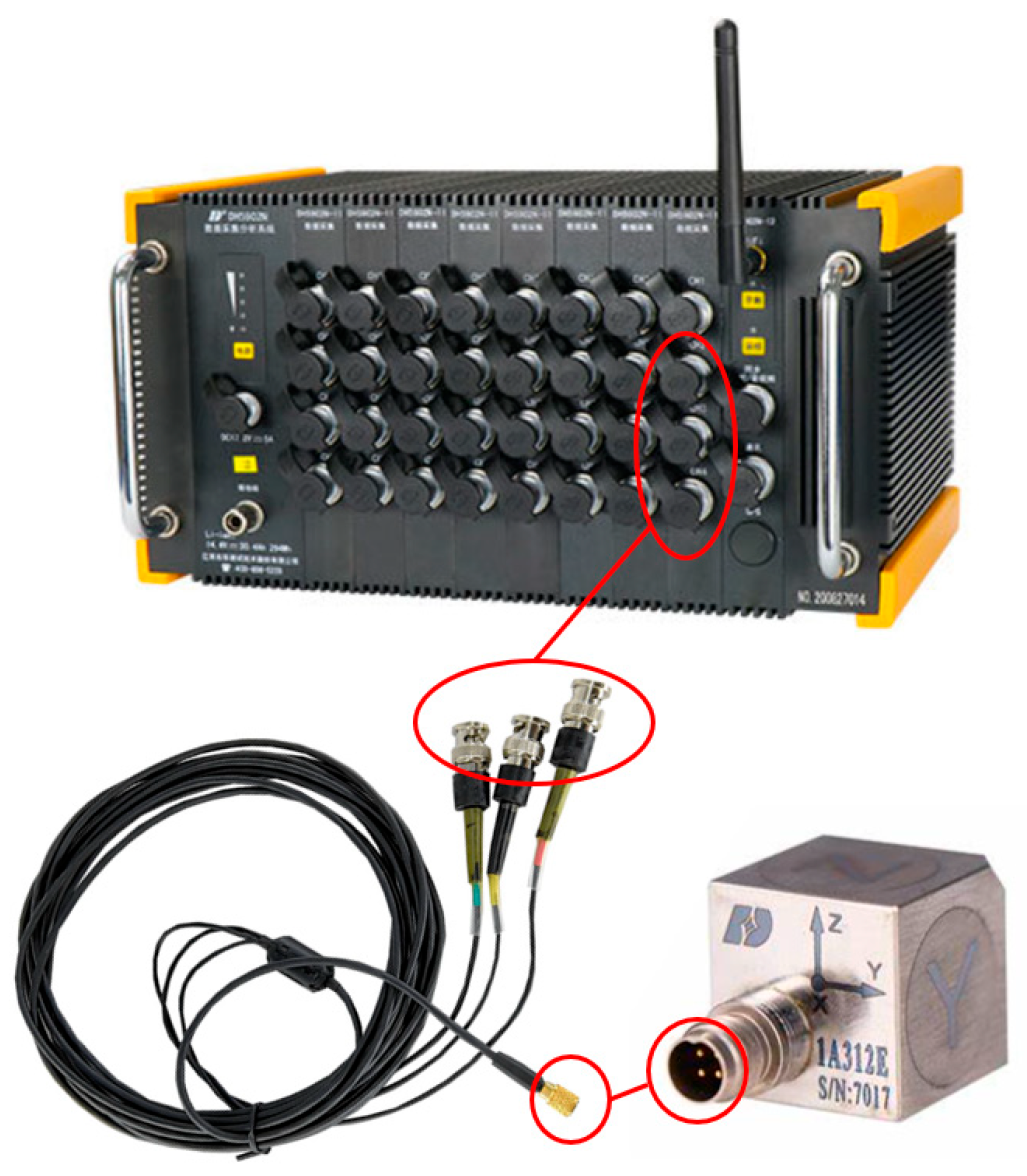
The vibration testing system mainly consists of a DH5902N signal acquisition instrument, triaxial accelerometers, and a DHDAS dynamic signal acquisition system provided by Jiangsu Donghua Testing Technology Co., Ltd. First, the relevant parameters of the dynamic signal analyzer are set, and the sampling frequency is set to 2.56 kHz. The key performance parameters are detailed in the specification Table 1 below.
The DH5902N dynamic acquisition instrument and DHDAS dynamic signal acquisition and analysis system are shown in Figure 7 and Figure 8. The three-colored waveforms in the figure correspond to time-domain acceleration signals along three orthogonal directions (X, Y, Z), where: Red (X): Lateral acceleration, representing left-right movement; Blue (Y): Longitudinal acceleration, representing fore-aft movement; Green (Z): Vertical acceleration, representing up-down movement.
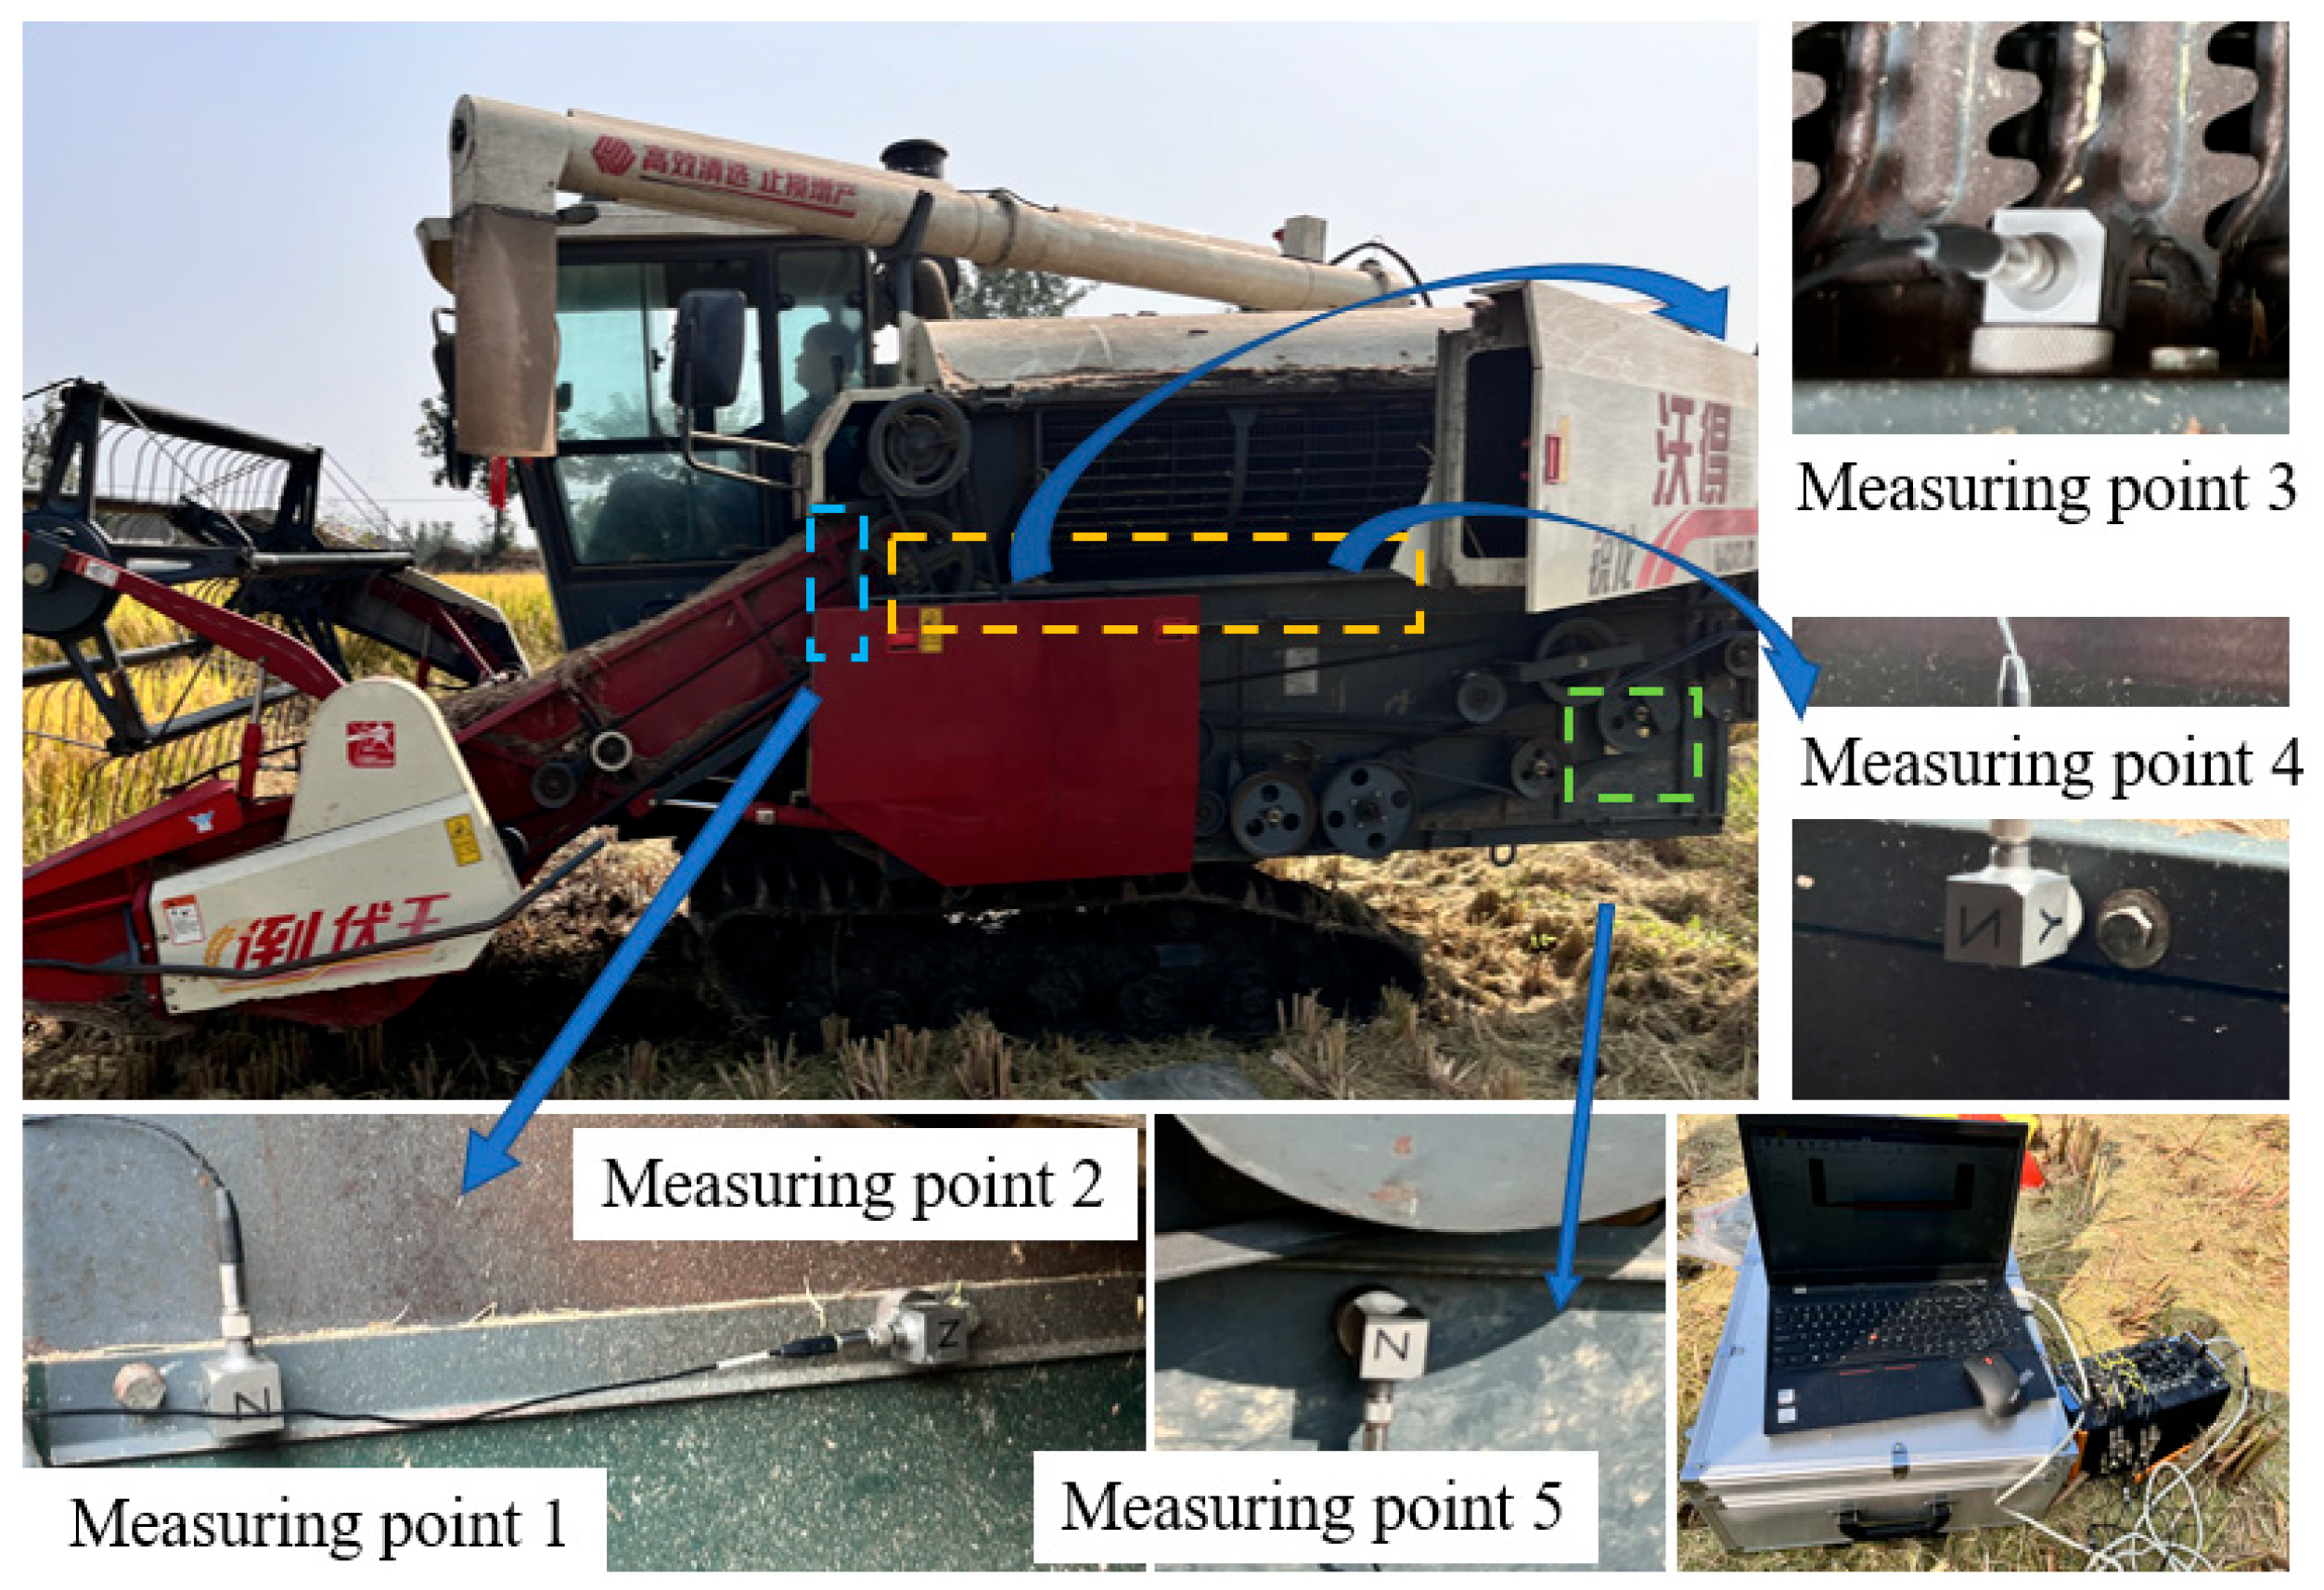
One end of the triaxial accelerometer is fixed to the corresponding measuring point on the vibrating screen frame, and the other end’s three signal lines, X, Y, and Z (model 1A312E), are connected to the chl~ch3 channels of the dynamic signal analyzer, respectively. Subsequently, the dynamic signal analyzer saves the data collected by the sensor, and then the signal data are imported into the software for spectrum transformation (FFT) to obtain the corresponding spectrum signal. Finally, the time domain and frequency domain signals of each measuring point when the vibrating screen vibrates are compared and analyzed. The arrangement of each measuring point and the corresponding direction of the triaxial accelerometer channels are shown in Table 2 below.

2.5.2. Experimental Plan and Procedure

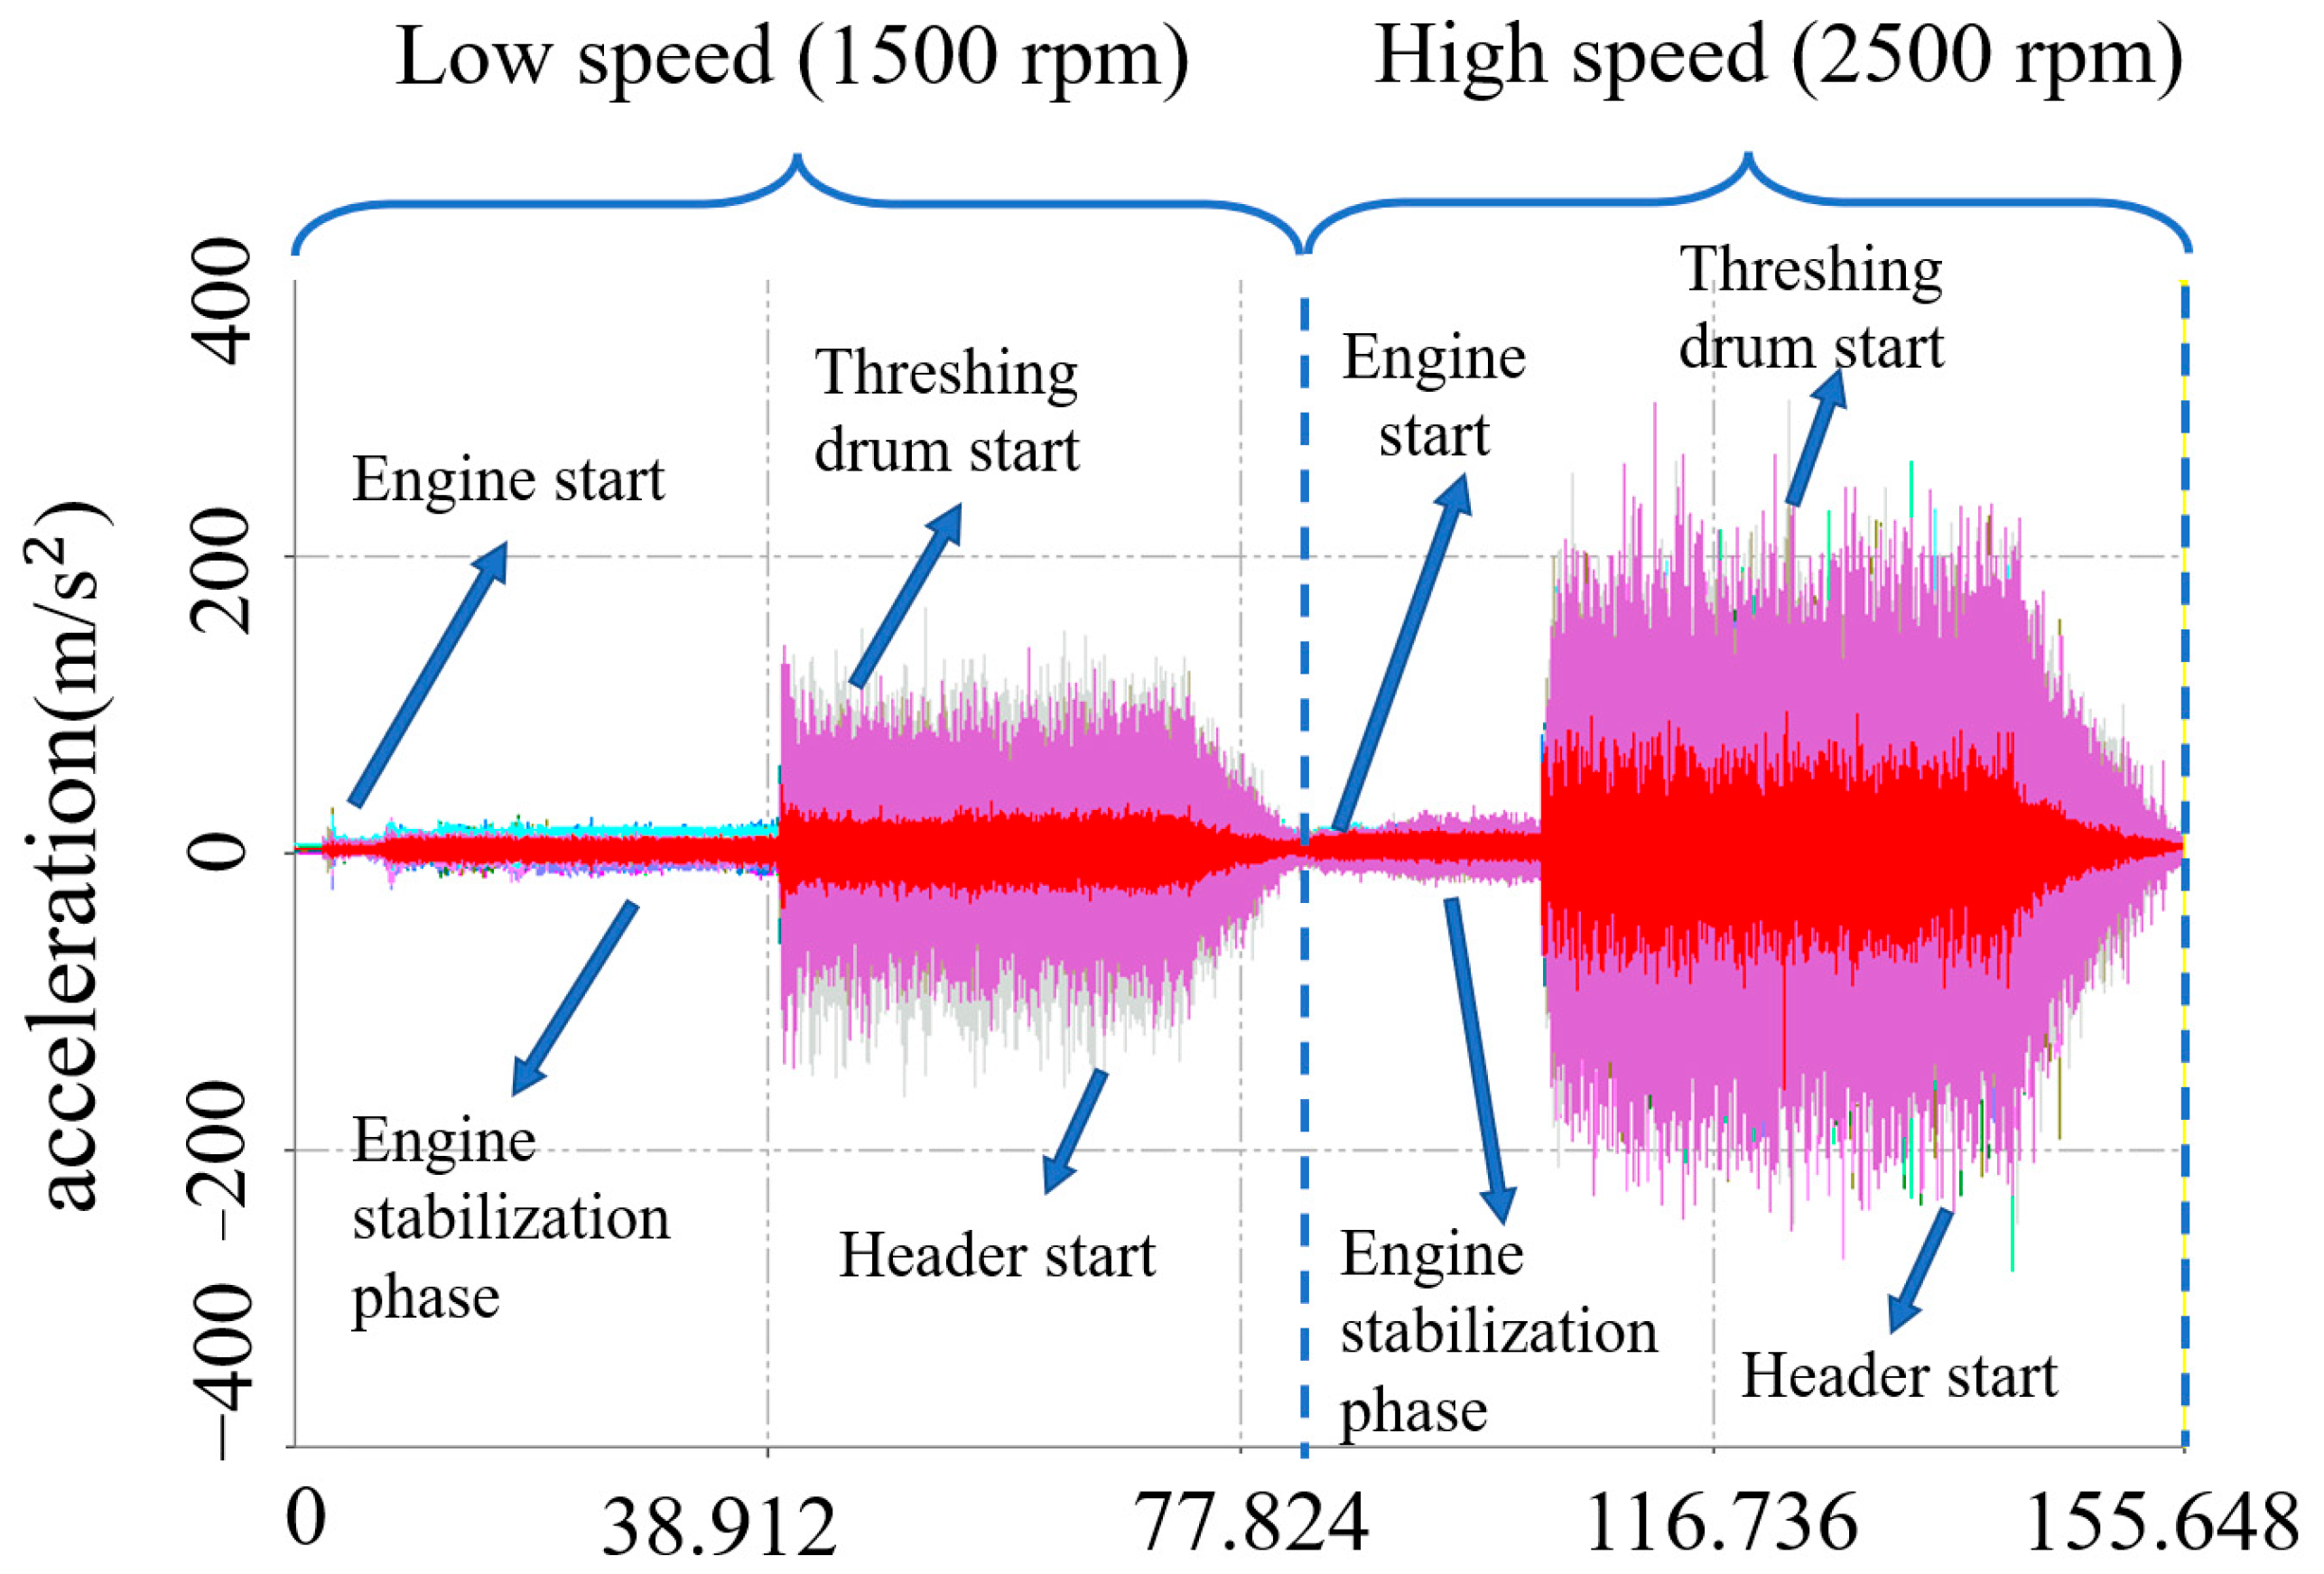
In this experiment, accelerometers were used to collect and save the vibration signals in three directions from five measuring points on the bolted connections of the vibrating screen of a combine harvester. There are 15 channels in the xyz direction of the five measuring points, and different colors correspond to different channels. The harvester model was World 4LZ-5.0 E Ruilong, and the test site was Xinfeng Town, Zhenjiang, Jiangsu Province. The specific experimental procedure was as follows: The sensors were attached to the corresponding parts of the harvester vibrating screen, as shown in Figure 9. The arrangement of each measuring point and the corresponding direction of the triaxial accelerometer channels are shown in Table 2. Five sensors were used to collect data simultaneously from fifteen channels of the acquisition instrument. The instrument sampling frequency was set to 2.56 kHz to ensure that the collected signals did not alias. After setting the parameters, the combine harvester was started. The high engine speed was 2500 min−1, and the low speed was 1500 min−1. After starting the combine harvester and waiting for the signal to stabilize, 2 min of vibration signals in three directions were collected from each measuring point. To collect the vibration signals of the working devices under different operating conditions, the harvester was first started to allow the engine to work independently. After stable operation, the threshing cylinder device was started; then, the header was started. Finally, the header, threshing cylinder, and engine were shut down sequentially to achieve a multi-condition test in one run. The experiment was repeated twice to obtain the vibration response of the bolted connections of the vibrating screen, the main working component of the combine harvester, resulting in the acceleration signals shown in Figure 10.

3. Results and Discussion

3.1. Analysis of Single-Bolt Test Data

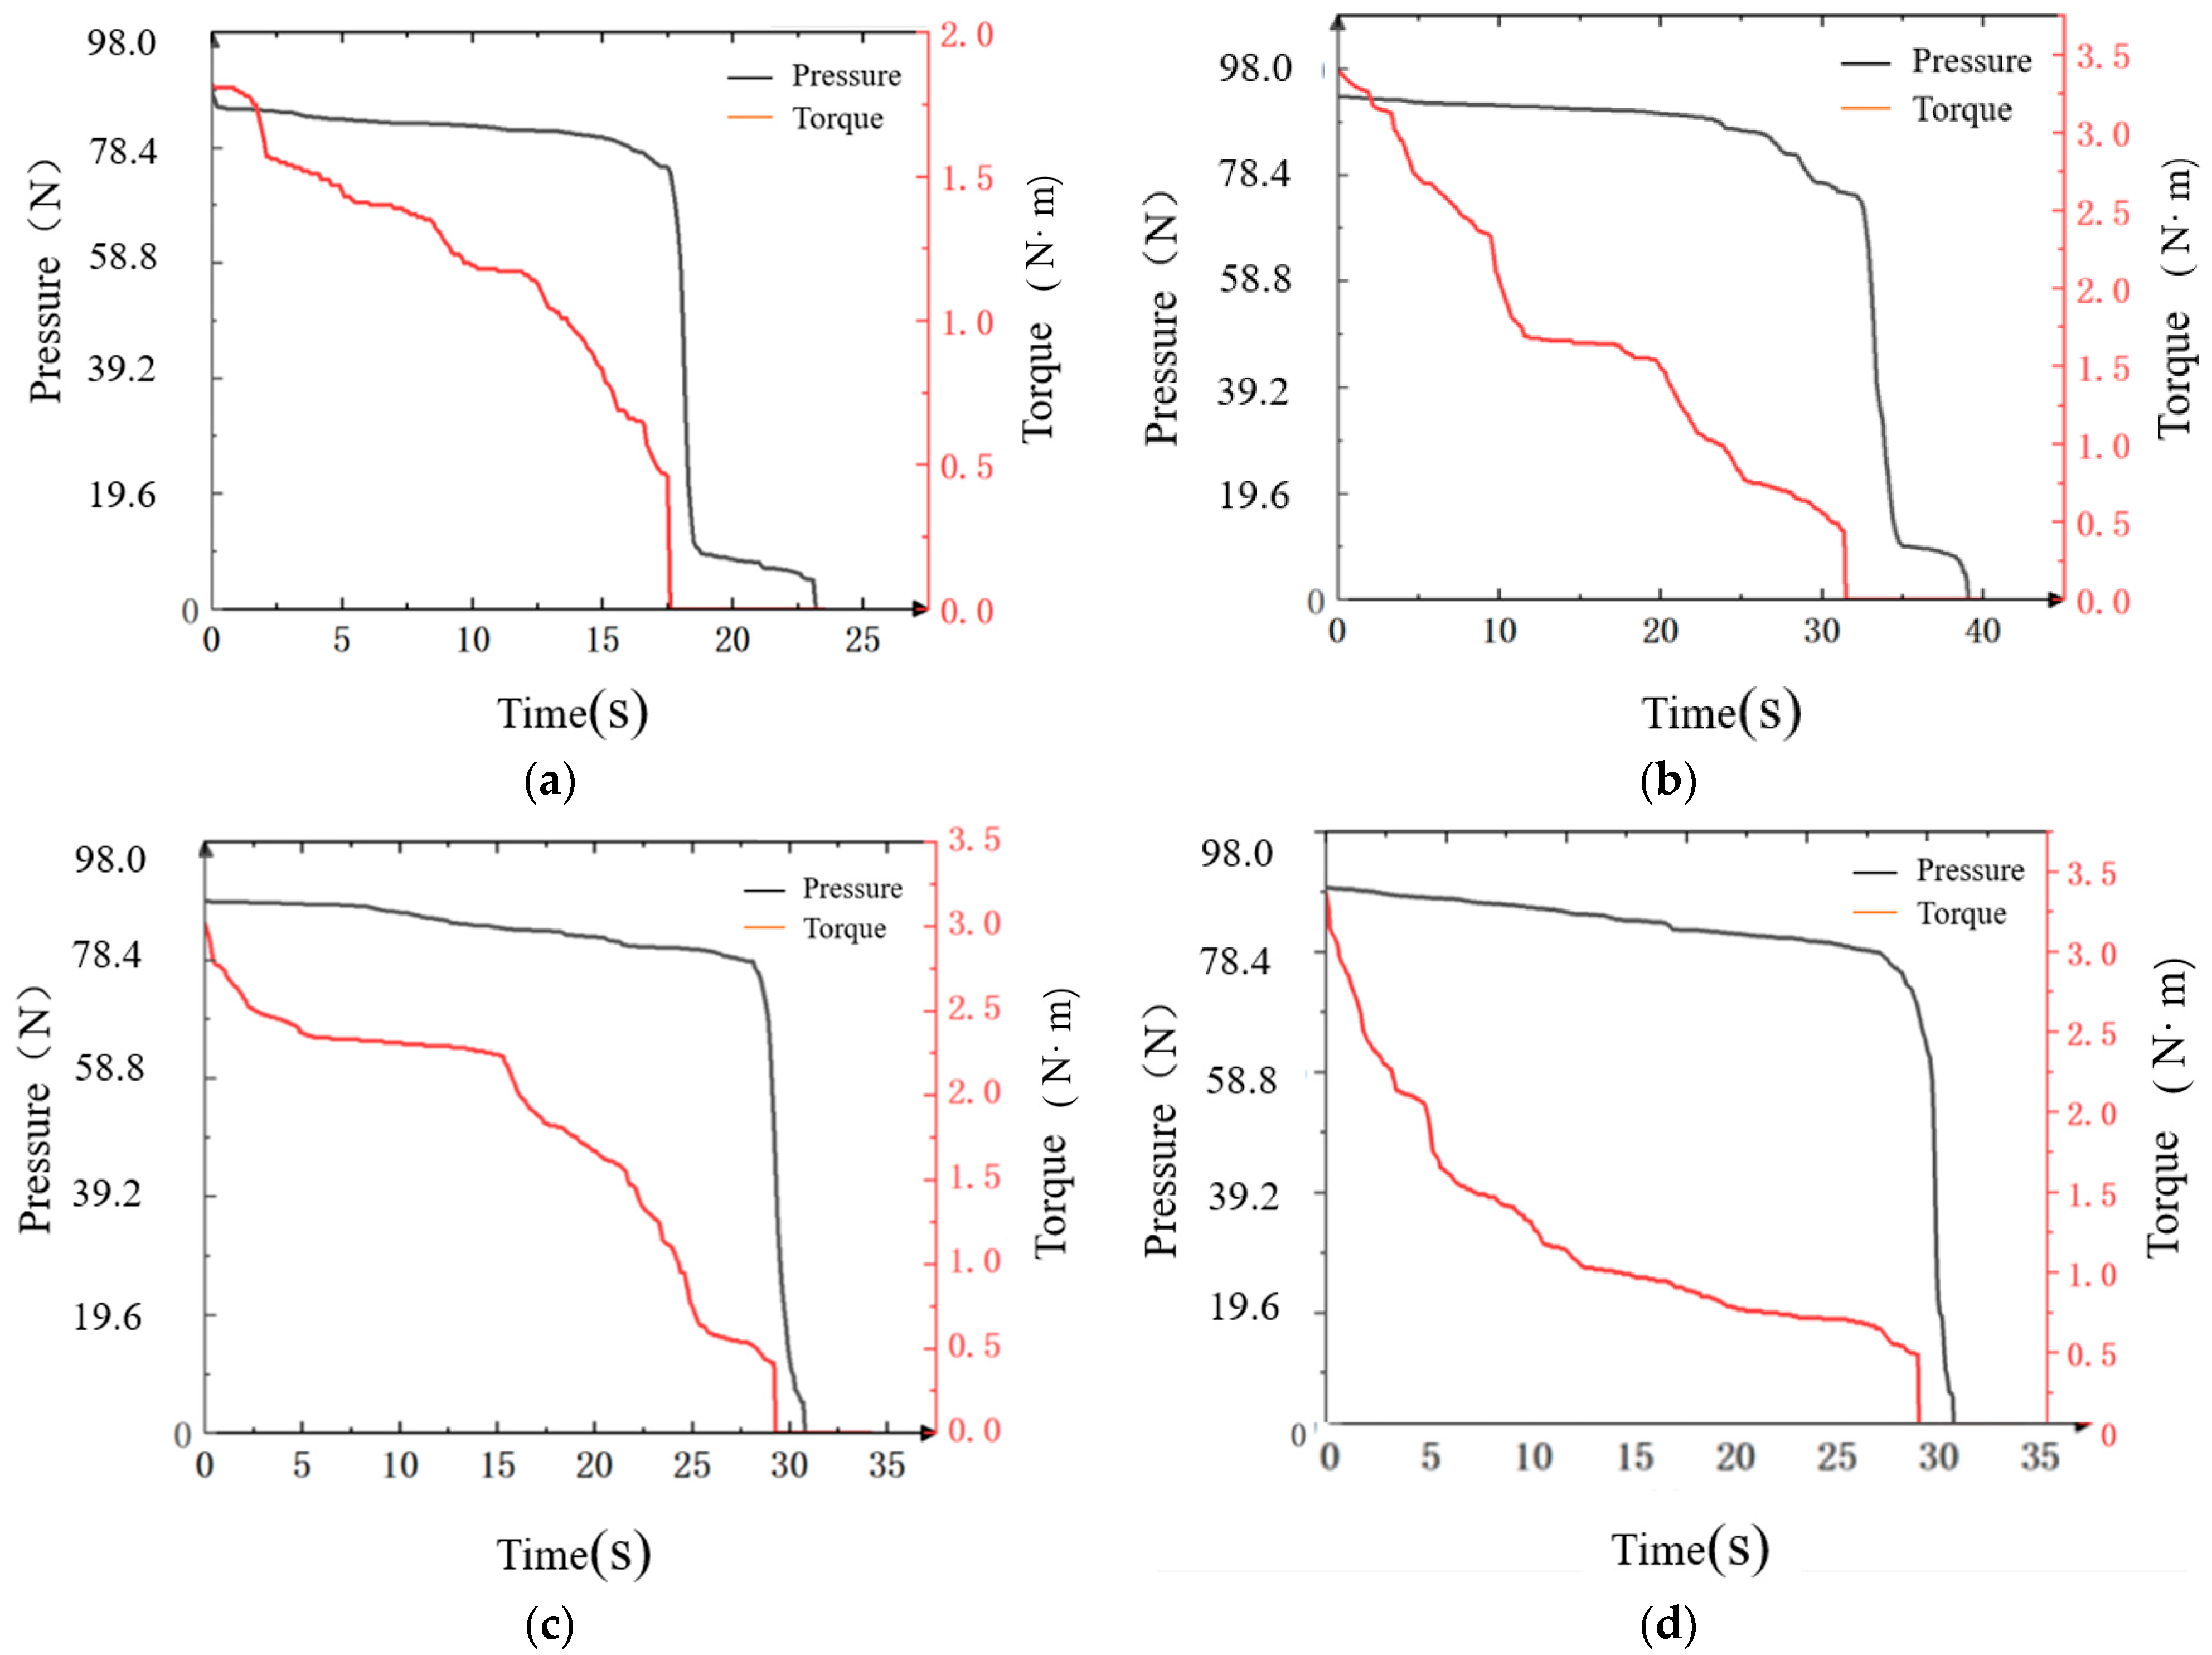
A total of four tests were carried out in this experiment to confirm the accuracy of the piezoelectric film sensor identification results. The test results of the four groups of data are shown in Figure 7. The abscissa is the time recorded at the beginning of the test, and the ordinate is the pressure and torque, with units of N and N·m.
As can be seen from Figure 11, the basic pattern of torque changing with time is that, as the bolt is continuously loosened, the torque value displayed by the digital display wrench gradually decreases in a linear correlation until the bolt is completely loosened, the torque value suddenly changes to 0, and a plateau section appears, indicating that the wrench is no longer loosening at this time, and the bolt loosening reaches the maximum value. In addition, it can be seen that the pressure change pattern is different from the torque change pattern. First, there is a plateau stage where the pressure value decreases slowly. When the bolt loosening threshold is reached, the pressure drops sharply until it reaches 0. Since the loosening process is simulated manually, the loading time of each segment is not the same when using a wrench to simulate loosening. However, it can be seen that the changing trends of the four sets of test data are basically the same. After the bolt is no longer loosened, the values of pressure and torque quickly return to 0. It was also found that when the pressure is reduced to 78.4 N and the torque reaches 0.5 N·m, the bolt loosening intensifies, and the pressure value drops sharply, indicating that the bolt loosening threshold is reached at this time. This indicates that, despite some discontinuities in the simulated loosening process, the observed results are consistent and repeatable at the same degree of loosening. This provides strong data support for our further study and analysis of bolt loosening.

3.2. Vibration Characteristics Analysis of Connection Bolts

3.2.1. Kurtosis Factor Analysis of Vibration Response

The kurtosis factor of the vibration signal of a loosened bolt can be used to evaluate the sharpness of the signal, thereby indirectly reflecting the degree of bolt loosening. The kurtosis factor can measure the tail weight of the signal and is used to determine the non-Gaussianity and sharpness of the signal.
KU = 1 N i = 1 N x i μ 4 1 N i = 1 N x i μ 2 2 3
where KU represents the sample kurtosis. xi represents the i-th data point in the dataset. μ represents the mean (average) of the dataset. N represents the total number of data points in the dataset.
Generally, if the kurtosis factor of the vibration signal caused by bolt loosening is large, it indicates that the tail weight of the signal is large, i.e., there are more outliers or non-Gaussian distribution components, which may be related to the characteristics of the vibration signal caused by bolt loosening. In this paper, the three-way (XYZ) vibration signals of the sensor are extracted for quantitative analysis, and three time domain features are solved. The random sampling method is used to generate three kurtosis factor values for random segments through the MATLAB (R2022a) randi function. Then, the features of the entire data segment are measured by analyzing these three calculated feature values. From the perspective of early fault diagnosis of precision bolted connections, it was considered that the structure is experiencing a loosening fault when the kurtosis factor value exceeds 4, and the structure has experienced a serious loosening fault when the kurtosis factor exceeds 7 [51].
As shown in Table 3, measuring point 1-X has the largest kurtosis factor of 5.22, which is much larger than the 1-Y and 1-Z directions. This indicates that the combine harvester will experience severe body shaking in the vertical direction at a certain time interval during normal operation, resulting in a significant increase in impacts and collisions during this period, which affects the service life of the bolted connections. The maximum kurtosis values in the 2-Z, 4-Y, and 4-Z directions are relatively small compared to point 1-X but are much higher than the normal distribution value, belonging to a super-Gaussian signal state. The state of the bolted connections at other measuring points is relatively stable during the working process, with no frequent impacts and collisions, and the damage to the bolts is lighter.

3.2.2. Skewness Factor Analysis of Vibration Response

The skewness factor is a statistical indicator that describes the skewness of a data distribution, that is, the degree to which the data deviates from the mean in the dataset [52].
SK = 1 N i = 1 N x i μ 2 1 N i = 1 N x i μ 2 3
In the vibration response signal of a combine harvester, the main reason for the skewness factor is that an unbalanced collision occurs in one direction of the bolted connection, resulting in the asymmetry of the response signal about the zero axis. Therefore, it can be used to measure the unbalanced impact characteristics of the bolted connection.
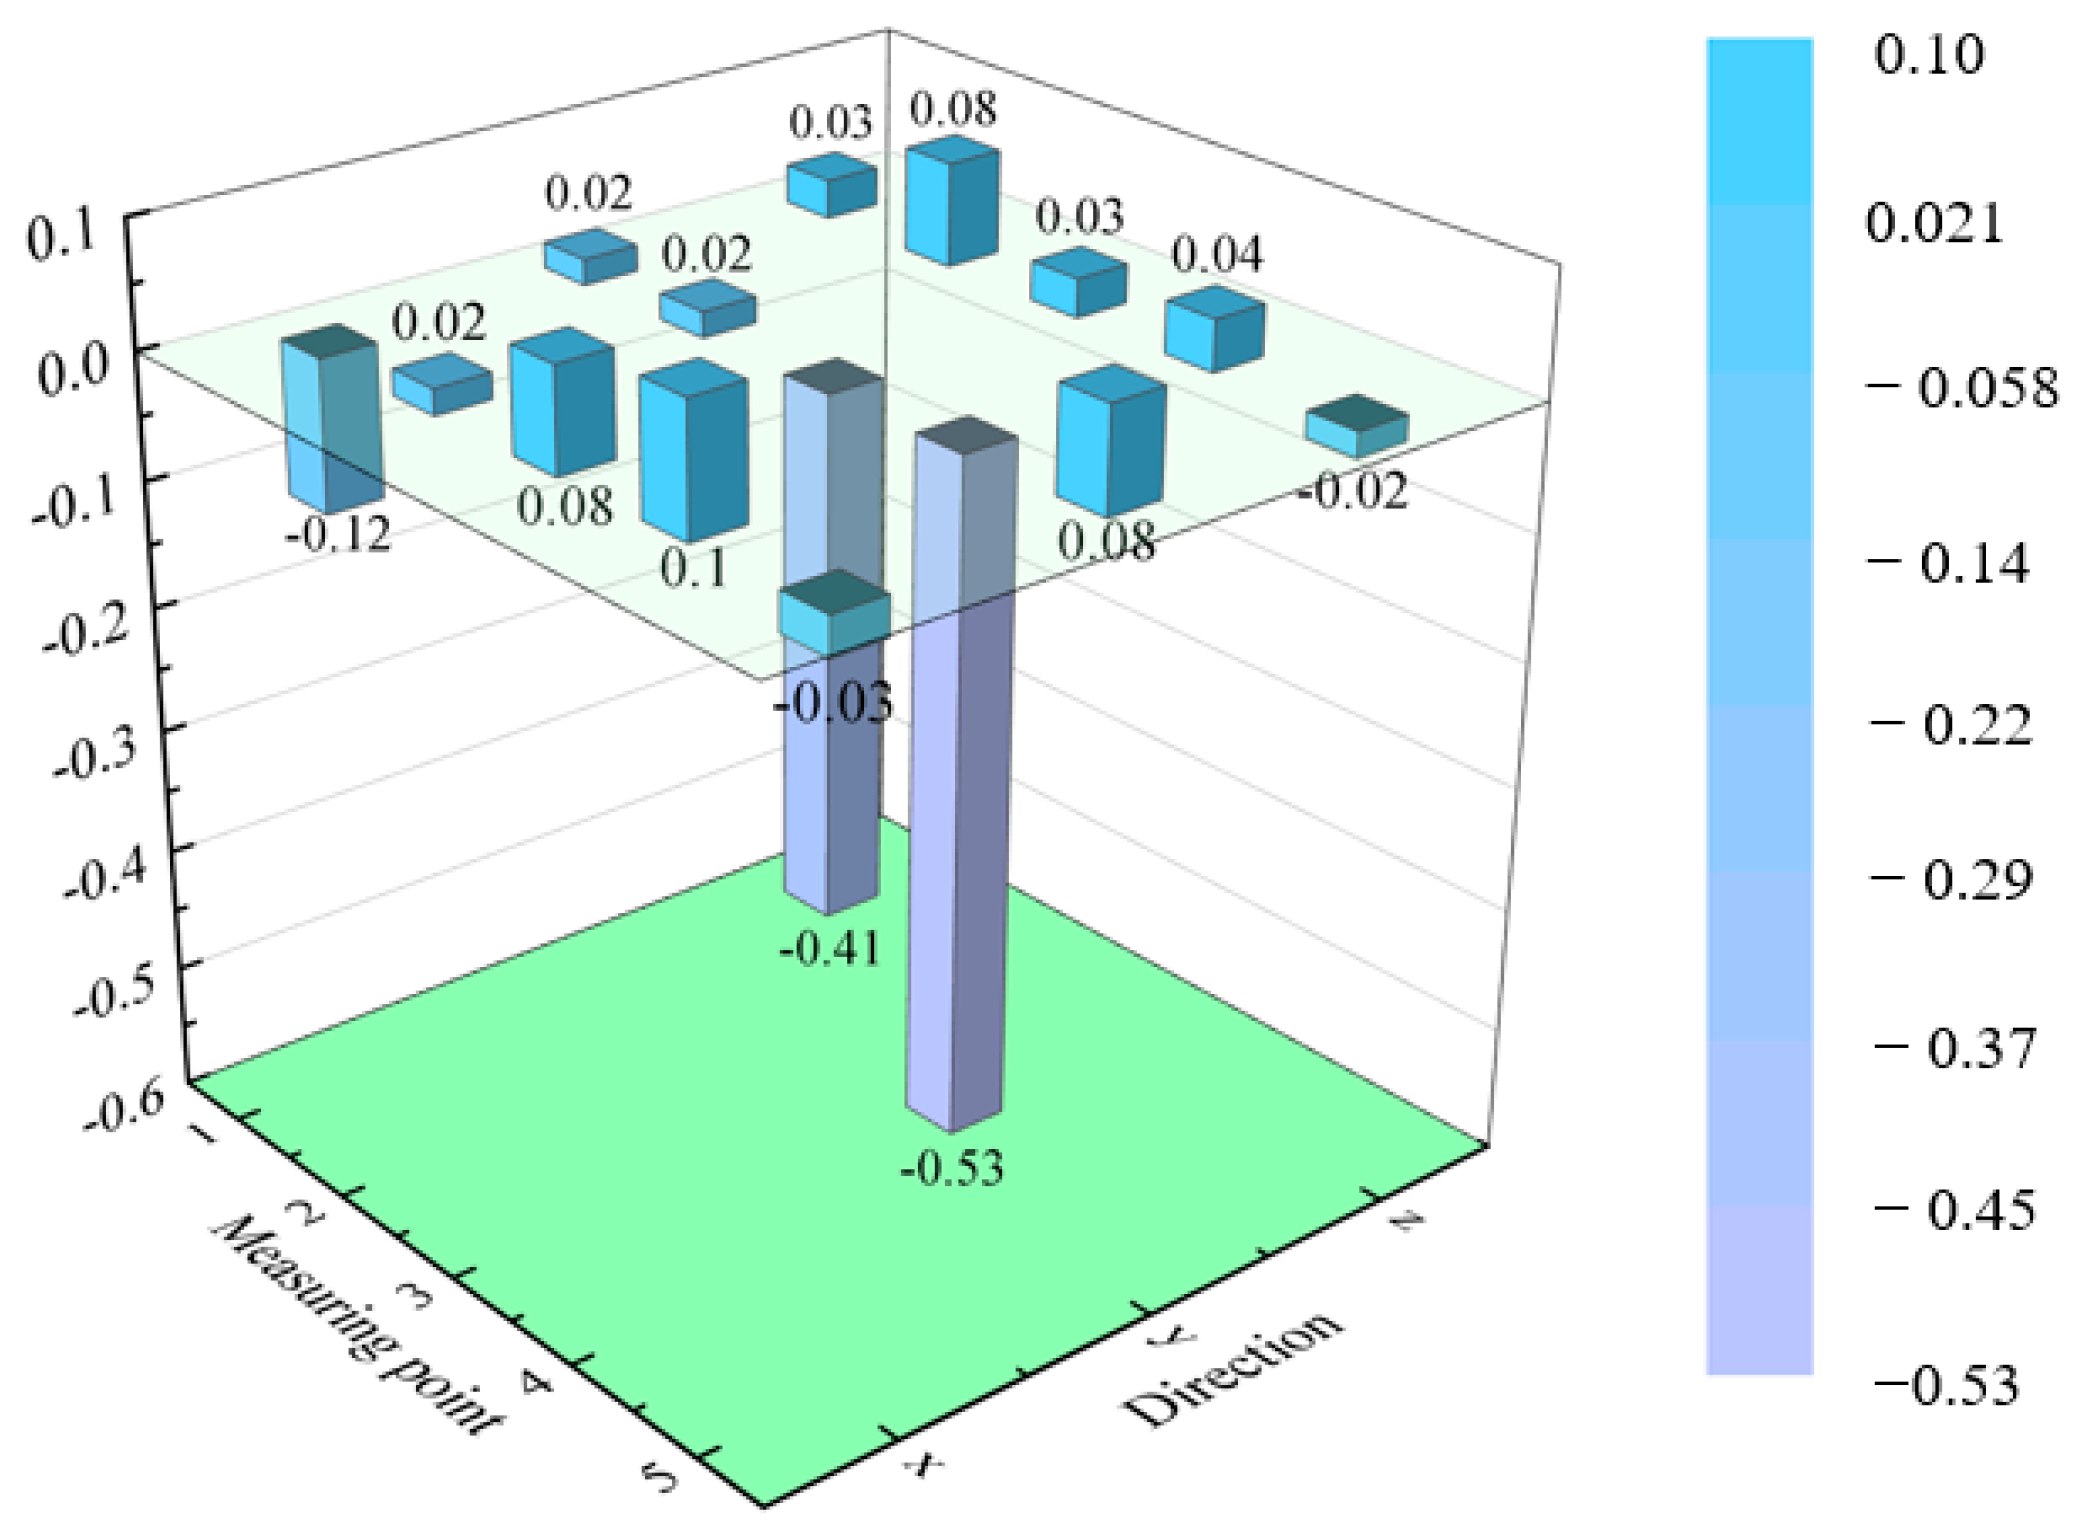
The skewness values of each vibration direction of the sensors at each measuring point were calculated, as shown in Table 4. Qualitative analysis reveals that there are significant differences in skewness in different directions at multiple measuring points, indicating that the unbalanced impact at the bolted connections of the combine harvester has clear directionality. It can be clearly observed that the skewness values of the vibration response signals at the bolted connections of measuring points 1, 2, and 5 are at a low level in all three directions and do not differ much. Therefore, it is believed that the impact received by these bolts is not significantly unbalanced, and there is no situation in which one side is subjected to a large impact; therefore, the degree of damage to the bolted connection is relatively small. However, the skewness values in the y direction at measuring points 3 and 4 are large, exhibiting obvious unbalanced impact characteristics.

3.2.3. Analysis of Vibration Response Margin Factor

The margin factor of a vibration signal is an indicator that is used to evaluate the stability and reliability of the vibration signal. It is commonly used to analyze and monitor the health of vibration systems to determine whether there are abnormal vibrations or potential faults. The vibration signal margin factor can be calculated using the ratio between the peak value and the root mean square value [53].
C e = x p e a k ( 1 N i = 1 N x i ) 2
When the equipment is running healthily, the margin factor is usually low, ranging between 3 and 5. Generally speaking, a higher vibration signal margin factor indicates that there are more high-frequency components or impulsive vibrations in the vibration signal, while a lower margin factor indicates that the vibration signal is relatively stable or contains more low-frequency components.
Qualitative analysis from Table 5 shows that the margin factor at 5-Z is at the highest level, reaching a margin value of 247.35. This measuring point is located near the bolted connection of the vibrating screen transmission shaft, which is the maximum power source input. As a result, the margin value at measuring point 5 is higher compared to other measuring points. The margin values in the 4-X and 4-Z directions are second only to 5-Z, with margin factor values ranging from 195 to 225. Compared to the bolted connections at measuring point 3, which is also located on the side of the vibrating screen, the margin values are generally 30 to 50 higher, possibly because measuring point 4 is closer to the transmission shaft and is affected by it, resulting in more impact vibration signals at measuring point 4.
Figure 12, Figure 13 and Figure 14 show histograms of the kurtosis, skewness, and margin factors for all vibration directions at each measuring point. It can be found that the kurtosis factors of all measuring points are relatively high, which may indicate faults such as bolt loosening. The skewness factors in the X and Y directions of each measuring point are generally higher than those in the Z direction. The margin factors of measuring points 4 and 5 reach 250 (far exceeding other groups), indicating that there are more high-frequency components or impulsive vibrations in the vibration signals at these measuring points, which are prone to causing bolt loosening.
A comprehensive analysis of the vibration energy, wear, collisions, and impact directions of each time domain feature at each measuring point was conducted to analyze the five measuring points, and the characteristic values of each measuring point in the main vibration direction were obtained and are shown in Table 6.
The analysis revealed that all characteristic values at measuring point 5 are at a high level, and all characteristics at measuring point 1 are at a low level. The time domain characteristics at 2-Z, 3-X, and 4-X show a mixture of high and low values. The main vibration characteristics are concentrated in the forward and vertical directions of the harvester, which is consistent with the decomposition direction of the reciprocating motion of the vibrating screen. Therefore, the following frequency domain analysis mainly focuses on the following four main vibration directions: 2-Z, 3-X, 4-X, and 5-Y.

3.2.4. Frequency Spectrum Analysis of Vibration Response

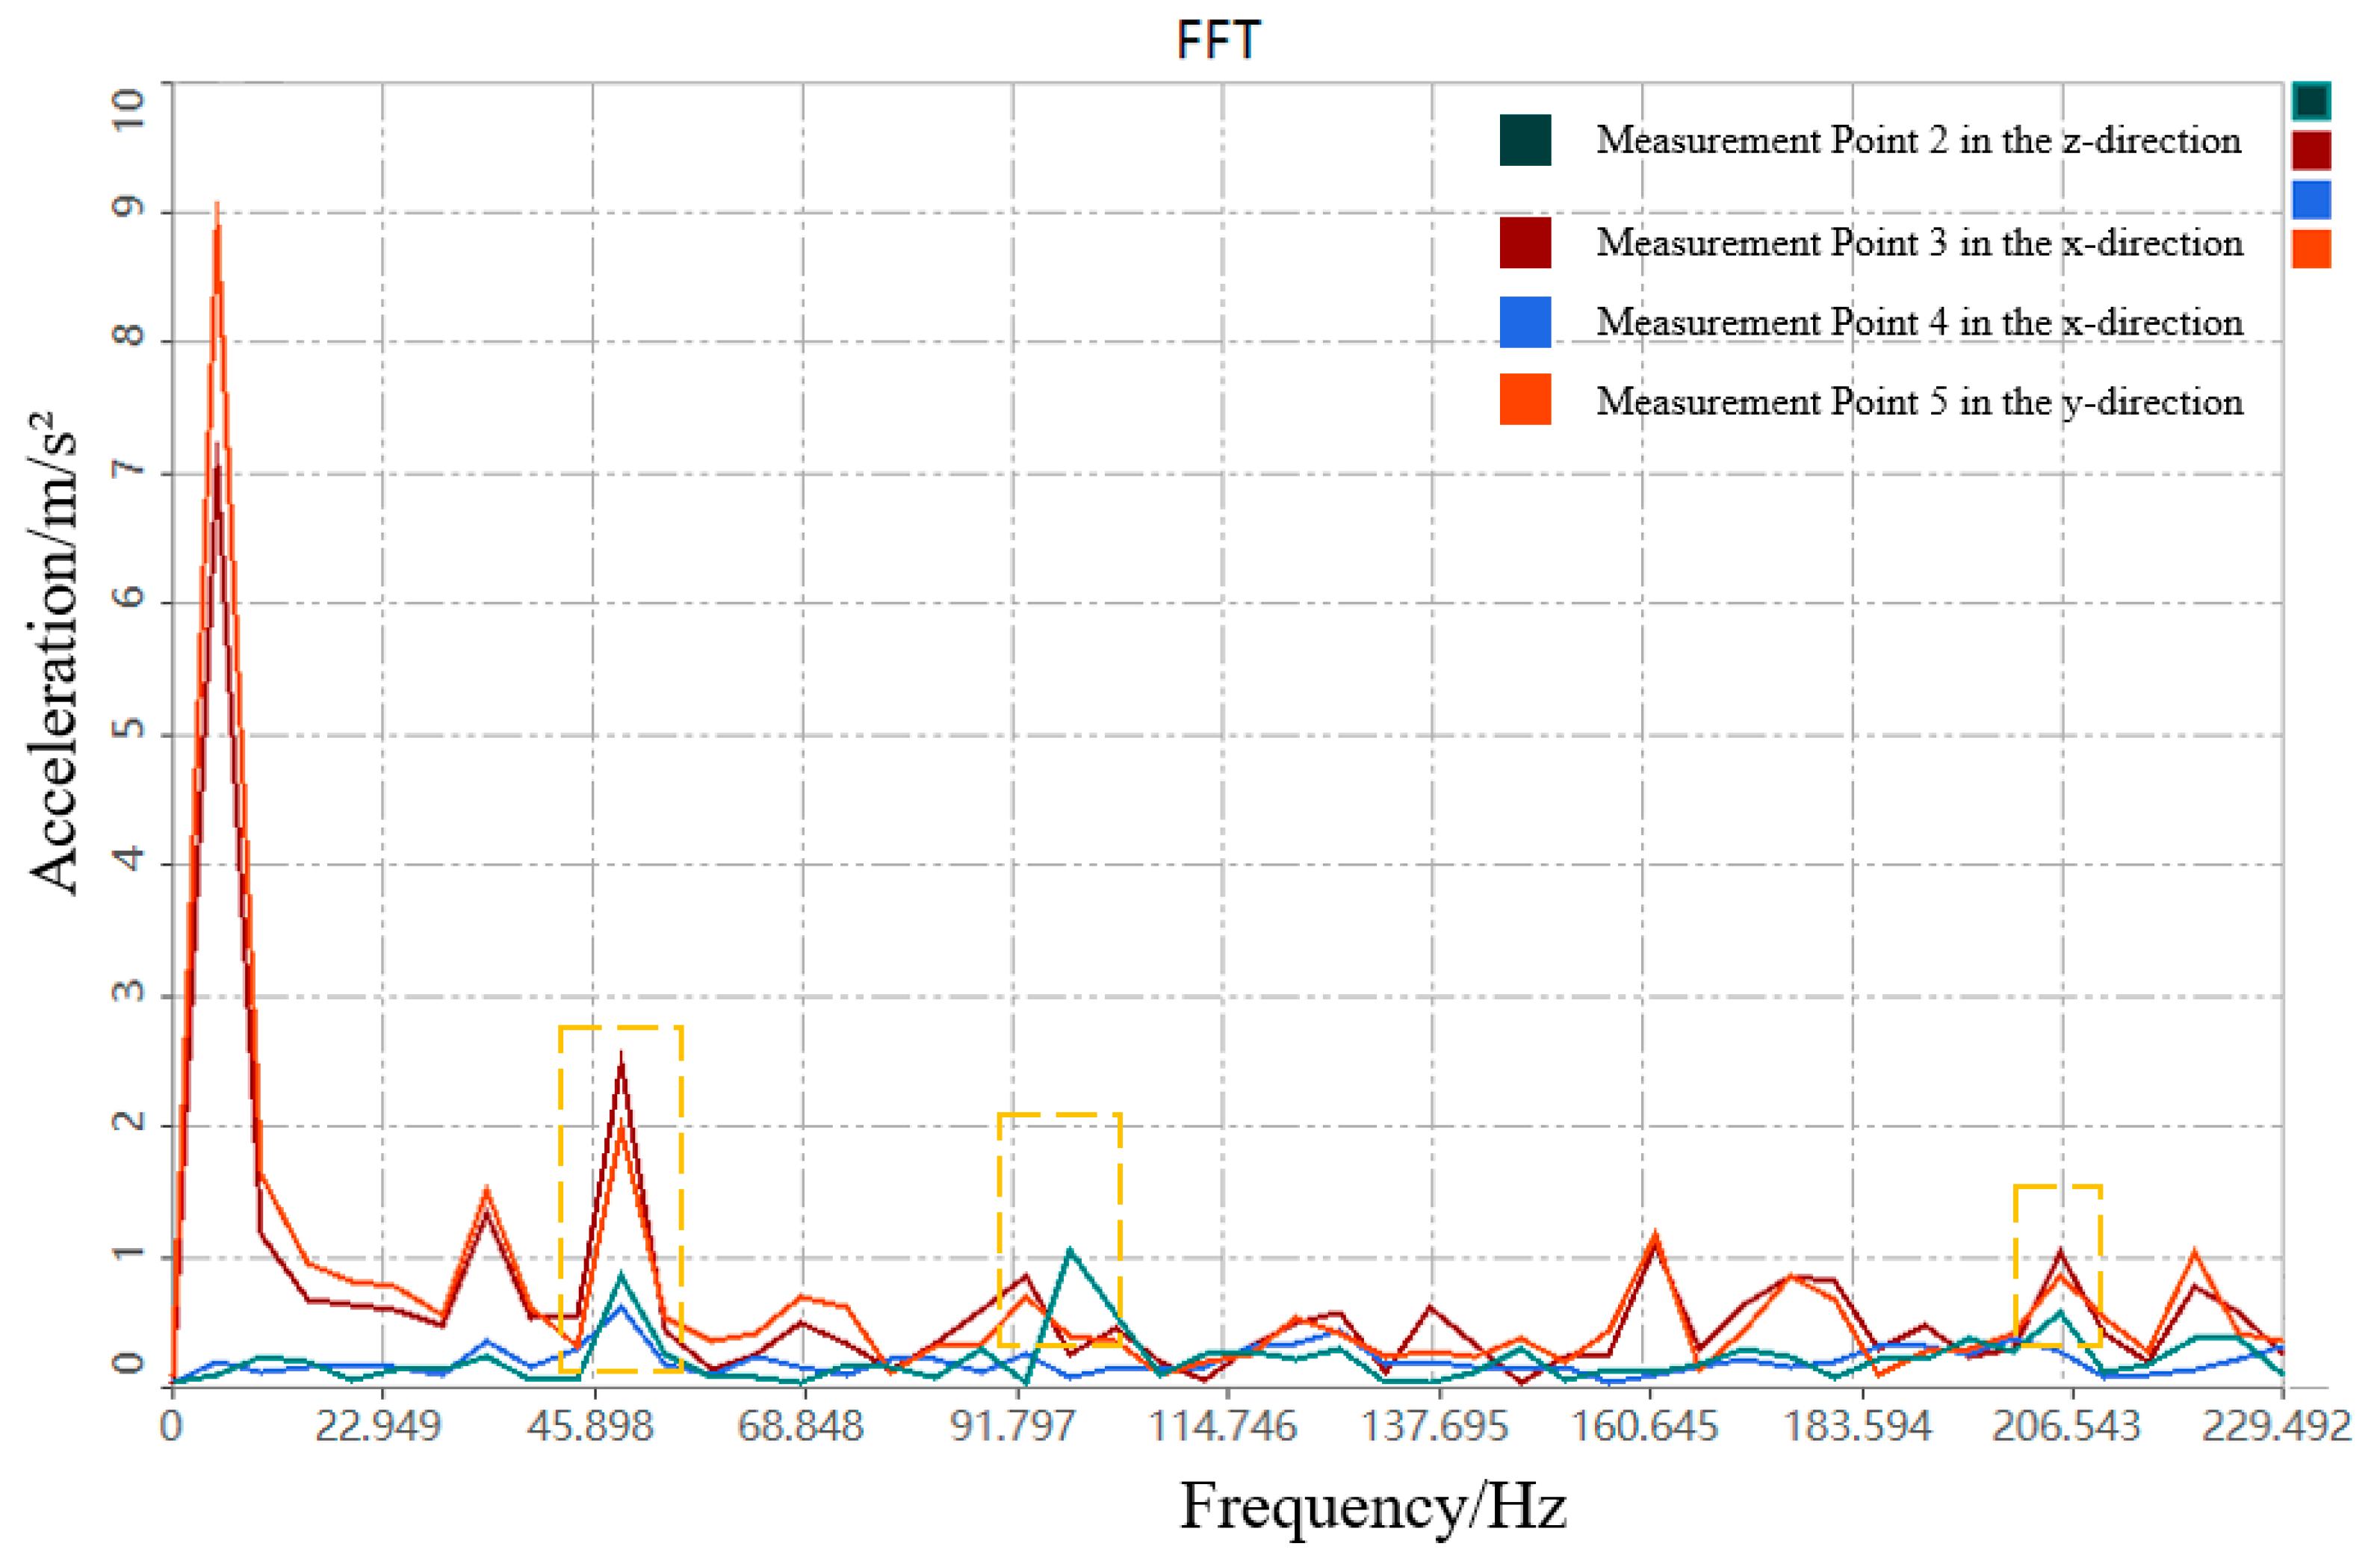
To explore the frequency spectrum response of the bolt connections at each measuring point, a short-time Fourier transform was performed on the signal to obtain the frequency domain response of each measuring point in the main vibration direction during operation, as shown in Figure 15. The three prominent common amplitude peaks highlighted by the yellow box in the figure correspond to excitation frequencies of 48.828 Hz, 122.07 Hz, and 219.727 Hz, respectively.
Upon comparing the frequency domain signals at different locations, the influence of the excitation frequencies on the four locations is different. The front-end bolt’s z-direction has a maximum acceleration of 1.2 m/s2 at 103.9 Hz, the second peak is at 49.6 Hz with an acceleration of 0.78 m/s2, and the third peak is at 206.5 Hz with an acceleration of 0.58 m/s2. The outer bolt 1’s x-direction has a maximum acceleration of 7.2 m/s2 at 5.1 Hz, the second peak is at 48.8 Hz with an acceleration of 2.75 m/s2, and the third peak is at 163.7 Hz with an acceleration of 1.71 m/s2. The outer bolt 2’s x-direction has a maximum acceleration of 0.56 m/s2 at 45.8 Hz, the second peak is at 91.8 Hz with an acceleration of 0.25 m/s2, and the third peak is at 33.6 Hz with an acceleration of 0.21 m/s2. The shaft-end bolt’s y-direction has a maximum acceleration of 9.2 m/s2 at 48.828 Hz, the second peak is at 49.2 Hz with an acceleration of 1.98 m/s2, and the third peak is at 162.6 Hz with an acceleration of 1.2 m/s2.

4. Conclusions

To address the issue of a combine harvester’s vibrating screen’s bolted connections being prone to failure due to the harvester’s multiple vibration sources and complex transmission, this paper conducts a finite element simulation of bolt preload, single-bolt loosening tests and investigates the vibration characteristics of the combine harvester’s vibrating screen bolts. The specific conclusions can be summarized as follows:
When the pressure is reduced to 78.4 N and the torque reaches 0.5 N·m, bolt loosening intensifies, and the pressure value drops sharply, indicating that the bolt loosening threshold is reached at this time. This provides strong data support for our further study and analysis of bolt loosening. Comprehensive time domain feature analysis shows that the kurtosis factor, envelope RMS value, skewness factor, and margin factor of the bolted connection at the vibrating screen transmission shaft are at high levels (kurtosis factor is 3, envelope RMS value is 58, skewness factor is 0.9, and margin factor is 240) and far higher than those at other bolted connections, indicating that there are severe impacts, wear, and unbalanced collisions in the direction of the combine harvester’s movement at the bolted connection of the vibrating screen transmission shaft. This provides a reference from the perspective of the vibration response for online bolt monitoring.
Through a frequency domain analysis of the bolts at the vibrating screen connection of a combine harvester, it was found that there are three obvious common amplitude peaks, corresponding to excitation frequencies of 48.828 Hz, 122.07 Hz, and 219.727 Hz. Peaks higher than or equal to the amplitude of the operating frequency appeared in the 2-Z and 5-Y vibration signals, indicating that strong frequency resonance occurred at the measuring points, which threatens the use of the bolted connection structure. The test shows that the frequency components of the bolts on the vibrating screen transmission shaft are more complex and that the amplitude is much higher than that of other bolted connections, providing a frequency domain reference for bolt loosening prevention and monitoring.

Author Contributions

Conceptualization, Z.T.; Methodology, Y.L. and Z.T.; Validation, L.Y.; B.W. and K.Q.; Formal Analysis, M.S. Data Curation, G.Y. and K.Q.; Investigation, B.W. and S.X.; Writing—Original Draft Preparation, Y.L. and L.Y.; Writing—Review and Editing, G.Y.; Supervision, S.X. All authors have read and agreed to the published version of the manuscript.

Funding

This research work was supported by the Jiangsu University Student Research Project (23A592); Key Laboratory of Modern Agricultural Equipment and Technology of Ministry of Education, Jiangsu University (MAET202326); Nantong Social Livelihood Science and Technology Project (MS2023016) and Natural Science Foundation of Jiangsu Basic Research Program (BK20221368); College Student Innovation Practice Fund of the School of Artificial Intelligence and Intelligent Manufacturing, Jiangsu University (RZCX2024001); and the Jiangsu Province University Students Practical Innovation Training Program Project (202410299060Z).

Institutional Review Board Statement

Not applicable.

Data Availability Statement

The data used to support the findings of this study are available from the corresponding author upon request.

Conflicts of Interest

Author Guangen Yan was employed by the company Xinjiang Production and Construction Corps Fourth Division Chuangjin Agricultural Development Group Co. The remaining authors declare that the research was conducted in the absence of any commercial or financial relationships that could be construed as a potential conflict of interest.

References

  1. Shi, M.; Liang, Z.; Zhang, J.; Xu, L.; Song, X. A robust prediction method based on Kriging method and fuzzy c-means algorithm with application to a combine harvester. Struct. Multidiscip. Optim. 2022, 65, 260. [Google Scholar] [CrossRef]
  2. Lu, E.; Tian, Z.; Xu, L.; Ma, Z.; Luo, C. Observer-based robust cooperative formation tracking control for multiple combine harvesters. Nonlinear Dyn. 2023, 111, 15109–15125. [Google Scholar]
  3. Wang, Y.; Liu, X.; Li, Z.; Feng, Z.; Pan, C.; Zhang, J.; Xu, J. Nitsche-based isogeometric approach for free vibration analysis of laminated plate with multiple stiffeners and cutouts. Int. J. Mech. Sci. 2023, 244, 108041. [Google Scholar]
  4. Cao, Z.; Dai, J.; Xu, W.; Chang, C. Bearing Fault Diagnosis with Frequency Sparsity Learning. Trans. Instrum. Meas. 2022, 71, 1–10. [Google Scholar]
  5. Zhou, Y.; Ji, J.; Zhao, W.; Zhu, S.; Liu, H. Modulated Vibration Reduction Design for Integral-Slot Interior Permanent Magnet Synchronous Machines. Trans. Ind. Electron. 2022, 69, 12249–12260. [Google Scholar]
  6. Qi, G.; Ma, L.; Bortolotti Rossini, M.; Schroeder, K. Vibration of a Satellite Structure with Composite Lattice Truss Core Sandwich Panels. Aia J. 2022, 60, 3389–3401. [Google Scholar] [CrossRef]
  7. Zhang, B.; Tan, C.A.; Liu, Z.; Hu, Z. Nonstationary time-frequency characteristics of vehicle suspension systems based on evolutionary power spectral density. Proc. Inst. Mech. Eng. Part D J. Automob. Eng. 2024. [Google Scholar] [CrossRef]
  8. Fan, W.; Chen, Z.; Li, Y.; Zhu, F.; Xie, M. A Reinforced Noise Resistant Correlation Method for Bearing Condition Monitoring. Trans. Autom. Sci. Eng. 2023, 20, 995–1006. [Google Scholar] [CrossRef]
  9. Yuan, Y.; Jin, R.; Tang, L. Numerical Investigation on the Flow-Induced Vibration Characteristics of Fire Turbopump with the Turbine-Pump Structure. Appl. Sci. 2022, 12, 4650. [Google Scholar] [CrossRef]
  10. Wang, Y.; Fan, J.; Shen, X.; Liu, X.; Zhang, J.; Ren, N. Free vibration analysis of stiffened rectangular plate with cutouts using Nitsche based IGA method. Thin-Walled Struct. 2022, 181, 109975. [Google Scholar]
  11. Sakai, T. Investigations of Bolt Loosening Mechanisms: 1st Report, On the Bolts of Transversely Loaded Joints. Bull. JSME 1978, 21, 1385–1390. [Google Scholar]
  12. Yamamoto, K. Investigations on the Self-loosening of Threaded Fasteners under Transverse Vibration—A Solution for Self-loosening Mechanism. Precis. Mach. 1977, 43, 82–87. [Google Scholar]
  13. Jiang, W.Q.; Mo, Z.; Wang, T.; Zhang, Q.; Yang, L.Q.; Zhang, W. Loosening process of bolted connection in transmission tower under transverse cyclic load. Structures 2025, 73, 108399. [Google Scholar]
  14. Sun, C.Y.; Liu, C.H.; Yuan, J.H. Mechanical behavior analysis of fully grouted bolts under shear throughout the entire elastic–plastic process. Eng. Fail. Anal. 2025, 171, 109340. [Google Scholar]
  15. Chen, H.; Dai, S.; Ou, M.; Li, S.; Wang, C.; Li, Z.; Wang, G.; Chen, Y.; Jia, W. Multibody Dynamics Simulation and Vibration Test for High Clearance Orchard Sprayer. Appl. Sci. 2022, 12, 8058. [Google Scholar] [CrossRef]
  16. Zhang, Y.; Gao, S.; Guo, L.H.; Qu, J.Y.; Wang, S. Ultimate tensile behavior of bolted T-stub connections with preload. Build. Eng. 2022, 47. [Google Scholar] [CrossRef]
  17. Tang, S.; Zhu, Y.; Yuan, S. Intelligent fault diagnosis of hydraulic piston pump based on deep learning and Bayesian optimization. ISA Trans. 2022, 129, 555–563. [Google Scholar] [CrossRef]
  18. Jiménez-Peña, C.; Lavatelli, A.; Balcaen, R.; Zappa, E.; Debruyne, D. A Novel Contactless Bolt Preload Monitoring Method Using Digitallmage Correlation. J. Nondestruct. Eval. 2021, 40, 54. [Google Scholar]
  19. Li, J.; Liang, Z.; Zhu, F.; Liu, C. Optimum of Grain Loss Sensors by Analyzing Effects of Grain Collision Attitude on Signal Characteristics. Electronics 2022, 11, 3187. [Google Scholar] [CrossRef]
  20. Zhang, Q.; Hu, J.; Xu, L.; Cai, Q.; Yu, X.; Liu, P. Impurity/Breakage Assessment of Vehicle-Mounted Dynamic Rice Grain Flow on Combine Harvester Based on Improved Deeplabv3+ and YOLOv4. IEEE Access 2023, 11, 49273–49288. [Google Scholar]
  21. Zhao, W.; Zhu, S.; Ji, J.; Liu, G.; Mao, Y. Analysis and Reduction of Electromagnetic Vibration in Fractional-Slot Concentrated-Windings PM Machines. Trans. Ind. Electron. 2022, 69, 3357–3367. [Google Scholar]
  22. Xue, H.; Ding, D.; Zhang, Z.; Wu, M.; Wang, H. A Fuzzy System of Operation Safety Assessment Using Multimodel Linkage and Multistage Collaboration for In-Wheel Motor. Trans. Fuzzy Syst. 2022, 30, 999–1013. [Google Scholar]
  23. Tang, S.; Zhu, Y.; Yuan, S. Intelligent fault identification of hydraulic pump using deep adaptive normalized CNN and synchrosqueezed wavelet transform. Reliab. Eng. Syst. Saf. 2022, 224, 108560. [Google Scholar]
  24. Tang, S.; Zhu, Y.; Yuan, S. An adaptive deep learning model towards fault diagnosis of hydraulic piston pump using pressure signal. Eng. Fail. Anal. 2022, 138, 106300. [Google Scholar]
  25. Zhou, H.T.; Jia, W.D.; Li, Y.; Ou, M.X. Method for Estimating Canopy Thickness Using Ultrasonic Sensor Technology. Agriculture 2022, 11, 1011. [Google Scholar]
  26. Zhang, F.; Chen, Z.J.; Wang, Y.F.; Bao, R.F.; Chen, X.G.; Fu, S.L.; Tian, M.M.; Zhang, Y.K. Research on Flexible End-Effectors with Humanoid Grasp Function for Small Spherical Fruit Picking. Agriculture 2023, 13, 123. [Google Scholar] [CrossRef]
  27. Elbeltagi, A.; Srivastava, A.; Deng, J.; Li, Z.; Raza, A.; Khadke, L.; Yu, Z.; El-Rawy, M. Forecasting vapor pressure deficit for agricultural water management using machine learning in semi-arid environments. Agric. Water Manag. 2023, 283, 108302. [Google Scholar]
  28. Huda, F.; Kajiwara, I.; Hosoya, N.; Kawamura, S. Bolt loosening analysis and diagnosis by non-contact laser excitation vibration tests. Mech. Syst. Signal Process. 2013, 40, 589–604. [Google Scholar]
  29. Xu, Z.; Yu, X.C.; Li, H.; Xu, P.Y.; Gu, D.W.; Han, Q.K.; Wen, B.C. Nonlinear vibration characteristics of fiber-reinforced composite thin-walled conical-cylindrical coupled shells under partial bolt looseness. Thin-Walled Struct. 2025, 209, 112874. [Google Scholar]
  30. Wu, P.H.; Zhao, Y.; Mao, C.Y. A frequency-time approach of random vibration analysis for bolted structures based on a semi-analytic Jacobian matrix. Mech. Syst. Signal Process. 2024, 218, 111562. [Google Scholar]
  31. Wu, C.X.; Yan, Q.W. Dynamic modeling and vibration analysis of bolted flange joint disk-drum structures: Theory and experiment. Int. J. Mech. Sci. 2024, 272, 109186. [Google Scholar]
  32. Liu, X.F.; Sun, W.; Liu, H.H.; Ma, H.W.; Du, D.X.; Li, H. Modeling and vibration analysis of bolted composite conical-conical shells with flanges. Thin-Walled Struct. 2024, 200, 111955. [Google Scholar]
  33. Valdez-Yepez, R.; Tutivén, C.; Vidal, Y. Structural health monitoring of jacket-type support structures in offshore wind turbines: A comprehensive dataset for bolt loosening detection through vibrational analysis. Data Brief 2024, 53, 110222. [Google Scholar] [PubMed]
  34. Kreutz, M.; Trainotti, F.; Gimpl, V.; Rixen, D.J. On the robust experimental multi-degree-of-freedom identification of bolted joints using frequency-based substructuring. Mech. Syst. Signal Process. 2023, 203, 110626. [Google Scholar]
  35. Pirdayr, A.; Mohammadi, M.; Kazemzadeh-Parsi, M.J.; Rajabi, M. Self-loosening effects on vibration characteristics of plates with bolted joints: An experimental and finite element analysis. Measurement 2021, 185, 109922. [Google Scholar]
  36. Liu, H.H.; Sun, W.; Du, D.X.; Liu, X.F. Modeling and free vibration analysis for bolted composite plate under inconsistent pre-tightening condition. Compos. Struct. 2022, 292, 115634. [Google Scholar]
  37. Madan, A.; Zhao, C.; Han, C.; Dong, Y.; Yang, Y. Monitoring rail track bolt loosening using fiber-optic distributed acoustic sensing. Sens. Actuators A Phys. 2025, 382, 116176. [Google Scholar]
  38. Wang, X.; Yue, Q.R.; Liu, X.G. Bolted lap joint loosening monitoring and damage identification based on acoustic emission and machine learning. Mech. Syst. Signal Process. 2024, 220, 111690. [Google Scholar]
  39. Hu, M.P.; Avval, S.S.P.; He, J.; Yue, N.; Groves, R.M. Explainable artificial intelligence study on bolt loosening detection using Lamb waves. Mech. Syst. Signal Process. 2025, 225, 112285. [Google Scholar]
  40. Tong, T.; Hua, J.D.; Du, D.Y.; Gao, F.; Lin, J. Bolt looseness detection in lap joint based on phase change of Lamb waves. Mech. Syst. Signal Process. 2025, 223, 111840. [Google Scholar]
  41. Tan, B.H.; Wang, T.; Fang, Q.; Yang, D.; Wang, H.; Lu, G.T. Bolt looseness monitoring using dynamic mode decomposition with piezoelectric active sensing. Measurement 2024, 238, 115204. [Google Scholar]
  42. Zhou, C.; He, J.; Xiong, X.; Yang, S.X.; Sun, J.H. Simulation data-driven attention fusion network with multi-similarity metric: A single-domain generalization diagnostic method for tie rod bolt loosening of a rod-fastening rotor system. Measurement 2025, 240, 115565. [Google Scholar]
  43. Liu, Z.C.; Huang, X.B.; Zhao, L.; Wen, G.R.; Feng, G.Z.; Zhang, Y. Research on online monitoring technology for transmission tower bolt looseness. Measurement 2023, 223, 113703. [Google Scholar]
  44. Du, F.; Tian, Z.X.; Nan, Y.; Zhang, X.; Xu, C.; Wang, S.F.; Su, Z.Q. A modified virtual time reversal method for enhancing monitoring sensitivity of bolt preloads based on ultrasonic guided waves. J. Sound Vib. 2024, 585, 118475. [Google Scholar]
  45. Liu, P.T.; Wang, X.P.; Wang, Y.Q.; Zhu, J.; Ji, X.Y. Research on percussion-based bolt looseness monitoring under noise interference and insufficient samples. Mech. Syst. Signal Process. 2024, 208, 111013. [Google Scholar]
  46. Yuan, B.; Sun, W.; Wang, Y.Q.; Zhao, R.X.; Mu, X.K.; Sun, Q.C. Study on bolt preload measurement: An error compensation model for ultrasonic detection based on solid coupling. Measurement 2023, 221, 113484. [Google Scholar]
  47. Liu, H.; Wei, S.; Xiao, F.L.; Hong, W.M.; Dong, X.D.; Hui, L. Modeling and free vibration analysis of bolted composite flanged cylindrical-cylindrical shells under partial bolt loosening conditions. Thin-Walled Struct. 2024, 199, 111853. [Google Scholar]
  48. Liu, F.; Sun, W.; Hong, H.L.; Hong, W.M.; Dong, X.D.; Hui, L. An investigation of vibration responses for bolted composite flanged-cylindrical shells considering material and joint nonlinearity. Thin-Walled Struct. 2024, 204, 112335. [Google Scholar]
  49. Fan, J.S.; Yuan, Q.; Wei, L.L.; Zhang, L.; Zhang, D.D.; Zhang, D.S.; Wang, L. Experimental study of anchor bolt stress evaluation with hybrid optical fiber monitoring. Opt. Fiber Technol. 2023, 80, 103415. [Google Scholar]
  50. ISO 4014:2014; Hexagon Head Bolts—Product Grades A and B. International Organization for Standardization: Geneva, Switzerland, 2014.
  51. Yuan, Y.L. Rolling bearing fault diagnosis based on kurtosis wavelet packet analysis. New Technol. New Technol. 2008, 43–46. [Google Scholar]
  52. Ding, W.S.; Tang, Q.; Huang, F. Failure Analysis of Bolted Connection under Lateral Vibration. Mech. Res. Appl. 2022, 35, 190–192. [Google Scholar]
  53. Tang, W.H.; Hong, S.; Wang, Y. Technical analysis of railway bearing performance test based on kurtosis and spectral kurtosis. J. Dalian Jiaotong Univ. New Technol. New Technol. 2020, 41, 69–73. [Google Scholar]
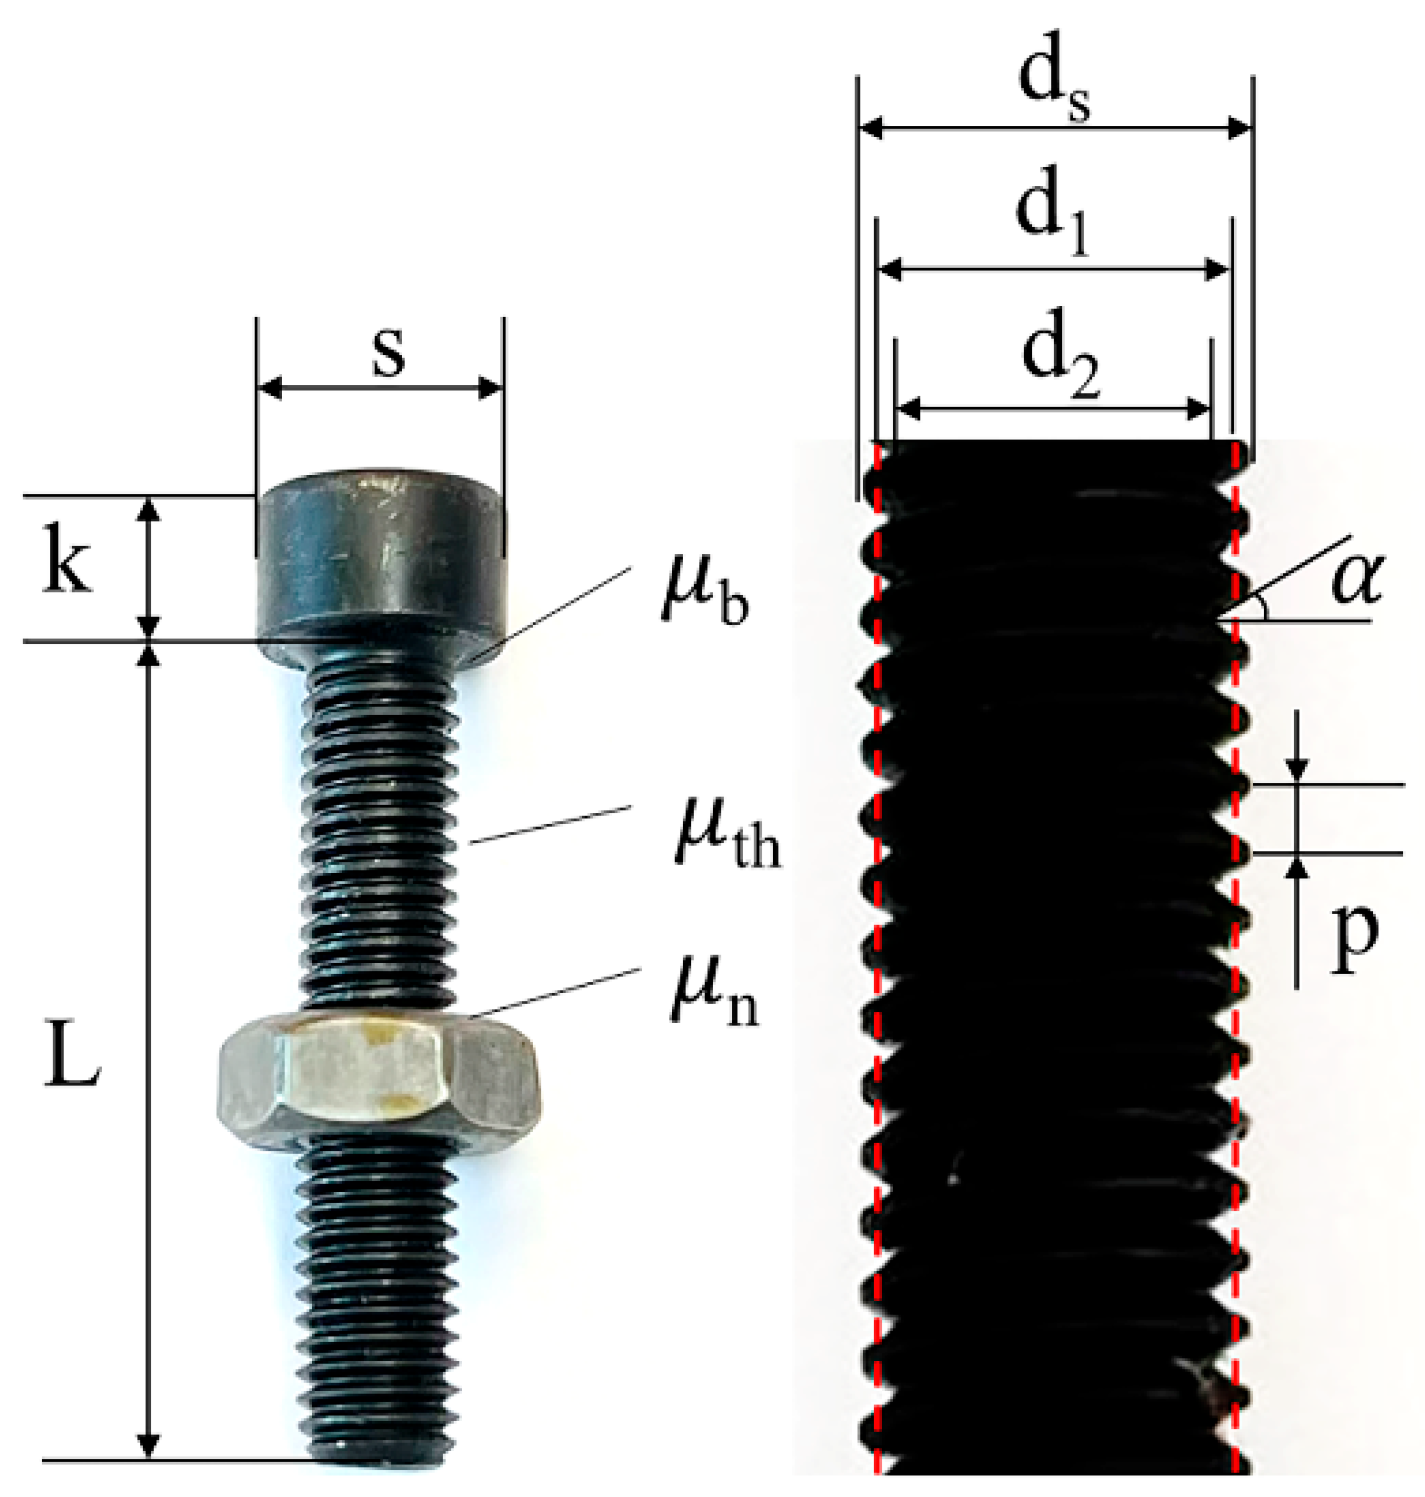
Figure 1. Bolt parameter diagram.
Agriculture 15 00749 g001
Figure 2. Equivalent slope slider model.
Agriculture 15 00749 g002
Figure 3. Stress nephogram of bolts under different preloading forces.
Agriculture 15 00749 g003
Figure 4. Stress nephogram of bolt head under different preloading forces.
Agriculture 15 00749 g004
Figure 5. Single-bolt loosening test data acquisition environment.
Agriculture 15 00749 g005
Figure 6. Single-bolt loosening test procedure.
Agriculture 15 00749 g006
Figure 7. DH5902N dynamic signal acquisition instrument and DHDAS dynamic signal acquisition system.
Agriculture 15 00749 g007
Figure 8. Three-phase acceleration sensor (1A312E.Jiangsu Donghua Testing Technology Co., Ltd., Taizhou, Jiangsu, China).
Agriculture 15 00749 g008
Figure 9. Arrangement of vibrating screen measuring points on harvester.
Agriculture 15 00749 g009
Figure 10. Vibrating screen acceleration signal.
Agriculture 15 00749 g010
Figure 11. Torque and pressure–time relationship during single-bolt loosening: (a) Test 1; (b) Test 2; (c) Test 3; (d) Test 4.
Agriculture 15 00749 g011
Figure 12. Comparison of kurtosis.
Agriculture 15 00749 g012
Figure 13. Comparison of skewness.
Agriculture 15 00749 g013
Figure 14. Comparison of margin.
Agriculture 15 00749 g014
Figure 15. Main vibration direction spectrum diagram of measuring point.
Agriculture 15 00749 g015
Table 1. DH5902N dynamic signal acquisition instrument main specifications.
Serial NumberTechnical IndexMain Specification
1Number of channels4 channels/card, up to 32 channels per unit, wireless channel expansion through Ethernet
2Communication modeGigabit Ethernet and wireless WIFI communication
3Voltage range±20 mV, ±50 mV, ±100 mV, ±200 mV, ±500 mV
4Voltage indication errorNot more than 0.3%
5Continuous sampling rateSingle box does not exceed 16 channels synchronous acquisition, up to 256 KHz channel
6Analog-to-digital converter24-bit varepsilon-∆ AD converter
7Environmental suitabilityMaximum 100 g impact, −20~60 °C wide temperature
8Supports capture card typesVoltage/IEPE/Strain/speed/counter/Signal source/CAN/DIO/RS485
9Access typeSupports intelligent wire identification and TEDS sensor access
Table 2. Sensor layout positions and triaxial channel orientations.
Test ConditionsMeasuring Point LocationsTriaxial Channel DirectionsTesting Time
XYZ
Full/Partial Throttle No-Load–Threshing–Header Engagement–Gradual Shutdown1Vertical DirectionLateral DirectionForward DirectionTwo groups per test, sampling time is 2 min of response signals during the stable operation phase.
2Lateral DirectionVertical DirectionForward Direction
3Vertical DirectionForward DirectionLateral Direction
4Vertical DirectionForward DirectionLateral Direction
5Vertical DirectionForward DirectionLateral Direction
Table 3. Kurtosis of vibration signal at each measuring point.
Measuring Point12345
x5.223.263.753.832.85
5.123.253.833.872.87
5.043.313.843.882.85
y3.063.273.274.382.99
3.053.273.234.433.00
3.063.273.254.413.00
z3.414.103.874.513.12
3.504.163.834.413.10
3.434.203.824.343.12
Table 4. Skewness of vibration signal at each measuring point.
Measuring Point12345
x−0.120.020.080.10−0.03
−0.130.010.080.08−0.03
−0.100.010.080.07−0.03
y0.020.02−0.41−0.530.08
0.020.03−0.40−0.530.09
0.010.03−0.40−0.530.09
z0.030.080.000.04−0.02
0.040.080.030.03−0.03
0.050.080.000.02−0.03
Table 5. Clearance of vibration signal at each measuring point.
Measuring Point12345
x68.1763.71187.17199.66199.15
67.9563.08190.60206.16206.41
69.8763.88195.59190.44201.73
y59.0763.36122.00191.54188.55
60.0561.67123.35187.75190.53
59.6663.35121.51186.60183.29
z45.3295.86170.42221.93245.77
47.6396.75169.92211.11244.20
47.6096.02160.12195.69247.35
Table 6. Comparison of dominant vibration direction characteristics at each measuring point.
Characteristic ValueMeasuring Point with Maximum ValueMeasuring Point with Maximum Value
12345
RMS Value16183737585
kurtosis343.84.434
skewness0.10.080.40.50.094
margin68961902002405
Disclaimer/Publisher’s Note: The statements, opinions and data contained in all publications are solely those of the individual author(s) and contributor(s) and not of MDPI and/or the editor(s). MDPI and/or the editor(s) disclaim responsibility for any injury to people or property resulting from any ideas, methods, instructions or products referred to in the content.