Article

Design and Experiment of a Single-Disk Silage Corn Harvester

1
College of Mechanical and Electrical Engineering, Gansu Agricultural University, Lanzhou 730070, China
2
Gansu Mechanical Science Research Institute Co., Lanzhou 730070, China
*
Author to whom correspondence should be addressed.
Agriculture 2025, 15(7), 751; https://doi.org/10.3390/agriculture15070751
Submission received: 7 March 2025 / Revised: 28 March 2025 / Accepted: 28 March 2025 / Published: 31 March 2025
(This article belongs to the Section Agricultural Technology)

Abstract

:
Although the mechanized harvesting rate of maize in China has exceeded 90%, there are still shortcomings in the mechanized harvesting of silage maize. Some areas still rely on manual harvesting, which is not only inefficient but also requires more labor. Therefore, it is extremely important to realize the mechanized harvesting of silo maize. The aim of this paper is to improve the harvesting efficiency of silo maize, ensure the quality of the silage and reduce the loss of nutrients. Aiming at the problems of wide cutting width, difficult access, low operating efficiency, and uneven straw feeding in the process of corn silage harvesting in terraced fields in hilly and mountainous areas. This study creatively designed a single-disk corn silage harvester. The optimal Latin hypercube method and MATLAB R2021 software are used to analyze the influence of various factors on the evaluation index. The ternary quadratic regression prediction model was constructed by using Isight 5.6 software, and the accuracy of the model was verified by variance analysis and field experiments. In addition, the main program was optimized by writing the program of the SMPSO algorithm. The optimal combination of working parameters was determined: the working speed was 1.00 m/s, the cutter rotation speed was 1085.89 rpm, and the drum rotation speed was 30 m/s. At that time, the machine productivity was 38 t·h−1, the average standard grass length rate was 82.15%, and the stubble qualification rate was 91.95%. After two field trials, the results showed that all indicators met the national standards and industry standards, which confirmed the efficiency and practicality of this design.

1. Introduction

Corn silage is an important animal feed and industrial raw material in China, and it is one of the most important feeds for animal husbandry [1].
As a kind of roughage, direct feeding of corn straw has problems such as chewing effort, poor palatability, low nutrient absorption rate, and difficulty in digesting the whole corn kernel. Through mechanical processing, corn straw with a water content of 65% to 75% is chopped and broken and then fermented by anaerobic lactic acid bacteria in a sealed anoxic environment to obtain a high-quality feed, called silage, which is beneficial for livestock digestion and absorption, thereby improving the utilization rate of feed nutrients and improving the quality and yield of livestock products [2,3]. With the continuous adjustment of China’s rural agricultural industrial structure, the development speed of animal husbandry is also quite fast, and the demand for feed continues to grow. By the end of 2024, China’s silage corn planting area will reach 7 million mu [4]. Hilly terrain has a number of significant natural characteristics that directly affect the design and operation of silage maize harvesters. First, the terrain is hilly, and the slope is steep; the slope is usually 10°~25°, and the local slope can reach more than 30°. The fields are scattered, mostly in the form of terraces or slopes, and the plot area is small and irregular. Traditional agricultural machinery is prone to center of gravity instability and overturning. Chassis stability and anti-tilt design need to be strengthened; power is insufficient when climbing, and braking pressure is high when descending. Second, the soil conditions are complex, mainly including clay (wet and slippery), sandy soil (loose), or gravel soil (stone) mixed distribution, and the water content is uneven, the top of the slope is easily dried, and the bottom of the slope is easy to accumulate water, resulting in large differences in soil hardness. In the design process of the whole machine, it is necessary to consider the anti-skid and anti-sink factors of the tire or crawler, the chassis of the harvester must prevent stone impact, and the blade must be wear-resistant.
As agricultural machinery specially designed for harvesting and processing silage corn, silage corn harvesters are widely used in areas with developed animal husbandry [5,6,7]. At present, there are many models of silage corn harvesters in the market. For example, foreign advanced self-propelled models include the CLAAS JAGUAR series and the John Deere 8000 and 9000 series. For example, European and American models from CLAAS and John Deere have insufficient adaptability to complex terrain and are mostly designed for large plots on flat land. When the slope is >15°, the center of gravity tends to shift, and even when the counterweight is fitted, the risk of overturning is still high. John Deere 8000 and 9000 series, the chassis by the poor, the lack of all-terrain adaptive chassis solutions; New Holland FR series knives and feed rollers are designed based on low humidity crops (water content 60–65%). When working on the edge of the rainforest, the knives have to be stopped every hour. The silage harvesters of Nonghaha, Meidi, and other companies with better domestic sales use wheeled chassis as the walking system, which has a large pressure on the land and easily causes soil compaction. The representative models are the Mushen 4QX series and the 9QSD series. Among them, Mushen 9QSD-900 has the characteristics of disk vertical header [8,9], adjustable material cutting length, non-row harvesting, and full refinement of materials. Most of the foreign planting modes are large-scale planting, with a large plot area and a large workload during the harvesting period. In order to ensure high working efficiency, the design of foreign silage harvesters generally has a large working width and a high-power engine [10]. For example, in the mainstream American John Deere’s 8000 series self-propelled silage harvester in the international market, the header technology is more developed, mainly multi-disk wide header and the operation is not limited by the row spacing [11]. However, China is mostly a decentralized planting mode, so the larger harvester has difficulty meeting the needs of ordinary corn silage farmers [12]. The crawler-type forage harvester with a 1.6~2.4 m cutting width developed by Revo Valley God, Dinggua Gua, Wogong, and other companies can solve the silage harvesting operation with a small plot area and irregular shape in hilly and mountainous areas. However, the design of the multi-disk header gives the harvester a wide cutting width, which still cannot solve the silage harvesting operation in hilly and mountainous areas in essence. There are still problems, such as low operation efficiency, uneven straw feeding, and inflexible operation in mountainous areas. The key parameter pairs are shown in Table 1.
In view of the above problems, a single-disk, side-suspended silage corn harvester was designed, which can effectively solve the efficient operation of harvesting, chopping, and throwing of silage harvesters in hilly and mountainous areas. Hanging directly on the side of the tractor, without an independent chassis, it can easily negotiate narrow mountain roads, terraces, and small plots, adapting to the frequent steering requirements in hilly areas and reducing empty running time; the chopped silage is loaded directly into the following trailer by the throwing cylinder, eliminating the need for intermediate transfer links. The single-disk cutterbar has a simple structure and light weight, which is 30–40% lighter than traditional multi-disk cutterbars, reducing the load on the tractor. The side-suspension design keeps the center of gravity close to the tractor, and the stability of operation on slopes is better than that of the traction type, which can adapt to slopes within 15°. The parameters of each component are determined by theoretical calculation, and the parameters of each device are optimized by feedback from experimental results [13]. Field experiments show that the equipment has good performance in the road and small plot operation, which provides a reference for optimization and improvement.

2. The Structure and Working Principle of the Whole Machine

2.1. Overall Structure of the Machine

In the hilly and mountainous areas represented by Gansu Province, silage corn planting plots are mostly terraced fields. The characteristics are that the mountain roads leading to the terraced fields are steep and narrow, but the field plots are flat, and there is no big slope. Therefore, the self-propelled combine harvester cannot enter the field. Only if the power machine and the drive are designed separately can the harvester be harvested in the field after assembly. To reduce production costs, this study is powered by a tractor, and the header is optimized from a conventional double-disk cutter to a single-disk cutter with low power consumption.
As shown in Figure 1, the single-disk silage maize harvester mainly consists of a threshing device, holding device, single-disk cutter, flattening roller group, straw crushing device, material throwing device, walking wheel, and hanging device.

2.2. Operating Principle

In the case of the single-disk silage maize harvester, the entire machine is connected to the tractor by means of the three-point hitch on the hitch, and the power output shaft on the tractor is connected to the power input shaft of the gearbox on the hitch. When working, the power is output from the tractor and transmitted to the gearbox, and then the power is input to the spindle of the disk cutter through the belt drive. The spindle of the disk cutter is extended outward, and the power transmission direction is changed by the spur gear. The power is input to the flattening device to control its harvesting. Harvesting functional components include the feeder, chopper, ejector, and other functional components. The harvester moves forward, and the silage crop enters the working area of the header. After the bottom of the crop is cut off by the rotary disk cutter, the crop is fed into the feeder along the feed channel, and the crop is sent to the chopper by the flattening rotation. The chopping knife rotates quickly, the crop is cut into pieces, and the finely chopped material is collected by the throwing device. The main technical parameters are listed in Table 2.

3. Structural Design of Key Components
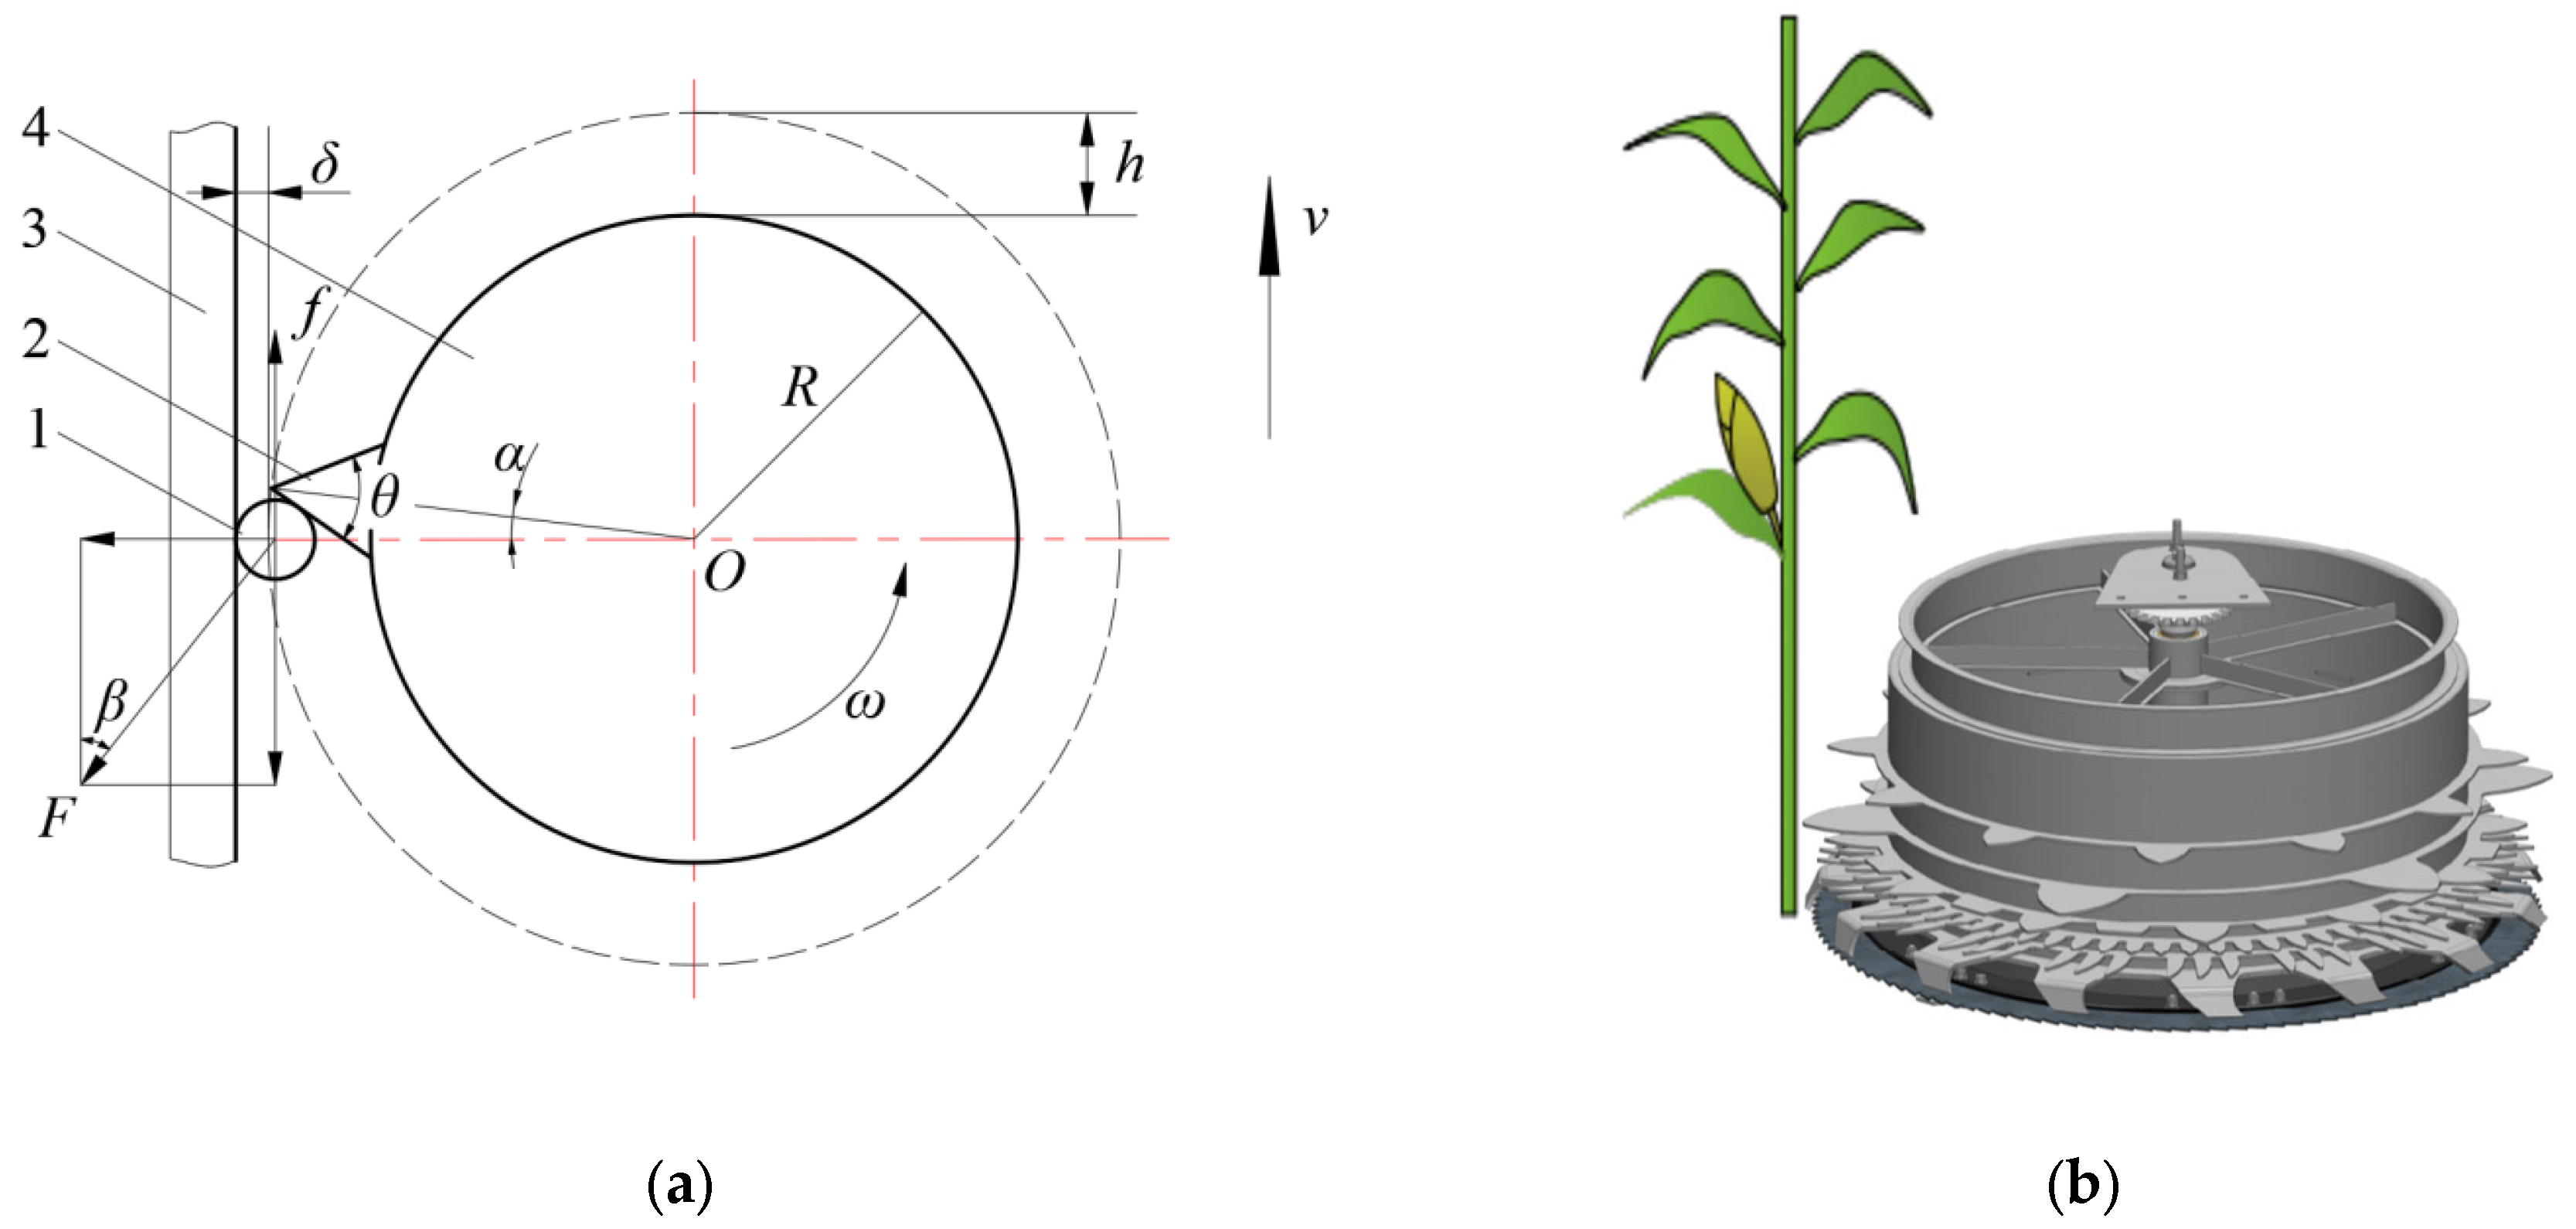
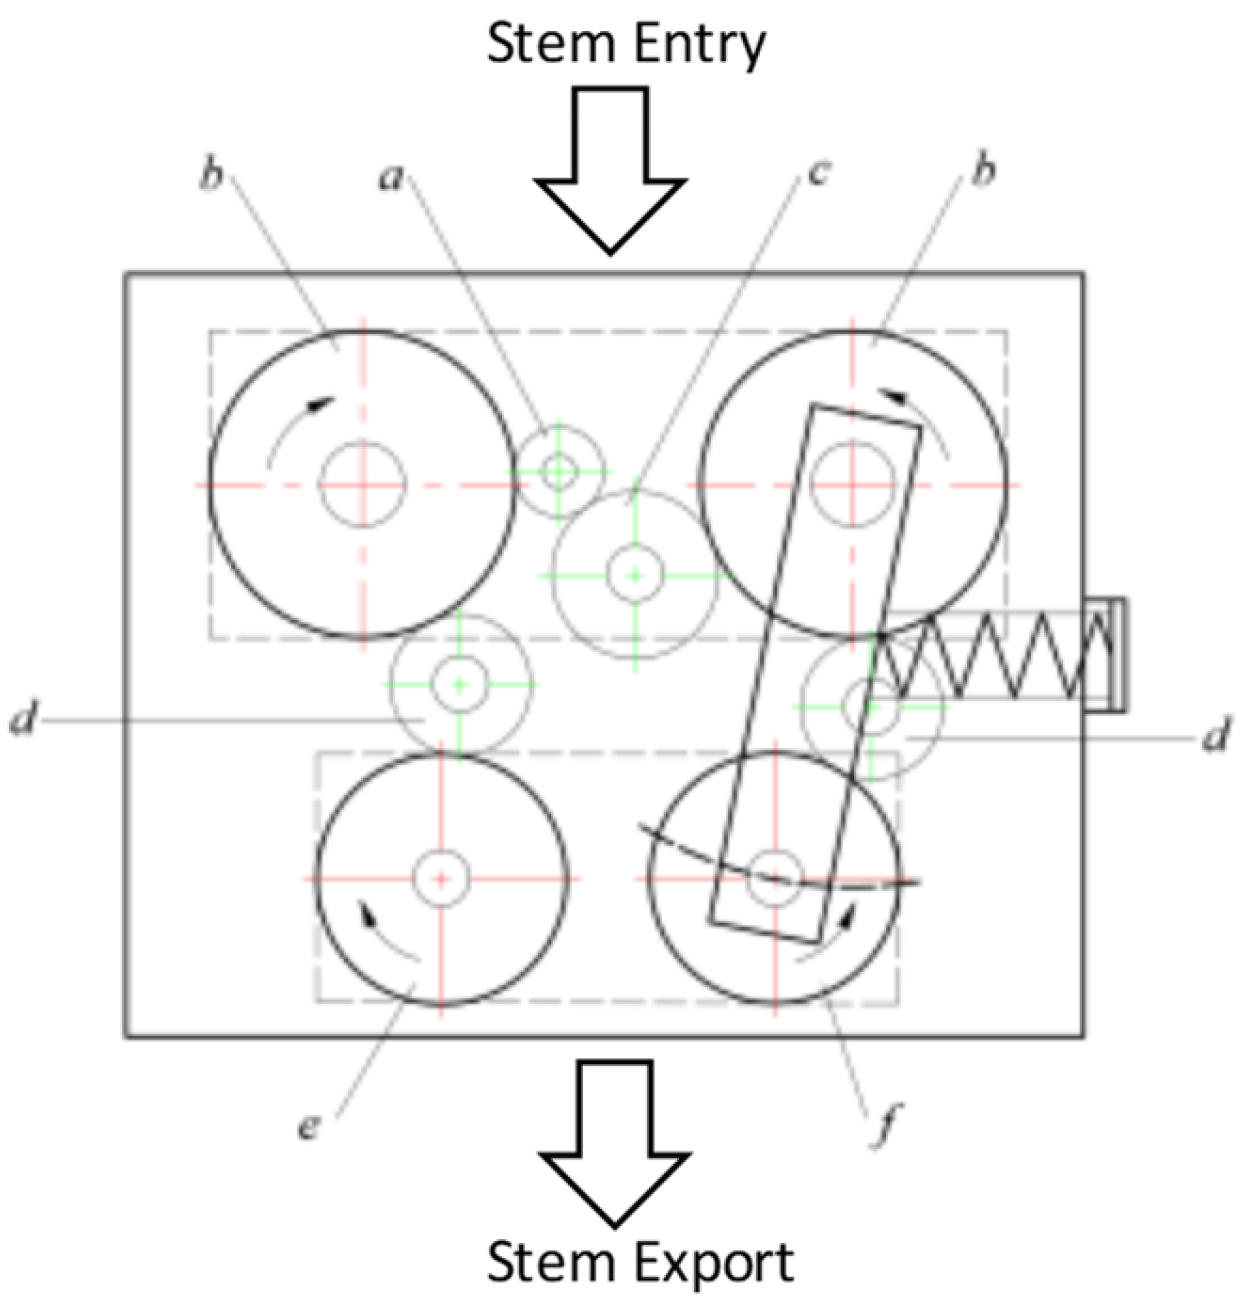
3.1. Feeding Device

The feeder is composed of a separator, a holder, a single-disk cutter, a drum, and other parts. The transmission mode is gear transmission. The lower bending tooth is first contacted with the cut crop straw, and the feeding process is shown in Figure 2a.
The single-disk cutter is composed of a high-speed rotating disk blade, a rotating speed between 1500 and 2500 rpm, and a fixed knife. The blade is usually designed with a serrated blade or a flat blade to adapt to different crop states, such as dry/wet straw. The cutting is shown in Figure 2b. The corn straw is guided to the cutting area with the help of the divider. The disk blade and the fixed knife form a shear action to achieve low stubble cutting. The stubble height after cutting is adjustable from 5 to 15 cm. When working in hills or uneven plots, the cutter automatically attaches to the ground through a hydraulic or spring floating device to maintain a stable cutting height and reduce leakage.
This can be seen from the force analysis of the feeding process.
β = α + θ 2
The conditions for smooth corn stalk feeding are
F cos ( α + θ 2 ) f > 0
In the formula, θ is the angle between the roller teeth, °; α is the angle between the center line of the roller gear and the vertical line of the forward direction of the machine, °; and β is the angle between the supporting force of the roller gear on the corn stalk and the forward direction of the machine, °.
Cut vice L is as follows:
L = 2 ( R + h + δ )
In the formula, r is the radius of the single-disk cutter, mm; h is the height of the roller gear, mm; and δ is the feeding gap, which is the gap between the roller gear and the divider, mm.
The number of bending teeth in the lower layer is set to Z = 15, and the drum rotates for one week to theoretically transport 15 plants.
(1) Roller speed
Combined with the agronomic mode of whole-film double-ridge furrow sowing and silage corn operation, the design operation width is 1600 mm; that is, the number of harvest rows is 4–8 rows, and the corresponding single-disk cutter radius is 425 mm. In order to ensure the effective and orderly feeding of the cut plant stalks, the roller teeth adopt a multi-layer design method, and the height h of each layer of teeth is the same, so h = 100 mm; the feeding gap is 3 times the maximum diameter of the plant root, so δ = 100 mm.
When the forward harvesting speed of the machine is v = 1–2 m/s, the speed of the conveyor drum is set to the following:
n 1 = 30 v π r
In the formula, n is the speed of the conveyor drum, r/min; v is the forward harvesting speed of the machine, m/s; and r is the radius of the single-disk cutter, m.
Entering the data obtains n = 23–45 rpm/min. Combined with the actual production, in order to obtain higher conveying efficiency, Formula (4) is multiplied by the working coefficient of 1.3, and the speed of the conveying drum is determined to be n = 30–60 rpm.
(2) Rotational speed of the disk cutter
The rotation speed of the cutterbar is closely related to the cutting quality and power consumption of the corn plant. According to the trajectory of any point on the outer circle of the saw tooth of the disk cutter, it can be seen that the rotational speed of the cutter is closely related to the cutting quality and power consumption of the corn plant.
v = v 2 + ω 2 R 2 + 2 v ω R cos γ cos ( ω t + φ ) ω = n 2 π 30 n 2 = 30 ( v + v ) π R
In the formula, v’ is the speed of any point on the outer circle of the saw tooth of the disk cutter, r/min; v is the forward harvesting speed of the machine, v = 1–2 m/s; γ is the angle between the rotating plane and the horizontal plane of the disk cutter, γ = 10 °; ω is the rotational angular velocity of the cutter head, rad/s; r is the radius of the single-disk cutter (cutter head), R = 545 mm; φ is the angle between the inner and outer end points of the sawtooth and the connecting line of the disk center, rad; and n2 is the rotational speed of the disk cutter, r/min.
In Equation (5), when cos (ωt + φ) = 1, v’ is the largest, and when cos (ωt + φ) = −1, v’ is the smallest. In order for the cutter to work stably and meet the operating requirements, the cutter speed should be greater than the minimum limit speed, which is generally 50–90 m/s. Therefore, the rotational speed of the disk cutter is n2 = 988–1623 r/min.

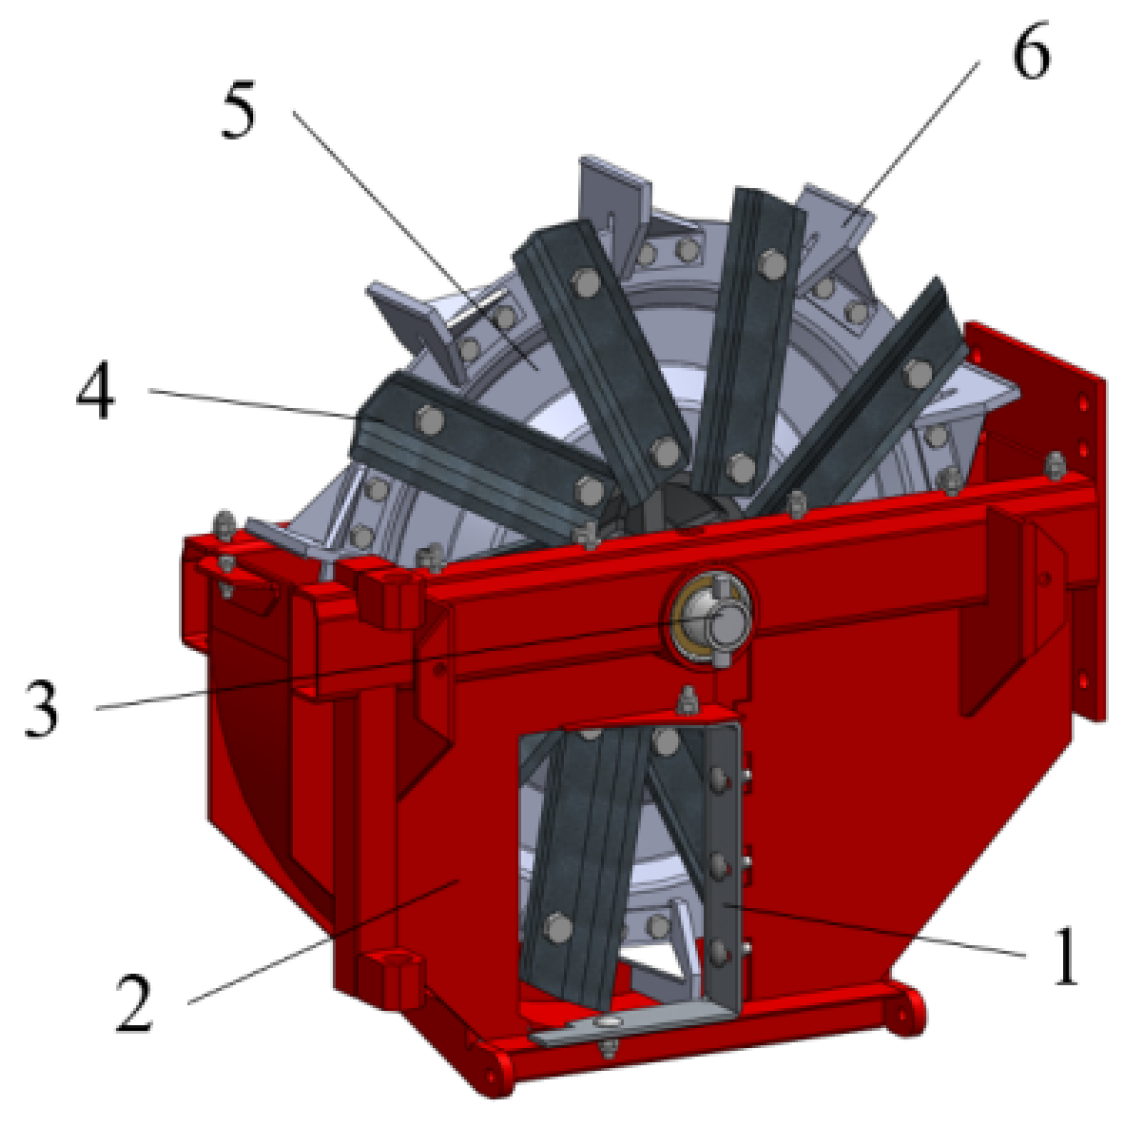
3.2. Flattening Device

As shown in Figure 3, the flattening device is one of the key components of the silage corn harvester, which is mainly used to destroy the hard epidermal structure of the corn stalk and promote the release of juice, thereby improving the silage fermentation efficiency and feed quality. Its core function is to crack the stem by mechanical rolling and not completely cut off. In the stem introduction stage after cutting, through the roller extrusion, the opposite rotating roller produces a kneading effect with a linear speed difference (speed ratio 1.2–1.8:1), and the speed ratio is generally between 1.2 and 1.8:1. When the pressure reached 150–300 N/cm2, the stem epidermis cracked longitudinally, the crack length was ≥80% of the stem length, the pith tissue was exposed, the stem juice exudation rate after rolling increased by 30–50%, and the soluble sugar content increased by 15–25%, providing carbohydrates for subsequent fermentation. The flattening device adopts two pairs of vertical roller groups to realize the concentrated collection and flattening of corn straw, and the power transmission is realized by the meshing gear train arranged above the flattening device. The vertical roller group in front of the feed inlet mainly plays the role of feeding and concentrating corn straw, and the vertical roller group adjacent to the crushing device at the rear of the device mainly plays the role of flattening corn straw. The flattening method is realized by the meshing gear and spring mechanism.
The opposite rotation of the front and rear flattening roller groups completes the flattening process, and the power transmission is realized by gear meshing. The power transmission path of the flattening device is shown in Figure 4. In the figure, a, b, c, d, e, and f are all spur gears, and the number of teeth is 16, 55, 31, 20, 31, and 46, respectively.
The spur gear a is the power input gear, and its speed is na. According to the gear meshing relationship, it can be seen that the rotational speed of the front flattening roller group, the rotational speed of the fixed roller in the rear flattening roller group, and the rotational speed of the movable roller in the rear flattening roller group are, respectively, as follows:
n b = 16 55 n a n e = 16 31 n a n f = 16 46 n a
When the harvester is working, the tractor outputs power and transmits the power to the transmission, and then the power is input to the main shaft of the disk cutter through the belt transmission. The spindle of the disk cutter extends outward, the direction of power transmission is changed by the helical gear, and the power is inputted to the flattening device to control its harvesting operation. In the process of power transmission, the diameter of the pulley is the same, and its diameter is 225 mm. The harvester is equipped with a Dongfanghong 1304 tractor (China One Towing Group Co., Ltd., Luoyang, China) during operation, and the speed of the power output shaft is 650~720 r/min.

Feeding Roller Material Selection and Surface Treatment

The material selection and surface treatment of the feed roller have a direct effect on its gripping ability, wear resistance, corrosion resistance, and overall service life.
(1) Material selection: The feed roller must have high strength, wear resistance, and some toughness to cope with friction, straw impact, and possible collision with hard objects (such as stones and soil). In this design, 40 Cr alloy structural steel is selected, which can achieve HRC 45–55 by quenching and tempering and balance wear resistance and impact resistance.
(2) Surface treatment process: In order to improve the wear resistance, rust resistance, or gripping effect, the feed roller is often strengthened by heat treatment. By quenching and tempering at high temperatures, the total hardness can reach HRC 45–50; by surface coating technology, usually thermal spraying, the service life can be increased by 3–5 times; at the same time, the surface has been made rust-proof, and the hard chrome plating (thickness 0.05–0.1 mm) has been made both rust-proof and wear-resistant, suitable for high-humidity environments.

3.3. Cutting Device

The crushing and throwing device adopts the disk cutter crushing method, and the feeding port is closely connected to the feeding device. Its main working parts include a rotating cutter head, a moving blade, a fixed blade, a throwing blade, a spindle, and a bowl. The circle of the moving blade and the throwing blade are evenly arranged on the rotating cutter head. The number of moving blades and the number of throwing blades are both 10. The moving blade ejects the chopped corn kernels as it rotates counterclockwise. The design is shown in Figure 5.
The blade of the moving blade cuts into the shaft along the direction of a certain angle with the vertical line of the blade line; that is, the cutting method of the moving blade is sliding cutting. When the spindle speed is n1, the throwing speed at the maximum radius of the throwing blade is as follows:
V = n 1 π r 1 30
In the formula, the rotational speed of the input shaft is 700 r/min, and the maximum radius of the blade is 182 mm. The throwing speed at the maximum radius of the throwing blade is calculated to be 13 m/s.
The actual formula for calculating the productivity of the silage harvester is as follows:
Q t = 15 S Q e v f × 10 4
In the formula, S is the working width of the header, S = 1.6 m; for the crop yield, take 4500/mu; for the operating speed of the machine, take 3.6 km/h; and the actual productivity is calculated to be 38 t/h.
The ratio of the actual productivity of the conveyor to the theoretical productivity is the filling coefficient ε of the material feed inlet. The formula for calculating ε is as follows:
ε = Q t Q
Substituting the value in = 38/47.52 = 0.79, this value is between 0.7 and 0.8, which meets the design requirements. The actual chopping productivity is greater than the amount of material harvested per unit of time, so the design of the material chopper also meets the actual work requirements.

The Hardness and Wear Resistance of the Blade and Its Influence on the Cutting Quality

(1) The hardness of the blade and the choice of materials: The hardness of the blade is too high, and it will break easily if >HRC 65; too low, and it will wear too quickly if <HRC 50.
Combined with the actual requirements, the ideal range of hardness requirements is HRC 55–62, which can balance wear resistance and impact resistance. The material is T8 high carbon tool steel, and the hardness after treatment is 58–62 HRC. The Rockwell C scale hardness tester is used to detect the blade’s working surface to ensure its uniformity.
(2) The impact on the quality of shredding: The ideal length of silage is 1–2 cm. The sharp blade can ensure a smooth cut, the same length of straw breakage, low cutting resistance, and the fuel consumption reduced by 10–15%. If the blade is passivated, the pulling fiber leads to the increase in broken powder or long residue, which affects the quality of fermentation, the power consumption increases by 20–30%, and the engine load increases significantly. If the edge is passivated circularly, i.e., the radius > 0.3 mm must be polished, and the depth > 1 mm must be replaced.

4. Test Scheme Design

4.1. Performance Evaluation Indicators

The experimental plot was randomly selected in the experimental field, and the operating speed was set to 0.8 m/s for uniform harvesting. The harvesting length was 500 m, and the repeated test was conducted 5 times. The productivity, standard grass length rate, and stubble qualification rate of the self-propelled silage harvester were measured. The relevant indicators were collected as follows [14].

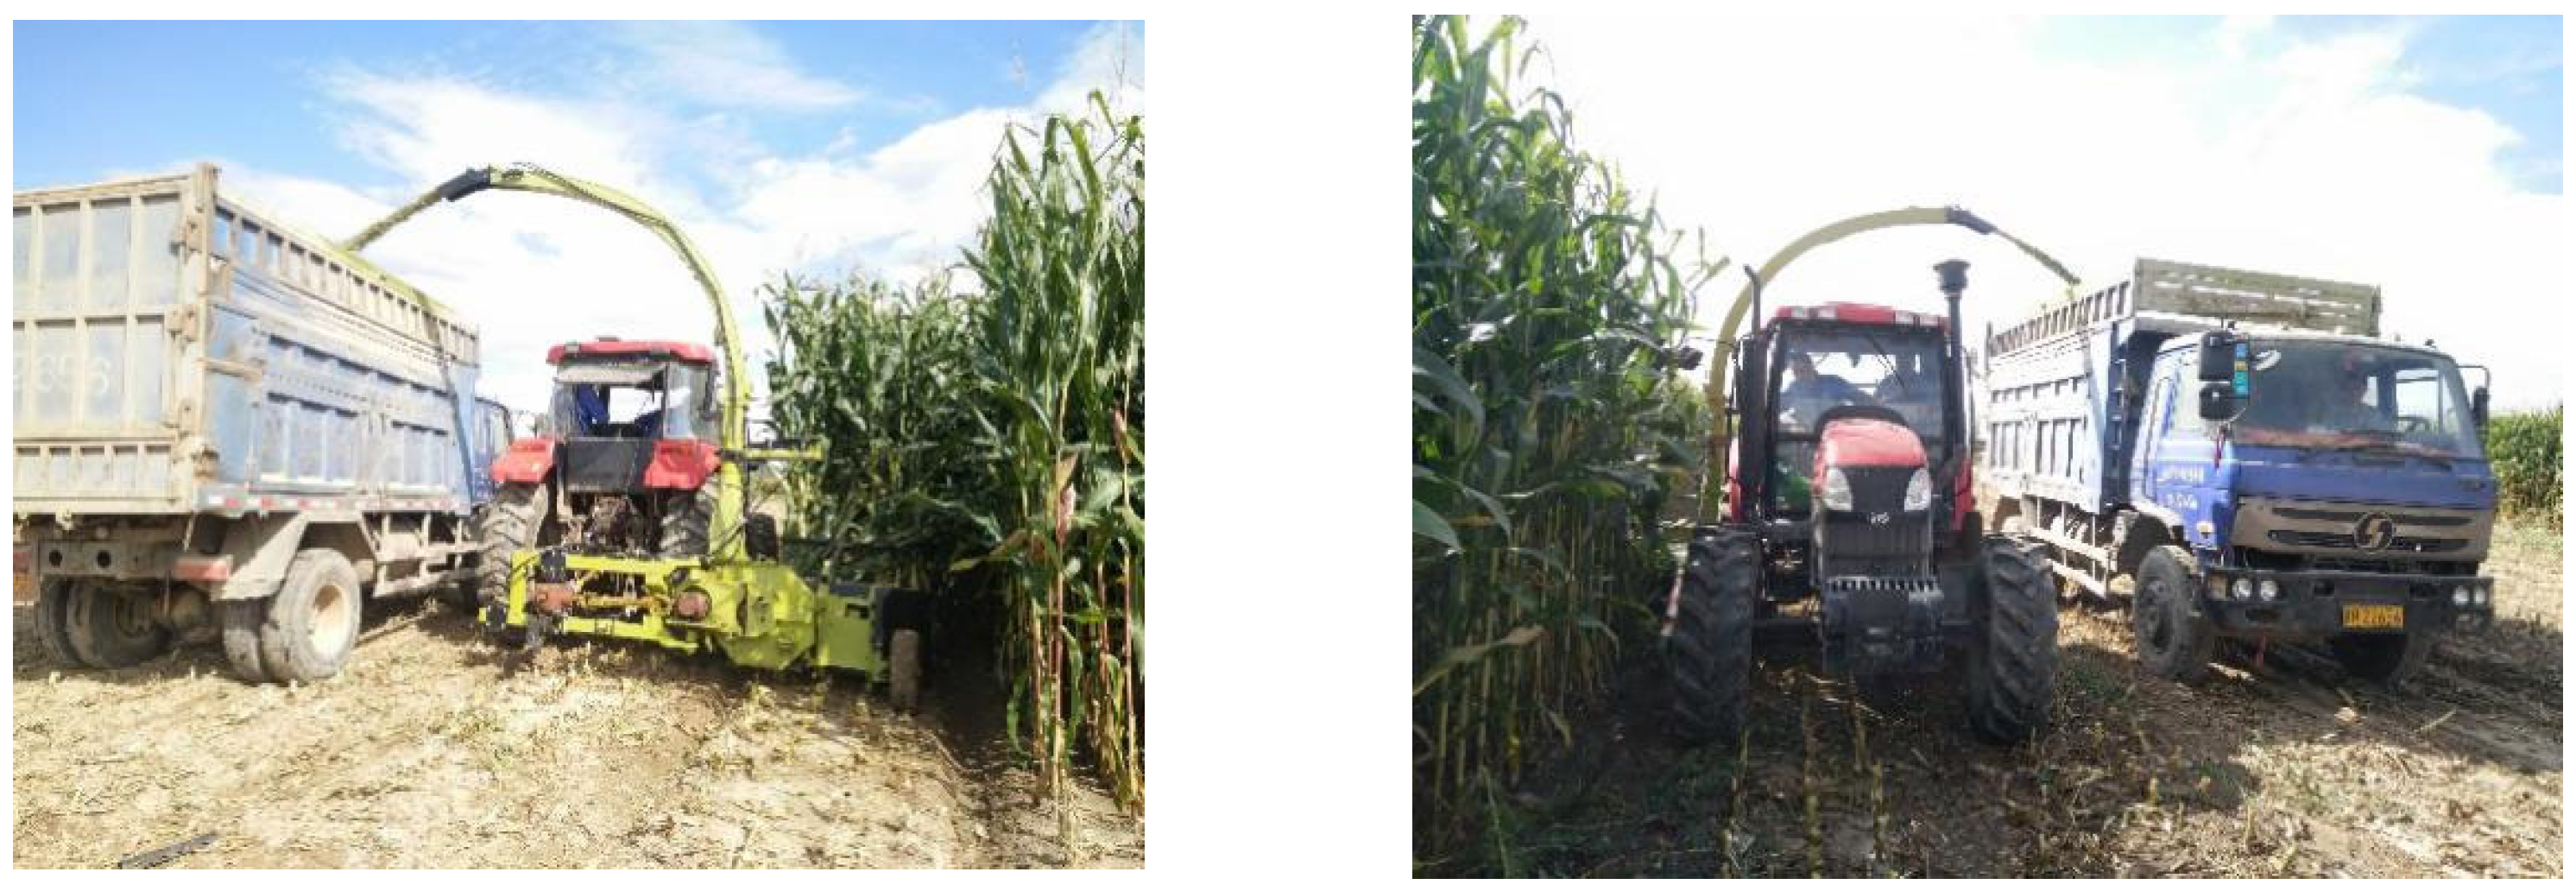
4.1.1. Test Condition

To verify whether the green feed harvester meets the requirements of the whole plant corn harvesting and technology, in September 2023, according to the standard GB/T 10394.3-2002 ‘Feed Harvester Part 3: Test Method’ [15], GB/T 10394.4-2009 ‘Feed Harvester Part 4: Safety and Operational Performance Requirements’ [16], GB/T 21961-2008 ‘Corn Harvester Test Method’ [17], and GB/T 8097-2008 ‘Harvester Combine Harvester Test Method’ [18], experiments were conducted in Huangyang Town, Wuwei City. As shown in Figure 6. The length of the test site was more than 100 m, and the slope of the terrain was 0. The main instruments and tools used in the test are a tachometer, balance, Pennsylvania sieve, stopwatch, and so on.

4.1.2. Determination of Productivity Index

Three strokes are taken within the working range of the prototype, and the length of each stroke is 100 m. The time taken by the machine to complete this stroke is recorded, and the average productivity of the three strokes is calculated as the productivity of the machine. The calculation formula is as follows:
y 1 = 0.1 b x 1 k q c
In the formula, y1 is productivity, t/h; b is the cutting width, m; x1 is the forward (operation) speed of the test machine, km/h; k is the utilization coefficient of the cut width, %; and qc is the crop yield per hectare, t/hm2.

4.1.3. Determination of Standard Grass Length Rate

The standard grass length ratio refers to the percentage of the quality of the standard length of the broken straw in its total quality. In the working area, three measuring points were selected, and the measured values were obtained by averaging three parallel tests and three repeated tests. That is, each sample was divided into three parts for the parallel test, and three repeated tests were carried out three times. When the whole machine was harvested in normal operation, 1200–1500 g of chopped material samples were taken from the outlet of the throwing cylinder, which was divided into three parts, with each weight of 400–500 g. The weight was measured as a small sample weight, my, and the unit was g. The non-standard chopped materials were screened out by a Pennsylvania sieve, and the average value of the standard grass length rate at three measuring points was calculated. The calculation formula is as follows:
y 2 = m c / m y × 100 %
In the formula, y2 is the standard grass length rate, %; mc is the total mass of the standard grass length, g; and my is the sample mass, g.
Note: The standard grass length refers to the range of 0.7~1.2 times the maximum and minimum cutting size given by the equipment.

4.1.4. Determining the Qualified Stubble Cutting Rate

Three points were measured in the longitudinal direction of each stroke measurement area, and the height of straw stubble in the area of 1 m × 1 m was measured at each point. The height of the stubble cut to the ground (ridge top) was measured, and the average value was taken. If the stubble height was less than or equal to 150 mm, it was considered qualified.

4.2. Design of Test Scheme

4.2.1. Design of Experimental Scheme Based on Latin Hypercube

The experimental design is the basis for building the mathematical model, which is directly related to the accuracy of the prediction model and affects the final optimization effect. DOE (Design of Experiments) sampling methods include full factorial, central composition, orthogonal array, Latin hypercube, and optimal Latin hypercube. In contrast, the optimal Latin method optimizes the order of occurrence of each level in each column of the design matrix, which can ensure that the horizontal distribution of factors of each sample point is more uniform, with excellent space filling and balance, avoiding the occurrence of gap areas.

4.2.2. Construction of Regression Equation and ANOVA Analysis

(1) Construction of regression equation
The performance of the silage corn harvester is affected by multiple operating parameters during operation, which is the result of the coupling of multiple variables. It shows that there is a multi-dimensional nonlinear relationship between the operating parameters and the performance of the whole machine. Only by setting reasonable operating parameters can the performance of the whole machine be improved, and reasonable operating parameters can often be obtained by constructing mathematical models and optimizing them.
In this paper, regression analysis is used as the proxy model to construct the mapping relationship between the three operating parameters and the performance of the whole machine (operating productivity y1, standard grass length rate y2, stubble qualification rate y3). For job performance, there is an interaction between job parameters, so a second-order model is adopted. The regression model is as follows:
y = a 0 + i = 1 n a i x i + i = 1 n a i i x i 2 + i < j n a i j x i x j
In the formula, y is the working performance of the whole machine; a0, aii, and aij are the model coefficients to be solved; n is the number of influencing factors, which is 3 in this paper; and xi, xj is the design variable.
(2) ANOVA Analysis
The variance analysis determines the total variance of the response target by calculating the error of the polynomial model itself and the sum of the squared deviations and mean squared values of the fitting error and determines the fitting accuracy (R2) and F-value. The variance analysis of the above regression equation can be used to determine whether the equation is statistically significant. In general, the closer the R2 is to 1, the more accurate the equation. If the F-value is greater than the critical value, the regression model is more significant.

4.2.3. Particle Swarm Optimization Algorithm

Particle Swarm Optimization (PSO) is a bionic meta-heuristic algorithm. It simulates the social behavior of flocks of birds or schools of fish and finds the optimal solution through cooperation and information sharing among individuals in the group. As one of the most classic swarm intelligence algorithms, it is widely used to solve single-objective optimization problems because of its ease of implementation and fast convergence speed. Since Moore and Chapman first tried to extend it to multi-objective optimization [14], the existing literature [19,20,21,22] has shown that PSO also has good potential in solving multi-objective problems.
He et al. analyzed the ‘swarm explosion’ phenomenon in the mainstream MOPSOS algorithm in reference [23] (the speed of the particles becomes too high, resulting in the unstable movement of the upper and lower bounds of the particle position), and believed that it could be prevented by using the speed-constraint mechanism class, so a speed-constrained multi-objective particle swarm optimization (SMPSO) algorithm [24] was proposed. Compared to NSGA-II [25] and SPEA2 [26,27], MOCELL, OMOPSO, and other algorithms, SMPSO can handle more complex MOPs.

5. Results Analysis

5.1. DOE Experimental Design

5.1.1. Design of Test Conditions

The whole plant maize base in Huangyang Town, Wuwei City, was selected as the experimental plot. Five density gradients of 60,000 plants were established. The field water holding capacity was 70%, near the irrigation canal, slightly saline, conductivity was 1.2 dS/m, sandy loam, pH was 8.1, organic matter was 1.2%, and the previous crop was whole plant maize. The variety is ‘Zhengdan 958’ with starch content > 30%, stem sugar content > 8%, and whole plant crude protein > 7.5%.

5.1.2. Design of Experimental Variables

The performance of the silage maize harvester is affected by many factors, including the forward speed of the whole machine, the speed of the cutter, and the speed of the drum. Therefore, the three factors of whole machine forward speed (x1), cutter speed (x2), and drum speed (x3) are the experimental variables. The specific range of values is shown in Table 3.
To ensure the uniformity of the sample points, the optimized Latin hypercube uses the stratified sampling technique to sample the three input parameters and uses the combination of sampling parameters as the input parameters required for the test. The farm productivity y1, the standard grass length rate y2, and the stubble qualification rate y3 are used as the data output, and a total of 48 sets of sample data are taken as the test plan, as shown in Table 4.

5.2. Analysis of Operation Performance Under the Interaction of Various Factors

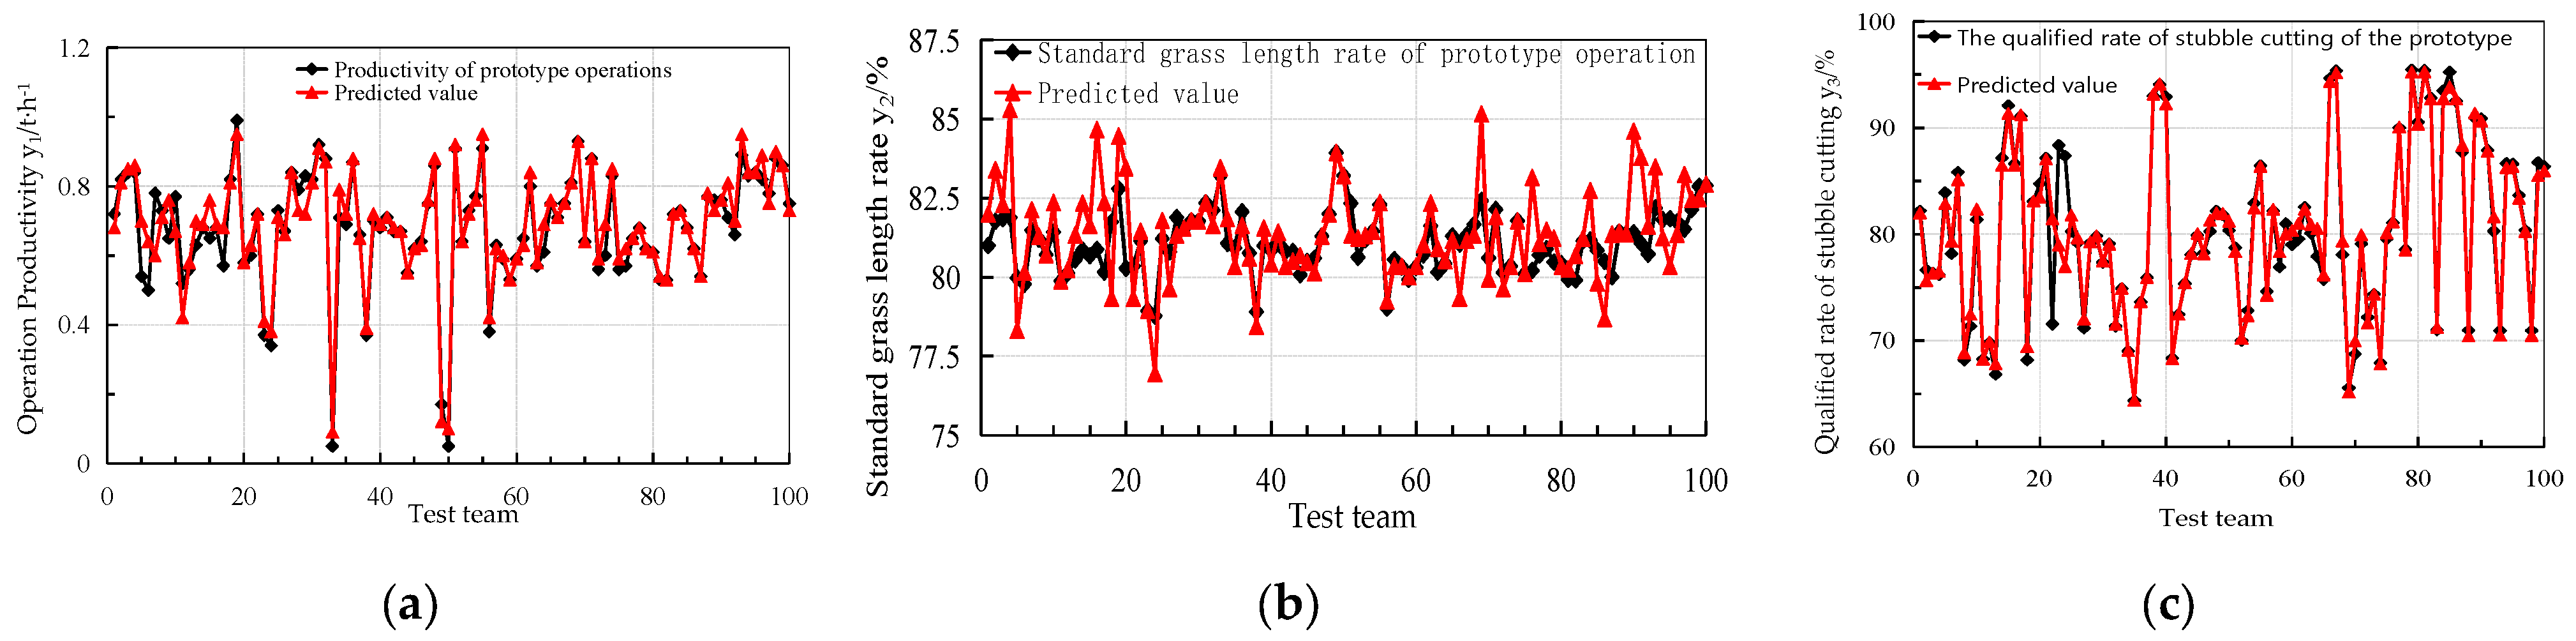
5.2.1. Analysis of Operation Productivity

The change area of the operation productivity y1 of the interaction of feed rate x1, cutter speed x2, and drum speed x3 is shown in Figure 7a–c. When x3 is a fixed value, the effect of the interaction between x1 and x2 on productivity is shown in Figure 7a. It can be seen that as the working speed increases, the production rate gradually increases, and then the entire surface is smooth. After the working speed of 1.2 m/s, it increases again. When 1.2 < x1< 1.5, 1350 < x2< 1500, the response surface is steeper, indicating that the interaction between x1 and x2 is stronger. This is because as the working speed and cutter speed increase, the amount of silage maize harvested increases, so the productivity becomes greater, which is consistent with the theoretical analysis results.
When x1 is constant, the surface figure of the interaction between x2 and x3 on productivity is shown in Figure 7b. At this time, the surface is steep between 1150 < x2 < 1300, but the overall effect of the change in the cutter speed x2 on the surface is not very obvious. However, the drum speed x3 has a greater impact. It can be seen from the figure that the steepest surface is between 0 < x3 < 34 and 46 < x3 < 50, indicating that too large or too small speed will affect productivity, but there is a maximum productivity between 46 < x3 < 50. This is because the harvested feed can be transported to the storage tank in time, increasing productivity.
When x2 is constant, the surface figure of the interaction between x1 and x3 on productivity is shown in Figure 7c. It can be seen that x1 has little effect on productivity because as the operating speed increases, the corn straw entering the cutter fails to be cut off in time, resulting in no significant increase in productivity. However, x1 has a certain impact on productivity, and the maximum productivity appears between 46 < x3 < 50.

5.2.2. Standard Grass Length Rate Analysis

The standard grass length rate y2 change area of the interaction of forward speed x1, cutter speed x2, and drum speed x3 is shown in Figure 8a–c. When x3 is a fixed value, the effect of the interaction between x1 and x2 on y2 is shown in Figure 8a. When the cutter speed is between 1200 and 1500 rpm, the effect of operating speed on y2 is not obvious, but when the cutter speed decreases, the optimum operating speed is 1.2–1.5 m/s. Compared with the operating speed, the smaller the rotation speed of the cutter, the steeper the surface appears, and there is a maximum value of the standard grass length rate. In summary, it can be concluded that the optimum speed range of the whole machine cutter is 1000–1200 r/min, and the optimum operating speed range is 1.2–1.5 m/s.
When x1 is constant, the surface figure of the interaction between x2 and x3 on y2 is shown in Figure 8b. At this time, the value of y2 gradually increases with the decrease of x2 and the increase of x3, and the surface is the steepest between 1000 < x2 < 1100 and 46 < x3 < 50. Within this range, the interaction between x2 and x3 is the strongest, and the standard grass length rate has a maximum value.
When x2 is zero, the effect of the interaction between x1 and x3 on the standard grass length rate is shown in Figure 8c. It can be clearly seen that when 1.2 < x1 < 1.5 and 46 < x3 < 50, the response surface is steeper, indicating that the standard grass length rate changes greatly. This is because the conveyor belt can transport the harvested straw feed to the discharge port in time, ensuring that the cutting process can be carried out effectively and the standard grass length rate can reach the maximum value.

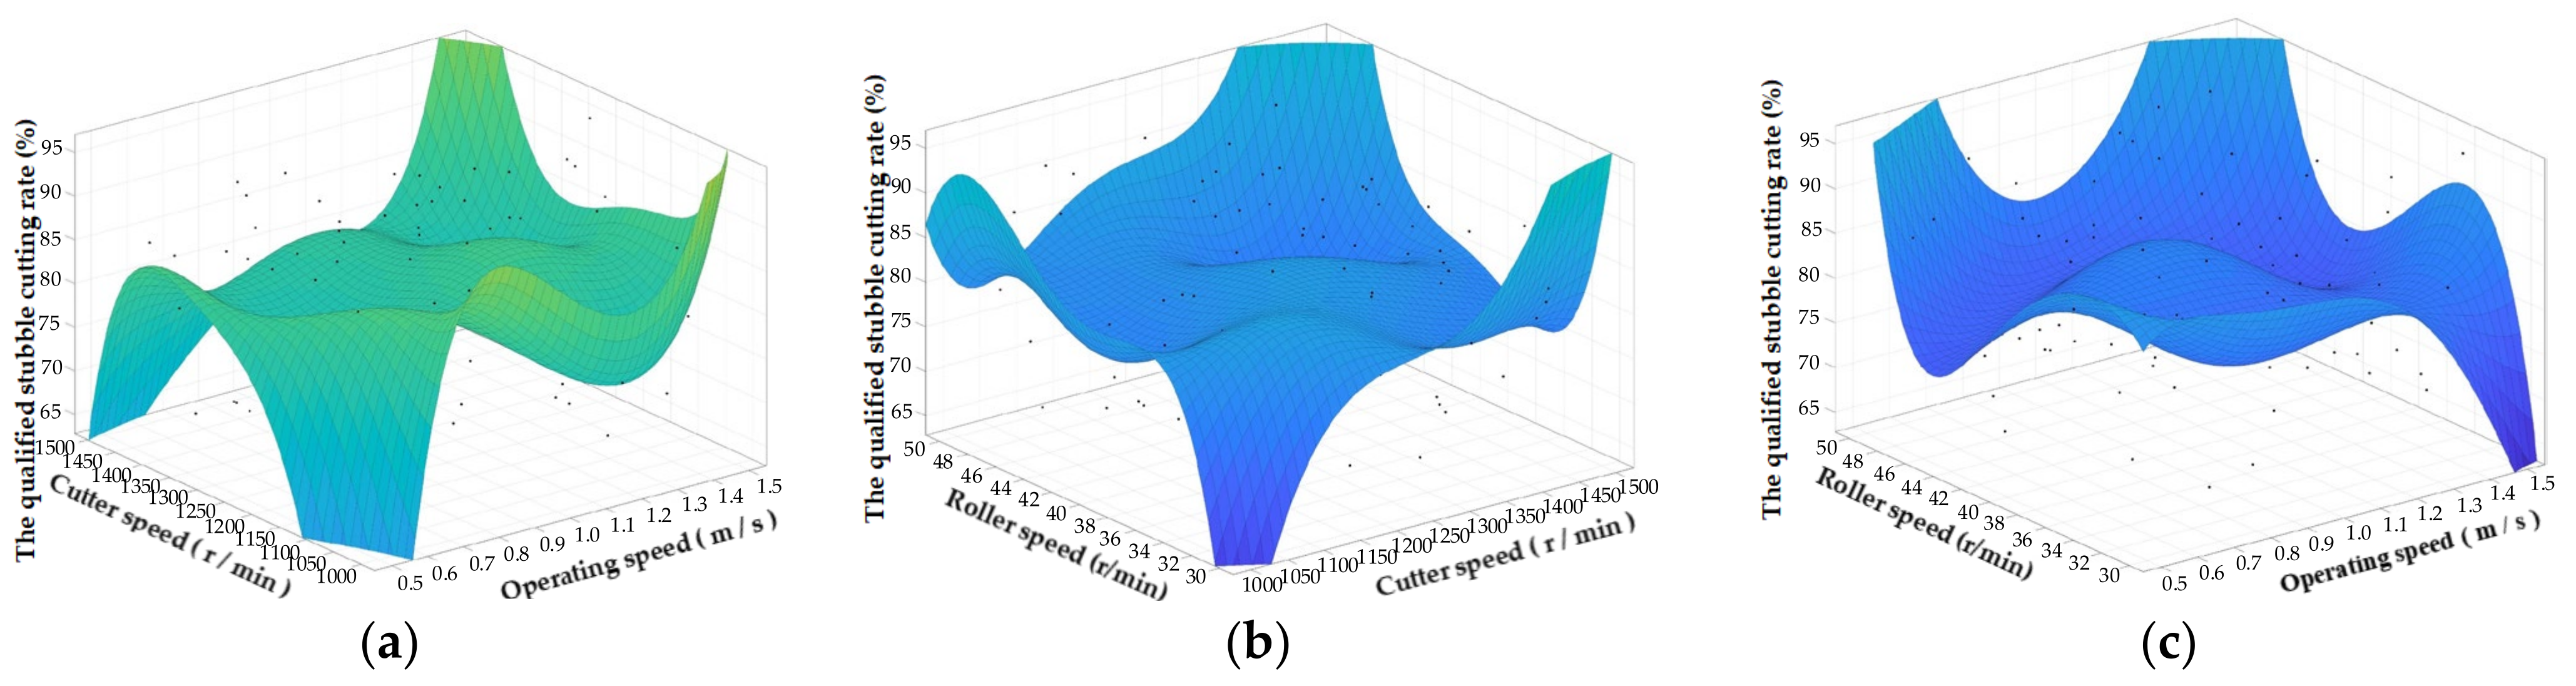
5.2.3. Analysis of the Qualified Stubble Cutting Rate

The qualified stubble cutting rate changes with x1, x2, and x3, and the interaction is shown in Figure 9a–c. It can be seen from the whole surface that when the operating parameters take the intermediate value, the influence on the qualified stubble rate y3 is not significant. When x2 is zero, the effect of the interaction between x1 and x2 on the qualified rate of stubble y3 is shown in Figure 9a. It can be clearly seen that when x1 and x2 take the minimum and maximum ranges, they have the most significant effect on the qualified stubble rate. However, the range of x1 and x2 of the maximum value of the qualified rate of stubble is 1.3–1.5 m/s and 1350–1500 m/s, respectively, which is because the increase in operating speed and cutter speed improves the efficiency of harvesting and makes the stubble flatter.
When x1 is zero, the influence of the interaction between x2 and x3 on the qualified stubble rate is shown in Figure 9b. It can be seen that there is also the steepest surface at the lower speed of the drum and the higher speed of the cutter, indicating that the low speed of the conveyor belt is also significant for the qualified stubble rate. This is because the speed of the drum is too low to transport the chopped straw to the outlet in time, which indirectly affects the value of y2. When 1300 < x2 < 1500 or 44 < x3 < 50, the response surface is steeper, indicating that the qualified stubble rate varies greatly and there is a maximum value. This is because the high-speed rotating tool can cut the silage corn straw in a timely and efficient manner, and the high-speed running conveyor belt can transport the chopped straw to the discharge port in a timely manner, thus improving the stubble qualification rate.
When x2 is fixed, the influence of x1 and x3 interaction on the qualified stubble rate is shown in Figure 9c. When 1.0 < x1 < 1.5 or 44 < x3 < 50, the response surface is steeper, indicating that the two operating parameters of x1 and x3 have the greatest influence on the qualified stubble rate within the above range, and there is a maximum value.

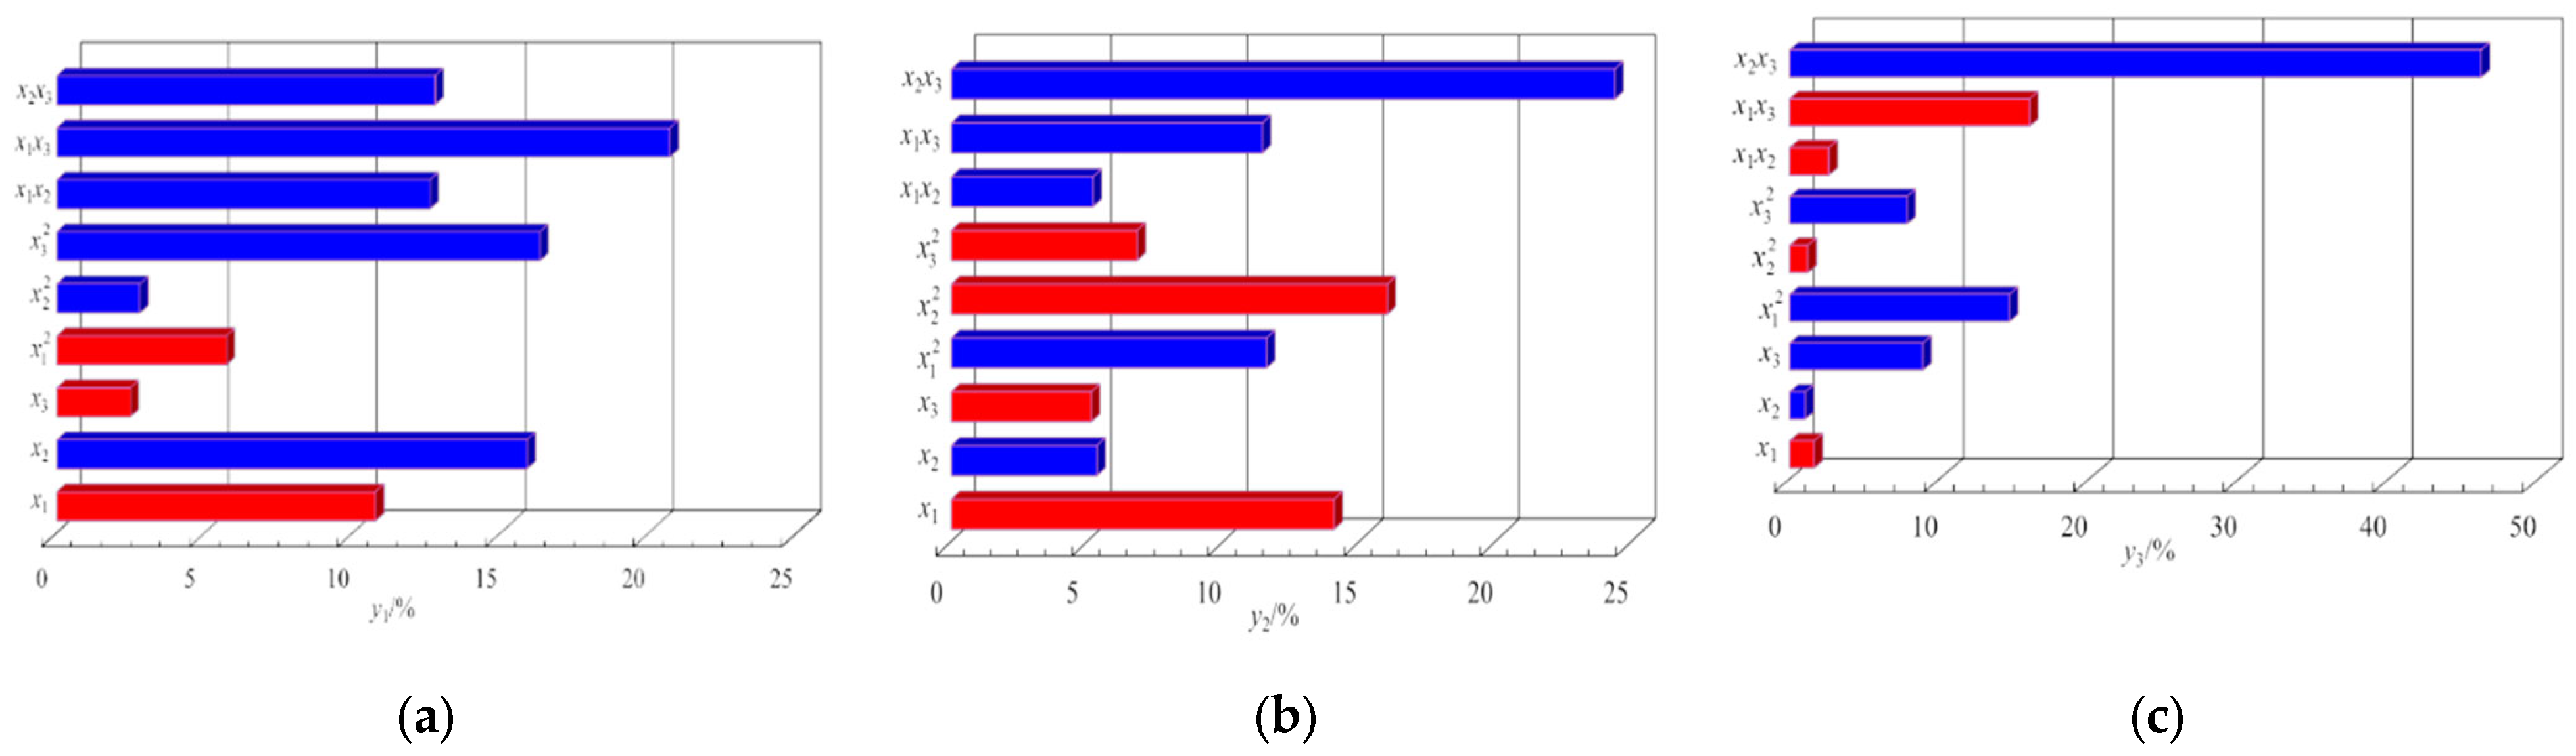
5.2.4. Analysis of Different Factors on the Performance of the Operation

The Pareto value of each factor is shown in Figure 10a–c. The higher the Pareto value, the greater the influence of this factor or interaction factor on the evaluation index. The blue histogram indicates that the factor has a positive influence on the evaluation index, and the red histogram indicates a negative influence.
It can be seen from Figure 10a that in terms of the productivity of the whole machine, the influence of single factors x1 and x2 on the productivity of the whole machine is extremely significant. Among the interaction terms, the interaction of x1x3 has the most significant influence on the productivity of the whole machine. Although x1 contributes much to productivity, it has a negative effect, and x3 and the other two factors have a negative effect on productivity. The influence of x1x3, x2, x2x3, x1x2, x1, and x3 on the productivity of the whole machine is 20.70%, 16.31%, 15.87%, 12.76%, 12.6%, 10.76%, 5.72%, 2.8%, and 2.47%, respectively, which indicates that x3 (drum speed) has a weak influence on the productivity of the whole machine.
Combined with Figure 10b, it can be seen that the single factor x1 has the most significant effect on the standard grass length rate y2, so the proportion is the largest, and its value is 14.06%. The effect of x2 and x3 on the standard grass length rate is small, accounting for 5.35% and 5.15%, respectively. In the interaction term, the influence of x2x3 on y2 is very significant, accounting for 24.38% and 16.02%, respectively, followed by the influence of x1x3 and x1x2, the corresponding values are 11.58%, 11.43%, 6.83%, and 5.21%, respectively. Where x1, x3, are negative effects on y2. In summary, x3 (roller speed) has a small effect on the standard grass length rate. It can be ignored when setting the operating parameters.
It can be seen from Figure 10c that the influence of a single factor on the qualified rate of stubble y3 is relatively small, and the effect of the maximum value of x3 is only 8.87%. The contribution of x1 and x2 is 1.62% and 1.03%, respectively, and the single factor x1 has a negative effect on y3. The contribution of each item in the interaction term is quite different, among which x1x3, x1x2, x2x3, and the proportion of y3 are 16.01%, 14.66%, 7.82%, 2.62%, and 2.20%, respectively. Among them, x1x3, x1x2 and all have negative contributions to y3.

5.3. Multi-Objective Optimization Analysis

5.3.1. Construction of Regression Equation

Using Isight regression analysis software, a ternary quadratic regression model of farm productivity y1, standard grass length rate y2, and stubble qualification rate y3 was constructed. The corresponding coefficients are provided in Table 4.
y 1 = 4.1637 1.1632 x 1 0.001538 x 2 0.10365 x 3 + 0.00043868 x 1 x 2 + 0.018019 x 1 x 3 + 0.000022215 x 2 x 3 0.099564 x 1 2 + 0.00000019504 x 2 2 + 0.00070978 x 3 2 y 2 = 84.575 4.7757 x 1 + 0.0041625 x 2 0.17225 x 3 + 0.0007527 x 1 x 2 + 0.041308 x 1 x 3 + 0.00017627 x 2 x 3 + 0.83704 x 1 2 + 0.00000046317 x 2 2 0.0012336 x 3 2 y 3 = 177.49 + 4.423 x 1 0.074185 x 2 2.7796 x 3 0.0023 x 1 x 2 0.35253 x 1 x 3 + 0.002036 x 2 x 3 + 6.4574 x 1 2 0.0000021077 x 2 2 0.0086137 x 3 2
The 48 sets of test parameters in Table 5 were substituted into the above regression equations to obtain the corresponding predicted values. By drawing the line graph of the predicted value and the simulated test value (Figure 11), it can be seen that the difference between the predicted value and the test value is small, and the prediction accuracy is high. The red line chart represents the predicted value, and the black line represents the measured value. It can be seen from the figure that the broken line of the predicted value is basically synchronized with the broken line of the measured value. Through calculation, the error between the predicted value and the experimental value is 5%, which is within the error range.

5.3.2. Analysis of Variance

The variance analysis determines the total variance of the response target by calculating the error of the polynomial model itself, the sum of the squared deviations, and the mean squared values of the error of fit and determines the fit accuracy (R2) and F-value. The variance analysis of the above regression equation can determine whether the equation is statistically significant. In general, the closer the R2 is to 1, the more accurate the equation. If the F-value is greater than the critical value, the regression model is more significant. A significance level of 0.05 was chosen for the analysis, and the analysis of variance of the regression model is shown in Table 6. It can be seen from Table 6 that the farm productivity, standard grass length rate, and stubble qualification rate R2 are close to 1, so the regression model is considered to be more accurate. After checking the F-test table, F0.05 (6,21) = 3.08, F > F0.05 (6,21), which indicates that the regression model has a very significant effect.

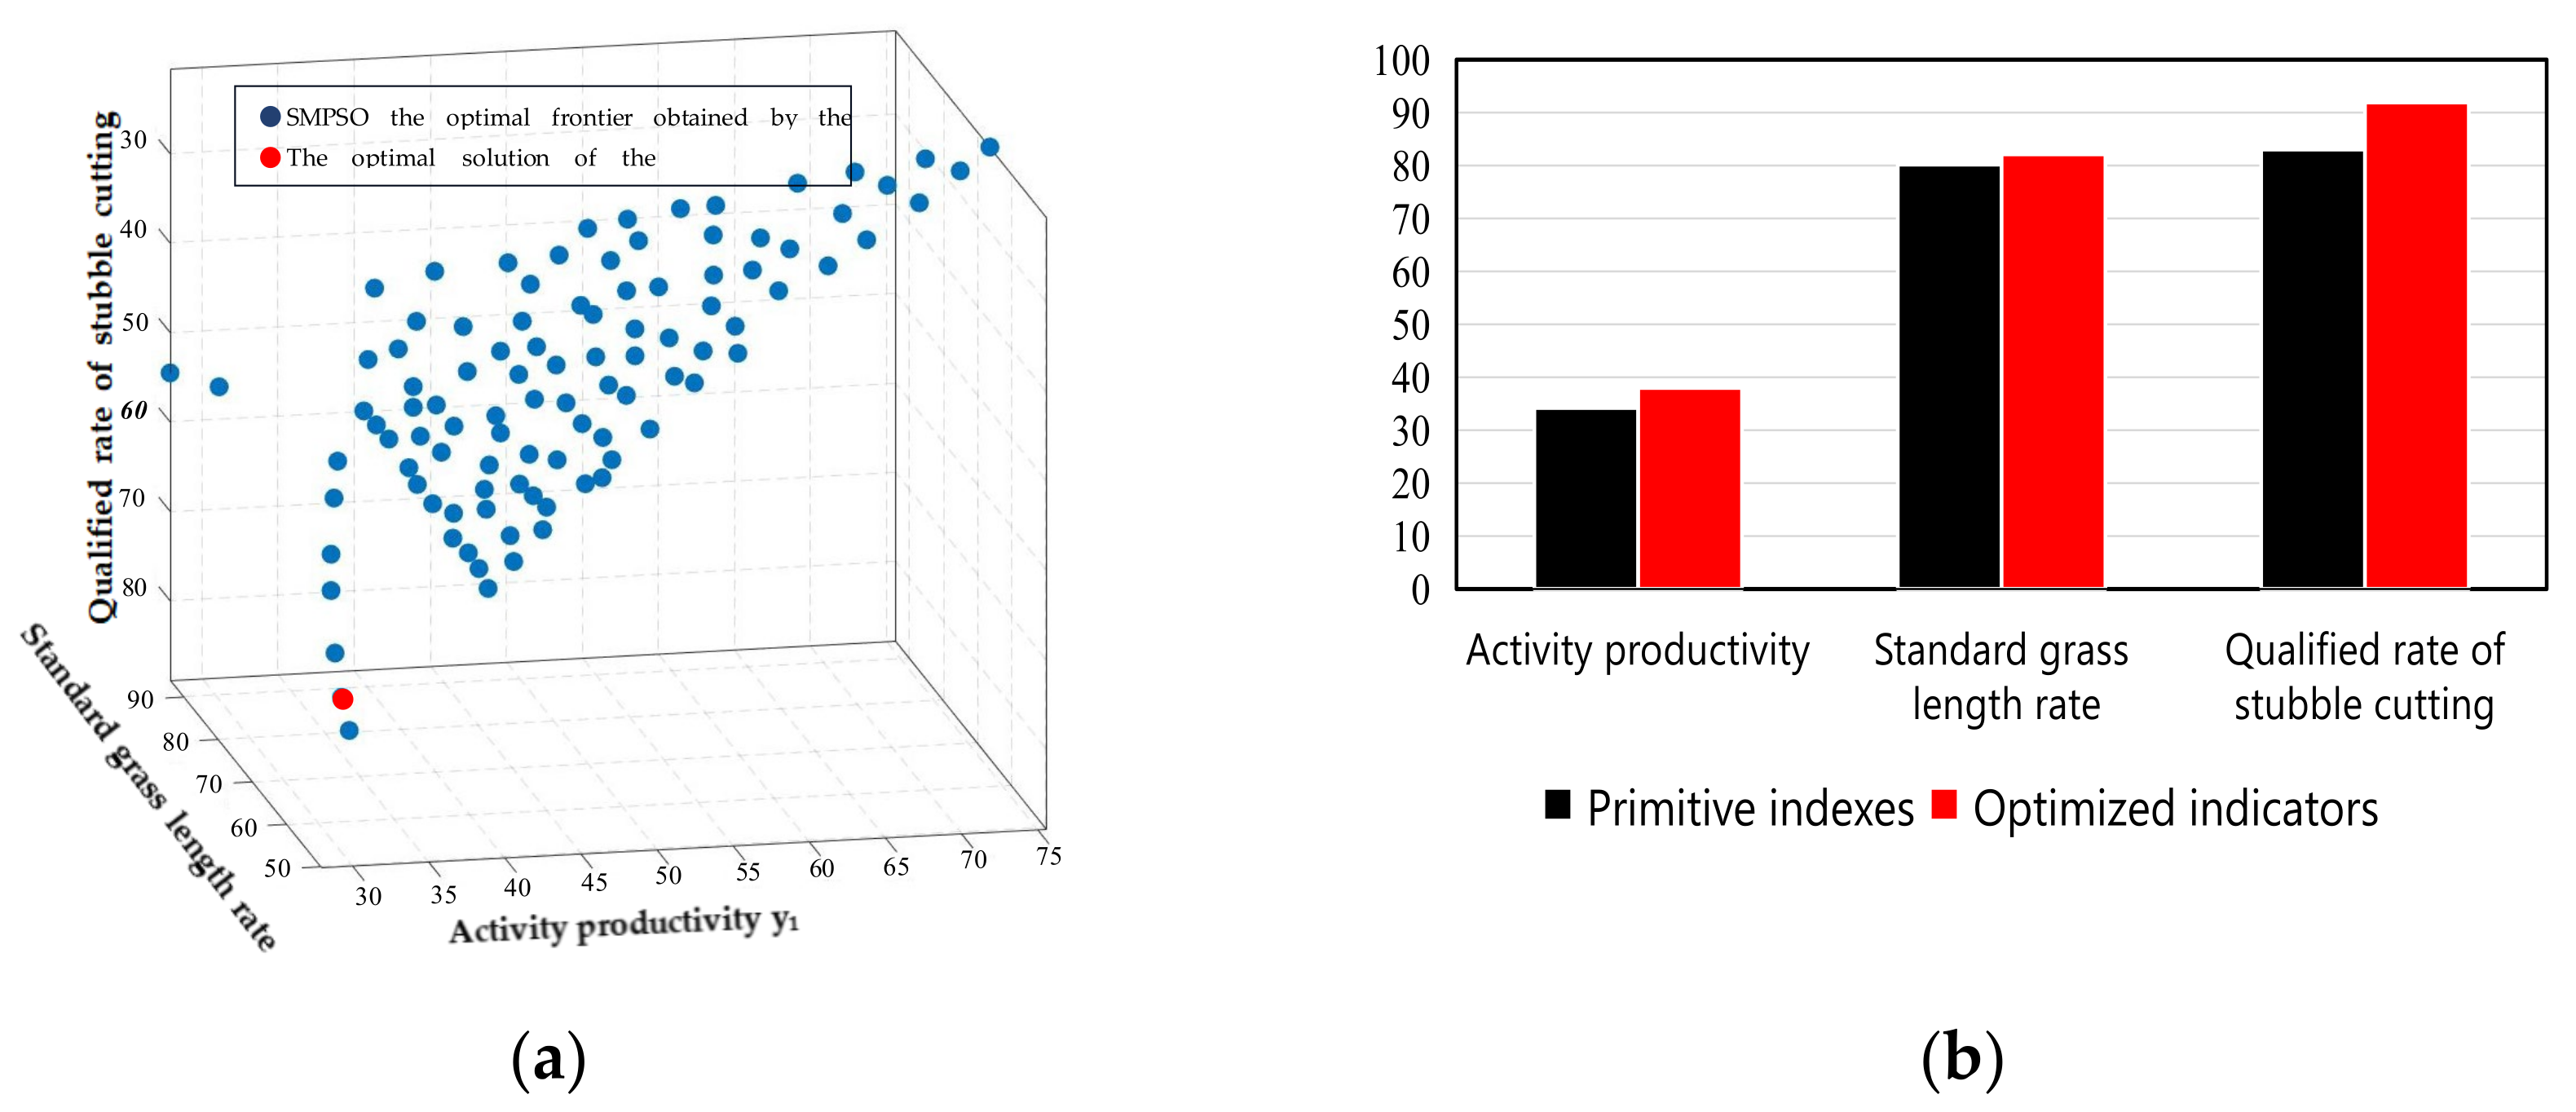
5.3.3. Multi-Objective Optimization

The SMPSO algorithm is programmed using MATLAB R2021. The relevant parameters of the SMPSO algorithm are set as follows: the population size is 100, the size of the external archive set is 100, the mutation adopts the polynomial mutation operator, and the mutation probability Pm = 1/L, where L is the dimension of the decision variable, and the maximum function evolution is set to 30,000 times. The Pareto solution set is obtained, and the distribution is shown in Figure 12a. In the Pareto frontier shown in Figure 12, the author hopes that the operation productivity y1, the standard grass length rate y2, and the stubble qualification rate y3 can be optimized at the same time, but the operation productivity y1, the standard grass length rate y2, and the stubble qualification rate y3 are contradictory. Improving one objective may sacrifice the other two objectives. The author selects the most satisfactory optimization solution from the Pareto frontier according to the actual situation and experience. As shown in Figure 12a, the corresponding x1, x2, and x3 are 1.00 m/s, 1085.89 r/min, and 30 m/s, respectively, and the optimal values of y1, y2, and y3 are 38 t·h−1, 82.15%, and 91.95%, respectively.
The optimized parameters x1, x2, and x3 were selected for field experiments. The test site was still Huangyang Town, Wuwei City, as shown in Figure 13. The time was September 2024. The corn test site was longer than 90 m, which was in accordance with the test method. The length of the test site is not less than 90 m, and the length of the test area is not less than 50 m. There is a stable area of 20 m before and after the test area. After the driving performance test is stable, the whole machine is driven into the test area, adjusted according to the optimized parameters, and the harvesting test is carried out. The optimized index value and the original value are shown in Figure 12b. It can be seen that the optimized index has been improved. Among them, the qualified stubble rate was significantly improved.

6. Results and Discussion

6.1. Discussion

6.1.1. Limitations of Related Research

(1) Crop adaptability limitations, including differences in varieties and planting patterns. Different silage maize varieties, such as high-stalk type, dwarf type, and high-sugar type, have large differences in stem strength, moisture content, and lodging characteristics, and it is difficult to uniformly design and study.
(2) The level of intelligence and automation is low, and there is a lack of precise control systems. It is impossible to adjust the cutting speed and feeding amount in real time according to crop density and water content. AI visual recognition technology has not been widely used, such as automatic identification of lodging plants and adjustment of header angle.

6.1.2. Innovations of This Paper

Through theoretical calculation and consulting the relevant literature, the key structural parameters of the actuator are determined, and the actuator and walking mechanism are designed separately to ensure that the requirements of special plots in hilly and mountainous areas can be met to the greatest extent. The design of the test scheme is carried out by Latin hypercube, and the performance of the harvester is analyzed in combination with the field test. Finally, the multi-objective optimization is carried out by particle swarm optimization.

6.1.3. Comparison of Research Results

(1) Comparison of operation productivity
Self-propelled silage harvesters, such as CLAAS Jaguar and John Deere 8000 series, usually have a maximum efficiency of 8–15 mu/h, which is suitable for large-scale fields. Traction or suspension harvester has low efficiency (3–6 mu/h), but the cost is lower. In this paper, the side-suspension type is used to design the actuator and the walking mechanism separately. The operation efficiency can reach 7 mu/hour. Although the efficiency is not the highest, it can meet the special terrain operation in hilly and mountainous areas.
(2) Cutting table width
The efficiency of a wide cutting table (such as 4–6 rows) is 30–50% higher than that of a narrow cutting table (2–3 rows).
(3) Crushing length uniformity
The deviation of the traditional mechanical adjustment model may reach ±20%. In this paper, the electronic control is used to achieve a more stable cutting length, and the theoretical value is only ± 5% deviation.
(4) Grain breakage rate
Through the model equipped with a grain crushing device, the crushing rate can reach more than 95%, and the feed digestibility can be significantly improved.
(5) Fuel consumption
The fuel consumption of the self-propelled model is high, and the fuel consumption reaches 12–20 L/mu, but the unit area takes less time.
In this paper, the design of the rotary hanging is adopted, and the fuel consumption is 8–12 L/mu, but the total operation time is longer.

6.1.4. Later Research Direction

(1) Intelligent control technology: Real-time adaptive control systems based on sensors and AI are developed.
(2) Low-power design: Explore the application of electric, hybrid, and lightweight materials.
(3) Shared economic model: Promote cooperative or rental models to reduce the cost of use.

6.2. Conclusions

(1). In order to solve the problems of no suitable machine available, low operating performance, and poor handling in hilly and mountainous silage harvesting operations, a single-disk silage harvester was designed. Solid Works and CAD were used to make the drawings and three-dimensional drawings of the parts and the whole machine. Through theoretical calculation and combined with the actual production situation, the rotation speed of the conveying drum is determined to be n = 30–60 rpm, the rotation speed of the disk cutter is n2 = 988–1623 rpm, and the rotation speed of the power output shaft is 650~720 rpm. The actual productivity Qt = 38 t·h−1 is calculated.
(2). Based on the corn silage harvester selected in this paper, harvesting productivity, standard grass length rate, and stubble passage rate were used as evaluation indexes, and working speed, cutter speed, and drum speed were used as design parameters. The optimal Latin hypercube method was used to extract 48 groups of sample data as the experimental design, and MATLAB R2021 and Isight software were used to analyze the interaction of various factors on the evaluation index. The analysis showed that the working speed of the whole machine as a single factor had the greatest influence on the harvesting productivity y1, the standard grass length rate y2, and the stubble passing rate y3, but the negative influence. The interaction terms such as x2x3 and x1x3 have relatively significant effects on y1, y2, and y3. Among them, x2x3 has a positive effect on all three indicators, x1x3 has a positive effect on y1 and y2 and a negative effect on y3.
(3). The ternary quadratic regression prediction model was constructed by Isight 5.6 software, and the validity of the model was verified by variance analysis and field experiments. It shows that the response surface model of the evaluation index can fit the response well. The program of the SMPSO algorithm is written by MATLAB R2021, and the main program is run to optimize the objective and obtain the Pareto solution set. Combined with practical experience, the optimal parameter values of x1, x2, and x3 are 1.00 m/s, 1085.89 rpm, and 30 m/s, respectively, and the values of the optimal values of y1–1, y2–1, and y3–1 are 38 t·h−1, 82.15%, and 91.95%, respectively. By adjusting the operating parameters of the prototype (the optimized parameter values), the two field experiments were carried out, and the values of y1–2, y2–2, and y3–2 were 36 t·h−1, 81.38%, and 89.73% respectively. This is because in the actual operation process, due to the influence of topography, soil quality, and operators, the operating parameters are unstable, so the test statistical value is slightly smaller than the optimized calculation value.
The values of y1–1, y2–1, and y3–1 are within the error range of 5% compared to the values of y1–2, y2–2, and y3–2. It can be considered that the optimization parameters and results meet the requirements.

Author Contributions

Conceptualization, W.S., H.L. and W.W.; methodology, W.S. and W.W.; software, W.W.; validation, H.L., W.W., X.L. and Y.Y.; formal analysis, W.W. and W.S.; investigation, X.L. and H.L.; writing—original draft preparation, W.W. and X.L.; writing—review and editing, W.W. and W.S.; visualization, W.W.; supervision, W.S.; project administration, H.L. and X.L. All authors have read and agreed to the published version of the manuscript.

Funding

This work was supported by the Gansu Province Major Science and Technology Project (24ZD13NA019), Gansu Provincial University Industry Support Plan (2022CYZC-42).

Data Availability Statement

The data presented in this study are available on request from the authors.

Acknowledgments

The authors thank the editor for providing helpful suggestions to improve the quality of this manuscript.

Conflicts of Interest

Author Xiaokang Li was employed by the company Gansu Mechanical Science Research Institute Co. The remaining authors declare that the research was conducted in the absence of any commercial or financial relationships that could be construed as a potential conflict of interest.

References

  1. Li, X.; Li, X.; Zhang, F.; Li, X.; Shen, X. Design and experiment of feeding and shredding test bench for silage corn harvester. Chin. J. Agric. Mach. Chem. 2024, 45, 41–47. [Google Scholar]
  2. Wu, J.; Li, S.; Lin, H.; Ma, Y.; Pan, L.; Li, D.; Yang, G.; Sun, D. Comparative study on quality traits of different silage maize varieties. Anim. Husb. Feed Sci. 2021, 42, 48–51. [Google Scholar]
  3. Chen, M.; Xu, G.; Song, Z.; Wei, M.; Diao, P.; Xin, S. Design and experiment of automatic grinding device and control system for corn silage harvester. Acta Agric. Eng. 2022, 38, 22–33. [Google Scholar]
  4. Ye, H. Six factors lock the green forage harvester market. Contemp. Agric. Mach. 2021, 28–31. [Google Scholar]
  5. Zhang, L.; Luo, H.; Zhou, Y.; Qiu, Q.; Yuan, S.; Cai, J. Design and experiment of bionic crushing blade for the upper jaw of silage corn leaf-cutting ant. Acta Agric. Eng. 2022, 38, 48–56. [Google Scholar]
  6. Mu, X.D.; Jiang, H.X.; Sun, Y.C.; Xu, H.G.; Yao, Y.C.; Geng, D.Y. Simulation Optimization and Experiment of Disc Grain Crushing Device for Silage Corn Harvester. Trans. Chin. Soc. Agric. Mach. 2020, 51, 218–226. [Google Scholar]
  7. Li, X.; Zhang, J.; Han, S.; Shen, X. Design and experiment of 9QZL-1.8 self-propelled silage corn combine harvester. Chin. J. Agric. Mach. Chem. 2020, 41, 1–6+19. [Google Scholar]
  8. Jia, J. Use and maintenance of suspended silage harvester 4QS-1250. Agric. Eng. 2017, 7, 32–34. [Google Scholar]
  9. Yang, D.; Liu, W. Meddie 9QZ-3000 self-propelled silage harvester in Altay region. Xinjiang Agric. Mech. 2016, 36–37. [Google Scholar]
  10. Zhang, L.J. Application of Silage Corn Harvester. Agric. Mach. 2014, 89–90. [Google Scholar] [CrossRef]
  11. Zhang, S.Q.; Zhao, Q. Development status and prospects of domestic silage corn harvester. Agric. Mach. 2024, 64–67. [Google Scholar] [CrossRef]
  12. Duan, J.; Cheng, F.; He, C.; Liu, Y.; Wang, Y.; Guo, X. Research status and development trend of small and medium-sized silage corn harvesting machinery. Chin. J. Agric. Mach. Chem. 2024, 45, 305–310. [Google Scholar]
  13. Liu, P.W.; Yang, M.L.; Zhang, X.J.; Lin, J.; Peng, W.; Wang, Z. Evaluation of Mechanized Production Models in Southwest Hilly and Mountainous Areas Based on High Quality and Efficiency. Trans. Chin. Soc. Agric. Mach. 2022, 53 (Suppl. S1), 140–149. [Google Scholar]
  14. Li, Z.; Li, X.; Wang, Y.; Li, M.; Chen, Z. 9QZ-200 self-propelled crawler green fodder harvester design and experiment. Mech. Res. Appl. 2022, 35, 98–101. [Google Scholar]
  15. GB/T 10394.3-2002; Forage Harvesters—Part 3: Test Methods. China Standards Press: Beijing, China, 2002.
  16. GB/T 10394.4-2009; Forage Harvesters—Part 4: Safety and Performance. China Standards Press: Beijing, China, 2009.
  17. GB/T 21961-2008; Test Methods for Maize Combine Harvester. China Standards Press: Beijing, China, 2008.
  18. GB/T 8097-2008; Equipment for Harvesting—Combine Harvesters—Test Procedure. China Standards Press: Beijing, China, 2008.
  19. Moore; Chapman, R. Application of Particle Swarm to Multiobjective Optimization; Technical Report; Departament of Computer Science and Software Engineering, Auburn University: Auburn, AL, USA, 1999. [Google Scholar]
  20. Coello, C.A.C.; Lecsuga, M.S. MOPSO: A proposal for multiple objective particle swarm optimization. In Proceedings of the IEEE Congress on Evolutionary Computation, Honolulu, HI, USA, 12–17 May 2002; pp. 1051–1056. [Google Scholar]
  21. Dai, C.; Wang, Y.; Ye, M. A new multi-objective particle swarm optimization algorithm based on decomposition. Inf. Sci. 2015, 325, 541–557. [Google Scholar] [CrossRef]
  22. Zhang, X.; Zheng, X.; Cheng, R.; Qiu, J.; Jin, Y. A competitive mechanism based multi-objective particle swarm optimizer with fast convergence. Inf. Sci. 2017, 427, 63–76. [Google Scholar] [CrossRef]
  23. He, C.; Li, M.; Zhang, C.; Chen, H.; Li, X.; Li, J. A competitive swarm optimizer with probabilistic criteria for many-objective optimization problems. Complex Intell. Syst. 2022, 8, 4697–4725. [Google Scholar]
  24. Durillo, J.J.; Garc, J.; Nebro, A.J.; Coello, C.A.C.; Luna, F.; Alba, E. Multi-objective particle swarm optimizers: An experimental comparison. In 5th International Conference on Evolutionary MultiCriterion Optimization (EMO’ 2009); Springer: Berlin/Heidelberg, Germany, 2009. [Google Scholar]
  25. Nebro, A.J.; Durillo, J.J.; Nieto, J.G.; Coello, C.A.C.; Luna, F.; Alba, E. SMPSO: A new PSO-based metaheuristic for multiobjective optimization. In Proceedings of IEEE Symposium on Computational Intelligence in Miulti-Criteria Decision-Making, Nashville, TN, USA, 30 March–2 April 2009; pp. 66–73. [Google Scholar]
  26. Deb, K.; Pratap, A.; Agarwal, S.; Meyarivan, T. A fast and elitist multiobjective genetic algorithm: NSGA-II. IEEE Trans. Evol. Comput. 2002, 6, 182–197. [Google Scholar]
  27. Zitzler, E.; Laumanns, M.; Thiele, L. SPEA2: Improving the Strength Pareto Evolutionary Algorithm; Giannakoglou, K., Ed.; Eurogen 2001: Athens, Greece, 2002; pp. 95–100. [Google Scholar]
Figure 1. Single-disk silage maize harvester: 1. separator; 2. single-disk mower; 3. mowing device; 4. walking wheel; 5. material thrower; 6. hanging device; 7. power input shaft; 8. straw crusher; 9. flattening roller assembly.
Agriculture 15 00751 g001
Figure 2. Schematic structure of the feeding device: (a) feeding process diagram: 1. corn stalk; 2. roller tooth; 3. divider; 4. roller; (b) schematic diagram of the cutter structure.
Agriculture 15 00751 g002
Figure 3. Flattening device: (a) structure diagram of the flattening device; (b) three-dimensional diagram of the flattening device. (1,5) After feeding the tooth roller pressure spring. (2) After feeding the tooth roller gear. (3) After feeding the tooth roller bracket. (4) Straight gear. (6,7) After feeding the tooth roller pressure spring. (8) After feeding the input shaft. (9) After feeding the smooth roller gear.
Agriculture 15 00751 g003
Figure 4. Power transmission diagram of the flattening device.
Agriculture 15 00751 g004
Figure 5. Chopping and throwing device. (1) Fixed knife; (2) bowl; (3) spindle; (4) moving knife; (5) rotating knife head; (6) throwing knife.
Agriculture 15 00751 g005
Figure 6. Field experiment.
Agriculture 15 00751 g006
Figure 7. Two-factor corresponding surface of the whole machine operation productivity: (a) working speed–cutter speed on productivity surface diagram; (b) roller speed–cutter speed on the productivity surface diagram; (c) roller speed–operating speed on the productivity surface diagram.
Agriculture 15 00751 g007
Figure 8. Two-factor corresponding area of standard grass length rate; (a) working speed–cutter speed to standard grass length rate surface diagram; (b) roller speed–cutter speed on the standard grass length rate surface; (c) roller speed–operating speed on the standard grass length rate surface.
Agriculture 15 00751 g008
Figure 9. Two-factor corresponding area of stubble qualified rate; (a) working speed–cutter speed on the qualified rate of stubble surface figure; (b) cylinder speed–cutter speed on stubble qualified rate curve; (c) roller speed–operating speed on stubble qualified rate surface diagram.
Agriculture 15 00751 g009
Figure 10. The degree of influence of each factor on harvester performance. (a) The degree of influence of various factors on productivity; (b) the degree of influence of each factor on the standard grass length rate; (c) the degree of influence of various factors on the qualified stubble cutting rate.
Agriculture 15 00751 g010
Figure 11. Comparison between predicted value and field test value; (a) experimental value and predicted value of operation productivity; (b) the influence degree of each factor on the standard grass length rate; (c) the influence degree of each factor on the qualified rate of stubble.
Agriculture 15 00751 g011
Figure 12. Optimized results: (a) Pareto; (b) histogram of each objective value of the operational process before and after optimization.
Agriculture 15 00751 g012
Figure 13. Secondary field experiment.
Agriculture 15 00751 g013
Table 1. Comparative analysis table of key parameters of silage corn harvester.
Parameter Type CheckCurrent Research ProgressProblems to Be Solved
Cutting qualified rateThe proportion of high-end models can reach 85~95%Low-end models are only 60~75%
Stubble height stabilityHydraulic adjustment accuracy ±10 mmWhen the ground is uneven, the stubble fluctuation is more than 30 mm
Feed preparation unit quantityThe double-disk machine can reach 8~12 kg/sWhen the single-disk machine model > 3 kg/s, the blockage rate increases
Lodging adaptabilitySome models are equipped with a dial chain (when the lodging angle is less than 30°, the leakage rate is less than 10%)When the lodging angle > 45°, the missing cutting rate > 20%
Grain broken rateRoller crusher > 95%When the moisture content is more than 70%, the crushing effect decreases by 30%
Grain crushing uniformityThe high-end model adopts a double-roll design (CV < 5%)Low-end models CV > 15%, affecting the consistency of fermentation
Table 2. Main technical parameters of single-disk maize silage harvesters.
ParameterNumerical Value
Total machine size (length × width × height)/mm3068 × 3350 × 4150
Working width/mm1600
Total machine mass/kg1295
Matching power/kW≥96
Operating speed/m·s−11–2
Number of rows harvested/row4–8
Table 3. Test factors and coding.
ProjectFactor
Operating Speed x1Cutter Speed x2Drum Speed x3
Value1.0–2.01000–160030–60
Table 4. Optimal Latin hypercube test data.
Serial NumberFactorsy1/t·h−1y2/%y3/%
x1x2x3
10.781378.7941.3128.60881.0082.18
20.891267.6842.1232.91281.7776.64
30.821292.9337.8833.44881.8576.36
41.141217.1749.1933.66481.8976.18
51.341434.3430.421.45679.9883.91
61.491106.0632.4220.16879.7878.18
70.541398.9947.7831.08881.4885.82
81.461343.4347.1729.27281.2068.18
91.441176.7736.6726.16880.7171.36
100.801030.340.7130.76881.4381.36
111.321439.3946.9720.81679.8868.27
120.621338.3844.1422.42480.1369.82
130.721409.0936.8725.09680.5566.82
141.411353.5442.3227.12880.8687.18
150.841393.943025.95280.6892.09
161.241323.2348.3827.2480.8886.64
170.711202.0235.8622.63280.1691.09
181.081404.0447.5832.80881.7568.18
191.041131.3134.2439.4482.7983.09
201.001065.6638.6923.38480.2884.73
210.501419.1935.2523.81680.3587.18
220.921282.8349.828.95281.1571.55
230.561318.1831.8214.81678.9488.36
240.641207.0731.2113.75278.7787.36
251.311025.2532.8329.37681.2280.27
261.261328.2838.8926.70480.8079.18
270.971151.5241.7233.66481.8971.18
281.151171.7244.7531.5281.5579.18
291.041333.3330.6133.01681.7879.82
300.631257.5840.7132.91281.7777.36
310.881489.933.4336.65682.3579.09
321.221131.3137.2735.1682.1271.36
331.211015.1537.472.1283.2174.91
341.421363.6434.0428.41681.0769.00
350.691459.645.1527.5680.9364.36
360.681303.0348.7934.83282.0773.64
370.551156.5742.9326.48880.7675.91
380.521161.6238.2814.60878.9193.00
391.131232.3240.327.99281.0094.09
400.861075.7631.4127.02480.8592.91
411.201035.3545.7628.52881.0868.36
420.831080.8148.9926.80880.8172.45
430.761111.1144.5526.80880.8175.36
440.571116.1633.8422.09680.0878.09
450.661479.840.5124.77680.5079.91
461.391474.7542.5325.41680.6078.27
471.401020.247.9829.91281.3080.27
481.281262.6343.7434.40882.0082.18
Table 5. Regression analysis coefficient table of corn silage performance.
Operational Productivity y1 (t·h−1)Standard Grass Cutting Rate y2 (%)Qualified Stubble Cutting Rate y3 (%)
VariableCoefficientVariableCoefficientVariableCoefficient
Constant term a04.1637Constant term a084.575 Constant term a081.049
x1−1.1636x1−4.7757 x14.423
x2−0.001538x20.0041625 x2−0.074185
x3−0.10365x3−0.17225 x3−2.7796
x 1 2 −0.099564 x 1 2 0.83704 x 1 2 6.4574
x 2 2 0.00000019504 x 2 2 −0.0000004632 x 2 2 −0.0000021077
x 3 2 0.00070978 x 3 2 −0.0012336 x 3 2 0.0086137
x1x20.00043868x1x20.0007527 x1x2−0.00237
x1x30.018019x1x30.041308 x1x3−0.352537
x2x30.000022215x2x30.00017627 x2x30.002036
Table 6. Variance analysis table.
Evaluating IndicatorSource of VarianceDegree of FreedomSquare of the DeviationMean SquareF RatioR2
Operational productivity y1 (t·h−1)Model210.575460.02824224.360.9508
Error30.00032460.00032
Standard grass cutting rate y2 (%)Model260.585360.029349216.070.9349
Error60.000489030.00042604
Qualified stubble cutting rate y3 (%)Model230.540650.030026235.090.9468
Error50.0003460.0003012
Disclaimer/Publisher’s Note: The statements, opinions and data contained in all publications are solely those of the individual author(s) and contributor(s) and not of MDPI and/or the editor(s). MDPI and/or the editor(s) disclaim responsibility for any injury to people or property resulting from any ideas, methods, instructions or products referred to in the content.

